Embed Size (px)
Citation preview
ASX Announcement - 9 December 2016 Annual General Meeting - 9 December 2016 Attached are the Chairman’s address and the Managing Director’s presentation which will be delivered at the 2016 Annual General Meeting of the Company later today.
I.D. Bloodworth Company Secretary
For
per
sona
l use
onl
y

Good afternoon Ladies and Gentlemen, my name is Robert Millner, I am the Chairman of Washington H.
Soul Pattinson and I would like to welcome you to the 114th Annual General Meeting of the Company.
I am advised that a quorum is present and therefore declare the Meeting open.
Before we proceed I would like to introduce to you the other members of the board:-
Mr. Todd Barlow is our Managing Director.
Mr. Michael Hawker – non-executive independent director,
Mr. Tom Millner – non-executive director,
Mr. Warwick Negus – non-executive independent director,
Ms. Melinda Roderick is our Finance Director,
Mr. Robert Westphal – non-executive independent director,
Mr. David Wills – non-executive independent director, and
Mr. Ian Bloodworth is the Company Secretary.
Mr. John Gavljak from the Company’s Auditors, is also present.
1
For
per
sona
l use
onl
y
Chairman’s Address
I would like to thank the representatives from our investee companies who were responsible for the stands
in the foyer.
I hope everyone has found the displays informative and has had an opportunity to speak with the
representatives.
I propose that the Notice of Meeting dated 2nd November 2016, which was sent to all registered
shareholders of the Company be taken as read.
Following my address, Todd will deliver his presentation, after which shareholders will have the opportunity
to ask questions.
We will then conduct the formal business of the meeting.
For
per
sona
l use
onl
y
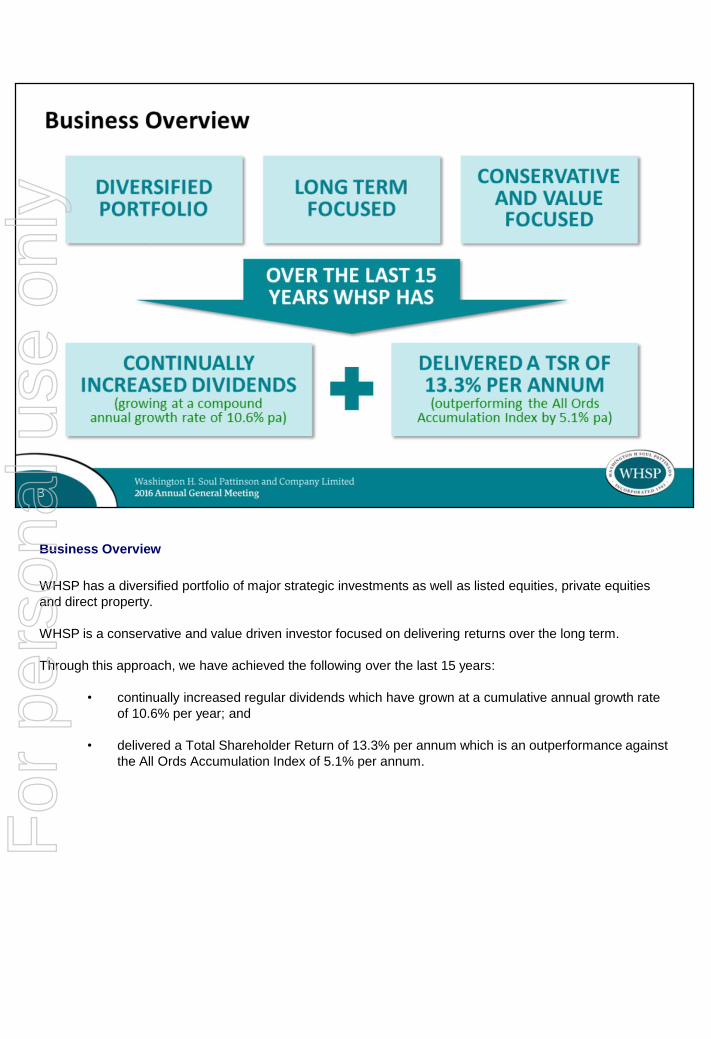
Business Overview
WHSP has a diversified portfolio of major strategic investments as well as listed equities, private equities
and direct property.
WHSP is a conservative and value driven investor focused on delivering returns over the long term.
Through this approach, we have achieved the following over the last 15 years:
• continually increased regular dividends which have grown at a cumulative annual growth rate
of 10.6% per year; and
• delivered a Total Shareholder Return of 13.3% per annum which is an outperformance against
the All Ords Accumulation Index of 5.1% per annum.
For
per
sona
l use
onl
y
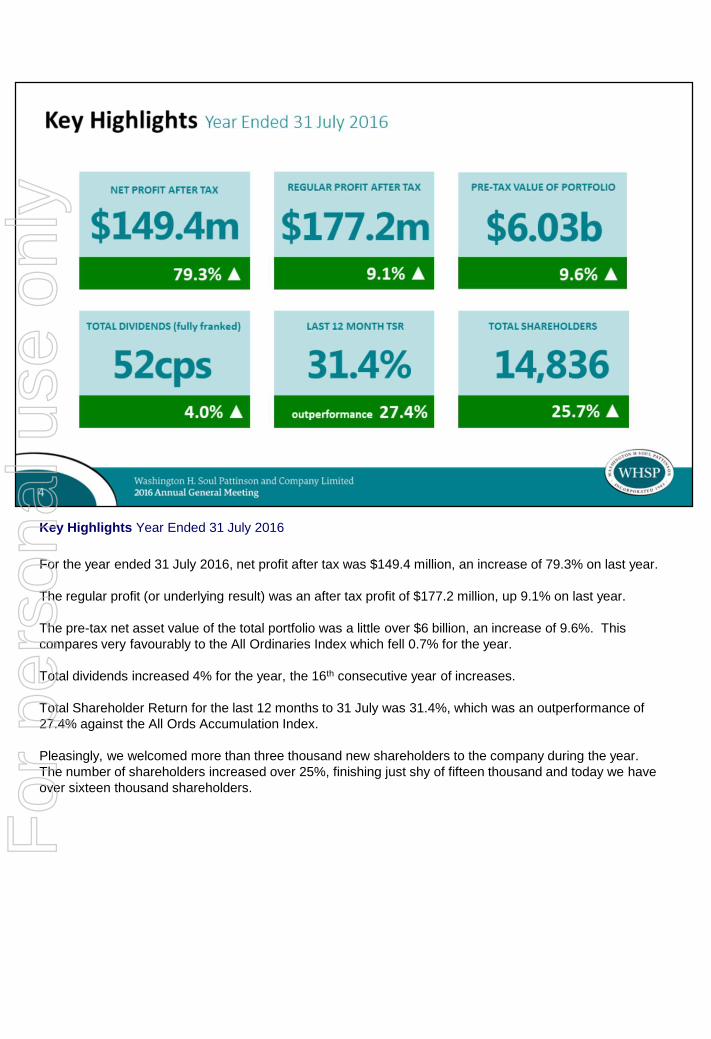
Key Highlights Year Ended 31 July 2016
For the year ended 31 July 2016, net profit after tax was $149.4 million, an increase of 79.3% on last year.
The regular profit (or underlying result) was an after tax profit of $177.2 million, up 9.1% on last year.
The pre-tax net asset value of the total portfolio was a little over $6 billion, an increase of 9.6%. This
compares very favourably to the All Ordinaries Index which fell 0.7% for the year.
Total dividends increased 4% for the year, the 16th consecutive year of increases.
Total Shareholder Return for the last 12 months to 31 July was 31.4%, which was an outperformance of
27.4% against the All Ords Accumulation Index.
Pleasingly, we welcomed more than three thousand new shareholders to the company during the year.
The number of shareholders increased over 25%, finishing just shy of fifteen thousand and today we have
over sixteen thousand shareholders.
For
per
sona
l use
onl
y
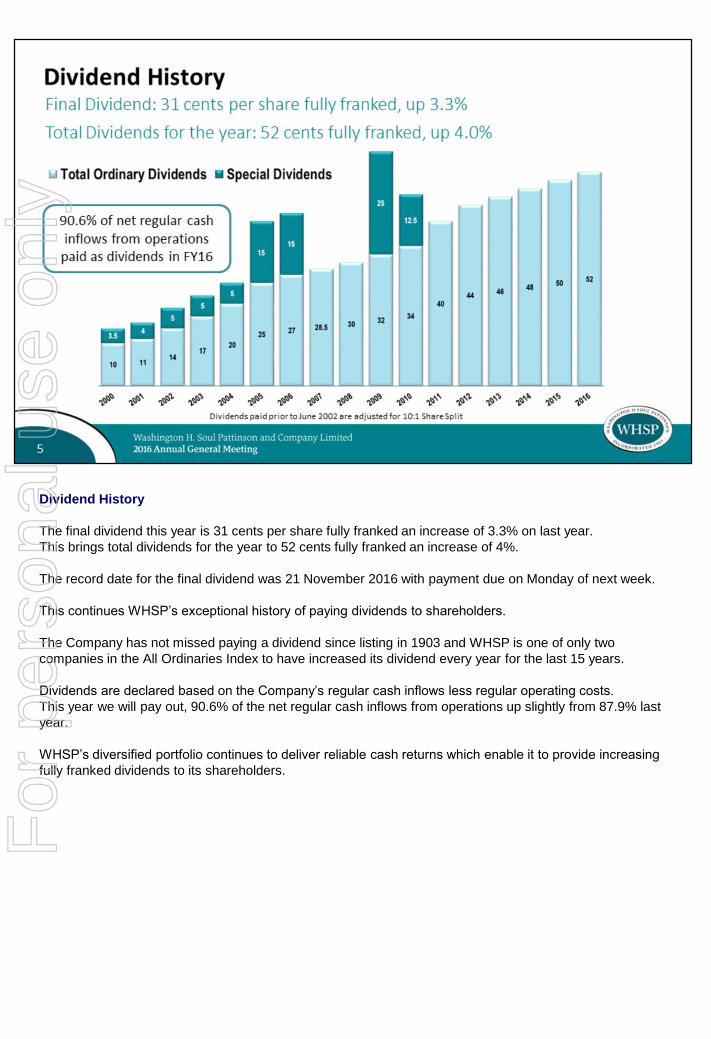
Dividend History
The final dividend this year is 31 cents per share fully franked an increase of 3.3% on last year.
This brings total dividends for the year to 52 cents fully franked an increase of 4%.
The record date for the final dividend was 21 November 2016 with payment due on Monday of next week.
This continues WHSP’s exceptional history of paying dividends to shareholders.
The Company has not missed paying a dividend since listing in 1903 and WHSP is one of only two
companies in the All Ordinaries Index to have increased its dividend every year for the last 15 years.
Dividends are declared based on the Company’s regular cash inflows less regular operating costs.
This year we will pay out, 90.6% of the net regular cash inflows from operations up slightly from 87.9% last
year.
WHSP’s diversified portfolio continues to deliver reliable cash returns which enable it to provide increasing
fully franked dividends to its shareholders.
For
per
sona
l use
onl
y
WHSP
Total Shareholder Return - 40 years
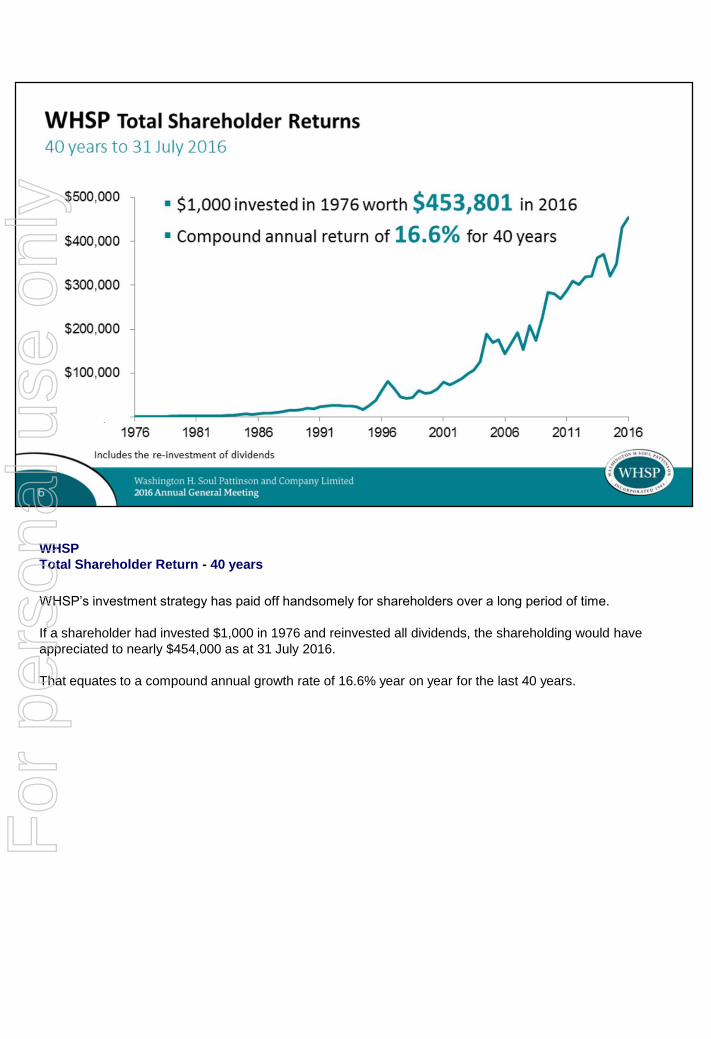
WHSP’s investment strategy has paid off handsomely for shareholders over a long period of time.
If a shareholder had invested $1,000 in 1976 and reinvested all dividends, the shareholding would have
appreciated to nearly $454,000 as at 31 July 2016.
That equates to a compound annual growth rate of 16.6% year on year for the last 40 years.
For
per
sona
l use
onl
y

For
per
sona
l use
onl
y
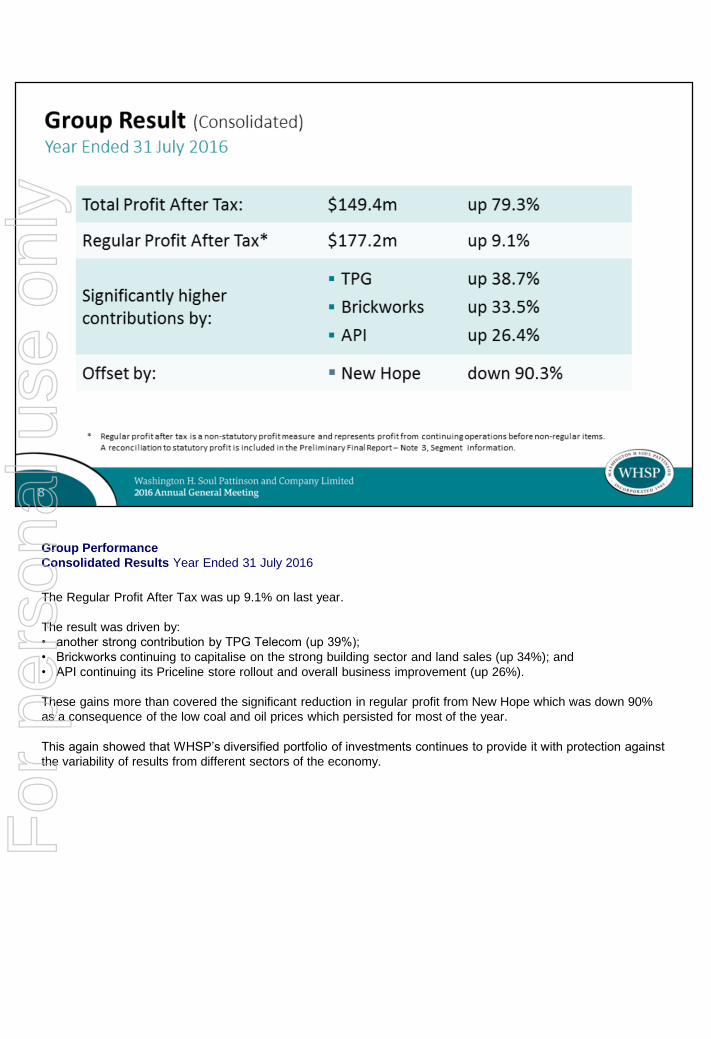
Group Performance
Consolidated Results Year Ended 31 July 2016
The Regular Profit After Tax was up 9.1% on last year.
The result was driven by:
• another strong contribution by TPG Telecom (up 39%);
• Brickworks continuing to capitalise on the strong building sector and land sales (up 34%); and
• API continuing its Priceline store rollout and overall business improvement (up 26%).
These gains more than covered the significant reduction in regular profit from New Hope which was down 90%
as a consequence of the low coal and oil prices which persisted for most of the year.
This again showed that WHSP’s diversified portfolio of investments continues to provide it with protection against
the variability of results from different sectors of the economy.
For
per
sona
l use
onl
y
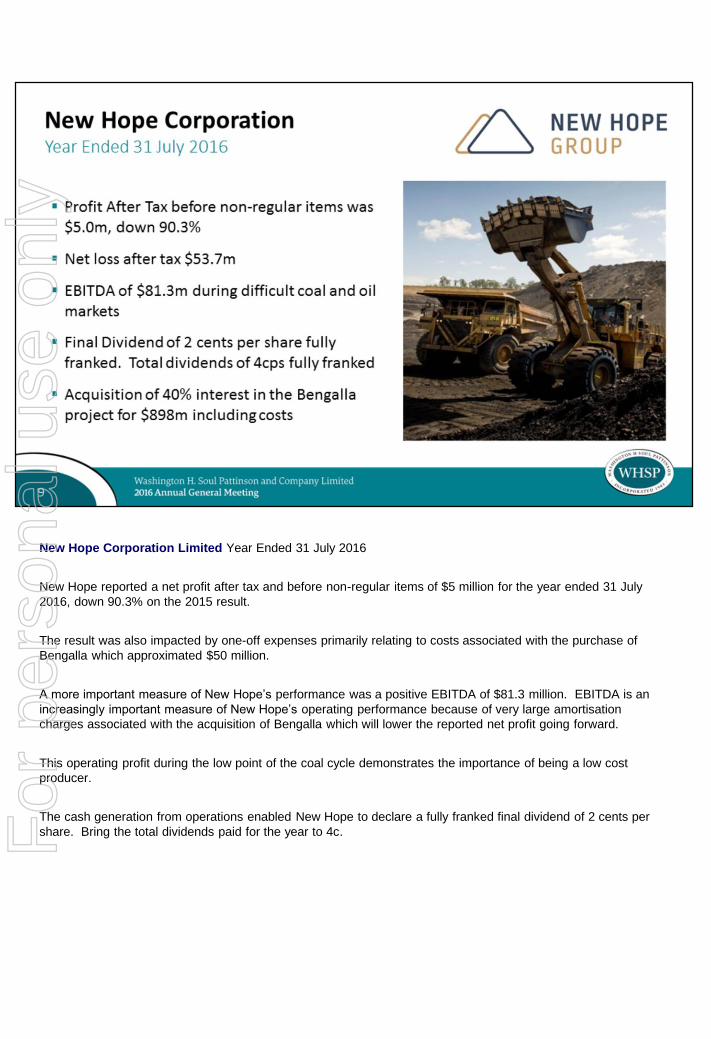
New Hope Corporation Limited Year Ended 31 July 2016
New Hope reported a net profit after tax and before non-regular items of $5 million for the year ended 31 July
2016, down 90.3% on the 2015 result.
The result was also impacted by one-off expenses primarily relating to costs associated with the purchase of
Bengalla which approximated $50 million.
A more important measure of New Hope’s performance was a positive EBITDA of $81.3 million. EBITDA is an
increasingly important measure of New Hope’s operating performance because of very large amortisation
charges associated with the acquisition of Bengalla which will lower the reported net profit going forward.
This operating profit during the low point of the coal cycle demonstrates the importance of being a low cost
producer.
The cash generation from operations enabled New Hope to declare a fully franked final dividend of 2 cents per
share. Bring the total dividends paid for the year to 4c.For
per
sona
l use
onl
y
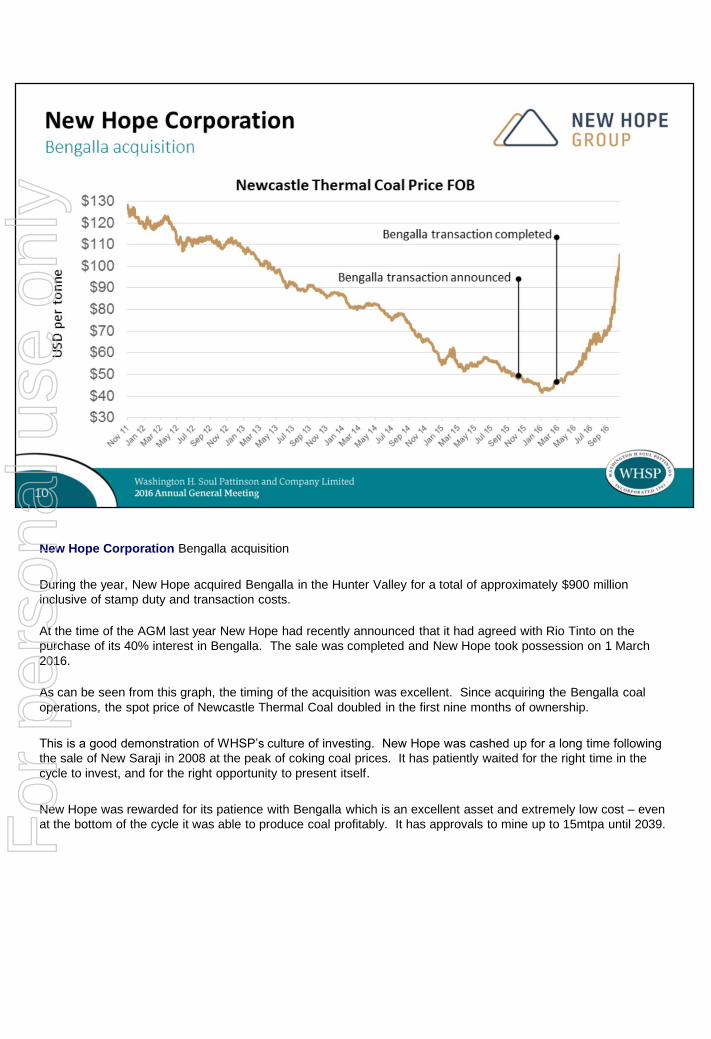
New Hope Corporation Bengalla acquisition
During the year, New Hope acquired Bengalla in the Hunter Valley for a total of approximately $900 million
inclusive of stamp duty and transaction costs.
At the time of the AGM last year New Hope had recently announced that it had agreed with Rio Tinto on the
purchase of its 40% interest in Bengalla. The sale was completed and New Hope took possession on 1 March
2016.
As can be seen from this graph, the timing of the acquisition was excellent. Since acquiring the Bengalla coal
operations, the spot price of Newcastle Thermal Coal doubled in the first nine months of ownership.
This is a good demonstration of WHSP’s culture of investing. New Hope was cashed up for a long time following
the sale of New Saraji in 2008 at the peak of coking coal prices. It has patiently waited for the right time in the
cycle to invest, and for the right opportunity to present itself.
New Hope was rewarded for its patience with Bengalla which is an excellent asset and extremely low cost – even
at the bottom of the cycle it was able to produce coal profitably. It has approvals to mine up to 15mtpa until 2039. For
per
sona
l use
onl
y
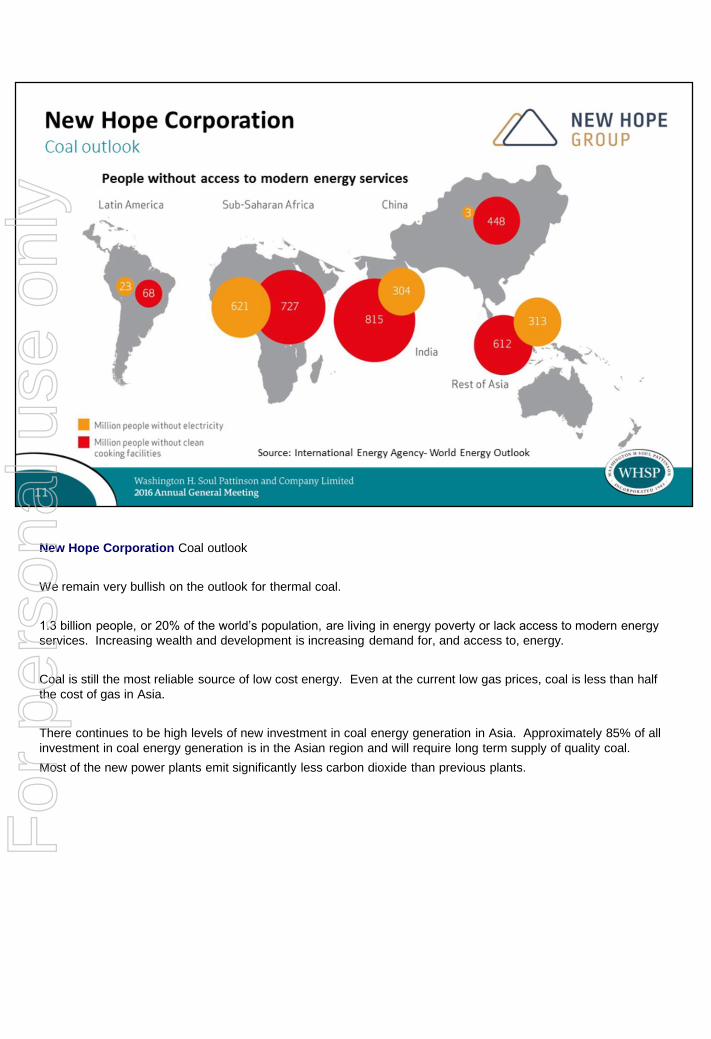
New Hope Corporation Coal outlook
We remain very bullish on the outlook for thermal coal.
1.3 billion people, or 20% of the world’s population, are living in energy poverty or lack access to modern energy
services. Increasing wealth and development is increasing demand for, and access to, energy.
Coal is still the most reliable source of low cost energy. Even at the current low gas prices, coal is less than half
the cost of gas in Asia.
There continues to be high levels of new investment in coal energy generation in Asia. Approximately 85% of all
investment in coal energy generation is in the Asian region and will require long term supply of quality coal.
Most of the new power plants emit significantly less carbon dioxide than previous plants.
For
per
sona
l use
onl
y
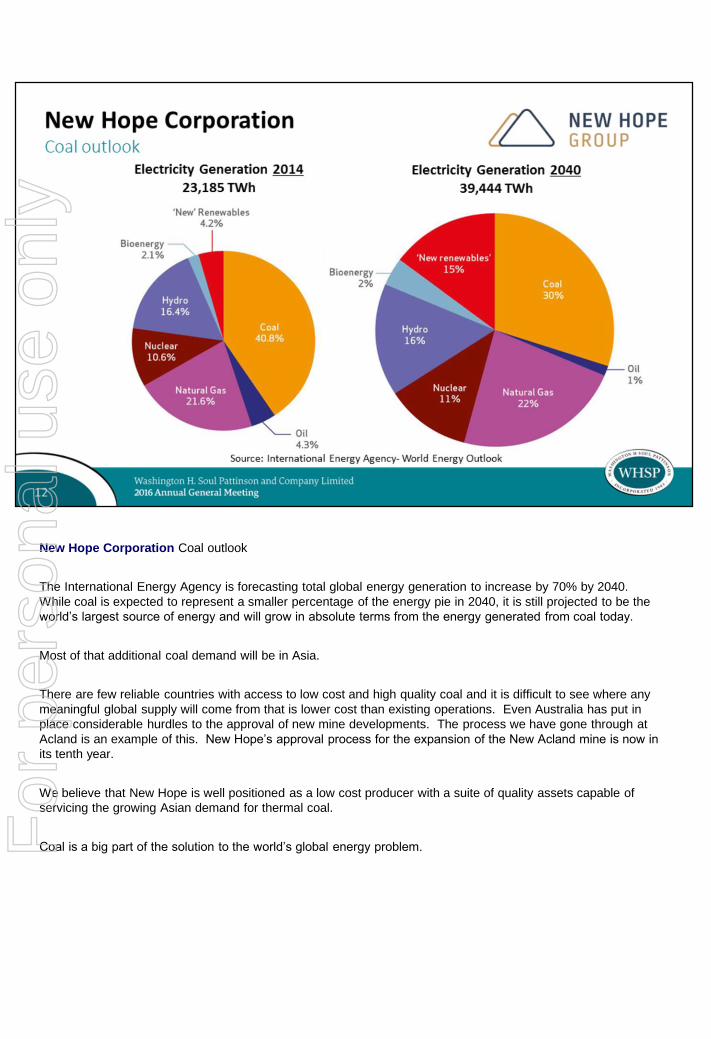
New Hope Corporation Coal outlook
The International Energy Agency is forecasting total global energy generation to increase by 70% by 2040.
While coal is expected to represent a smaller percentage of the energy pie in 2040, it is still projected to be the
world’s largest source of energy and will grow in absolute terms from the energy generated from coal today.
Most of that additional coal demand will be in Asia.
There are few reliable countries with access to low cost and high quality coal and it is difficult to see where any
meaningful global supply will come from that is lower cost than existing operations. Even Australia has put in
place considerable hurdles to the approval of new mine developments. The process we have gone through at
Acland is an example of this. New Hope’s approval process for the expansion of the New Acland mine is now in
its tenth year.
We believe that New Hope is well positioned as a low cost producer with a suite of quality assets capable of
servicing the growing Asian demand for thermal coal.
Coal is a big part of the solution to the world’s global energy problem. For
per
sona
l use
onl
y
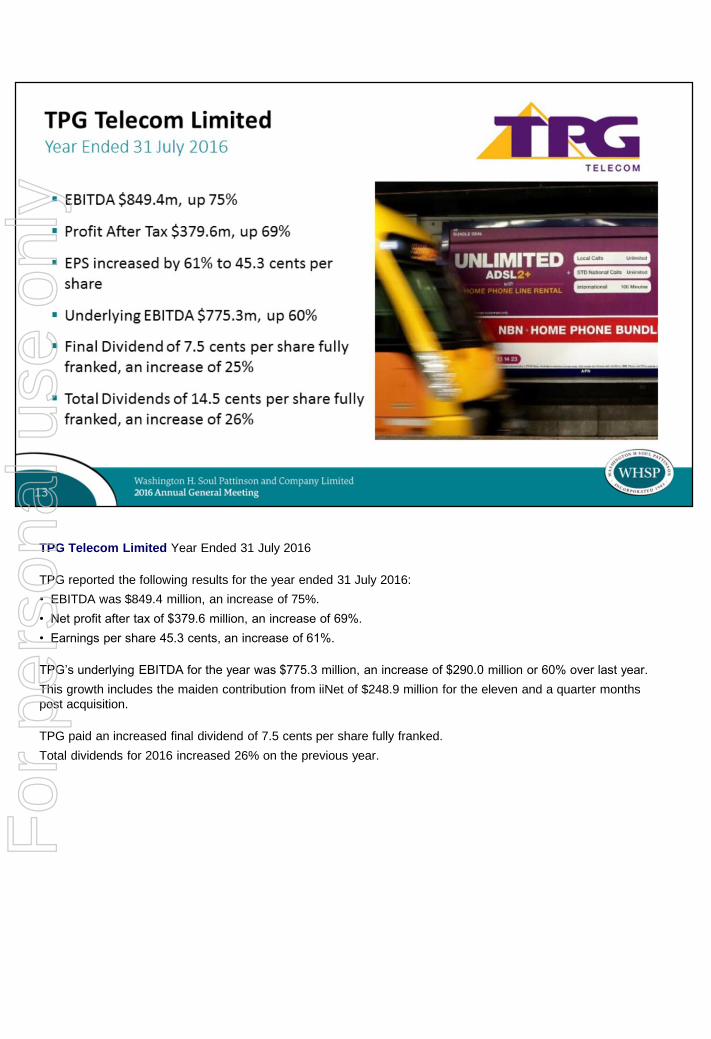
TPG Telecom Limited Year Ended 31 July 2016
TPG reported the following results for the year ended 31 July 2016:
• EBITDA was $849.4 million, an increase of 75%.
• Net profit after tax of $379.6 million, an increase of 69%.
• Earnings per share 45.3 cents, an increase of 61%.
TPG’s underlying EBITDA for the year was $775.3 million, an increase of $290.0 million or 60% over last year.
This growth includes the maiden contribution from iiNet of $248.9 million for the eleven and a quarter months
post acquisition.
TPG paid an increased final dividend of 7.5 cents per share fully franked.
Total dividends for 2016 increased 26% on the previous year.
For
per
sona
l use
onl
y
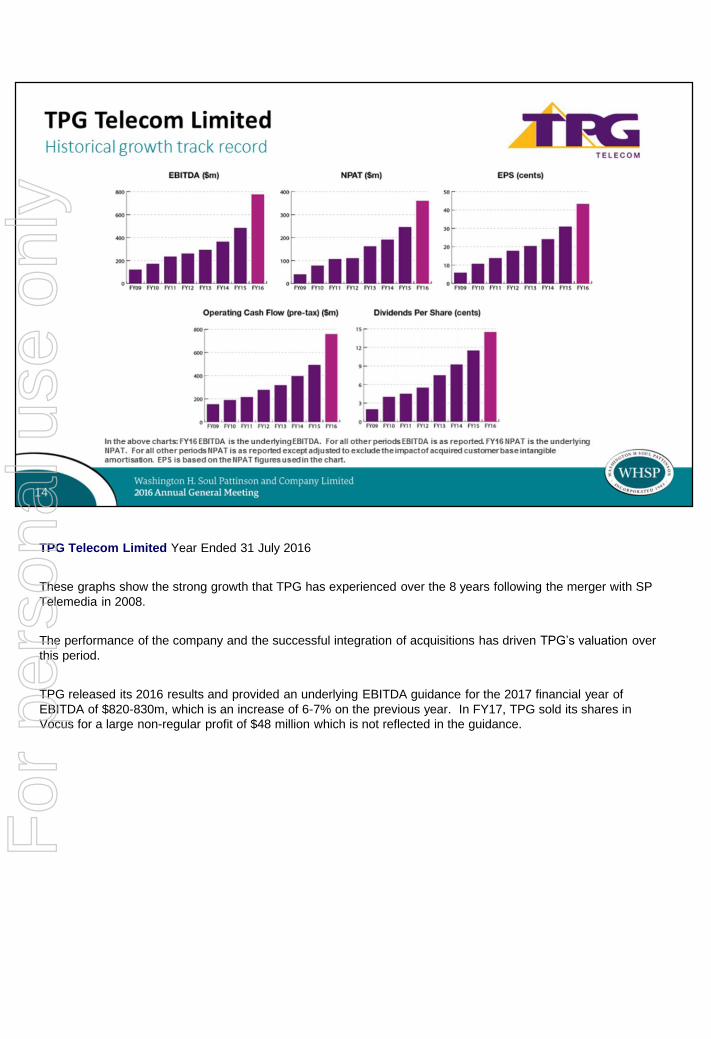
TPG Telecom Limited Year Ended 31 July 2016
These graphs show the strong growth that TPG has experienced over the 8 years following the merger with SP
Telemedia in 2008.
The performance of the company and the successful integration of acquisitions has driven TPG’s valuation over
this period.
TPG released its 2016 results and provided an underlying EBITDA guidance for the 2017 financial year of
EBITDA of $820-830m, which is an increase of 6-7% on the previous year. In FY17, TPG sold its shares in
Vocus for a large non-regular profit of $48 million which is not reflected in the guidance.
For
per
sona
l use
onl
y
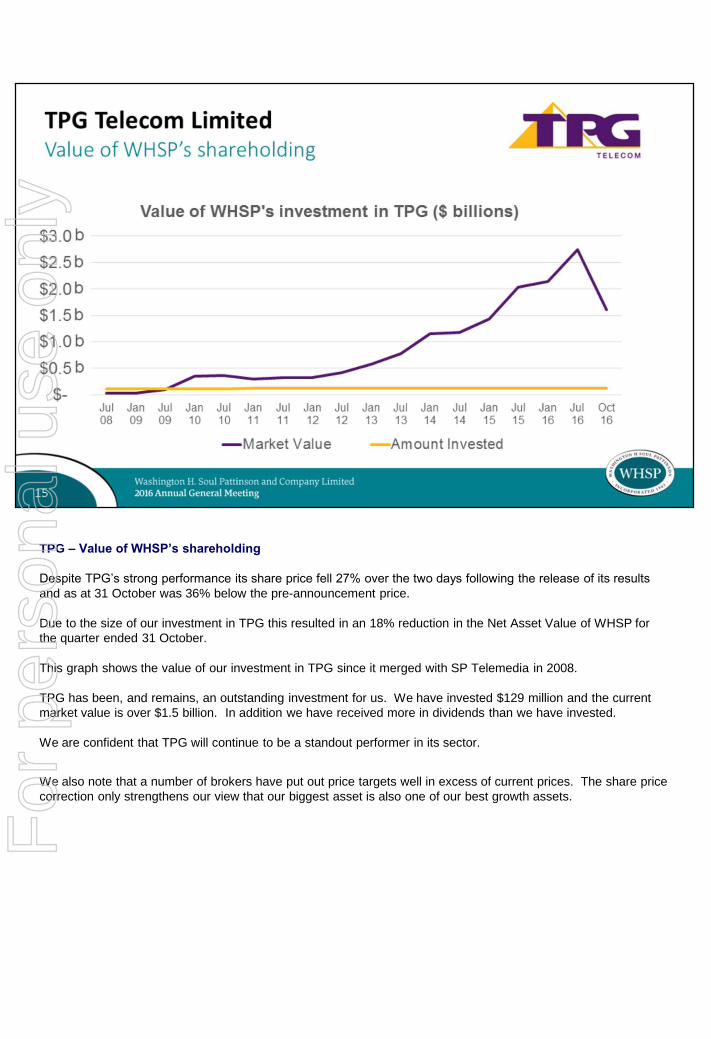
TPG – Value of WHSP’s shareholding
Despite TPG’s strong performance its share price fell 27% over the two days following the release of its results
and as at 31 October was 36% below the pre-announcement price.
Due to the size of our investment in TPG this resulted in an 18% reduction in the Net Asset Value of WHSP for
the quarter ended 31 October.
This graph shows the value of our investment in TPG since it merged with SP Telemedia in 2008.
TPG has been, and remains, an outstanding investment for us. We have invested $129 million and the current
market value is over $1.5 billion. In addition we have received more in dividends than we have invested.
We are confident that TPG will continue to be a standout performer in its sector.
We also note that a number of brokers have put out price targets well in excess of current prices. The share price
correction only strengthens our view that our biggest asset is also one of our best growth assets.
For
per
sona
l use
onl
y
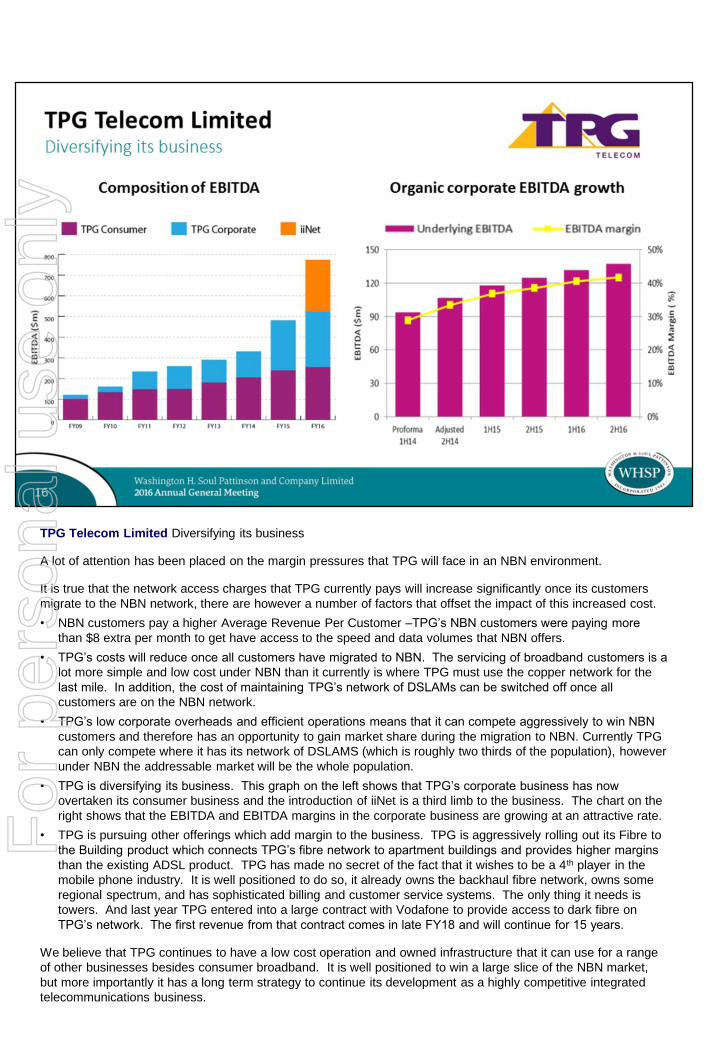
TPG Telecom Limited Diversifying its business
A lot of attention has been placed on the margin pressures that TPG will face in an NBN environment.
It is true that the network access charges that TPG currently pays will increase significantly once its customers
migrate to the NBN network, there are however a number of factors that offset the impact of this increased cost.
• NBN customers pay a higher Average Revenue Per Customer –TPG’s NBN customers were paying more
than $8 extra per month to get have access to the speed and data volumes that NBN offers.
• TPG’s costs will reduce once all customers have migrated to NBN. The servicing of broadband customers is a
lot more simple and low cost under NBN than it currently is where TPG must use the copper network for the
last mile. In addition, the cost of maintaining TPG’s network of DSLAMs can be switched off once all
customers are on the NBN network.
• TPG’s low corporate overheads and efficient operations means that it can compete aggressively to win NBN
customers and therefore has an opportunity to gain market share during the migration to NBN. Currently TPG
can only compete where it has its network of DSLAMS (which is roughly two thirds of the population), however
under NBN the addressable market will be the whole population.
• TPG is diversifying its business. This graph on the left shows that TPG’s corporate business has now
overtaken its consumer business and the introduction of iiNet is a third limb to the business. The chart on the
right shows that the EBITDA and EBITDA margins in the corporate business are growing at an attractive rate.
• TPG is pursuing other offerings which add margin to the business. TPG is aggressively rolling out its Fibre to
the Building product which connects TPG’s fibre network to apartment buildings and provides higher margins
than the existing ADSL product. TPG has made no secret of the fact that it wishes to be a 4th player in the
mobile phone industry. It is well positioned to do so, it already owns the backhaul fibre network, owns some
regional spectrum, and has sophisticated billing and customer service systems. The only thing it needs is
towers. And last year TPG entered into a large contract with Vodafone to provide access to dark fibre on
TPG’s network. The first revenue from that contract comes in late FY18 and will continue for 15 years.
We believe that TPG continues to have a low cost operation and owned infrastructure that it can use for a range
of other businesses besides consumer broadband. It is well positioned to win a large slice of the NBN market,
but more importantly it has a long term strategy to continue its development as a highly competitive integrated
telecommunications business.
For
per
sona
l use
onl
y
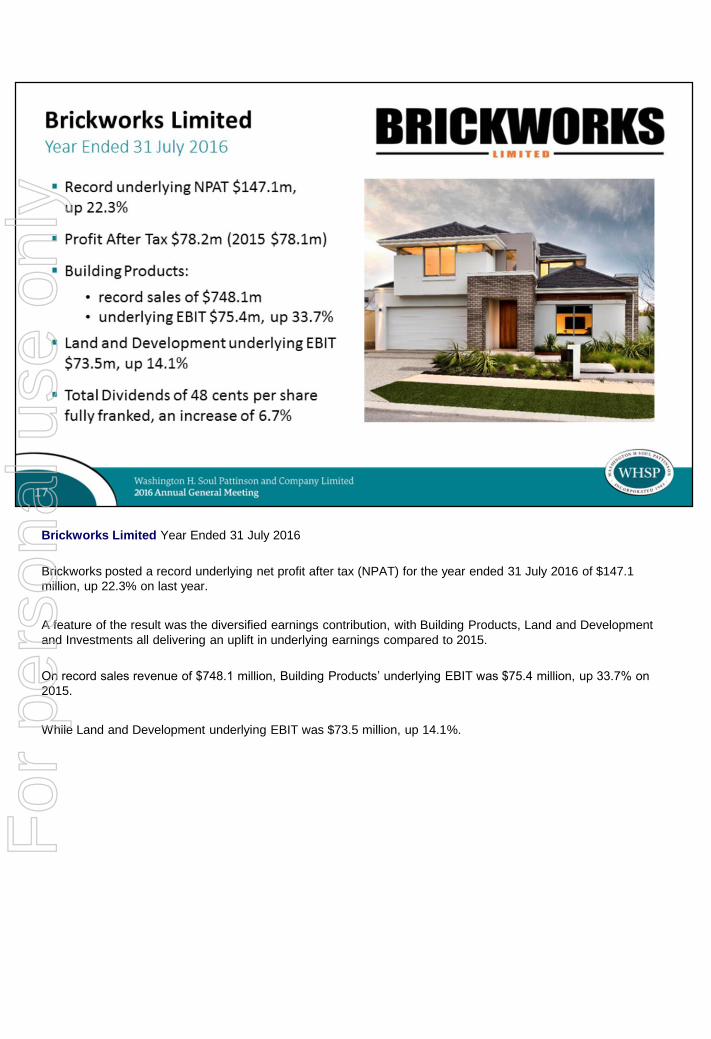
Brickworks Limited Year Ended 31 July 2016
Brickworks posted a record underlying net profit after tax (NPAT) for the year ended 31 July 2016 of $147.1
million, up 22.3% on last year.
A feature of the result was the diversified earnings contribution, with Building Products, Land and Development
and Investments all delivering an uplift in underlying earnings compared to 2015.
On record sales revenue of $748.1 million, Building Products’ underlying EBIT was $75.4 million, up 33.7% on
2015.
While Land and Development underlying EBIT was $73.5 million, up 14.1%.
For
per
sona
l use
onl
y
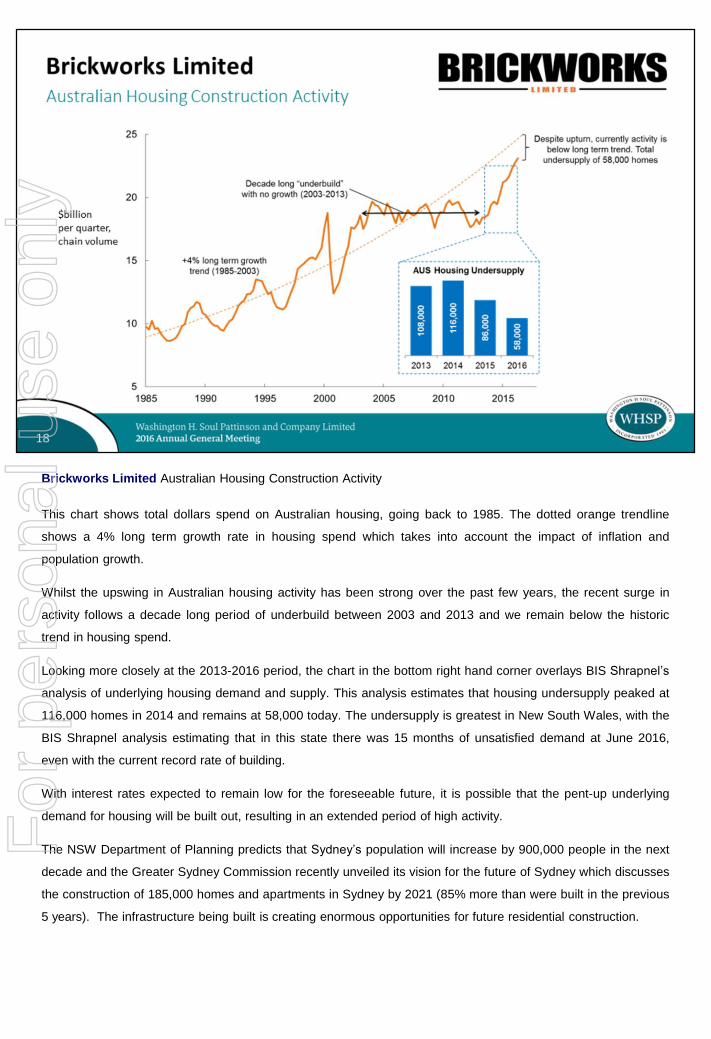
Brickworks Limited Australian Housing Construction Activity
This chart shows total dollars spend on Australian housing, going back to 1985. The dotted orange trendline
shows a 4% long term growth rate in housing spend which takes into account the impact of inflation and
population growth.
Whilst the upswing in Australian housing activity has been strong over the past few years, the recent surge in
activity follows a decade long period of underbuild between 2003 and 2013 and we remain below the historic
trend in housing spend.
Looking more closely at the 2013-2016 period, the chart in the bottom right hand corner overlays BIS Shrapnel’s
analysis of underlying housing demand and supply. This analysis estimates that housing undersupply peaked at
116,000 homes in 2014 and remains at 58,000 today. The undersupply is greatest in New South Wales, with the
BIS Shrapnel analysis estimating that in this state there was 15 months of unsatisfied demand at June 2016,
even with the current record rate of building.
With interest rates expected to remain low for the foreseeable future, it is possible that the pent-up underlying
demand for housing will be built out, resulting in an extended period of high activity.
The NSW Department of Planning predicts that Sydney’s population will increase by 900,000 people in the next
decade and the Greater Sydney Commission recently unveiled its vision for the future of Sydney which discusses
the construction of 185,000 homes and apartments in Sydney by 2021 (85% more than were built in the previous
5 years). The infrastructure being built is creating enormous opportunities for future residential construction.
For
per
sona
l use
onl
y
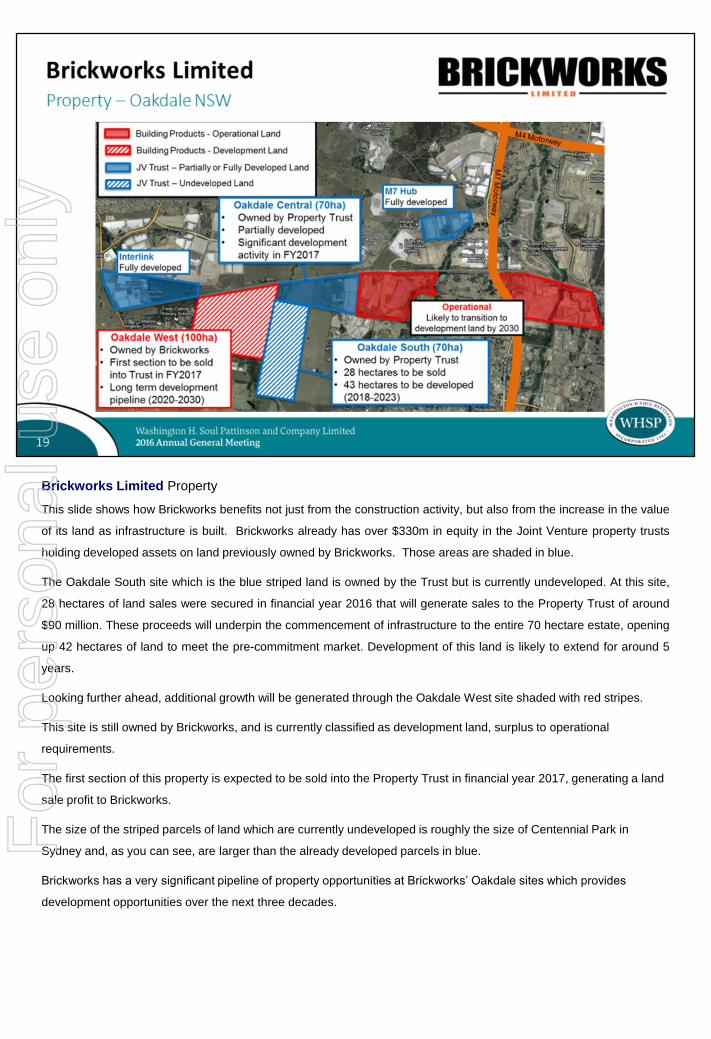
Brickworks Limited Property
This slide shows how Brickworks benefits not just from the construction activity, but also from the increase in the value
of its land as infrastructure is built. Brickworks already has over $330m in equity in the Joint Venture property trusts
holding developed assets on land previously owned by Brickworks. Those areas are shaded in blue.
The Oakdale South site which is the blue striped land is owned by the Trust but is currently undeveloped. At this site,
28 hectares of land sales were secured in financial year 2016 that will generate sales to the Property Trust of around
$90 million. These proceeds will underpin the commencement of infrastructure to the entire 70 hectare estate, opening
up 42 hectares of land to meet the pre-commitment market. Development of this land is likely to extend for around 5
years.
Looking further ahead, additional growth will be generated through the Oakdale West site shaded with red stripes.
This site is still owned by Brickworks, and is currently classified as development land, surplus to operational
requirements.
The first section of this property is expected to be sold into the Property Trust in financial year 2017, generating a land
sale profit to Brickworks.
The size of the striped parcels of land which are currently undeveloped is roughly the size of Centennial Park in
Sydney and, as you can see, are larger than the already developed parcels in blue.
Brickworks has a very significant pipeline of property opportunities at Brickworks’ Oakdale sites which provides
development opportunities over the next three decades.
For
per
sona
l use
onl
y
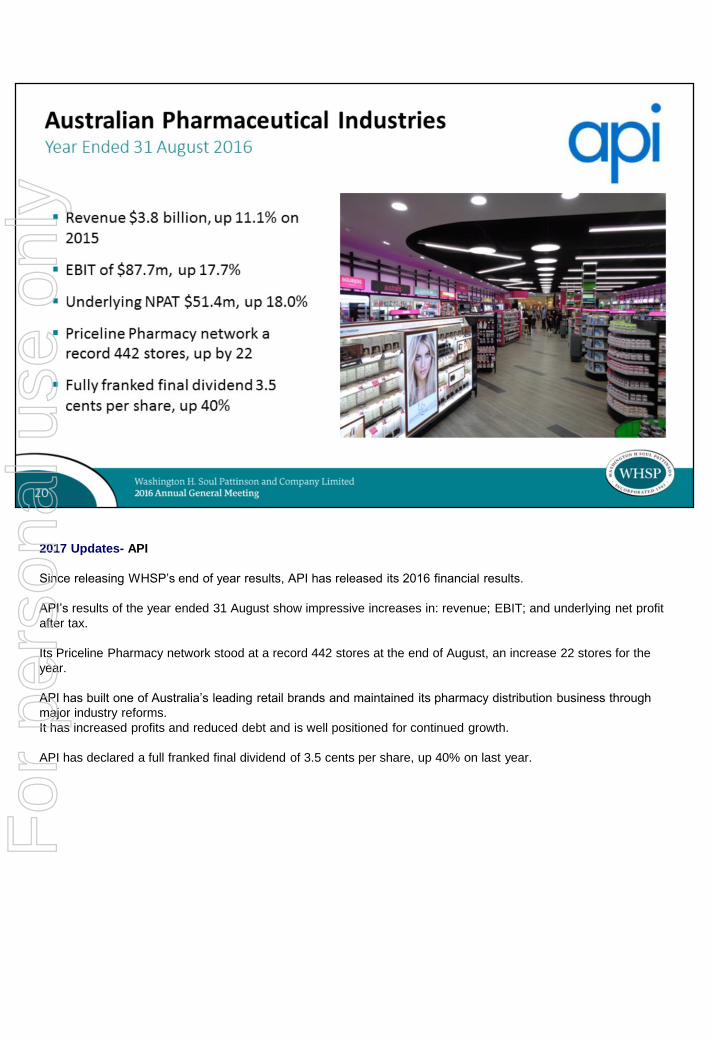
2017 Updates- API
Since releasing WHSP’s end of year results, API has released its 2016 financial results.
API’s results of the year ended 31 August show impressive increases in: revenue; EBIT; and underlying net profit
after tax.
Its Priceline Pharmacy network stood at a record 442 stores at the end of August, an increase 22 stores for the
year.
API has built one of Australia’s leading retail brands and maintained its pharmacy distribution business through
major industry reforms.
It has increased profits and reduced debt and is well positioned for continued growth.
API has declared a full franked final dividend of 3.5 cents per share, up 40% on last year.
For
per
sona
l use
onl
y
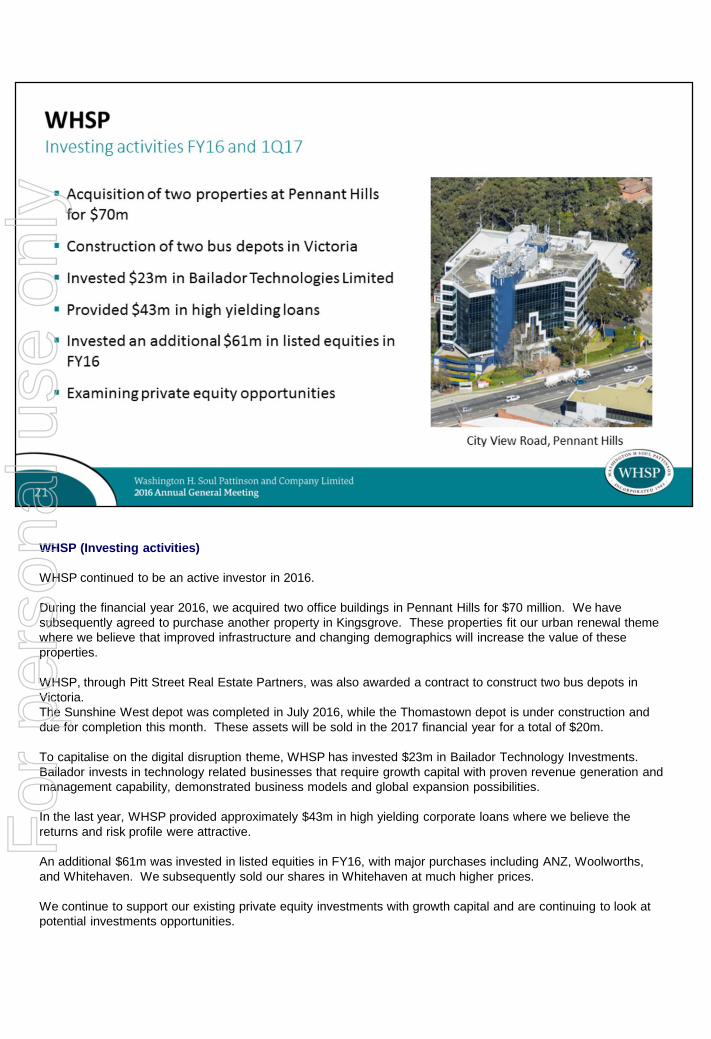
WHSP (Investing activities)
WHSP continued to be an active investor in 2016.
During the financial year 2016, we acquired two office buildings in Pennant Hills for $70 million. We have
subsequently agreed to purchase another property in Kingsgrove. These properties fit our urban renewal theme
where we believe that improved infrastructure and changing demographics will increase the value of these
properties.
WHSP, through Pitt Street Real Estate Partners, was also awarded a contract to construct two bus depots in
Victoria.
The Sunshine West depot was completed in July 2016, while the Thomastown depot is under construction and
due for completion this month. These assets will be sold in the 2017 financial year for a total of $20m.
To capitalise on the digital disruption theme, WHSP has invested $23m in Bailador Technology Investments.
Bailador invests in technology related businesses that require growth capital with proven revenue generation and
management capability, demonstrated business models and global expansion possibilities.
In the last year, WHSP provided approximately $43m in high yielding corporate loans where we believe the
returns and risk profile were attractive.
An additional $61m was invested in listed equities in FY16, with major purchases including ANZ, Woolworths,
and Whitehaven. We subsequently sold our shares in Whitehaven at much higher prices.
We continue to support our existing private equity investments with growth capital and are continuing to look at
potential investments opportunities.
For
per
sona
l use
onl
y
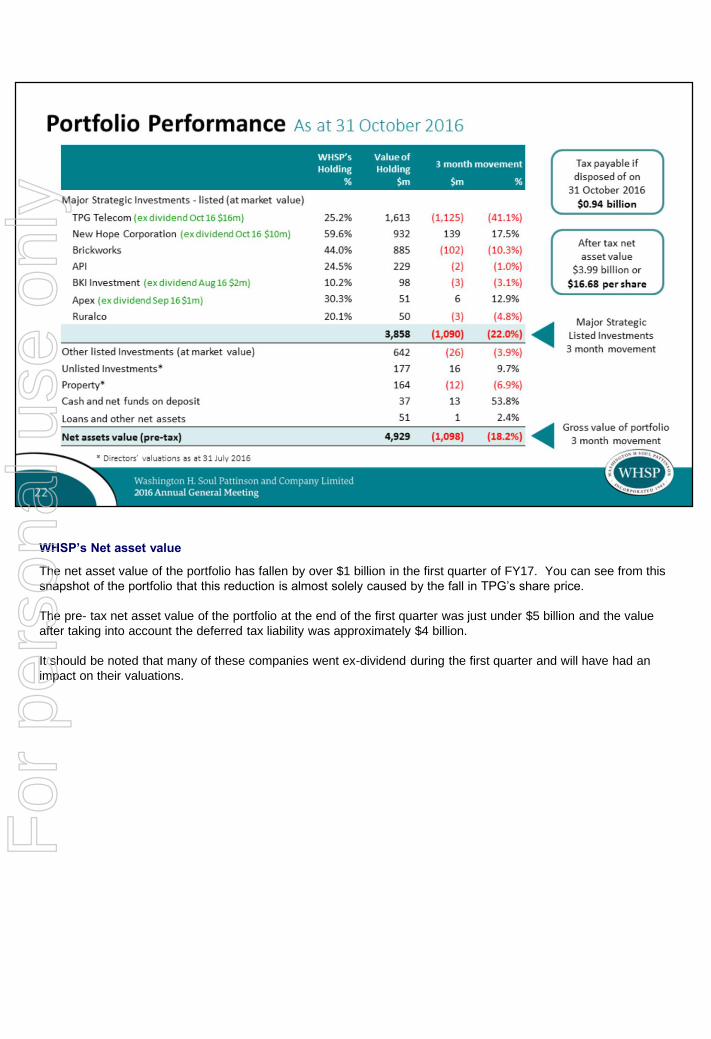
WHSP’s Net asset value
The net asset value of the portfolio has fallen by over $1 billion in the first quarter of FY17. You can see from this
snapshot of the portfolio that this reduction is almost solely caused by the fall in TPG’s share price.
The pre- tax net asset value of the portfolio at the end of the first quarter was just under $5 billion and the value
after taking into account the deferred tax liability was approximately $4 billion.
It should be noted that many of these companies went ex-dividend during the first quarter and will have had an
impact on their valuations.
For
per
sona
l use
onl
y
WHSP
Total Shareholder Return at 31 October 2016
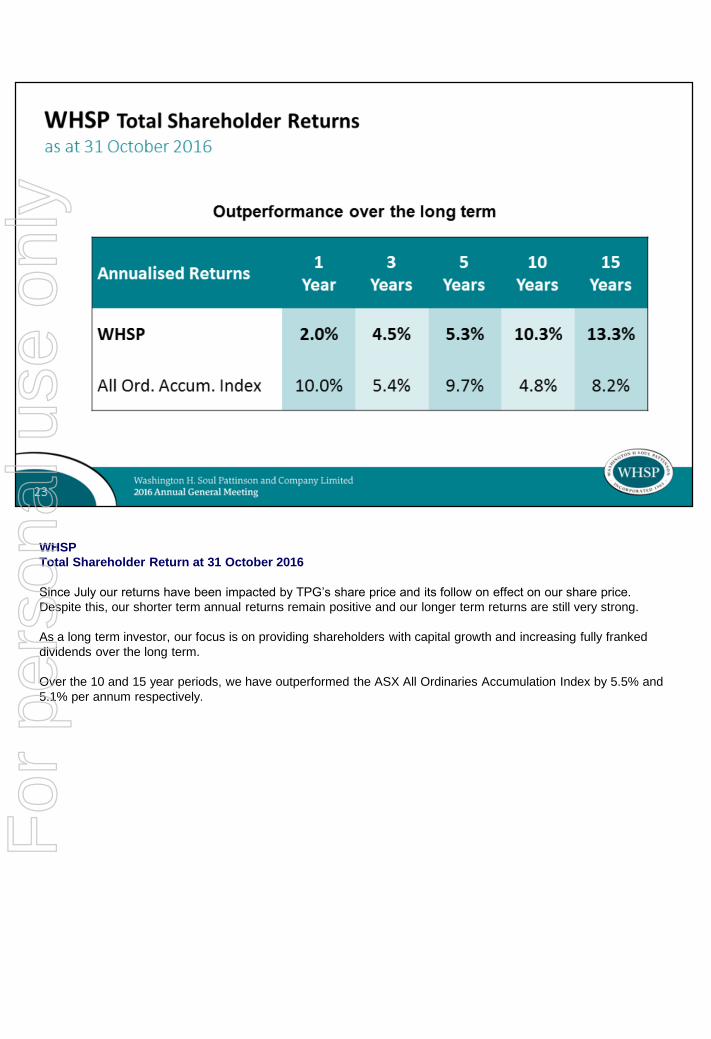
Since July our returns have been impacted by TPG’s share price and its follow on effect on our share price.
Despite this, our shorter term annual returns remain positive and our longer term returns are still very strong.
As a long term investor, our focus is on providing shareholders with capital growth and increasing fully franked
dividends over the long term.
Over the 10 and 15 year periods, we have outperformed the ASX All Ordinaries Accumulation Index by 5.5% and
5.1% per annum respectively.
For
per
sona
l use
onl
y
WHSP
Total Shareholder Return - 15 years
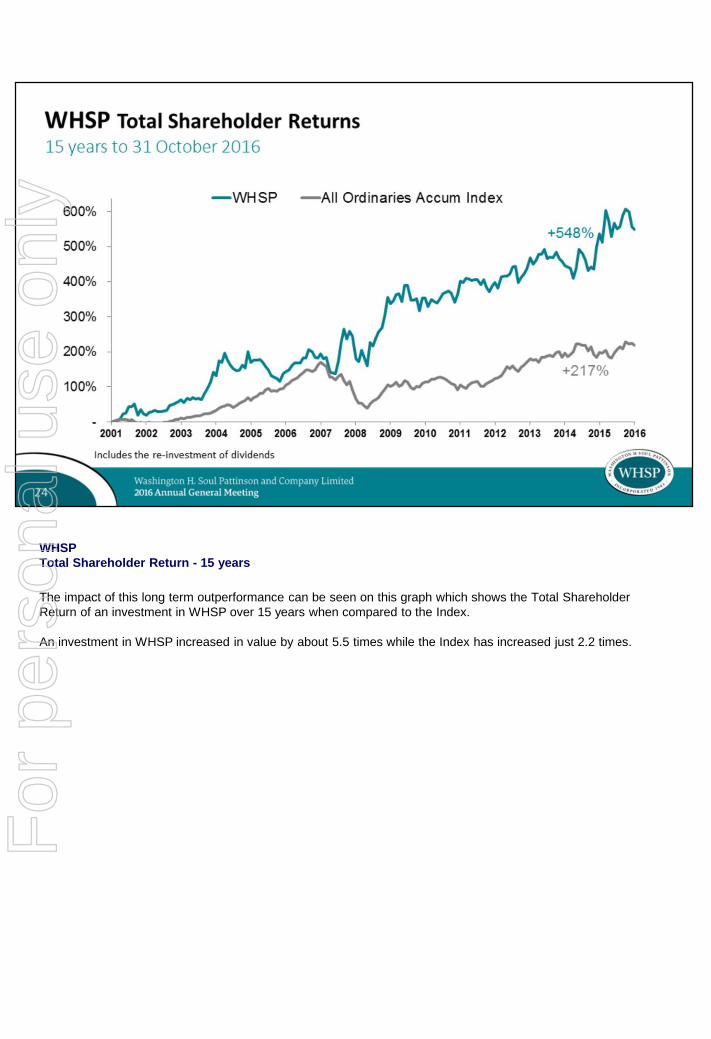
The impact of this long term outperformance can be seen on this graph which shows the Total Shareholder
Return of an investment in WHSP over 15 years when compared to the Index.
An investment in WHSP increased in value by about 5.5 times while the Index has increased just 2.2 times.
For
per
sona
l use
onl
y
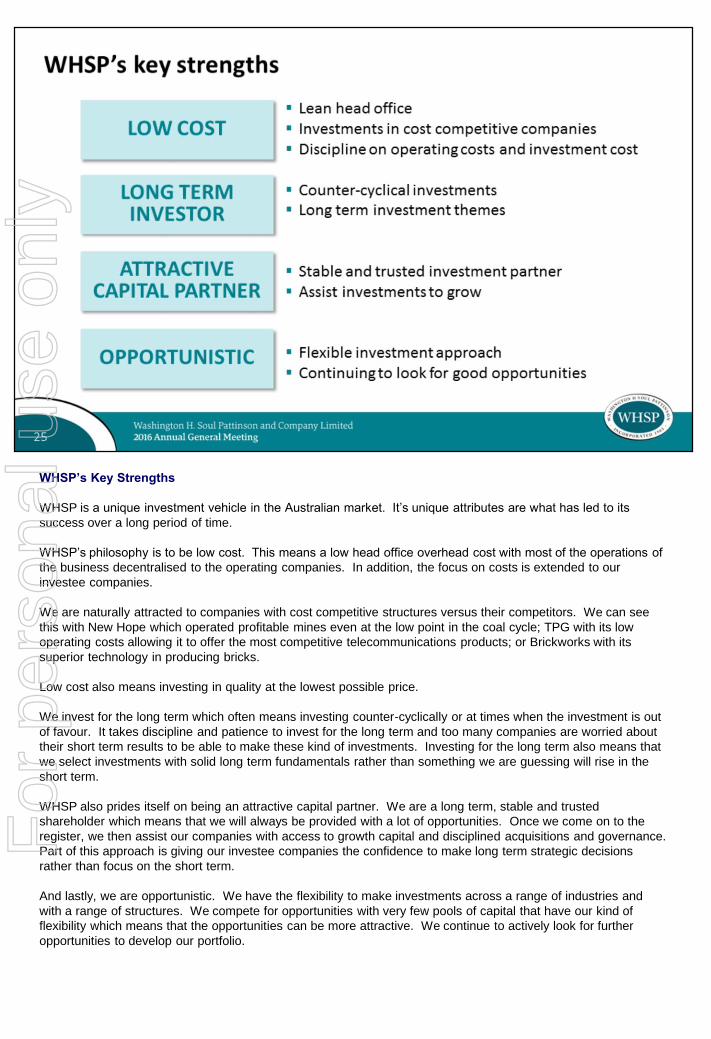
WHSP’s Key Strengths
WHSP is a unique investment vehicle in the Australian market. It’s unique attributes are what has led to its
success over a long period of time.
WHSP’s philosophy is to be low cost. This means a low head office overhead cost with most of the operations of
the business decentralised to the operating companies. In addition, the focus on costs is extended to our
investee companies.
We are naturally attracted to companies with cost competitive structures versus their competitors. We can see
this with New Hope which operated profitable mines even at the low point in the coal cycle; TPG with its low
operating costs allowing it to offer the most competitive telecommunications products; or Brickworks with its
superior technology in producing bricks.
Low cost also means investing in quality at the lowest possible price.
We invest for the long term which often means investing counter-cyclically or at times when the investment is out
of favour. It takes discipline and patience to invest for the long term and too many companies are worried about
their short term results to be able to make these kind of investments. Investing for the long term also means that
we select investments with solid long term fundamentals rather than something we are guessing will rise in the
short term.
WHSP also prides itself on being an attractive capital partner. We are a long term, stable and trusted
shareholder which means that we will always be provided with a lot of opportunities. Once we come on to the
register, we then assist our companies with access to growth capital and disciplined acquisitions and governance.
Part of this approach is giving our investee companies the confidence to make long term strategic decisions
rather than focus on the short term.
And lastly, we are opportunistic. We have the flexibility to make investments across a range of industries and
with a range of structures. We compete for opportunities with very few pools of capital that have our kind of
flexibility which means that the opportunities can be more attractive. We continue to actively look for further
opportunities to develop our portfolio.
For
per
sona
l use
onl
y
2017 Outlook
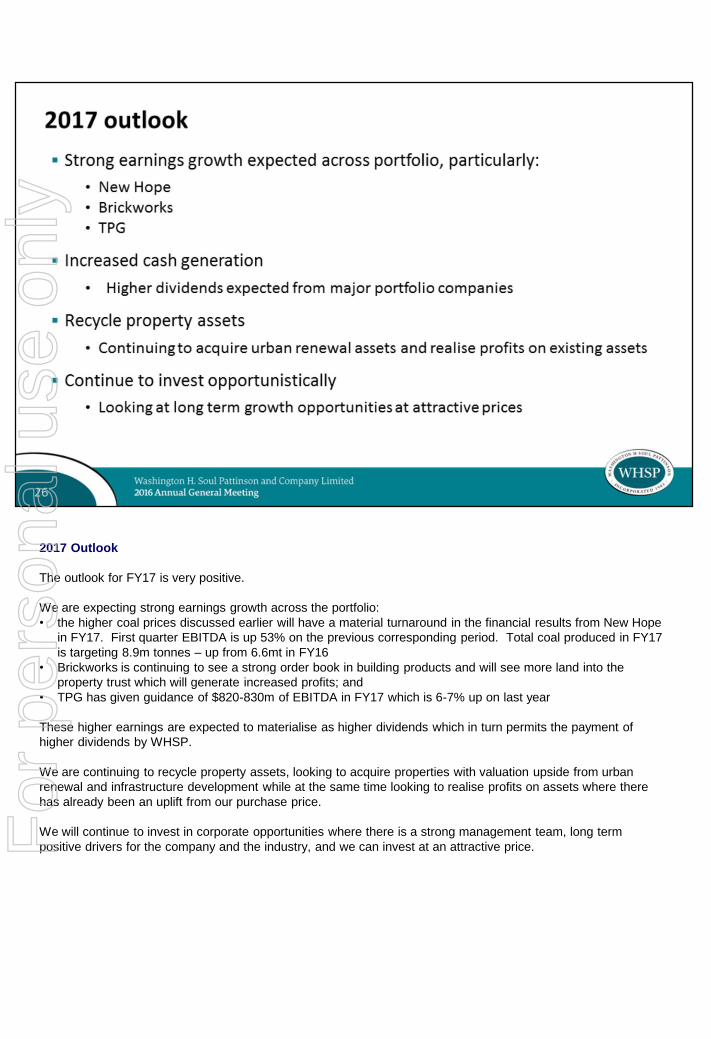
The outlook for FY17 is very positive.
We are expecting strong earnings growth across the portfolio:
• the higher coal prices discussed earlier will have a material turnaround in the financial results from New Hope
in FY17. First quarter EBITDA is up 53% on the previous corresponding period. Total coal produced in FY17
is targeting 8.9m tonnes – up from 6.6mt in FY16
• Brickworks is continuing to see a strong order book in building products and will see more land into the
property trust which will generate increased profits; and
• TPG has given guidance of $820-830m of EBITDA in FY17 which is 6-7% up on last year
These higher earnings are expected to materialise as higher dividends which in turn permits the payment of
higher dividends by WHSP.
We are continuing to recycle property assets, looking to acquire properties with valuation upside from urban
renewal and infrastructure development while at the same time looking to realise profits on assets where there
has already been an uplift from our purchase price.
We will continue to invest in corporate opportunities where there is a strong management team, long term
positive drivers for the company and the industry, and we can invest at an attractive price.For
per
sona
l use
onl
y

For
per
sona
l use
onl
y
For
per
sona
l use
onl
y