Embed Size (px)
Citation preview

ASX Release / 20 October 2015
Investor Relations Mr Rowan Cole Company Secretary +61 3 8660 1900
Media Relations Ms Nerida Mossop Hinton & Associates +61 3 9600 1979
St Barbara Limited Level 10, 432 St Kilda Road, Melbourne VIC 3004 T +61 3 8660 1900 F +61 3 8660 1999 ACN 009 165 066 Locked Bag 9, Collins Street East, Melbourne VIC 8003 W www.stbarbara.com.au
2015 Annual Report and Notice of Annual General Meeting
The 2015 Annual General Meeting of St Barbara Limited will be held at 11:00 am Melbourne time (UTC
+ 11 hours) on Friday 27 November 2015, in the Royce Conference Room, Royce Hotel, 379 St Kilda Road,
Melbourne.
The 2015 Annual Report, Notice of Annual General Meeting and sample Proxy Form are attached, as
distributed to shareholders today.
A live audio webcast of the Annual General Meeting will be available at St Barbara’s website at
www.stbarbara.com.au/investors/webcast, or by clicking here. The audio webcast is ‘listen only’ and does
not enable questions. The audio webcast will subsequently be made available on the website.
For
per
sona
l use
onl
y

Annual Report 2015
For
per
sona
l use
onl
y

ST BARBARA LIMITED 30 JUNE 2015
Page ii
St Barbara at a glance
˃ St Barbara was established in 1969 and is an ASX‐300 listed gold mining company
(ASX:SBM).
˃ St Barbara has two mining operations:
˃ Leonora Operations in Western Australia
˃ Simberi Operations in Papua New Guinea.
˃ Leonora Operations comprise the Gwalia underground mine and associated processing
plant. The Gwalia underground mine is St Barbara’s cornerstone asset. The Gwalia deposit
has an Ore Reserve grade of 9.4 g/t Au, an expected mine life of approximately seven years,
and remains open at depth. Gwalia compares favourably against other ASX listed gold
mines on grade, reserve size, production and cost per ounce.
˃ Simberi Operations has an open pit mine and associated, recently expanded, processing
plant. Simberi has operated at its target production run‐rate of 100,000 ounces per year
since March 2015. Oxide and sulphide Ore Reserves provide the potential for Simberi to
become a long‐term cash generating asset.
˃ At 30 June 2015, St Barbara had Mineral Resources of 9.2 million ounces of contained gold,
including Ore Reserves of 4.0 million ounces of contained gold.
˃ Growth initiatives planned for FY16 include:
˃ further deep drilling below the existing Ore Reserve at Gwalia (which remains open at
depth) with the objective of delineating an Indicated Resource, in conjunction with a
shaft pre‐feasibility study
˃ prospective near mine oxide targets to be drilled at Simberi, in addition to a
pre‐feasibility study of processing options regarding the 1.3 Moz sulphide Ore Reserve
˃ exploration at Centenary and Pinjin in Western Australia and the Tabar Island Group in
PNG.
˃ St Barbara’s primary safety measure, total recordable injury frequency rate, was 5.0 for the
year to June 2015, a continued good result for a mixed jurisdiction combination of
underground and open pit operations.
0 5 10 15
2011
2012
2013
2014
2015
Total Recordable Injury Frequency Rate 5.0
0 100 200 300 400
2011
2012
2013
2014
2015
Gold Production377,387 ouncesF
or p
erso
nal u
se o
nly

ST BARBARA LIMITED 30 JUNE 2015
Page iii
St Barbara at a glance
FY15 Gold Production 377 koz@ AISC A$1,007/oz
11.2 10.0 9.2
2.1 3.2
FY 13 FY 14 FY 15SI (sold FY15)WA & PNG
Mineral Resources(Moz)
Simberi
Simberi
80 koz
King of the Hills
50 koz Gwalia
248 koz
Leonora (Gwalia mine)
• Gwalia underground mine
• FY15 production 248 koz
• FY16F production
220 ‐ 250 koz
• 1.6 Moz Ore Reserve
(open at depth)
• Est. mine life 7 years
FY16 Growth initiative
• Drilling under current
Reserve with objective of
delineating an indicated
Resource in combination
with shaft pre‐feasibility
study, together seeking to
extend mine life
Ore Reserves as at 30 June 2015
Ore Reserves Mt g/t Au Moz
Leonora, Western Australia 7.9 7.5 1.90
Simberi, Papua New Guinea 39.0 1.7 2.10
Total Reserves all Regions 46.9 2.7 4.00
Leonora
Australia
4.3 4.5 4.0
0.9 0.7
FY 13 FY 14 FY15SI (sold FY15)WA & PNG
Notes: All Ore Reserve and Mineral Resource figures are as at 30 June 2015, refer to pages 106 to 110 for details. Mine lives based on Ore Reserves at 30 June 2015. FY16 guidance figures per June 2015 Quarterly Report released to ASX on 21 July 2015. Data is rounded as displayed in charts, discrepancies in totals may occur due to rounding.
Centenary & Pinjin (WA) Tabar Island Group (PNG) 2,700 km2 of prospective tenements across Western Australia and Papua New Guinea
Ore Reserves(Moz)
FY16 planned exploration
• Open pit mine
• FY15 production 80 koz
• FY16F production
90 – 110 koz
• 0.8 Moz oxide Ore Reserve
• Est. oxide mine life (without
mining larger pit for
sulphides) 4 years
FY16 Growth initiative
• Near mine targets for
exploration
• Pre‐feasibility study
investigating potential for
long life sulphide mine
• Existing 1.3 Moz sulphide
Reserve (open at depth)
Simberi
PNG
For
per
sona
l use
onl
y

ST BARBARA LIMITED 30 JUNE 2015
Page iv
Contents
3 Directors’ Report
40 Financial Report
106 Ore Reserves and Mineral Resources Statements
111 Shareholder Information
The Company’s 2015 Corporate Governance Statement was released to the ASX on 20
October 2015 and is available at www.stbarbara.com.au/profile/governance/
For
per
sona
l use
onl
y
ST BARBARA LIMITED 30 JUNE 2015
Page 1
Directors’ Report
and
Financial Report
For Year Ended 30 June 2015
For
per
sona
l use
onl
y

ST BARBARA LIMITED 30 JUNE 2015
Page 2
TABLE OF CONTENTS
DIRECTORS’ REPORT ........................................................................................................................ 3
Directors ...................................................................................................................................... 3
Principal activities ........................................................................................................................ 3
Dividends ..................................................................................................................................... 3
Overview of Results ..................................................................................................................... 3
Business strategy and future prospects .................................................................................... 10
Regulatory environment ........................................................................................................... 15
Information on Directors ........................................................................................................... 16
Meetings of Directors ................................................................................................................ 20
Directors’ Interests .................................................................................................................... 20
Indemnification and insurance of officers ................................................................................. 37
Proceedings on behalf of the company ..................................................................................... 37
Environmental management ..................................................................................................... 37
Non‐audit services ..................................................................................................................... 37
Auditor independence ............................................................................................................... 38
Events occurring after the end of the financial year ................................................................. 38
Rounding of amounts ................................................................................................................ 38
Auditor’s Independence Declaration ........................................................................................ 39
FINANCIAL REPORT ........................................................................................................................ 40
For
per
sona
l use
onl
y
ST BARBARA LIMITED 30 JUNE 2015
Page 3
DIRECTORS’ REPORT The Directors present their report on the “St Barbara Group”, consisting of St Barbara Limited and the entities it controlled at the end of, or during, the financial year ended 30 June 2015.
Directors
The following persons were Directors of St Barbara Limited at any time during the year and up to the date of this report:
T C Netscher Non‐Executive Chairman (appointed 1 July 2015) Non‐Executive Director (1 July 2014 to 30 June 2015)
S J C Wise Non‐Executive Chairman (resigned 30 June 2015)
R S Vassie Managing Director & CEO (appointed 1 July 2014)
D W Bailey Non‐Executive Director (resigned 30 June 2015)
I L Scotland Non‐Executive Director (resigned 26 January 2015)
K J Gleeson Non‐Executive Director (appointed 18 May 2015)
D E J Moroney Non‐Executive Director (appointed 16 March 2015)
The qualifications, experience and special responsibilities of the Directors are presented on pages 16 to 20.
Principal activities
During the year the principal activities of the Group were mining and the sale of gold, mineral exploration and development. There were no significant changes in the nature of activities of the Group during the year.
Dividends
There were no dividends paid or declared during the financial year.
Overview of Results
During the 2015 financial year the Group significantly improved its financial performance, with key achievements over the year being:
• Record annual production from the Gwalia mine of 248,142 ounces of gold (2014: 214,319 ounces) generating significant cash flows during the year of $168,695,000.
• Successful turnaround of the Simberi operations in Papua New Guinea, with this operation generating positive cash flows of $13,907,000 since December 2014.
• Divesting the Gold Ridge project leaving the Group with no residual environmental, rehabilitation or other liabilities.
The Group reported a statutory net profit after tax of $39,682,000 (2014: statutory net loss after tax of $500,831,000) for the year ended 30 June 2015, including Significant Items totalling a net loss after tax of $2,720,000 (2014: net loss of $467,305,000).
To provide additional clarity into the underlying performance of the operations the underlying measures for the year are presented in the table below, together with the statutory results. Underlying net profit after tax, before significant items, was $42,402,000 (2014: net loss of $33,526,000).
Cash on hand (excluding restricted cash) at 30 June 2015 was $76,871,000 (2014: $79,407,000). Total interest bearing borrowings were $346,961,000 (2014: $339,576,000).
For
per
sona
l use
onl
y

ST BARBARA LIMITED 30 JUNE 2015
DIRECTORS’ REPORT
Page 4
The consolidated result for the year is summarised as follows:
2015 $’000
2014 $’000
EBITDA(3)(6)
(including significant items) 167,557 (331,634)
EBIT(2)(6)
(including significant items) 82,486 (440,325)
Profit/(Loss) before tax(4) 40,772 (483,307)
Statutory profit/(loss) (1) after tax for the year 39,682 (500,831)
Total net significant items after tax (2,720) (467,305)
EBITDA (6) (excluding significant items) 186,332 114,974
EBIT (6) (excluding significant items) 101,261 19,354
Profit/(loss) before tax – excluding significant items 57,921 (22,222)
Underlying net profit/(loss) after tax(5)(6)
for the year 42,402 (33,526)
(1) Statutory profit/(loss) is net profit/(loss) after tax attributable to owners of the parent.
(2) EBIT is earnings before interest revenue, finance costs and income tax expense. It includes revenues and expenses associated with discontinued operations.
(3) EBITDA is EBIT before depreciation and amortisation. It includes revenues and expenses associated with discontinued operations.
(4) Profit/(loss) before tax is earnings before income tax expense. It includes revenues and expenses associated with discontinued operations.
(5) Underlying net profit/(loss) after income tax is net profit/(loss) after income tax (“Statutory Profit/(Loss)”) less significant items as described in Note 9 to the financial statements, and excluding profit or loss from discontinued operations.
(6) EBIT, EBITDA and underlying net profit/(loss) after tax are non‐IFRS financial measures, which have not been subject to review or audit by the Group’s external auditors. These measures are presented to enable understanding of the underlying performance of the Group by users.
Details of significant items included in the Statutory Profit/(Loss) for the year are displayed in the table below. Descriptions of each item are provided in Note 9 to the financial report.
2015 $’000
2014* $’000
Asset impairments and write downs (11,425) (215,290)
Increase in rehabilitation provision (5,896) ‐
Redundancy costs (522) (4,349)
Gain on US notes buy back 1,626 ‐
Onerous provisions on office leases (1,729) ‐
Effect of unhedged borrowings (47,470) ‐
Unrealised foreign exchange gain 42,805 ‐
Realised foreign exchange loss on buy back of US Notes (13,066) ‐
Additional proceeds in relation to Southern Cross sale ‐ 1,444
Net profit/(loss) from discontinued operation 18,528 (242,890)
Significant items before tax (17,149) (461,085)
Significant items after tax (2,720) (467,305)
*restated to include comparative for discontinued operations.
For
per
sona
l use
onl
y

ST BARBARA LIMITED 30 JUNE 2015
DIRECTORS’ REPORT
Page 5
Asset impairments and write downs
Due to the cessation of mining at the King of the Hills mine in Leonora during April 2015 and the move to care and maintenance, the Group reviewed the carrying values of the remaining assets associated with the operations. As a result capitalised mine development was written off totalling $11,425,000. In the prior year total impairments expensed in relation to the Simberi and Gold Ridge operations amounted to $410,556,000 after tax.
In addition, a review of the estimate of the rehabilitation provision related to the King of the Hills operations resulted in an increased cost of $5,896,000, which has been expensed in the income statement and recognised as a significant item. Overview of Operating Results
Total production for the Group in the 2015 financial year was 377,387 ounces of gold (2014: 374,402 ounces), and gold sales amounted to 382,104 ounces (2014: 376,160 ounces) at an average gold price of A$1,439 per ounce (2014: A$1,410 per ounce). The prior year included higher production and gold sales from the Gold Ridge mine, which is classified as a discontinued operation.
Consolidated All‐In Sustaining Cost (AISC) for the Group was $1,007 per ounce in 2015 (2014: $1,340 per ounce), reflecting the benefits of strong results achieved at Leonora, improved performance at Simberi and removal of the Gold Ridge operation from the portfolio.
The table below provides a summary of the underlying profit/(loss) before tax from continued operations in Australia and the Pacific.
Year ended 30 June 2015 $’000
Australian Operations
(2)
Pacific Operations
(3)
Consolidated
Revenue 435,685 112,521 548,206
Mine operating costs (209,230) (102,471) (311,701)
Gross Profit 226,455 10,050 236,505
Royalties (17,656) (2,575) (20,231)
Depreciation and Amortisation (69,837) (10,038) (79,875)
Underlying profit/(loss) from operations(1) 138,962 (2,563) 136,399
(1) Excludes corporate and exploration costs, discontinued operations, impairment losses, interest and tax and is non‐IFRS financial information, which has not been subject to review or audit by the Group’s external auditors, . This measure is presented to enable understanding of the underlying performance of the operations. (2) Comprises the Leonora operations, which includes the Gwalia and King of the Hills underground mines and the Leonora processing plant. (3) Comprises only the Simberi operations, with operations at Gold Ridge having been suspended in April 2014.
The table below provides a summary of the cash contribution, after capital expenditure, from continued operations in Australia and the Pacific.
Year ended 30 June 2015 $’000
Australian Operations
Pacific Operations
Consolidated
Operating cash contribution 224,328 8,490 232,818
Capital expenditure (38,332) (8,523) (46,855)
Cash contribution 185,996 (33) 185,963
F
or p
erso
nal u
se o
nly

ST BARBARA LIMITED 30 JUNE 2015
DIRECTORS’ REPORT
Page 6
Analysis of Australian Operations
Total sales revenue from the Leonora operations of $435,685,000 (2014: $401,820,000) was generated from gold sales of 302,094 ounces (2014: 284,067 ounces) in the year at an average achieved gold price of A$1,437 per ounce (2014: A$1,406 per ounce). During the 2015 year revenue benefitted from six percent higher gold sales compared with the prior year and a marginal increase in the average spot gold price.
In April 2015 mining operations at the King of the Hills mine ceased and processing of stockpiles through the Gwalia mill continued to the end of June.
A summary of production performance for the year ended 30 June 2015 is provided in the table below.
Details of 2015 Production Performance
Gwalia King of the Hills
2014/15 2013/14 2014/15 2013/14
Underground Ore Mined kt 902 811 457 472
Grade g/t Au 8.9 8.4 4.1 4.6
Ore Milled (including stockpiles) kt 931 851 392 514
Grade g/t Au 8.6 8.1 4.2 4.5
Recovery % 96 96 95 95
Gold Production oz 248,142 214,319 49,677 70,711
Cash Cost(1) A$/oz 642 688 1,112 973
All‐In Sustaining Cost (AISC) (2)
A$/oz 841 940 1,103 1,263
Gwalia
Gwalia produced a record 248,142 ounces of gold in 2015 (2014: 214,319 ounces). The record performance at Gwalia was the result of multiple factors, including improvements in productivity, successful implementation of innovations in mining and higher grade.
Ore tonnes mined from the Gwalia underground mine increased from 811,000 tonnes in 2014 to 902,000 tonnes in 2015, largely due to excellent productivity improvements achieved during the year, including continued underground storage of waste.
Ore mined grades increased from 8.4 grams per tonne gold in 2014 to 8.9 grams per tonne gold in 2015 mainly due to reduced dilution, and high grade shoots present in stopes that cannot be reliably estimated by production drilling. Ore milled grade increased from 8.1 grams per tonne in 2014 to 8.6 grams per tonne in line with the higher grade of ore mined. The Gwalia mill continued to perform strongly in 2015 and throughput increased in line with the higher ore production; the average recovery was consistent with the prior year at 96 percent.
Gwalia unit Cash Operating Costs1 for the year were $642 per ounce (2014: $688 per ounce), reflecting the benefit of
increased production and higher average grade. The unit All‐In Sustaining Cost (AISC)2 for Gwalia was $841 per ounce in
2015 well down on the $940 per ounce reported in the prior year. The lower AISC in 2015 was due mainly to the lower unit Cash Operating Cost and a reduced corporate and administration cost allocation. Total Cash Operating Costs at Gwalia of $159,307,000 were higher compared with the prior year (2014: $147,451,000) due to the increase in production volumes.
In 2015 Gwalia generated net cash flows, after capital expenditure, of $168,695,000 (2014: $119,392,000).
1 Cash Operating Costs are mine operating costs including government royalties, and after by‐product credits. This is a non‐IFRS financial measure which has not been subject to review or audit by the Group’s external auditors. It is presented to provide meaningful information to assist management, investors and analysts in understanding the results of the operations. Cash Operating Costs are calculated according to common mining industry practice
using The Gold Institute (USA) Production Cost Standard (1999 revision). 2 All‐In Sustaining Cost (AISC) is based on Cash Operating Costs, and adds items relevant to sustaining production. It includes some but not all, of the components identified in World Gold Council’s Guidance Note on Non‐GAAP Metrics – All‐In Sustaining Costs and All‐In Costs (June 2013), which is a non
IFRS financial measure.
For
per
sona
l use
onl
y

ST BARBARA LIMITED 30 JUNE 2015
DIRECTORS’ REPORT
Page 7
King of the Hills
Ore tonnes mined from the King of the Hills underground mine was marginally down on 2014 at 457,000 tonnes (2014: 472,000 tonnes). Gold production from King of the Hills was 49,677 ounces (2014: 70,711 ounces). The lower production in 2015 was as a result of mining operations ceasing in April 2015 and the fact that higher grade Gwalia ore was prioritised for processing over King of the Hills ore.
The average grade of ore mined was lower than the prior year at 4.1 grams per tonne gold (2014: 4.6 grams per tonne gold). The King of the Hills unit cash operating costs for 2015 were $1,112 per ounce (2014: $973 per ounce), with the increase due mainly to the lower production. The unit All‐In Sustaining Cost (AISC) for King of the Hills was $1,103 per ounce in 2015 (2014: $1,263 per ounce). Total Cash Operating Costs at King of the Hills were $55,241,000 (2014: $68,802,000), reflecting the lower mining activity and milling volumes in 2015.
In 2015 King of the Hills generated net cash flows, after capital expenditure, of $17,301,000 (2014: net cash outflow $650,000). As at 30 June 2015 ore containing an estimated 9,410 ounces of gold was stockpiled at King of the Hills for processing in the first quarter of the 2016 financial year.
Analysis of Pacific Operations
Operations at the Gold Ridge mine in the Solomon Islands were suspended in April 2014 following extreme rainfall and flooding. Production did not recommence and the Group divested the mine in May 2015. In the 2014 year Gold Ridge produced 45,121 ounces of gold prior to operations being suspended, with gold sales of 49,410 ounces generating revenue of $71,058,000. While there was no production from Gold Ridge in the 2015 year, gold sales of $4,345,000 were generated from gold produced in the prior year. The results of operations at Gold Ridge and the impact of its divestment in 2015 have been separately disclosed as discontinued operations in the income statement.
During 2015 a successful turnaround was completed at the Simberi operations. The turnaround has been achieved through optimising the processing plant to sustain throughput of 3.5 million tonnes per annum, improving the mining fleet and achieving productivity improvements in mining operations, increased focus on the ore delivery system and a commitment to reduce operating costs.
Total sales revenue from Simberi in 2015 was $112,521,000 (June 2014: $60,950,000) generated from gold sales of 77,236 ounces (June 2014: 42,683 ounces) at an average achieved gold price of A$1,445 per ounce (June 2014: A$1,426 per ounce).
A summary of production performance at Simberi for the year ended 30 June 2015 is provided in the table below.
Details of 2015 Production Performance
Simberi Gold Ridge
30 June 2015
30 June 2014
30 June 2015
30 June 2014
Open Pit Ore Mined kt 2,070 1,886 ‐ 1,425
Grade g/t Au 1.23 1.0 ‐ 1.4
Ore Milled (including stockpiles) kt 2,660 1,714 ‐ 1,467
Grade g/t Au 1.1 1.0 ‐ 1.4
Recovery % 84 80 ‐ 67
Gold Production oz 79,568 44,251 ‐ 45,121
Cash Cost(1) A$/oz 1,337 2,136 ‐ 1,994
All‐In Sustaining Cost (AISC)(1)
A$/oz 1,464 2,404 ‐ 2,218
(1) Before significant items.
For
per
sona
l use
onl
y

ST BARBARA LIMITED 30 JUNE 2015
DIRECTORS’ REPORT
Page 8
Simberi
Simberi production of 79,568 ounces of gold was the highest since the Group acquired the operations in September 2012 (2014: 44,251 ounces). Simberi’s performance in the second half of 2015 with production of 49,635 ounces confirmed that the turnaround of the operations has been successful.
Ore tonnes mined and total volume of material moved has increased quarter on quarter during 2015. Total material moved in 2015 was 6,289,000 tonnes compared to 4,256,000 tonnes for the 2014 year. Ore mined in 2015 totalled 2,070,000 tonnes compared to 1,886,000 tonnes in 2014. The improvement in mining performance in the 2015 financial year was largely attributable to better equipment reliability and availability, improvement in equipment and introduction of efficiencies in the mining operations.
Ore mined grades increased from 1.0 gram per tonne gold in 2014 to 1.23 grams per tonne gold in 2015.
Ore milled increased to 2,660,000 tonnes (2014: 1,714,000 tonnes), which reflected the commissioning of the SAG mill and refurbishment of the ball mill in December 2014, and the processing of ore through both the SAG and ball mills in the second half of the year.
Simberi unit Cash Operating Costs for the year were $1,337 per ounce (2014: $2,136 per ounce), reflecting the positive impact of increased production and lower operating costs. The unit All‐In Sustaining Cost (AISC) for Simberi was $1,464 per ounce in 2015 (2014: $2,404 per ounce). As the performance of Simberi significantly improved during the second half of the 2015 financial year, the unit cash costs and AISC reduced markedly to $1,107 per ounce and $1,222 per ounce respectively. Total Cash Operating Costs at Simberi during the 2015 year were higher than the prior year at $106,382,000 (2014: $94,520,000) due to increased production.
In 2015 Simberi generated net negative cash flows, after capital expenditure, of $33,000 (2014: negative $60,381,000). In the seven month period from December 2014 to 30 June 2015 Simberi generated positive net cash flows of $13,907,000.
Discussion and Analysis of the Income Statement
Revenue
Total revenue (excluding discontinued operations) increased from $462,770,000 in 2014 to $548,206,000 in 2015. Revenue from Leonora and Simberi was higher than the previous year due to increased production and gold sales, and the benefit of the higher gold price.
Mine operating costs
Mine operating costs in relation to continuing operations in 2015 were $311,701,000 compared to $297,864,000 in the prior year. The increase in operating costs was attributable to higher production and mining activity at both the Gwalia and Simberi mines in 2015.
Other revenue and income
Other revenue of $1,782,000 (2014: $1,904,000) comprised mainly interest earned during the year of $1,586,000 (2014: $1,718,000). The decrease in interest earned is reflective of lower interest rates applied to excess cash balances in 2015.
Other income for the year of $1,503,000 (2014: $3,169,000) included royalties earned from tenements held in Australia of $1,053,000 (2014: $1,565,000). In the prior year other income included an amount of $1,444,000 in relation to additional proceeds from the sale of the Southern Cross operations.
Exploration
Exploration expenditure expensed in the income statement in the year amounted to $7,691,000 (2014: $16,112,000). Total exploration expenditure incurred during the 2015 year amounted to $9,932,000 (2014: $16,112,000), with an amount of $2,241,000 (2014: nil) capitalised to exploration and evaluation. Exploration expenditure in the current year was significantly lower compared to the prior year, with exploration expenditure activities during the year focused on investigating highly prospective near mine high grade oxide targets at Simberi and undertaking a deep drilling program at Gwalia.
Corporate and support costs
Corporate and support costs for the year of $20,284,000 (2014: $26,809,000) comprised mainly expenses relating to the corporate office and compliance costs. Expenditure in 2015 was lower than in the prior year as a result of a cost reduction program that commenced in 2014.
For
per
sona
l use
onl
y
ST BARBARA LIMITED 30 JUNE 2015
DIRECTORS’ REPORT
Page 9
Royalties
Royalty expenses for the year were $20,231,000 (2014: $17,267,000). Royalties paid in Western Australia are 2.5% of gold revenues, plus a corporate royalty of 1.5% of gold revenues. Royalties paid in Papua New Guinea are 2.25% of gold revenues earned from the Simberi mine. The increase in royalty expenses in 2015 was attributable to increased gold revenue from Leonora and Simberi.
Depreciation and amortisation
Depreciation and amortisation of fixed assets and capitalised mine development amounted to $85,071,000 (2014: $95,620,000) for the year. Depreciation and amortisation attributable to the Australian Operations was $69,837,000 (2014: $80,938,000), with the lower charge attributable to reduced amortisation of mine development at King of the Hills. The expense at Simberi was $10,038,000 (2014: $11,554,000), with the lower charge due to the reduction in the asset base in the prior year from the impairment write off.
Other expenditure
Other expenditure of $9,705,000 (2014: $1,261,000) included an expense related to recognition of an onerous provision for surplus office lease space, costs related to a procurement cost reduction initiative and technical and feasibility study costs.
Net finance costs
Finance costs in the year were $43,300,000 (2014: $43,296,000). Finance costs comprised interest paid and payable on borrowings and finance leases of $36,708,000 (2014: $26,551,000), capitalised borrowing costs relating to the senior secured notes amortised to the income statement of $4,246,000 (2014: $3,575,000) and the unwinding of the discount on the rehabilitation provision of $1,875,000 (2014: $1,629,000).
Foreign currency movements
A foreign exchange movement loss of $15,350,000 was recognised for the year (2014: gain of $3,218,000), which included the foreign currency loss of $13,066,000 on the buy back of the US Notes in June 2015.
Income tax
An income tax expense of $1,090,000 was recognised for the 2015 year (2014: income tax expense of $12,484,000).
Discussion and Analysis of the Cash Flow Statement
Operating activities
Cash flows from operating activities for the year were $113,201,000 (2014: $20,260,000), reflecting the benefit of higher receipts from customers and significantly lower payments to suppliers and employees compared to the prior year. Receipts from customers of $555,823,000 (2014: $540,050,000) were marginally higher than the prior year; the prior year receipts included an amount of $71,058,000 related to Gold Ridge. Payments to suppliers were $407,508,000 (2014: $472,501,000), with 2014 including payments related to Gold Ridge amounting to $97,818,000. Payments for exploration expensed in the year amounted to $7,383,000 (2014: $21,297,000, including $5,185,000 relating to discontinued operation). Interest paid in the year was $28,682,000 (2014: $26,565,000), with the higher expense due mainly to the impact of the weaker Australian dollar on United States dollar denominated interest payments.
Investing activities
Net cash flows used in investing activities amounted to $50,602,000 (2014: $86,412,000) for the year. Lower expenditure on property, plant and equipment of $23,762,000 (2014: $49,225,000) was the main reason for reduced investing expenditure in the year. The lower expenditure on property, plant and equipment in 2015 was due to the completion of the Simberi SAG Mill in 2014. Lower mine development of $24,705,000 (2014: $39,971,000) was due mainly to reduced expenditure at King of the Hills. Exploration expenditure capitalised during the year totalled $2,241,000 (2014: $Nil), which related to the deep drilling program at Gwalia. Investing expenditure during the year was in the following major areas:
Underground mine development and infrastructure at Gwalia – $30,662,000 (2014: $28,921,000);
Underground mine development and infrastructure at King of the Hills – $4,969,000 (2014: $11,050,000);
Simberi oxide expansion and other capital projects – $8,412,000 (2014: $26,973,000); and
Purchase of property, plant and equipment at the operations – $3,073,000 (2014: $19,092,000)
For
per
sona
l use
onl
y

ST BARBARA LIMITED 30 JUNE 2015
DIRECTORS’ REPORT
Page 10
Financing activities
Net cash flows related to financing activities in 2015 were a net outflow of $71,341,000 (2014: net inflow of $18,679,000), due mainly to the repayment of debt in the 2015 year. The main movements in financing cash flows included:
Partial repayment of the secured notes through a buy back totalling $66,831,000 after a five percent discount.
Repayment of finance leases amounting to $4,003,000 (2014: $4,706,000).
The prior year benefitted from the net additional draw down of debt of $14,921,000 and proceeds from the close out of gold options of $8,500,000.
Discussion and Analysis of the Statement of Financial Position
Net Assets and Total Equity
St Barbara’s net assets and total equity increased marginally during the year by $8,617,000 to $140,429,000 as a result of an increase in the deferred tax assets, combined with a reduction in total liabilities, offset by lower mine properties. The reduction in mine properties was attributable to amortisation in the year and the impairment of King of the Hills.
Trade and other payables decreased to $42,895,000 at 30 June 2015 (2014: $58,951,000), reflecting mainly the impact of the cessation of activities at King of the Hills and Gold Ridge.
Provisions decreased to $62,597,000 (2014: $84,007,000) due to the de‐recognition of the Gold Ridge rehabilitation provision.
The deferred tax balance was a net asset of $13,985,000 (2014: net asset of $5,859,000). Deferred tax assets arising from accumulated tax losses in relation to the Pacific Operations of $79,574,000 (tax effected) have not yet been booked as it is not probable as at 30 June 2015 that future taxable profits will be generated to utilise these deferred tax assets.
Debt management and liquidity
The available cash balance at 30 June 2015 was $76,871,000 (2014: $79,407,000), with an additional $2,084,000 (2014: $1,577,000) held on deposit as restricted cash and reported within trade receivables.
Total interest bearing liabilities increased to $346,961,000 at 30 June 2015 (2014: $339,576,000). The significantly weaker Australian dollar had a materially negative impact on the United States denominated debt as at 30 June 2015, while the buy back of senior secured notes in June 2015 reduced debt by $70,037,000. The largest components of the year end balance were:
US$195,980,000 (2014: US$250,000,000) senior secured notes translated at the year end AUD/USD exchange rate ($248,621,000), net of capitalised transaction costs of $5,467,000;
A debt facility of US$75,000,000 (2014: US$75,000,000) drawn down with RK Mine Finance (“Red Kite”) translated at the year end AUD/USD exchange rate ($93,081,000), net of capitalised transaction costs of $4,157,000; and
Lease liabilities of $5,259,000.
The current portion of total debt as at 30 June 2015 was $52,428,000 (2014: $24,226,000). Scheduled quarterly repayments of the Red Kite facility commences in September 2015.
The AUD/USD exchange rate as at 30 June 2015 was 0.7713 (30 June 2014: 0.9430).
Business strategy and future prospects
St Barbara’s strategic focus is on mining lower cost gold deposits in Australia and at Simberi in Papua New Guinea. Currently the Group has a diversified asset portfolio spanning underground and open cut mines, and exploration projects in Australia and Papua New Guinea. A successful turnaround was completed at the Simberi operations through the optimisation of the processing plant, improving the mining fleet, and productivity improvements in mining operations.
St Barbara’s strategy is to generate shareholder value through the discovery and development of gold deposits and production of gold. The Group aligns its decisions and activities to this strategy by focusing on three key value drivers: relative total shareholder returns, growth in gold ore reserves and return on capital employed.
Strategic drivers for the business include:
Optimising cash flow and reducing the cost base: The Group is focused on optimising cash flow from operations through maximising production and managing costs at its existing operations, enhancing operating capabilities and
For
per
sona
l use
onl
y
ST BARBARA LIMITED 30 JUNE 2015
DIRECTORS’ REPORT
Page 11
incorporating new technologies across St Barbara. The Group will continue to identify opportunities to enhance efficiency and improve operating performance in a volatile gold market.
Improving productivity: The Group is focused on consolidating the turnaround at the Simberi operations to maintain the increased production rates and reduced operating costs. St Barbara continues to invest to improve infrastructure, mining fleets and capability to ensure consistent and reliable production.
Growing the ore reserve base through the development of existing Mineral Resources and exploration activities: A number of potential organic growth opportunities have been identified, which could increase production and extend the life of the Gwalia and Simberi operations. During 2015 a deep drilling program commenced at Gwalia with the objective to extend the Gwalia mineral resource and develop the case for mining below the current resource. At Simberi, a sulphide ore reserve, which has been estimated at 1.3 Moz, provides an opportunity to create a long life production centre at Simberi. In addition the Group is generating and evaluating exploration targets in the Tabar Island Group in Papua New Guinea.
Maintaining a conservative financial profile: The Group will continue to maintain prudent financial management policies with the objective of maintaining liquidity to ensure appropriate investments in the operations. The Group’s financial management policies are aimed at generating net cash flows from operations to meet financial commitments, fund exploration and reduce debt to the extent viable and appropriate. The Group’s capital management plan is reviewed and discussed with the Board on a regular basis.
Continue and strengthen the Group’s commitment to employees and local communities: The Group considers the capability and wellbeing of its employees as key in delivering the business strategy. Creating and sustaining a safe work environment and ensuring that operations conform to applicable environmental and sustainability standards is an important focus for the Group. The Group invests in the training and development of its employees, talent management, and succession planning, and views such efforts as an important component of instilling St Barbara’s values throughout the organisation and retaining continuity in the workforce. The Group has implemented a comprehensive talent management framework to strengthen the capacity to attract, motivate and retain capable people. The Group also has an ongoing commitment to work with local communities to improve infrastructure, particularly in health and education, support local businesses, and provide venues for leisure activities, and other opportunities for developing communities in which the Group operates.
Within Australia, the Gwalia underground mine with ore reserves of 1.6 million ounces remains the flagship asset of the Group, generating strong cash flows. In parallel with the deep drilling program at Gwalia, studies in relation to ore haulage options are to occur during the 2016 financial year.
In Papua New Guinea, a prefeasibility study (PFS) for the Simberi sulphide project is being advanced. Current plans indicate that a phased cut over to sulphide processing, including a period of processing both sulphides and oxides would be optimal (due to areas of oxide reserves lying within the deeper sulphide pit shells). The PFS is currently focussed on metallurgical work that indicates a traditional floatation circuit will produce a marketable concentrate for export from Simberi. The extent of oxide and sulphide reserves indicates at least a 15 year mine life with upside potential. If the sulphide project was not progressed, the best value plan for oxides would be for approximately 4 years, with possible extension to this from continuing exploration work.
The Group’s 2016 financial year budget was developed in the context of a volatile gold market and weakening Australian dollar against the United States dollar. The Group’s priorities in the 2016 financial year are to continue consistent production from Leonora, further optimise the operations at Simberi, reduce costs and contain capital expenditure. For the 2016 financial year the Group’s operational and financial outlook is as follows:
Gold production is expected to be in the range 319,000 to 369,000 ounces.
All‐In Sustaining Cost is expected to be in the range of $995 per ounce to $1,080 per ounce.
Capital expenditure is expected to be in the range of $38 million to $47 million.
Material business risks
St Barbara prepares its business plan using estimates of production and financial performance based on a business planning system and a range of assumptions and expectations. There is uncertainty in these assumptions and expectations, and risk that variation from them could result in actual performance being different to planned outcomes. The uncertainties arise from a range of factors, including the Group’s international operating scope, nature of the mining industry and economic factors. The material business risks faced by the Group that may have an impact on the operating and financial prospects of the Group as at 30 June 2015 are:
For
per
sona
l use
onl
y

ST BARBARA LIMITED 30 JUNE 2015
DIRECTORS’ REPORT
Page 12
Fluctuations in the United States Dollar (“USD”) spot gold price: Volatility in the gold price creates revenue uncertainty and requires careful management of business performance to ensure that operating cash margins are maintained despite a fall in the spot gold price.
Declining gold prices can also impact operations by requiring a reassessment of the feasibility of a particular exploration or development project. Even if a project is ultimately determined to be economically viable, the need to conduct such a reassessment could cause substantial delays and/or may interrupt operations, which may have a material adverse effect on the results of operations and financial condition.
In assessing the feasibility of a project for development, the Group may consider whether a hedging instrument should be put in place in order to guarantee a minimum level of return. For example the Group put in place a gold collar structure when the King of the Hills project was commissioned.
The Group has a centralised treasury function that monitors the risk of fluctuations in the USD gold price and impacts on expenditures from movements in local currencies. Where possible, the exposure to movements in the USD relative to USD denominated expenditure is offset by the exposure to the USD gold price (a natural hedge position).
Government regulation: The Group’s mining, processing, development and exploration activities are subject to various laws and statutory regulations governing prospecting, development, production, taxes, royalty payments, labour standards and occupational health, mine safety, toxic substances, land use, water use, communications, land claims of local people and other matters.
No assurance can be given that new laws, rules and regulations will not be enacted or that existing laws, rules and regulations will not be applied in a manner which could have an adverse effect on the Group’s financial position and results of operations. Any such amendments to current laws, regulations and permits governing operations and activities of mining and exploration companies, or more stringent implementation thereof, could have a material adverse impact on the Group. Failure to comply with any applicable laws, regulations or permitting requirements may result in enforcement actions against the Group, including orders issued by regulatory or judicial authorities causing operations to cease or be curtailed, and may include corrective measures requiring capital expenditures, installation of additional equipment, or remedial actions.
Operating risks and hazards: The Group’s mining operations, consisting of open pit and underground mines, generally involve a high degree of risk, and these risks are increased when mining occurs at increased depth. The Group’s operations are subject to all the hazards and risks normally encountered in the exploration, development and production of gold. Processing operations are subject to hazards such as equipment failure, toxic chemical leakage, loss of power, fast‐moving heavy equipment, failure of deep sea tailings disposal pipelines and retaining dams around tailings containment areas, rain and seismic events which may result in environmental pollution and consequent liability. The impact of these events could lead to disruptions in production and scheduling, increased costs and loss of facilities, which may have a material adverse impact on the Group’s results of operations, financial condition and prospects. These risks are managed by a structured operations risk management framework.
Reliance on transportation facilities and infrastructure: The Group depends on the availability and affordability of reliable transportation facilities and infrastructure (e.g. roads, bridges, airports, power sources and water supply) to deliver consumables to site, and final product to market. Interruption in the provision of such infrastructure (e.g. due to adverse weather; community or government interference) could adversely affect St Barbara's operations, financial condition and results of operations. The Group’s operating procedures include business continuity plans which can be enacted in the event a particular piece of infrastructure is temporarily unavailable.
Production, cost and capital estimates: The Group prepares estimates of future production, cash costs and capital costs of production for its operations. The ability of the Group to achieve production targets, or meet operating and capital expenditure estimates on a timely basis cannot be assured. The assets of the Group, as any others, are subject to uncertainty with ore tonnes, grade, metallurgical recovery, ground conditions, operational environment, funding for development, regulatory changes, accidents and other unforeseen circumstances such as unplanned mechanical failure of plant and equipment. Failure to achieve production, cost or capital estimates, or material increases to costs, could have an adverse impact on the Group’s future cash flows, profitability and financial condition. The development of estimates is managed by the Group using a rigorous budgeting and forecasting process. Actual results are compared with forecasts to identify drivers behind discrepancies which may result in updates to future estimates.
For
per
sona
l use
onl
y

ST BARBARA LIMITED 30 JUNE 2015
DIRECTORS’ REPORT
Page 13
Changes in input costs: Mining operations and facilities are intensive users of electricity, gas and carbon‐based fuels. Energy prices can be affected by numerous factors beyond the Group's control, including global and regional supply and demand, carbon taxes, inflation, political and economic conditions, and applicable regulatory regimes. The prices of various sources of energy may increase significantly from current levels.
The Group's production costs are also affected by the prices of commodities it consumes or uses in its operations, such as diesel, lime, sodium cyanide and explosives. The prices of such commodities are influenced by supply and demand trends affecting the mining industry in general and other factors outside the Group's control. Increases in the price for materials consumed in St Barbara's mining and production activities could materially adversely affect its results of operations and financial condition.
Certain of the Group's operations use contractors for the bulk of the mining services at those operations, and some of its construction projects are conducted by contractors. As a result, the Group's operations are subject to a number of risks, including:
- negotiation and renewal of agreements with contractors on acceptable terms; - failure of contractors to perform under their agreements, including failure to comply with safety systems and
standards, contractor insolvency and failure to maintain appropriate insurance; - failure of contractors to comply with applicable legal and regulatory requirements; and - changes in contractors.
In addition, St Barbara may incur liability to third parties as a result of the actions of its contractors. The occurrence of one or more of these risks could have a material adverse effect on its results of operations and financial position.
The Group manages risks associated with input costs through a centralised procurement function which analyses market trends, supply environment, and operational demand planning, to establish appropriate sourcing strategies for spend categories.
Exploration and development risk: Although the Group’s activities are primarily directed towards mining operations and the development of mineral deposits, its activities also include the exploration for mineral deposits and the possibility of third party arrangements including joint ventures, partnerships, toll treating arrangements or other third party contracts. An ability to sustain or increase the current level of production in the longer term is in part dependent on the success of the Group’s exploration activities and development projects, and the expansion of existing mining operations.
The exploration for and development of mineral deposits involves significant risks that even a combination of careful evaluation, experience and knowledge may not eliminate. While the discovery of an ore body may result in substantial rewards, few properties that are explored subsequently have economic deposits of gold identified, and even fewer are ultimately developed into producing mines. Major expenses may be required to locate and establish mineral reserves, to establish rights to mine the ground, to receive all necessary operating permits, to develop metallurgical processes and to construct mining and processing facilities at a particular site. It is impossible to ensure that the exploration or development programs the Group plans will result in a profitable mining operation.
Whether a mineral deposit will be commercially viable depends on a number of factors.
The Group has a disciplined approach to allocating budget to exploration projects. The Group also has investment criteria to ensure that development projects are only approved if an adequate return on the investment is expected.
Ore Reserves and Mineral Resources: The Group's estimates of Ore Reserves and Mineral Resources are based on different levels of geological confidence and different degrees of technical and economic evaluation, and no assurance can be given that anticipated tonnages and grades will be achieved, that the indicated level of recovery will be realised or that Ore Reserves could be mined or processed profitably. The quality of any Ore Reserve or Mineral Resource estimate is a function of the quantity of available technical data and of the assumptions used in engineering and geological interpretation, and modifying factors affecting economic extraction. Such estimates are compiled by experienced and appropriately qualified geoscientists using mapping and sampling data obtained from bore holes and field observations, and subsequently reported by Competent Persons under the JORC Code.
Fluctuation in gold prices, key input costs to production, as well as the results of additional drilling, and the evaluation of reconciled production and processing data subsequent to any estimate may require revision of such estimate.
For
per
sona
l use
onl
y

ST BARBARA LIMITED 30 JUNE 2015
DIRECTORS’ REPORT
Page 14
Actual mineralisation or ore bodies may be different from those predicted, and any material variation in the estimated Ore Reserves, including metallurgy, grade, dilution, ore loss, or stripping ratio at the Group's properties may affect the economic viability of its properties, and this may have a material adverse impact on the Group's results of operations, financial condition and prospects.
There is also a risk that depletion of reserves will not be offset by discoveries or acquisitions or that divestitures of assets will lead to a lower reserve base. The reserve base of the Group may decline if reserves are mined without adequate replacement and the Group may not be able to sustain production beyond current mine lives, based on current production rates.
Political, social and security risks: St Barbara has production and exploration operations in developing countries that are subject to political, economic and other risks and uncertainties. The formulation and implementation of government policies in these countries may be unpredictable. Operating in developing countries also involves managing security risks associated with the areas where the Group has activities. The Group has established policies and procedures to assist in managing and monitoring various government relations. The Group’s operating procedures at its mines in the Pacific include detailed security plans.
Restrictions on indebtedness: Under the terms of the US senior secured notes, although there are no operational covenants, there are certain restrictions on the cumulative amount that can be invested in the Pacific Operations, and in the amount of additional indebtedness that may be entered into by the Group. A breach of these terms may lead to a default. At 30 June 2015, based on forward projections, there is adequate headroom under these restrictions. However the restrictions on investment in the Pacific Operations and new indebtedness may provide a potential constraint on developing future programs such as expanding production capacity or developing additional near mine reserves.
Refinancing risk: The Company has debt facilities with external financiers, including a secured loan facility with RK Mine Finance and senior secured notes. The structure of these facilities has been designed so that the refinancing obligations of the facilities are staged over a reasonable period. Although the Company currently generates sufficient cash flows to secure its debt requirements, no assurance can be given that it will be able to refinance the debt prior to its expiry on acceptable terms to the Company. If the Company is unable to repay or refinance its external debt in the future, its financial condition and ability to continue operating may be adversely affected.
Foreign exchange: The Group has an Australian dollar functional currency for reporting purposes. However, gold is sold throughout the world based principally on the U.S. dollar price, and most of the Group's revenues and interest bearing liabilities are realised in, or linked to, U.S. dollars. The Group is also exposed to U.S. dollars and Papua New Guinea Kina in respect of operations located in Papua New Guinea as certain of its operating costs are denominated in these currencies. There is a "natural" (but not perfect) hedge which matches to some degree U.S. denominated revenue and obligations related to interest bearing liabilities, which may reduce, but does not eliminate, foreign exchange risk. The Group is therefore exposed to fluctuations in foreign currency exchange rates. The Group monitors foreign exchange exposure and risk on a monthly basis through the centralised treasury function and a Management Treasury Risk Committee.
Community relations: A failure to adequately manage community and social expectations within the communities in which the Group operates may lead to local dissatisfaction which, in turn, could lead to interruptions to production and exploration operations. The Group has an established stakeholder engagement framework to guide the management of the Group’s community relations efforts. At each of the operations in the Pacific there is a dedicated community relations team to work closely with the local communities and government.
Insurance: The Group maintains insurance to protect against certain risks. However, the Group’s insurance will not cover all the potential risks associated with a mining company’s operations. The Group may also be unable to maintain insurance to cover these risks at economically feasible premiums. Insurance coverage may not continue to be available or may not be adequate to cover any resulting liability. Moreover, insurance against risks such as loss of title to mineral property, environmental pollution, or other hazards as a result of exploration and production is not generally available to the Group or to other companies in the mining industry on acceptable terms. The Group might also become subject to liability for pollution or other hazards which may not be insured against or which it may elect not to insure against because of premium costs or other reasons. Losses from these events may cause the Group to incur significant costs that could have a material adverse effect upon its financial performance and results of operations.
Weather and climactic conditions: The effects of changes in rainfall patterns, changing storm patterns and intensities have from time to time adversely impacted, and may in the future adversely impact, the cost, production levels and financial performance of the Group's operations. The Group's mining operations have been,
For
per
sona
l use
onl
y
ST BARBARA LIMITED 30 JUNE 2015
DIRECTORS’ REPORT
Page 15
and may in the future be, subject from time to time to severe storms and high rainfalls leading to flooding and associated damage, which has resulted, and may result in delays to, or loss of production at its mines. Seismic activity is of particular concern to mining operations. The Simberi mine in Papua New Guinea is in an area known to be seismically active and is subject to risks of earthquakes and the related risks of tidal surges and tsunamis. Also, production at the Gwalia mine has in the past been, on occasion, interrupted due to water ingress and flooding at the base of the mine. Naturally occurring events, such as earthquakes, volcanic eruptions and tsunamis are difficult to predict and no assurance can be given that St Barbara's operations will not be adversely affected by earthquakes and associated tidal surges and tsunamis.
Risk of further impairment: If the gold price continues to decline, or the operations are not expected to meet future production levels, there may be a potential for future impairment write downs at any of our operations.
Risk management
The Group manages the risks listed above, and other day‐to‐day risks through an established enterprise wide risk management framework which conforms to Australian and international standards and guidance. The Group’s risk reporting and control mechanisms are designed to ensure strategic, operational, legal, financial, reputational and other risks are identified, assessed and appropriately managed.
The financial reporting and control mechanisms are reviewed during the year by management, the Audit and Risk Committee, the internal audit function and the external auditor.
The Group has policies in place to manage risk in the areas of Health and Safety, Environment and Equal Employment Opportunity.
Senior management and the Board regularly review the risk portfolio of the business and the effectiveness of the Group’s management of those risks.
During July 2014, the Company announced that by operation of its internal reporting mechanisms, the provision of benefits to a foreign public official that may violate its Anti‐Bribery and Anti‐Corruption Policy or applicable laws in Australia or in foreign jurisdictions were identified. The amount of the benefits provided to the foreign public official was not material to the Company. The Company self‐reported the matter to relevant authorities, including the Australian Federal Police, and the matter is being assessed and investigated. To date, there has been no action taken against the Company, consequently, the range of potential penalties, if any, cannot be reliable estimated. Should there be any prosecution, potential penalties if any are governed by laws in various jurisdictions including Criminal Code 1995 (Cth) in Australia and/or the UK Bribery Act. Regulatory environment
Australia
The Group’s Australian mining activities are in Western Australia and governed by Western Australian legislation, including the Mining Act 1978, the Mines Safety and Inspection Act 1994, Dangerous Goods Safety Act 2004 and other mining related and subsidiary legislation. The Mining Rehabilitation Fund Act 2012 took effect from 1 July 2013. The Mining Rehabilitation Fund replaces unconditional environmental performance bonds for companies operating under the Mining Act 1978.
The Group is subject to significant environmental regulation, including, inter alia, the Western Australian Environmental Protection Act 1986, Contaminated Sites Act 2003, Wildlife Conservation Act 1950, Aboriginal Heritage Act 1972 and the Commonwealth Environmental Protection and Biodiversity Conservation Act 1999, as well as safety compliance in respect of its mining and exploration activities.
The Group is registered pursuant to the National Greenhouse and Energy Reporting Act 2007 under which it is required to report annually its energy consumption and greenhouse gas emissions. St Barbara also reports to Government pursuant to both the Energy Efficiency Opportunities Act 2006 and the National Environmental Protection (National Pollutant Inventory) Measure (subsidiary legislation to the National Environmental Protection Measures (Implementation) Act 1998). The Group has established data collection systems and processes to meet these reporting obligations. The Group’s Australian operations are also required to comply with the Australian Federal Government’s Clean Energy Act 2011, effective from 1 July 2012.
For
per
sona
l use
onl
y

ST BARBARA LIMITED 30 JUNE 2015
DIRECTORS’ REPORT
Page 16
Papua New Guinea
The primary Papua New Guinea mining legislation is the Mining Act 1992, which governs the granting and cessation of mining rights. Under the Mining Act, all minerals existing on, in or below the surface of any land in Papua New Guinea, are the property of the State. The Mining Act establishes a regulatory regime for the exploration for, and development and production of, minerals and is administered by the Minerals Resources Authority. Environmental impact is governed by the Environment Act 2000, administered by the Department of Environment and Conservation. Information on Directors S J Colin Wise, LL.B, FAICD, FAusIMM Non‐Executive Chairman Appointed as Non‐Executive Chairman 20 July 2004 Resigned as Non‐Executive Chairman and Director 30 June 2015 Mr Wise is an experienced corporate lawyer, consultant and company director with significant expertise in the mining and exploration industry and resources, energy and corporate sectors. He has extensive practical experience in Australia and internationally with a wide range of corporate, operational and legal matters. He was Chairman of St Barbara from July 2004 to 30 June 2015, and is a Fellow of both the Australian Institute of Company Directors and the Australasian Institute of Mining and Metallurgy. He has been a member of the Advisory Board to the Dean of Medicine, Nursing and Health Sciences at Monash University and was a Non‐Executive Director for 5 years of Southern Health, the largest health care service in Victoria, Chair of its Quality Committee, and a member of the Audit Committee. Other current listed company directorships Nil Former listed company directorships in last 3 years Straits Resources Limited Special responsibilities Chairman of the Board Member of the Audit, Remuneration and Health, Safety, Environment and Community Committees Mr Wise is considered by the Board to have been an independent Director. Robert S (Bob) Vassie, B. Mineral Technology Hons (Mining), GAICD, MAUSIMM Managing Director and Chief Executive Officer Appointed as Managing Director & CEO 1 July 2014 Mr Vassie joined St Barbara as Managing Director and Chief Executive Officer on 1 July 2014. He is a mining engineer with 30 years international mining industry experience. Prior to joining St Barbara, Mr Vassie was the Managing Director and CEO at Inova Resources Limited (formerly Ivanhoe Australia Limited) and has 18 years’ experience in a range of senior management roles with Rio Tinto. He has particular experience in operations management, resource development strategy, mine planning, feasibility studies, business improvement, corporate restructuring and strategic procurement. Other listed public company directorships Nil Former listed company directorships in last 3 years Inova Resources Limited (formerly Ivanhoe Australia Limited) Special responsibilities Member of the Health, Safety, Environment and Community Committee
For
per
sona
l use
onl
y

ST BARBARA LIMITED 30 JUNE 2015
DIRECTORS’ REPORT
Page 17
Douglas W Bailey, BBus (Acc), CPA, ACIS Non‐Executive Director Appointed as a Director January 2006 Resigned as a Director 30 June 2015 Mr Bailey was the Chief Financial Officer of Woodside Petroleum Ltd between 2002 and 2004 and previously, was an Executive Director of Ashton Mining Limited from 1990 to 2000, including the last 3 years as Chief Executive Officer. He was also a Non‐Executive Director of Aurora Gold Ltd for the period 1993‐2000. Other current listed company directorships Tap Oil Limited Former listed company directorships in last 3 years Nil Special responsibilities Chairman of the Audit & Risk Committee Member of the Health, Safety, Environment and Community and Remuneration Committees Mr Bailey is considered by the Board to have been an independent Director. Tim Netscher, BSc (Eng) (Chemical), BCom, MBA, FIChE, CEng, MAICD Non‐Executive Director Appointed as a Director 17 February 2014, appointed as Chairman 1 July 2015 Mr Netscher was the Managing Director of Gindalbie Metals Limited from 2011 to 2013, and is currently the Non‐Executive Chairman of Deep Yellow Limited, a Non‐Executive Director of Gold Road Resources Limited, a Non‐Executive Director of Aquila Resources Limited, and a Non‐Executive Director of Western Areas Limited. A chemical engineer, he is an experienced international mining executive with extensive operational, project development, and transactional experience and expertise in senior executive management roles. Other current listed company directorships Deep Yellow Limited Gold Road Resources Limited Western Areas Limited Former listed company directorships in last 3 years Gindalbie Metals Limited Bullabulling Gold Limited Special responsibilities Chair of the Health, Safety, Environment and Community Committee Member of the Audit and Risk and Remuneration Committees Mr Netscher is considered by the Board to be an independent Director.
For
per
sona
l use
onl
y

ST BARBARA LIMITED 30 JUNE 2015
DIRECTORS’ REPORT
Page 18
Ines L Scotland B.Sc Non‐Executive Director Appointed as a Director 30 September 2013 Resigned as a Director 26 January 2015 Ms Scotland is an experienced director and senior executive in the resources sector, with particular expertise in building successful projects in developing countries. She was co‐founder in 2007 of Citadel Resource Group Limited. As Managing Director & CEO, she listed the Company on the ASX through an IPO and managed the successful development of the Jabel Sayid copper project in Saudi Arabia before the company was acquired by Equinox Minerals in late 2010. Other current listed company directorships Chair of MetalBank Limited Former listed company directorships in last 3 years Ivanhoe Australia Limited (most recently as interim Managing Director, previously Non‐Executive Director) Citadel Resource Group Limited Special responsibilities Chair of the Remuneration Committee Member of the Health, Safety, Environment and Community Committee Ms Scotland is considered by the Board to have been an independent Director. Kerry J Gleeson LLB (Hons), FAICD Non‐Executive Director Appointed as a Director 18 May 2015 Ms Gleeson has over 20 years extensive boardroom and senior management experience across Australia, UK and the US, in a variety of industries including mining, agriculture, chemicals, logistics and manufacturing. Ms Gleeson was admitted to practice as a lawyer of the Supreme Court of England and Wales in 1991 and in Victoria in 2001. She has significant expertise in major corporate finance and transactional matters, and in disciplined governance in Australian and international businesses. She was a member of the Group Executive at Incitec Pivot Limited for 10 years until late 2013, including as Company Secretary and General Counsel. Previously, she was a corporate finance and transactional partner in an English law firm, and also practiced as a senior lawyer at the Australian law firm, Ashurst. Ms Gleeson is currently a Non‐Executive Director of ASX listed McAleese Limited, and a member of its Audit, Business Risk and Compliance Committee. She is a Fellow of the Australian Institute of Company Directors. Other current listed company directorships McAleese Limited Former listed company directorships in last 3 years Nil Special responsibilities Chair of Remuneration Committee (from 1 July 2015) Member of the Audit & Risk and Health, Safety, Environment & Community Committees Ms Gleeson is considered by the Board to be an independent Director. F
or p
erso
nal u
se o
nly

ST BARBARA LIMITED 30 JUNE 2015
DIRECTORS’ REPORT
Page 19
David E J Moroney, BCom, FCA, FCPA, GAICD Non‐Executive Director Appointed as a Director 16 March 2015 Mr Moroney has strong skills in finance, strategic planning, governance, risk management and leadership, with more than 20 years’ experience in senior corporate finance roles, including 15 years in the mining industry, and extensive international work experience. Since 2013 he has been an independent non‐executive director of Geraldton Fishermen’s Co‐operative Ltd, (the southern hemisphere’s largest exporter of lobster) and chair of its Audit & Risk Management Committee, and since 2014, of WA Super, Western Australia’s largest public offer superannuation fund (and a member of the Compliance & Risk Management, and Investment Committees). In his executive career, Mr Moroney was the Chief Financial Officer of Australia’s largest grain exporter Co‐operative Bulk Handling Ltd (2009‐2014); TSX and LSE listed copper and base metals miner First Quantum Minerals Ltd (2007‐2009); chemicals and fertiliser producer Wesfarmers CSBP Ltd (2002‐2003); and Indonesian gold and silver miner Aurora Gold Ltd (1993‐1999). He was Executive General Manager/Deputy CFO of Australia’s then‐largest gold miner Newmont Australia Ltd (previously Normandy Mining Ltd) (1999‐2002), and a member of the Executive Management Team of conglomerate Wesfarmers Ltd (2003‐2006) in its corporate office. A commerce graduate from the University of Melbourne, he is a Fellow of the Chartered Accountants Australia & New Zealand, a Fellow of CPA Australia, and a Graduate of the Australian Institute of Company Directors. Other current listed company directorships Nil Former listed company directorships in last 3 years Nil Special responsibilities Chair of the Audit & Risk Committee Member of the Health, Safety, Environment & Community and Remuneration Committees Mr Moroney is considered by the Board to be an independent Director. Qualifications and experience of the Company secretary Rowan Cole, B.Comm, CA, CIA, MBA, Grad. Dip AGC, Dip Inv Rel Company Secretary Mr Cole joined St Barbara in 2010 as General Manager Corporate Services and was appointed as Deputy Company Secretary in 2012 and as Company Secretary in 2014. He has over 25 years’ experience across chartered accounting, retail banking, private and public companies. Mr Cole's experience includes external, internal and IT audit, risk management, customer service delivery, marketing, strategy formulation, execution and measurement, process and business improvement, financial and business reporting in senior roles including general manager, head of risk and compliance, chief audit executive and most recently prior to joining St Barbara as chief financial and risk officer of an ASX 300 company. F
or p
erso
nal u
se o
nly

ST BARBARA LIMITED 30 JUNE 2015
DIRECTORS’ REPORT
Page 20
Information on Executives Robert S (Bob) Vassie, B. Mineral Technology Hons (Mining), GAICD, MAUSIMM Managing Director and Chief Executive Officer Appointed as a Director 1 July 2014 Mr Vassie joined St Barbara as Managing Director and Chief Executive Officer in July 2014. He is a mining engineer with 30 years international mining industry experience. Prior to joining St Barbara, Mr Vassie was the Managing Director and CEO at Inova Resources Limited (formerly Ivanhoe Australia Limited) and has 18 years’ experience in a range of senior management roles with Rio Tinto. He has particular experience in operations management, resource development strategy, mine planning, feasibility studies, business improvement, corporate restructuring and strategic procurement. Garth Campbell‐Cowan, B.Comm, Dip‐Applied Finance & Investments, FCA Chief Financial Officer Mr Campbell‐Cowan is a Chartered Accountant with 30 years of experience in senior management and finance positions across a number of different industries. He was appointed to the position of Chief Financial Officer in September 2006 and is responsible for the Group’s Finance function, covering financial reporting and accounting, treasury, taxation, business analysis, internal audit, capital management, procurement and information technology. Prior to joining St Barbara, he was Director of Corporate Accounting at Telstra and has held senior leadership roles with WMC, Newcrest Mining and ANZ. Meetings of Directors
The number of meetings of Directors (including meetings of Committees of Directors), and the numbers of meetings attended by each of the Directors of the Company during the financial year was:
Board (Scheduled)
Board (Supplementary)
Audit & Risk Committee
Remuneration Committee
Health, Safety, Environment & Community Committee
A H A H A H A H A H
D Bailey 10 10 5 6 4 4 5 5 3 3 K Gleeson 2 2 1 1 1 1 2 2 1 1 D Moroney 4 4 2 2 1 1 2 2 1 1 T Netscher 10 10 6 6 4 4 3 3 3 3 I Scotland 2 5 3 6 ‐ ‐ 1 2 1 1 B Vassie 10 10 5 6 ‐ ‐ ‐ ‐ 3 3 C Wise 10 10 6 6 4 4 5 5 3 3
A = Number of meetings attended H = Number of meetings held during the time the Director held office or was a member of the committee during the year Directors’ Interests The relevant interest of each Director in the shares and rights over such instruments issued by the companies within the Group and other related bodies corporate as notified by the Directors to the ASX in accordance with S205G(1) of the Corporations Act 2001, as the date of this report is as follows:
Ordinary shares Rights over ordinary shares
K Gleeson ‐ ‐
D Moroney 100,000 ‐
T Netscher ‐ ‐
R Vassie 1,769,053 4,062,500
No Directors have an interest in options over shares issued by companies within the Group.
For
per
sona
l use
onl
y

ST BARBARA LIMITED 30 JUNE 2015
DIRECTORS’ REPORT
Page 21
Remuneration report (Audited)
Introduction
This Remuneration Report describes the remuneration structure that applied for the 2015 financial year. The Report provides details of remuneration paid for the 2015 financial year to Directors and the senior executives named in this report with the authority and responsibility for planning, directing and controlling the activities of the Group, directly or indirectly, collectively referred to as Key Management Personnel.
Overview of contents
1. Remuneration strategy
2. Key changes since 2014 Remuneration Report
3. Decision making authorities for remuneration
4. Remuneration structure
5. Group performance
6. Remuneration paid 2015
1. Remuneration Strategy
The Group’s remuneration strategy recognises that it needs to attract, reward and retain high calibre, high performing, and team orientated individuals capable of delivering the Group strategy. The remuneration policy and related employment policies and practices are aligned with this strategy.
The objectives of the Remuneration strategy for the 2015 financial year, consistent with the Group strategy, were to ensure that:
total remuneration for senior executives and each level of the workforce was market competitive
key employees were retained
total remuneration for senior executives and managers comprised an appropriate proportion of fixed remuneration and performance linked at risk remuneration
performance linked at risk remuneration encouraged and rewarded high performance aligned with value creation for shareholders, through an appropriate mix of short and long term incentives
the integrity of the remuneration review processes delivered fair and equitable outcomes
remuneration for Non‐Executive Directors preserved their independence by being in the form of fixed fees.
The remuneration strategy, policy and structure are directly linked to the development of strategies and budgets in the Group’s annual planning cycle shown in the timetable below.
Annual Planning Timetable
Month Strategy & Reporting Remuneration
October Annual strategy update
January Review STI & LTI design framework
February Half Year Financial Report
April Budget setting framework Set Remuneration review framework
July Measure STI outcomes and determine award
Measure LTI outcomes and action any vested entitlements
August Annual Financial Report Set STI targets for following financial year
October Annual Report
November Annual General Meeting Shareholder approval of LTI to be issued to MD&CEO
For
per
sona
l use
onl
y

ST BARBARA LIMITED 30 JUNE 2015
DIRECTORS’ REPORT
Remuneration report (Audited) ‐ Continued
Page 22
2. Key changes since 2014 Remuneration Report
Non‐Executive Director Remuneration
Director fees were last increased on 1 July 2012 and were reduced by 10% from 1 March 2014. The quantum of Directors fees has been constant since 1 March 2014, and the Board has resolved not to change Director fees for FY16.
The number of Non‐Executive Directors as at the time of release of the Remuneration Report has reduced as follows:
2013 Remuneration Report 5
2014 Remuneration Report 4
2015 Remuneration Report 3
Significant Board renewal has occurred in the last year. Of the five Directors in office at 27 August 2014 when the 2014 Remuneration Report was released, only two remain in office at the date of this report.
Directors in office at date of 2014 Remuneration Report
Directors in office at date of 2015 Remuneration Report
S J C Wise
R S Vassie
D W Bailey
T C Netscher
I L Scotland
Non‐Executive Chairman
Managing Director & CEO
Non‐Executive Director
Non‐Executive Director
Non‐Executive Director
T C Netscher
R S Vassie
K J Gleeson
D E J Moroney
Non‐Executive Chairman
Managing Director & CEO
Non‐Executive Director
Non‐Executive Director
Senior Executive Remuneration
The Managing Director and CEO, Mr Bob Vassie, commenced with the Company on 1 July 2014 on a fixed remuneration of approximately 20% less than his predecessor. The quantum of the allocation of performance rights to the Managing Director and CEO under the FY15 LTI was reduced by 25% from the prior year.
In addition, there was no increase to senior executive remuneration during the 2015 financial year.
The number of senior executives as at the time of release of the Remuneration Report has reduced as follows:
2013 Remuneration Report 6 (MD & CEO, CFO, 4 Executive General Managers)
2014 Remuneration Report 3 (MD & CEO, CFO, 1 Executive General Manager)
2015 Remuneration Report 2 (MD & CEO, CFO)
3. Decision making authorities for remuneration
Remuneration strategy and policies are approved by the Board. They are aligned with, and underpin, the Group strategy. On behalf of the Board, the Remuneration Committee oversees and reviews the effectiveness of the remuneration strategy, policies and practices to ensure that the interests of the Group, shareholders and employees are properly taken into account. The charter for the Remuneration Committee is approved by the Board and is available on the Group’s website at www.stbarbara.com.au.
The Remuneration Committee is responsible for making recommendations to the Board on all aspects of remuneration arrangements for Non‐Executive Directors, the Managing Director and CEO, and the senior executives named in this report with the authority and responsibility for planning, directing and controlling the activities of the Group, directly or indirectly, collectively referred to as Key Management Personnel.
In addition, the Remuneration Committee oversees and reviews proposed levels of annual organisation remuneration increases and key employee related policies for the Group. It also receives reports on organisation capability and effectiveness, skills, training and development and succession planning for key roles.
For
per
sona
l use
onl
y

ST BARBARA LIMITED 30 JUNE 2015
DIRECTORS’ REPORT
Remuneration report (Audited) ‐ Continued
Page 23
The members of the Remuneration Committee are all independent, Non‐Executive Directors and as at the date of this report comprised:
K Gleeson ‐ Chair of Committee, Non‐Executive Director
D Moroney ‐ Non‐Executive Director
T Netscher ‐ Non‐Executive Chairman
During the 2015 financial year, Ms Ines Scotland was Chair of the Remuneration Committee until her resignation as a Director on 26 January 2015. Mr Colin Wise was then Chair of the Remuneration Committee until 23 February 2015 and Mr Tim Netscher was then Chair of the Remuneration Committee until his appointment as Non‐Executive Chairman on 1 July 2015. Mr Moroney was appointed to the Remuneration Committee on 16 March 2015. Ms Kerry Gleeson was appointed to the Remuneration Committee on 18 May 2015, and appointed as Chair of the Remuneration Committee on 1 July 2015.
In forming remuneration recommendations, the Remuneration Committee obtains and considers each year industry specific independent data and professional advice as appropriate. All reports and professional advice relating to the Managing Director and CEO’s remuneration are commissioned and received directly by the Committee. The Committee reviews all other contracts with remuneration consultants and directly receives the reports of those consultants.
The Remuneration Committee has delegated authority to the Managing Director and CEO for approving remuneration recommendations for employees other than Key Management Personnel, within the parameters of approved Group wide remuneration levels and structures.
4. Remuneration structure
(a) Non‐Executive Directors
Non‐Executive Directors’ fees are reviewed annually by the Board to ensure fees are appropriate to reflect the responsibilities and time commitments required of Non‐Executive Directors and to ensure that the Group continues to attract and retain Non‐Executive Directors of a high calibre. The Board seeks the advice of, and is guided by, specialist independent remuneration consultants in this process. Currently Non‐Executive Directors’ fees are compared with those of comparatively sized companies.
In order to maintain their independence and impartiality, the fees paid to Non‐Executive Directors are not linked to the performance of the Group. Non‐Executive Directors are not directly involved in the day to day management of the Group.
Superannuation contributions, in accordance with legislation, are included as part of each Director’s total remuneration. Directors may elect to increase the proportion of their remuneration taken as superannuation subject to legislative limits. Non‐Executive Directors are not entitled to retirement benefits, bonuses or equity based incentives.
The maximum aggregate amount payable to all Non‐Executive Directors is approved by shareholders. This is currently $1,200,000 per annum in aggregate, approved by shareholders at the Annual General Meeting in November 2012. Within that amount, the basis and level of fees paid to Non‐Executive Directors is set by the Board, and reported to shareholders each year, as detailed in Section 6 of this report.
(b) Senior Executive Remuneration
The Group operates a performance based remuneration system through which the remuneration of senior executives is linked to the financial and non‐financial performance of the Group, including its share price.
Under the remuneration system the amount of performance linked at risk remuneration relative to an employee’s total remuneration increases in line with the seniority of the role of that employee. This reinforces the linkage between personal and Group performance and achievement of the Group’s business strategy and creation of shareholder wealth.
The reward structures for the Group’s senior executives are strongly aligned with shareholders’ interests by:
Organisational Capability and Scenario Planning
Key Workforce Policies‐ equal opportunity‐ diversity
Remuneration Design‐ fixed vs variable
Remuneration levels for Key Management Personnel
Remuneration CommitteeOversight and design
For
per
sona
l use
onl
y
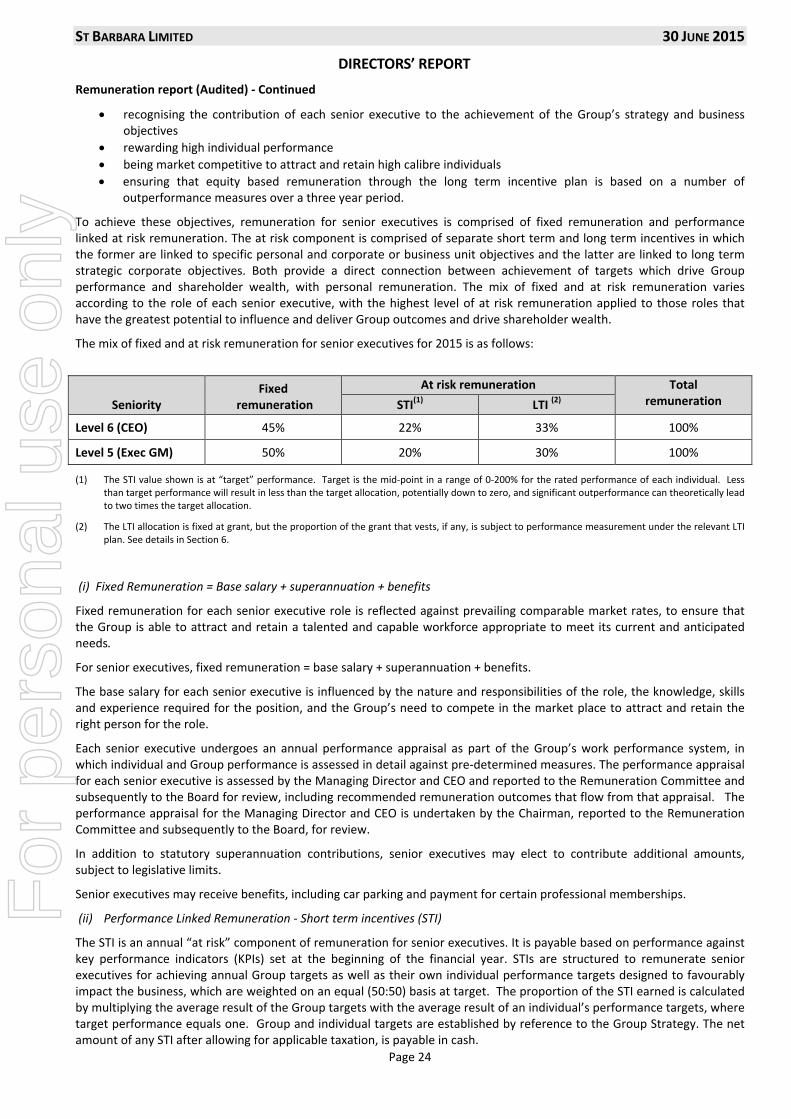
ST BARBARA LIMITED 30 JUNE 2015
DIRECTORS’ REPORT
Remuneration report (Audited) ‐ Continued
Page 24
recognising the contribution of each senior executive to the achievement of the Group’s strategy and business objectives
rewarding high individual performance
being market competitive to attract and retain high calibre individuals
ensuring that equity based remuneration through the long term incentive plan is based on a number of outperformance measures over a three year period.
To achieve these objectives, remuneration for senior executives is comprised of fixed remuneration and performance linked at risk remuneration. The at risk component is comprised of separate short term and long term incentives in which the former are linked to specific personal and corporate or business unit objectives and the latter are linked to long term strategic corporate objectives. Both provide a direct connection between achievement of targets which drive Group performance and shareholder wealth, with personal remuneration. The mix of fixed and at risk remuneration varies according to the role of each senior executive, with the highest level of at risk remuneration applied to those roles that have the greatest potential to influence and deliver Group outcomes and drive shareholder wealth.
The mix of fixed and at risk remuneration for senior executives for 2015 is as follows:
Seniority Fixed
remuneration
At risk remuneration Total remuneration STI
(1) LTI
(2)
Level 6 (CEO) 45% 22% 33% 100%
Level 5 (Exec GM) 50% 20% 30% 100%
(1) The STI value shown is at “target” performance. Target is the mid‐point in a range of 0‐200% for the rated performance of each individual. Less than target performance will result in less than the target allocation, potentially down to zero, and significant outperformance can theoretically lead to two times the target allocation.
(2) The LTI allocation is fixed at grant, but the proportion of the grant that vests, if any, is subject to performance measurement under the relevant LTI plan. See details in Section 6.
(i) Fixed Remuneration = Base salary + superannuation + benefits
Fixed remuneration for each senior executive role is reflected against prevailing comparable market rates, to ensure that the Group is able to attract and retain a talented and capable workforce appropriate to meet its current and anticipated needs.
For senior executives, fixed remuneration = base salary + superannuation + benefits.
The base salary for each senior executive is influenced by the nature and responsibilities of the role, the knowledge, skills and experience required for the position, and the Group’s need to compete in the market place to attract and retain the right person for the role.
Each senior executive undergoes an annual performance appraisal as part of the Group’s work performance system, in which individual and Group performance is assessed in detail against pre‐determined measures. The performance appraisal for each senior executive is assessed by the Managing Director and CEO and reported to the Remuneration Committee and subsequently to the Board for review, including recommended remuneration outcomes that flow from that appraisal. The performance appraisal for the Managing Director and CEO is undertaken by the Chairman, reported to the Remuneration Committee and subsequently to the Board, for review.
In addition to statutory superannuation contributions, senior executives may elect to contribute additional amounts, subject to legislative limits.
Senior executives may receive benefits, including car parking and payment for certain professional memberships.
(ii) Performance Linked Remuneration ‐ Short term incentives (STI)
The STI is an annual “at risk” component of remuneration for senior executives. It is payable based on performance against key performance indicators (KPIs) set at the beginning of the financial year. STIs are structured to remunerate senior executives for achieving annual Group targets as well as their own individual performance targets designed to favourably impact the business, which are weighted on an equal (50:50) basis at target. The proportion of the STI earned is calculated by multiplying the average result of the Group targets with the average result of an individual’s performance targets, where target performance equals one. Group and individual targets are established by reference to the Group Strategy. The net amount of any STI after allowing for applicable taxation, is payable in cash.
For
per
sona
l use
onl
y

ST BARBARA LIMITED 30 JUNE 2015
DIRECTORS’ REPORT
Remuneration report (Audited) ‐ Continued
Page 25
For 2015, the calculation of STI earned can be summarised as follows:
STI earned = STI value at risk x (average result of Group STI targets x average result of Individual STI targets), where target performance = 1.
For each KPI there are defined “threshold”, “target” and “stretch” measures which are capable of objective assessment.
Threshold performance typically requires achievement of the full year budget for quantifiable measures such as safety, profitability, cash generation, as well as the achievement of criteria set as near term goals linked to the annual strategy review.
Target performance represents challenging but achievable levels of performance beyond achievement of budget measures. For example, the 2015 financial year STI target for gold production for Leonora was set at 104% of the corresponding midpoint of guidance.
Stretch performance requires significant performance above and beyond normal expectations and if achieved is anticipated to result in a substantial improvement in key strategic outcomes, operational or financial results, and/or the business performance of the Group.
The Remuneration Committee is responsible for recommending to the Board senior executive STIs and then later assessing the extent to which the Group STI measures and the individual KPIs of the senior executives have been achieved, and the amount to be paid to each senior executive. To assist in making this assessment, the Committee receives detailed reports and presentations on the performance of the business from the Managing Director & CEO and independent remuneration consultants as required. The Board retains overall discretion on whether an STI should be paid in any given year.
Details of the FY15 STI are set out in Section 6 of this report.
(iii) Performance Linked Remuneration ‐ Long term incentives (LTI)
LTIs are structured to reward senior executives for the long term performance of the Group relative to its peers. For 2015, LTIs were granted in the form of Performance Rights according to the St Barbara Performance Rights Plan which was approved at the 2010 Annual General Meeting.
In considering the LTI awards for the 2015 financial year (“FY15 Performance Rights”), the Board considered the trend towards deferring a portion of the award. Unlike other industries where matching revenues and expenses may have long lead times, the gold industry is such that gold produced is sold at arm’s length within a matter of days from production. Revenue and expenses are then recorded. The industry characteristics supporting a look back testing of prior year performance awards do not carry, in the opinion of the Board, the same weight in our industry.
Vesting conditions of each tranche of Performance Rights issued are approved by the Board and set out in the relevant Notice of Annual General Meeting. The vesting conditions of the FY15 Performance Rights comprised measures for:
total shareholder return
return on capital employed in excess of the weighted average cost of capital, as a measure of capital efficiency and generation of shareholder value.
Performance rights expire on the earliest of their expiry date, immediately upon the effective resignation date of the relevant senior executive or twelve months from the date of retirement or retrenchment.
Performance rights granted under the plan carry no dividend or voting rights. On vesting each performance right is convertible into one ordinary share.
Details of the FY15 Performance Rights are set out in Section 6 of this report.
(iv) Summaries of service agreements for senior executives
Remuneration and other terms of employment for the Managing Director and CEO and the senior executives are formalised in service agreements. These agreements provide, where applicable, for the provision of performance related cash payments, other benefits including allowances, and participation in the St Barbara Limited Performance Rights Plan. Other major provisions of the agreements relating to remuneration are set out below.
All contracts with senior executives may be terminated early by either party giving the required notice and subject to termination payments as detailed below.
All service agreements with senior executives, including with the Managing Director and CEO comply with the provisions of Part 2 D.2, Division 2 of the Corporations Act.
For
per
sona
l use
onl
y
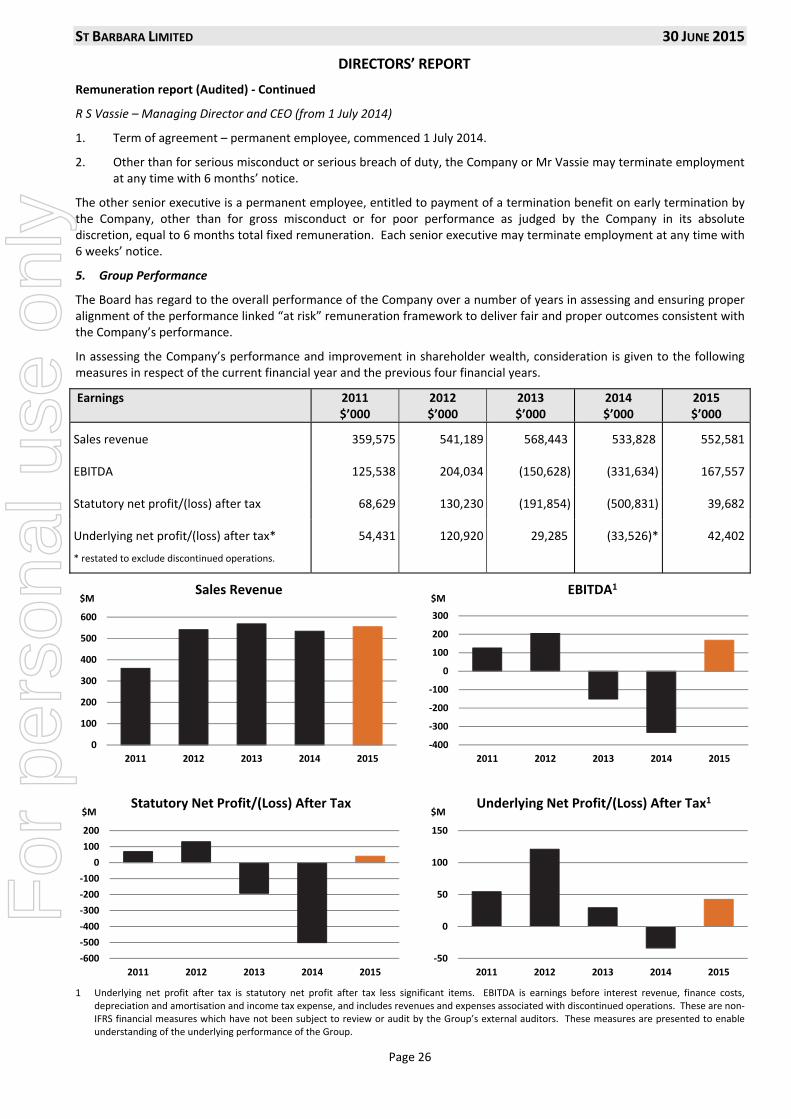
ST BARBARA LIMITED 30 JUNE 2015
DIRECTORS’ REPORT
Remuneration report (Audited) ‐ Continued
Page 26
0
100
200
300
400
500
600
2011 2012 2013 2014 2015
$MSales Revenue
‐400
‐300
‐200
‐100
0
100
200
300
2011 2012 2013 2014 2015
$MEBITDA1
‐600
‐500
‐400
‐300
‐200
‐100
0
100
200
2011 2012 2013 2014 2015
$MStatutory Net Profit/(Loss) After Tax
‐50
0
50
100
150
2011 2012 2013 2014 2015
$MUnderlying Net Profit/(Loss) After Tax1
R S Vassie – Managing Director and CEO (from 1 July 2014)
1. Term of agreement – permanent employee, commenced 1 July 2014.
2. Other than for serious misconduct or serious breach of duty, the Company or Mr Vassie may terminate employment at any time with 6 months’ notice.
The other senior executive is a permanent employee, entitled to payment of a termination benefit on early termination by the Company, other than for gross misconduct or for poor performance as judged by the Company in its absolute discretion, equal to 6 months total fixed remuneration. Each senior executive may terminate employment at any time with 6 weeks’ notice.
5. Group Performance
The Board has regard to the overall performance of the Company over a number of years in assessing and ensuring proper alignment of the performance linked “at risk” remuneration framework to deliver fair and proper outcomes consistent with the Company’s performance.
In assessing the Company’s performance and improvement in shareholder wealth, consideration is given to the following measures in respect of the current financial year and the previous four financial years.
Earnings
2011 $’000
2012 $’000
2013 $’000
2014 $’000
2015 $’000
Sales revenue 359,575 541,189 568,443 533,828 552,581
EBITDA 125,538 204,034 (150,628) (331,634) 167,557
Statutory net profit/(loss) after tax
68,629 130,230 (191,854) (500,831) 39,682
Underlying net profit/(loss) after tax*
* restated to exclude discontinued operations.
54,431 120,920 29,285 (33,526)* 42,402
1 Underlying net profit after tax is statutory net profit after tax less significant items. EBITDA is earnings before interest revenue, finance costs, depreciation and amortisation and income tax expense, and includes revenues and expenses associated with discontinued operations. These are non‐IFRS financial measures which have not been subject to review or audit by the Group’s external auditors. These measures are presented to enable understanding of the underlying performance of the Group.
For
per
sona
l use
onl
y

ST BARBARA LIMITED 30 JUNE 2015
DIRECTORS’ REPORT
Remuneration report (Audited) ‐ Continued
Page 27
The table below provides the share price performance of the Company’s shares in the 2015 financial year and the previous four financial years.
Share price history 2011 2012 2013 2014 2015
Period end share price ($ per share) 1.96 1.77 0.45 0.115 0.57
Average share price for the year ($ per share) 2.16 2.12 1.35 0.38 0.21
During the 2015 financial year, the Company’s daily closing share price ranged between $0.072 to $0.585 per share (2014: $0.115 to $0.93 per share).
The Company’s primary measure of safety performance is the rolling 12‐month average of the Total Recordable Injury Frequency Rate. The FY15 result compares favourably with published mining industry TRIFR information.
6. Remuneration paid 2015
Details of the remuneration of Key Management Personnel of the Company during the year ended 30 June 2015 are set out in the following tables.
0
100
200
300
400
2011 2012 2013 2014 2015
kozGold Production
0
5
10
15
2011 2012 2013 2014 2015
Total Recordable Injury Frequency Ratemeasured on a 12 month rolling basis
For
per
sona
l use
onl
y

ST BARBARA LIM
ITED
30 JUNE 2015
DIRECTO
RS’ REPORT
Remuneration report (Audited) ‐ Continued
Page 28
(1) For curren
t em
ployees, the am
ount represents long service leave and annual leave en
titlem
ents.
(2) The value of perform
ance rights disclosed as remuneration is the portion of the fair value of the perform
ance
rights recognised
in the reporting period
(3) For
executive Key Managem
ent
Personnel, non‐m
onetary
ben
efits
comprise car
parking, professional
mem
berships and living aw
ay from home travel expen
ses.
(4) Rep
resents car parking, m
obile phone, and other administrative ben
efits
(5) Mrs Gleeson appointed as a Director on 18 M
ay 2015
(6) Mr Moroney appointed as a Director on 16 M
arch 2015
(7) Ms Scotland resigned
as a Director 26 January 2015. Ms Scotland has directed for her fees to be paid to
nominated
charities
(8) Mr Bailey resigned
as a Director on 30 June 2015
(9)
Mr Wise resigned
as Non‐Executive Chairm
an on 30 June 2015
(10) Mr Netscher appointed as Non‐Executive Chairm
an 1 July 2015
(11) Mr Ken
ned
y’s role w
as m
ade redundant on 28 M
arch 2014 and he ceased
employm
ent 30 Sep
tember
2014.
(12) Ms Romeyn’s role as Executive Gen
eral M
anager Peo
ple and Business Services was m
ade red
undant on
28 November 2014.
(13) Mr Vassie appointed as MD & CEO
on 1 July 2014
(14) 833,333 shares issued
to the Managing Director and CEO
on 8 Decem
ber 2014 (AGM resolution 4)
(15) In addition to the leave expen
se accrued
in the year, R.Ken
ned
y and K.Romeyns’ outstanding leave
balances of $134,164 and $97,712 respectively were paid on termination
2015
Short‐term ben
efits
Post‐ em
ploym
ent ben
efits
Long‐term
ben
efits
Nam
e Cash
salary & fees
STI
paymen
t
Non‐
monetary
ben
efits(3)
Other
Super‐
annuation
Leave(
1)
Share‐based
paymen
ts(2)
Term
ination
paymen
ts
Total
Proportion of
total
perform
ance
Value of
share based
paymen
ts as
$
$
$
$
$
$
$
$
$
related
% of total
Non‐Executive Directors
S J C W
ise (Chairm
an)(9)
204,417
‐ 24,946(4)
‐ 18,783
‐ ‐
‐ 248,146
‐ ‐
D W
Bailey(8)
106,348
‐ ‐
‐ 10,103
‐ ‐
‐ 116,451
‐ ‐
K J Gleeson (5
) 12,478
‐ ‐
‐ 1,185
‐ ‐
‐ 13,663
‐ ‐
D E J M
oroney (6
) 28,177
‐ ‐
‐ 2,677
‐ ‐
‐ 30,854
‐ ‐
T C Netscher (1
0)
109,298
‐ ‐
‐ 10,383
‐ ‐
‐ 119,681
‐ ‐
I L Scotland (7
) 60,411
‐ ‐
‐ 5,739
‐ ‐
‐ 66,150
‐ ‐
Total N
on‐Executive
Directors
521,129
‐ 24,946
‐ 48,870
‐ ‐
‐ 594,945
Executive Director
R S Vassie (1
3)
631,217
447,200
64,303
100,000(14)
18,783
52,558
41,717
‐ 1,355,778
33.0%
10.5%
Senior Executives
G Cam
pbell‐Cowan
468,922
234,879
5,417
‐ 18,783
43,493
41,908
‐ 813,402
28.9%
5.2%
R Ken
ned
y(11)
92,081
‐ ‐
‐ 4,696
11,079(15)
‐ 236,052
343,908
‐ ‐
K Romeyn(12)
144,035
‐ ‐
‐ 9,392
7,083(15)
‐ 220,175
380,685
‐ ‐
Total Senior Executives
1,336,255
682,079
69,720
100,000
51,654
114,213
83,625
456,227
2,893,773
For
per
sona
l use
onl
y
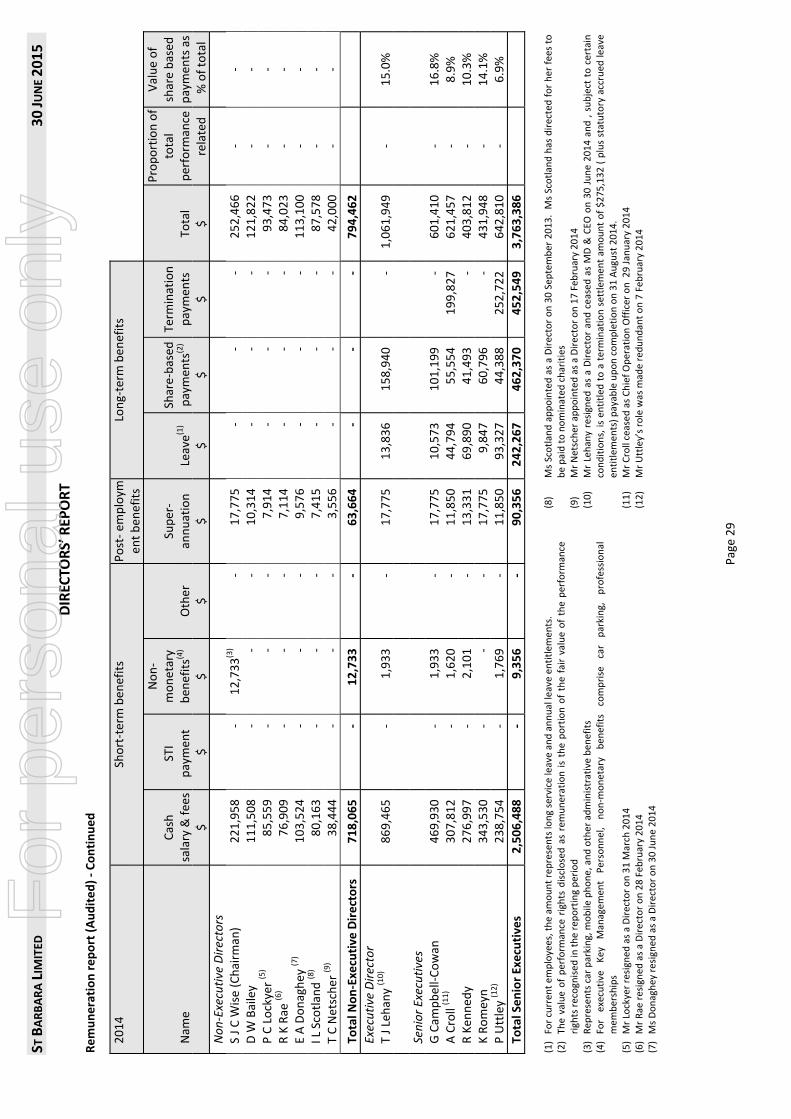
ST BARBARA LIM
ITED
30 JUNE 2015
DIRECTO
RS’ REPORT
Remuneration report (Audited) ‐ Continued
Page 29
(1) For curren
t em
ployees, the am
ount represents long service leave and annual leave en
titlem
ents.
(2) The value of perform
ance rights disclosed as remuneration is the portion of the fair value of the perform
ance
rights recognised
in the reporting period
(3) Rep
resents car parking, m
obile phone, and other administrative ben
efits
(4) For
executive Key Managem
ent
Personnel, non‐m
onetary
ben
efits
comprise car
parking, professional
mem
berships
(5) M
r Lockyer resigned
as a Director on 31 M
arch 2014
(6) Mr Rae
resigned
as a Director on 28 Feb
ruary 2014
(7) Ms Donaghey resigned
as a Director on 30 June 2014
(8)
Ms Scotland appointed as a Director on 30 Sep
tember 2013. M
s Scotland has directed for her fees to
be paid to nominated
charities
(9)
Mr Netscher appointed as a Director on 17 Feb
ruary 2014
(10)
Mr Lehany resigned
as a Director and ceased as MD &
CEO
on 30 June 2014 and , subject to certain
conditions, is en
titled
to a termination settlem
ent am
ount of $275,132 ( plus statutory accrued
leave
entitlem
ents) payable upon completion on 31 August 2014.
(11)
Mr Croll ceased
as Chief Operation Officer on 29 January 2014
(12)
Mr Uttley’s role was m
ade redundant on 7 Feb
ruary 2014
2014
Short‐term ben
efits
Post‐ em
ploym
ent ben
efits
Long‐term
ben
efits
Nam
e Cash
salary & fees
STI
paymen
t
Non‐
monetary
ben
efits(4)
Other
Super‐
annuation
Leave(
1)
Share‐based
paymen
ts(2)
Term
ination
paymen
ts
Total
Proportion of
total
perform
ance
Value of
share based
paymen
ts as
$
$
$
$
$
$
$
$
$
related
% of total
Non‐Executive Directors
S J C W
ise (Chairm
an)
221,958
‐ 12,733(3)
‐ 17,775
‐ ‐
‐ 252,466
‐ ‐
D W
Bailey
111,508
‐ ‐
‐ 10,314
‐ ‐
‐ 121,822
‐ ‐
P C Lockyer (5)
85,559
‐ ‐
‐ 7,914
‐ ‐
‐ 93,473
‐ ‐
R K Rae
(6)
76,909
‐ ‐
‐ 7,114
‐ ‐
‐ 84,023
‐ ‐
E A Donaghey (7
) 103,524
‐ ‐
‐ 9,576
‐ ‐
‐ 113,100
‐ ‐
I L Scotland (8
) 80,163
‐ ‐
‐ 7,415
‐ ‐
‐ 87,578
‐ ‐
T C Netscher (9
) 38,444
‐ ‐
‐ 3,556
‐ ‐
‐ 42,000
‐ ‐
Total N
on‐Executive
Directors
718,065
‐ 12,733
‐ 63,664
‐ ‐
‐ 794,462
Executive Director
T J Lehany
(10)
869,465
‐ 1,933
‐ 17,775
13,836
158,940
‐ 1,061,949
‐ 15.0%
Senior Executives
G Cam
pbell‐Cowan
469,930
‐ 1,933
‐ 17,775
10,573
101,199
‐ 601,410
‐ 16.8%
A Croll
(11)
307,812
‐ 1,620
‐ 11,850
44,794
55,554
199,827
621,457
‐ 8.9%
R Ken
ned
y 276,997
‐ 2,101
‐ 13,331
69,890
41,493
‐ 403,812
‐ 10.3%
K Romeyn
343,530
‐ ‐
‐ 17,775
9,847
60,796
‐ 431,948
‐ 14.1%
P Uttley
(12)
238,754
‐ 1,769
‐ 11,850
93,327
44,388
252,722
642,810
‐ 6.9%
Total Senior Executives
2,506,488
‐ 9,356
‐ 90,356
242,267
462,370
452,549
3,763,386
For
per
sona
l use
onl
y

ST BARBARA LIMITED 30 JUNE 2015
DIRECTORS’ REPORT Remuneration Report (Audited) ‐ Continued
Page 30
(a) Non‐Executive Directors Fees
Director fees were last increased effective 1 July 2012. Non‐Executive Director fees for the 2015 financial year were determined, both as to their composition (for base fees and committee work) and overall level, based on information from Aon Hewitt McDonald.
As part of Group wide cash management measures, Non‐Executive Directors fees were reduced by 10% effective from 1 March 2014. The increase in statutory superannuation from 1 July 2014 was absorbed within the existing level of Directors fees.
Directors resolved not to increase individual Director fees for financial year 2016. Director fees comprise:
Director fees of $90,000
an allowance for chairing a Board Committee of $15,750
a fee for serving as a member of a Board Committee of $7,650
Chairman’s fee of $223,200 (inclusive of all Board Committee commitments). The Chairman’s fee was determined independently, based on roles and responsibilities in the external market for companies comparable with St Barbara Limited. The Chairman was not present at any discussions relating to the determination of his own remuneration.
(b) Senior Executive Remuneration
(i) Fixed Remuneration ‐ Base salary
In considering remuneration for senior executives for the 2015 financial year, the Remuneration Committee considered reports from Aon Hewitt McDonald, as well as industry trend data and other relevant remuneration information. There was no increase in fixed remuneration for senior executives in the 2015 financial year.
(ii) Performance Linked Remuneration Five Year History
Performance Linked Remuneration
2011
2012
2013
2014
2015
% of maximum potential STI earned 14% 92% 40% 0% 66%
% of maximum potential LTI earned 0% 0% 0% 0% 0%
(ii) Performance Linked Remuneration ‐ Short term incentives (STI)
The Board has discretion whether to pay an STI in any given year, irrespective of whether Company and Individual STI targets have been achieved. In FY14 the Board applied its discretion not to award an STI to senior executives.
The Company STI target measures for the 2015 financial year were equally weighted and comprised:
STI Target Weighting Result % of Target achieved
(a) Achieve Total Recordable Injury Frequency Rate of 4.5
33% TRIFR of 5.0 achieved, within target range
83%
(b) Achieve gold production from Leonora of 266,000 ounces
33% 297,814 ounces produced, above upper threshold of target range
125%
(c) Achieve gold production from Simberi of 91,000 ounces
33% 79,568 ounces produced, at lower threshold of target range
50%
(d) Discretionary factor determined by the Board, designed to take into account unexpected events and achievements during the year
‐ Discretion not applied n/a
Overall Company Performance 86%
For
per
sona
l use
onl
y

ST BARBARA LIMITED 30 JUNE 2015
DIRECTORS’ REPORT Remuneration Report (Audited) ‐ Continued
Page 31
Individual performance measures varied according to the individual senior executive’s responsibilities, and for the 2015 financial year reflected a range of achievements aligned with the Company strategy. These included measures relating to improving safety, specific integration activities, increasing production volumes and lowering production costs, achieving exploration discoveries and implementing business improvement systems. There was also provision for a discretionary factor for individual performance designed to take into account unexpected events and achievements during the year.
The table below describes the Short Term Incentives available to, and achieved by, executive Key Management Personnel during the year. Amounts shown as “Actual STI” represent the amounts accrued in relation to the 2015 financial year, based on achievement of the specified performance criteria. No additional amounts vest in future years in respect of the STI scheme for the 2015 financial year.
2015 Maximum potential STI Actual STI included in
remuneration
% of maximum ‘Target’ STI earned
% of maximum potential total STI earned
% of maximum potential total STI foregone
Target $
Stretch(1)
$ $
R S Vassie 325,000 650,000 447,200 138% 69% 31% G Campbell‐Cowan 195,082 390,164 234,879 120% 60% 40%
(1) Inclusive of STI “Target”
Performance Linked Remuneration ‐ Long term incentives (LTI)
FY 13 Performance Rights ended 30 June 2015
The vesting period for the FY13 Performance Rights ended on 30 June 2015. The criteria for the FY13 Performance Rights were published in the Notice of 2012 Annual General Meeting, and comprised of three equally weighted performance measures over the 3 year period from 1 July 2012 to 30 June 2015 being:
Relative Total Shareholder Return
Increase in Ore Reserves
Return on Capital Employed.
The comparator group of companies for the FY13 Performance Rights comprises:
Company
Kingsgate Consolidated Limited Kingsrose Mining Limited
Ramelius Resources Limited Medusa Mining Limited
CGA Mining Limited Evolution Mining Limited
Saracen Mineral Holdings Limited Regis Resources Limited
Silver Lake Resources Limited OceanaGold Corporation
Northern Star Resources Ltd Tanami Gold NL
Focus Minerals Ltd
The result of the Relative TSR of the FY13 Performance Rights for the period 1 July 2012 to 30 June 2015 was:
Relative TSR Performance Percentage of Performance Rights to vest
Result
Below 50th percentile 0%
St Barbara ranked at the 46th percentile for the period, below the 50th percentile RTSR threshold
50th percentile 50%
Between 50th & 75
th percentiles Pro‐rata between 50% & 100%
75th percentile and above 100%
For
per
sona
l use
onl
y

ST BARBARA LIMITED 30 JUNE 2015
DIRECTORS’ REPORT Remuneration Report (Audited) ‐ Continued
Page 32
Increase in Ore Reserves (net of production) Percentage of Performance Rights to vest
Result
Negative growth 0% St Barbara reported negative growth in Ore Reserves for the period, below the ‘depletion replaced’ threshold
Depletion replaced 50%
20% increase 100%
ROCE Percentage of Performance Rights to vest
Result
Less than or equal to the average annual weighted average cost of capital (WACC) over the three year period commencing on 30 June 2012
0%
St Barbara achieved negative ROCE for the period, below the ‘WACC +5%’ threshold WACC (calculated as above) + 5% 50%
WACC (calculated as above) + 10% 100%
None of the remaining FY13 Performance Rights granted in respect of the FY13 year vested as at 30 June 2015, as they did not meet the minimum performance criteria.
Performance Rights granted as compensation in 2015.
FY15 Performance Rights
Performance rights issued in 2015 (‘FY15 Performance Rights‘) were granted under the St Barbara Limited Performance Rights Plan approved at the 2010 Annual General Meeting, and details of the performance conditions were set out in the Notice of 2014 Annual General Meeting. Performance rights issued to Mr Vassie, Managing Director & CEO, were also approved by shareholders at the 2014 Annual General Meeting.
Key Features of FY15 Performance Rights
Vesting conditions Performance conditions for the three year period commencing 1 July 2014 to 30 June 2017 as set out below, relating to:
Relative Total Shareholder Returns (67% weighting); and
Return on capital employed in excess of the weighted average cost of capital (33% weighting).
Other conditions Include continuing employment Issue price 10 day VWAP at start, 30 June 2014, $0.12 Vesting date 30 June 2017
Details of FY15 Performance Rights
The vesting of performance rights granted in respect of the FY15 Performance Rights is subject to continuing employment as at the vesting date of 30 June 2017, and satisfying performance conditions measured over a three year vesting period from 1 July 2014 to 30 June 2017 as set out below.
(i) Performance rights pricing
The issue price of the performance rights is based on the 10 day volume weighted average price (VWAP) on the ASX of the Company’s share price up to, and including, the last business day of the financial period immediately preceding the period that the performance rights relate to.
FY15 Performance Rights are priced at $0.12 per right, based on the 10 day VWAP up to and including 30 June 2014.
(ii) Performance conditions
The performance conditions for FY14 Performance Rights will be measured over a three year vesting period ending on 30 June 2017. Vesting conditions include continuing employment as at the vesting date of 30 June 2017 and satisfying conditions relating to:
For
per
sona
l use
onl
y

ST BARBARA LIMITED 30 JUNE 2015
DIRECTORS’ REPORT Remuneration Report (Audited) ‐ Continued
Page 33
Relative Total Shareholder Returns (67% weighting); and
Return on Capital Employed in excess of the weighted average cost of capital (33% weighting).
(iii) Percentage of relevant total fixed remuneration offered as LTIs for the 2015 financial year
Managing Director and Chief Executive Officer 75%
Executive General Managers 60%
General Managers 45%
The Board has the discretion to vary the relevant percentage each year, having regard to external advice and / or relevant market benchmarks.
(iv) An example of how performance rights are calculated for the 2015 financial year (assuming the maximum award level) is set out below:
Executive Level 5 Total Fixed Remuneration (TFR) $400,000 (for illustration only) LTI award value 60% of TFR $240,000 (i.e. 60% of TFR) Performance rights issue price (10 day VWAP) $0.12 Performance rights to be granted ($240,000 ÷ $0.12) 2,000,000
(v) Relative TSR
The Relative Total Shareholder Return (Relative TSR) is measured against a defined peer group of companies which the Board considers compete with the Company for the same investment capital, both in Australia and overseas, and which by the nature of their business are influenced by commodity prices and other external factors similar to those that impact on the TSR performance of the Company.
The comparator group of companies for FY15 Performance Rights comprises:
Company
Kingsgate Consolidated Limited Kingsrose Mining Limited
Ramelius Resources Limited Medusa Mining Limited
CGA Mining Limited Evolution Mining Limited
Saracen Mineral Holdings Limited Regis Resources Limited
Silver Lake Resources Limited OceanaGold Corporation
Northern Star Resources Ltd Tanami Gold NL
Focus Minerals Ltd
At the discretion of the Board, the composition of the comparator group may change from time to time.
TSR measures the growth for a financial year in the price of shares plus cash distributions notionally reinvested in shares. Company and comparator TSR performances are measured using the 10 day VWAP calculation up to, and including, the last business day of the financial period immediately preceding the period that the performance rights relate to, and in determining the closing TSR performances at the end of the three year period. Relative TSR performance is calculated at a single point in time and is not subject to re‐testing. Where a comparator company ceases to be listed on the ASX during the vesting period, the corresponding TSR is adjusted, taking into account the period the ceasing company was listed and the average TSR of the remaining comparator companies.
For
per
sona
l use
onl
y

ST BARBARA LIMITED 30 JUNE 2015
DIRECTORS’ REPORT Remuneration Report (Audited) ‐ Continued
Page 34
The proportion of the FY15 Performance Rights that vest will be influenced by the Company’s TSR relative to the comparator group over the three year vesting period commencing 1 July 2014 and ending 30 June 2017 as outlined below:
Relative TSR Performance % Contribution to the Number of Performance Rights to Vest
Below 50th percentile 0%
50th percentile 50%
Between 50th & 75th percentiles Pro‐rata from 50% to 100%
75th percentile and above 100%
(vi) Return on Capital Employed (ROCE)
The proportion of the FY 15 Performance Rights that vest will be influenced by the ROCE achieved by the Company over the three year vesting period commencing 1 July 2014 and ending 30 June 2017 as outlined below:
Return on Capital Employed (ROCE) % Contribution to the Number of Performance Rights to Vest
Less than or equal to the average annual weighted average cost of capital (WACC) over the three year period ending on 30 June 2017
0%
WACC (calculated as above) + 3% 50%
WACC (calculated as above) + 7% 100%
(vii) Example of calculation of the number of FY15 Performance Rights to vest
Assuming the following measures over the three year vesting period ending 30 June 2017:
Relative TSR: 70%
ROCE WACC + 4%
then the following proportion of performance rights will vest:
(a) Relative TSR Weighting: 67% Actual score: 70
th percentile
Calculation: 50% (for achieving the 50th percentile)
+ ((70% ‐ 50%) (75% ‐ 50%)) x (100% ‐ 50%) = 90%
(b) Return on Capital Employed (ROCE) Weighting: 33% Actual ROCE: WACC + 4% Calculation: 50% (for achieving the 50
th percentile)
+ ((4% ‐ 3%) (7% ‐ 3%)) x (100% ‐ 50%) = 62.5%
(c) Combined score (90% + 67%) + (62.5% x 33%) = 80.9%
Using the above example of an senior executive being issued with 2,000,000 performance rights based on the above 80.9% combined score, 1,618,000 (=80.9% x 2,000,000) performance rights would vest.
For
per
sona
l use
onl
y

ST BARBARA LIMITED 30 JUNE 2015
DIRECTORS’ REPORT Remuneration Report (Audited) ‐ Continued
Page 35
Performance Rights granted in 2015
Details on performance rights over ordinary shares in the Company that were granted as remuneration to each key management person and details of performance rights that vested in the 2015 financial year are as follows:
2015 Number of performance rights granted during 2015
Issue price per
performance right
Grant date Expiry date Fair value per performance right at grant
date ($ per share)
(1)
Number of performance rights vested
during FY2015
R S Vassie 4,062,500 $0.12 9 Dec 2014 30 Jun 2017 $0.05 ‐ G Campbell‐Cowan 2,438,525 $0.12 5 Dec 2014 30 Jun 2017 $0.05 ‐
(1) The fair value of performance rights at grant date was determined using a Black‐Scholes valuation to which a Monte Carlo simulation was applied to determine the probability of the market conditions associated with the rights being met. This methodology complied with the requirements of Australian Accounting standard AASB 2 Share Based Payments.
Performance Rights On Issue
The number of rights over ordinary shares in the Company held directly, indirectly or beneficially during the financial year by each key management person, including their related parties, are set out below:
2015 Held at 1 July 2014
Granted as compensation
Exercised during the year
Other changes during the year
Held at 30 June 2015
(1)
R S Vassie ‐ 4,062,500 ‐ ‐ 4,062,500 G Campbell‐Cowan 736,826 2,438,525 ‐ (139,636) 3,035,715 K Romeyn 543,763 ‐ ‐ (543,763) n/a
(1) The vesting of performance rights held at 30 June 2015 is subject to future performance conditions.
(2) Ms Romeyn’s role as EGM People and Business Services was made redundant on 28 November 2014
Valuation of Performance Rights
The assessed fair value at the grant date of performance rights is allocated equally over the period from grant date to vesting date. Fair values at grant date are based on the prevailing market price on the date the performance right is granted.
A Monte Carlo simulation is performed to determine the probability of the market conditions associated with the performance rights being met. The probability estimated by the Monte Carlo simulation is then applied to the fair value. For performance rights issued during the year ended 30 June 2015 (FY15 Performance Rights), taking into account the impact of the market condition (as discussed above), the estimated fair value was, for accounting purposes, $0.05.
Further information on performance rights is set out in Note 34 to the Financial Statements.
For
per
sona
l use
onl
y

ST BARBARA LIMITED 30 JUNE 2015
DIRECTORS’ REPORT Remuneration Report (Audited) ‐ Continued
Page 36
Share holdings
The numbers of shares in the Company held directly, indirectly or beneficially during the year by each key management person, including their related parties, are set out below. Other than 833,333 shares issued to the Manager Director and CEO (as approved at the 2014 AGM), there were no shares granted during the year as compensation.
Name
Note
Balance at the start of the year
Performance rights vested
Purchased Sold Other changes
Balance at the end of the
year
Non‐Executive Directors
S J C Wise (1) 1,139,389 ‐ ‐ ‐ (1,139,389) n/a
D W Bailey (2) 130,247 ‐ ‐ ‐ (130,247) n/a
T C Netscher ‐ ‐ ‐ ‐ ‐ ‐
I L Scotland (3) 16,000 ‐ ‐ ‐ (16,000) n/a
D Moroney n/a ‐ 100,000 ‐ ‐ 100,000
K Gleeson n/a ‐ ‐ ‐ ‐ ‐
Executive Director
R S Vassie n/a ‐ 935,720 ‐ 833,333 1,769,053
Senior Executives
G Campbell‐Cowan 15,000 ‐ ‐ ‐ ‐ 15,000
K Romeyn (4) ‐ ‐ ‐ ‐ ‐ n/a
(1) Resigned as a Director 30 June 2015 (2) Resigned as a Director 30 June 2015 (3) Resigned as a Director 26 January 2015 (4) Role as EGM People & Business Services made redundant on 28 November 2014.
Loans to Directors and senior executives
There were no loans to Directors or senior executives during the financial year 2015.
END OF REMUNERATION REPORT
For
per
sona
l use
onl
y

ST BARBARA LIMITED 30 JUNE 2015
DIRECTORS’ REPORT
Page 37
Indemnification and insurance of officers
The Company indemnifies all Directors of the Company named in this report, and a number of former Directors (including Mr Eduard Eshuys, Ms Barbara Gibson, Mr Richard Knight, Mr Hank Tuten, and Mr Mark Wheatley) and current and former executive officers of the Company and its controlled entities against all liabilities to persons (other than the Company or a related body corporate) which arise out of the performance of their normal duties as Director or executive officer, unless the liability relates to conduct involving bad faith. The Company also has a policy to indemnify the Directors and executive officers against all costs and expenses incurred in defending an action that falls within the scope of the indemnity and any resulting payments.
During the year the Company paid an insurance premium for Directors’ and Officers’ Liability and Statutory Liability policies. The contract of insurance prohibits disclosure of the amount of the premium and the nature of the liabilities insured under the policy. Proceedings on behalf of the company
No person has applied to the Court under section 237 of the Corporations Act 2001 for leave to bring proceedings on behalf of the Company, or to intervene in any proceedings to which the Company is a party, for the purpose of taking responsibility on behalf of the Company for all or part of those proceedings.
No proceedings have been brought or intervened in on behalf of the Company with leave of the Court under section 237 of the Corporations Act 2001. Environmental management
St Barbara regards compliance with environmental legislation, regulations and regulatory instruments as the minimum performance standard for its operations. The Group’s operations in Western Australia are subject to environmental regulation under both Commonwealth and State legislation. Within the Pacific Operations, the Group ensures compliance with the relevant National and Provincial legislation for each sovereignty and where appropriate standards or legislation are not available, the Group reverts to the standard of environmental performance as stipulated in the Western Australian legislation.
With the sale of Gold Ridge Mining Limited in the Solomon Islands in May 2015 and ongoing rehabilitation work undertaken at Leonora Operations, the rehabilitation liability of the Group has been substantially reduced in the year ended 30 June 2015. Mining operations at the King of the Hills mine ceased in April 2015, and it is anticipated that further rehabilitation of this site will occur during the coming months. The Group is committed to the rehabilitation of areas at closed sites previously disturbed by mining and exploration within its tenements in Western Australia.
A Group‐wide Environmental Management System (EMS) has been implemented to facilitate the effective and responsible management of environmental issues to the same high standard across all sites in both Australia and Papua New Guinea. Adoption of the EMS at all operations has contributed to further reductions in the number of minor environmental incidents, and an improvement in internal compliance rates for environmental audits and inspections. There were no externally reportable environmental incidents during the year ended 30 June 2015 at any of the Group’s Australian and Pacific sites
Non‐audit services
During the year and prior year the Company did not employ the auditor on any assignments in addition to their statutory audit duties. Details of the amounts paid or payable to the auditor, KPMG, for non‐audit services provided during the 2015 financial year are set out in Note 25 to the financial statements.
The Board of Directors has considered the position and, in accordance with the advice received from the Audit Committee, is satisfied that the provision of non‐audit services during the year is compatible with the general standard of independence for auditors imposed by the Corporations Act 2001. The Directors are satisfied that the provision of non‐audit services by the auditor, as set out in Note 25 to the financial statements, did not compromise the auditor independence requirements of the Corporations Act 2001 for the following reasons:
All non‐audit services were reviewed by the Audit Committee to ensure they do not impact the impartiality and objectivity of the auditor;
No non‐audit services were performed in the 2015 and 2014 financial years; and
For
per
sona
l use
onl
y

ST BARBARA LIMITED 30 JUNE 2015
DIRECTORS’ REPORT
Page 38
The Audit Committee annually informs the Board of the detail, nature and amount of any non‐audit services rendered by KPMG during the most recent financial year, giving an explanation of why the provision of these services is compatible with auditor independence. If applicable, the Audit Committee recommends that the Board take appropriate action in response to the Audit Committee’s report to satisfy itself of the independence of KPMG.
Auditor independence
A copy of the Auditor’s Independence Declaration required under section 307C of the Corporations Act 2001 is set out on page 39 and forms part of this Director’s Report. Events occurring after the end of the financial year
The Directors are not aware of any matter or circumstance that has arisen since the end of the financial year that, in their opinion, has significantly affected or may significantly affect in future years the Company’s operations, the results of those operations or the state of affairs, except that on 20 August 2015, the Group announced the sale of its King of the Hills mine and Kailis resource to Saracen Metals Pty Ltd (a wholly owned subsidiary of Saracen Mineral Holdings Ltd) subject to various third party consents and Australian government approvals. Consideration for the sale is $3 million, with $0.3 million payable on completion and the balance due on the earlier of commercial production of ore from Kailis or four years from completion of the sale. The present value of the deferred settlement of $2.7 million is $2.3 million. Completion of the sale is expected to occur by the end of October 2015. On completion of the sale the rehabilitation provision of $13.9 million relating to King of the Hills and Kailis will be reversed to the Income Statement.
Rounding of amounts St Barbara Limited is a Company of the kind referred to in Class Order 98/100 approved by the Australian Securities and Investments Commission and issued pursuant to section 341(1) of the Corporations Act 2001. As a result, amounts in this Directors’ Report and the accompanying Financial Report have been rounded to the nearest thousand dollars, except where otherwise indicated.
This report is made in accordance with a resolution of Directors. For and on behalf of the Board Dated at Melbourne this 25th day of August 2015
Bob Vassie Managing Director and CEO
For
per
sona
l use
onl
y

ST BARBARA LIMITED 30 JUNE 2015
DIRECTORS’ REPORT
Page 39
Auditor’s Independence Declaration Set text colour to white after inserting the auditor’s independence declaration
For
per
sona
l use
onl
y

ST BARBARA LIMITED 30 JUNE 2015
Page 40
FINANCIAL REPORT
Financial Report Table of Contents
CONSOLIDATED INCOME STATEMENT ......................................................................................................................... 41
CONSOLIDATED STATEMENT OF COMPREHENSIVE INCOME ....................................................................................... 42
CONSOLIDATED STATEMENT OF FINANCIAL POSITION ................................................................................................ 43
CONSOLIDATED STATEMENT OF CHANGES IN EQUITY ................................................................................................. 44
CONSOLIDATED CASH FLOW STATEMENT .................................................................................................................... 45
NOTES TO THE CONSOLIDATED FINANCIAL STATEMENTS ........................................................................................... 46
DIRECTORS’ DECLARATION ......................................................................................................................................... 103
INDEPENDENT AUDIT REPORT .................................................................................................................................... 104
This financial report covers the St Barbara Group (the Group) consisting of St Barbara Limited and its subsidiaries. The financial report is presented in the Australian dollar currency. St Barbara Limited is a company limited by shares, incorporated and domiciled in Australia. Its registered office is: St Barbara Limited Level 10, 432 St Kilda Rd Melbourne VIC 3004 A description of the nature of the Group’s operations and its principal activities is included in the review of operations and activities in the directors’ report, which is not part of this financial report. The financial report was authorised for issue by the Directors on 25 August 2015. The Company has the power to amend and reissue the financial report.
For
per
sona
l use
onl
y

ST BARBARA LIMITED 30 JUNE 2015
FINANCIAL REPORT
Page 41
CONSOLIDATED INCOME STATEMENT For the year ended 30 June 2015
Consolidated
2015 2014*
Notes $'000 $'000
Continuing operations
Revenue 6 548,206 462,770
Mine operating costs (311,701) (297,864)
Gross profit 236,505 164,906
Other revenue 6 1,782 1,904
Other income 7 1,503 3,169
Exploration expensed (7,691) (16,112)
Corporate and support costs (20,284) (26,809)(1)
Royalties (20,231) (17,267)
Depreciation and amortisation 8 (85,071) (95,620)
Net loss on disposal of assets ‐ (791)
Other expenditure (9,705) (1,261)(1)
Rehabilitation provision 9 (5,896) ‐
Impairment losses and asset write‐downs 4,9 (11,425) (215,290)
Operating profit/(loss) 79,487 (203,171)
Finance costs 8 (43,300) (43,296)
Foreign exchange(loss)/gain (15,350) 3,218
Net realised gain on derivatives 1,407 2,832
Profit/(loss) before income tax 22,244 (240,417)
Income tax (expense)/benefit 10 (1,090) (12,484)
Profit/(loss) from continuing operations (net of tax) 21,154 (252,901)
Profit/(loss) from discontinued operations (net of tax) 35 18,528 (247,930)
Profit/(loss) attributable to equity holders of the Company 39,682 (500,831)
Earnings per share for continuing and discontinued operations:
Basic earnings per share (cents per share) 33 8.05 (102.61)
Diluted earnings per share (cents per share) 33 7.83 (102.61)
Earnings per share for continuing operations:
Basic earnings per share (cents per share) 33 4.29 (51.82)
Diluted earnings per share (cents per share) 33 4.18 (51.82)
*restated to account for discontinued operations in the period. (1)During the year the Group reclassified expenditure for certain costs from other expenditure to corporate and support costs. This classification better reflects the nature of the expenditure. Prior year expenditure of $7,148,000 was changed for comparative purposes.
The above Consolidated Income Statement should be read in conjunction with the accompanying notes.
For
per
sona
l use
onl
y

ST BARBARA LIMITED 30 JUNE 2015
FINANCIAL REPORT
Page 42
CONSOLIDATED STATEMENT OF COMPREHENSIVE INCOME For the year ended 30 June 2015
Consolidated
2015 2014 Notes $'000 $'000
Profit/(loss) for the year 39,682 (500,831)
Other comprehensive income
Items that may be reclassified subsequently to profit/(loss):
Changes in fair value of available for sale financial assets 23(a) (6) 18
Changes in fair value of cash flow hedges taken to reserves 23(a) ‐ (4,771)
Gain/(loss) on closure of cash flow hedge 23(a) (1,407) 1,407
Income tax on other comprehensive income 9,386 722
Foreign currency translation differences ‐ foreign operations (40,151) 11,342
Other comprehensive income/(loss) net of tax(1) (32,178) 8,718
Total comprehensive income/(loss) attributable to equity holders of the Company 7,504 (492,113)
(1) Other comprehensive income comprises items of income and expense that are recognised directly in reserves or equity. These items are not recognised in
the consolidated Income Statement in accordance with the requirements of the relevant accounting standards. Total comprehensive (loss)/ profit comprises the result for the year adjusted for the other comprehensive income.
The above Consolidated Statement of Comprehensive Income should be read in conjunction with the accompanying notes.
For
per
sona
l use
onl
y
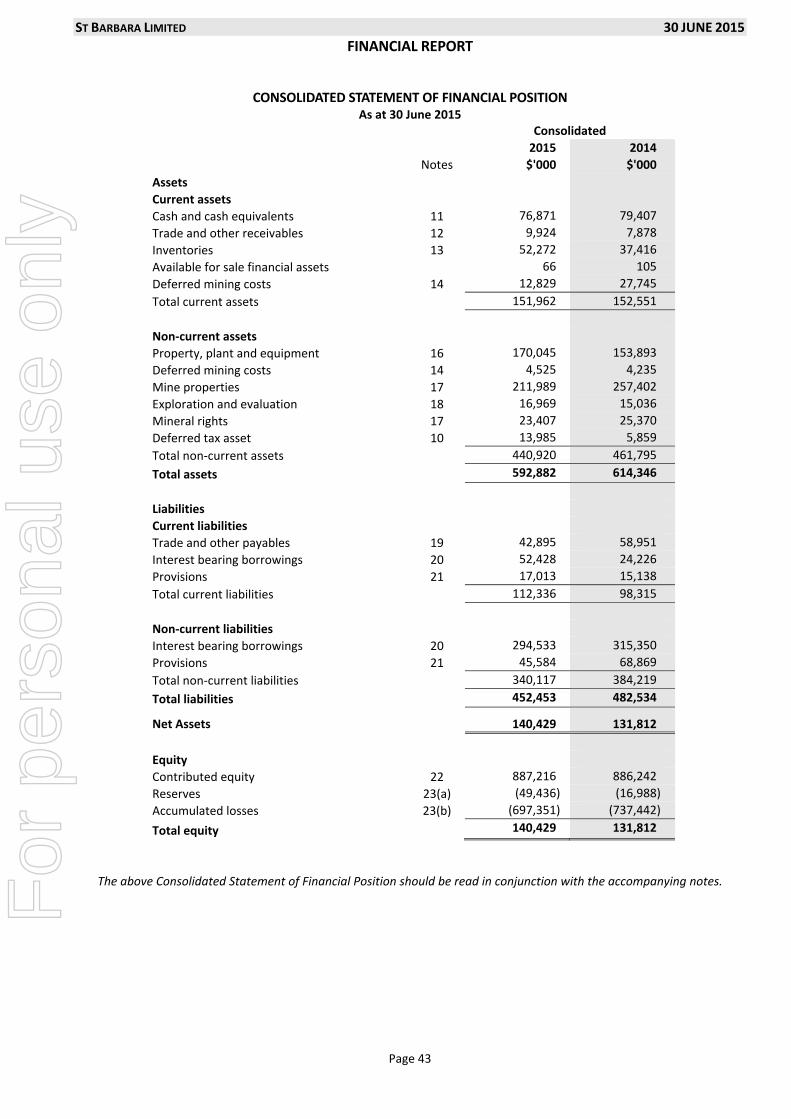
ST BARBARA LIMITED 30 JUNE 2015
FINANCIAL REPORT
Page 43
CONSOLIDATED STATEMENT OF FINANCIAL POSITION As at 30 June 2015
Consolidated
2015 2014
Notes $'000 $'000
Assets
Current assets
Cash and cash equivalents 11 76,871 79,407
Trade and other receivables 12 9,924 7,878
Inventories 13 52,272 37,416
Available for sale financial assets 66 105
Deferred mining costs 14 12,829 27,745
Total current assets 151,962 152,551
Non‐current assets
Property, plant and equipment 16 170,045 153,893
Deferred mining costs 14 4,525 4,235
Mine properties 17 211,989 257,402
Exploration and evaluation 18 16,969 15,036
Mineral rights 17 23,407 25,370
Deferred tax asset 10 13,985 5,859
Total non‐current assets 440,920 461,795
Total assets 592,882 614,346
Liabilities
Current liabilities
Trade and other payables 19 42,895 58,951
Interest bearing borrowings 20 52,428 24,226
Provisions 21 17,013 15,138
Total current liabilities 112,336 98,315
Non‐current liabilities
Interest bearing borrowings 20 294,533 315,350
Provisions 21 45,584 68,869
Total non‐current liabilities 340,117 384,219
Total liabilities 452,453 482,534
Net Assets 140,429 131,812
Equity
Contributed equity 22 887,216 886,242
Reserves 23(a) (49,436) (16,988)
Accumulated losses 23(b) (697,351) (737,442)
Total equity 140,429 131,812
The above Consolidated Statement of Financial Position should be read in conjunction with the accompanying notes. For
per
sona
l use
onl
y

ST BARBARA LIM
ITED
30 JUNE 2015
FINANCIAL REPORT
Page 44
CONSO
LIDATED STATEMEN
T OF CHANGES IN
EQUITY
Note
Contributed
Equity
000’s
Share Based
Paymen
ts
Reserve
000’s
Gold Cash
Flow Hed
ge
Reserve
000’s
Investmen
t Fair Value
Reserve
000’s
Foreign
Curren
cy
Translation
Reserve
000’s
Retained
Earnings
000’s
Total
000’s
Balance at 1 July 2013
886,242
1,141
3,627
(156)
(29,614)
(238,013)
623,227
Transactions
with owners’ of
the
Company
recognised directly in equity:
Share‐based
payments expense
23(a)
‐ 698
‐ ‐
‐ ‐
698
Unlisted options expired
23(a)
‐ (1,402)
‐ ‐
‐ 1,402
‐
Total comprehensive income for the year
Loss attributable to equity holders of the Company
‐
‐ ‐
‐ ‐
(500,831)
(500,831)
Other comprehensive income/loss
‐
‐ (2,642)
18
11,342
‐
8,718
Balance at 30
June 2014
886,242
437
985
(138)
(18,272)
(737,442)
131,812
Balance at 1 July 2014
886,242
437
985
(138)
(18,272)
(737,442)
131,812
Transactions
with owners’ of
the
Company
recognised directly in equity:
Share‐based
payments expense
23(a)
‐ 139
‐ ‐
‐ ‐
139
Unlisted options expired
23(a)
‐ (409)
‐ ‐
‐ 409
‐ Equity Issue (net of transaction costs)
974
‐ ‐
‐ ‐
‐ 974
Total comprehensive income for the year
Gain attributable to equity holders of the Company
‐
‐ ‐
‐ ‐
39,682
39,682
Other comprehensive income/(loss)
‐
‐ (985)
(6)
(31,187)
‐ (32,178)
Balance at 30
June 2015
887,216
167
‐ (144)
(49,459)
(697,351)
140,429
The above Consolidated Statement of Changes in Equity should be read in conjunction with the accompanying notes.
For
per
sona
l use
onl
y

ST BARBARA LIMITED 30 JUNE 2015
FINANCIAL REPORT
Page 45
CONSOLIDATED CASH FLOW STATEMENT For the year ended 30 June 2015
Notes Consolidated 2015 2014 $'000 $'000
Cash Flows From Operating Activities:
Receipts from customers (inclusive of GST) 555,823 540,050
Payments to suppliers and employees (inclusive of GST) (407,508) (472,501)
Payments for exploration and evaluation (7,383) (21,297)
Interest received 1,571 1,720
Interest paid (28,682) (26,565)
Finance charges – finance leases (471) (741)
Borrowing costs paid (149) (406)
Net cash inflow from operating activities 31 113,201 20,260
Cash Flows From Investing Activities:
Proceeds from sale of property, plant and equipment 106 1,340
Payments for property, plant and equipment (23,762) (49,225)
Payments for development of mining properties (24,705) (39,971)
Payments for exploration and evaluation (2,241) ‐
Proceeds from sale of discontinued operations ‐ 1,444
Net cash outflow from investing activities (50,602) (86,412)
Cash Flows From Financing Activities:
Proceeds from close out of gold options ‐ 8,500
Movement in restricted cash (507) 10,378
Gold prepayment facility repayments ‐ (32,399)
Gold prepayment facility repayment/settlement ‐ (36,132)
Loans from other entities ‐ drawdown ‐ 83,452
Loans from other entities – transaction and borrowing costs ‐ (5,841)
Secured notes repayments (66,831) ‐
Principal repayments ‐ finance leases (4,003) (4,706)
‐ insurance premium funding ‐ (4,573)
Net cash (outflow)/inflow from financing activities (71,341) 18,679
Net decrease in cash and cash equivalents (8,742) (47,473)
Cash and cash equivalents at the beginning of the year 79,407 117,383
Net movement in foreign exchange rates 6,206 9,497
Cash and cash equivalents at the end of the year 11 76,871 79,407
The above Consolidated Cash Flow Statement should be read in conjunction with the accompanying notes.
For
per
sona
l use
onl
y

ST BARBARA LIMITED 30 JUNE 2015
FINANCIAL REPORT
Page 46
NOTES TO THE CONSOLIDATED FINANCIAL STATEMENTS Table of Contents
Note 1 Summary of significant accounting policies ......................................................................................... 47
Note 2 New Standards adopted ....................................................................................................................... 60
Note 3 Financial risk management ................................................................................................................... 62
Note 4 Critical Accounting Estimates and Judgements .................................................................................... 68
Note 5 Segment Information ........................................................................................................................... 72
Note 6 Revenue ................................................................................................................................................ 76
Note 7 Other income ........................................................................................................................................ 76
Note 8 Expenses ............................................................................................................................................... 77
Note 9 Significant items ................................................................................................................................... 78
Note 10 Income tax ............................................................................................................................................ 79
Note 11 Cash and cash equivalents .................................................................................................................... 81
Note 12 Trade and other receivables ................................................................................................................. 81
Note 13 Inventories ............................................................................................................................................ 81
Note 14 Deferred mining costs .......................................................................................................................... 81
Note 15 Financial instruments ........................................................................................................................... 82
Note 16 Property, plant and equipment ............................................................................................................ 84
Note 17 Mine properties .................................................................................................................................... 85
Note 18 Exploration and evaluation ................................................................................................................... 85
Note 19 Trade and other payables ..................................................................................................................... 85
Note 20 Interest bearing borrowings ................................................................................................................. 86
Note 21 Provisions ............................................................................................................................................. 87
Note 22 Contributed equity ............................................................................................................................... 88
Note 23 Reserves and accumulated losses ........................................................................................................ 89
Note 24 Parent Entity disclosures ...................................................................................................................... 91
Note 25 Remuneration of auditors .................................................................................................................... 92
Note 26 Contingencies ....................................................................................................................................... 92
Note 27 Commitments for expenditure ............................................................................................................. 93
Note 28 Related party transactions ................................................................................................................... 94
Note 29 Controlled entities ................................................................................................................................ 95
Note 30 Events occurring after the balance sheet date ..................................................................................... 96
Note 31 Reconciliation of loss after income tax to net cash flows from operating activities ............................ 97
Note 32 Non‐cash investing and financing activities.......................................................................................... 97
Note 33 Earnings per share ................................................................................................................................ 98
Note 34 Share‐based payments ......................................................................................................................... 99
Note 35 Discontinued Operations .................................................................................................................... 101
Note 36 Disposal of subsidiary ......................................................................................................................... 102
For
per
sona
l use
onl
y

ST BARBARA LIMITED 30 JUNE 2015
FINANCIAL REPORT
Page 47
Note 1 Summary of significant accounting policies
St Barbara Limited (the “Company” or “Parent Entity”) is a company limited by shares incorporated in Australia whose shares are publicly traded on the Australian Stock Exchange. The consolidated financial statements of the Company as at and for the year ended 30 June 2015 comprise the Company and its subsidiaries (together referred to as the “Group”), and the Group’s interest in associates and jointly controlled entities. The Group is a for‐profit entity primarily involved in the exploration for, and mining of, gold.
The principal accounting policies adopted in the preparation of the financial report are set out below. These policies have been consistently applied to all the years presented, unless otherwise stated.
The consolidated financial statements have been presented in Australian dollars and all values are rounded to the nearest thousand dollars ($000) unless otherwise stated.
1.1 Basis of preparation
Statement of compliance
The financial report is a general‐purpose financial report, which has been prepared in accordance with Australian Accounting Standards (AASBs) (including Australian Interpretations) adopted by the Australian Accounting Standards Board (AASB) and the Corporations Act 2001. Where required by accounting standards comparative figures have been adjusted to conform to changes in presentation in the current year. The consolidated financial report of the Group complies with International Financial Reporting Standards (IFRSs) and interpretations issued by the International Accounting Standards Board.
The Board of Directors approved the financial statements on 25 August 2015.
Basis of measurement
The consolidated financial statements have been prepared on the historical cost basis, except for the following material items:
Derivative financial instruments are measured at fair value;
Share based payment arrangements are measured at fair value;
Available for sale assets are measured at fair value;
Rehabilitation provision is measured at net present value;
Long service leave provision is measured at net present value; and
Critical accounting estimates
The preparation of financial statements in conformity with AASB and IFRS requires management to make judgements, estimates and assumptions that affect the application of accounting policies and the reported amount of assets, liabilities, income and expenses. Actual results may differ from these estimates. The estimates and underlying assumptions are reviewed on an ongoing basis. Revisions to accounting estimates are recognised in the period in which the estimate is revised and in any future periods affected. The areas involving a higher degree of judgement or complexity, or areas where assumptions and estimates are significant to the financial statements are disclosed in Note 4.
For
per
sona
l use
onl
y

ST BARBARA LIMITED 30 JUNE 2015
FINANCIAL REPORT
Page 48
1.2 Principles of consolidation
(i) Subsidiaries
The consolidated financial statements incorporate the assets and liabilities of all subsidiaries of St Barbara Limited as at 30 June 2015 and the results of all subsidiaries for the year then ended.
Subsidiaries are all those entities (including special purpose entities) over which the Group has the power to govern the financial and operating policies, and as a result has an exposure or rights to variable returns, generally accompanying a shareholding of more than one‐half of the voting rights. The existence and effect of potential voting rights that are currently exercisable or convertible are considered when assessing whether the Group controls another entity.
Subsidiaries are consolidated from the date on which control commences until the date control ceases. A list of controlled entities is presented in Note 29.
Intercompany transactions, balances and unrealised gains on transactions between Group companies are eliminated. Unrealised losses are also eliminated unless the transaction provides evidence of the impairment of the asset transferred. Accounting policies of subsidiaries have been changed where necessary to ensure consistency with the policies adopted by the Group.
Investments in subsidiaries are accounted for at cost less any impairment charges within the Parent Entity disclosures at Note 24.
Non‐controlling interests in the results and equity of the entity that is controlled by the Group is shown separately in the Consolidated Income Statement, Consolidated Statement of Comprehensive Income, Consolidated Statement of Financial Position and Consolidated Statement of Changes in Equity respectively.
(ii) Associates and jointly controlled entities
Associates are all entities over which the Group has significant influence but not control, generally accompanying a shareholding of between 20% and 50% of voting rights. An interest in an associate is accounted for in the consolidated financial statements using the equity method and is carried at cost by the Parent Entity.
For joint arrangements in which the Group has rights to the assets, and obligations for the liabilities relating to the arrangements (joint operations), the proportionate interest in assets, liabilities and expenses are incorporated in the consolidated financial statements under the appropriate headings.
For those joint arrangements in which the Group has rights to the net assets of the arrangement (joint ventures), the Group accounts for the investment within the consolidated financial statements using the equity method. Within the separate financial statements of the parent the investment is carried at cost.
Profits or losses on transactions establishing the joint venture entity and transactions with the joint venture are eliminated to the extent of the Group’s ownership interest, until such time as they are realised by the joint venture entity on consumption or sale, unless they relate to an unrealised loss that provides evidence of the impairment of an asset transferred.
For
per
sona
l use
onl
y

ST BARBARA LIMITED 30 JUNE 2015
FINANCIAL REPORT
Page 49
1.3 Business combinations and goodwill
Acquisitions of businesses are accounted for using the acquisition method. The cost of an acquisition is measured as the aggregate of the consideration transferred. The consideration transferred in a business combination is measured at fair value, which is calculated as the sum of the acquisition date fair values of assets transferred to the Group, liabilities incurred by the Group to the former owners of the acquiree and the equity instruments issued by the Group in exchange for control of the acquiree.
Consideration transferred also includes the fair value of any contingent consideration and share‐based payment awards of the acquiree that are replaced as part of the business combination. Transaction costs that the Group incurs in connection with a business combination, other than those associated with the issue of debt or equity securities, are expensed as incurred.
Goodwill is measured as the excess of the sum of the consideration transferred, the amount of any non‐controlling interests in the acquiree, and the fair value of the acquirer’s previously held equity interest in the acquiree (if any) over the net fair value of the acquisition‐date amounts of the identifiable assets acquired and the liabilities assumed. After initial recognition, goodwill is measured at cost less any accumulated impairment losses.
For the purpose of impairment testing, goodwill acquired in a business combination is, from the acquisition date, allocated to each of the Group’s Cash Generating Units (CGU) that are expected to benefit from the synergies of the combination. Refer to Note 4(iv) on Impairment.
If the initial accounting for a business combination is incomplete by the end of the reporting period in which the combination occurs, the Group reports provisional amounts for the items for which the accounting is incomplete. Those provisional amounts are adjusted during the measurement periods or additional assets or liabilities are recognised to reflect new information obtained about facts and circumstances that existed as at the acquisition date that, if known, would have affected the amounts recognised as of that date.
1.4 Segment reporting
A reportable segment is a component of the Group that engages in business activities from which it may earn revenues or incur expenses, including revenues and expenses that relate to transactions with any of the Group’s other components. The operating results of all reportable segments are regularly reviewed by the Group’s Executive Leadership Team (“ELT”) to make decisions about resources to be allocated to the segment and assess its performance, and for which financial information is available.
Segment results that are reported to the ELT include items directly attributable to a segment and those that can be allocated on a reasonable basis. Unallocated items comprise mainly corporate assets and related depreciation, and corporate expenses.
Segment capital expenditure represents the total cost incurred during the year for mine development and acquisitions of property, plant and equipment.
1.5 Foreign currency translation
(i) Functional and presentation currency
Both the functional and presentation currency of St Barbara Limited and its Australian controlled entities is Australian dollars (AUD). The functional currency of the Group’s foreign operations is US dollars (USD).
(ii) Transactions and balances
Foreign currency transactions are translated into the functional currency using the exchange rates prevailing at the dates of the transactions. Foreign exchange gains and losses resulting from the settlement of such transactions, and from the translation at year end exchange rates of monetary assets and liabilities denominated in foreign currencies, are recognised in the income statement, except when deferred in equity as qualifying cash flow hedges and qualifying net investment hedges.
Translation differences on non‐monetary financial assets and liabilities are reported as part of the fair value gain or loss. Translation differences on non‐monetary financial assets and liabilities, such as equities held at fair value through profit or loss, are recognised in the income statement as part of the fair value gain or loss. Translation differences on non‐monetary financial assets, such as equities classified as available for sale financial assets, are included in the fair value reserve in equity.
For
per
sona
l use
onl
y

ST BARBARA LIMITED 30 JUNE 2015
FINANCIAL REPORT
Page 50
(iii) Translation of foreign operations
The assets and liabilities of controlled entities incorporated overseas with functional currencies other than Australian dollars are translated into the presentation currency of St Barbara Limited (Australian dollars) at the year‐end exchange rate and the income statements are translated at the rates applicable at the transaction date. Exchange differences arising on translation are taken directly to the foreign currency translation reserve in equity. On consolidation, exchange differences arising from the translation of net investments in foreign operations and of the borrowings designated as hedges of the net investment are taken to the foreign currency translation reserve. If the foreign operation is sold, the proportionate share of exchange differences would be transferred out of equity and recognised in the income statement.
1.6 Revenue recognition
Revenue from the sale of goods in the course of ordinary activities is measured at the fair value of the consideration received or receivable. Amounts disclosed as revenue are net of amounts collected on behalf of third parties. The Group recognises revenue when the significant risks and rewards of ownership have been transferred to the buyer, the amount of revenue can be reliably measured and the associated costs can be estimated reliably, and it is probable that future economic benefits will flow to the Group.
Revenue is recognised for the major business activities as follows:
(i) Product sales
Amounts are recognised as sales revenue when there has been a transfer of risk and rewards to a customer and selling prices are known or can be reasonably estimated.
Gains and losses, including premiums paid or received, in respect of forward sales, options and other deferred delivery arrangements, which hedge anticipated revenues from future production, are deferred and included in sales revenue when the hedged proceeds are received.
(ii) Interest income
Interest income is recognised as it accrues, using the effective interest method.
(iii) Dividends
Dividends are recognised as revenue when the right to receive payment is established.
(iv) Gains on disposal of available‐for‐sale financial assets and property, plant and equipment
Revenue is recognised when the risks and rewards of ownership have been transferred, which is usually considered to occur on settlement.
1.7 Exploration and evaluation/mine properties
(i) Exploration, evaluation and feasibility expenditure
All exploration and evaluation expenditure incurred up to establishment of reserves is expensed as incurred. From the point in time when reserves are established, exploration and evaluation expenditure is capitalised and carried forward in the financial statements, in respect of areas of interest for which the rights of tenure are current and where such costs are expected to be recouped through successful development and exploitation of the area of interest, or alternatively, by its sale. Capitalised costs are deferred until commercial production commences from the relevant area of interest, at which time they are amortised on a unit of production basis.
Exploration and evaluation expenditure consists of an accumulation of acquisition costs and direct exploration and evaluation costs incurred, together with an allocation of directly related overhead expenditure.
Feasibility expenditure represents costs related to the preparation and completion of a feasibility study to enable a development decision to be made in relation to that area of interest. Feasibility expenditures are expensed as incurred until a decision has been made to develop the area of interest.
Exploration and evaluation assets are assessed for impairment if (i) sufficient data exists to determine technical feasibility and commercial viability, and (ii) facts and circumstances suggest that the carrying amount exceeds the recoverable amount (see impairment policy, Note 1.10). For the purpose of impairment testing, exploration and evaluation assets are allocated to cash‐generating units to which the exploration activity relates.
When an area of interest is abandoned, or the Directors determine it is not commercially viable to pursue, accumulated costs in respect of that area are written off in the period the decision is made.
For
per
sona
l use
onl
y

ST BARBARA LIMITED 30 JUNE 2015
FINANCIAL REPORT
Page 51
(ii) Mines under construction
Mine development expenditure is accumulated separately for each area of interest in which economically recoverable reserves have been identified. This expenditure includes direct costs of construction, an appropriate allocation of overheads and borrowing costs capitalised during construction. Once a development decision has been taken, all capitalised exploration, evaluation and feasibility expenditure in respect of the area of interest is aggregated with the costs of construction and classified under non‐current assets as mine development.
(iii) Mine development
Mine development expenditure represents the acquisition cost and/or accumulated exploration, evaluation and development expenditure in respect of areas of interest in which mining has commenced.
When further development expenditure is incurred in respect of a mine, after the commencement of production, such expenditure is carried forward as part of the mine development only when substantial future economic benefits are thereby established, otherwise such expenditure is classified as part of production and expensed as incurred.
Mine development costs are deferred until commercial production commences, at which time they are amortised on a unit‐of‐production basis over mineable reserves. The calculation of amortisation takes into account future costs which will be incurred to develop all the mineable reserves. Changes to mineable reserves are applied from the beginning of the reporting period and the amortisation charge is adjusted prospectively from the beginning of the period.
1.8 Deferred mining expenditure
Certain mining costs, principally those that relate to the stripping of waste and operating development in underground operations, which provide access so that future economically recoverable ore can be mined, are deferred in the statement of financial position as deferred mining costs.
(i) Underground operations
In underground operations mining occurs progressively on a level‐by‐level basis. In these operations an estimate is made of the life of level average underground mining cost per recoverable ounce to expense underground costs in the income statement. Underground mining costs in the period are deferred based on the metres developed for a particular level. Previously deferred underground mining costs are released to the income statement based on the recoverable ounces produced in a level multiplied by the life of level cost per recoverable ounce rate.
Grade control drilling is deferred to the statement of financial position on a level‐by‐level basis. These amounts are released to the income statement as ounces are produced from the related mining levels.
(ii) Open pit operations
Overburden and other mine waste materials are often removed during the initial development of a mine site in order to access the mineral deposit. This activity is referred to as Deferred Stripping. Capitalisation of development stripping costs ceases and the depreciation of costs commences, at the time that saleable materials begin to be extracted from the mine.
Removal of waste material normally continues throughout the life of a mine. This activity is referred to as production stripping and commences at the time that saleable materials begin to be extracted from the mine.
The amount of mining costs deferred is based on the ratio obtained by dividing the waste tonnes mined by the quantity of gold ounces contained in the ore. Mining costs incurred in the period are deferred to the extent that the current period waste to contained gold ounce ratio exceeds the life of mine waste to ore ratio.
Deferred mining costs are then charged against reported earnings to the extent that, in subsequent periods, the ratio falls below the life of mine ratio. The life of mine ratio is based on economically recoverable reserves of the operation.
The life of mine ratio is a function of an individual mine’s design and therefore changes to that design will generally result in changes to the ratio. Changes in other technical or economic parameters may impact reserves, which will then impact the life of mine ratio. Changes to the life of mine ratio are accounted for prospectively.
In the production stage of some operations further development of the mine requires a phase of unusually high overburden removal activity that is similar in nature to pre‐production mine development. The costs of such unusually high overburden removal are deferred and charged against earnings in subsequent periods on a unit‐of‐production basis.
For
per
sona
l use
onl
y
ST BARBARA LIMITED 30 JUNE 2015
FINANCIAL REPORT
Page 52
1.9 Taxes
(i) Income tax
Income tax expense comprises current and deferred tax. Current tax and deferred tax is recognised in the income statement except to the extent that it relates to a business combination, or items recognised directly in equity or in other comprehensive income.
Current tax is the expected tax payable or receivable on the taxable profit or loss for the year, using tax rates enacted or substantively enacted at the reporting date, and any adjustment to tax payable in respect of previous years. Current tax payable also includes any tax liability arising from the declaration of dividends.
Additional income tax expenses that arise from the distribution of cash dividends are recognised at the same time that the liability to pay the related dividend is recognised. The Group does not distribute non‐cash assets as dividends to its shareholders.
(ii) Deferred tax
Deferred tax is recognised in respect of temporary differences between the carrying amounts of assets and liabilities for financial reporting purposes and the amounts used for taxation purposes. Deferred tax is not recognised for:
Temporary differences on the initial recognition of assets or liabilities in a transaction that is not a business combination and that affects neither accounting nor taxable profit or loss;
Temporary differences related to investments in subsidiaries and jointly controlled entities to the extent that it is probable that they will not reverse in the foreseeable future; and
Taxable temporary differences arising on the initial recognition of goodwill.
Deferred tax is measured at the tax rates that are expected to be applied to temporary differences when they reverse, based on the laws that have been enacted or substantively enacted by the reporting date.
Deferred tax assets and liabilities are offset if there is a legally enforceable right to offset current tax liabilities and assets, and they relate to income taxes levied by the same tax authority on the same taxable entity, or on different tax entities, but they intend to settle current tax liabilities and assets on a net basis or their tax assets and liabilities will be realised simultaneously.
A deferred tax asset is recognised for unused tax losses, tax credits and deductible temporary differences, to the extent that it is probable that future taxable profits will be available against which they can be utilised. Deferred tax assets are reviewed at each reporting date and are reduced to the extent that it is no longer probable that the related tax benefit will be realised.
Tax benefits acquired as part of a business combination, but not satisfying the criteria for separate recognition at that date, are recognised subsequently if new information about facts and circumstances change.
(iii) Tax exposure
In determining the amount of current and deferred tax the Group takes into account the impact of uncertain tax positions and whether additional taxes and interest may be due. This assessment relies on estimates and assumptions and may involve a series of judgements about future events. New information may become available that causes the Group to change its judgement regarding the adequacy of existing tax liabilities; such changes to tax liabilities will impact tax expense in the period that such a determination is made.
(iv) Goods and Services Tax (GST)
Revenues, expenses and assets are recognised net of the amount of associated GST, unless the GST incurred is not recoverable from the taxation authority. In this case it is recognised as part of the cost of acquisition of the asset or as part of the expense.
Receivables and payables are stated inclusive of the amount of GST receivable or payable. The net amount of GST recoverable from, or payable to, the taxation authority is included with other receivables or payables in the balance sheet.
Cash flows are included in the statement of cash flows on a gross basis. The GST component of cash flows arising from investing or financing activities, which are recoverable from, or payable to, the taxation authority are classified as part of operating cash flows.
For
per
sona
l use
onl
y

ST BARBARA LIMITED 30 JUNE 2015
FINANCIAL REPORT
Page 53
1.10 Impairment of assets
All asset values are reviewed at each reporting date to determine whether there is objective evidence that there have been events or changes in circumstances that indicate that the carrying value may not be recoverable. Where an indicator of impairment exists, a formal estimate of the recoverable amount is made. An impairment loss is recognised for the amount by which the carrying amount of an asset or a cash generating unit exceeds the recoverable amount. Impairment losses are recognised in the income statement. Refer to Note 4 (iv).
1.11 Cash and cash equivalents
For cash flow statement presentation purposes, cash and cash equivalents include cash on hand, deposits held at call with financial institutions, other short term, highly liquid investments that are readily convertible to known amounts of cash and which are subject to an insignificant risk of changes in value, and bank overdrafts. Bank overdrafts are shown within borrowings in current liabilities on the balance sheet.
1.12 Trade receivables
Trade receivables are recognised initially at fair value and subsequently measured at amortised cost, less provision for doubtful debts. Trade receivables are usually due for settlement no more than 30 days from the date of recognition. Cash placed on deposit with a financial institution to secure bank guarantee facilities and restricted from use within the business is disclosed as trade and other receivables.
Collectability of trade receivables is reviewed on an ongoing basis. Debts which are known to be uncollectible are written off. A provision for doubtful receivables is established when there is objective evidence that the Group will not be able to collect all amounts due according to the original terms of receivables. The amount of the provision is the difference between the asset’s carrying amount and the present value of estimated future cash flows, discounted at the effective interest rate. The amount of the provision is recognised in the income statement.
1.13 Inventories
Raw materials and stores, ore stockpiles, work‐in‐progress and finished gold stocks are valued at the lower of cost and net realisable value.
Cost comprises direct materials, direct labour and an appropriate proportion of variable and fixed overhead expenditure relating to mining activities, the latter being allocated on the basis of normal operating capacity. Costs are assigned to individual items of inventory on the basis of weighted average costs. Net realisable value is the estimated selling price in the ordinary course of business, less the estimated costs of completion and the estimated costs necessary to make the sale.
1.14 Investments and other financial assets
The Group classifies its investments and other financial assets in the following categories: financial assets at fair value through profit or loss, loans and receivables, and available‐for‐sale financial assets. The classification depends on the purpose for which the investments were acquired. Management determines the classification of its investments at initial recognition and re‐evaluates this designation at each reporting date.
Investments and other financial assets are recognised initially at fair value plus, for assets not at fair value through profit and loss, any directly attributable transaction costs, except as described below. Subsequent to initial recognition, investments and other financial assets are measured as described below.
(i) Financial assets at fair value through profit or loss
Financial assets at fair value through profit or loss are financial assets held for trading, which were acquired principally for the purpose of selling in the short term with the intention of making a profit. Derivatives are also categorised as held for trading, unless they are designated as hedges. Financial assets at fair value through profit or loss are measured at fair value and changes therein are recognised in the income statement. Attributable transaction costs are recognised in the income statement when incurred.
(ii) Available‐for‐sale financial assets
Available for sale financial assets, comprising principally marketable equity securities, are non‐derivative financial assets that are either designated in this category or not classified in any of the other categories. They are included in non‐current assets, unless management intends to and can dispose of the investment within 12 months of the balance sheet date.
Subsequent to initial recognition, available‐for‐sale financial assets are measured at fair value and changes therein, other than impairment losses, are recognised as a separate component of equity net of attributable tax. When an asset is derecognised the cumulative gain or loss in equity is transferred to the income statement.
For
per
sona
l use
onl
y

ST BARBARA LIMITED 30 JUNE 2015
FINANCIAL REPORT
Page 54
1.15 Derivative financial instruments
Derivative financial instruments may be held to protect against the Group’s Australian dollar gold price risk exposures. Derivatives are initially recognised at fair value on the date a derivative contract is entered into and are subsequently remeasured to fair value at each reporting date. The accounting for subsequent changes in fair value depends on whether the derivative is designated as a hedging instrument, and if so, the nature of the item being hedged. The Group designates certain derivatives as either (1) hedges of the fair value of recognised assets or liabilities or a firm commitment (fair value hedge); or (2) hedges of the cash flows of recognised assets and liabilities and highly probable forecast transactions (cash flow hedges).
The Group documents at the inception of the hedging transaction the relationship between hedging instruments and hedged items, as well as its risk management objective and strategy for undertaking various hedge transactions. The Group also documents its assessment, both at hedge inception and on an ongoing basis, of whether the derivatives that are used in hedging transactions have been, and will continue to be, highly effective in offsetting changes in fair values or cash flows of hedged items.
Movements in the gold cash flow hedge reserve in shareholders' equity are shown in Note 23.
(i) Cash flow hedge
The fair value of gold option contracts comprises intrinsic value, that is, the extent to which the components of an option are in the money due to a gold forward price falling below or rising above the option strike prices, and time value.
The effective portion of changes in the intrinsic value of derivatives that are designated and qualify as cash flow hedges is recognised in equity in the gold cash flow hedge reserve. The gain or loss relating to the ineffective portion and time value is recognised immediately in the income statement.
Amounts accumulated in equity are recycled through the income statement in the periods when the hedged item affects profit or loss (for instance, when the forecast gold sale that is hedged takes place). The gain or loss relating to the effective portion of the financial instrument hedging Australian dollar gold sales is recognised in the income statement within ‘net realised gains on derivatives’.
When a hedging instrument expires or is sold or terminated, or when a hedge no longer meets the criteria for hedge accounting, any cumulative gain or loss existing in equity at that time remains in equity and is recognised when the forecast transaction is ultimately recognised in the income statement. When a forecast transaction is no longer expected to occur, the cumulative gain or loss that was reported in equity is immediately transferred to the income statement.
(ii) Derivatives that do not qualify for hedge accounting
Certain derivative instruments do not qualify for hedge accounting. Changes in the fair value of any derivative instrument that does not qualify for hedge accounting are recognised immediately in the income statement.
(iii) Hedges of Net Investment
Hedges of a net investment in a foreign operation, including a hedge of a monetary item that is accounted for as part of the net investment, are accounted for in a similar way to cash flow hedges. Gains or losses on the hedging instrument relating to the effective portion of the hedge are recognised directly in equity in the Foreign Currency Translation Reserve, while any gains or losses relating to the ineffective portion are recognised in the income statement. On disposal of the foreign operation, the cumulative value of any gains or losses recognised directly in equity is transferred to the income statement.
1.16 Fair value estimation
The fair value of financial assets and financial liabilities must be estimated for recognition and measurement, or for disclosure purposes.
The fair value of financial instruments traded in active markets (such as publicly traded derivatives, and trading and available for sale securities) is based on quoted market prices at the balance sheet date. The quoted market price used for financial assets held by the Group is the current bid price; the appropriate quoted market price for financial liabilities is the current ask price.
The fair value of financial instruments that are not traded in an active market (for example, over the counter derivatives) is determined using generally accepted valuation techniques. The Group uses a variety of methods and makes assumptions that are based on market conditions existing at each balance date.
For
per
sona
l use
onl
y

ST BARBARA LIMITED 30 JUNE 2015
FINANCIAL REPORT
Page 55
The nominal value less estimated credit adjustments of trade receivables and payables are assumed to approximate their fair values. The fair value of financial liabilities for disclosure purposes is estimated by discounting the future contractual cash flows at the current market interest rate that is available to the Group for similar financial instruments.
1.17 Property, plant and equipment
Buildings, plant and equipment are stated at historical cost less accumulated depreciation. Historical cost includes expenditure that is directly attributable to the acquisition of the items. Cost may also include transfers from equity of any gains/losses on qualifying cash flow hedges of foreign currency purchases of property, plant and equipment.
Subsequent costs are included in the asset’s carrying amount or recognised as a separate asset, as appropriate, only when it is probable that future economic benefits associated with the item will flow to the Group and the cost of the item can be measured reliably. All other repairs and maintenance are charged to the income statement during the financial period in which they are incurred.
Depreciation of assets is calculated using the straight line method to allocate the cost or revalued amounts, net of residual values, over their estimated useful lives, as follows:
‐ Buildings 10 – 15 years
‐ Plant and equipment 3 – 10 years
‐ Fixtures and fittings 10 – 15 years
Where the carrying value of an asset is less than its estimated residual value, no depreciation is charged. The assets’ residual values and useful lives are reviewed, and adjusted if appropriate, at each balance sheet date.
An asset’s carrying amount is written down immediately to its recoverable amount, if the asset’s carrying amount is greater than its estimated recoverable amount (Note 1.10).
Gains and losses on disposal are determined by comparing proceeds with carrying amount. These gains and losses are included in the income statement when realised.
1.18 Mineral rights
Mineral rights comprise identifiable exploration and evaluation assets, mineral resources and ore reserves, which are acquired as part of a business combination or a joint venture acquisition, and are recognised at fair value at date of acquisition. Mineral rights are attributable to specific areas of interest and are amortised when commercial production commences on a unit of production basis over the estimated economic reserve of the mine to which the rights relate.
1.19 Trade and other payables
These amounts represent liabilities for goods and services provided to the Group prior to the end of the financial year, which remain unpaid as at reporting date. The amounts are unsecured and are usually paid within 30 days from the end of the month of recognition.
1.20 Borrowings
Borrowings are initially recognised at fair value, net of transaction costs incurred. Borrowings are subsequently measured at amortised cost except for the gold prepayment facility which is subsequently measured at fair value as its amortisation profile changes as a result of the embedded derivative. Any difference between the proceeds (net of transaction costs) and the redemption amount is recognised in the income statement over the period of the borrowings using the effective interest method. Fees paid on the establishment of loan facilities, which are not incremental costs relating to the actual draw down of the facility, are recognised as prepayments and amortised on a straight line basis over the term of the facility.
Borrowings are classified as current liabilities unless the Group has an unconditional right to defer settlement of the liability for at least 12 months after the reporting date.
1.21 Borrowing costs
Borrowing costs incurred for the construction of any qualifying asset are capitalised during the period of time it is required to complete and prepare the asset for its intended use or sale. Other borrowing costs are recognised as expenses in the period in which they are incurred.
1.22 Provisions
Provisions, including those for legal claims and rehabilitation and restoration costs, are recognised when the Group has a present legal or constructive obligation as a result of past events, it is more likely than not that an outflow of resources will
For
per
sona
l use
onl
y

ST BARBARA LIMITED 30 JUNE 2015
FINANCIAL REPORT
Page 56
be required to settle the obligation, and the amount has been reliably estimated. Provisions are not recognised for future operating losses.
Where there are a number of similar obligations, the likelihood that an outflow will be required in settlement is determined by considering the class of obligations as a whole. A provision is recognised even if the likelihood of an outflow with respect to any one item included in the same class of obligations may be small.
A provision for restructuring is recognised when the Group has approved a detailed and formal restructuring plan, and the restructuring has commenced or has been announced publicly. Future operating costs are not provided for.
Provisions are measured at the present value of management’s best estimate of the expenditure required to settle the present obligation at the balance sheet date. The discount rate used to determine the present value reflects current market assessments of the time value of money and the risks specific to the liability. The increase in the provision due to the passage of time is recognised as interest expense.
1.23 Employee benefits
(i) Wages and salaries, and annual leave
Liabilities for wages and salaries, including non‐monetary benefits and annual leave expected to be paid within 12 months of the reporting date are recognised in other payables in respect of employees' services up to the reporting date and are measured at the amounts expected to be paid, including expected on‐costs, when the liabilities are settled.
(ii) Long service leave
The liability for long service leave is recognised in the provision for employee benefits and measured as the present value of expected future payments to be made, plus expected on‐costs, in respect of services provided by employees up to the reporting date. Consideration is given to the expected future wage and salary levels, experience of employee departures and periods of service. Expected future payments are discounted with reference to market yields on national government bonds with terms to maturity and currency that match, as closely as possible, the estimated future cash outflows.
(iii) Share‐based payments
Share‐based compensation benefits are provided to employees through the Performance Rights Plan. Information relating to this plan is set out in Note 34.
The fair value of rights granted under the Performance Rights Plan is recognised as an employee benefit expense with a corresponding increase in equity. The fair value is measured at grant date and recognised over the period during which the employees become unconditionally entitled to the options or rights. The amount recognised on issue date is adjusted to reflect the actual number of performance rights not expected to vest, based on expectations of performance related conditions. Adjustments to the amount recognised at each reporting date are taken through the income statement.
The fair value of performance rights at grant date is determined using the market price of the Company’s shares on the date of grant and taking into account the vesting and performance criteria and probability of market conditions being met using a Monte Carlo Simulation methodology.
Upon expiry of rights, the balance of the share‐based payments reserve is either transferred directly to retained earnings, where the expiry is due to market conditions not being met, or through the income statement.
Upon the exercise of rights, the balance of the share‐based payments reserve relating to those rights is transferred to share capital.
(iv) Retirement benefit obligations
Contributions to defined contribution funds are recognised as an expense as they are due and become payable. Prepaid contributions are recognised as an asset to the extent that a cash refund or a reduction in future payments is available.
The Group has no obligations in respect of defined benefit funds.
(v) Executive incentives
Senior executives may be eligible for Short Term Incentive payments (“STI”) subject to achievement of Key Performance Indicators, as recommended by the Remuneration Committee and approved by the Board of Directors. The Group recognises a liability and an expense for STIs in the reporting period during which the service is provided by the employee.
(vi) Termination benefits
Termination benefits are recognised as an expense when the Group is demonstrably committed, without realistic possibility of withdrawal, to a formal detailed plan to terminate employment.
For
per
sona
l use
onl
y

ST BARBARA LIMITED 30 JUNE 2015
FINANCIAL REPORT
Page 57
1.24 Contributed equity
Ordinary shares are classified as equity. Incremental costs directly attributable to the issue of ordinary shares and performance rights are recognised as a deduction from equity, net of any tax effects.
If the entity reacquires its own equity instruments, e.g. as the result of a share buy‐back, those instruments are deducted from equity and the associated shares are cancelled. No gain or loss is recognised in the income statement and the consideration paid, including any directly attributable incremental costs, is recognised directly in equity.
1.25 Earnings per share
(i) Basic earnings per share
Basic earnings per share is calculated by dividing the profit attributable to equity holders of the Company, excluding any costs of servicing equity other than ordinary shares, by the weighted average number of ordinary shares outstanding during the reporting period, adjusted for bonus elements in ordinary shares issued during the reporting period.
(ii) Diluted earnings per share
Diluted earnings per share adjusts the figures used in the determination of basic earnings per share to take into account the after income tax effect of interest and other financing costs associated with dilutive potential ordinary shares and the weighted average number of shares assumed to have been issued for no consideration in relation to dilutive potential ordinary shares.
1.26 Rehabilitation and mine closure
The Group has obligations to dismantle, remove, restore and rehabilitate certain items of property, plant and equipment and areas of disturbance during mining operations.
Under AASB 116 Property, Plant and Equipment, the cost of an asset must include any estimated costs of dismantling and removing the asset and restoring the site on which it is located. The capitalised rehabilitation and mine closure costs are depreciated (along with the other costs included in the asset) over the asset’s useful life.
AASB 137 Provisions, Contingent Liabilities and Contingent Assets requires a provision to be made for the estimated cost of rehabilitation and restoration of areas disturbed during mining operations up to reporting date but not yet rehabilitated. Management judgments and estimates in relation to the rehabilitation provision are provided at Note 4(vi). Provision has been made in full for all the disturbed areas at the reporting date based on current estimates of costs to rehabilitate such areas, discounted to their present value based on expected future cash flows. The estimated cost of rehabilitation includes the current cost of contouring, topsoiling and revegetation to meet legislative requirements. Changes in estimates are dealt with on a prospective basis as they arise.
There is some uncertainty as to the amount of rehabilitation obligations that will be incurred due to the impact of changes in environmental legislation and many other factors, including future developments, changes in technology and price increases.
At each reporting date the rehabilitation liability is remeasured in line with changes in the timing and /or amounts of the costs to be incurred and discount rates. The liability is adjusted for changes in estimates. Adjustments to the estimated amount and timing of future rehabilitation and restoration cash flows are a normal occurrence in light of the significant judgments and estimates involved.
As the value of the provision represents the discounted value of the present obligation to restore, dismantle and rehabilitate, the increase in the provision due to the passage of time is recognised as a borrowing cost. A large proportion of the outflows are expected to occur at the time the respective mines are closed.
1.27 Assets classified as held for sale
Individual non‐current assets or disposal groups comprising assets and liabilities are classified as “held for sale” if the carrying amount will be recovered principally through a sale transaction rather than through continuing use. This condition is regarded as met only when the sale is highly probable and the non‐current asset is available for immediate sale in its present condition. Management must be committed to the sale, which should be expected to qualify for recognition as a completed sale within one year from the date of classification. On initial recognition, assets held for sale are measured at the lower of their carrying amount and fair value less costs to sell and are no longer depreciated (or amortised).
For
per
sona
l use
onl
y

ST BARBARA LIMITED 30 JUNE 2015
FINANCIAL REPORT
Page 58
1.28 Government royalties
Royalties under existing regimes are payable on sales revenue, or gold ounces produced and sold, and are therefore recognised as the sale occurs.
1.29 Rounding of amounts
The Company is of a kind referred to in Class Order 98/100, issued by the Australian Securities and Investments Commission, relating to the “rounding off” of amounts in the financial report. Amounts in the financial report have been rounded off in accordance with that Class Order to the nearest thousand dollars, or in certain cases, the nearest dollar.
1.30 Leases
Leases of property, plant and equipment, where the Group has substantially all the risks and rewards of ownership, are classified as finance leases. Finance leases are capitalised at inception of the lease at the lower of the fair value of the leased property and the present value of the minimum future lease payments. The corresponding rental obligations, net of finance charges, are included in interest bearing liabilities. Each lease payment is allocated between the liability and finance charges so as to achieve a constant rate on the finance balance outstanding. The interest element of the finance cost is charged to the income statement over the lease period so as to produce a constant periodic rate of interest on the remaining balance of the liability for each period. The property, plant and equipment acquired under finance leases are depreciated over the asset’s useful life, or the lease term if shorter where there is no reasonable certainty that the Group will obtain ownership by the end of the lease term.
Leases in which a significant portion of the risks and rewards of ownership are retained by the lessor are classified as operating leases. Payments made under operating leases (net of any incentives received from the lessor) are charged to the income statement on a straight‐line basis over the period of the lease.
1.31 New accounting standards and interpretations not yet adopted
A number of new standards, amendments to standards and interpretations are available for early adoption for annual reporting periods beginning after 1 July 2015, and have not been applied in preparing these consolidated financial statements. Those new standards, amendments to standards and interpretations which may be relevant to the Group are set out below. The Group does not plan to adopt these standards early and is in the process of considering the impact of the changes. I. AASB 9 Financial Instruments (December 2014) is a new standard which replaces AASB 139. This new version supersedes
AASB 9 issued in December 2009 (as amended) and AASB 9 (issued in December 2010) and includes a model for classification and measurements, a single, forward‐looking ‘expected loss’ impairment model and a substantially‐reformed approach to hedge accounting. AASB 9 is effective for annual periods beginning on or after 1 January 2018.
II. AASB 2014‐3 Amendments to Australian Accounting Standards‐Accounting for Acquisitions of interest in Joint Operations [AASB 1 &AASB 11]. Amends AASB 11 Joint Arrangements to provide guidance on the accounting for acquisitions of interest in joint operations in which the activity constitutes a business. AASB 2014‐3 is effective for annual periods beginning on or after 1 January 2018.
For
per
sona
l use
onl
y

ST BARBARA LIMITED 30 JUNE 2015
FINANCIAL REPORT
Page 59
1.31 New accounting standards and interpretations not yet adopted (continued)
III. AASB 2014‐4 Clarification of Acceptable Methods of Depreciation and Amortisation (Amendments to AASB 116 and AASB
138). Clarifies that the use of revenue‐based methods to calculate the depreciation of an asset is not appropriate, and is an inappropriate method for measuring the consumption of economic benefits embodied in an intangible asset. The clarification is effective for annual periods beginning on or after 1 January 2016.
IV. AASB 15 Revenue from Contracts with Customers which supersedes AASB 111 Construction contracts, AASB 118 Revenue, interpretation 12 Customer loyalty programmes, Interpretation 15 Agreements for the construction of Real Estate, Interpretation 18 Transfer of Assets from Customers, interpretation 131 Revenue‐Barter transactions involving Advertising services and Interpretation 1042 Subscriber Acquisition Costs in the Telecommunications Industry. The core principle of AASB 15 is that an entity recognises revenue to depict the transfer of promised goods or services to customers in an amount that reflects the consideration to which an entity expects to be entitled in exchange for those goods or services. AASB 15 is effective for annual periods beginning on or after 1 January 2017.
V. AASB 2014‐10 Amendments to Australian Accounting Standards‐Sale or Contribution of Assets between an Investor and its Associate or Joint Venture. Amends AASB 10 Consolidated Financial Statements and AASB 1287 to address inconsistency between the requirements in AASB 10 an those in AASB 128 (August 2011), in dealing with the sale or contribution of assets between an investor and its associate or joint venture. AASB 2014‐10 is effective for annual periods beginning on or after 1 January 2016.
VI. AASB 2015‐1 Amendments to Australian Accounting Standards‐Annual improvements to Australian Accounting Standards 2012‐2014 Cycle. Amends AASB 5 Non‐current Assets Held for Sale and Discontinued Operations clarifying changes in the method of disposal; AASB 7 Financial Instruments: Disclosures, clarifying the classification of service contracts, and disclosure requirements for condensed interim financial statements. Amends AASB 19 Employee Benefits by clarifying the currency of the corporate bonds used in arriving at the discount rate and AASB 134 Interim Financial Reporting, by clarifying the meaning of disclosure if information ‘elsewhere in the interim financial report’ and requires the inclusion of a cross‐reference from the interim financial statements to the location of this information. AASB 2015‐1 is effective for annual periods on or after 1 January 2016.
VII. AASB 2015‐2 Amendments to Australian Accounting Standards‐Disclosure Initiative: Amendments to AASB 101.
The Standard makes amendments to AASB 101 Presentation of Financial Statements arising from the IASB’s Disclosure Initiative project. The amendments are designed to further encourage companies to apply professional judgement in determining what information to disclose in the financial statements. The amendment will be applicable for annual periods on or after 1 January 2016.
VIII. AASB 2015‐3 Amendments to Australian Accounting Standard arising from the Withdrawal of AASB 1031 Materiality. The
Standard completes the AASB’s project to remove Australian guidance on materiality from Australian Accounting Standards. This amendment will be applicable for annual periods on or after 1 July 2015.
For
per
sona
l use
onl
y

ST BARBARA LIMITED 30 JUNE 2015
FINANCIAL REPORT
Page 60
Note 2 New Standards adopted The Company has adopted the following new and/or revised Standards, Amendments and Interpretations from 1 July 2014:
AASB 2012‐3 Amendments to Australian Accounting Standards‐Offsetting Financial Assets and Financial Liabilities.
AASB 2012‐3 adds application guidance to AASB 132 Financial Instruments: Presentation to address inconsistencies identified in applying some of the offsetting criteria of AASB 132.
AASB 2013‐3 Amendments to AASB 136‐Recoverable Amount Disclosures for Non‐Financial Assets
AASB 2013‐3 amends the disclosure requirements in AASB 136 Impairment of Assets. The amendments include the requirement to disclose additional information about the fair value measurements when the recoverable amount of impaired assets is based on fair value less cost of disposal.
AASB 2013‐4 Amendments to Australian Accounting Standards‐Novation of Derivatives and Continuation of Hedge Accounting [AASB 139].
AASB 2013‐4 amends AASB 139 to permit continuation of hedge accounting in specified circumstances where a derivative, which has been designated as a hedging instrument, is novated from one counterparty to a central counterparty as a consequence of laws or regulations.
AASB 1031 Materiality.
The revised AASB 1031 is an interim standard that cross‐references to other Standards and the Framework (issued December 2013) that contains guidance on materiality. AASB 1031 will be withdrawn when references to AASB 1031 in all Standards and Interpretations have been removed.
Interpretation 21 Levies.
The interpretation confirms that a liability to pay a levy is only recognised when the activity that triggers the payment occurs.
AASB 2013‐9 Amendments to Australian Accounting Standards‐Conceptual Framework, Materiality and Financial Instruments..
The Standard contains three main parts and makes amendments to a number of Standards and Interpretations. Part A of AASB 2013‐9 makes consequential amendments arising from the issuance of AASB CF 2013‐1. Part B makes amendments to particular Australian Accounting Standards to delete references to AASB 1031 and also makes minor editorial amendments to various other standards. Part C makes amendments to a number of Australian Accounting Standards, including incorporating Chapter 6 Hedge Accounting into AASB 9 Financial Instruments.
For
per
sona
l use
onl
y

ST BARBARA LIMITED 30 JUNE 2015
FINANCIAL REPORT
Page 61
AASB 2014‐1 Part A Annual Improvements 2010‐2012 Cycle.
AASB 2014‐1 Part A: This standard sets out amendments to Australian Accounting Standards arising from the issuance by the International Accounting Standards Board (IASB) of International Financial Reporting Standards (IFRSs) Annual Improvements to IFRSs 2010–2012 Cycle and Annual Improvements to IFRSs 2011–2013 Cycle.
Annual Improvements to IFRSs 2010–2012 Cycle addresses the following items:
AASB 2 ‐ Clarifies the definition of 'vesting conditions' and 'market condition' and introduces the definition of performance condition' and 'service condition'.
AASB 3 ‐ Clarifies the classification requirements for contingent consideration in a business combination by removing all references to AASB 137.
AASB 8 ‐ Requires entities to disclose factors used to identify the entity's reportable segments when operating segments have been aggregated. An entity is also required to provide a reconciliation of total reportable segment assets to the entity's total assets.
AASB 116 & AASB 138 ‐ Clarifies that the determination of accumulated depreciation does not depend on the selection of the valuation technique and that it is calculated as the difference between the gross and net carrying amounts.
AASB 124 ‐ Defines a management entity providing KMP services as a related party of the reporting entity. The amendments added an exemption from the detailed disclosure requirements in paragraph 17 of AASB 124 Related Party Disclosures for KMP services provided by a management entity. Payments made to a management entity in respect of KMP services should be separately disclosed.
The Adopted standards have no material impact on the recognition, measurement and disclosure of the year end financial report.
For
per
sona
l use
onl
y

ST BARBARA LIMITED 30 JUNE 2015
FINANCIAL REPORT
Page 62
Note 3 Financial risk management
The Group’s management of financial risk is aimed at ensuring net cash flows are sufficient to withstand significant changes in cash flow at risk scenarios and still meet all financial commitments as and when they fall due. The Group continually monitors and tests its forecast financial position and has a detailed planning process that forms the basis of all cash flow forecasting.
This note presents information about each of the financial risks that the Group is exposed to, the policies and processes for measuring and managing financial risk, and the management of capital. Further quantitative disclosures are included throughout this financial report.
The Group's normal business activities expose it to a variety of financial risk, being: market risk (especially gold price and foreign exchange risk), credit risk and liquidity risk. The Group may use derivative instruments as appropriate to manage certain risk exposures.
Risk management in relation to financial risk is carried out by a centralised Group Treasury function in accordance with Board approved directives that underpin Group Treasury policies and processes. The Treasury Risk Management Committee assists and advises the Group Treasury function, Executive Leadership Team, Audit and Risk Committee and Board in discharging their responsibilities in relation to forecasted risk profiles, risk issues, risk mitigation strategies and compliances with Treasury policy. Group Treasury regularly reports the findings to the Treasury Risk Management Committee and the Board.
(a) Market risk
Market risk is the risk that changes in market prices, such as commodity prices, foreign exchange rates, interest rates and equity prices will affect the Group’s income or the value of its holdings of financial instruments, cash flows and financial position. The Group may enter into derivatives, and also incur financial liabilities, in order to manage market risks. All such transactions are carried out within directives and policies approved by the Board.
(i) Commodity price risk
The Group’s revenue is exposed to spot gold price risk. Based upon sensitivity analysis, a movement in the average spot price of gold during the year of +AUD$100 per ounce/(‐AUD$100 per ounce), and all other factors remaining constant, would have increased/(decreased) post tax profit by $13,856,000/($13,856,000) respectively.
The Group has managed commodity price risk from time to time by using a combination of AUD denominated gold put options and gold call options to create zero‐cost option collar structures and gold forward contracts as described in (b) below.
(ii) Currency risk
The Group is exposed to currency risk on gold sales and transactions where the AUD spot rate is quoted as a function of USD and Papua New Guinea Kina (PGK) at the prevailing exchange rate. The USD currency exposure in relation to gold sales is not hedged and the USD exposure on transactions is managed by selling gold in USD therefore creating a natural hedge. Currently the PGK is not hedged.
For
per
sona
l use
onl
y

ST BARBARA LIMITED 30 JUNE 2015
FINANCIAL REPORT
Page 63
Note 3 Financial risk management (continued)
(iii) Interest rate risk
The Group’s main interest rate risk arises from long‐term borrowings. Borrowings issued at variable rates expose the Group to cash flow interest rate risk. Borrowings issued at fixed rates expose the Group to fair value interest rate risk. The Group Treasury will manage the interest rate exposures according to the Board approved Treasury policy. Any decision to hedge interest rate risk will be assessed in relation to the overall Group exposure, the prevailing interest rate market, and any funding counterparty requirements. As at 30 June 2015, interest rates on interest bearing liabilities were predominantly fixed as set out in note 15(b).
(b) Cash flow hedges The Group may from time to time be party to derivative financial instruments in the normal course of business to protect future revenue from gold operations from a significant fall in the price of gold, in accordance with the Group’s financial risk management policies.
(i) Leonora
In November 2013, the Company entered into a gold forward contract for 240,000 ounces of gold over a twelve‐month period to manage Australian dollar gold price risk associated with the estimated production from the Leonora mine at a strike price of A$1,390 per ounce.
In July 2014, the Company entered into another gold forward contract for 153,000 ounces of gold over the nine‐month period to June 2015 to manage Australian dollar gold price risk associated with the estimated production from the Leonora mine at a strike price of A$1,415 per ounce.
During financial year 2015, 218,456 ounces of gold were delivered to the gold forward contracts with no further amounts outstanding.
As physical delivery of gold is used to close out forward contracts, the standard provides an own use exemption under which the Group is not subject to the requirements of AASB 139 for these contracts.
(ii) Simberi
In April 2015, the Company entered into a gold forward contract for 100,200 ounces of gold over a twelve‐month period to June 2016 to manage Australian dollar gold price risk associated with the estimated production from the Simberi mine at a strike price of A$1,600 per ounce.
As physical delivery of gold is used to close out forward contracts, the standard provides an own use exemption under which the Group is not subject to the requirements of AASB 139 for these contracts.
The maturity profile of the gold forward contracts remaining as at 30 June 2015 is provided in the table below.
Strike Price Total ounces
6 months or less
ounces
6 – 12 months ounces
1 – 2 years ounces
2 – 5 years ounces
Simberi
A$1,600/oz 100,200 50,100 50,100 ‐ ‐
For
per
sona
l use
onl
y

ST BARBARA LIMITED 30 JUNE 2015
FINANCIAL REPORT
Page 64
Note 3 Financial risk management (continued) (iii) Cash flow hedge sensitivity
The relationship between currencies, spot gold price and volatilities is complex and changes in the spot gold price can influence volatility, and vice versa.
At 30 June 2015, the Group did not hold any gold options to hedge against movements in the gold price, however this is reviewed by the Board as part of the risk management framework.
(c) Credit risk
Credit risk is the risk that a counter party will not meet its obligations under a financial instrument or customer contract, with a maximum exposure equal to the carrying amount of the financial assets as recorded in the financial statements. The Group is exposed to credit risk from its operating activities (primarily customer receivables) and from its financing activities, including deposits with banks and financial institutions and derivatives.
Credit risks related to receivables
The Group’s most significant customer accounts for $3,342,000 of the trade receivables carrying amount at 30 June 2015 (2014: $nil), representing receivables owing from gold sales. Based on historic rates of default, the Group believes that no impairment has occurred with respect to trade receivables, and none of the trade receivables at 30 June 2015 were past due.
Credit risks related to cash deposits and derivatives
Credit risk from balances with banks and financial institutions derivative counterparties is managed by the centralised Group Treasury function in accordance with Board approved policy. Investments of surplus funds are only made with approved counterparties (minimum Standard & Poor’s credit rating of “AA‐”) and there is a financial limit on funds placed with any single counterparty.
Derivative transactions are only made with approved counterparties as per the Board approved Treasury Policy. Derivative transactions cover a major proportion of total Group production with maturities occurring over a period of time (refer Note 3(b)).
(d) Currency Risk
The Group is exposed to currency risk on gold sales, purchases and borrowings that are denominated in a currency other than the Company’s functional currency of the AUD. The currencies in which transactions primarily are denominated are Australian Dollars (AUD), US Dollars (USD) and Papua New Guinea Kina (PGK).
Currency risk relating to the net investment in the foreign operations is hedged against the Group's USD borrowings.. Exchange gains and losses upon subsequent revaluation of the designated USD denominated borrowings from the historical draw down rate to the reporting period end spot exchange rate are deferred in equity in the Foreign Currency Translation Reserve, and will be released to the income statement if the foreign operation is disposed of.
For
per
sona
l use
onl
y

ST BARBARA LIMITED 30 JUNE 2015
FINANCIAL REPORT
Page 65
Note 3 Financial risk management (continued)
As at 30 June 2015, a portion of the total USD borrowings of US$270,980,000 (2014: US$325,000,000) translated at the year end USD:AUD foreign exchange rate to $351,326,000 (2014: $344,630,000), excluding capitalised transaction costs of $9,624,000, were designated as a hedging instrument against the Group’s net investment in foreign operations. Prior to the impairment write down at 30 June 2014, the total USD borrowings were designated as a hedging instrument.
Interest on borrowings is denominated in the currency of the borrowing. The Group’s USD interest exposure is mitigated through USD cash flows realised through gold sales, providing a natural currency hedge. In respect of other monetary assets and liabilities denominated in foreign currencies, the Group buys and sells foreign currencies at spot rates when necessary.
Exposure to Currency
2015 USD $’000
PGK $’000
SBD $’000
Cash and cash equivalents 887 ‐ ‐ Trade Receivables 2,205 1,179 ‐ Trade payables (4,650) (6,025) ‐ Interest bearing liabilities (270,980) ‐ ‐
Net Exposure (272,358) (4,846) ‐
Exposure to Currency
2014 USD $’000
PGK $’000
SBD $’000
Cash and cash equivalents 25,236 736 335 Trade Receivables 653 1,054 34 Trade payables (4,673) (8,827) (7,576) Interest bearing liabilities (325,000) ‐ ‐
Net Exposure (303,784) (7,037) (7,207)
The exchange rates at the close of the period were as follows:
Closing rate as at AUD/USD AUD/PGK AUD/SBD 30 June 2015 0.771 2.065 6.042 30 June 2014 0.943 2.243 6.843
For
per
sona
l use
onl
y

ST BARBARA LIMITED 30 JUNE 2015
FINANCIAL REPORT
Page 66
Note 3 Financial risk management (continued)
Sensitivity Analysis:
The following table details the Group's sensitivity to a 10% movement (i.e. increase or decrease) in the Australian dollar against the US dollar and PNG Kina at the reporting date, with all other variables held constant. The 10% sensitivity is based on reasonably possible changes, over a financial year, using the observed range of actual historical rates for the preceding five year period:
Impact on Profit(1) After Tax
(Increase profit)/decrease profit
2015 2014
000's 000's
AUD/USD +10% 27,253 (30,377)
AUD/USD ‐10% (27,254) 30,378
AUD/PGK +10% 484 (704)
AUD/PGK ‐10% (485) 705
AUD/SBD +10% ‐ (722)
AUD/SBD ‐10% ‐ 719
Note (1): There is no impact on equity as the foreign currency denominated assets and liabilities represent cash, receivables, payables and borrowings. There are no derivatives.
Significant assumptions used in the foreign currency exposure sensitivity analysis above include:
Reasonably possible movements in foreign exchange rates.
The translation of the net assets in subsidiaries with a functional currency other than the Australian dollar has not been included in the sensitivity analysis as part of the equity movement.
The net exposure at the reporting date is representative of what the Group is expected to be exposed to in the next 12 months.
The sensitivity analysis only includes the impact on the balance of financial assets and financial liabilities at the reporting date.
(e) Capital management
The Group’s total capital is defined as total shareholders’ funds plus net debt. The Group aims to maintain an optimal capital structure to reduce the cost of capital and maximise shareholder returns. The Group has a capital management plan that is reviewed by the Board on a regular basis.
Consolidated capital 2015 $’000
2014 $’000
Total shareholders’ funds 140,429 131,812 Borrowings 346,961 339,576 Cash and cash equivalents (76,871) (79,407)
Total capital 410,519 391,981
The Group does not have a target debt/equity ratio. There were no changes in the Group’s approach to capital management during the year.
The Group is not subject to externally imposed capital requirements other than normal banking requirements.
Cash and cash equivalents does not include cash held on deposit with financial institutions as security for bank guarantee facilities totalling $2,084,000 (2014: $1,577,000) at the reporting date.
For
per
sona
l use
onl
y

ST BARBARA LIMITED 30 JUNE 2015
FINANCIAL REPORT
Page 67
Note 3 Financial risk management (continued)
Performance bonds with National Australia Bank Limited (NAB) and Commonwealth Bank of Australia (CBA) are respectively $1,386,000 and $98,000 to provide security for performance obligations incurred in the ordinary course of business, with security given through cash backing the facility. The Company has also provided cash as security for $600,000 credit card facility with NAB.
(f) Liquidity risk
Prudent liquidity risk management requires maintaining sufficient cash and marketable securities, the availability of funding through an adequate amount of committed credit facilities and the ability to close out market positions.
The Group manages liquidity risk by continuously monitoring forecast and actual cash flows, and matching maturity profiles of financial assets and liabilities. The Group undertakes sensitivity analysis to stress test the operational cash flows, which are matched with capital commitments to assess liquidity requirements. The capital management plan provides the analysis and actions required in detail for the next twelve months and longer term. The maturity of non‐current liabilities is monitored within the cash management plan.
Surplus funds are invested in instruments that are tradeable in highly liquid markets.
Maturities of financial liabilities
The table below analyses the Group’s financial liabilities. The amounts disclosed in the table are the contractual undiscounted cash flows, which includes interest obligations over the term of the facilities.
Maturity of financial liabilities ‐ 2015
$‘000 Less than 6 months
6 – 12 months
Between 1 and 5 years
Over 5 years
Total contractual cash flows
Carrying amount
Senior Secured Notes(1) 11,275 11,275 299,189 ‐ 321,739 248,621
Loans from other entities(1) 28,650 27,458 51,496 ‐ 107,604 93,081
Finance lease liabilities 2,983 1,356 1,444 ‐ 5,783 5,259
Trade and other payables 42,895 ‐ ‐ ‐ 42,895 42,895
85,803 40,089 352,129 ‐ 478,021 389,856
(1) Excluding amortisation of capitalised transaction costs and discount.
Maturity of financial liabilities ‐ 2014
$‘000 Less than 6 months
6 – 12 months
Between 1 and 5 years
Over 5 years
Total contractual cash flows
Carrying amount
Senior Secured Notes(1) 11,764 11,764 335,697 ‐ 359,225 256,048
Loans from other entities(1) 3,787 23,374 64,602 ‐ 91,763 73,689
Finance lease liabilities 2,519 2,356 5,492 ‐ 10,367 9,839
Trade and other payables 58,951 ‐ ‐ ‐ 58,951 58,951
77,021 37,494 405,791 ‐ 520,306 398,527
(1) Excluding amortisation of capitalised transaction costs and discount.
For
per
sona
l use
onl
y

ST BARBARA LIMITED 30 JUNE 2015
FINANCIAL REPORT
Page 68
Note 3 Financial risk management (continued)
(g) Fair value estimation
On‐Balance Sheet
The fair value of cash and cash equivalents and non‐interest bearing monetary financial assets and financial liabilities of the Group approximates their carrying value. The fair value of other monetary financial assets and financial liabilities is based upon market prices.
Fair values
The carrying amounts and the fair values of financial assets and liabilities of the Group at balance date are set out in the table below:
2015 2014
Carrying Amount $’000
Fair Value $’000
Carrying Amount $’000
Fair Value $’000
Financial assets
‐ Cash and cash equivalents 76,871 76,871 79,407 79,407
‐ Restricted cash 2,084 2,084 1,577 1,577
‐ Receivables 5,900 5,900 3,733 3,733
‐ Available for sale financial assets 66 66 105 105
84,921 84,921 84,822 84,822
Financial liabilities
‐ Trade and Other Payables 42,895 42,895 58,951 58,951
‐ Senior Secured Notes(1) 254,088 252,620 265,100 219,420
‐ Loans from other entities(2) 97,238 94,593 79,530 77,573
‐ Lease liabilities 5,259 5,259 9,839 9,839
399,480 395,367 413,420 365,783
(1) The senior secured note amount excludes $4,920,000 of capitalised transaction costs and $547,000 discount on notes. (2) Loans from other entities exclude $4,157,000 of capitalised transaction costs.
Note 4 Critical Accounting Estimates and Judgements
The preparation of financial statements requires management to make judgements, estimates and assumptions that affect the application of accounting policies and the reported amounts of assets, liabilities, income and expenses. Actual results may differ from these estimates under different assumptions and conditions. Estimates and judgements are continually evaluated and are based on historical experience and on various other factors, including expectations of future events that are believed to be reasonable under the circumstances. Revisions to accounting estimates are recognised in the period in which the estimate is changed and in any future periods affected.
The Group has identified the following critical accounting policies under which significant judgements, estimates and assumptions are made, and where actual results may differ from these estimates under different assumptions and conditions that could materially affect financial results or financial position reported in future periods.
i. Ore reserve estimates Reserves are estimates of the amount of gold product that can be economically extracted from the Group’s properties. In order to calculate reserves, estimates and assumptions are required about a range of geological, technical and economic factors, including quantities, grades, production techniques, recovery rates, production costs, future capital requirements, short and long term commodity prices and exchange rates.
Estimating the quantity and/or grade of reserves requires the size, shape and depth of ore bodies to be determined by analysing geological data. This process may require complex and difficult geological judgements and calculations to interpret the data.
For
per
sona
l use
onl
y

ST BARBARA LIMITED 30 JUNE 2015
FINANCIAL REPORT
Page 69
Note 4 Critical Accounting Estimates and Judgements (continued)
The Group determines and reports ore reserves under the 2012 edition of the Australian Code for Reporting of Mineral Resources and Ore Reserves, known as the JORC Code. The JORC Code requires the use of reasonable investment assumptions to calculate reserves. Due to the fact that economic assumptions used to estimate reserves change from period to period, and geological data is generated during the course of operations, estimates of reserves may change from period to period.
Changes in reported reserves may affect the Group’s financial results and financial position in a number of ways, including:
Asset carrying values may be impacted due to changes in estimated future cash flows.
Depreciation and amortisation charged in the income statement may change where such charges are calculated using the units of production basis.
Underground capital development and waste stripping costs deferred in the balance sheet or charged in the income statement may change due to a revision in the development amortisation rates and stripping ratios.
Decommissioning, site restoration and environmental provisions may change where changes in estimated reserves affect expectations about the timing or cost of these activities.
ii. Units of production method of amortisation
The Group applies the units of production method for amortisation of its life of mine specific assets, which results in an amortisation charge proportional to the depletion of the anticipated remaining life of mine production. These calculations require the use of estimates and assumptions in relation to reserves and resources, metallurgy and the complexity of future capital development requirements; changes to these estimates and assumptions will impact the amortisation charge in the income statement and asset carrying values.
iii. Amortisation of underground operating development
The Group applies the units of production method for amortisation of underground operating development. The amortisation rates are determined on a level‐by‐level basis. In underground operations an estimate is made of the life of level average underground mining cost per recoverable ounce to expense underground costs in the income statement. Underground mining costs in the period are deferred based on the metres developed for a particular level.
Grade control drilling is deferred to the statement of financial position on a level‐by‐level basis. These amounts are released to the income statement as ounces are produced from the related mining levels.
iv. Impairment of assets
The Group assesses impairment of all assets at each reporting date by evaluating conditions specific to the Group and to the particular assets that may lead to impairment. The recoverable amount of each CGU is determined as the higher of value‐in‐use or fair value less costs to sell (“Fair Value”), in accordance with significant accounting policy 1.10. These calculations require the use of estimates, which have been outlined in significant accounting policy 1.10.
The identified CGUs of the Group are: Leonora and Simberi. The carrying value of the Leonora CGU is assessed using value‐in‐use, while the Simberi CGU is valued using Fair Value.
For Simberi fair value less cost to sell was determined to be higher than the value in use based upon internal valuations, and as mandated by the accounting standards, the basis of measurement has been amended. The cost to dispose in respect of the updated measurement basis has been estimated based upon prevailing market conditions. The change in basis has no impact on impairment in current or prior periods.
Value‐in‐use and Fair Value are determined as the net present value of the estimated future cash flows. Future cash flows are based on life‐of‐mine plans using market based commodity price and exchange assumptions for both Australian Dollar (AUD) and United States Dollar (USD) gold price, estimated quantities of ore reserves, operating costs and future capital.
Significant judgements and assumptions are required in making estimates of value‐in‐use and fair value. The CGU valuations are subject to variability in key assumptions including, but not limited to: long‐term gold prices, currency exchange rates, discount rates, production, operating costs and future capital expenditure. An adverse change in one or more of the assumptions used to estimate value‐in‐use and fair value could result in a reduction in a CGU’s recoverable value. This could lead to the recognition of impairment losses in the future. The inter‐relationship of the significant accounting assumptions upon which estimated future cash flows are based, however, are such that it is impractical to disclose the extent of the possible effects of a change in a key assumption in isolation.
For
per
sona
l use
onl
y

ST BARBARA LIMITED 30 JUNE 2015
FINANCIAL REPORT
Page 70
Note 4 Critical Accounting Estimates and Judgements (continued)
The table below summarises the key assumptions used in the 30 June 2015 reporting date carrying value assessments:
(a) Impairment testing
2016‐2020
Long term
2021+
Gold (Real US$ per ounce) $1,139/oz ‐ $1,204/oz $1,150/oz
Gold (Real A$ per ounce) $1,531/oz ‐ $1,584/oz $1,475/oz
AUD:USD exchange rate 0.76 to 0.71 0.78
Post‐tax real discount rate (%) – Australia 9.3 9.3
Post‐tax real discount rate (%) – Pacific Operations 11.3 11.3
Commodity prices and exchange rates
Commodity prices and foreign exchange rates are estimated with reference to external market forecasts and updated at least annually. The rates applied for the first five years of the valuation have regard to observable market data, including spot and forward values. Thereafter the estimate is interpolated to the long‐term assumption, which is made with reference to market analysis.
Discount rate
In determining the value‐in‐use or Fair Value of CGUs, the future cash flows are discounted using rates based on the Group’s estimated real post‐tax weighted average cost of capital for each functional currency used in the Group, with an additional premium applied having regard to the geographic location of the CGU.
Operating and capital costs
Life‐of‐mine operating and capital cost assumptions are based on the Group’s latest life‐of‐mine plans. The projections do not include expected cost improvements reflecting the Group’s objectives to maximise free cash flow, optimise and reduce activity, apply technology, improve capital and labour productivity.
Unmined resources and exploration values
Unmined resources may not be included in a CGU’s particular life‐of‐mine plan for a number of reasons, including the need to constantly re‐assess the economic returns on and timing of specific production options in the current economic environment. In our determination of value in use, there are no unmined resources and exploration estimates included within our valuation.
Impairment booked
At 30 June 2015, the Group booked an impairment of $11,425,000 in relation to the King of the Hills mine which ceased operations during the year. The impairment booked relates to capitalised mine development which remained unamortised at the date the decision was made to cease operations. As there was no plan generated which would generate future cash flows to support the carrying value of the unamortised capitalised development, the entire amount was considered impaired.
v. Exploration and evaluation expenditure As set out in Note 1.7 exploration and evaluation expenditure is capitalised where reserves have been established for an area of interest and it is considered likely to be recoverable from future exploitation or sale. The accounting policy requires management to make certain estimates and assumptions as to future events and circumstances, in particular whether an economically viable extraction operation can be established. These estimates and assumptions may change as new information becomes available. If, after having capitalised the expenditure under the accounting policy, a judgement is made that recovery of the expenditure is unlikely, the relevant capitalised amount will be written off to the income statement.
For
per
sona
l use
onl
y

ST BARBARA LIMITED 30 JUNE 2015
FINANCIAL REPORT
Page 71
Note 4 Critical Accounting Estimates and Judgements (continued)
vi. Rehabilitation and mine closure provisions As set out in Note 1.26, the value of these provisions represents the discounted value of the present obligation to restore, dismantle and rehabilitate each site. Significant judgement is required in determining the provisions for mine rehabilitation and closure as there are many transactions and other factors that will affect the ultimate costs necessary to rehabilitate the mine sites. The discounted value reflects a combination of management’s best estimate of the cost of performing the work required, the timing of the cash flows and the discount rate.
A change in any, or a combination of, the key assumptions used to determine the provisions could have a material impact on the carrying value of the provisions (refer to Note 21). The provision recognised for each site is reviewed at each reporting date and updated based on the facts and circumstances available at the time. Changes to the estimated future
costs for operating sites are recognised in the balance sheet by adjusting both the restoration and rehabilitation asset and provision.
In estimating the rehabilitation provision at 30 June 2015, the following assumptions were made:
Timing of rehabilitation outflows was based on the life of mine plan of each operation, with the rehabilitation of legacy areas of disturbance scheduled accordingly.
Mine demolition costs are estimated on the basis of the expected mine life of each operation. Costs are adjusted for potential receipts through the sale of scrap metal.
Inflation is not applied to cost estimates.
A pre‐tax real discount rate of 5% based on the risks specific to the liability. vii. Taxes Estimates of future taxable profits are based on forecast cash flows from operations. At 30 June 2015 losses not recognised amounted to $79,574,000 (tax effected) relating to Pacific Operations entities in PNG and Australia. These have not been recognised as it is not probable that the existence of future taxable profits will be available against which they can be utilised.
viii. Derivative financial instruments In prior periods, fair value of gold options bought and sold, have been determined using a ‘Level 2’ valuation method involving the use of a generally accepted option valuation model: inputs were based on market observable data for the asset or liability, either directly (i.e. prices) or indirectly (i.e. derived from prices), at the reporting date and compared with valuations provided by the counterparties to the collar structure. These calculations required the use of estimates and assumptions. Any changes in assumptions in relation to gold prices and volatilities could have had a material impact on the fair valuation attributable to the gold collar structure in prior periods. When these assumptions change in the future the differences will impact the gold cash flow hedge reserve and/or income statement in the period in which the change occurs.
ix. Onerous provision Following cost and headcount reductions in 2014 the Group no longer required leased premises in Brisbane and half of the floor space in Melbourne. An onerous provision totalling $1,729,000 was booked in June 2015 as a result which will be amortised over the outstanding lease period.
x. Share based payments The Group measures the cost of equity settled transactions with employees by reference to the fair value of the equity instruments at the date at which they are granted. The fair value is determined using the assumptions detailed in Note 34.
Where the vesting of share based payments contain market conditions, in estimating the fair value of the equity instruments issued, the Group assesses the probability of the market conditions being met, and therefore the probability of fair value vesting, by undertaking a Monte‐Carlo simulation. The simulation performs sensitivity analysis on key assumptions in order to determine potential compliance with the market performance conditions. The simulation specifically performs sensitivity analysis on share price volatility based on the historical volatility for St Barbara Limited and the peer group companies. The results of the Monte‐Carlo simulation are not intended to represent actual results, but are used as an estimation tool by management to assist in arriving at the judgment of probability.
For
per
sona
l use
onl
y

ST BARBARA LIMITED 30 JUNE 2015
FINANCIAL REPORT
Page 72
Note 5 Segment Information
The Group had three operational business units: Leonora Operations, Gold Ridge Operations and Simberi Operations. The operational business units are managed separately due to their separate geographic regions.
Gold Ridge Operations was disposed of during the year and therefore was separately disclosed as a discontinued operation.
The Group’s Executive Leadership Team reviews the results of all operations regularly, in particular production, cost per ounce and capital expenditures.
Information regarding the operations of each reportable segment is included below. Performance is measured based on segment profit before income tax, as this is deemed to be the most relevant in assessing performance, after taking into account factors such as cost per ounce of production.
For
per
sona
l use
onl
y

ST BARBARA LIM
ITED
30 JUNE 2015
FINANCIAL REPORT
Page 73
Note 5 Segm
ent Inform
ation (continued)
Leonora
Simberi
To
tal from continuing
operations
Total from discontinued
operations
2015
$’000
2014
$’000
2015
$’000
2014
$’000
2015
$’000
2014
$’000
2015
$’000
2014*
$’000
Reven
ue
435,685
401,820
112,521
60,950
548,206
462,770
4,375
71,058
Mine operating costs
(209,230)
(206,809)
(102,471)
(91,055)
(311,701)
(297,864)
(19,584)
(97,818)
Gross profit
226,455
195,011
10,050
(30,105)
236,505
164,906
(15,209)
(26,760)
Royalties (1)
(17,656)
(15,903)
(2,575)
(1,364)
(20,231)
(17,267)
(278)
(2,932)
Impairm
ent losses
(11,425)
‐‐
(215,290)
(11,425)
(215,290)
‐(195,266)
Dep
reciation and amortisation
(69,837)
(80,938)
(10,038)
(11,554)
(79,875)
(92,492)
‐(13,071)
Other income and expen
ses discontinued
ops
‐‐
‐ ‐
‐‐
3,694
(4,861)
Reh
abilitation expen
ses
(5,896)
‐‐
‐(5,896)
‐‐
‐ Reportab
le segm
ent profit/(loss) before
income tax
121,641
98,170
(2,563)
(258,313)
119,078
(160,143)
(11,793)
(242,890)
Capital expen
diture
(38,974)
(45,541)
(9,111)
(32,254)
(48,085)
(77,795)
‐(8,203)
Rep
ortable segmen
t ‐ assets
(2)
356,675
402,486
129,274
102,263
485,949
504,749
‐6,952
Rep
ortable segmen
t ‐ non‐curren
t assets
(2)
334,556
355,736
99,122
87,575
433,678
443,311
‐‐
Rep
ortable segmen
t ‐ liabilities
(2)
37,689
36,661
20,424
40,508
58,113
77,169
‐31,918
*restated to account for discontinued
operations in the period.
(1) Royalties include state and government royalties and corporate royalties
(2) Represents the reportable segment balances after the asset im
pairment and write down charges.
For
per
sona
l use
onl
y

ST BARBARA LIMITED 30 JUNE 2015
FINANCIAL REPORT
Page 74
Note 5 Segment Information (continued)
Major Customer
Major customers to whom the Group provides goods that are more than 10% of external revenue are as follows: Revenue % of external revenue 2015
$’000 2014 $’000
2015 %
2014 %
Customer A ‐ 60,460 ‐ 11.3 Customer B ‐ 35,279 ‐ 6.6 Customer C ‐ 49,857 ‐ 9.3 Customer D 306,990 264,043 56.0 49.5 Customer E 207,478 67,665 37.8 12.7 Reconciliation of reportable segment revenues, profit, assets, and other material items: Consolidated
2015 $’000
2014* $’000
Continuing operations
Revenues and other income
Total revenue for reportable segments 548,206 462,770
Other revenue 1,782 1,904
Other income 1,503 3,169
Consolidated revenue and other income – continuing operations 551,491 467,843
Consolidated
2015 $’000
2014* $’000
Continuing operations
Total profit/(loss) for reportable segments 119,078 (160,143)
Other income and revenue 3,285 5,073
Exploration expensed (7,691) (16,112)
Unallocated depreciation and amortisation (5,196) (3,128)
Finance costs (43,300) (43,296)
Amortisation of realised gain on settled hedges 1,407 2,832
Corporate and support costs (20,284) (26,809)
Foreign exchange(loss)/gain (15,350) 3,218
Loss on disposal of assets ‐ (791)
Other expenses (9,705) (1,261)
Consolidated profit/( loss) before income tax – continuing operations 22,244 (240,417)
*restated to account for discontinued operations in the period.
For
per
sona
l use
onl
y

ST BARBARA LIMITED 30 JUNE 2015
FINANCIAL REPORT
Page 75
Note 5 Segment Information (continued) Consolidated
2015 $’000
2014 $’000
Assets
Total assets for reportable segments 485,949 511,701
Cash and cash equivalents 76,871 76,888
Trade and other receivables 9,924 7,167
Available for sale financial assets 66 105
Inventories ‐ 3
Property, plant & equipment 6,087 6,857
Net deferred tax assets 13,985 5,859
Other assets ‐ 5,766
Consolidated total assets 592,882 614,346
Consolidated
2015 $’000
2014 $’000
Liabilities
Total liabilities for reportable segments 58,113 109,087
Trade and other payables 28,328 29,220
Interest bearing liabilities (current) 52,428 24,226
Provisions (current) 13,132 4,106
Interest bearing liabilities (non‐current) 294,533 315,350
Provisions (non‐current) 5,919 545
Consolidated total liabilities 452,453 482,534
For
per
sona
l use
onl
y

ST BARBARA LIMITED 30 JUNE 2015
FINANCIAL REPORT
Page 76
Note 5 Segment Information (continued)
Year ended 30 June 2015
Reportable
segment totals$’000
Unallocated $’000
Consolidated totals $’000
Other material items – continuing operations
Depreciation and amortisation
(79,875) (5,196) (85,071)
Capital Expenditure (48,085) (1,616) (49,701)
Year ended 30 June 2014*
Reportable
segment totals$’000
Unallocated $’000
Consolidated totals $’000
Other material items
Depreciation and amortisation
(92,492) (3,128) (95,620)
Capital Expenditure (77,795) (3,160) (80,955)
Note 6 Revenue Consolidated 2015 2014*
$'000 $'000 Sales revenue‐continuing operations Sale of gold 546,404 460,322 Sale of silver 1,802 2,448
548,206 462,770
Other revenue Interest revenue 1,586 1,718
Sub‐lease rental 196 186
1,782 1,904
Revenue from continuing operations 549,988 464,674
Revenue from discontinued operations (note 35) 4,375 71,058
Note 7 Other income Consolidated 2015 2014*
$'000 $'000 Profit on sale of assets 106 49 Royalties 1,053 1,565 Contingent consideration received on sale of Southern Cross (Note 9) ‐ 1,444 Other income 344 111 Other income from continuing operations 1,503 3,169 Other income from discontinued operations (note 35) 3,694 7,109
*restated to account for discontinued operations in the period.
For
per
sona
l use
onl
y

ST BARBARA LIMITED 30 JUNE 2015
FINANCIAL REPORT
Page 77
Note 8 Expenses Consolidated 2015 2014*
$'000 $'000 (Loss)/Profit before income tax includes the following specific expenses:
Depreciation Buildings 1,829 2,340 Plant and equipment 20,160 16,505 21,989 18,845 Amortisation
Mine properties and mine development costs 59,167 70,783 Deferred waste stripping ‐ 33 Other mineral assets 1,963 3,535 Capitalised borrowing costs 1,952 233 Plant/equipment finance leases ‐ 2,191 63,082 76,775 Total depreciation & amortisation – continuing operations 85,071 95,620
Finance Costs Interest paid/payable 36,708 26,551 Borrowing costs 4,246 3,575 Finance lease interest 471 741 Fair value movement in gold prepayment facility ‐ 10,800 Provisions: unwinding of discount 1,875 1,629
43,300 43,296
Employee related expenses Wages and salaries 59,291 66,493 Contributions to defined contribution superannuation funds 2,067 4,967 Equity settled share‐based payments (note 23(a)) 139 698
61,497 72,158
Rental expense relating to operating leases Lease payments 3,830 2,074
Expenses from discontinued operations 6,018 39,425
*restated to account for discontinued operations in the period.
For
per
sona
l use
onl
y

ST BARBARA LIMITED 30 JUNE 2015
FINANCIAL REPORT
Page 78
Note 9 Significant items
Significant items are those items where their nature or amount is considered material to the financial report. Such items included within the consolidated results for the year are detailed below. Consolidated 2015 2014*
$'000 $'000
Continuing operations Impairment losses
(1) (11,425) (215,290)
Increase in rehabilitation provision related to King of the Hills
(2) (5,896) ‐
Included within borrowing costs Gain on the US notes buy back 1,626 ‐
Redundancy costs Within Mine operating costs (21) (755) Within Exploration expenses ‐ (842) Within Corporate and support costs (501) (2,752)
(522) (4,349)
Included within other expenditure Onerous provisions (1,729) ‐
Included within net foreign exchange (loss)/gain Effect of unhedged borrowings
(3) (47,470) ‐
Unrealised foreign exchange gain(4) 42,805 ‐
Foreign exchange loss on the US Notes buy back(5) (13,066) ‐
(17,731) ‐
Included within other income Contingent consideration received on sale of Southern Cross ‐ 1,444
Total significant items for continuing operations – pre tax (35,677) (218,195)
Total significant items for continuing operations – post tax (21,248) (219,375)
Discontinued operations
Profit on sale of Gold Ridge(6) 29,554 ‐
Foreign exchange gains 767 ‐
Results from Gold Ridge Mining operations (11,793) (242,890)
Total significant items for discontinued operations – pre tax 18,528 (242,890)
Total significant items for discontinued operations – post tax 18,528 (247,930)
Total significant items – pre tax (17,149) (461,085)
Total significant items – post tax (2,720) (467,305)
*restated to account for discontinued operations in the period.
(1) Impairment losses
During the year, mining ceased at King of the Hills. The impairment amount for the year ended 30 June 2015 represents the impairment of capitalised mine development assets which remained on the balance sheet at the date the decision to cease mining was made.
(2) King of the Hills rehabilitation
During the year, a review was performed on the rehabilitation provision related to the King of the Hills operations. This resulted in an increased cost of $5,896,000.
For
per
sona
l use
onl
y

ST BARBARA LIMITED 30 JUNE 2015
FINANCIAL REPORT
Page 79
Note 9 Significant items (continued)
(3) Effect of unhedged borrowings
The group hedges the foreign exchange exposure of its US dollar functional currency Pacific assets against its US dollar denominated borrowings. Per AASB 121 the ineffective component must be recognised in the Consolidated Income Statement. Additionally, the unrealised foreign exchange movement on the US dollar denominated borrowings not in a hedging relationship is recognised in the Consolidated Income Statement.
(4) Unrealised foreign exchange gains.
The movement represent the unrealised gains on Australian and US denominated intercompany loans and third party balances reflected within the Consolidated Income Statement per AASB 121.
(5) Foreign exchange loss on the US notes buy back
Represents the foreign exchange loss on the bonds buy back in June 2015 (USD $54,020,000/AUD $70,348,000), previously translated at June 14 year end (AUD $57,282,000) reflecting the devaluation of the AUD against the US Dollar in the year.
(6) Discontinued operations.
The profit on sale of Gold Ridge includes the reversal of the rehabilitation provision previously held (income: $35M), offset by the reversal of balances held within the Foreign Currency Translation Reserve (FCTR) (Expense: $2.7M), and ongoing costs of disposal in the year ($2.7M).
Note 10 Income tax
(a) Income tax expense/ (benefit)
Consolidated
2015 2014*
$'000 $'000
Current tax (benefit)/expense (1,356) (4,923)
Under/(Over) provision in respect of the prior year (623) 705
Deferred income tax expense/(benefit) 3,069 21,742
Total income tax expense/(benefit) for continued and discontinued operations
1,090 17,524
Comprising of:
Income tax expense/(benefit) for continued operations 1,090 12,484
Income tax expense for discontinued operations ‐ 5,040
(b) Numerical reconciliation of income tax expense/(benefit) to prima facie tax payable
Consolidated
2015 2014
$'000 $'000
Profit/(Loss) before income tax benefit 40,772 (483,307)
Tax at the Australian tax rate of 30% 12,232 (144,992) Tax effect of amounts not deductible/(taxable) in calculating taxable income: Legal and other non‐deductible expenditure 77 270
Equity settled share based payments 42 209 Sundry items 1,987 (2,116) Recognition of previously unbooked deferred tax assets (1,321) ‐ Permanent differences on taxable income 882 ‐ Research and development incentive (current year) (2,999) (9,183) Non‐recognition of deferred tax assets relating to impairments ‐ 126,644 Reversal of deferred tax assets relating to Gold Ridge disposal (9,810) ‐ Current year losses not recognised and prior year deferred tax assets ‐ 46,692
Income tax expense/(benefit) 1,090 17,524
For
per
sona
l use
onl
y

ST BARBARA LIMITED 30 JUNE 2015
FINANCIAL REPORT
Page 80
Note 10 Income tax (continued)
Consolidated
(c) Deferred tax balance 2015 2014
$'000 $'000
Deferred tax assets
Tax losses 117,988 159,518
Provisions and accruals 54,490 39,284
Cash flow reserve ‐ 1,407
Investments at fair value 257 249
Tax assets without a carrying amount ‐ 835
Unrealised foreign exchange losses 66,503 ‐
Property plant and equipment 9,304 7,625
Total 248,542 208,918
Tax effect @ 30% 74,563 62,675
Deferred tax liabilities
Accrued income 295 346
Mine properties – exploration 22,113 21,187
Mine properties – development 108,528 139,800
Consumables 38,804 21,721
Capitalised convertible notes costs 4,060 6,296
Investments at fair value ‐ 37
Unrealised foreign exchange gains 28,126 ‐
Total 201,926 189,387
Tax effect @ 30% 60,578 56,816
Net deferred tax balance 13,985 5,859
Consolidated
2015 2014
$'000 $'000
Comprising of:
Australia – net deferred tax assets/(liabilities) 13,985 5,859
Deferred tax assets have not been recognised in respect of the following items:
Tax losses – Pacific Operations 265,246 502,410
Provisions and accruals ‐ 33,348
Investments at fair value 6,293 5,147
Tax assets without a carrying amount 3,709 6,780
Property, plant and equipment 227,300 315,650
Consumables ‐ 21,537
Other ‐ 2,765
Total 502,548 887,637
Tax effect @ 30% 150,764 266,291
For
per
sona
l use
onl
y

ST BARBARA LIMITED 30 JUNE 2015
FINANCIAL REPORT
Page 81
Note 11 Cash and cash equivalents Consolidated 2015 2014
$'000 $'000 Cash at bank and on hand 18,871 68,985 Term deposits 58,000 10,422 76,871 79,407 (a) Cash at bank and on hand Cash at bank at 30 June 2015 invested “at call” was earning interest at an average rate of 2.2% per annum (2014: 2.7% per annum). (b) Term Deposits The deposits at 30 June 2015 were earning interest at rates of between 2.35% and 2.97% per annum (2014: rates of between 3.5% and 3.6% per annum). While term deposits are invested for defined periods, all deposits can be immediately accessed at minimal or no penalty cost. At 30 June 2015, the average time to maturity was 50 days (2014: 69 days), with $nil maturing between 90 to 180 days (2014: $nil) from balance date.
Note 12 Trade and other receivables Consolidated 2013 2014
$'000 $'000 Current assets Trade receivables 3,683 661 Other receivables 2,217 3,072 Restricted cash
(1) 2,084 1,577
Prepayments 1,940 2,568 9,924 7,878
(1) Cash held on deposit with the Commonwealth Bank of Australia secures $98,000 for bank guarantees as at 30 June 2015 (2014: $98,000) and the remaining $1,986,000 (2014: $1,479,000) represents security provided to the National Australia Bank for bank guarantees in favour of various government authorities and service providers.
Information concerning the effective interest rate and credit risk of receivables is set out in Note 3 and Note 15.
Note 13 Inventories Consolidated 2015 2014
$'000 $'000 Consumables 31,952 17,716 Ore stockpiles 8,369 1,241 Gold in circuit 8,517 11,141 Bullion on hand 3,434 7,318 52,272 37,416
(a) Lower of cost and net realisable value
Bullion on hand of $3,434,000 was valued at cost (2014: $7,318,000).
Note 14 Deferred mining costs Consolidated 2015 2014
$'000 $'000 Current Deferred operating mine development 12,829 27,745
Non‐current Deferred operating mine development 4,525 4,235
For
per
sona
l use
onl
y
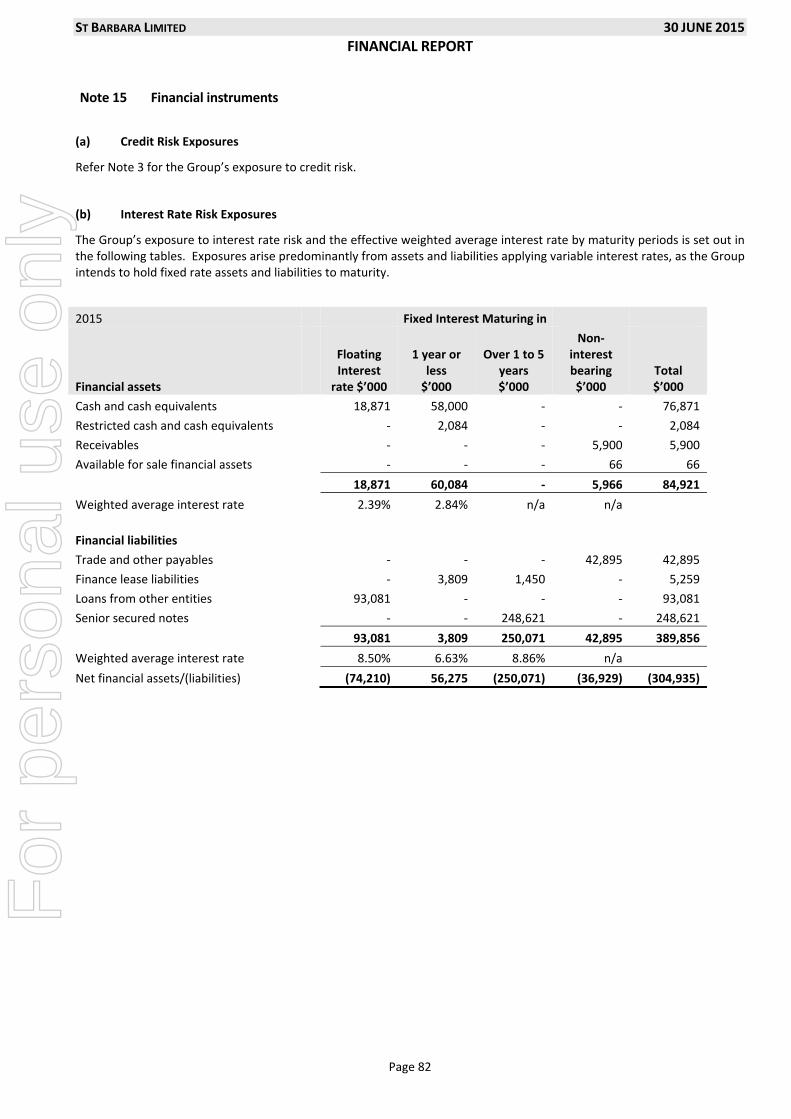
ST BARBARA LIMITED 30 JUNE 2015
FINANCIAL REPORT
Page 82
Note 15 Financial instruments
(a) Credit Risk Exposures
Refer Note 3 for the Group’s exposure to credit risk.
(b) Interest Rate Risk Exposures
The Group’s exposure to interest rate risk and the effective weighted average interest rate by maturity periods is set out in the following tables. Exposures arise predominantly from assets and liabilities applying variable interest rates, as the Group intends to hold fixed rate assets and liabilities to maturity.
2015 Fixed Interest Maturing in
Financial assets
Floating Interest rate $’000
1 year or less $’000
Over 1 to 5 years $’000
Non‐ interest bearing $’000
Total $’000
Cash and cash equivalents 18,871 58,000 ‐ ‐ 76,871
Restricted cash and cash equivalents ‐ 2,084 ‐ ‐ 2,084
Receivables ‐ ‐ ‐ 5,900 5,900
Available for sale financial assets ‐ ‐ ‐ 66 66
18,871 60,084 ‐ 5,966 84,921
Weighted average interest rate 2.39% 2.84% n/a n/a
Financial liabilities
Trade and other payables ‐ ‐ ‐ 42,895 42,895
Finance lease liabilities ‐ 3,809 1,450 ‐ 5,259
Loans from other entities 93,081 ‐ ‐ ‐ 93,081
Senior secured notes ‐ ‐ 248,621 ‐ 248,621
93,081 3,809 250,071 42,895 389,856
Weighted average interest rate 8.50% 6.63% 8.86% n/a
Net financial assets/(liabilities) (74,210) 56,275 (250,071) (36,929) (304,935)
For
per
sona
l use
onl
y

ST BARBARA LIMITED 30 JUNE 2015
FINANCIAL REPORT
Page 83
Note 15 Financial instruments (continued)
(b) Interest Rate Risk Exposures (continued)
2014 Fixed Interest Maturing in
Financial assets
Floating Interest rate $’000
1 year or less $’000
Over 1 to 5 years $’000
Non‐ interest bearing $’000
Total $’000
Cash and cash equivalents 68,985 10,422 ‐ ‐ 79,407
Restricted cash and cash equivalents ‐ 1,577 ‐ ‐ 1,577
Receivables ‐ ‐ ‐ 3,733 3,733
Available for sale financial assets ‐ ‐ ‐ 105 105
68,985 11,999 ‐ 3,838 84,822
Weighted average interest rate 1.51% 3.55% n/a n/a
Financial liabilities
Trade and other payables ‐ ‐ ‐ 58,951 58,951
Finance lease liabilities ‐ 4,301 5,359 179 9,839
Loans from other entities 73,689 ‐ ‐ ‐ 73,689
Senior secured notes ‐ ‐ 256,048 ‐ 256,048
73,689 4,301 261,407 59,130 398,527
Weighted average interest rate 8.50% 6.71% 8.83% n/a
Net financial assets/(liabilities) (4,704) 7,698 (261,407) (55,292) (313,705)
The Group determines fair values of various financial assets and financial liabilities as listed below. a) Fair value of the Group’s financial asset and liabilities that are measured at fair value on a recurring basis: The Group has financial assets and liabilities measured at fair value at the end of each reporting period. The following table gives information about how the fair values of these assets are assessed.
Financial assets/liabilities
Fair value as at Fair Value hierarchy
Valuation technique and key inputs
Significant unobservable input
Relationship of unobservable inputs to fair value 30/06/15 30/06/14
Available for sale financial assets (shares) $66,000 $105,000 Level 1
Quoted bid price in an active market N/A N/A
The Group has senior secured notes and other loans valued at amortised cost, the fair values of which would be determined using models based upon market observable data; a level 2 fair valuation methodology under AASB 13.
For
per
sona
l use
onl
y

ST BARBARA LIMITED 30 JUNE 2015
FINANCIAL REPORT
Page 84
Note 16 Property, plant and equipment Consolidated 2015 2014
$'000 $'000 Non‐current – net written down value Land and buildings 18,100 19,124 Plant and equipment 151,945 134,769 170,045 153,893
Reconciliation of the carrying amounts for each class of property, plant and equipment is set out below: Consolidated 2015 2014 $'000 $'000 Land and buildings At the beginning of the year 19,124 33,137 Additions 140 241 Depreciation (1,829) (2,632) Asset impairments and write downs ‐ (11,450) Effects of movement in foreign exchange rates 665 (172) At the end of the year 18,100 19,124
Plant and equipment At the beginning of the year 134,769 306,724 Additions 24,179 50,465 Disposals (617) (2,082) Depreciation (20,160) (27,003) Amortisation of leased assets ‐ (2,286) Asset impairments and write downs ‐ (191,830) Effects of movement in foreign exchange rates 13,774 781 At the end of the year 151,945 134,769 Total 170,045 153,893
(a) Security
As at 30 June 2015, plant and equipment with a carrying value of $2,701,000 (2014: $3,141,000) was pledged as security for finance leases (Note 20). In accordance with the security arrangements the senior secured notes and loans from RK Mine Finance are secured by the assets of St Barbara Limited; the security does not include the assets of the Pacific operations.
For
per
sona
l use
onl
y

ST BARBARA LIMITED 30 JUNE 2015
FINANCIAL REPORT
Page 85
Note 17 Mine properties Consolidated
2015 2014
Non‐current $'000 $'000
Mine Properties ‐ development
At beginning of the year 257,402 288,936
Direct expenditure 24,706 39,971
Amortisation for the year (61,119) (71,505)
Impairment losses and write downs (9,000) ‐
At end of the year 211,989 257,402
Mineral rights
At the beginning of the year 25,370 209,957
Reallocation of purchase price on business combination ‐ 547
Amortisation (1,963) (5,232)
Impairment losses and write downs ‐ (179,902)
At the end of the year 23,407 25,370
Note 18 Exploration and evaluation Consolidated
2015 2014
Non‐current $'000 $'000
Exploration and evaluation
At beginning of the year 15,036 15,036
Additions 2,241 ‐
Disposals (308) ‐
At end of the year 16,969 15,036
Note 19 Trade and other payables
Consolidated 2015 2014 $'000 $'000 Current Trade payables 41,157 56,597 Other payables 1,738 2,354 42,895 58,951
For
per
sona
l use
onl
y

ST BARBARA LIMITED 30 JUNE 2015
FINANCIAL REPORT
Page 86
Note 20 Interest bearing borrowings
Consolidated 2015 2014
$'000 $'000 Current Secured Lease liabilities (Note 27) 3,809 4,343 Loans from other entities 48,619 19,883 Total current 52,428 24,226
Non‐current Secured Lease liabilities (Note 27) 1,450 5,496 Senior secured notes (net of transaction costs) 248,621 256,048 Loans from other entities 44,462 53,806 Total non‐current 294,533 315,350 Total interest bearing liabilities 346,961 339,576
Interest rate risk exposures
Details of the Group’s exposure to interest rate changes on borrowings are set out in Note 3 and Note 15.
Set‐off of assets and liabilities
The parent entity has established a legal right of set‐off with a financial institution over cash on deposit to secure the issue of bank guarantees for the purpose of performance bonds. At 30 June 2015, restricted cash for this purpose amounted to $2,084,000 (2014: $1,577,000).
Senior secured notes
On 27 March 2013, the Group settled an offering of US$250 million senior secured notes issued in the United States Rule 144A bond market and to certain persons outside the United States. The senior secured notes are due 15 April 2018 with a coupon rate of 8.875% p.a. payable bi‐annually. The notes were issued by St Barbara Limited and are secured by the Group’s Australian assets; the security does not include the assets of the Pacific Operations. In June 2015, Notes with a face value of USD 54,020,000 were bought back. The USD value of the notes outstanding at reporting date is converted to AUD at the AUD/USD exchange rate as at 30 June 2015. The related transaction costs capitalised against the borrowings amounted to $5,467,059 and are being amortised over the period to 15 April 2018.
AUD/USD exchange rate as at 30 June 2015 was 0.7713 (2014: 0.9430). Loans from other entities
In March 2014, SBM executed a US$75 million loan facility with RK Mine Finance. The first tranche of US$52,775,000 was drawn down on 7 March 2014 to settle the Gold Prepayment Facility of US$31,490,000 and to increase the cash position of the Group. The second tranche of US$22,225,000 was drawn down on 30 May 2014. The facility is to be repaid quarterly starting in September 2015. The agreed interest rate for the facility is the 3 month London Interbank Offered Rate (“LIBOR”) plus 7.5% p.a. The LIBOR has a floor of 1%p.a. The facility is secured by the Group’s Australian assets under the existing senior secured notes security trust structure and has priority payment status. The related transaction costs capitalised against the loan amounted to $4,156,718 and are being amortised over the period to 30 June 2017.
For
per
sona
l use
onl
y

ST BARBARA LIMITED 30 JUNE 2015
FINANCIAL REPORT
Page 87
Note 21 Provisions
Consolidated 2015 2014
$'000 $'000 Current Employee benefits – annual leave 3,144 4,153 Employee benefits – long service leave 2,232 2,446 Provision for redundancy payments 194 1,340 Provision for rehabilitation 2,424 1,015 Other provisions 9,019 6,184 17,013 15,138
Consolidated 2015 2014 $'000 $'000
Non‐current Provision for rehabilitation 39,663 62,857 Employee benefits ‐ long service leave 1,452 2,010 Other provisions 4,469 4,002 45,584 68,869
Consolidated
2015 2014
Movements in Provisions $'000 $'000
Rehabilitation
Balance at start of year 63,872 61,096
Unwinding of discount 1,875 3,021
Reduction in net provisions made during the year (1) (23,584) ‐
Provisions used during the year (92) (50)
Effects of movements in the foreign exchange rate 16 (195)
Balance at end of year 42,087 63,872 (1) Represents the elimination of the Gold ridge opening rehabilitation provision ($29.5M), offset by the increase in relation to the King of the Hills underground mine ($5.9M).
For
per
sona
l use
onl
y

ST BARBARA LIMITED 30 JUNE 2015
FINANCIAL REPORT
Page 88
Note 22 Contributed equity
(a) Share capital 2015 2014 2015 2014
Shares Shares $’000 $’000 Ordinary shares ‐ fully paid
(1) 495,102,525 488,074,077 887,216 886,242
(2) The Company does not have par value in respect of its issued shares. All issued shares are fully paid.
(b) Movements in ordinary share capital:
Date Details Number of shares $’000
1 July 2014 Opening balance 488,074,077 886,242
29 Oct 2014 Issue of shares (as part of the 2014 Short Term Incentives scheme) 6,195,115 874
8 Dec 2014 Issue of shares (to the Managing Director and CEO on 8 December 2014 (AGM resolution 4)
833,333 100
30 Jun 2015 Closing balance 495,102,525 887,216
(c) Ordinary shares
Ordinary shares entitle the holder to participate in dividends and the proceeds on winding up of the Company in proportion to the number of and amounts paid on the shares held.
On a show of hands every holder of ordinary shares present at a meeting in person or by proxy, is entitled to one vote, and upon a poll each share is entitled to one vote.
(d) Performance Rights
Information relating to the St Barbara Performance Rights Plan, including details of rights issued, exercised and lapsed during the financial year and outstanding at the end of the financial year, is set out in Note 34.
For
per
sona
l use
onl
y

ST BARBARA LIMITED 30 JUNE 2015
FINANCIAL REPORT
Page 89
Note 23 Reserves and accumulated losses (a) Reserves
Consolidated
2015 2014
$'000 $'000
Reserves
Share based payment reserve 167 437
Investment fair value reserve (144) (138)
Gold hedge and other cash flow reserves ‐ 985
Foreign currency translation reserve (49,459) (18,272)
(49,436) (16,988)
Consolidated
2015 2014
$’000 $’000
Share based payments reserve
Balance at start of year 437 1,141
Option/performance rights expense 139 698
Option/performance rights expired and transferred to retained earnings (409) (1,402)
Balance at end of year 167 437
Investments fair value reserve
Balance at start of year (138) (156)
Fair value adjustment (6) 18
Balance at end of year (144) (138)
Gold cash flow hedge reserve Balance at start of year 985 3,627 Options exercised/expired ‐ (4,771) Gain/(loss) on settlement of the hedge (1,407) 1,407 Tax effect of fair value and other movements 422 722 Balance at end of year ‐ 985
Foreign currency translation reserve
Balance at start of year (18,272) (29,614) Movement during the year (31,187) 11,342
Balance at end of year (49,459) (18,272)
(b) Accumulated losses
Movements in accumulated losses were as follows:
Consolidated
2015 2014
$'000 $'000
Balance at start of year (737,442) (238,013)
Profit/(loss) attributable to members of the Company 39,682 (500,831)
Transferred from share based payment reserve 409 1,402
Balance at end of year
(697,351) (737,442)
For
per
sona
l use
onl
y

ST BARBARA LIMITED 30 JUNE 2015
FINANCIAL REPORT
Page 90
Note 23 Reserves and accumulated losses (continued)
(c) Share based payments reserve
The share based payments reserve is used to recognise the fair value rights issued to executives and employees but not exercised. During the year, $409,000 previously recognised in the share based payment reserve for 461,678 performance rights which expired during the year were transferred as a gain to accumulated losses (2014: gain of $1,402,000 for expired options). Accounting standards preclude the reversal through the income statement of amounts which have been booked in the share based payments reserve for options and rights which expire due to not having met a market based vesting condition.
(d) Gold cash flow hedge reserves
In the prior year, a mark‐to‐market valuation of the Group’s gold bought put options and sold call options (the “collar structure”) was performed. Where the hedge was effective, changes in fair value relating to the intrinsic portion of the valuation were recognised in the gold cash flow hedge reserve. The cashflow reserve balance as at June 2014 represents the amount of the gain from the close out of the gold option collar unamortised during the year. The collar was closed out resulting in a gain, which was deferred to an equity reserve and was fully amortised in FY2015 accordance with the original maturity profile of the collar.
(e) Investment fair value reserve
Subsequent to initial recognition, available‐for‐sale financial assets are measured at fair value and changes therein, other than impairment losses, are recognised as a separate component of equity net of attributable tax. When an asset is derecognised the cumulative gain or loss in equity is transferred to the income statement.
(f) Foreign currency translation reserve
The assets and liabilities of controlled entities incorporated overseas with functional currencies other than Australian dollars are translated into the presentation currency of St Barbara Limited (Australian dollars) at the year‐end exchange rate and the revenue and expenses are translated at the rates applicable at the transaction date. Exchange differences arising on translation are taken directly to the foreign currency translation reserve in equity.
For
per
sona
l use
onl
y

ST BARBARA LIMITED 30 JUNE 2015
FINANCIAL REPORT
Page 91
Note 24 Parent Entity disclosures
As at, and throughout, the financial year ended 30 June 2015, the parent company of the Group was St Barbara Limited.
(a) Financial statements
Parent Entity 2015 2014 $'000 $'000
Results of the parent entity
Loss after tax for the year (40,650) (489,261)
Other comprehensive income (924) (2,642)
Total comprehensive income for the year (41,574) (491,903)
Other comprehensive income is set out in the Consolidated Statement of Comprehensive Income.
Parent Entity
2015 2014
Financial position of the parent entity at year end $'000 $'000
Current assets 104,813 128,833
Total assets 537,272 657,655
Current liabilities 42,815 77,231
Total liabilities 437,199 515,729
Total equity of the parent entity comprising:
Share capital 887,216 886,242
Share based payments reserve 167 435
Investment fair value reserve (148) (148)
Gold cash flow hedge reserve ‐ 985
Accumulated losses (787,162) (745,588)
Total equity 100,073 141,926
(b) Parent entity contingencies
Refer to Note 26 for contingent liabilities which may impact the parent entity. (c) Parent entity guarantees
Refer Note 26 for details of bank guarantees issued by the parent entity.
For
per
sona
l use
onl
y

ST BARBARA LIMITED 30 JUNE 2015
FINANCIAL REPORT
Page 92
Note 25 Remuneration of auditors
During the year the following fees were paid or payable for services provided by the auditor of the parent entity and its related practices:
Consolidated
2015 2014
$ $
(a) Assurance services
Audit and audit related services
KPMG
Audit and review of financial reports 508,925 552,725
Total remuneration for audit and audit related services 508,925 552,725
There were no non‐audit services provided by KPMG to the Group during the year.
Note 26 Contingencies
(a) Contingent liabilities
During July 2014, the Company announced that by operation of its internal reporting mechanisms, the provision of benefits to a foreign public official that may violate its Anti‐Bribery and Anti‐Corruption Policy or applicable laws in Australia or in foreign jurisdictions were identified. The amount of the benefits provided to the foreign public official was not material to the Company. The Company self‐reported the matter to relevant authorities, including the Australian Federal Police, and the matter is being assessed and investigated. To date, there has been no action taken against the Company, consequently, the range of potential penalties, if any, cannot be reliably estimated. Should there be any prosecution, potential penalties are governed by laws in various jurisdictions including Criminal Code 1995 (Cth) in Australia and/or the UK Bribery Act.
(b) Bank guarantees
The Group has negotiated bank guarantees in favour of various government authorities and service providers. The total of these guarantees at 30 June 2015 was $2,084,000 (2014: $1,577,000). Security is provided to the National Australia Bank Limited (“NAB”) (refer to Note 12) for $1,986,000 of this amount in cash deposits. Cash held on deposit with the Commonwealth Bank of Australia secures the remaining $98,000 as at 30 June 2015 (refer to Note 12).
For
per
sona
l use
onl
y

ST BARBARA LIMITED 30 JUNE 2015
FINANCIAL REPORT
Page 93
Note 27 Commitments for expenditure Consolidated
2015 $’000
2014 $’000
Exploration In order to maintain rights of tenure to mining tenements, the Group is committed to tenement rentals and minimum exploration expenditure in terms of the requirements of the relevant state government mining departments in Western Australia, New South Wales and South Australia. This requirement will continue for future years with the amount dependent upon tenement holdings. 4,984 5,675
Consolidated
2015 $’000
2014 $’000
Finance Lease Commitments Payable not later than one year 4,476 5,054 Payable later than one year, not later than five years 1,444 5,492 Payable later than five years ‐ ‐
5,920 10,546 Future finance charges (661) (707)
Total lease liabilities 5,259 9,839
Current (Note 20) 3,809 4,343 Non‐current (Note 20) 1,450 5,496
5,259 9,839
These finance lease commitments relate to vehicles and plant and equipment, and are based on the cost of the assets and are payable over a period of up to 48 months at which point ownership of the assets transfers to the Group.
Consolidated
2015 $’000
2014 $’000
Analysis of Non‐Cancellable Operating Lease Commitments
Payable not later than one year 837 1,651 Payable later than one year, not later than five years 1,094 4,472 Payable later than five years ‐ 203
1,931 6,326
Consolidated
2015 $’000
2014 $’000
Analysis of Non‐Cancellable Operating Sub‐lease receipts
Receivable not later than one year 170 222 Receivable later than one year, not later than five years ‐ 171
170 393
For
per
sona
l use
onl
y

ST BARBARA LIMITED 30 JUNE 2015
FINANCIAL REPORT
Page 94
Note 28 Related party transactions
a) Directors and key management personnel
Disclosures relating to Directors and Key Management Personnel are now included within the Remuneration Report, with the exception of the table below.
Consolidated
2015 $
2014 $
Short term employee benefits 2,188,054 2,515,844
Post‐employment benefits 51,654 90,356
Leave 114,213 242,267
Share‐based payments 83,625 462,370
Termination payments 456,227 452,549
2,893,773 3,763,386
(b) Transactions with entities in the wholly‐owned group
St Barbara Limited is the parent entity in the wholly‐owned group comprising the Company and its wholly‐owned subsidiaries. It is the Group’s policy that transactions are at arm’s length.
During the year the Company charged management fees of $8,095,000 (2014: $10,969,000), operating lease rents of $969,000 (2014: $1,464,000), and interest $15,921,000 (2014: $7,259,000) to entities in the wholly‐owned group.
Net loans payable to the Company amount to a net receivable of $319,914,000 (2014: net receivable $321,282,000).
Balances and transactions between the Company and its subsidiaries, which are related parties of the Company, have been eliminated on consolidation.
(c) Guarantees
Subsidiary companies have guaranteed the parent entity’s obligations under the bank guarantee facilities provided by the National Australia Bank Limited and Commonwealth Bank of Australia.
(d) Terms and conditions
Outstanding balances are unsecured and are repayable in cash on demand.
(e) Amounts receivable from Director related entities
At 30 June 2015, there were no amounts receivable from Director related entities (2014: $ nil).
(f) Other Transactions with Directors of the Company and their Director related entities
During the years ended 30 June 2015 and 30 June 2014, there were no other transactions with Directors of the Company and their Director related entities.
For
per
sona
l use
onl
y

ST BARBARA LIMITED 30 JUNE 2015
FINANCIAL REPORT
Page 95
Note 29 Controlled entities
The consolidated financial statements incorporate the assets, liabilities and results of the following subsidiaries in accordance with the accounting policy in Note 1 Principles of Consolidation.
Country of Incorporation Ownership Interest
Carrying value of Company’s investment
June 2015 %
June 2014 %
June
2015 $’000
June 2014 $’000
Parent entity
St Barbara Limited Australia
Subsidiaries of St Barbara Limited
Australia
Allied Gold Mining Ltd(2) UK 100 100 78,238 78,238
Australian Eagle Oil Co Pty Ltd Australia ‐(3) 100 ‐ 178
Capvern Pty Ltd Australia ‐(3) 100 ‐ ‐
Eagle Group Management Pty Ltd Australia ‐(3) 100 ‐ ‐
Murchison Gold Pty Ltd Australia ‐(3) 100 ‐ ‐
Kingkara Pty Ltd Australia ‐(3) 100 ‐ ‐
Oakjade Pty Ltd Australia ‐(3) 100 ‐ ‐
Regalkey Holdings Pty Ltd Australia ‐(3) 100 ‐ ‐
Silkwest Holdings Pty Ltd Australia ‐(3) 100 ‐ ‐
Sixteenth Ossa Pty Ltd Australia ‐(3) 100 ‐ ‐
Vafitu Pty Ltd Australia ‐(3) 100 ‐ ‐
Zygot Pty Ltd Australia ‐(3) 100 ‐ ‐
Subsidiaries of Allied Gold Mining Ltd
UK
Allied Gold Pty Ltd(5) Australia 100 100 ‐ ‐
Subsidiaries of Allied Gold Pty Ltd
Australia
Advance R&D Pty Ltd(1) Australia 100 100 ‐ ‐
AGL (ASG) Pty Ltd Australia 100 100 ‐ ‐
AGL (SGC) Pty Ltd Australia 100 100 ‐ ‐
Allied Gold Finance Pty Ltd Australia 100 100 ‐ ‐
Allied Gold Services Pty Ltd Australia 100 100 ‐ ‐
Allied Tabar Exploration Pty Ltd Australia 100 100 ‐ ‐
Aretrend Pty Ltd(1) Australia 100 100 ‐ ‐
Australian Solomons Gold Pty Ltd(6) Australia ‐
(4) 100 ‐ ‐
Nord Pacific Limited Canada 100 100 ‐ ‐
(1) Non operating. (2) Converted from Allied Gold Mining Plc to Allied Gold Mining Limited on 30 August 2012. (3) Deregistered 9 February 2015.
(4) Sold 6 May 2015. (5) Converted from Allied Gold Ltd to Allied Gold Pty Ltd on 1 August 2014. (6) Converted from Australian Solomons Gold Ltd to Australian Solomons Gold Pty Ltd on 1 August 2014.
For
per
sona
l use
onl
y

ST BARBARA LIMITED 30 JUNE 2015
FINANCIAL REPORT
Page 96
Note 29 Controlled entities (continued) Country of
Incorporation Ownership Interest Carrying value of
company’s investment
June 2015 %
June 2014 %
June
2015 $’000
June 2014 $’000
Subsidiaries of AGL (SGC) Pty Ltd Australia
Compania Minera Nord Pacific De Mexico, S.A. DE C.V.
(4)
Mexico 100 100 ‐ ‐
Subsidiaries of Allied Tabar Exploration Pty Ltd
Australia
Tabar Exploration Company Ltd PNG 100 100 ‐ ‐
Subsidiaries of Australian Solomons Gold Pty Limited
Australia
JV Mine (Australia) Pty Ltd Australia ‐(3) 100 ‐ ‐
Subsidiaries of Nord Pacific Limited
Canada
Nord Australex Nominees (PNG) Ltd PNG 100 100 ‐ ‐
Simberi Gold Company Limited PNG 100 100 ‐ ‐
Subsidiaries of JV Mine (Australia) Pty Ltd
Australia
Solomon Islands International Pty Ltd Australia ‐(3) 100 ‐ ‐
Subsidiaries of Solomon Islands International Pty Ltd
Australia
ASG Solomon Islands Ltd Solomon Islands ‐(3) 100
(1) ‐ ‐
Subsidiaries of ASG Solomon Islands Ltd
Solomon Islands
Gold Ridge Mining Ltd Solomon Islands ‐(3) 100
(2) ‐ ‐
(1) 175,762,501 shares held by Solomon Islands International Pty Ltd. 1 share held by JV Mine (Australia)Pty Ltd. (2) 175,762,501 shares held by ASG Solomon Island Ltd. 74,443,511 shares held by Australian Solomons Gold Ltd. 1 share held by Solomon Islands
International Pty Ltd.
(3) Sold 6 May 2015. (4) 49,999 shares held by AGL (SGC) Pty Ltd. 1 share held by AGL (ASG) Pty Ltd. Liquidation pending.
Note 30 Events occurring after the balance sheet date
The Directors are not aware of any matter or circumstance that has arisen since the end of the financial year that, in their opinion, has significantly affected or may significantly affect in future years the Company’s or the Group’s operations, the results of those operations or the state of affairs, except as described in this note:
On 20 August 2015, the Group announced the sale of its King of the Hills mine and Kailis resource to Saracen Metals Pty Ltd (a wholly owned subsidiary of Saracen Mineral Holdings Ltd) subject to various third party consents and Australian government approvals. Consideration for the sale is $3 million, with $0.3 million payable on completion and the balance due on the earlier of commercial production of ore from Kailis or four years from completion of the sale. The present value of the deferred settlement of $2.7 million is $2.3 million. Completion of the sale is expected to occur by the end of October 2015. On completion of the sale the rehabilitation provision of $13.9 million relating to King of the Hills and Kailis will be reversed to the Income Statement.
For
per
sona
l use
onl
y

ST BARBARA LIMITED 30 JUNE 2015
FINANCIAL REPORT
Page 97
Note 31 Reconciliation of loss after income tax to net cash flows from operating activities
Consolidated
2015 2014
$’000 $’000
Profit/(loss) after tax for the year 39,682 (500,831)
Depreciation and amortisation 85,071 108,691
Rehabilitation provision 5,896 ‐
Asset impairments and write downs 11,425 410,556
Income tax expense/(benefit) 1,090 17,524
Net loss on sale of property, plant and equipment 513 742
Discontinued operations non‐cash expenses (14,611) ‐
Contingent consideration received on sale of Southern Cross ‐ (1,444)
Fair value movement in gold prepayment facility ‐ 10,800
Net realised/unrealised gain on gold derivative fair value movements (1,407) (2,832)
Unwinding of rehabilitation provision 1,875 3,021
Onerous provision written back ‐ (6,840)
Net finance costs amortised 6,915 3,169
Unrealised/realised foreign exchange gain 15,350 (1,810)
Equity settled share‐based payments 139 698
Change in operating assets and liabilities
Decrease/(increase) in receivables and prepayments (1,539) 4,902
Decrease/(increase) in inventories (14,856) 2,237
(Increase)/decrease in other assets 14,933 (1,405)
(Decrease)/increase in trade creditors and payables (16,056) (29,707)
Increase/(Decrease) in provisions (21,219) 2,789
Net cash flows from operating activities 113,201 20,260
Note 32 Non‐cash investing and financing activities Consolidated 2015 2014 $'000 $'000
Acquisition of vehicles and equipment through finance leases 577 2,474
For
per
sona
l use
onl
y

ST BARBARA LIMITED 30 JUNE 2015
FINANCIAL REPORT
Page 98
Note 33 Earnings per share Consolidated 2015 2014*
Cents Cents (a) Basic earnings per share
Continued operations 4.29 (51.82) Discontinued operations 3.76 (50.79) Continued and discontinued operations 8.05 (102.61)
(b) Diluted earnings per share
Continued operations 4.18 (51.82) Discontinued operations 3.65 (50.79) Continued and discontinued operations 7.83 (102.61)
(c) Reconciliation of earnings used in calculating earnings per share
Consolidated 2015 2014* $'000 $'000 Basic and diluted earnings per share: Profit/(loss) after tax for the year ‐ continuing operations 21,154 (252,901)
Profit/(loss) after tax for the year – including discontinued operations
39,682
(500,831)
(d) Weighted average number of shares
Consolidated 2015 2014 Number Number Weighted average number of ordinary shares used as the denominator in calculating basic earnings per share 492,700,478 488,074,077
Weighted average number of ordinary shares and potential ordinary shares used
as the denominator in calculating diluted earnings per share(i) 506,563,634 488,074,077
(i) Performance rights Performance rights granted to employees under the St Barbara Performance Rights Plan are considered to be potential ordinary shares and are included in the determination of diluted earnings per share to the extent to which they are dilutive. The rights are not included in the determination of basic earnings per share. Details relating to the rights are set out in Note 34.
*restated to account for discontinued operations in the period.
For
per
sona
l use
onl
y

ST BARBARA LIMITED 30 JUNE 2015
FINANCIAL REPORT
Page 99
Note 34 Share‐based payments
(a) Employee Option Plan
The establishment of the St Barbara Limited Employee Option Plan was approved by shareholders at the 2001 Annual General Meeting. Options were granted as part of an employee’s total remuneration package. Options were granted for a three to five year period. Commencing with the 2011 financial year long term incentives were granted in the form of Performance rights.
During the year ended 30 June 2015 no options (2014: nil) were granted.
(b) Employee Performance Rights
During the year ended 30 June 2015, $409,000 (2014: $1,402,000) previously recognised in the share based payment reserve for 461,678 (2014: 1,437,646) performance rights, which expired during the year, were transferred as a gain to accumulated losses. Accounting standards preclude the reversal through the Income Statement for amounts which have been booked in the share based payments reserve for options which satisfy service conditions but do not vest due to market conditions.
Set out below are summaries of performance rights granted to employees under the St Barbara Limited Performance Rights Plan approved by shareholders:
Consolidated and parent entity – 2015
Grant Date Expiry Date Price on issue date
Balance at start of the
year Number
Granted during the
year Number
Exercised during the yearNumber
Expired during the
year Number
(1)
Balance at end of the
year Number
Exercisable at end of the year Number
19 Dec 12 30 Jun 15 $2.09 858,798 ‐ ‐ (858,798) ‐ ‐ 29 Nov 13 30 Jun 16 $0.49 4,609,097 ‐ ‐ (1,700,628) 2,908,469 ‐ 5 Dec 14 30 Jun 17 $0.12 ‐ 18,186,232 ‐ (1,035,030) 17,151,202 ‐
Total 5,467,895 18,186,232 ‐ (3,594,456) 20,059,671 ‐
Weighted average exercise price ‐ ‐ ‐ ‐ ‐ ‐
(1) Includes performance rights, which did not vest due to not meeting performance criteria, or through termination of employment.
Consolidated and parent entity – 2014
Grant Date Expiry Date Price on issue date
Balance at start of the
year Number
Granted during the
year Number
Exercised during the
year Number
Expired during the
year Number
Balance at end of the
year Number
Exercisable at end of the year Number
28 Oct 11 30 Jun 14 $2.23 734,529 ‐ ‐ 734,529 ‐ ‐ 23 Nov 11 30 Jun 14 $2.20 459,621 ‐ ‐ 459,621
(1) ‐ ‐
15 Mar 12 30 Jun 14 $2.09 243,496 ‐ ‐ 243,496(1) ‐ ‐
19 Dec 12 30 Jun 15 $2.09 1,573,697 ‐ ‐ 714,899(2) 858,798 ‐
29 Nov 13 30 Jun 16 $0.49 ‐ 6,092,247 ‐ 1,483,150(2) 4,609,097 ‐
4 Dec 13 30 Jun 16 $0.49 ‐ 1,871,642 ‐ 1,871,642(2) ‐ ‐
Total 3,011,343 7,963,889 ‐ 5,507,337 5,467,895 ‐
Weighted average exercise price ‐ ‐ ‐ ‐ ‐ ‐
(1) Includes performance rights, which did not vest due to not meeting performance criteria, or through termination of employment. (2) Expired due to termination of employment.
F
or p
erso
nal u
se o
nly

ST BARBARA LIMITED 30 JUNE 2015
FINANCIAL REPORT
Page 100
Note 34 Share based payments (continued) The weighted average remaining contractual life of performance rights outstanding at the end of the year was 1.9 years (2014: 1.9 years). The model inputs for rights granted during the year ended 30 June 2015 included:
i. Rights are granted for no consideration. The vesting of rights granted in 2015 is subject to a continuing service condition as at the vesting date, Return on Capital Employed over a three year period, and relative Total Shareholder Return over a three year period measured against a peer group.
ii. Performance rights do not have an exercise price.
iii. Any performance right which does not vest will lapse.
iv. Grant date varies with each issue.
The fair value of rights issued was adjusted according to estimates of the likelihood that the market conditions will be met. A Monte‐Carlo simulation was performed using data at grant date to assist management in estimating the probability of the rights vesting. Refer Note 4 for further details.
As a result of the Monte‐Carlo simulation results, the assessed fair value of rights issued during the year was $1,637,000. This outcome was based on the likelihood of the market condition being met as at the date the rights vest.
(c) Expenses arising from share based payment transactions
Total expenses arising from equity settled share based payment transactions recognised during the year as part of the employee benefit expenses were as follows:
Consolidated 2015 2014
$ $
Options/performance rights issued under employee option plan 139,000 698,000
For
per
sona
l use
onl
y

ST BARBARA LIMITED 30 JUNE 2015
FINANCIAL REPORT
Page 101
Note 35 Discontinued Operations On the 6 May the Group completed the sale of Australian Solomons Gold Limited and its subsidiary companies to a Solomon Islands company associated with local landowners for a nominal purchase price. Australian Solomons Gold Limited is the parent entity of Gold Ridge Mining Limited, which holds the Gold Ridge assets. The parties also signed a Deed of Indemnity and Release as part of the sale in favour of the remaining St Barbara Group companies in respect of the Gold Ridge project. Details of the assets and liabilities disposed of are included within Note 36 and the profit on disposal is incorporated with Note 35. The results of the discontinued operations included in the prior year amounts in the consolidated income statement are set out below.
2015 $’000
2014*$’000
Profit /(Loss) for the period from discontinued operations
Revenue 4,375 71,058
Other income 3,694 7,109
Expenses (19,862) (321,057)
Operating loss before tax (11,793) (242,890)
Foreign exchange gains 767 ‐
Attributable income tax expense ‐ (5,040)
Loss after tax and foreign exchange (11,026) (247,930)
Gain on disposal of operations 29,554 ‐
29,554 ‐
Profit/(loss) for the year from discontinued operations (attributable to owners of the company) 18,528
(247,930)
2015 $’000
2014*$’000
Cash flows from discontinued operations
Net cash outflows from operating activities (13,575) (51,099)
Net cash outflows from investing activities ‐ (9,697)
Net cash outflows (13,575) (60,796)
*restated to account for discontinued operations in the period.
F
or p
erso
nal u
se o
nly
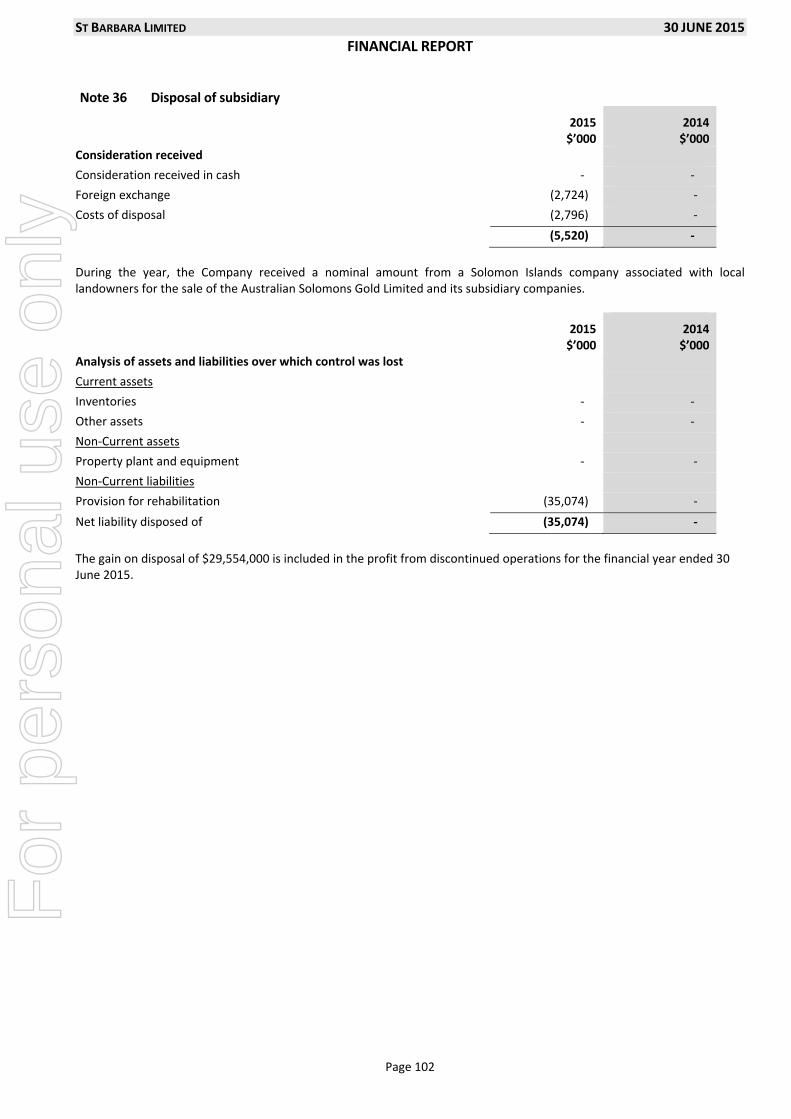
ST BARBARA LIMITED 30 JUNE 2015
FINANCIAL REPORT
Page 102
Note 36 Disposal of subsidiary
2015 $’000
2014$’000
Consideration received
Consideration received in cash ‐ ‐
Foreign exchange (2,724) ‐
Costs of disposal (2,796) ‐
(5,520) ‐
During the year, the Company received a nominal amount from a Solomon Islands company associated with local landowners for the sale of the Australian Solomons Gold Limited and its subsidiary companies.
2015 $’000
2014$’000
Analysis of assets and liabilities over which control was lost
Current assets
Inventories ‐ ‐
Other assets ‐ ‐
Non‐Current assets
Property plant and equipment ‐ ‐
Non‐Current liabilities
Provision for rehabilitation (35,074) ‐
Net liability disposed of (35,074) ‐
The gain on disposal of $29,554,000 is included in the profit from discontinued operations for the financial year ended 30 June 2015.
For
per
sona
l use
onl
y

ST BARBARA LIMITED 30 JUNE 2015
FINANCIAL REPORT
Page 103
DIRECTORS’ DECLARATION
1 In the opinion of the directors of St Barbara Limited (the Company):
(a) the consolidated financial statements and notes that are contained in pages 40 to 102 and the Remuneration report in the Directors’ report, set out on pages 21 to 36, are in accordance with the Corporations Act 2001, including:
(i) giving a true and fair view of the Group’s financial position as at 30 June 2015 and of its performance for the financial year ended on that date; and
(ii) complying with Australian Accounting Standards and the Corporations Regulations 2001; and
(b) there are reasonable grounds to believe that the Company will be able to pay its debts as and when they become due and payable.
2 The directors have been given the declarations required by Section 295A of the Corporations Act 2001 from the chief executive officer and chief financial officer for the financial year ended 30 June 2015.
3 The directors draw attention to Note 1.1 to the financial statements, which include a statement of compliance with International Financial Reporting Standards.
Signed in accordance with a resolution of the directors:
Bob Vassie
Managing Director and CEO
Melbourne 25 August 2015
For
per
sona
l use
onl
y
ST BARBARA LIMITED 30 JUNE 2015
Page 104
INDEPENDENT AUDIT REPORT Set text colour to white after inserting the audit report Two pages are required for the audit report
For
per
sona
l use
onl
y

ST BARBARA LIMITED 30 JUNE 2015
Page 105
INDEPENDENT AUDIT REPORT Set text colour to white after inserting the audit report Two pages are required for the audit report
For
per
sona
l use
onl
y

ST BARBARA LIMITED 30 JUNE 2015
Ore Reserves and Mineral Resources Statement as at 30 June 2015
Page 106
Overview
˃ Ore Reserves at 30 June 2015 were 46.9 Mt @ 2.7 g/t Au for 4.00 million ounces of contained gold.
˃ Ore Reserves decreased by a net 1.16 million ounces (Moz) from the 30 June 2014 estimate to 4.00 Moz at 30 June 2015.
˃ The reduction in Ore Reserves is primarily due to:
˃ divestment of Gold Ridge Operations (0.67 Moz); and
˃ depletion through mining and processing of stockpiles (0.43 Moz).
˃ The Gwalia ore body remains open at depth, particularly South West Branch lode, with potential within the planned mining interval to add to Mineral Resources in West Lode.
˃ Subsequent to 30 June 2015, the Company announced the sale of its King of the Hills mine and Kailis resource, subject to various third party consents and Australian government approvals. At 30 June 2015, these items had no estimated Ore Reserves, and combined estimated mineral resources of 1.9 Mt @ 4.5 g/t Au for 274,000 ounces of contained gold. Further details are available in the ASX announcement dated 20 August 2015 and Note 30 of the 2015 Financial Report.
Company Summary at 30 June 2015
˃ Total Ore Reserves are estimated at: 46.9 Mt @ 2.7 g/t Au for 4.00 Moz of contained gold, comprising:
˃ Leonora Operations: 7.9 Mt @ 7.5 g/t Au for 1.90 Moz of contained gold
˃ Simberi Operations: 39.0 Mt @ 1.7 g/t Au for 2.10 Moz of contained gold
˃ Total Mineral Resources1 are estimated at: 140.8 Mt @ 2.0 g/t Au for 9.22 Moz of contained gold, comprising:
˃ Leonora Operations: 19.9 Mt @ 6.6 g/t Au for 4.20 Moz of contained gold
˃ Simberi Operations: 120.9 Mt @ 1.3 g/t Au for 5.02 Moz of contained gold
The 30 June 2015 Ore Reserves and Mineral Resources Statements released to the ASX on 25 August 2015 follow.
1 Mineral Resources are reported inclusive of Ore Reserves
For
per
sona
l use
onl
y

ST BARBARA LIMITED 30 JUNE 2015
Ore Reserves and Mineral Resources Statement as at 30 June 2015
Page 107
St Barbara's Mineral Resource and Ore Reserve position as at 30 June 2015 is summarised and compared with the 2014
statement in Table 1.
Region
2014 Ore Reserves 2015 Depletion1 2015 Ore Reserves
Tonnes
(‘000) Grade (g/t)
Ounces
(‘000) Ounces (‘000)
Tonnes
(‘000) Grade (g/t)
Ounces
(‘000)
Leonora (WA)
˃ Gwalia 7,277 8.2 1,914 260 5,290 9.4 1,594
˃ Tower Hill 2,572 3.7 306 ‐ 2,572 3.7 306
˃ King of the Hills2 449 4.4 63 60 ‐ ‐ ‐
Total Leonora 10,298 6.9 2,283 320 7,862 7.5 1,900
Simberi, (PNG) 44,170 1.6 2,209 106 38,999 1.7 2,103
Gold Ridge, (SI) 14,617 1.4 673 0 0 0 0
Grand Total 69,085 2.3 5,165 426 46,861 2.7 4,003
Region
2014 Mineral Resource
2015 Mineral Resource
Tonnes
(‘000) Grade (g/t)
Ounces
(‘000)
Tonnes
(‘000) Grade (g/t)
Ounces
(‘000)
Leonora, (WA)
˃ Gwalia 14,143 7.9 3,589 12,929 7.9 3,304
˃ Tower Hill 5,093 3.8 625 5,093 3.8 625
˃ King of the Hills2 1,286 6.7 279 870 6.1 170
˃ Kailis2 1,075 3.3 114 1,027 3.1 104
Total Leonora 21,597 6.6 4,607 19,919 6.6 4,203
Simberi, (PNG) 123,629 1.4 5,380 120,894 1.3 5,020
Gold Ridge, (SI) 64,162 1.5 3,175 0 0 0
Grand Total 209,390 2.0 13,161 140,812 2.0 9,223
Table 1: St Barbara 2014 and 2015 Ore Reserve and Mineral Resource Summary
Data is rounded to thousands of tonnes and thousands of ounces. Discrepancies in totals may occur due to rounding.
The reduction in the company’s Ore Reserves of 1,162 koz comprises (Figure 1):
Divestment of the Gold Ridge Operations (‐673 koz);
Depletion through mining and processing of stockpiles (‐426 koz);
Revised geological models for the Gwalia Mine and associated design changes (‐60 koz) ; and
Closure of the King of the Hills Mine2 (‐3 koz).
The reduction in the company’s Mineral Resources of 3,938 koz comprises (Figure 2):
Divestment of the Gold Ridge Operations (‐3,175 koz);
Depletion through mining and processing of stockpiles (‐426 koz);
Sterilisation of non‐recoverable resources at Gwalia and King of the Hills (‐80 koz);
Revised geological models for Leonora Operations (‐4koz) ; and
Revised geological models for Simberi Operations (‐254 koz).
1 Depletion through mining and processing of stockpiles 2 Sale of King of the Hills mine and Kailis resource announced 20 August 2015, refer corresponding ASX announcement for details
For
per
sona
l use
onl
y

ST BARBARA LIMITED 30 JUNE 2015
Ore Reserves and Mineral Resources Statement as at 30 June 2015
Page 108
Note: Closing balance includes 274 koz attributed to King of the Hills and Kailis, which the Company announced on
20 August 2015 were subject to a sale agreement, refer to the corresponding ASX announcement for details
Figure 1: Summary Movement in Ore Reserve between FY14 and FY15
Figure 2: Summary Movement in Mineral Resource between FY14 and FY15
9,223‐3,175‐426 ‐80 ‐4
‐254
13,161
0
2,000
4,000
6,000
8,000
10,000
12,000
14,000
June2014
Divestment of GoldRidge Operations
Depletion throughmining and
processing ofstockpiles
Sterilisation of non-recoverable
resources at Gwaliaand King of the Hills
Revised geologicalmodels for Leonora
Operations
Revised geologicalmodels for Simberi
Operations
June2015
koz
4,003‐673
‐426‐60 ‐3
5,165
0
1,000
2,000
3,000
4,000
5,000
6,000
June2014
Divestment of Gold RidgeOperation
Depletion through miningand processing of
stockpiles
Design changes King of the Hills Closure June2015
koz
For
per
sona
l use
onl
y
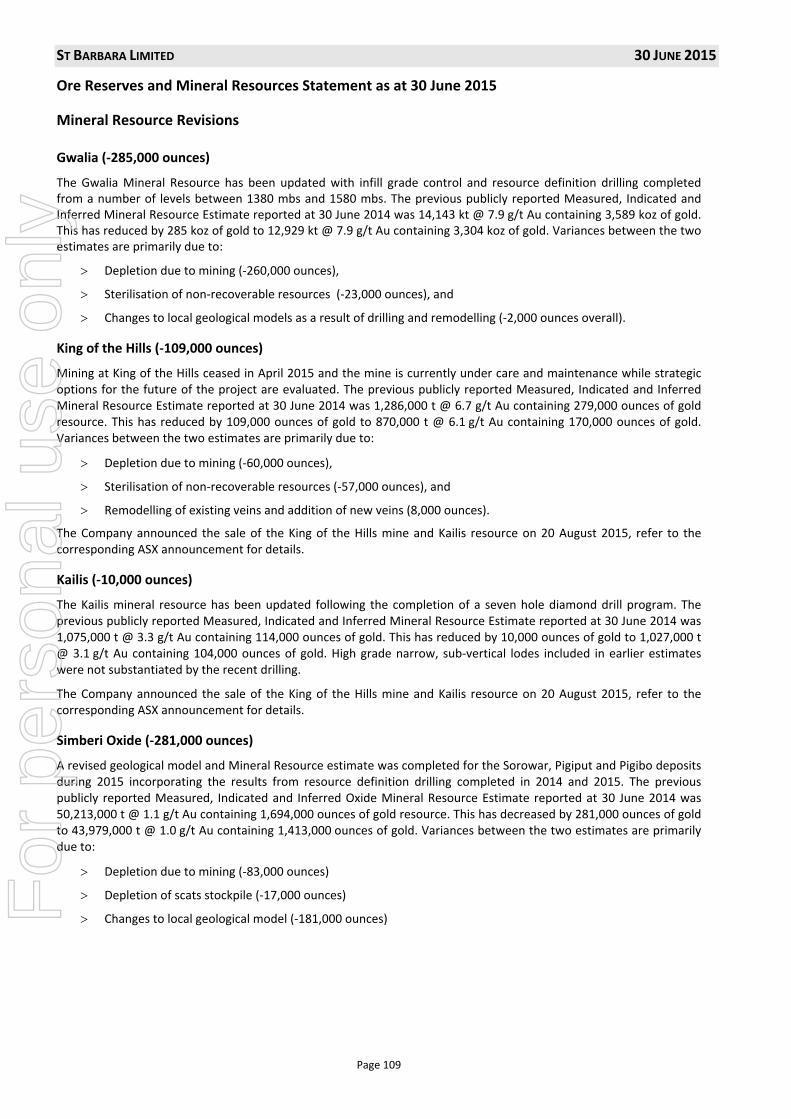
ST BARBARA LIMITED 30 JUNE 2015
Ore Reserves and Mineral Resources Statement as at 30 June 2015
Page 109
Mineral Resource Revisions
Gwalia (‐285,000 ounces)
The Gwalia Mineral Resource has been updated with infill grade control and resource definition drilling completed from a number of levels between 1380 mbs and 1580 mbs. The previous publicly reported Measured, Indicated and Inferred Mineral Resource Estimate reported at 30 June 2014 was 14,143 kt @ 7.9 g/t Au containing 3,589 koz of gold. This has reduced by 285 koz of gold to 12,929 kt @ 7.9 g/t Au containing 3,304 koz of gold. Variances between the two estimates are primarily due to:
Depletion due to mining (‐260,000 ounces),
Sterilisation of non‐recoverable resources (‐23,000 ounces), and
Changes to local geological models as a result of drilling and remodelling (‐2,000 ounces overall).
King of the Hills (‐109,000 ounces)
Mining at King of the Hills ceased in April 2015 and the mine is currently under care and maintenance while strategic options for the future of the project are evaluated. The previous publicly reported Measured, Indicated and Inferred Mineral Resource Estimate reported at 30 June 2014 was 1,286,000 t @ 6.7 g/t Au containing 279,000 ounces of gold resource. This has reduced by 109,000 ounces of gold to 870,000 t @ 6.1 g/t Au containing 170,000 ounces of gold. Variances between the two estimates are primarily due to:
Depletion due to mining (‐60,000 ounces),
Sterilisation of non‐recoverable resources (‐57,000 ounces), and
Remodelling of existing veins and addition of new veins (8,000 ounces).
The Company announced the sale of the King of the Hills mine and Kailis resource on 20 August 2015, refer to the corresponding ASX announcement for details.
Kailis (‐10,000 ounces)
The Kailis mineral resource has been updated following the completion of a seven hole diamond drill program. The previous publicly reported Measured, Indicated and Inferred Mineral Resource Estimate reported at 30 June 2014 was 1,075,000 t @ 3.3 g/t Au containing 114,000 ounces of gold. This has reduced by 10,000 ounces of gold to 1,027,000 t @ 3.1 g/t Au containing 104,000 ounces of gold. High grade narrow, sub‐vertical lodes included in earlier estimates were not substantiated by the recent drilling.
The Company announced the sale of the King of the Hills mine and Kailis resource on 20 August 2015, refer to the corresponding ASX announcement for details.
Simberi Oxide (‐281,000 ounces)
A revised geological model and Mineral Resource estimate was completed for the Sorowar, Pigiput and Pigibo deposits during 2015 incorporating the results from resource definition drilling completed in 2014 and 2015. The previous publicly reported Measured, Indicated and Inferred Oxide Mineral Resource Estimate reported at 30 June 2014 was 50,213,000 t @ 1.1 g/t Au containing 1,694,000 ounces of gold resource. This has decreased by 281,000 ounces of gold to 43,979,000 t @ 1.0 g/t Au containing 1,413,000 ounces of gold. Variances between the two estimates are primarily due to:
Depletion due to mining (‐83,000 ounces)
Depletion of scats stockpile (‐17,000 ounces)
Changes to local geological model (‐181,000 ounces)
For
per
sona
l use
onl
y

ST BARBARA LIMITED 30 JUNE 2015
Ore Reserves and Mineral Resources Statement as at 30 June 2015
Page 110
Simberi Sulphide (‐79,000 ounces)
The previous publicly reported Measured, Indicated and Inferred Sulphide Mineral Resource Estimate reported at 30 June 2014 was 73,416,000 t @ 1.6 g/t Au containing 3,686,000 ounces of gold resource. This has decreased by 79,000 ounces of gold to 76,914,000 t @ 1.5 g/t Au containing 3,607,000 ounces of gold. Variances between the two estimates are primarily due to:
Depletion due to mining (‐6,000 ounces)
Changes to local geological model (‐73,000 ounces)
Gold Ridge (‐3,175,000 ounces)
The Gold Ridge Project was sold in May 2015 to a Solomon Islands company, Goldridge Comminity (sic) Investment Limited (GCIL).
For
per
sona
l use
onl
y

ST BARBARA LIMITED 30 JUNE 2015
Ore Reserves and Mineral Resources Statement as at 30 June 2015
Page 111
Ore Reserve Revisions
Gwalia (‐320,000 ounces)
The previous publicly reported Proved and Probable Ore Reserve Estimate reported at 30 June 2014 was 7,277 kt @ 8.2 g/t Au containing 1,914 koz of gold. This has reduced by 320 koz of gold to 5,290 kt @ 9.4 g/t Au containing 1,594 koz of gold. Variances between the two estimates are primarily due to:
Depletion due to mining (‐260,000 ounces),
Local changes to geological models which have in turn impacted local design and modifying factors (‐104,000 ounces), and
Improved confidence in local (stope) estimates of gold grade due to additional drilling which has reduced the impact of grade softening factors (+45,000 ounces)
King of the Hills (‐63,000 ounces)
Mining at King of the Hills ceased in April 2015 and the mine is currently under care and maintenance while strategic options for the future of the project are evaluated. The previous publicly reported Probable Ore Reserve Estimate reported at 30 June 2014 was 449 kt @ 4.4 g/t Au containing 63 koz of gold, which has now been mined out. The Company announced the sale of the King of the Hills mine and Kailis resource on 20 August 2015, refer to the corresponding ASX announcement for details.
Simberi (‐106,000 ounces)
The previous publicly reported Proved and Probable Ore Reserve Estimate reported at 30 June 2014 was 44,170 kt @ 1.6 g/t Au containing 2,209 koz of gold. This has reduced by 106 koz of gold to 38,999 kt @ 1.7 g/t Au containing 2,103 koz of gold. Variances between the two estimates are primarily due to depletion through mining and processing of stockpiles.
Simberi is currently subject to a pre‐feasibility study examining sulphide treatment options and how to better integrate oxide and sulphide transition. This study is expected to be complete by the end of H1 FY16.
Gold Ridge (‐673,000 ounces)
The Gold Ridge Project was sold in May 2015 to a Solomon Islands company, Goldridge Comminity (sic) Investment Limited (GCIL).
For
per
sona
l use
onl
y

ST BARBARA LIMITED 30 JUNE 2015
Ore Reserves Statement as at 30 June 2015
Page 112
Project
Proved Probable Total
Tonnes (k) Au g/t koz Tonnes (k) Au g/t koz Tonnes (k) Au g/t koz
Gwalia (WA) 2,100 9.1 614 3,190 9.6 980 5,290 9.4 1,594
Tower Hill (WA) ‐ ‐ ‐ 2,572 3.7 306 2,572 3.7 306
Simberi Oxide (PNG) 3,800 1.5 178 15,317 1.3 660 19,117 1.3 818
Simberi Sulphide (PNG) 704 1.1 24 19,178 2.0 1,261 19,882 2.0 1,285
Total All Projects 6,604 3.8 816 21,079 17 3,207 46,861 2.7 4,003
Notes
1. Ore Reserves are based on a gold price of A$1,250/oz.
2. Mineral Resources are reported inclusive of Ore Reserves.
3. Data is rounded to thousands of tonnes and thousands of ounces. Discrepancies in totals may occur due to rounding.
4. Details relating to each of the estimates are contained in the 2015 Annual Mineral Resource and Ore Reserve Report at www.stbarbara.com.au/exploration/Ore‐Reserves‐mineral‐resources/
5. The Competent Person, Mr John de Vries was entitled to participate in St Barbara’s long term incentive plan, details of which are included in the 2014 Annual Report and Notice of 2014 Annual General Meeting released to the ASX on 17 October 2014. In 2012 and 2013 an increase in Ore Reserves was a performance measure.
JORC Code Compliance Statement
The information in this report that relates to Ore Reserves is based on information compiled by Mr John de Vries, who is a Member of the Australasian Institute of Mining and Metallurgy. Mr de Vries was a full‐time employee of St Barbara Ltd at the time this report was compiled and has sufficient experience relevant to the style of mineralisation and type of deposit under consideration and to the activity which he is undertaking to qualify as a Competent Person as defined in the 2012 Edition of the “Australasian Code for Reporting of Exploration Results, Mineral Resources and Ore Reserves”.
Mr de Vries consents to the inclusion in the statement of the matters based on his information in the form and context in which it appears.
For
per
sona
l use
onl
y

ST BARBARA LIM
ITED
30 JUNE 2015
Mineral R
esources Statement as at 30 June 2015
Page 113
Notes
1.
Mineral Resources are rep
orted
inclusive of Ore Reserves
2.
Cut‐off Grades Leo
nora: Gwalia Deeps (2.5 g/t Au), King of The Hills (3.0 g/t Au), Tower Hill (2.5 g/t Au), Kailis (0.8 g/t Au),Simberi O
xide (0.4 g/t Au), Sim
beri Sulphide
(0.6 g/t Au)
3.
Data is rounded
to thousands of tonnes and thousands of ounces. Discrep
ancies in
totals m
ay occur due to rounding.
4.
Details relating to each of the estimates are contained
in the 2015 Annual M
ineral Resource and Ore Reserve Rep
ort at www.stbarbara.com.au/exploration/O
re‐
Reserves‐mineral‐resources/
5.
Sale of King of the Hills mine and Kailis resource announced 20 August 2015, refer corresponding ASX
announcemen
t for details.
JORC Code Compliance Statement
The inform
ation in
this rep
ort that relates to M
ineral Resources is based
on in
form
ation compiled by Ms Jane Batem
an, who is a M
ember of the Australasian
Institute of
Mining and M
etallurgy. M
s Batem
an is a full‐time em
ployee of St Barbara Ltd and has sufficient experience relevant to the style of mineralisation and type of dep
osit
under consideration and to the activity which she is undertaking to qualify as a Competen
t Person as defined
in the 2012 Edition of the “Australasian
Code for Rep
orting
of Exploration Results, M
ineral Resources and Ore Reserves”.
Ms Batem
an consents to the inclusion in
the statem
ent of the matters based
on her inform
ation in
the form
and context in
which it appears.
Project
Measured
Indicated
Inferred
Total
Tonnes (k)
Au g/t
koz
Tonnes (k)
Au g/t
koz
Tonnes (k)
Au g/t
koz
Tonnes (k)
Au g/t
koz
Gwalia (WA)
4,781
7.2
1,112
6,112
9.3
1,833
2,036
5.5
359
12,929
7.9
3,304
King of the Hills (W
A)5
‐ ‐
‐799
5.5
142
71
12.3
28
870
6.1
170
Tower Hill (WA)
‐ ‐
‐4,604
3.9
574
489
3.3
51
5,093
3.8
625
Kailis (WA)5
‐ ‐
‐997
3.1
99
30
5.1
51,027
3.1
104
Simberi O
xide (PNG)
7,986
1.1
271
28,065
1.0
889
7,929
1.0
253
43,979
1.0
1,413
Simberi Sulphide (PNG)
1,379
1.0
48
49,424
1.6
2,531
26,110
1.2
1,028
76,914
1.5
3,607
Total A
ll Projects
14,146
3.1
1,430
90,002
2.1
6,069
36,665
1.5
1,724
140,812
2.0
9,223
For
per
sona
l use
onl
y

ST BARBARA LIMITED 30 SEPTEMBER 2015
Shareholder Information
Page 114
Twenty Largest Shareholders
Ordinary fully paid shares as at 30 September 2015
Rank Name Units % of Units
1. J P MORGAN NOMINEES AUSTRALIA LIMITED 141,491,271 28.58
2. HSBC CUSTODY NOMINEES (AUSTRALIA) LIMITED 115,983,872 23.43
3. NATIONAL NOMINEES LIMITED 57,024,200 11.52
4. CITICORP NOMINEES PTY LIMITED 34,596,270 6.99
5. SANDHURST TRUSTEES LTD <JMFG CONSOL A/C> 4,381,289 0.88
6. HSBC CUSTODY NOMINEES (AUSTRALIA) LIMITED ‐ A/C 3 4,051,308 0.82
7. MR PASQUALE BEVILACQUA + MRS MARIA CARMELA BEVILACQUA 4,000,000 0.81
8. BNP PARIBAS NOMS PTY LTD <DRP> 3,155,752 0.64
9. BRISPOT NOMINEES PTY LTD <HOUSE HEAD NOMINEE NO 1 A/C> 2,953,475 0.60
10. HSBC CUSTODY NOMINEES (AUSTRALIA) LIMITED‐GSCO ECA 2,578,888 0.52
11. NORTHCLIFFE HOLDINGS PTY LTD <NORTHCLIFFE HOLDINGS A/C> 2,200,686 0.44
12. CS FOURTH NOMINEES PTY LTD 1,979,732 0.40
13. CITICORP NOMINEES PTY LIMITED <COLONIAL FIRST STATE INV A/C> 1,397,846 0.28
14. DR JANET DAWN KENCIAN 1,300,000 0.26
15. MR ANTHONY WOOLLEY <WOOLLEY KENCIAN S/FUND A/C> 1,300,000 0.26
16. KEMBLA NO 20 PTY LTD <J SHUSTER RET PLAN A/C> 1,100,000 0.22
17. COLIN WISE CONSULTING PTY LTD <SUPERFUND ACCUM A/C> 1,035,875 0.21
18. NAPLA PTY LTD 976,089 0.20
19. MRS CAROLINE JOY VASSIE 935,720 0.19
20. NORTHWEST ACCOUNTING PTY LTD <PUUTU KUNTI KURRAMA AND PINIKU> 934,657 0.19
Total top 20 holders of ordinary fully paid shares 383,376,930 77.43
Total remaining holders balance 111,725,595 22.57
For
per
sona
l use
onl
y

ST BARBARA LIMITED 30 SEPTEMBER 2015
Shareholder Information
Page 115
Distribution of Shareholdings
Ordinary fully paid shares as at 30 September 2015
Range Total Holders Shares % of Issued
Capital
1 – 1,000 3,773 1,557,097 0.31
1,001 – 5,000 3,580 8,945,578 1.81
5,001 – 10,000 1,078 8,185,062 1.65
10,001 – 100,000 1,354 42,102,820 8.50
100,001 and over 221 434,311,968 87.72
Total 10,006 495,102,525 100.00
Unmarketable Parcels
Ordinary fully paid shares as at 30 September 2015
Total Holders Shares
Minimum Parcel Size
Minimum $500.00 parcel at $1.05 per unit 2,264 428,995 477
Substantial Shareholders
Ordinary fully paid shares as at 30 September 2015
Name Shares % of Shares
Hunter Hall Investment Management Ltd 74,265,378 15.0%
M&G Investment Management Ltd 56,940,337 11.5%
Franklin Resources Inc 32,521,607 6.6%
For
per
sona
l use
onl
y

BOARD OF DIRECTORS T C Netscher Non‐Executive Chairman R S Vassie Managing Director & CEO K J Gleeson Non‐Executive Director D E J Moroney Non‐Executive Director
SHARE REGISTRY Computershare Investment Services Pty Ltd GPO Box 2975 Melbourne Victoria 3001 Australia Telephone (within Australia): 1300 653 935 Telephone (international): +61 3 9415 4356 Facsimile: +61 3 9473 2500
COMPANY SECRETARY R R Cole
REGISTERED OFFICE Level 10, 432 St Kilda Road Melbourne Victoria 3004 Australia Telephone: +61 3 8660 1900 Facsimile: +61 3 8660 1999 Email: [email protected] Website: www.stbarbara.com.au
AUDITOR KPMG 147 Collins Street Melbourne Victoria 3000 Australia
STOCK EXCHANGE LISTING Shares in St Barbara Limited are quoted on the Australian Securities Exchange, Ticker Symbol: SBM
ABN 36 009 165 066
For
per
sona
l use
onl
y

ABN 36 009 165 066
Level 10, 432 St Kilda Road, Melbourne VIC 3004
Locked Bag 9, Collins Street East VIC 8003
TELEPHONE + 61 3 8660 1900 FACSIMILE + 61 3 8660 1999
Notice of 2015 Annual General Meeting
The 2015 Annual General Meeting of St Barbara Limited will be held: Date: 27 November 2015
Time: 11:00 am (Melbourne time)
Venue: Royce Conference Room
Royce Hotel
379 St Kilda Road
Melbourne Victoria 3004
Meeting Documentation including:
Notice of Annual General Meeting
Explanatory Memorandum
Proxy Form
The Directors recommend that Shareholders vote FOR Resolutions 1 to 6
For
per
sona
l use
onl
y

For
per
sona
l use
onl
y

ABN 36 009 165 066
Level 10, 432 St Kilda Road, Melbourne VIC 3004
Locked Bag 9, Collins Street East VIC 8003
TELEPHONE + 61 3 8660 1900 FACSIMILE + 61 3 8660 1999
20 October 2015
Dear Shareholder
Annual General Meeting
I am pleased to invite you to the 2015 Annual General Meeting of Shareholders of St Barbara Limited, and hope you will be able to attend in person.
The meeting will be held on Friday 27 November 2015 at 11:00 am (Melbourne time) in the Royce Conference Room, Royce Hotel, 379 St Kilda Road, Melbourne (between Domain and Toorak Roads).
A live audio webcast of the Annual General Meeting will be available on St Barbara’s website at
www.stbarbara.com.au/investors/webcast/. The audio webcast is ‘listen only’ and does not enable questions. The
audio webcast will also be available on the website after the conclusion of the meeting.
The business of the meeting is set out in the enclosed Notice of Annual General Meeting. Details and the
background for each item of business are set out in the accompanying Explanatory Memorandum. Please read this
information carefully.
The Board unanimously recommends that you vote in favour of Resolutions 1 to 6. The background and reasons
for these recommendations are set out in the enclosed Explanatory Memorandum.
If you are not able to personally attend the meeting, details of how you can vote are set out in the enclosed Proxy
Form. Please note that Proxy Forms must be received by mail or fax at the designated address, or online, by no
later than 11:00 am (Melbourne time) on Wednesday, 25 November 2015.
Yours sincerely
Tim Netscher
Non‐Executive Chairman
For
per
sona
l use
onl
y

page 4
Contents
Important Notices .................................................................................................................................................... 5
Key Dates ................................................................................................................................................................. 5
What You Should Do ................................................................................................................................................ 5
Notice of Annual General Meeting .......................................................................................................................... 6
Explanatory Memorandum to Shareholders ........................................................................................................... 9
1. Annual Reports ............................................................................................................................ 9 2. Resolution 1: Adoption of Remuneration Report ....................................................................... 9 3. Resolution 2: Re‐election of Director – Mr Tim Netscher ......................................................... 11 4. Resolution 3: Election of Director – Mr David Moroney ........................................................... 11 5. Resolution 4: Election of Director – Ms Kerry Gleeson ............................................................. 11 6. Resolution 5: Approval of issue of performance rights to Mr Bob Vassie, Managing
Director and Chief Executive Officer ......................................................................................... 12 7. Special Resolution 6: Adoption of a new Constitution .............................................................. 14 8. Definitions ................................................................................................................................. 16
Schedule: Performance rights – Further details .................................................................................................... 17
Proxy Form (separate)
For
per
sona
l use
onl
y

page 5
Important Notices
A copy of this document has been lodged with ASX. ASX and its officers take no responsibility for the contents of this document.
Certain capitalised terms used in this document are defined in Section 8 of the Explanatory Memorandum.
Key Dates
Deadline for receipt of Proxy Forms 11:00am (Melbourne time) on Wednesday 25 November 2015
Date and time for determining eligibility to vote 7:00pm (Melbourne time) on Wednesday 25 November 2015
Date and time of Annual General Meeting 11:00am (Melbourne time) on Friday 27 November 2015
What You Should Do
Step 1 ‐ Read this Meeting Documentation
This is an important document. This Meeting Documentation sets out the business of the Annual General Meeting. Please read this document carefully and, if you are not sure what to do, please consult your legal or financial adviser immediately.
Step 2 ‐ Vote on the Resolutions
Your vote is important.
If you are unable to attend the meeting in person, please complete the Proxy Form that accompanies this Meeting Documentation and return it in the reply paid envelope to the Company’s share registry, Computershare, before Wednesday 25 November 2015 at 11:00am (Melbourne time). Proxy Forms received after this time will not be effective for the scheduled commencement of the Annual General Meeting.
For details on how to complete and lodge the Proxy Form, please refer to the instructions on the Proxy Form.
If you wish to appoint a proxy on the enclosed Proxy Form to vote on your behalf in the manner consistent with the voting recommendations of the Board, mark the “FOR” box for Resolutions as set out in the example below.
Questions
If you have any questions about any matter contained in this Meeting Documentation, please contact Mr Rowan Cole, Company Secretary, at [email protected] or on +61 3 8660 1900.
For
per
sona
l use
onl
y

page 6
St Barbara Limited ABN 36 009 165 066
Notice of Annual General Meeting
Notice is given that the 2015 Annual General Meeting of the Company will be held on Friday 27 November 2015 at 11:00am (Melbourne time) in the Royce Conference Room, Royce Hotel, 379 St Kilda Road, Melbourne, Victoria.
Agenda
1. Annual Reports
To receive and consider the Annual Financial Report of the Company and the reports of the Directors and Auditor for the year ended 30 June 2015.
2. Resolution 1: Adoption of Remuneration Report
To consider and, if thought fit, pass the following as an ordinary resolution:
“That the Remuneration Report for the year ended 30 June 2015 as set out on pages 21 to 36 (inclusive) of the Annual Report be adopted.”
Note – the vote on this resolution is advisory only and does not bind the Directors or the Company.
3. Resolution 2: Re‐election of Director – Mr Tim Netscher
To consider and, if thought fit, pass the following as an ordinary resolution:
“That Mr Tim Netscher, being a Director of the Company who retires pursuant to article 6.3 of the Company’s Constitution, and being eligible, is re‐elected as a Director of the Company.”
4. Resolution 3: Election of Director – Mr David Moroney
To consider and, if thought fit, pass the following as an ordinary resolution:
“That Mr David Moroney, being a Director of the Company who was appointed to the Board since the last annual general meeting and retires pursuant to article 6.3 of the Company’s Constitution, and being eligible, is elected as a Director of the Company.”
5. Resolution 4: Election of Director – Ms Kerry Gleeson
To consider and, if thought fit, pass the following as an ordinary resolution:
“That Ms Kerry Gleeson, being a Director of the Company who was appointed to the Board since the last annual general meeting and retires pursuant to article 6.3 of the Company’s Constitution, and being eligible, is elected as a Director of the Company.”
6. Resolution 5: Approval of issue of performance rights to Mr Robert (Bob) Vassie, Managing Director and Chief Executive Officer
To consider and, if thought fit, pass the following as an ordinary resolution:
“That, for the purposes of ASX Listing Rule 10.14, sections 200B and 200E of the Corporations Act and for all other purposes, in part consideration of his employment as Managing Director and Chief Executive Officer of the Company in respect of the current 2016 financial year, Mr Bob Vassie be issued 1,104,674 performance rights to acquire fully paid ordinary shares in the capital of the Company, on the terms and conditions set out, and approval be given to provide Mr Vassie the benefits described, in the Explanatory Memorandum accompanying the Notice convening this Annual General Meeting.” F
or p
erso
nal u
se o
nly

page 7
7. Special Resolution 6: Adoption of a new Constitution
To consider, and if thought fit, pass the following resolution as a special resolution:
“That the Company adopt as its Constitution the document tabled at the 2015 Annual General Meeting and signed by the Chairman for the purposes of identification, in substitution for, and to the exclusion of, the existing Constitution.”
Explanatory Memorandum
We recommend that you read the Explanatory Memorandum accompanying and forming part of this Notice of Annual General Meeting.
Entitlement to Vote
1. Eligibility
The Board has determined that, for the purposes of voting at the Annual General Meeting, Shareholders are those persons who are the registered holders of Shares on 25 November 2015 at 7:00 pm (Melbourne time).
2. Voting Restrictions
Resolution 1: Adoption of the Remuneration Report
The Remuneration Report identifies the Company's Key Management Personnel for the financial year to 30 June 2015.
Under the Corporations Act, Key Management Personnel (including Directors) of the Company, details of whose remuneration are included in the Remuneration Report, and their closely related parties (as defined in the Corporations Act), (each a Restricted Person), are prohibited from voting on Resolution 1 in any capacity (eg: as a Shareholder, proxy, attorney or corporate representative).
However, the prohibition does not apply if:
a Restricted Person is appointed as a proxy for a Shareholder entitled to vote and the proxy appointment specifies the way the Restricted Person is to vote on the resolution; or
the Chairman has been appointed as a proxy for a Shareholder entitled to vote and the proxy appointment: o does not specify the way the Chairman is to vote on the resolution; and o expressly authorises the Chairman to exercise the proxy (notwithstanding that Resolution 1 is
connected directly or indirectly with the remuneration of Key Management Personnel).
The Chairman intends to vote undirected proxies (where the Chairman has been appropriately authorised) in favour of Resolution 1.
Other Directors and other Key Management Personnel of the Company and their closely related parties must not cast any votes in respect of Resolution 1 that arise from any undirected proxy that they hold.
Resolution 5: Approval of issue of performance rights to Mr Bob Vassie
In accordance with the ASX Listing Rules (and having regard to the voting restrictions in section 200E(2A) of the Corporations Act as it applies to Resolution 5), the Company will disregard any votes cast on Resolution 5 by Mr Vassie and his associates, other than where the vote:
is cast by a person as proxy for a Shareholder who is entitled to vote, in accordance with the directions on the Proxy Form; or
is cast by the Chairman as proxy for a Shareholder who is entitled to vote, in accordance with a direction on the Proxy Form to vote as the proxy decides.
Further, under the Corporations Act, the Company's Key Management Personnel and their closely related parties are prohibited from voting on resolutions connected directly or indirectly with the remuneration of Key Management Personnel (such as Resolution 5) as a proxy for a Shareholder entitled to vote where the proxy appointment does not specify the way the proxy is to vote on the resolution.
For
per
sona
l use
onl
y
page 8
However, this Corporations Act prohibition does not apply if the Chairman has been appointed as the proxy and the proxy appointment expressly authorises the Chairman to exercise an undirected proxy. The Chairman intends to vote undirected proxies (where the Chairman has been appropriately authorised) in favour of Resolution 5.
Proxy Information
If you are entitled to attend the meeting and vote, you may appoint a proxy to attend and vote on your behalf. A proxy need not be a Shareholder and can be either an individual or a body corporate.
If you appoint a body corporate as a proxy, that body corporate will need to ensure that it:
appoints an individual as its corporate representative to exercise its powers at the meeting, in accordance with section 250D of the Corporations Act; and
provides satisfactory evidence of the appointment of its corporate representative prior to commencement of the meeting.
If such evidence is not received before the meeting, then the body corporate (through its representative) will not be permitted to act as a proxy.
If you are entitled to cast 2 or more votes, you may appoint 2 proxies and may specify the proportion or number of votes each proxy is appointed to exercise. If no proportion or number is specified, each proxy will exercise half of your votes.
A Proxy Form accompanies this Notice of Annual General Meeting and to be effective it, and any authority under which the Proxy Form is signed, must be received by St Barbara’s share registry by no later than 11:00am on 25 November 2015 (Melbourne time) by one of the following methods:
Mail to: Computershare Investor Services Pty Limited, GPO Box 242, Melbourne, Victoria, 3001
Fax to: 1800 783 447 (within Australia), +61 3 9473 2555 (outside Australia)
Online: login at www.investorvote.com.au using the Control Number found on the front of your accompanying proxy form and follow the instructions. Alternatively, with your mobile device scan the QR code located on the front of the proxy form and follow the instructions. You will be taken to have signed your Proxy Form if you lodge it in accordance with the instructions given on the website.
For intermediary online subscribers only (custodians) please visit www.intermediaryonline.com.
By Order of the Board
Rowan Cole Company Secretary 20 October 2015
For
per
sona
l use
onl
y

page 9
St Barbara Limited ABN 36 009 165 066
Explanatory Memorandum to Shareholders
This Explanatory Memorandum has been prepared to assist Shareholders to understand the business to be put to Shareholders at the forthcoming Annual General Meeting on 27 November 2015.
Ordinary Business
1. Annual Reports
The Corporations Act requires:
the reports of the Directors and Auditor; and
the Annual Financial Report, including the financial statements of the Company for the year ended 30 June 2015,
to be laid before the Annual General Meeting.
The 2015 Annual Report is available on the St Barbara website at www.stbarbara.com.au.
The Corporations Act does not require a vote of Shareholders on the reports or statements. However, Shareholders will be able to ask questions at the meeting in relation to the reports.
Also, a reasonable opportunity will be given to Shareholders to ask the Company’s Auditor for the year ended 30 June 2015, Mr Tony Romeo, Partner, KPMG, questions relevant to the conduct of the audit, the preparation and content of the Auditor’s report, the accounting policies adopted by the Company in relation to the preparation of the financial statements and the independence of the Auditor in relation to the conduct of the audit.
2. Resolution 1: Adoption of Remuneration Report
The Remuneration Report sets out remuneration details paid to Non‐Executive Directors, the Managing Director and Chief Executive Officer and senior executives. The Remuneration Report is set out on pages 21 to 36 (inclusive) of the 2015 Annual Report, and is available on the St Barbara website at www.stbarbara.com.au.
The Remuneration Report is required to be considered for adoption in accordance with section 250R of the Corporations Act.
The vote on this resolution is advisory only and does not bind the Directors or the Company.
Key remuneration principles set out in the Report are summarised below.
The Company’s remuneration strategy recognises that it needs to attract, reward and retain high calibre, high performing and team orientated individuals capable of delivering the Company strategy. The remuneration policy and related employment policies and practices of the Company are aligned with this strategy.
Non‐Executive Directors’ fees are reviewed annually by the Board to ensure fees are appropriate to reflect the responsibilities and time commitments required of Non‐Executive Directors and to ensure that the Company continues to attract and retain Non‐Executive Directors of a high calibre. The Board seeks the advice of, and is guided by, specialist independent remuneration consultants in this process. Currently Non‐Executive Directors’ fees are compared with those of comparatively sized companies.
In order to maintain their independence and impartiality, the fees paid to Non‐Executive Directors are not linked to the performance of the Company. Non‐Executive Directors have no involvement in the day to day management of the Company.
The Company operates a performance based remuneration system through which the remuneration of the senior executives is linked to the financial and non‐financial performance of the Company, including its share price.
Under the remuneration system the amount of performance linked at risk remuneration relative to an employee’s total remuneration increases in line with the seniority of the role of that employee. This reinforces the linkage between personal and Company performance and achievement of the Company’s business strategy and creation of shareholder wealth.
For
per
sona
l use
onl
y

page 10
The reward structures for the Company’s senior executives are strongly aligned with Shareholders’ interests by:
recognising the contribution of each senior executive to the achievement of the Company’s strategy and business objectives;
rewarding high individual performance;
being market competitive to attract and retain high calibre individuals; and
ensuring that equity based remuneration through the long term incentive plan is based on a number of outperformance measures over a three year period.
To achieve these objectives, remuneration for senior executives is comprised of fixed remuneration and performance linked at risk remuneration. The “at risk” component is comprised of separate short term and long term incentives in which the former are linked to specific personal and corporate or business unit objectives and the latter are linked to medium term strategic corporate objectives. Both provide a direct connection between achievement of targets which drive Company performance and shareholder wealth, with personal remuneration. The mix of fixed and at risk remuneration varies according to the role of each senior executive, with the highest level of at risk remuneration applied to those roles that have the greatest potential to influence and deliver Company outcomes and drive shareholder wealth.
Fixed remuneration for each senior executive role is reflected against prevailing comparable market rates, to ensure that the Company is able to attract and retain a talented and capable workforce appropriate to meet its current and anticipated needs.
The short term incentive (STI) is an annual “at risk” component of remuneration for senior executives. It is payable based on performance against key performance indicators (KPIs) set at the beginning of the financial year. STIs are structured to remunerate executives for achieving annual Company targets as well as their own individual performance targets designed to benefit the business. Company and individual STIs are weighted equally at “target” performance. Company and individual targets are established by reference to the Company strategy. The net amount of any STI after allowing for applicable taxation, is payable in cash.
For each KPI there are defined “threshold”, “target” and “stretch” measures which are capable of objective assessment.
Threshold performance typically requires achievement of the full year budget for quantifiable measures such as safety, profitability, cash generation, as well as the achievement of criteria set as near term goals linked to the annual strategy review.
Target performance represents challenging but achievable levels of performance beyond achievement of budget measures. For example, the 2015 financial year STI target for gold production of Leonora was set at 104% of the corresponding midpoint of guidance. Stretch performance requires significant performance above and beyond normal expectations and if achieved is anticipated to result in a substantial improvement in key strategic outcomes, operational or financial results, and / or the business performance of the Company.
Long term incentives (LTIs) are structured to reward senior executives for the long term performance of the Company relative to its peers and are granted in the form of performance rights. The St Barbara Rights Plan was approved by the Board on 22 September 2015.
In considering the LTI awards for the 2015 financial year (FY15 Performance Rights), the Board considered the trend towards deferring a portion of the award. Unlike other industries where matching revenues and expenses may have long lead times, the gold industry is such that gold produced is sold at arm’s length within a matter of days from production. Revenue and expenses are then recorded. The industry characteristics supporting a look back testing of prior year performance awards do not carry the same weight in our industry.
As set out in the 2015 Annual Report, the vesting of the FY15 Performance Rights granted in respect of the 2015 financial year is subject to continuing employment as at the vesting date of 30 June 2017, and satisfactory performance over the three year period ending on 30 June 2017 respectively relating to relative total shareholder return, net growth in Ore Reserves, and return on capital employed.
The Board unanimously recommends that Shareholders vote in favour of this resolution.
For
per
sona
l use
onl
y

page 11
3. Resolution 2: Re‐election of Director – Mr Tim Netscher
Mr Tim Netscher BSc (Eng) (Chemical), BCom, MBA, FIChE, CEng, MAICD
A Director of the Company since February 2014, Mr Netscher is Chairman of the Board, Chair of the Health, Safety Environment and Community Committee, and a member of the Remuneration Committee and Audit & Risk Committee. Mr Netscher was the Managing Director of Gindalbie Metals Limited from 2011 to 2013, and is currently the Non‐Executive Chairman of Deep Yellow Limited, and a Non‐Executive Director of Gold Road Resources Limited and Western Areas Limited. A chemical engineer, he is an experienced international mining executive with extensive operational, project development, and transactional experience and expertise in senior executive management roles.
Board recommendation
The Board, with Mr Netscher abstaining, unanimously recommends that Shareholders vote in favour of this resolution.
4. Resolution 3: Election of Director – Mr David Moroney
Mr David Moroney BCom, FCA, FCPA, GAICD
Mr Moroney was appointed to the Board of the Company as an independent Non‐Executive Director with effect from 16 March 2015. He is Chair of the Audit & Risk Committee and a member of the Remuneration Committee and Health, Safety Environment & Community Committee. Mr Moroney has strong skills in finance, strategic planning, governance, risk management and leadership, with more than 20 years’ experience in senior corporate finance roles, including 15 years in the mining industry, and extensive international work experience. Since 2013 he has been an independent Non‐Executive Director of Geraldton Fishermen’s Co‐operative Ltd (the southern hemisphere’s largest exporter of lobster), and Chair of its Audit & Risk Management Committee, and since 2014, an independent Non‐Executive Director of WA Super, Western Australia’s largest public offer superannuation fund (and Chair of its Risk Management Committee, and a member of the Compliance & Audit Committee and Investment Committee).
In his executive career, Mr Moroney was the Chief Financial Officer of Australia’s largest grain exporter Co‐operative Bulk Handling Ltd (2009‐2014), TSX and LSE listed copper and base metals miner First Quantum Minerals Ltd (2007‐2009), chemicals and fertiliser producer Wesfarmers CSBP Ltd (2002‐2003), and Indonesian gold and silver miner Aurora Gold Ltd (1993‐1999).
He was Executive General Manager/Deputy CFO of Australia’s then‐largest gold miner Newmont Australia Ltd (previously Normandy Mining Ltd) (1999‐2002), and a member of the Executive Management Team of conglomerate Wesfarmers Ltd (2003‐2006) in its corporate office. A commerce graduate from the University of Melbourne, he is a Fellow of the Chartered Accountants Australia & New Zealand, a Fellow of CPA Australia, and a Graduate of the Australian Institute of Company Directors.
Board recommendation
The Board, with Mr Moroney abstaining, unanimously recommends that Shareholders vote in favour of this resolution.
5. Resolution 4: Election of Director – Ms Kerry Gleeson
Ms Kerry Gleeson LLB (Hons), FAICD
Ms Gleeson was appointed to the Board of the Company as an independent Non‐Executive Director with effect from 18 May 2015. She is Chair of the Remuneration Committee and a member of the Audit & Risk Committee, and the Health, Safety, Environment & Community Committee. Ms Gleeson has over 20 years’ extensive boardroom and senior management experience across Australia, UK and the US, in a variety of industries including mining, agriculture, chemicals, logistics and manufacturing. Ms Gleeson was admitted to practice as a lawyer of the Supreme Court of England and Wales in 1991 and in Victoria in 2001.
Ms Gleeson has significant expertise in major corporate finance and transactional matters, and in disciplined governance in Australian and international businesses. She was a member of the Group Executive at Incitec Pivot Limited for 10 years until late 2013, including as Company Secretary and General Counsel. Previously she was a corporate finance and transactional partner in an English law firm, and also practiced as a senior lawyer at the Australian law firm, Ashurst. Ms Gleeson is currently a Non‐Executive Director of ASX listed McAleese Limited, and a member of its Audit, Business Risk & Compliance Committee. She is a Fellow of the Australian Institute of Company Directors.
For
per
sona
l use
onl
y

page 12
Board recommendation
The Board, with Ms Gleeson abstaining, unanimously recommends that Shareholders vote in favour of this resolution.
6. Resolution 5: Approval of issue of performance rights to Mr Bob Vassie, Managing Director and Chief Executive Officer
Introduction
The Board has resolved, subject to Shareholder approval, to issue Mr Vassie, Managing Director and Chief Executive Officer, performance rights pursuant to the Rights Plan (RP) to acquire Shares in the capital of the Company, in the quantum and on the terms which are set out below. These performance rights represent the LTI component of Mr Vassie's total remuneration in respect of the 2016 financial year.
The number of performance rights to be issued in respect of the 2016 financial year (FY16 Performance
Rights) is 1,104,674.
FY16 Performance Rights are priced at $0.5092 per right, based on the 10 day VWAP up to and including
30 June 2015 (10 day VWAP to 30 June 2014: $0.12).
The issue of the FY16 Performance Rights is subject to the terms of the RP approved by the Board on
22 September 2015, the material details of which are summarised in this document.
No cash consideration is payable for the issue, or vesting or exercise of the FY16 Performance Rights.
The FY16 Performance Rights will vest subject to prescribed service and performance conditions being met.
The number of FY16 Performance Rights that vest will be subject to the Company’s relative performance for
each of the performance conditions.
1. The service condition requires continuous employment for a three year period commencing on
1 July 2015. The Board has discretion in circumstances of death, disability or bona fide redundancy to
vary the service condition and reduce the number of performance rights proportionately for a period of
service of less than three years.
2. The performance conditions comprise the following:
a. a condition based on Relative Total Shareholder Return; and
b. a condition based on the Return On Capital Employed by the Company,
each of which is calculated over the three year period commencing 1 July 2015 and ending on
30 June 2018 and is described in more detail in the attached Schedule. This vesting period may be
extended by up to two years if retesting becomes necessary.
Subject to the satisfaction of the service and performance conditions, Mr Vassie will receive one Share for
each FY16 Performance Rights granted. Any FY16 Performance Rights which does not vest will lapse.
The FY16 Performance Rights will not be listed on ASX and will not be transferable, except as permitted under
the RP.
In the event of a change of control of the Company, the RP provides that the Board may, in its absolute
discretion, determine that all or a specified number of FY16 Performance Rights vest, having regard to
whether pro‐rata performance is consistent with the performance conditions applicable to those FY16
Performance Rights over the period from the date of grant to the date of change of control.
For
per
sona
l use
onl
y

page 13
Shareholder approval
Shareholder approval for the issue of the FY16 Performance Rights to Mr Vassie is sought for all purposes under
the Corporations Act and the ASX Listing Rules, including for the following purposes:
Under ASX Listing Rule 10.14, the acquisition of securities by a director under an employee incentive scheme
requires Shareholder approval. Shareholder approval is therefore sought for the acquisition by Mr Vassie of
the FY16 Performance Rights and Shares upon vesting of the FY16 Performance Rights. If approval is given
under ASX Listing Rule 10.14, approval is not required under ASX Listing Rule 7.1.
Under section 200B of the Corporations Act, a company may only give a person a benefit in connection with
their ceasing to hold a managerial or executive office in the company or a related body corporate if it is
approved by Shareholders or an exemption applies. Section 200B of the Corporations Act applies to managerial
or executive officers of the Company or any of its subsidiaries, which includes Mr Vassie. The term ‘benefit’
has a wide operation and includes the early vesting of the FY16 Performance Rights under the rules of the RP.
It is proposed, therefore, that this resolution will also approve, under section 200E of the Corporations Act,
any ‘termination benefit’ that may be provided to Mr Vassie under the RP in relation to the FY16
Performance Rights to be granted to him, in addition to any other termination benefits that may be provided
to Mr Vassie under the Corporations Act. The termination benefit that may be given under the RP is the early
vesting of the FY16 Performance Rights (and the receipt of Shares upon exercise of the FY16 Performance
Rights) if Mr Vassie ceases employment with the Company due to death, disability, bona fide redundancy or
other reason with the approval of the Board.
The value of such benefits cannot presently be ascertained but matters, events and circumstances that will,
or are likely to, affect the calculation of that value include:
1. the number of performance rights held by Mr Vassie prior to cessation of employment;
2. the number of performance rights that vest (which could be all of the performance rights held by
Mr Vassie). The Board's decision as to the number of performance rights that vest will depend on,
among other things, the circumstances of Mr Vassie's cessation of employment (for example,
whether due to death, disability, redundancy or other reasons approved by the Board), the Board's
assessment of Mr Vassie's performance in the period up to cessation of employment, the degree to
which the performance conditions have been met at the relevant time, and the duration of
Mr Vassie's employment; and
3. the market price of Shares on ASX on the last ASX trading day before the date of calculation.
The number of performance rights that could vest upon Mr Vassie ceasing employment, where the Board
determines to permit performance rights to vest, will not exceed the maximum number of performance
rights held by Mr Vassie.
Disclosures made for the purposes of ASX Listing Rule 10.15:
In accordance with ASX Listing Rule 10.15, the Company notes that:
the maximum number of securities that can be awarded to Mr Vassie if this resolution is approved is
1,104,674 FY16 Performance Rights, entitling Mr Vassie to a maximum of 1,104,674 Shares if all FY16
Performance Rights subsequently vest;
the price payable on the issue, vesting or exercise of each FY16 Performance Rights is nil;
Mr Vassie was granted 4,062,500 performance rights for nil cash consideration on 9 December 2014 under the
Performance Rights Plan (PRP) approved at the 2010 Annual General Meeting of the Company in accordance
with Shareholder approval obtained at the Company's Annual General Meeting held on 25 November 2014;
For
per
sona
l use
onl
y

page 14
Mr Vassie is the only Director entitled to participate in the RP because he is the only Executive Director and
the Company has not declared any Non‐Executive Director as being eligible to participate in the RP;
there have not been any grants made to any Director or associate of a Director under the PRP or the RP since
Shareholder approval was last obtained at the Company’s Annual General Meeting held on
25 November 2014, aside from the issue of 4,062,500 performance rights (for nil cash consideration and no
amount payable on vesting) to Mr Vassie on 9 December 2014, in accordance with Shareholder approval
obtained at the Company’s Annual General Meeting held on 25 November 2014;
there is no loan proposed in relation to the proposed award of the FY16 Performance Rights to Mr Vassie;
and
Mr Vassie's FY16 Performance Rights are intended to be granted by 31 December 2015 and in any event will
not be granted later than 12 months after the date of the meeting.
Board recommendation
The Board, with Mr Vassie abstaining, unanimously recommends the approval of the issue of the performance rights to Mr Vassie and, accordingly, that Shareholders vote in favour of this resolution.
7. Special Resolution 6: Adoption of a new Constitution
Introduction
The last substantive review of the Company’s Constitution took place in 2003 with a minor revision in 2006. The Board proposes that the Constitution be replaced with an updated version to ensure that it complies with the current requirements of the Corporations Act and ASX Listing Rules and reflects current corporate governance practices.
A copy of the proposed Constitution which will replace the current Constitution is available on the Company website at www.stbarbara.com.au/investors/latest‐news/.
An explanation of the key changes between the current Constitution of the Company and the proposed replacement version is set out below.
Key changes in the proposed Constitution
Variation of class rights. It is proposed to remove the current requirement that the Company pass a special resolution of all Shareholders to vary class rights and instead require a special resolution be passed only by those in the affected class. It is more efficient for only the relevant class to vote on such a special resolution and it is appropriate as it is the rights of only those particular shareholders who will be affected by a proposed change to the rights of the class.
Number of Directors on the Board. It is proposed to reduce the maximum number of Directors that may be appointed to the Board to seven, compared to the current permitted maximum of ten. There are currently four Directors on the Board of the Company. The proposed change is intended to ensure that the Board has a maximum number of Directors which is commensurate with the operations and size of the Company. If in the future it is desirable that more than 7 Directors be appointed to the Board, the Board has discretion to increase the maximum number of Directors.
Directors Election. The proposed Constitution replaces the current rule that ‘one‐third of Directors retire at each AGM (regardless of whether they have been in office for three years)’, with ‘if no Director is scheduled to stand for election, then the Director who has held office longest retires.‘ This proposed change is in line with current market practice.
The following Director election rules would remain unchanged:
o An election of Directors must occur each year (at least one Director). o A Director must retire at the third AGM after the Director was elected or re‐elected. o A Director appointed by the Board must stand for election at the next AGM.
For
per
sona
l use
onl
y

page 15
Proportional takeover approval. The proposed Constitution includes a requirement that where a proportional takeover bid is lodged for shares in the Company, Shareholders must approve acceptance of the bid. This ensures Shareholders have an element of control in the Company's dealings with proportional takeover bidders.
Notices by the Company. The proposed Constitution permits notices to be sent to overseas Shareholders electronically. The proposed Constitution sets out the time at which electronic notices and all other notices will be taken to have been received. These proposed changes are intended to provide a more efficient and cost effective way for the Company to provide notices to Shareholders and to ensure clarity in respect of the time at which notices will be taken to have been received.
Terms of issue of preference shares. The terms of issue of preference shares are included in the proposed Constitution. This is more efficient than the alternative, which requires the terms of issue of preference shares to be approved by a special resolution of the Company for each issue.
Fee for paper based transfers. The proposed Constitution gives the Company the right to charge an administrative fee to register paper‐based transfers of Shares. This change is intended to align the Constitution with ASX Listing Rule 8.14.1 and to allow the Company to recover the administrative costs associated with paper‐based transfers. The majority of transfers in the Shares of the Company occur online and will not incur such a fee.
Shareholder approval required for adopting changes to the Constitution
Special Resolution
Section 136 of the Corporations Act provides that the Company may adopt or modify its Constitution by special resolution. This means that at least 75% of the Shareholders entitled to vote on the resolution and who vote at the meeting must vote in favour of this resolution in order for it to be passed.
Board recommendation
For the reasons outlined above, the Board unanimously recommends that Shareholders vote in favour of Special Resolution 6.
For
per
sona
l use
onl
y

page 16
8. Definitions
Annual General Meeting means the annual general meeting of St Barbara to be held on Friday 27 November 2015 at 11:00am (Melbourne time) in the Royce Hotel, 379 St Kilda Road, Melbourne, Victoria to consider and, if thought fit, pass the resolutions set out in the Notice of Annual General Meeting
Annual Report means the 2015 annual report of St Barbara
ASX means ASX Limited
ASX Listing Rules means the Official Listing Rules of ASX Limited
Auditor means KPMG
Board means the board of Directors of St Barbara
Chairman means the chairman of the Annual General Meeting of St Barbara
Change of control means that one or more persons acting in concert have acquired or are likely to imminently acquire “control” of the Company as defined in section 50AA of the Corporations Act
Corporations Act means the Corporations Act 2001 (Cth)
Director means a director of St Barbara
EBITDA means earnings before interests, tax, depreciation and amortisation
Explanatory Memorandum means the explanatory memorandum accompanying the Notice of Annual General Meeting contained in this Meeting Documentation
FY15 Performance Rights means the LTI awards in respect of the 2015 financial year
FY16 Performance Rights means the LTI awards in respect of the 2016 financial year (which are subject to the approval of resolution 5, for the number of performance rights to be issued to Mr Bob Vassie)
Key Management Personnel has the meaning given in the Corporations Act
KPI means key performance indicator
LTI means long term incentive
Meeting Documentation means this document comprising of the Notice of Annual General Meeting, Explanatory Memorandum and the Proxy Form
Non‐Executive Director means a non‐executive Director
Notice of Annual General Meeting means the notice of meeting which is enclosed in the Meeting Documentation
Proxy Form means the proxy form for the Annual General Meeting contained in the Meeting Documentation
RP means the rights plan of the Company
Share means a fully paid ordinary share in the capital of St Barbara
Shareholder means a holder of Shares
St Barbara or the Company means St Barbara Limited ABN 36 009 165 066
STI means short term incentive
VWAP means volume weighted average price For
per
sona
l use
onl
y

page 17
Schedule: Performance rights – Further details
Performance rights to be granted to Key Management Personnel in respect of the 2016 financial year (FY16
Performance Rights) will be offered pursuant to the terms of the Rights Plan (RP) approved by the Board on
22 September 2015 and the performance conditions set out below.
1. Performance rights pricing
The issue price of the performance rights is based on the 10 day volume weighted average price (VWAP) on the
ASX of the Company’s share price up to, and including, the last business day of the financial period immediately
preceding the period that the performance rights relate to.
FY16 Performance Rights are priced at $0.5092 per right, based on the 10 day VWAP up to and including
30 June 2015.
2. Performance conditions for performance rights
The performance conditions for FY16 Performance Rights will be measured over a three year vesting period
commencing 1 July 2015 and ending on 30 June 2018. This vesting period may be extended by up to two years if
retesting becomes necessary. Vesting conditions include satisfying conditions relating to:
Relative Total Shareholder Returns (67% weighting); and
Return on Capital Employed (33% weighting).
3. Change of control
In the event of a change of control of the Company, the RP provides that the Board may, in its absolute
discretion, determine that all or a specified number of FY16 Performance Rights vest, having regard to whether
pro‐rata performance is consistent with the performance conditions applicable to those FY16 Performance Rights
over the period from the date of grant to the date of change of control.
4. Percentage of relevant total fixed remuneration offered as LTIs for the 2016 financial year
Managing Director and Chief Executive Officer 75%
Executive General Managers 60%
The Board has the discretion to vary the relevant percentage each year, having regard to external advice and / or relevant market benchmarks.
5. An example of how performance rights are calculated for the 2016 financial year (assuming the maximum award level) is set out below:
Executive Level 5 Total Fixed Remuneration (TFR) $400,000 (example only)
LTI award value 60% of TFR $240,000 (i.e. 60% of TFR)
Performance rights issue price (10 day VWAP) $0.5092
Performance rights to be granted ($240,000 ÷ $0.5092) 471,328 rights
6. Relative TSR
The Relative Total Shareholder Return (Relative TSR) is measured against a defined peer group of companies
which the Board considers compete with the Company for the same investment capital, both in Australia and
overseas, and which by the nature of their business are influenced by commodity prices and other external
factors similar to those that impact on the TSR performance of the Company.
For
per
sona
l use
onl
y

page 18
The comparator group of companies for FY16 Performance Rights comprises:
Alacer Gold Corp. (ASX: AQG)
Beadell Resources Limited (ASX: BDR)
Evolution Mining Limited (ASX: EVN)
Focus Minerals Ltd (ASX: FML)
Gryphon Minerals Limited (ASX: GRY)
Intrepid Mines Limited (ASX: IAU)
Kingsgate Consolidated Limited (ASX: KCN)
Kingsrose Mining Limited (ASX:KRM)
Medusa Mining Limited (ASX: MML)
Northern Star Resources Ltd (ASX: NST)
OceanaGold Corporation (ASX: OGC)
Perseus Mining Limited (ASX: PRU)
Ramelius Resources Limited (ASX: RMS)
Regis Resources Limited (ASX: RRL)
Resolute Mining Limited (ASX: RSG)
Saracen Mineral Holdings Limited (ASX: SAR)
Silver Lake Resources Limited (ASX: SLR)
Tanami Gold NL (ASX: TAM)
Troy Resources Limited (ASX: TRY)
Oz Minerals Limited (ASX: OZL)
At the discretion of the Board, the composition of the comparator group may change from time to time.
TSR measures the growth for a financial year in the price of shares plus cash distributions notionally reinvested in
shares. Company and comparator TSR performances are measured using the 10 day VWAP calculation up to, and
including, the last business day of the financial period immediately preceding the period that the performance
rights relate to, and in determining the closing TSR performances at the end of the three year period and, if
retesting applies, at the end of the fourth and fifth year. Where a comparator company ceases to be listed on
the ASX during the vesting period, the corresponding TSR is adjusted, taking into account the period the ceasing
company was listed and the average TSR of the remaining comparator companies.
The proportion of the FY16 Performance Rights that vest will be influenced by the Company’s TSR relative to the
comparator group over the three year vesting period commencing 1 July 2015 and ending on 30 June 2018 as
outlined below:
Relative TSR Performance % Contribution to the Number of Performance Rights to Vest
Below 50th percentile 0%
50th percentile 50%
Between 50th & 75th percentiles Pro‐rata from 50% to 100%
75th percentile and above 100%
For
per
sona
l use
onl
y

page 19
7. Return on Capital Employed (ROCE)
The proportion of the FY16 Performance Rights that vest will be influenced by the ROCE achieved by the Company over the three year vesting period commencing 1 July 2015 and ending on 30 June 2018 as outlined below:
Return on Capital Employed (ROCE) % Contribution to the Number of Performance Rights to Vest
Less than or equal to the average annual weighted average cost of capital (WACC) over the three year period commencing on 1 July 2015
0%
WACC (calculated as above) + 3% 50%
WACC (calculated as above) + between 3% and 7% Pro‐rata from 50% to 100%
WACC (calculated as above) + 7% 100%
8. Example of calculation of the number of performance rights to vest
Assuming the following measures over the three year vesting period commencing on 1 July 2015 and ending on 30 June 2018:
Relative TSR: 70%
ROCE WACC + 4%
then the following proportion of performance rights will vest:
(a) Relative TSR Weighting: 67% Actual score: 70th percentile Calculation: 50% (for achieving the 50th percentile)
+ ((70% ‐ 50%) (75% ‐ 50%)) x (100% ‐ 50%) = 90%
(b) Return on Capital Employed (ROCE) Weighting: 33% Actual ROCE: WACC + 4% Calculation: 50% (for achieving the 50th percentile)
+ ((4% ‐ 3%) (7% ‐ 3%)) x (100% ‐ 50%) = 62.5%
(c) Combined score (90% x 67%) + (62.5% x 33%) = 80.9%
Using the above example of an executive being issued with 471,328 performance rights, based on
the above 80.9% combined score, 381,304 (= 80.9% x 471,328) performance rights will vest.
9. Retesting
In the event that none of the rights vest at the end of the three year vesting period, the vesting period will be
extended by one year and a second testing for vesting will occur following the end of the extended period using
the same vesting scales as at paragraphs 6 and 7 above. If none of the rights vest at the second test, the vesting
period will be extended by a further year and a third test for vesting will occur following the end of the extended
period using the same vesting scales as at paragraphs 6 and 7 above.
For
per
sona
l use
onl
y

SRN/HIN: I9999999999
Lodge your vote:Online:www.investorvote.com.au
By Mail:Computershare Investor Services Pty LimitedGPO Box 242 MelbourneVictoria 3001 Australia
Alternatively you can fax your form to(within Australia) 1800 783 447(outside Australia) +61 3 9473 2555
For Intermediary Online subscribers only(custodians) www.intermediaryonline.com
For all enquiries call:(within Australia) 1300 850 505(outside Australia) +61 3 9415 4000
Proxy Form
For your vote to be effective it must be received by 11:00am (Melbourne time) on Wednesday, 25 November 2015.
How to Vote on Items of BusinessAll your securities will be voted in accordance with your directions.
Appointment of Proxy
Voting 100% of your holding: Direct your proxy how to vote bymarking one of the boxes opposite each item of business. If you donot mark a box your proxy may vote or abstain as they choose (tothe extent permitted by law). If you mark more than one box on anitem your vote will be invalid on that item.
Voting a portion of your holding: Indicate a portion of yourvoting rights by inserting the percentage or number of securitiesyou wish to vote in the For, Against or Abstain box or boxes. Thesum of the votes cast must not exceed your voting entitlement or100%.
Appointing a second proxy: You are entitled to appoint up to twoproxies to attend the meeting and vote on a poll. If you appoint twoproxies you must specify the percentage of votes or number ofsecurities for each proxy, otherwise each proxy may exercise half ofthe votes. When appointing a second proxy write both names andthe percentage of votes or number of securities for each in Step 1overleaf.
Signing Instructions for Proxy FormsIndividual: Where the holding is in one name, the securityholdermust sign.Joint Holding: Where the holding is in more than one name, all ofthe securityholders should sign.Power of Attorney: If you have not already lodged the Power ofAttorney with the registry, please attach a certified photocopy of thePower of Attorney to this form when you return it.Companies: Where the company has a Sole Director who is alsothe Sole Company Secretary, this form must be signed by thatperson. If the company (pursuant to section 204A of the CorporationsAct 2001) does not have a Company Secretary, a Sole Director canalso sign alone. Otherwise this form must be signed by a Directorjointly with either another Director or a Company Secretary. Pleasesign in the appropriate place to indicate the office held. Delete titlesas applicable.
Attending the MeetingBring this form to assist registration. If a representative of a corporatesecurityholder or proxy is to attend the meeting you will need toprovide the appropriate “Certificate of Appointment of CorporateRepresentative” prior to admission. A form of the certificate may beobtained from Computershare or online at www.investorcentre.comunder the help tab, "Printable Forms".
Comments & Questions: If you have any comments or questionsfor the company, please write them on a separate sheet of paper andreturn with this form.
GO ONLINE TO VOTE, or turn over to complete the form
A proxy need not be a securityholder of the Company.
ABN 36 009 165 066
Control Number: 999999
PIN: 99999
Go to www.investorvote.com.au or scan the QR Code with your mobile device.Follow the instructions on the secure website to vote.
Vote and view the annual report online
Your access information that you will need to vote:
PLEASE NOTE: For security reasons it is important that you keep your SRN/HIN confidential.
••
T 000001 000 SBM
MR SAM SAMPLEFLAT 123123 SAMPLE STREETTHE SAMPLE HILLSAMPLE ESTATESAMPLEVILLE VIC 3030
Samples/000001/000001/i12
*S00000112Q01*
For
per
sona
l use
onl
y

I 9999999999
Change of address. If incorrect,mark this box and make thecorrection in the space to the left.Securityholders sponsored by abroker (reference numbercommences with ’X’) should adviseyour broker of any changes.
Proxy Form Please mark to indicate your directions
Appoint a Proxy to Vote on Your BehalfI/We being a member/s of St Barbara Limited hereby appoint
STEP 1
the Chairman ORPLEASE NOTE: Leave this box blank ifyou have selected the Chairman of theMeeting. Do not insert your own name(s).
or failing the individual or body corporate named, or if no individual or body corporate is named, the Chairman of the Meeting, as my/our proxyto act generally at the Meeting on my/our behalf and to vote in accordance with the following directions (or if no directions have been given, andto the extent permitted by law, as the proxy sees fit) at the Annual General Meeting of St Barbara Limited to be held in the Royce ConferenceRoom, Royce Hotel, 379 St Kilda Road, Melbourne, Victoria on Friday, 27 November 2015 at 11.00am (Melbourne time) and at anyadjournment or postponement of that Meeting.
STEP 2 Items of Business PLEASE NOTE: If you mark the Abstain box for an resolution, you are directing your proxy not to vote on yourbehalf on a show of hands or a poll and your votes will not be counted in computing the required majority.
SIGN Signature of Securityholder(s) This section must be completed.Individual or Securityholder 1 Securityholder 2 Securityholder 3
Sole Director and Sole Company Secretary Director Director/Company Secretary
ContactName
ContactDaytimeTelephone Date
of the Meeting
I ND
S B M 2 0 3 8 3 8 A
MR SAM SAMPLEFLAT 123123 SAMPLE STREETTHE SAMPLE HILLSAMPLE ESTATESAMPLEVILLE VIC 3030
/ /
XX
ForA
gainst
Absta
in
Resolution 1 Adoption of Remuneration Report
Resolution 2 Re-election of Director - Mr Tim Netscher
Resolution 3 Election of Director - Mr David Moroney
Resolution 4 Election of Director - Ms Kerry Gleeson
Resolution 5 Approval of issue of performance rights to Mr Robert (Bob) Vassie, Managing Director and ChiefExecutive Officer
Resolution 6 Adoption of a new Constitution
Important Note:Chairman authorised to exercise undirected proxies on remuneration related resolutions: Where I/we have appointed the Chairman ofthe Meeting as my/our proxy (or the Chairman becomes my/our proxy by default), I/we expressly authorise the Chairman to exercise my/ourproxy on Resolutions 1 and 5 (except where I/we have indicated a different voting intention below) even though Resolutions 1 and 5 are connected directly or indirectly with the remuneration of a member of key management personnel, which includes the Chairman. If the Chairmanof the Meeting is (or becomes) your proxy you can direct the Chairman to vote for or against or abstain from voting on Resolutions 1 and 5 bymarking the appropriate box in step 2 below.Please Note: To fully inform shareholders in exercising their right to vote, please note that the Chairman of the Meeting intends to voteundirected proxies in favour of each resolution.
For
per
sona
l use
onl
y