Embed Size (px)
Citation preview

Crown Resorts Limited ABN 39 125 709 953 Level 3, Crown Towers, 8 Whiteman Street, Southbank VIC 3006
ASX/MEDIA RELEASE FOR IMMEDIATE RELEASE 19 August 2020
2020 FULL YEAR RESULTS – PRESENTATION SLIDES
MELBOURNE: Crown Resorts Limited (ASX: CWN) (Crown) attaches the results presentation slides for the full year ended 30 June 2020. ENDS This announcement was authorised for release by the Crown Board. Financial Media Enquiries – Ken Barton, Chief Executive Officer, 03 9292 8824. Investor and Analyst Enquiries – Matthew Young, Investor Relations, 03 9292 8848. COPIES OF RELEASES Copies of previous media and ASX announcements issued by Crown are available at Crown's website at www.crownresorts.com.au
For
per
sona
l use
onl
y

Crown Resorts Limited
2020 Full Year Results Presentation
19 August 2020
For
per
sona
l use
onl
y

Crown Resorts Limited - 2020 Full Year Results Presentation
Crown Resorts Limited (Crown) performance:
Reported EBITDA of $504.6 million, down 40.6%
Reported NPAT attributable to the parent of $79.5 million, down 80.2%
Theoretical1 EBITDA before Closure Costs2 and Significant Items of $503.8 million, down 37.2%
Theoretical NPAT attributable to the parent before Closure Costs and Significant Items of $161.0 million, down 56.3%
Closure Costs of $81.6 million (net of tax), which includes costs incurred during the mandated closure of Crown’s
properties and investments, and Significant Items of $78.7 million (net of tax), relating to the impairment of Crown
Aspinalls and Nobu, Crown Sydney pre-opening costs and costs related to a reassessment of DGN contingent
consideration, were recorded during the period3
No final dividend declared (total full year dividend of 30 cents per share)
Australian resorts performance:
Actual revenue4 of $2,214.9 million, down 25.7%
Theoretical revenue of $2,091.1 million, down 29.2%
Main floor gaming revenue of $1,235.2 million, down 26.9%
VIP program play turnover of $20.4 billion, down 46.5%
Actual VIP revenue4 of $398.2 million, down 26.0%
Non-gaming revenue of $581.5 million, down 22.7%
2
Crown Resorts Limited Results Overview
1. Theoretical results have been adjusted to exclude the impact of any variance from theoretical win rate on VIP program play (at Crown Melbourne, Crown Perth and Crown Aspinalls). The
theoretical win rate is the expected hold percentage on VIP program play over time. Accordingly, the theoretical result gives rise to adjustments to VIP program play revenue, operating expenses
and income tax expense. Crown believes that theoretical results are the relevant measure of viewing performance of the business as it removes the inherent volatility in VIP gaming revenue.
Theoretical results are a non-IFRS measure.
2. Costs incurred whilst Crown’s properties were closed due to Government direction, excluding costs in relation to hotel quarantine services and Crown Digital (Closure Costs).
3. Significant Items with a net $nil value were recorded in the prior comparable period (pcp), with an impairment charge of $48.9 million recorded against DGN’s goodwill offset by a corresponding
reduction to the contingent consideration associated with the acquisition of Winners Club Limited.
4. Before VIP commission adjustment.
For
per
sona
l use
onl
y

Crown Resorts Limited - 2020 Full Year Results Presentation 3
Changed Operating Conditions
During the year, Crown was directed by relevant State and Federal Governments to modify its operating conditions and
ultimately suspend its gaming activities and other non-essential services in response to the COVID-19 pandemic, with
effect from 20 March 2020 for Crown Aspinalls and 23 March 2020 for Crown Melbourne and Crown Perth
As a result of the mandated closure of Crown’s properties, Crown was forced to substantially reduce its workforce through
a series of stand downs. On 16 April 2020, Crown announced that it had progressively stood down, on either a full or
partial basis, approximately 95% or over 11,500 of its employees
Gaming activities at Crown Melbourne and Crown Aspinalls remained closed through to 30 June 2020
With effect from 27 June 2020, Crown Perth re-commenced gaming activities and the operation of the majority of its food
and beverage venues under temporary restrictions agreed with the Western Australian Government, including:
capacity limits at each venue based on a prescribed maximum density of at least two square metres of space for
each person;
physical distancing between patrons at electronic gaming machines and electronic table games, including the
deactivation of every second electronic gaming machine and electronic table game terminal;
restricting the number of players at table games; and
enhanced hygiene protocols
During the year, Crown Melbourne and Crown Perth qualified for the Commonwealth Government’s JobKeeper program
Through this program, Crown recorded $43.4 million in payroll subsidies relating to the period through to 30 June
2020 for employees that continued to work in either a full or partial capacity
In addition, Crown recorded $67.9 million in JobKeeper payments relating to the period through to 30 June 2020 on
behalf of employees that were stood down which were paid in their entirety to Crown’s employees
For
per
sona
l use
onl
y

Crown Resorts Limited - 2020 Full Year Results Presentation
Crown Resorts Limited Group Result
$m
F20
Theoretical
F19
Theoretical
Variance
F/(U)
F20
Actual
F19
Actual
Variance
F/(U)
EBITDA before Closure Costs and Significant Items
Crown Melbourne 354.3 589.5 (39.9%) 447.6 615.0 (27.2%)
Crown Perth 161.8 221.8 (27.1%) 173.9 244.6 (28.9%)
Crown Aspinalls (2.7) 6.4 (142.4%) 3.5 5.7 (38.7%)
Crown Digital 34.7 26.1 32.9% 34.7 26.1 32.9%
Corporate costs (44.3) (41.7) (6.2%) (44.3) (41.7) (6.2%)
EBITDA before Closure Costs and Significant Items 503.8 802.1 (37.2%) 615.4 849.7 (27.6%)
Depreciation & amortisation (275.5) (273.6) (0.7%) (275.5) (273.6) (0.7%)
EBIT before Closure Costs and Significant Items 228.3 528.5 (56.8%) 339.9 576.1 (41.0%)
Net interest income / (expense) (0.0) (10.1) 100.0% (0.0) (10.1) 100.0%
Income tax (71.6) (162.0) 55.8% (104.4) (176.4) 40.8%
Equity accounted investments before Closure Costs1 6.7 13.3 (49.6%) 6.7 13.3 (49.6%)
NPAT before NCI, Closure Costs and Significant Items 163.4 369.7 (55.8%) 242.2 402.9 (39.9%)
Non-controlling interest (NCI) (2.4) (1.1) N/A (2.4) (1.1) N/A
NPAT attributable to the parent before Closure Costs and
Significant Items 161.0 368.6 (56.3%) 239.8 401.8 (40.3%)
Closure Costs (net of tax) (81.6) – N/A
Significant Items (net of tax) (78.7) – N/A
NPAT attributable to the parent 79.5 401.8 (80.2%)
EBITDA after Closure Costs and Significant Items2 393.0 802.1 (51.0%) 504.6 849.7 (40.6%)
4
1. Crown’s equity accounted result is comprised of its net equity accounted share of NPAT from Nobu, Aspers Group and Chill Gaming. These amounts have been shown before costs incurred
during the mandated closure of Aspers and Nobu during the period.
2. Significant Items in ‘EBITDA after Closure Costs and Significant Items’ includes EBITDA related Significant Items only.
For
per
sona
l use
onl
y
Crown Resorts Limited - 2020 Full Year Results Presentation
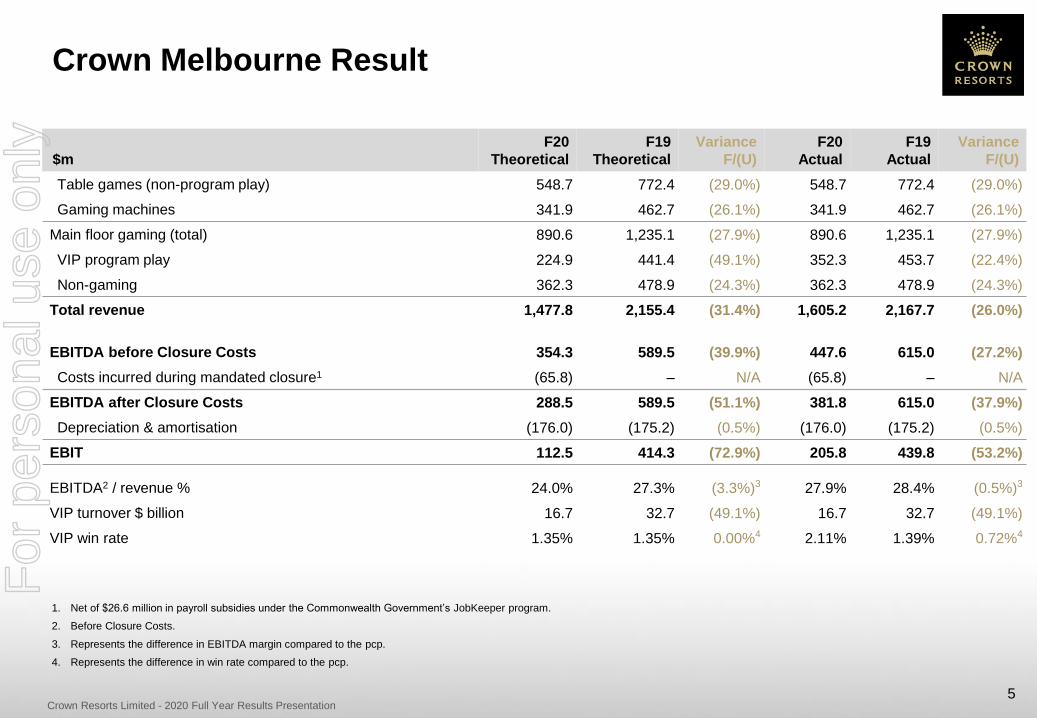
Crown Melbourne Result
5
$m
F20
Theoretical
F19
Theoretical
Variance
F/(U)
F20
Actual
F19
Actual
Variance
F/(U)
Table games (non-program play) 548.7 772.4 (29.0%) 548.7 772.4 (29.0%)
Gaming machines 341.9 462.7 (26.1%) 341.9 462.7 (26.1%)
Main floor gaming (total) 890.6 1,235.1 (27.9%) 890.6 1,235.1 (27.9%)
VIP program play 224.9 441.4 (49.1%) 352.3 453.7 (22.4%)
Non-gaming 362.3 478.9 (24.3%) 362.3 478.9 (24.3%)
Total revenue 1,477.8 2,155.4 (31.4%) 1,605.2 2,167.7 (26.0%)
EBITDA before Closure Costs 354.3 589.5 (39.9%) 447.6 615.0 (27.2%)
Costs incurred during mandated closure1 (65.8) – N/A (65.8) – N/A
EBITDA after Closure Costs 288.5 589.5 (51.1%) 381.8 615.0 (37.9%)
Depreciation & amortisation (176.0) (175.2) (0.5%) (176.0) (175.2) (0.5%)
EBIT 112.5 414.3 (72.9%) 205.8 439.8 (53.2%)
EBITDA2 / revenue % 24.0% 27.3% (3.3%)3 27.9% 28.4% (0.5%)3
VIP turnover $ billion 16.7 32.7 (49.1%) 16.7 32.7 (49.1%)
VIP win rate 1.35% 1.35% 0.00%4 2.11% 1.39% 0.72%4
1. Net of $26.6 million in payroll subsidies under the Commonwealth Government’s JobKeeper program.
2. Before Closure Costs.
3. Represents the difference in EBITDA margin compared to the pcp.
4. Represents the difference in win rate compared to the pcp.
For
per
sona
l use
onl
y

Crown Resorts Limited - 2020 Full Year Results Presentation
Crown Perth Result
6
$m
F20
Theoretical
F19
Theoretical
Variance
F/(U)
F20
Actual
F19
Actual
Variance
F/(U)
Table games (non-program play) 137.6 186.8 (26.4%) 137.6 186.8 (26.4%)
Gaming machines 207.0 267.4 (22.6%) 207.0 267.4 (22.6%)
Main floor gaming (total) 344.6 454.2 (24.1%) 344.6 454.2 (24.1%)
VIP program play 49.5 72.0 (31.2%) 45.9 84.4 (45.6%)
Non-gaming 219.2 273.0 (19.7%) 219.2 273.0 (19.7%)
Total revenue 613.3 799.2 (23.3%) 609.7 811.6 (24.9%)
EBITDA before Closure Costs 161.8 221.8 (27.1%) 173.9 244.6 (28.9%)
Costs incurred during mandated closure1 (19.7) – N/A (19.7) – N/A
EBITDA after Closure Costs 142.1 221.8 (36.0%) 154.2 244.6 (37.0%)
Depreciation & amortisation (79.6) (85.3) 6.7% (79.6) (85.3) 6.7%
EBIT 62.5 136.5 (54.2%) 74.6 159.3 (53.2%)
EBITDA2 / revenue % 26.4% 27.8% (1.4%)3 28.5% 30.1% (1.6%)3
VIP turnover $ billion 3.7 5.3 (31.2%) 3.7 5.3 (31.2%)
VIP win rate 1.35% 1.35% 0.00%4 1.25% 1.58% (0.33%)4
1. Net of $16.8 million in payroll subsidies under the Commonwealth Government’s JobKeeper program.
2. Before Closure Costs.
3. Represents the difference in EBITDA margin compared to the pcp.
4. Represents the difference in win rate compared to the pcp.
For
per
sona
l use
onl
y

Crown Resorts Limited - 2020 Full Year Results Presentation
Crown Aspinalls Result
7
$m
F20
Theoretical
F19
Theoretical
Variance
F/(U)
F20
Actual
F19
Actual
Variance
F/(U)
VIP program play 32.3 54.9 (41.2%) 41.9 55.2 (24.0%)
Non-gaming 0.8 1.1 (25.7%) 0.8 1.1 (25.7%)
Total revenue 33.1 56.0 (40.9%) 42.7 56.3 (24.0%)
EBITDA before Closure Costs (2.7) 6.4 (140.8%) 3.5 5.7 (37.0%)
Costs incurred during mandated closure1 (1.2) – N/A (1.2) – N/A
EBITDA after Closure Costs (3.9) 6.4 (160.0%) 2.3 5.7 (58.7%)
Depreciation & amortisation (4.8) (2.7) (79.2%) (4.8) (2.7) (79.2%)
EBIT (8.7) 3.7 (330.7%) (2.5) 3.0 (182.4%)
EBITDA2 / revenue % (7.9%) 11.5% (19.4%)3 8.3% 10.1% (1.8%)3
VIP turnover $ billion 2.8 5.3 (47.5%) 2.8 5.3 (47.5%)
VIP win rate4 1.16% 1.04% 0.12%5 1.51% 1.04% 0.47%5
1. Net of $2.6 million in Coronavirus Job Retention Scheme payments under the employee retention scheme in operation in the UK.
2. Before Closure Costs.
3. Represents the difference in EBITDA margin compared to the pcp.
4. Crown Aspinalls theoretical VIP win rate based on the mix of play during the period.
5. Represents the difference in win rate compared to the pcp.
For
per
sona
l use
onl
y

Crown Resorts Limited - 2020 Full Year Results Presentation
Crown Digital Result
8
Crown Digital includes:
EBITDA from Crown’s wagering and online social gaming operations (shown above)
Betfair Australasia, a 100% owned, online betting exchange
DGN Games, an 85% owned, online social gaming business
Equity accounted investment in Chill Gaming (not included above)
$m
F20
Actual
F19
Actual
Variance
F/(U)
Total revenue 135.5 130.1 4.1%
Total expenses (100.8) (104.0) 3.1%
EBITDA 34.7 26.1 32.9%
Depreciation & amortisation (9.4) (6.8) (38.7%)
EBIT 25.3 19.3 30.9%
For
per
sona
l use
onl
y

Crown Resorts Limited - 2020 Full Year Results Presentation 9
Closure Costs
During the mandated closure period, whilst Crown did not generate any gaming revenues, Crown continued to incur
expenses to maintain its operations and corporate responsibilities. Crown has separately identified these costs in
reporting its results for the full year ended 30 June 20201
$m F20
Crown Melbourne (65.8)
Crown Perth (19.7)
Crown Aspinalls (1.2)
Corporate (20.6)
Closure Costs included in EBITDA (107.3)
Equity accounted investments (6.4)
Tax effect of Closure Costs 32.1
Closure Costs included in NPAT (81.6)
1. Closure Costs exclude costs in relation to hotel quarantine services provided during the mandated closure period.
For
per
sona
l use
onl
y

Crown Resorts Limited - 2020 Full Year Results Presentation 10
Significant Items
During the period, the following have been classified as Significant Items
$m F20
Crown Sydney pre-opening costs (3.5)
Impairment – Crown Aspinalls (52.8)
Impairment – Nobu (21.7)
Reassessment of DGN contingent consideration (1.7)
Tax effect of Significant Items 1.0
Significant Items (net of tax) (78.7)
For
per
sona
l use
onl
y

Crown Resorts Limited - 2020 Full Year Results Presentation 11
This chart excludes investments in Crown Aspinalls, Queensbridge, Crown Digital, Crown’s equity accounted investments as well as the expected proceeds from the
sale of Crown Sydney apartments.
Investment in Australian Resorts
78 67 62 74 83 47
70 70
326
103
29 26 25
31 30 30
24
156 271
423
537 593
46 30
0
100
200
300
400
500
600
700
F16 (a) F17 (a) F18 (a) F19 (a) F20 (a) F21 (f) F22 (f) F23 (f)
$m
Crown Melbourne Crown Perth Crown Sydney
For
per
sona
l use
onl
y

Crown Resorts Limited - 2020 Full Year Results Presentation 12
Crown Sydney Project
The Crown Sydney Hotel Resort is in the final stages of
construction with the 275 metre tower reaching the significant
“Topping Out” milestone in May 2020, marking the completion of
vertical construction
Construction of the hotel guestrooms and suites located on floors
6-23 are substantially complete. The podium structure and façade
are complete with interior fit out well advanced across all areas
The residential component of the project, “One Barangaroo”,
which is located in the upper portion of the tower, is progressing
on schedule with the first residents scheduled to move into the
building in March 2021
With over 1,300 workers on site finalising the project, the hotel
resort remains on schedule to open progressively from December
2020
Recruitment activities are underway for the 2,000 people expected
to be employed at Crown Sydney once it is fully operational, who
will help bring Crown Sydney to life
Crown has invested approximately $1.7 billion into the Crown
Sydney project to date
The total project cost remains unchanged, with the gross project
cost expected to be approximately $2.2 billion and the net project
cost expected to be approximately $1.4 billion
For
per
sona
l use
onl
y

Crown Resorts Limited - 2020 Full Year Results Presentation 13
Recent Trading
Gaming activities re-commenced at Crown Perth on 27 June 2020, with a significant number of employees having now
returned to full duties
For the period 1 July to 16 August 2020, Crown Perth’s main floor gaming revenue (excluding VIP program play revenue)
was up approximately 18% on the pcp, however non-gaming revenue was down approximately 24% on the pcp
Over this period, Crown Perth’s VIP program play turnover has been minimal due to the ongoing international border
restrictions
Based on current trading levels, Crown Perth is not expected to qualify for the JobKeeper program beyond 27 September
2020. However, it is expected that Crown Melbourne will continue to qualify for the JobKeeper program beyond 27
September given the continued closure of that property
Gaming activities re-commenced at Crown Aspinalls on 15 August 2020
For
per
sona
l use
onl
y

Crown Resorts Limited - 2020 Full Year Results Presentation 14
$m 30 Jun 20 31 Dec 19 30 Jun 19
Bank debt 280.0 25.7 28.5
Lease liabilities and other loans1 59.7 56.0 1.0
Capital market debt - EMTN 174.6 174.6 174.6
- AMTN - - 259.1
- Subordinated Notes2 615.7 615.5 615.4
Total Outstanding Debt 1,130.0 871.8 1,078.6
Less available cash3 (238.5) (500.6) (992.1)
Net Debt / (Net Cash) 891.5 371.2 86.5
Committed un-drawn bank facilities of $401.3 million at 30 June 2020
Group’s current debt ratings (S&P/Moody’s/Fitch) BBB/Baa2/BBB
Debt Structure
1. At 30 June 2020, the balance includes lease liabilities of $58.7 million (Dec 2019: $54.9 million) following the adoption of AASB 16 on 1 July 2019.
2. Net of unamortised transaction costs.
3. Available cash refers to the closing cash balance of $286.9 million (Dec 2019: $652.0 million, Jun 2019: $1,126.0 million) less working capital cash of $48.4 million (Dec 2019: $151.4 million,
Jun 2019: $133.9 million). Working capital cash refers to cash held on the Company’s premises and cash held in bank accounts for day-to-day operations of the businesses.
For
per
sona
l use
onl
y

Crown Resorts Limited - 2020 Full Year Results Presentation 15
Debt Maturity Profile At 30 June 2020
1. Debt maturity profile excludes lease liabilities and other loans.
0
100
200
300
400
500
600
700
800
900
F21 F22 F23 F24 F25 F26 Beyond F26
$m
Drawn Bank Debt Capital Markets Committed Undrawn Facilities Subordinated Notes
For
per
sona
l use
onl
y

Crown Resorts Limited - 2020 Full Year Results Presentation
$m F20 F19
Theoretical EBITDA before Closure Costs and Significant Items 503.8 802.1
Win rate variance 111.6 47.6
Closure Costs included in EBITDA (107.3) -
Crown Sydney pre-opening costs (3.5) -
Reported EBITDA 504.6 849.7
Working capital movements (93.8) 43.0
Cash Flow Generated by Operations 410.8 892.7
Net interest (53.8) (48.0)
Dividends received 5.9 8.9
Income tax payments (36.0) (75.5)
Operating Cash Flow 326.9 778.1
Capital expenditure (net)1 (746.2) (538.5)
Investments (net) (3.9) 6.5
Net borrowings (13.7) (425.0)
Dividends paid (406.2) (409.0)
Share buy-back payments - (131.4)
Effect of exchange rates on cash 4.0 0.7
Net increase / (decrease) in cash (839.1) (718.6)
Closing Cash2 286.9 1,126.0
16
Group Cash Flow
1. Net of proceeds from the sale of property plant and equipment.
2. Includes $48.4 million (Jun 2019: $133.9 million) of cash held on the Company’s premises and cash held in bank accounts for the day-to-day operations of the businesses.
For
per
sona
l use
onl
y

Crown Resorts Limited - 2020 Full Year Results Presentation 17
All information provided in this presentation is provided as at the date stated or otherwise as at the date
of this presentation
This presentation may include forward looking statements which can generally be identified by the use of
forward looking terminology such as “may”, “will”, “expect”, “intend”, “plan”, “estimate”, or “anticipate”.
Forward looking statements, by their nature, involve known and unknown risks, uncertainties and other
factors. Many of those risks and uncertainties are matters which are beyond Crown’s control and could
cause actual results, performance and achievements to differ materially from those contained in this
presentation. Except as required by applicable laws and regulations, Crown does not undertake to
publicly update or review any forward looking statements, whether as a result of new information or
future events
Some information which has been included in this presentation has been provided by third parties. Those
third parties have consented to the inclusion of that information and accordingly, Crown does not assume
responsibility for the correctness or accuracy of the information
This presentation has not taken into account any particular investor’s investment objectives or other
circumstances. Investors are encouraged to make an independent assessment of Crown
This presentation includes certain non-IFRS financial measures which have not been subject to statutory
audit or review
Disclaimer F
or p
erso
nal u
se o
nly