Embed Size (px)
Citation preview

ASX/Media Release
24 August 2016
AJA FULL YEAR RESULTS - MEDIA RELEASE AND PRESENTATION Please find attached the following documents relating to Astro Japan Property Group’s Full Year Results to 30 June 2016: 1. Media Release 2. Results Presentation AJA will present its full year results this afternoon at 4.00pm AEST. The results presentation will be hosted by Mr Eric Lucas, Senior Advisor to AJA. Dial-in details for participation in the conference call are on AJA’s website, www.astrojapanproperty.com. ENDS Investor & Media Enquiries:
Eric Lucas John Pettigrew
Senior Advisor Chief Financial Officer
Phone: +81 3 3238 1671 (Japan) Phone: +61 2 8987 3902
About Astro Japan Property Group (AJA) Astro Japan Property Group is a listed property group which invests in the Japan real estate market. It currently holds interests in a portfolio comprising 29 retail, office, residential and hotel properties. Asset management services in Japan are generally undertaken by Spring Investment Co., Ltd. AJA is a stapled entity comprising Astro Japan Property Trust (ARSN 112 799 854) and Astro Japan Property Group Limited (ABN 25 135 381 663). For further information please visit our website: www.astrojapanproperty.com.
For
per
sona
l use
onl
y
ASX/Media Release
24 August 2016
AJA FULL YEAR RESULTS TO 30 JUNE 2016
Underlying profit after tax of A$31.5 million, up 17.5% on the prior year primarily as a result of increased net property income and an approximate 11% strengthening of the Japanese Yen
Earnings per security increased by 28.5% to 51.9 cents
Statutory net profit after tax of A$132.1 million, compared to A$43.6 million for the prior year
Year on year increase in the value of ongoing portfolio of approximately 2.5% with the 30 June 2016 portfolio size ¥83.0 billion (A$1.08 billion)
Distribution of 36.0 cps for the full year in line with guidance, an increase from 28.5 cps in the prior year
NTA of A$8.26 per security, up 28.3% from A$6.44
Financial results Astro Japan Property Group (ASX: AJA) today announced an underlying profit after tax of A$31.5 million for the full year ended 30 June 2016, 17.5% higher than the prior year, primarily as a result of an approximate 11% strengthening of the Japanese Yen, increased property income and savings in borrowing costs achieved through refinancings during the prior year. These increases have been partially offset by higher asset management fees (including a performance fee of A$5.1 million). Underlying profit after tax is a measure which the Directors believe most accurately and consistently reflects the underlying business performance of AJA. The underlying result for the full year reflects an increase in net property income of 16.7% to A$53.8 million, with 4.7% of the increase due to the consolidation from 1 July 2015 of income from JPTGK which owns a 64% interest in Musashino Towers. On a like for like portfolio basis and excluding currency movements, net property income increased by 4.9%. Statutory net profit after tax for the full year was A$132.1 million, compared to A$43.6 million in the prior year. The increase is mainly driven by foreign exchange rate gains and an increase in value of the property portfolio. Distribution for the six months ended 30 June 2016 of 18 cents per stapled security is to be paid on 31 August 2016. The full year distribution of 36.0 cents per security was less than underlying earnings of 51.9 cents per stapled security, with the balance used for capital management purposes. F
or p
erso
nal u
se o
nly

2
Portfolio Performance Portfolio values continue to show a positive trend with an approximately 2.5% or ¥2.0 billion increase in the value of the portfolio for the full year on a like-for-like basis. As at 30 June 2016, AJA’s total portfolio value was ¥83.0 billion, following the sale of four assets during the year and the purchase of an additional 12% interest in JPTGK. In Australian dollar terms, the value of the portfolio increased from A$877.5 million at 30 June 2015 to A$1.08 billion at 30 June 2016. This increase in property values continues a rising trend in Japanese asset values. The weighted average capitalisation rate used by the independent valuers for the portfolio at 30 June 2016 has tightened to 5.1% from 5.3% at June 2015. Portfolio occupancy by area continues to remain high at 99.1% as at 30 June 2016 compared to 97.3% as at 30 June 2015. Mr Eric Lucas, Senior Advisor to AJA, said, “The continued positive trend in asset values is pleasing, although it still reflects a firming of capitalisation rates more than improvement in actual or expected rental returns. We remain cautious as to how we invest our surplus cash, but are pleased that even in a very strong market we are able to achieve acquisitions such as the hotel purchases announced earlier this week.” Net Tangible Assets Strengthening of the Japanese Yen was the primary factor in a 28.3% increase in NTA to $8.26 cents per security as at 30 June 2016, along with an increase in the Yen value of the portfolio. Capital Management Mr Eric Lucas, Senior Advisor to AJA, said, “Having completed the refinance of all of the portfolio debt on substantially improved terms during the prior fiscal year, our weighted average interest rate has reduced to 1.27% p.a. as at 30 June 2016, and on an annual basis, financing costs were approximately A$1 million or 10% lower than the prior year, with a further saving on annual amortisation payments of approximately A$2.2 million or 52% lower compared to the prior year. The weighted average maturity of AJA’s debt is still comfortable at 6.9 years. AJA currently holds unrestricted cash equivalent to approximately A$45 million, mostly held in Yen, even after setting aside funding for the June 2016 distribution and after settlement of the purchase of the two hotels announced earlier this week.” Post Balance Date Events On 22 August 2016, AJA announced the acquisition of interests in two hotels for a combined purchase price of ¥1.47 billion (A$19.1 million) held through a new special purpose, property owning Japanese company KTS&S Co., Ltd. (JPKT). These assets have been acquired with new 20 year non-cancellable leases and without debt, using part of AJA’s free cash. Outlook Focus will continue to be on deployment of cash resources, portfolio optimisation and asset level performance. Further acquisitions and dispositions continue to be under consideration. Acquisition focus is on longer-term cash flows from younger assets. Dispositions will mainly seek to recycle capital from non-strategic assets to improve portfolio age, quality and long-term portfolio transparency and value.
For
per
sona
l use
onl
y

3
The recently announced acquisition of two hotels demonstrates the Board’s and the asset manager’s objective to further diversify income streams and capitalise on Japan’s growing tourism sector. To maintain the highest possible rental outcomes, AJA expects to continue an ongoing program of capital expenditure on the portfolio, forecast at approximately 10 cents per security, fully funded from cash flows. - J-REIT Investigations Investigation is ongoing of the previously disclosed possibility of a sale of all or substantially all of AJA’s portfolio to a J-REIT or similar vehicle. Although the J-REIT IPO market continues to be active, some recent, smaller issues are trading poorly post IPO. Directors believe AJA’s continued strong liquidity position and both recent and long-term return outperformance vs the A-REIT index dictate that attempting a J-REIT-based liquidity event should be done only with an appropriate level of execution, cost and reputation risks. Examination of this potential option will continue and updates will be made promptly if there is any substantive development. - Earnings and Distribution Guidance Based on a foreign exchange rate of A$1=¥80 and assuming no substantial performance fee to the asset manager, underlying profit after tax for the current fiscal year to 30 June 2017 is expected to increase by approximately 8%-11% to between A$34 million and A$35 million or approximately 56.0 – 58.0 cents per security. Distribution guidance for the 6 months to 31 December 2016 is 21.0 cents per security, an increase from 18.0 cents per security for the most recent 6 month period. Ends Investor & Media Enquiries:
Eric Lucas John Pettigrew Senior Advisor Chief Financial Officer Phone: +81 3 3238 1671 (Japan) Phone: +61 2 8987 3902
About Astro Japan Property Group (AJA) Astro Japan Property Group is a listed property group which invests in the Japan real estate market. It currently holds interests in a portfolio comprising 29 retail, office, residential and hotel properties. Asset management services in Japan are generally undertaken by Spring Investment Co., Ltd. AJA is a stapled entity comprising Astro Japan Property Trust (ARSN 112 799 854) and Astro Japan Property Group Limited (ABN 25 135 381 663). For further information please visit our website: www.astrojapanproperty.com.
F
or p
erso
nal u
se o
nly

First Name, Second Name, Title
Eric Lucas, Senior Advisor
FULL YEAR RESULTS TO 30 JUNE 2016
24 August 2016
For
per
sona
l use
onl
y
2
DISCLAIMER
This publication is issued by the Astro Japan Property Group (“Astro Group”), comprising Astro Japan Property Management Limi ted (ABN 94 111 874 563,
AFSL 283142) (“Responsible Entity”) as responsible entity of the Astro Japan Property Trust (ARSN 112 799 854) (“AJT”) and Astro Japan Property Group
Limited (ABN 25 135 381 663) (“AJCo”).
This Presentation contains summary information about the Astro Group and its activities current as at the date of this Presentation. The information in this
Presentation is of a general nature and does not constitute an offer of, or invitation to invest in or subscribe for, or a recommendation of, Astro Group
stapled securities. The Presentation does not purport to be complete or comprise all information which a securityholder or potential investor may require in
order to determine whether to deal in Astro Group stapled securities. It should be read in conjunction with the Astro Group’s other periodic and continuous
disclosure announcements lodged with the Australian Securities Exchange, which are available at www.asx.com.au.
The Astro Group and its directors, officers, employees and contractors do not accept, and expressly disclaim, any liability whatsoever for any loss
howsoever arising from any use of this Presentation or its contents. The information in this Presentation remains subject to change without notice.
This Presentation is not intended to constitute legal, tax or accounting advice or opinion. No representation or warranty, express or implied, is made as to
the accuracy, completeness or thoroughness of the content of the information contained in this Presentation. Recipients should consult with their own
investment, financial, taxation or other professional adviser as to the accuracy and application of the information contained herein and should conduct their
own due diligence and other enquiries in relation to such information.
The information contained in this Presentation constitutes general information only. The Responsible Entity is not licensed to provide financial product
advice (including personal financial product advice), and the information contained in this Presentation does not constitute financial product advice.
In providing this Presentation, the Astro Group has not considered the investment objectives, financial situation and particular needs of an investor. Before
making any investment decision with respect to Astro Group stapled securities, an investor should consider its own investment objectives, financial
circumstances and needs, and if necessary consult its investment, financial, taxation or other professional adviser. An investment in Astro Group stapled
securities is subject to investment and other known and unknown risks, some of which are beyond the control of Astro Group. The Astro Group does not
guarantee any particular rate of return or the performance of Astro Group.
This Presentation may contain forward looking statements. Forward looking statements include those containing such words as “anticipate”, “estimates”,
“will”, “should”, “could”, “may”, “expects”, “plans” or similar expressions. Indications of and guidance or outlook on future revenues, distributions or financial
position and performance or return or growth in underlying investments included in this Presentation, are also forward looking statements. No
representation or warranty is given as to the accuracy, completeness, likelihood of achievement or reasonableness of any forecasts, projections, prospects,
returns, forward-looking statements or statements in relation to future matters contained in the information provided in this document. Such guidance, For
per
sona
l use
onl
y
3
DISCLAIMER (cont’d) forecasts, projections, prospects, returns and statements are by their nature subject to significant unknown risks, uncertainties and contingencies, many of which are
outside the control of the Astro Group, that may cause actual results to differ materially from those expressed or implied in such statements. There can be no
assurance that actual outcomes will not differ materially from these statements. An investment in the Astro Group is subject to investment risk including possible loss
of income and principal invested.
The Astro Group specifically prohibits the redistribution or reproduction of this material in whole or in part without the written permission of the Astro Group and the
Astro Group accepts no liability whatsoever for the actions of third parties in this respect.
Asset management services in Japan are generally undertaken by Spring Investment Co., Limited (“Spring”). Property level information contained in this
Presentation has been provided by Spring. The Astro Group’s property interests are held via a Japanese Tokumei Kumiai structure, which is a contractual
arrangement whereby the Astro Group has no ownership interest in the properties. Refer to the Astro Group website under About Us – Ownership Structure for more
details, www.astrojapanproperty.com.
For
per
sona
l use
onl
y
4
AGENDA
• Overview
• Portfolio operating performance and leasing activity
• Capital structure
• Outlook
• Appendices
For
per
sona
l use
onl
y

First Name, Second Name, Title
OVERVIEW
For
per
sona
l use
onl
y
6
OVERVIEW
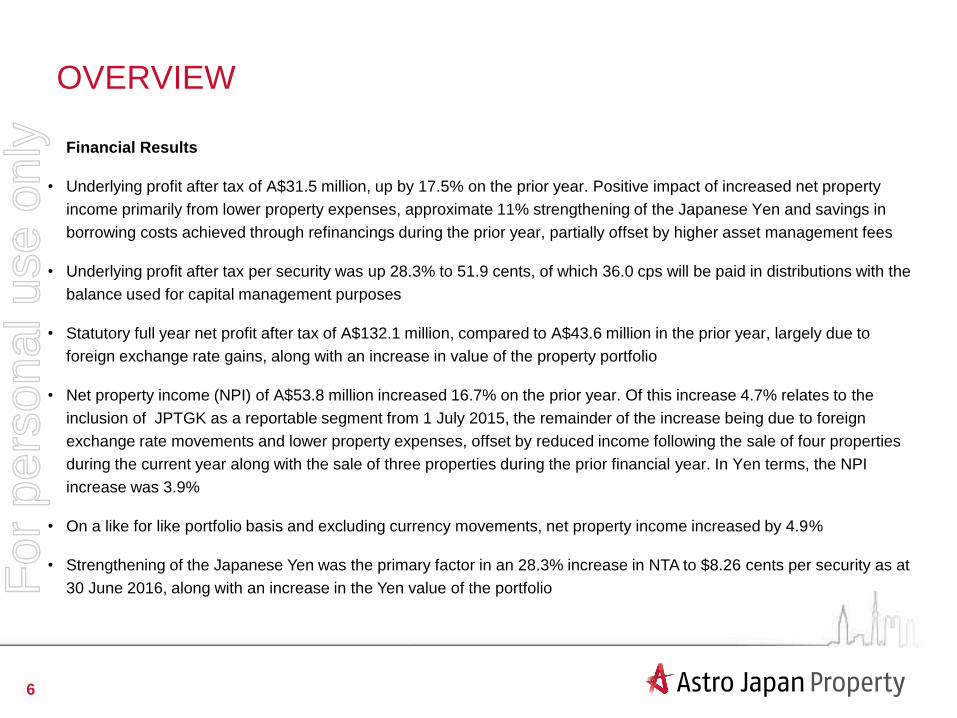
Financial Results
• Underlying profit after tax of A$31.5 million, up by 17.5% on the prior year. Positive impact of increased net property
income primarily from lower property expenses, approximate 11% strengthening of the Japanese Yen and savings in
borrowing costs achieved through refinancings during the prior year, partially offset by higher asset management fees
• Underlying profit after tax per security was up 28.3% to 51.9 cents, of which 36.0 cps will be paid in distributions with the
balance used for capital management purposes
• Statutory full year net profit after tax of A$132.1 million, compared to A$43.6 million in the prior year, largely due to
foreign exchange rate gains, along with an increase in value of the property portfolio
• Net property income (NPI) of A$53.8 million increased 16.7% on the prior year. Of this increase 4.7% relates to the
inclusion of JPTGK as a reportable segment from 1 July 2015, the remainder of the increase being due to foreign
exchange rate movements and lower property expenses, offset by reduced income following the sale of four properties
during the current year along with the sale of three properties during the prior financial year. In Yen terms, the NPI
increase was 3.9%
• On a like for like portfolio basis and excluding currency movements, net property income increased by 4.9%
• Strengthening of the Japanese Yen was the primary factor in an 28.3% increase in NTA to $8.26 cents per security as at
30 June 2016, along with an increase in the Yen value of the portfolio For
per
sona
l use
onl
y
7
OVERVIEW (CONT’D)
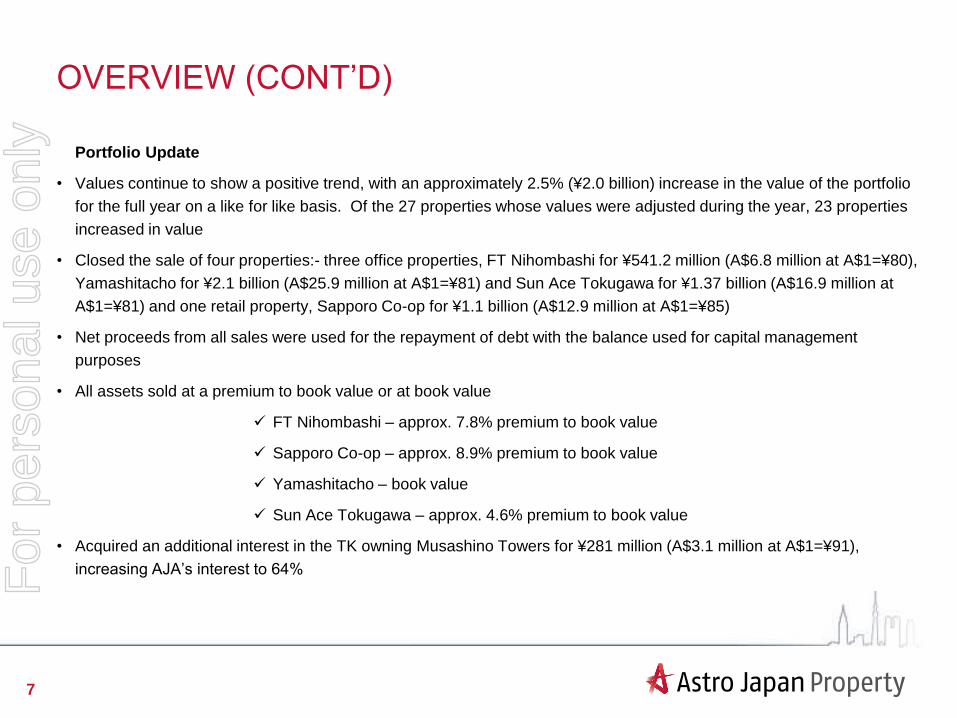
Portfolio Update
• Values continue to show a positive trend, with an approximately 2.5% (¥2.0 billion) increase in the value of the portfolio
for the full year on a like for like basis. Of the 27 properties whose values were adjusted during the year, 23 properties
increased in value
• Closed the sale of four properties:- three office properties, FT Nihombashi for ¥541.2 million (A$6.8 million at A$1=¥80),
Yamashitacho for ¥2.1 billion (A$25.9 million at A$1=¥81) and Sun Ace Tokugawa for ¥1.37 billion (A$16.9 million at
A$1=¥81) and one retail property, Sapporo Co-op for ¥1.1 billion (A$12.9 million at A$1=¥85)
• Net proceeds from all sales were used for the repayment of debt with the balance used for capital management
purposes
• All assets sold at a premium to book value or at book value
FT Nihombashi – approx. 7.8% premium to book value
Sapporo Co-op – approx. 8.9% premium to book value
Yamashitacho – book value
Sun Ace Tokugawa – approx. 4.6% premium to book value
• Acquired an additional interest in the TK owning Musashino Towers for ¥281 million (A$3.1 million at A$1=¥91),
increasing AJA’s interest to 64%For
per
sona
l use
onl
y

8
OVERVIEW (CONT’D)
Post Balance Date
• On 22 August 2016 AJA announced the acquisition of interests in two hotels for a combined purchase price of
¥1.47 billion (A$19.1 million at A$1=¥77) held through a new special purpose, property owning Japanese company
KTS&S Co., Ltd. (JPKT). These assets have been acquired with new 20 year non-cancellable leases to an
experienced Japanese hotel operator, Kuretakeso, and without debt, using part of AJA’s free cash
Kuretake Inn Asahikawa Kuretake Inn Okayama
For
per
sona
l use
onl
y
9
OVERVIEW (CONT’D)
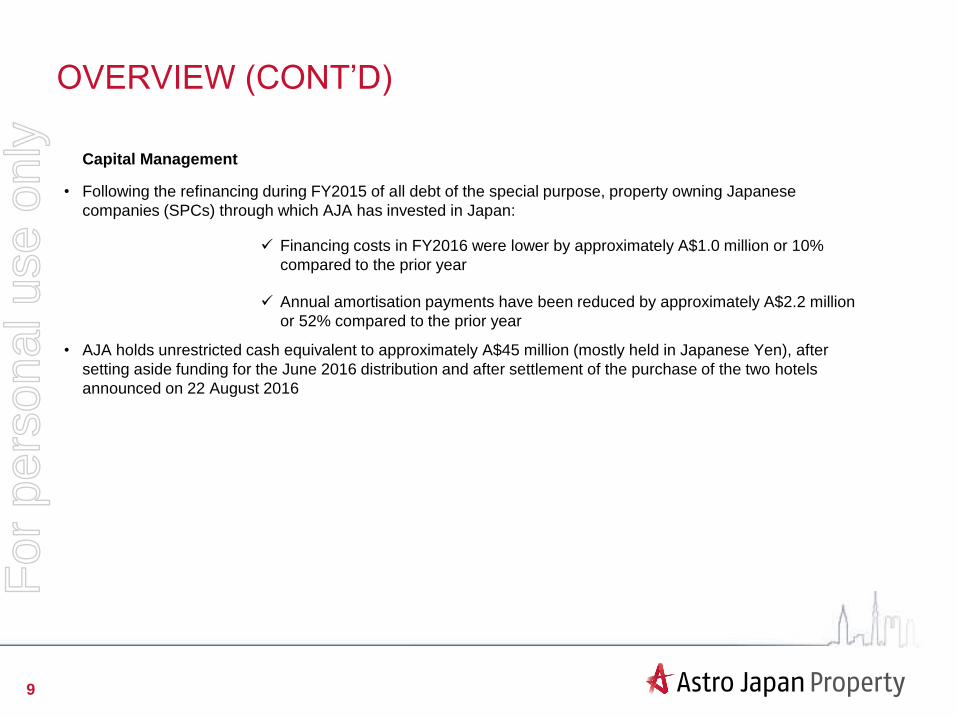
Capital Management
• Following the refinancing during FY2015 of all debt of the special purpose, property owning Japanese
companies (SPCs) through which AJA has invested in Japan:
Financing costs in FY2016 were lower by approximately A$1.0 million or 10%
compared to the prior year
Annual amortisation payments have been reduced by approximately A$2.2 million
or 52% compared to the prior year
• AJA holds unrestricted cash equivalent to approximately A$45 million (mostly held in Japanese Yen), after
setting aside funding for the June 2016 distribution and after settlement of the purchase of the two hotels
announced on 22 August 2016
For
per
sona
l use
onl
y
10
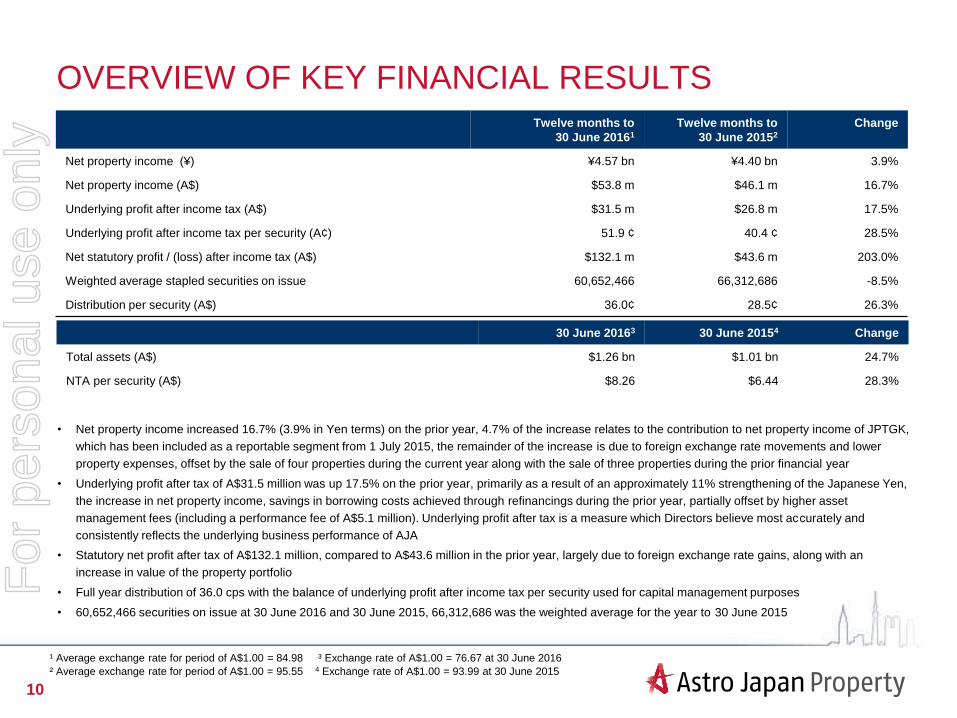
OVERVIEW OF KEY FINANCIAL RESULTSTwelve months to
30 June 20161
Twelve months to
30 June 20152
Change
Net property income (¥) ¥4.57 bn ¥4.40 bn 3.9%
Net property income (A$) $53.8 m $46.1 m 16.7%
Underlying profit after income tax (A$) $31.5 m $26.8 m 17.5%
Underlying profit after income tax per security (A¢) 51.9 ¢ 40.4 ¢ 28.5%
Net statutory profit / (loss) after income tax (A$) $132.1 m $43.6 m 203.0%
Weighted average stapled securities on issue 60,652,466 66,312,686 -8.5%
Distribution per security (A$) 36.0¢ 28.5¢ 26.3%
30 June 20163 30 June 20154 Change
Total assets (A$) $1.26 bn $1.01 bn 24.7%
NTA per security (A$) $8.26 $6.44 28.3%
• Net property income increased 16.7% (3.9% in Yen terms) on the prior year, 4.7% of the increase relates to the contribution to net property income of JPTGK,
which has been included as a reportable segment from 1 July 2015, the remainder of the increase is due to foreign exchange rate movements and lower
property expenses, offset by the sale of four properties during the current year along with the sale of three properties during the prior financial year
• Underlying profit after tax of A$31.5 million was up 17.5% on the prior year, primarily as a result of an approximately 11% strengthening of the Japanese Yen,
the increase in net property income, savings in borrowing costs achieved through refinancings during the prior year, partially offset by higher asset
management fees (including a performance fee of A$5.1 million). Underlying profit after tax is a measure which Directors believe most accurately and
consistently reflects the underlying business performance of AJA
• Statutory net profit after tax of A$132.1 million, compared to A$43.6 million in the prior year, largely due to foreign exchange rate gains, along with an
increase in value of the property portfolio
• Full year distribution of 36.0 cps with the balance of underlying profit after income tax per security used for capital management purposes
• 60,652,466 securities on issue at 30 June 2016 and 30 June 2015, 66,312,686 was the weighted average for the year to 30 June 2015
¹ Average exchange rate for period of A$1.00 = 84.98 ³ Exchange rate of A$1.00 = 76.67 at 30 June 2016
² Average exchange rate for period of A$1.00 = 95.55 4 Exchange rate of A$1.00 = 93.99 at 30 June 2015
For
per
sona
l use
onl
y

11
NOTE: The above calculations have not been subject to independent audit or review.
RECONCILIATION TO FINANCIAL STATEMENTS
Year ended 30 June 2016
A$
Year ended 30 June 2015
A$
Statutory Profit for the year $132.1 m $43.6 m
Fair value adjustments to unlisted investments $0.9 m $(0.8) m
Fair value adjustments to interest bearing debt $3.8 m $3.2 m
Foreign currency translation impact on the fair value of the TKs $(82.3) m $(3.8) m
TK operator share of TK distributions $0.1 m $0.1 m
Net fair value adjustment to investment properties $(19.2) m $(21.9) m
Net foreign currency gain $(8.5) m $(1.2) m
Loss/(gain) on disposal of investment properties $0.2 m $(4.6) m
Expenses associated with TK refinancings $0.8 m $5.0 m
Impairment of Goodwill - $0.4 m
Deferred tax on fair value adjustments $3.6 m $6.8 m
Underlying profit after tax $31.5 m $26.8 m
As at 30 June 2016 - A$ As at 30 June 2015 - A$
Net assets $503.3 m $393.0 m
Deferred tax $0.1 m $0.4 m
Intangible assets $(2.6) m $(2.6) m
NTA $500.8 m $390.8 m
NTA per security (A$) $8.26 $6.44
Percentage change (A$) 28.3%
Percentage change (A$/Yen exchange rate) 18.4%
For
per
sona
l use
onl
y
12
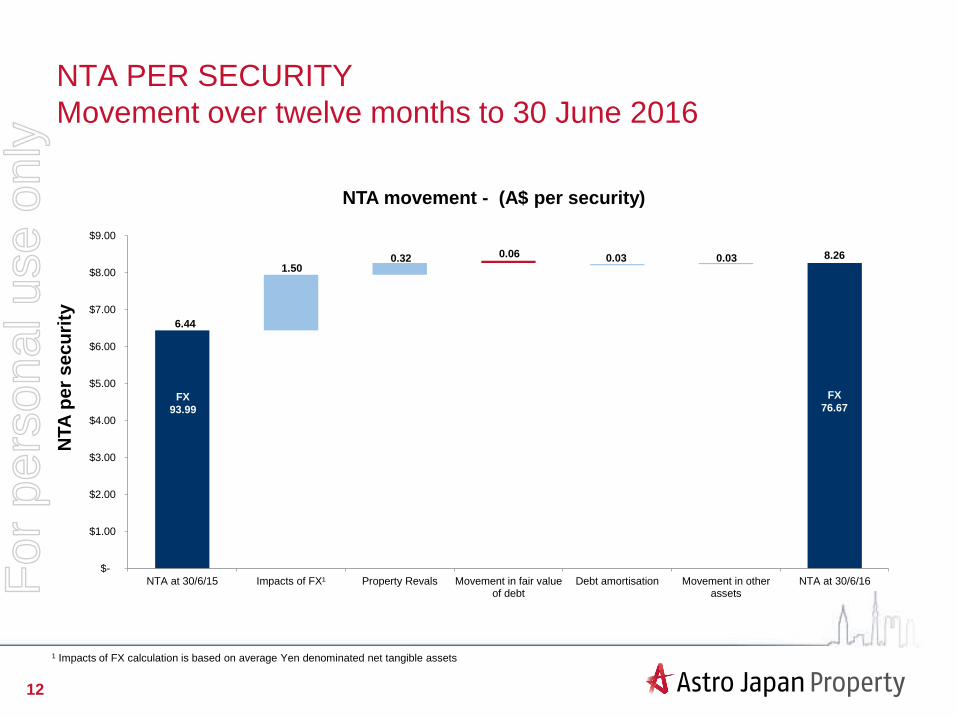
NTA PER SECURITY
Movement over twelve months to 30 June 2016
1 Impacts of FX calculation is based on average Yen denominated net tangible assets
8.260.06
1.500.32 0.03 0.03
6.44
$-
$1.00
$2.00
$3.00
$4.00
$5.00
$6.00
$7.00
$8.00
$9.00
NTA at 30/6/15 Impacts of FX¹ Property Revals Movement in fair valueof debt
Debt amortisation Movement in otherassets
NTA at 30/6/16
NTA
pe
r s
ec
uri
ty
NTA movement - (A$ per security)
FX
93.99
FX
76.67
For
per
sona
l use
onl
y

13
NTA SENSITIVITIES
NTA sensitivity to revaluations NTA sensitivity to A$:¥ exchange rate
5.58
6.47
7.37
8.26
9.15
10.04
10.93
$0.00
$2.00
$4.00
$6.00
$8.00
$10.00
$12.00
-15% -10% -5% 0% 5% 10% 15%
NTA
(A
$)
Property revaluations
10.44
9.67
9.00
8.267.93
7.49
7.10
$0.00
$2.00
$4.00
$6.00
$8.00
$10.00
$12.00
60 65 70 76.67 80 85 90
NT
A (
A$
)
A$:¥ exchange rateFor
per
sona
l use
onl
y
First Name, Second Name, Title
PORTFOLIO OPERATING PERFORMANCE AND
LEASING ACTIVITY
For
per
sona
l use
onl
y
15
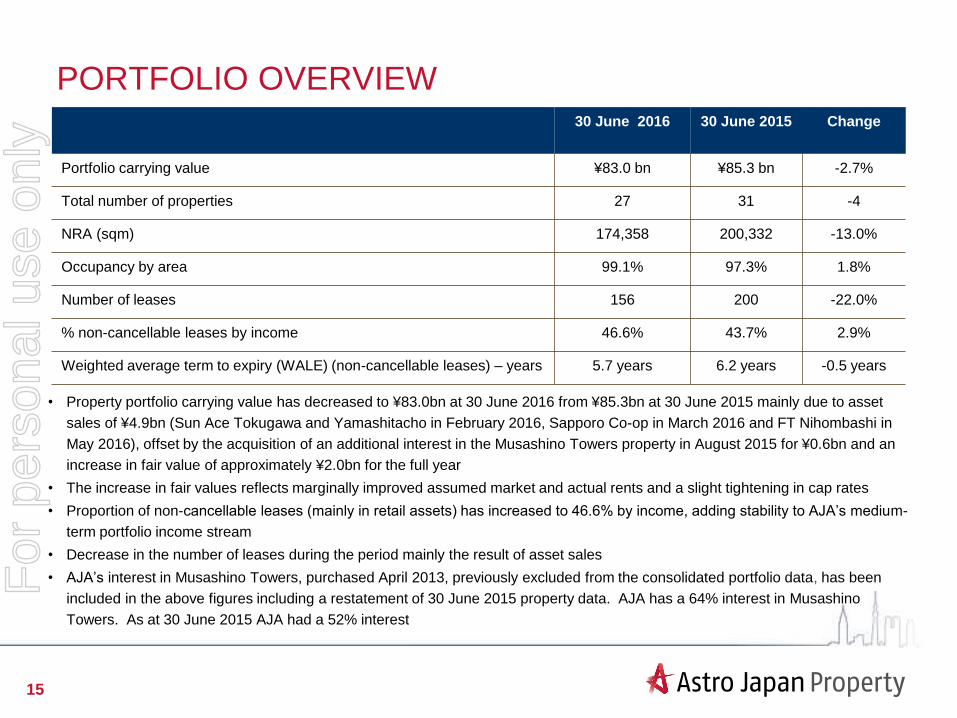
PORTFOLIO OVERVIEW 30 June 2016 30 June 2015 Change
Portfolio carrying value ¥83.0 bn ¥85.3 bn -2.7%
Total number of properties 27 31 -4
NRA (sqm) 174,358 200,332 -13.0%
Occupancy by area 99.1% 97.3% 1.8%
Number of leases 156 200 -22.0%
% non-cancellable leases by income 46.6% 43.7% 2.9%
Weighted average term to expiry (WALE) (non-cancellable leases) – years 5.7 years 6.2 years -0.5 years
• Property portfolio carrying value has decreased to ¥83.0bn at 30 June 2016 from ¥85.3bn at 30 June 2015 mainly due to asset
sales of ¥4.9bn (Sun Ace Tokugawa and Yamashitacho in February 2016, Sapporo Co-op in March 2016 and FT Nihombashi in
May 2016), offset by the acquisition of an additional interest in the Musashino Towers property in August 2015 for ¥0.6bn and an
increase in fair value of approximately ¥2.0bn for the full year
• The increase in fair values reflects marginally improved assumed market and actual rents and a slight tightening in cap rates
• Proportion of non-cancellable leases (mainly in retail assets) has increased to 46.6% by income, adding stability to AJA’s medium-
term portfolio income stream
• Decrease in the number of leases during the period mainly the result of asset sales
• AJA’s interest in Musashino Towers, purchased April 2013, previously excluded from the consolidated portfolio data, has been
included in the above figures including a restatement of 30 June 2015 property data. AJA has a 64% interest in Musashino
Towers. As at 30 June 2015 AJA had a 52% interest
For
per
sona
l use
onl
y

16
MAIN COMPONENTS OF LIKE FOR LIKE PROPERTY
REVENUE (LIKE FOR LIKE PORTFOLIO¹)
Property revenue (¥ million)Twelve months to
30 June 2016
Twelve months to
30 June 2015Change
Retail 2,958 2,935 0.8%
Office 1,854 1,818 2.0%
Residential 644 635 1.4%
Total portfolio 5,456 5,388 1.3%
Occupancy by area 30 June 2016 30 June 2015 Change
Retail 99.2% 99.2% 0.0%
Office 98.0% 95.3% 2.7%
Residential 100.0% 100.0% 0.0%
Total portfolio 99.1% 98.6% 0.5%
• Property revenue increased slightly relative to the prior corresponding period on a like for like basis
• Period end occupancy also increased slightly relative to the prior period end on a like for like basis
1 Property revenue for the ongoing portfolio excludes any properties purchased or sold since June 2014
For
per
sona
l use
onl
y
17
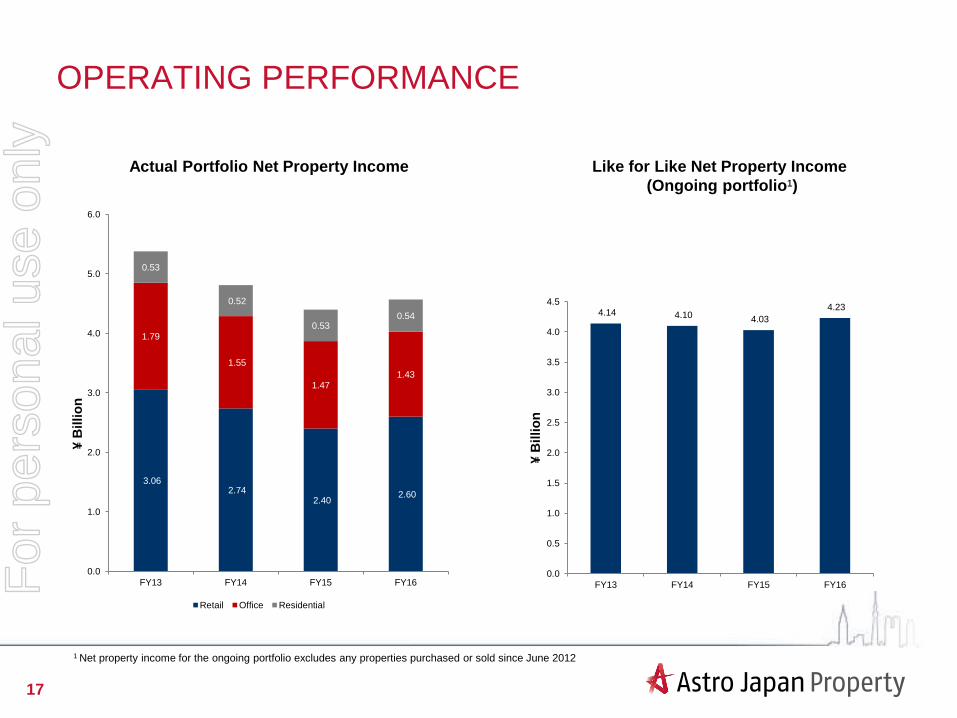
OPERATING PERFORMANCE
1 Net property income for the ongoing portfolio excludes any properties purchased or sold since June 2012
Like for Like Net Property Income
(Ongoing portfolio¹)
Actual Portfolio Net Property Income
4.14 4.10 4.03
4.23
0.0
0.5
1.0
1.5
2.0
2.5
3.0
3.5
4.0
4.5
FY13 FY14 FY15 FY16
¥ B
illio
n
3.06 2.74
2.40 2.60
1.79
1.55
1.471.43
0.53
0.52
0.530.54
0.0
1.0
2.0
3.0
4.0
5.0
6.0
FY13 FY14 FY15 FY16
¥ B
illio
n
Retail Office Residential
For
per
sona
l use
onl
y

18
TOP 10 TENANTS
Tenant Name Property Industry Lease type
% of Trust’s
total passing
rent + CAM
Lease expiry
date
Toyota Tsusho Corp /
Konan Shoji
Konan Home Centre Trading / Retail Fixed non-cancellable1 11.5% March 2025
Good Real Estate Tosabori Real Estate Fixed non-cancellable2 5.9% March 2024
Matahari Kawasaki Dice Game Centre Standard 4.0% August 2023
City of Yokohama JN Government Standard 3.9% March 2017
Gaia Shinjuku Fuji Game Centre Fixed cancellable 3.9% July 2020
Jikei Space Sekijomachi School Standard non-cancellable3 3.5% March 2022
Maxvalu Tokai Susono Retail Fixed non-cancellable4 3.5% April 2024
Konami Sports & Life Shibuya Konami Fitness Club Standard 3.1% March 2019
Kyodo PR Ginza Dowa Advertising Standard 3.1% January 2017
Nitori Holdings Matsudo Nitori /
Matsudo Nitori Parking
Retail Standard non-cancellable5 /
Fixed non-cancellable6
2.8% September 2024
TOTAL 45.3%
As at 30 June 2016
1 The property is 100% leased to Konan Shoji on a 20 year lease. For the first 12 years (until March 2017) the master lessee under a non-cancellable Fixed Term Lease is Toyota Tsusho Corporation pursuant to which Toyota Tsusho
subleases to Konan Shoji. From the end of the 12 year master lease term the lease is directly with Konan Shoji.2 9.5 year lease, The lease is non-cancellable during the term (until March 2024). 315 year lease, The lease is non-cancellable (until July 2018).410 year lease. The lease is non-cancellable during the initial three years (until April 2017). 520 year lease. The lease is non-cancellable during the term (until September 2024). 620 year lease. The lease is non-cancellable during the term (until June 2023).
For
per
sona
l use
onl
y
19
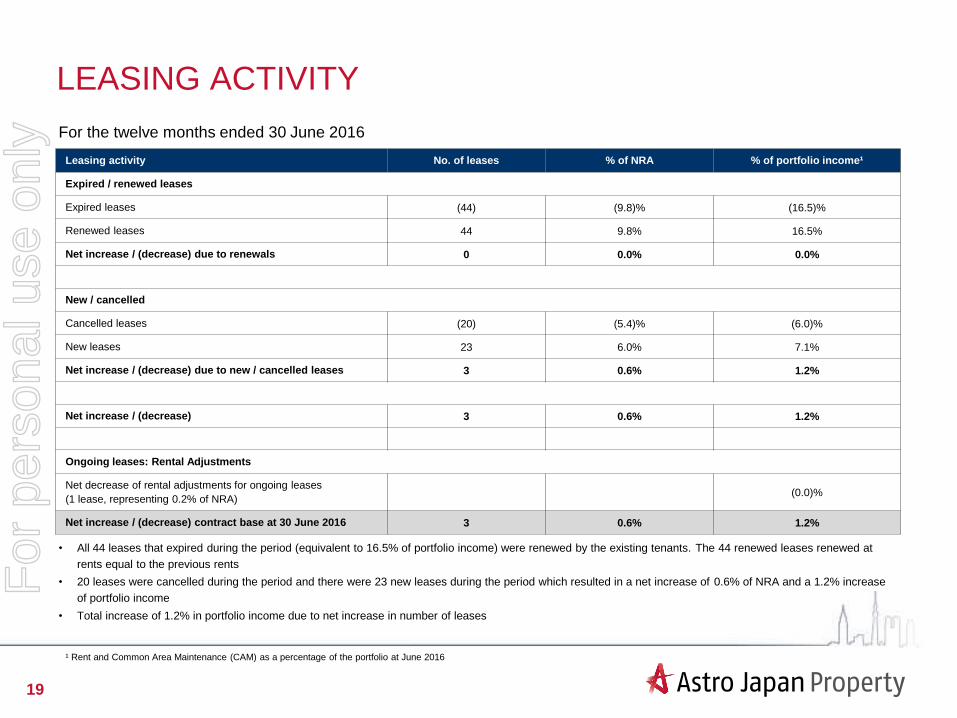
LEASING ACTIVITY
For the twelve months ended 30 June 2016
Leasing activity No. of leases % of NRA % of portfolio income¹
Expired / renewed leases
Expired leases (44) (9.8)% (16.5)%
Renewed leases 44 9.8% 16.5%
Net increase / (decrease) due to renewals 0 0.0% 0.0%
New / cancelled
Cancelled leases (20) (5.4)% (6.0)%
New leases 23 6.0% 7.1%
Net increase / (decrease) due to new / cancelled leases 3 0.6% 1.2%
Net increase / (decrease) 3 0.6% 1.2%
Ongoing leases: Rental Adjustments
Net decrease of rental adjustments for ongoing leases
(1 lease, representing 0.2% of NRA)(0.0)%
Net increase / (decrease) contract base at 30 June 2016 3 0.6% 1.2%
• All 44 leases that expired during the period (equivalent to 16.5% of portfolio income) were renewed by the existing tenants. The 44 renewed leases renewed at
rents equal to the previous rents
• 20 leases were cancelled during the period and there were 23 new leases during the period which resulted in a net increase of 0.6% of NRA and a 1.2% increase
of portfolio income
• Total increase of 1.2% in portfolio income due to net increase in number of leases
¹ Rent and Common Area Maintenance (CAM) as a percentage of the portfolio at June 2016
For
per
sona
l use
onl
y

20
LEASING ACTIVITY COMPARISON
Cancelled and New leases (% of NRA)
3.8%
6.5%
5.2%
3.0%
7.3%
2.6%
2.1%2.3%
4.2%
1.4%
3.5%
7.7%
7.0%
1.7%
0.9%
4.4%
1.4%
5.5%
4.0%
3.4%
6.6%
4.1%
2.2%
2.9%2.6%
4.0%
3.4%
10.4%
6.8%
1.3%1.0%
4.8%
0%
2%
4%
6%
8%
10%
12%
Dec-08 Jun-09 Dec-09 Jun-10 Dec-10 Jun-11 Dec-11 Jun-12 Dec-12 Jun-13 Dec-13 Jun-14 Dec-14 Jun-15 Dec-15 Jun-16
Cancelled Leases New Leases
For
per
sona
l use
onl
y

21
LEASING ACTIVITY COMPARISON (CONT’D)
Expired and Renewed leases (% of NRA)
3.3%
4.9%
3.7%
4.9%
1.9%
5.3%
3.6%
4.8%
2.3%
3.5%
4.8%
5.3%
2.2%
7.6%
3.9%
5.3%
0%
1%
2%
3%
4%
5%
6%
7%
8%
Dec-08 Jun-09 Dec-09 Jun-10 Dec-10 Jun-11 Dec-11 Jun-12 Dec-12 Jun-13 Dec-13 Jun-14 Dec-14 Jun-15 Dec-15 Jun-16
Expired Leases Renewed Lease
For
per
sona
l use
onl
y
22
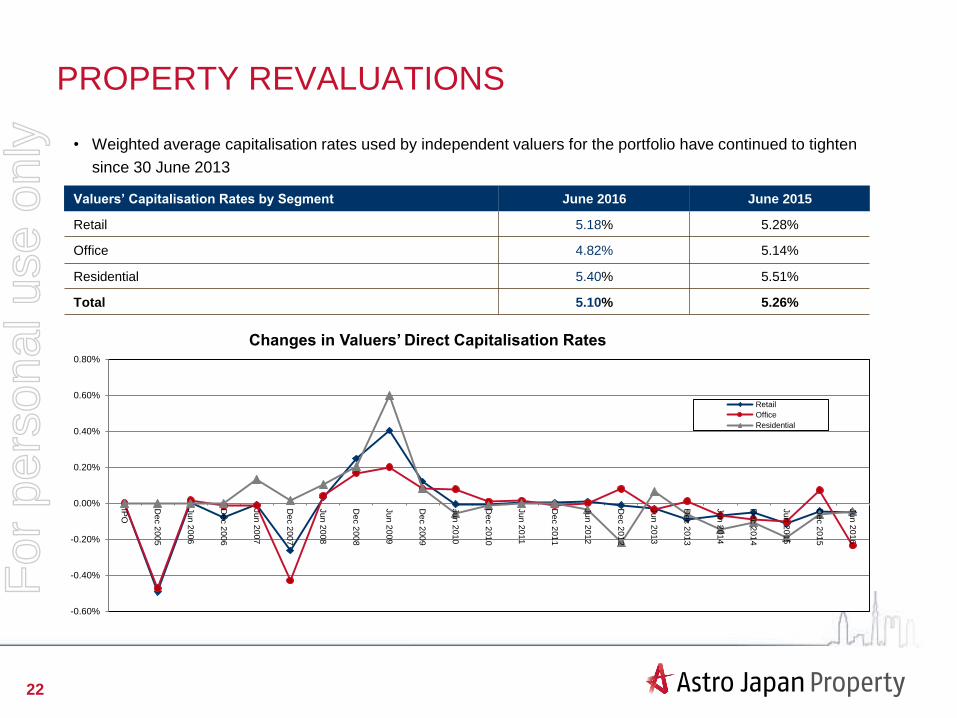
PROPERTY REVALUATIONS
Valuers’ Capitalisation Rates by Segment June 2016 June 2015
Retail 5.18% 5.28%
Office 4.82% 5.14%
Residential 5.40% 5.51%
Total 5.10% 5.26%
Changes in Valuers’ Direct Capitalisation Rates
• Weighted average capitalisation rates used by independent valuers for the portfolio have continued to tighten
since 30 June 2013
-0.60%
-0.40%
-0.20%
0.00%
0.20%
0.40%
0.60%
0.80%
IPO
Dec 2
005
Jun 2
006
Dec 2
006
Jun 2
007
Dec 2
007
Jun 2
008
Dec 2
008
Jun 2
009
Dec 2
009
Jun 2
010
Dec 2
010
Jun 2
011
Dec 2
011
Jun 2
012
Dec 2
012
Jun 2
013
Dec 2
013
Jun 2
014
Dec 2
014
Jun 2
015
Dec 2
015
Jun 2
016
Retail
Office
Residential
For
per
sona
l use
onl
y
23
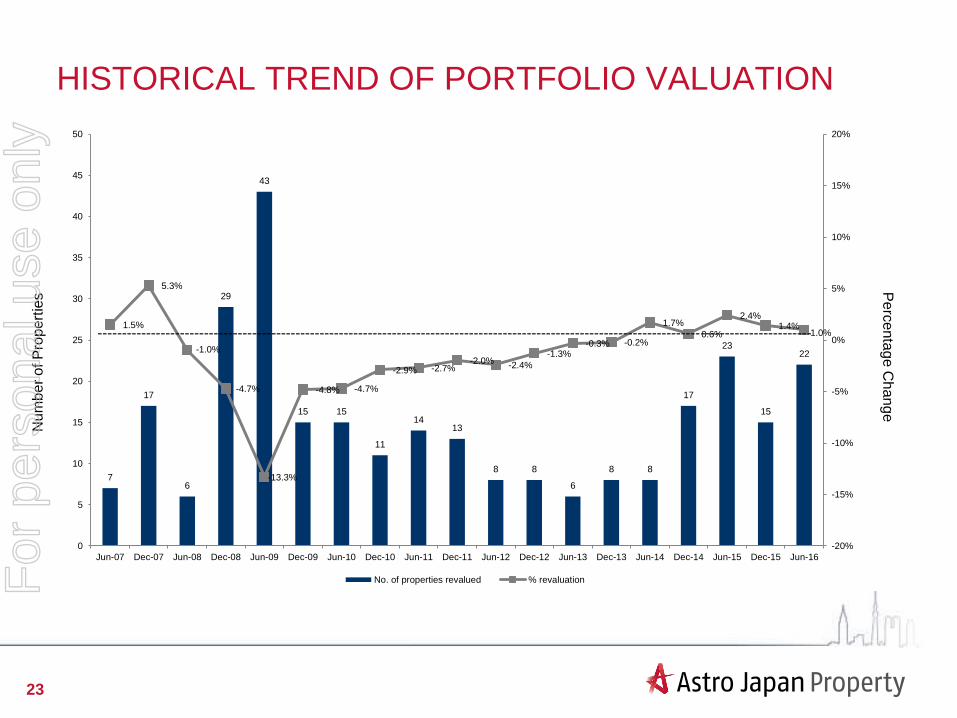
HISTORICAL TREND OF PORTFOLIO VALUATION
Nu
mb
er
of P
rope
rtie
s
Pe
rce
nta
ge
Ch
an
ge
7
17
6
29
43
15 15
11
1413
8 8
6
8 8
17
23
15
22
1.5%
5.3%
-1.0%
-4.7%
-13.3%
-4.8% -4.7%
-2.9% -2.7%-2.0%
-2.4%
-1.3%-0.3% -0.2%
1.7%
0.6%
2.4%1.4%
1.0%
-20%
-15%
-10%
-5%
0%
5%
10%
15%
20%
0
5
10
15
20
25
30
35
40
45
50
Jun-07 Dec-07 Jun-08 Dec-08 Jun-09 Dec-09 Jun-10 Dec-10 Jun-11 Dec-11 Jun-12 Dec-12 Jun-13 Dec-13 Jun-14 Dec-14 Jun-15 Dec-15 Jun-16
No. of properties revalued % revaluation
----------------------------------------------------------------------------------------------------------------------------------------------------
For
per
sona
l use
onl
y
24
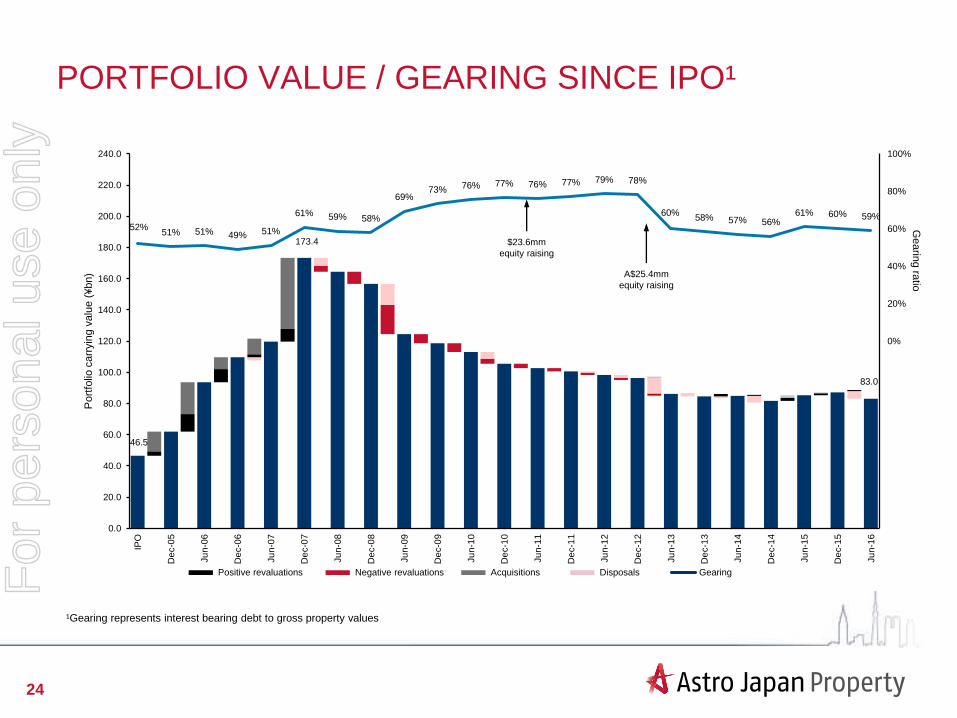
PORTFOLIO VALUE / GEARING SINCE IPO¹
A$25.4mm
equity raising
$23.6mm
equity raising
Negative revaluationsPositive revaluations Acquisitions Disposals Gearing
173.4
83.0
46.5
52%51% 51% 49% 51%
61% 59% 58%
69%73% 76% 77% 76% 77% 79% 78%
60%58% 57% 56%
61% 60% 59%
0%
20%
40%
60%
80%
100%
0.0
20.0
40.0
60.0
80.0
100.0
120.0
140.0
160.0
180.0
200.0
220.0
240.0
IPO
De
c-0
5
Ju
n-0
6
De
c-0
6
Ju
n-0
7
De
c-0
7
Ju
n-0
8
De
c-0
8
Ju
n-0
9
De
c-0
9
Ju
n-1
0
De
c-1
0
Ju
n-1
1
De
c-1
1
Ju
n-1
2
De
c-1
2
Ju
n-1
3
De
c-1
3
Ju
n-1
4
De
c-1
4
Ju
n-1
5
De
c-1
5
Ju
n-1
6
Gearin
g ra
tio
Port
folio
carr
yin
g v
alu
e (
¥bn)
¹Gearing represents interest bearing debt to gross property values
For
per
sona
l use
onl
y

25
PORTFOLIO YIELD DATA AS AT 30 JUNE 2016
Asset class
Original NOI yield /
purchase price
Current NOI yield /
current book value
June 2016
Weighted average
valuation cap rates¹
June 2016
Retail 5.3% 5.4% 5.2%
Office 5.0% 5.2% 4.8%
Residential 5.5% 5.8% 5.4%
Total 5.2% 5.4% 5.1%
¹ Cap rate used by valuers for NCF (underlying income less leasing fees less capex)
For
per
sona
l use
onl
y

First Name, Second Name, Title
CAPITAL STRUCTURE
For
per
sona
l use
onl
y
27
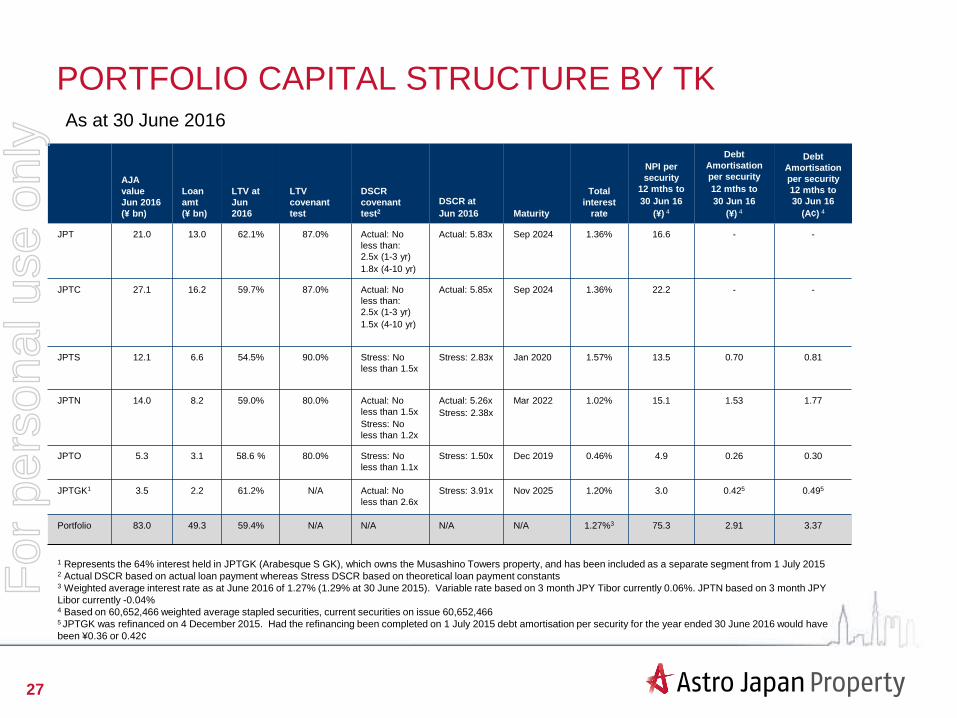
PORTFOLIO CAPITAL STRUCTURE BY TK
AJA
value
Jun 2016
(¥ bn)
Loan
amt
(¥ bn)
LTV at
Jun
2016
LTV
covenant
test
DSCR
covenant
test2
DSCR at
Jun 2016 Maturity
Total
interest
rate
NPI per
security
12 mths to
30 Jun 16
(¥) 4
Debt
Amortisation
per security
12 mths to
30 Jun 16
(¥) 4
Debt
Amortisation
per security
12 mths to
30 Jun 16
(A¢) 4
JPT 21.0 13.0 62.1% 87.0% Actual: No
less than:
2.5x (1-3 yr)
1.8x (4-10 yr)
Actual: 5.83x Sep 2024 1.36% 16.6 - -
JPTC 27.1 16.2 59.7% 87.0% Actual: No
less than:
2.5x (1-3 yr)
1.5x (4-10 yr)
Actual: 5.85x Sep 2024 1.36% 22.2 - -
JPTS 12.1 6.6 54.5% 90.0% Stress: No
less than 1.5x
Stress: 2.83x Jan 2020 1.57% 13.5 0.70 0.81
JPTN 14.0 8.2 59.0% 80.0% Actual: No
less than 1.5x
Stress: No
less than 1.2x
Actual: 5.26x
Stress: 2.38x
Mar 2022 1.02% 15.1 1.53 1.77
JPTO 5.3 3.1 58.6 % 80.0% Stress: No
less than 1.1x
Stress: 1.50x Dec 2019 0.46% 4.9 0.26 0.30
JPTGK1 3.5 2.2 61.2% N/A Actual: No
less than 2.6x
Stress: 3.91x Nov 2025 1.20% 3.0 0.425 0.495
Portfolio 83.0 49.3 59.4% N/A N/A N/A N/A 1.27%3 75.3 2.91 3.37
1 Represents the 64% interest held in JPTGK (Arabesque S GK), which owns the Musashino Towers property, and has been included as a separate segment from 1 July 20152 Actual DSCR based on actual loan payment whereas Stress DSCR based on theoretical loan payment constants3 Weighted average interest rate as at June 2016 of 1.27% (1.29% at 30 June 2015). Variable rate based on 3 month JPY Tibor currently 0.06%. JPTN based on 3 month JPY
Libor currently -0.04%4 Based on 60,652,466 weighted average stapled securities, current securities on issue 60,652,4665 JPTGK was refinanced on 4 December 2015. Had the refinancing been completed on 1 July 2015 debt amortisation per security for the year ended 30 June 2016 would have
been ¥0.36 or 0.42¢
As at 30 June 2016
For
per
sona
l use
onl
y

28
CAPITAL MANAGEMENT
1 Based on 60,652,466 stapled securities as at 30 June 2016 and exchange rate at 30 June 2016 of ¥76.67
Debt Maturity Profile (¥ bn) as at 30 June 2016
As at 30 June 2016
Number of non-recourse, asset specific loans, borrowed in ¥ in Japan 6
Weighted average portfolio interest rate Approx 1.27%
Proportion of AJA debt based on floating rate Approx 53.2%
Weighted average debt maturity 6.9 years
Annual debt amortisation 3.5 cps1
3.1
6.68.2
29.2
2.2
0.0
5.0
10.0
15.0
20.0
25.0
30.0
35.0
¥ b
n
For
per
sona
l use
onl
y

First Name, Second Name, Title
OUTLOOK
For
per
sona
l use
onl
y

30
JAPANESE ECONOMIC OUTLOOK
Overall Japanese market and economic outlook
• Prime Minister Abe’s Liberal Democratic coalition now has a “super majority” in both the upper and lower
houses of parliament which provides opportunity for much needed structural reforms
• Sales tax increase from 8% to 10% has now been deferred to October, 2019, as had been widely expected, in
attempt to avoid a negative impact on Japan’s recovery
• Balance of trade numbers have returned to strength assisted by lower energy costs
For
per
sona
l use
onl
y

31
JAPANESE ECONOMIC OUTLOOK (CONT’D)
• The Japanese economy expanded 0.5% in the quarter ended 31 March 2016 with private consumption
growing faster than expected
• Further fiscal and monetary programmes have been announced to stimulate consumption and improve export
revenues
• Housing lending, prices and starts all showing a positive trend, underpinned by further loosening of monetary
policy
For
per
sona
l use
onl
y

32
JAPANESE ECONOMIC OUTLOOK (CONT’D)
• The Japanese Government recently announced a new fiscal stimulus package to complement the BOJ
programme of buying government bonds and securities
• ¥13.5 trillion will be spent on areas such as infrastructure including upgrading ports, building a new high speed
railway and food processing plants to improve exports
• There will also be cash handouts to poorer pensioners and needy families and a focus will also be on reducing
the labour shortage with new child care facilities
• Doubts remain: There is a history of unspent fiscal commitments in Japan as detailed in the below graph by
the Financial Times
For
per
sona
l use
onl
y
33
AJA OUTLOOK
• Focus will continue to be on deployment of cash resources, portfolio optimisation and asset level
performance
• Further acquisitions and dispositions continue to be under consideration. Acquisition focus is on longer-term
cash flows from younger assets. Dispositions will mainly seek to recycle capital from non-strategic assets to
improve portfolio age, quality and long-term portfolio transparency and value
• The recently announced acquisition of two hotels demonstrates the Board’s and Asset Manager’s objective to
further diversify income streams and capitalise on Japan’s growing tourism sector
• To maintain the highest possible rental outcomes, AJA expects to continue an ongoing program of capital
expenditure on the portfolio, forecast at approximately 10 cents per security, fully funded from cash flows
For
per
sona
l use
onl
y

34
AJA OUTLOOK (CONT’D)
J-REIT Investigations
• Investigation is ongoing of the previously disclosed possibility of a sale of all or substantially all of AJA’s portfolio
to a newly established J-REIT or similar vehicle. Although the J-REIT IPO market continues to be active, some
recent, smaller issues are trading poorly post IPO
• Directors believe AJA’s continued strong liquidity position and both recent and long-term return outperformance
vs A-REIT index (see page 35) dictate that attempting a J-REIT-based liquidity event should be done only with an
appropriate level of execution, cost and reputation risk
• Examination of this potential option will continue and updates will be made promptly if there is any substantive
development
Earnings and Distribution Guidance
• Based on a foreign exchange rate of A$1=¥80 and assuming no substantial performance fee to the asset
manager, underlying profit after tax for the current fiscal year to 30 June 2017 is expected to increase by
approximately 8%-11% to between A$34 million and A$35 million or approximately 56.0–58.0 cents per security
• Distribution guidance for the 6 months to 31 December 2016 is 21.0 cents per security, an increase from 18.0
cents per security for the most recent six month periodFor
per
sona
l use
onl
y
35
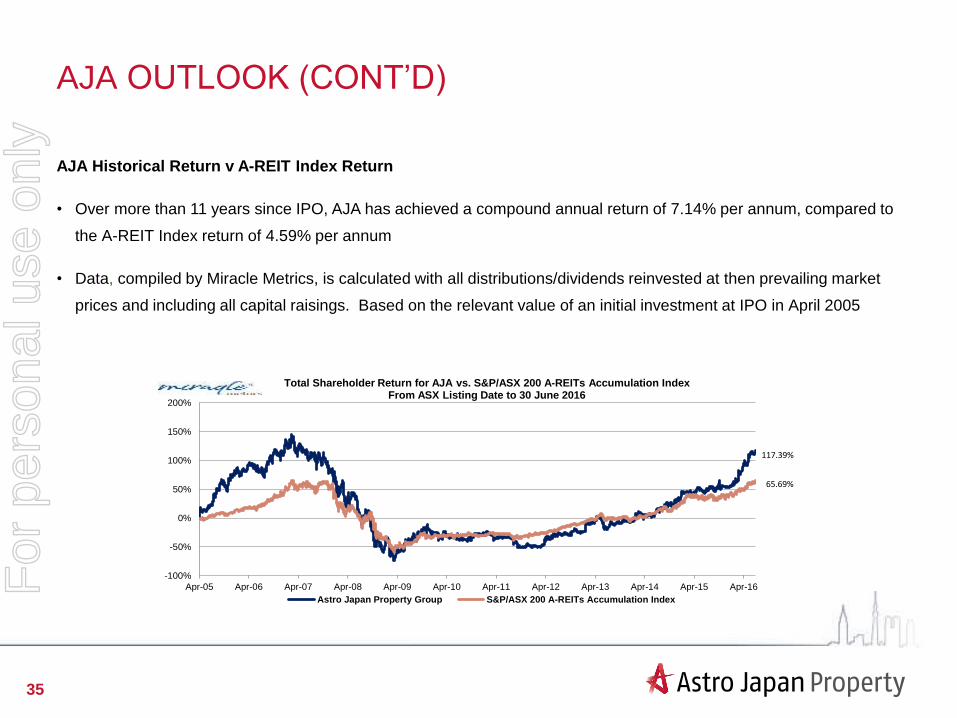
AJA OUTLOOK (CONT’D)
AJA Historical Return v A-REIT Index Return
• Over more than 11 years since IPO, AJA has achieved a compound annual return of 7.14% per annum, compared to
the A-REIT Index return of 4.59% per annum
• Data, compiled by Miracle Metrics, is calculated with all distributions/dividends reinvested at then prevailing market
prices and including all capital raisings. Based on the relevant value of an initial investment at IPO in April 2005
-100%
-50%
0%
50%
100%
150%
200%
Apr-05 Apr-06 Apr-07 Apr-08 Apr-09 Apr-10 Apr-11 Apr-12 Apr-13 Apr-14 Apr-15 Apr-16
Total Shareholder Return for AJA vs. S&P/ASX 200 A-REITs Accumulation IndexFrom ASX Listing Date to 30 June 2016
Astro Japan Property Group S&P/ASX 200 A-REITs Accumulation Index
117.39%
65.69%
For
per
sona
l use
onl
y

First Name, Second Name, Title
APPENDICES
For
per
sona
l use
onl
y
37
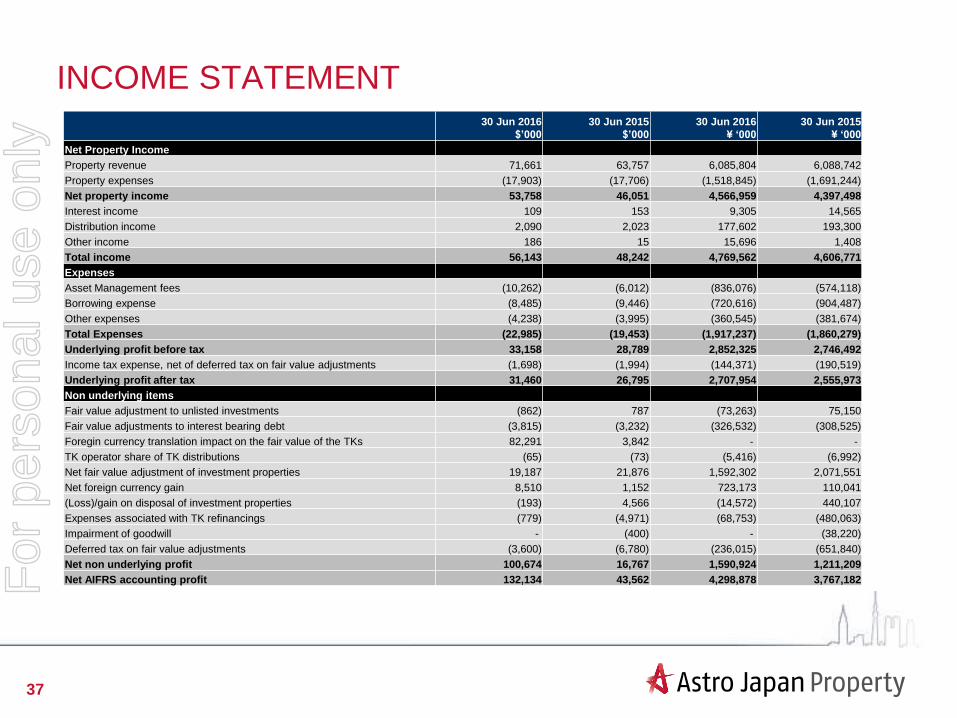
INCOME STATEMENT 30 Jun 2016
$’000
30 Jun 2015
$’000
30 Jun 2016
¥ ‘000
30 Jun 2015
¥ ‘000
Net Property Income
Property revenue 71,661 63,757 6,085,804 6,088,742
Property expenses (17,903) (17,706) (1,518,845) (1,691,244)
Net property income 53,758 46,051 4,566,959 4,397,498
Interest income 109 153 9,305 14,565
Distribution income 2,090 2,023 177,602 193,300
Other income 186 15 15,696 1,408
Total income 56,143 48,242 4,769,562 4,606,771
Expenses
Asset Management fees (10,262) (6,012) (836,076) (574,118)
Borrowing expense (8,485) (9,446) (720,616) (904,487)
Other expenses (4,238) (3,995) (360,545) (381,674)
Total Expenses (22,985) (19,453) (1,917,237) (1,860,279)
Underlying profit before tax 33,158 28,789 2,852,325 2,746,492
Income tax expense, net of deferred tax on fair value adjustments (1,698) (1,994) (144,371) (190,519)
Underlying profit after tax 31,460 26,795 2,707,954 2,555,973
Non underlying items
Fair value adjustment to unlisted investments (862) 787 (73,263) 75,150
Fair value adjustments to interest bearing debt (3,815) (3,232) (326,532) (308,525)
Foregin currency translation impact on the fair value of the TKs 82,291 3,842 - -
TK operator share of TK distributions (65) (73) (5,416) (6,992)
Net fair value adjustment of investment properties 19,187 21,876 1,592,302 2,071,551
Net foreign currency gain 8,510 1,152 723,173 110,041
(Loss)/gain on disposal of investment properties (193) 4,566 (14,572) 440,107
Expenses associated with TK refinancings (779) (4,971) (68,753) (480,063)
Impairment of goodwill - (400) - (38,220)
Deferred tax on fair value adjustments (3,600) (6,780) (236,015) (651,840)
Net non underlying profit 100,674 16,767 1,590,924 1,211,209
Net AIFRS accounting profit 132,134 43,562 4,298,878 3,767,182For
per
sona
l use
onl
y
38
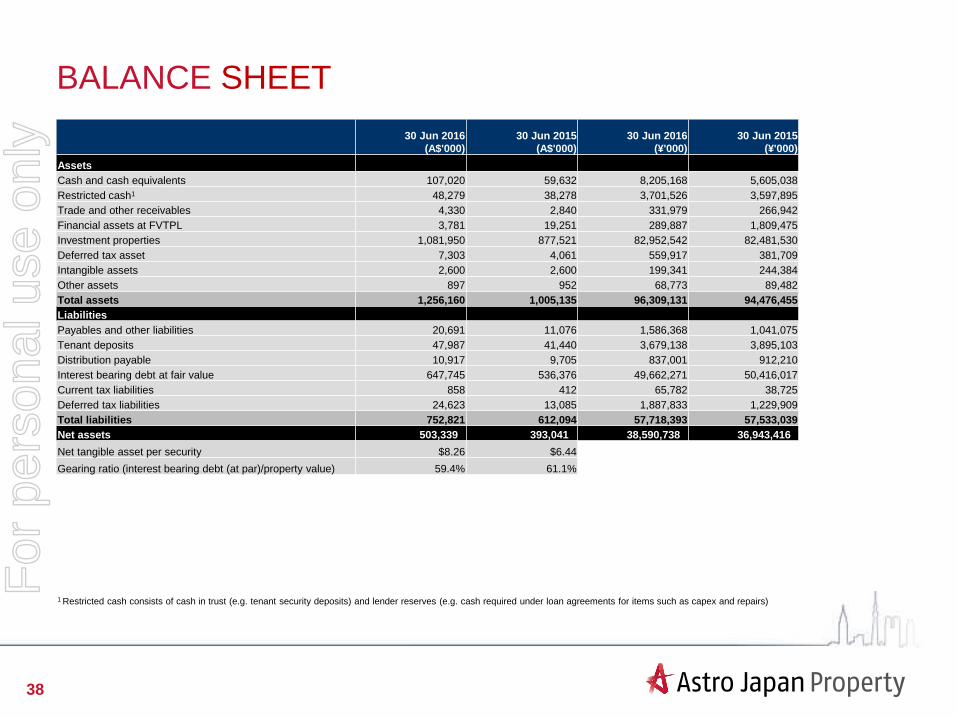
BALANCE SHEET
1 Restricted cash consists of cash in trust (e.g. tenant security deposits) and lender reserves (e.g. cash required under loan agreements for items such as capex and repairs)
30 Jun 2016
(A$'000)
30 Jun 2015
(A$'000)
30 Jun 2016
(¥'000)
30 Jun 2015
(¥'000)
Assets
Cash and cash equivalents 107,020 59,632 8,205,168 5,605,038
Restricted cash1 48,279 38,278 3,701,526 3,597,895
Trade and other receivables 4,330 2,840 331,979 266,942
Financial assets at FVTPL 3,781 19,251 289,887 1,809,475
Investment properties 1,081,950 877,521 82,952,542 82,481,530
Deferred tax asset 7,303 4,061 559,917 381,709
Intangible assets 2,600 2,600 199,341 244,384
Other assets 897 952 68,773 89,482
Total assets 1,256,160 1,005,135 96,309,131 94,476,455
Liabilities
Payables and other liabilities 20,691 11,076 1,586,368 1,041,075
Tenant deposits 47,987 41,440 3,679,138 3,895,103
Distribution payable 10,917 9,705 837,001 912,210
Interest bearing debt at fair value 647,745 536,376 49,662,271 50,416,017
Current tax liabilities 858 412 65,782 38,725
Deferred tax liabilities 24,623 13,085 1,887,833 1,229,909
Total liabilities 752,821 612,094 57,718,393 57,533,039
Net assets 503,339 393,041 38,590,738 36,943,416
Net tangible asset per security $8.26 $6.44
Gearing ratio (interest bearing debt (at par)/property value) 59.4% 61.1%
For
per
sona
l use
onl
y
39
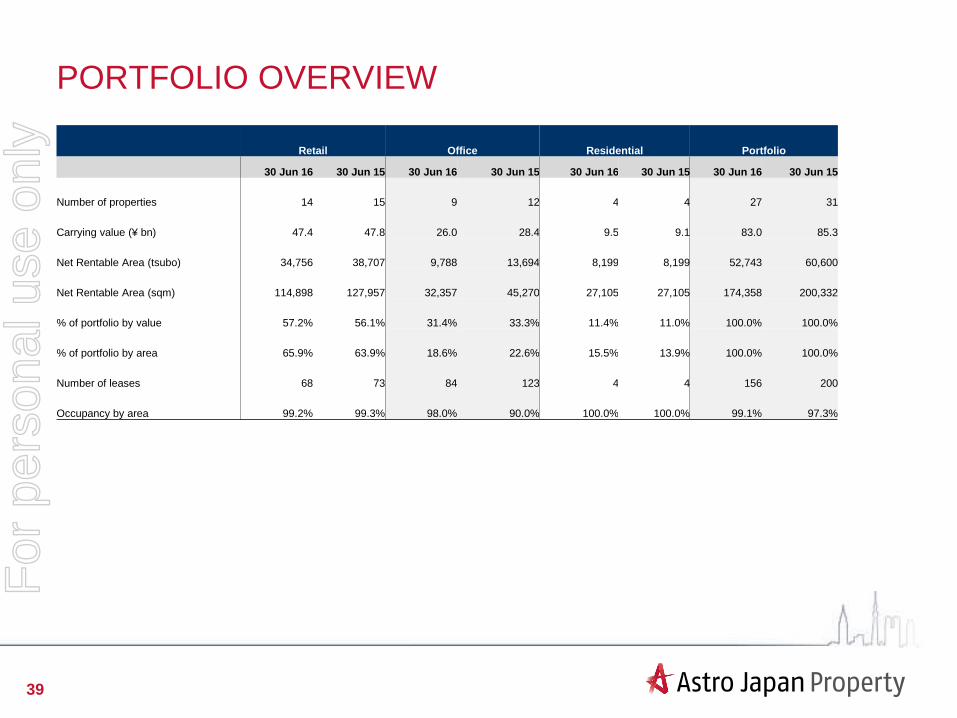
PORTFOLIO OVERVIEW
Retail Office Residential Portfolio
30 Jun 16 30 Jun 15 30 Jun 16 30 Jun 15 30 Jun 16 30 Jun 15 30 Jun 16 30 Jun 15
Number of properties 14 15 9 12 4 4 27 31
Carrying value (¥ bn) 47.4 47.8 26.0 28.4 9.5 9.1 83.0 85.3
Net Rentable Area (tsubo) 34,756 38,707 9,788 13,694 8,199 8,199 52,743 60,600
Net Rentable Area (sqm) 114,898 127,957 32,357 45,270 27,105 27,105 174,358 200,332
% of portfolio by value 57.2% 56.1% 31.4% 33.3% 11.4% 11.0% 100.0% 100.0%
% of portfolio by area 65.9% 63.9% 18.6% 22.6% 15.5% 13.9% 100.0% 100.0%
Number of leases 68 73 84 123 4 4 156 200
Occupancy by area 99.2% 99.3% 98.0% 90.0% 100.0% 100.0% 99.1% 97.3%
For
per
sona
l use
onl
y
40
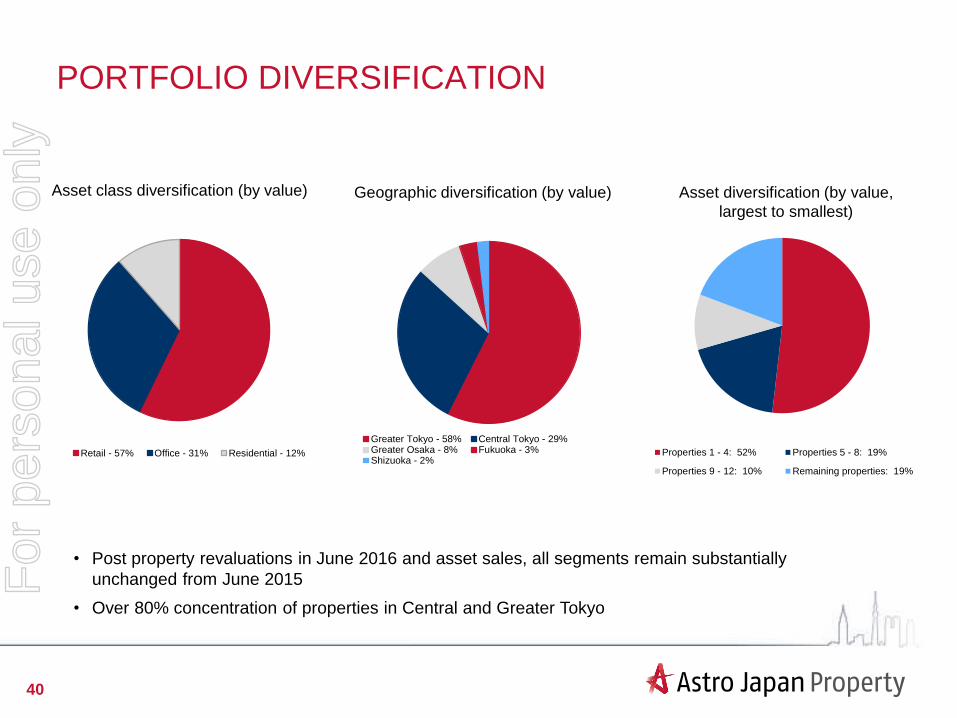
PORTFOLIO DIVERSIFICATION
Asset class diversification (by value)
• Post property revaluations in June 2016 and asset sales, all segments remain substantially
unchanged from June 2015
• Over 80% concentration of properties in Central and Greater Tokyo
Geographic diversification (by value) Asset diversification (by value,
largest to smallest)
Properties 1 - 4: 52% Properties 5 - 8: 19%
Properties 9 - 12: 10% Remaining properties: 19%
Greater Tokyo - 58% Central Tokyo - 29%Greater Osaka - 8% Fukuoka - 3%Shizuoka - 2%
Retail - 57% Office - 31% Residential - 12%
For
per
sona
l use
onl
y
41
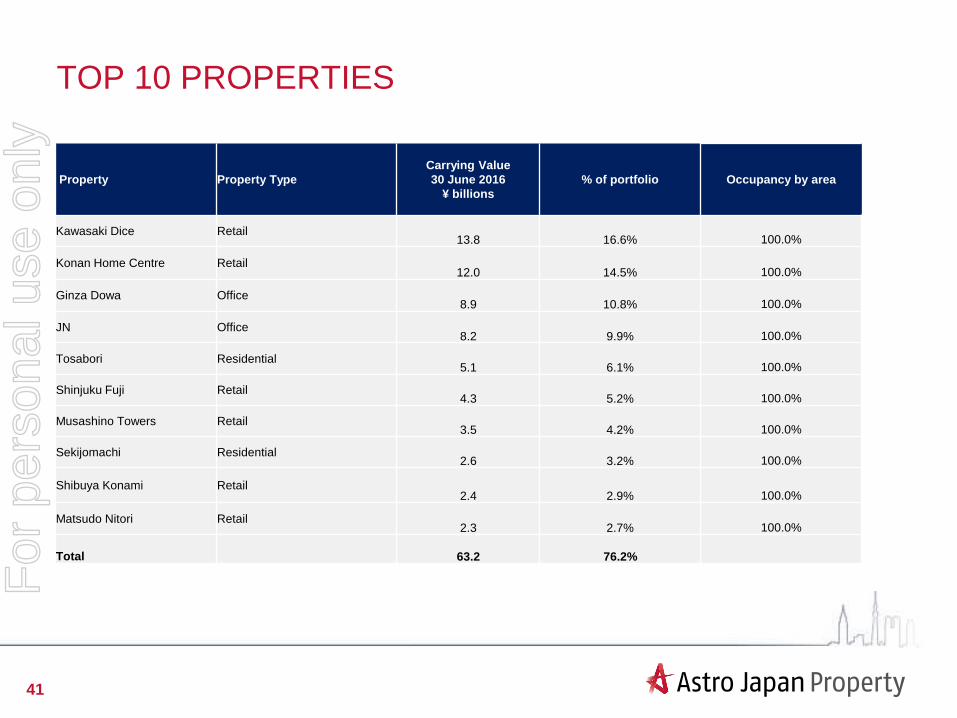
TOP 10 PROPERTIES
Property Property Type
Carrying Value
30 June 2016
¥ billions
% of portfolio Occupancy by area
Kawasaki Dice Retail13.8 16.6% 100.0%
Konan Home Centre Retail12.0 14.5% 100.0%
Ginza Dowa Office8.9 10.8% 100.0%
JN Office8.2 9.9% 100.0%
Tosabori Residential5.1 6.1% 100.0%
Shinjuku Fuji Retail4.3 5.2% 100.0%
Musashino Towers Retail3.5 4.2% 100.0%
Sekijomachi Residential2.6 3.2% 100.0%
Shibuya Konami Retail2.4 2.9% 100.0%
Matsudo Nitori Retail2.3 2.7% 100.0%
Total 63.2 76.2%
For
per
sona
l use
onl
y
42
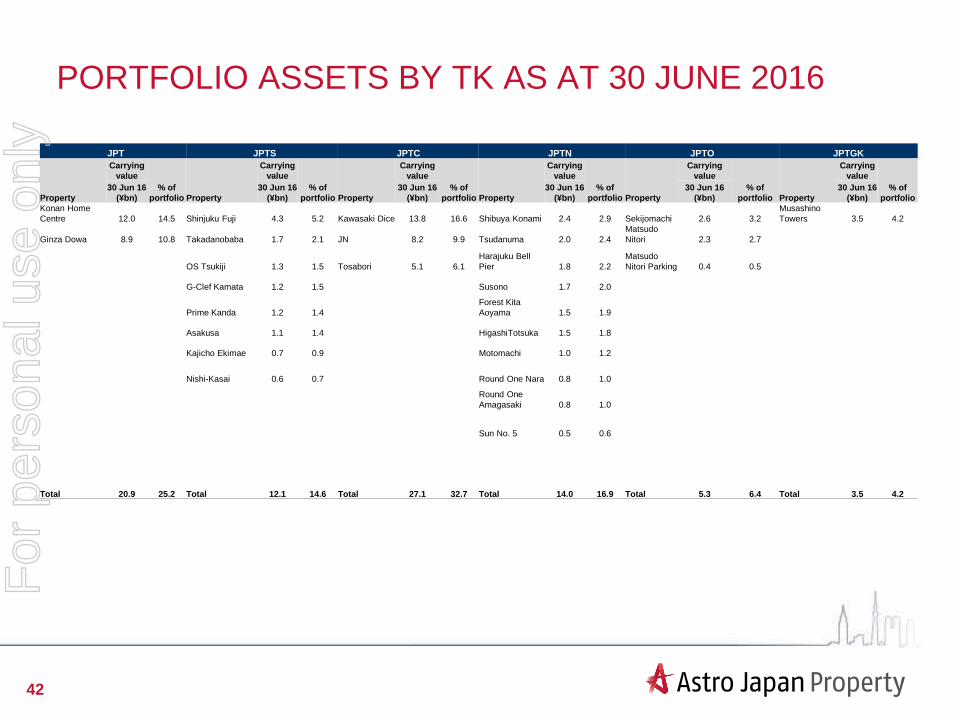
PORTFOLIO ASSETS BY TK AS AT 30 JUNE 2016
JPT JPTS JPTC JPTN JPTO JPTGK
Property
Carrying
value
% of
portfolio Property
Carrying
value
% of
portfolio Property
Carrying
value
% of
portfolio Property
Carrying
value
% of
portfolio Property
Carrying
value
% of
portfolio Property
Carrying
value
% of
portfolio
30 Jun 16
(¥bn)
30 Jun 16
(¥bn)
30 Jun 16
(¥bn)
30 Jun 16
(¥bn)
30 Jun 16
(¥bn)
30 Jun 16
(¥bn)
Konan Home
Centre 12.0 14.5 Shinjuku Fuji 4.3 5.2 Kawasaki Dice 13.8 16.6 Shibuya Konami 2.4 2.9 Sekijomachi 2.6 3.2
Musashino
Towers 3.5 4.2
Ginza Dowa 8.9 10.8 Takadanobaba 1.7 2.1 JN 8.2 9.9 Tsudanuma 2.0 2.4
Matsudo
Nitori 2.3 2.7
OS Tsukiji 1.3 1.5 Tosabori 5.1 6.1
Harajuku Bell
Pier 1.8 2.2
Matsudo
Nitori Parking 0.4 0.5
G-Clef Kamata 1.2 1.5 Susono 1.7 2.0
Prime Kanda 1.2 1.4
Forest Kita
Aoyama 1.5 1.9
Asakusa 1.1 1.4 HigashiTotsuka 1.5 1.8
Kajicho Ekimae 0.7 0.9 Motomachi 1.0 1.2
Nishi-Kasai 0.6 0.7 Round One Nara 0.8 1.0
Round One
Amagasaki 0.8 1.0
Sun No. 5 0.5 0.6
Total 20.9 25.2 Total 12.1 14.6 Total 27.1 32.7 Total 14.0 16.9 Total 5.3 6.4 Total 3.5 4.2
For
per
sona
l use
onl
y
43
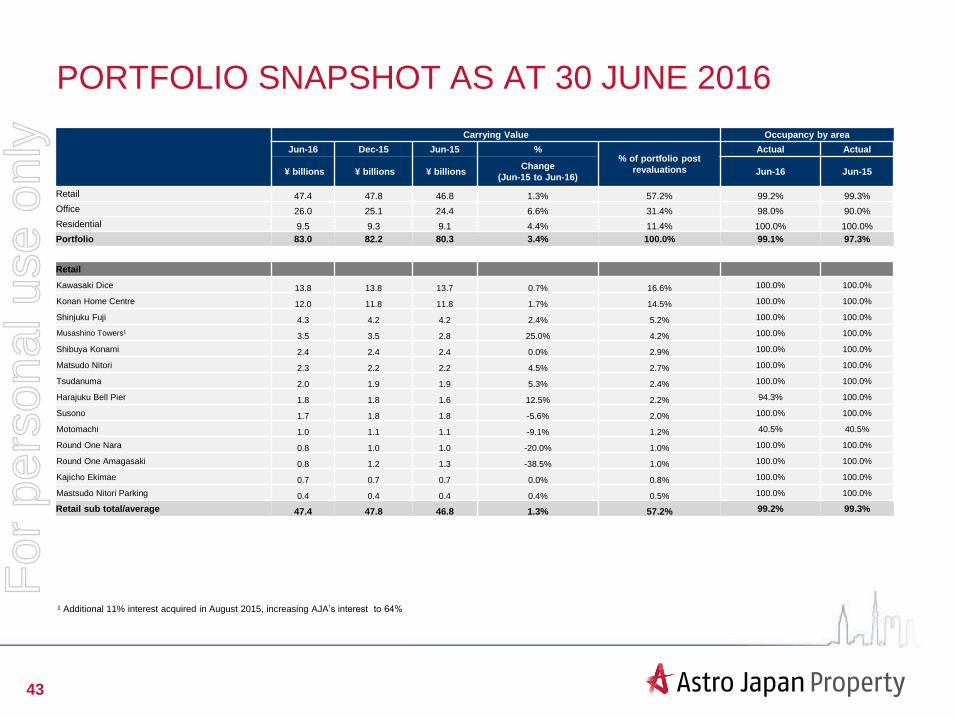
PORTFOLIO SNAPSHOT AS AT 30 JUNE 2016
Carrying Value Occupancy by area
Jun-16 Dec-15 Jun-15 %% of portfolio post
revaluations
Actual Actual
¥ billions ¥ billions ¥ billionsChange
(Jun-15 to Jun-16)Jun-16 Jun-15
Retail 47.4 47.8 46.8 1.3% 57.2% 99.2% 99.3%
Office 26.0 25.1 24.4 6.6% 31.4% 98.0% 90.0%
Residential 9.5 9.3 9.1 4.4% 11.4% 100.0% 100.0%
Portfolio 83.0 82.2 80.3 3.4% 100.0% 99.1% 97.3%
Retail
Kawasaki Dice 13.8 13.8 13.7 0.7% 16.6% 100.0% 100.0%
Konan Home Centre 12.0 11.8 11.8 1.7% 14.5% 100.0% 100.0%
Shinjuku Fuji 4.3 4.2 4.2 2.4% 5.2% 100.0% 100.0%
Musashino Towers¹ 3.5 3.5 2.8 25.0% 4.2% 100.0% 100.0%
Shibuya Konami 2.4 2.4 2.4 0.0% 2.9% 100.0% 100.0%
Matsudo Nitori 2.3 2.2 2.2 4.5% 2.7% 100.0% 100.0%
Tsudanuma 2.0 1.9 1.9 5.3% 2.4% 100.0% 100.0%
Harajuku Bell Pier 1.8 1.8 1.6 12.5% 2.2% 94.3% 100.0%
Susono 1.7 1.8 1.8 -5.6% 2.0% 100.0% 100.0%
Motomachi 1.0 1.1 1.1 -9.1% 1.2% 40.5% 40.5%
Round One Nara 0.8 1.0 1.0 -20.0% 1.0% 100.0% 100.0%
Round One Amagasaki 0.8 1.2 1.3 -38.5% 1.0% 100.0% 100.0%
Kajicho Ekimae 0.7 0.7 0.7 0.0% 0.8% 100.0% 100.0%
Mastsudo Nitori Parking 0.4 0.4 0.4 0.4% 0.5% 100.0% 100.0%
Retail sub total/average 47.4 47.8 46.8 1.3% 57.2% 99.2% 99.3%
¹ Additional 11% interest acquired in August 2015, increasing AJA’s interest to 64%
For
per
sona
l use
onl
y

44
PORTFOLIO SNAPSHOT AS AT 30 JUNE 2016 (CONT’D)
Carrying Value Occupancy by area
Jun-16 Dec-15 Jun-15 %% of portfolio post
revaluations
Actual Actual
¥ billions ¥ billions ¥ billionsChange
(Jun-15 to Jun-16)Jun-16 Jun-15
Office
Ginza Dowa 8.9 8.2 7.9 12.7% 10.8% 100.0% 100.0%
JN 8.2 8.2 8.0 2.5% 9.9% 100.0% 92.7%
Takadanobaba 1.7 1.7 1.6 6.2% 2.1% 100.0% 92.4%
Forest Kita Aoyama 1.5 1.4 1.4 7.1% 1.9% 100.0% 100.0%
Higashi Totsuka 1.5 1.6 1.6 -6.3% 1.8% 93.6% 93.6%
OS Tsukiji 1.3 1.2 1.2 8.3% 1.5% 86.5% 100.0%
Prime Kanda 1.2 1.2 1.2 0.0% 1.4% 100.0% 85.7%
Asakusa 1.1 1.1 1.1 0.0% 1.4% 100.0% 100.0%
Sun No.5 0.5 0.5 0.5 0.0% 0.6% 100.0% 100.0%
Office sub total/average 26.0 25.1 24.4 6.6% 31.4% 98.0% 90.0%
Residential
Tosabori 4.7 4.5 4.7 6.8% 5.7% 100.0% 100.0%
Sekijomachi 2.6 2.5 2.6 4.0% 3.1% 100.0% 100.0%
G-Clef Kamata 1.2 1.1 1.2 9.1% 1.4% 100.0% 100.0%
Nishi Kasai 0.6 0.5 0.6 20.0% 0.7% 100.0% 100.0%
Residential sub total/average 9.5 9.3 9.1 4.4% 11.4% 100.0% 100.0%
Total/average 83.0 82.2 80.3 3.4% 100.0% 99.1% 97.3%
For
per
sona
l use
onl
y
45
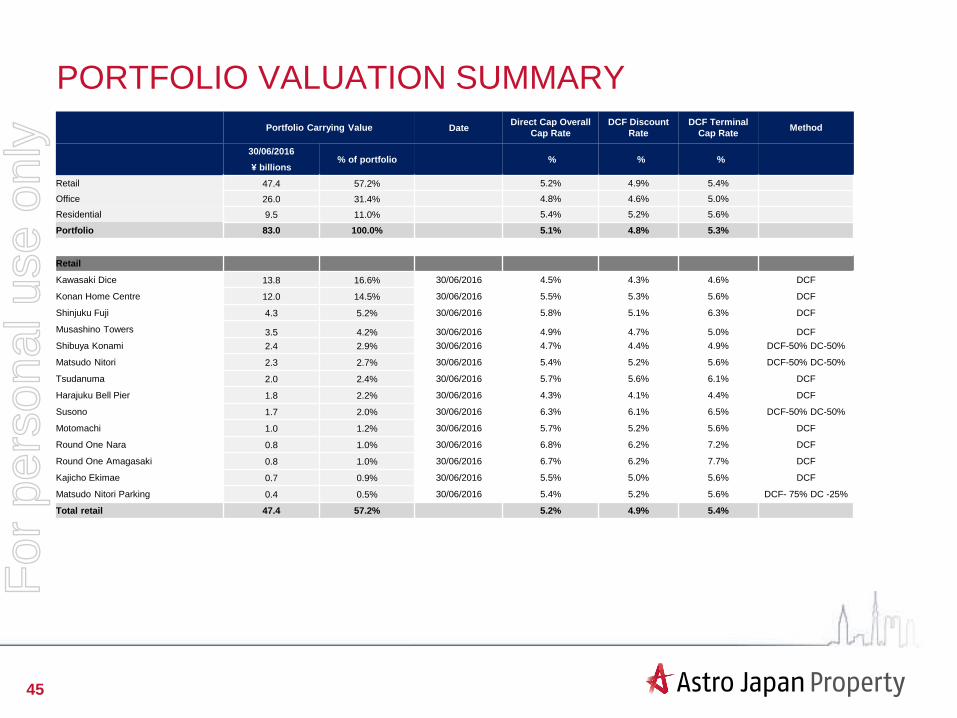
PORTFOLIO VALUATION SUMMARY
Portfolio Carrying Value DateDirect Cap Overall
Cap Rate
DCF Discount
Rate
DCF Terminal
Cap RateMethod
30/06/2016 % of portfolio % % %
¥ billions
Retail 47.4 57.2% 5.2% 4.9% 5.4%
Office 26.0 31.4% 4.8% 4.6% 5.0%
Residential 9.5 11.0% 5.4% 5.2% 5.6%
Portfolio 83.0 100.0% 5.1% 4.8% 5.3%
Retail
Kawasaki Dice 13.8 16.6% 30/06/2016 4.5% 4.3% 4.6% DCF
Konan Home Centre 12.0 14.5% 30/06/2016 5.5% 5.3% 5.6% DCF
Shinjuku Fuji 4.3 5.2% 30/06/2016 5.8% 5.1% 6.3% DCF
Musashino Towers 3.5 4.2% 30/06/2016 4.9% 4.7% 5.0% DCF
Shibuya Konami 2.4 2.9% 30/06/2016 4.7% 4.4% 4.9% DCF-50% DC-50%
Matsudo Nitori 2.3 2.7% 30/06/2016 5.4% 5.2% 5.6% DCF-50% DC-50%
Tsudanuma 2.0 2.4% 30/06/2016 5.7% 5.6% 6.1% DCF
Harajuku Bell Pier 1.8 2.2% 30/06/2016 4.3% 4.1% 4.4% DCF
Susono 1.7 2.0% 30/06/2016 6.3% 6.1% 6.5% DCF-50% DC-50%
Motomachi 1.0 1.2% 30/06/2016 5.7% 5.2% 5.6% DCF
Round One Nara 0.8 1.0% 30/06/2016 6.8% 6.2% 7.2% DCF
Round One Amagasaki 0.8 1.0% 30/06/2016 6.7% 6.2% 7.7% DCF
Kajicho Ekimae 0.7 0.9% 30/06/2016 5.5% 5.0% 5.6% DCF
Matsudo Nitori Parking 0.4 0.5% 30/06/2016 5.4% 5.2% 5.6% DCF- 75% DC -25%
Total retail 47.4 57.2% 5.2% 4.9% 5.4%
For
per
sona
l use
onl
y

46
PORTFOLIO VALUATION SUMMARY (CONT’D)
Portfolio Carrying Value DateDirect Cap
Overall Cap Rate
DCF Discount
Rate
DCF Terminal
Cap RateMethod
30/06/2016 % of portfolio % % %
¥ billions
Office
Ginza Dowa 8.9 10.8% 30/06/2016 4.2% 4.0% 4.4% DCF
JN 8.2 9.9% 30/06/2016 4.8% 4.6% 5.0% DCF-50% DC-50%
Takadanobaba 1.7 2.1% 30/06/2016 5.2% 5.0% 5.6% DCF-50% DC-50%
Forest Kita Aoyama 1.5 1.9% 30/06/2016 4.4% 4.3% 4.5% DCF
Higashi Totsuka 1.5 1.8% 30/06/2016 6.8% 6.0% 6.3% DCF
OS Tsukiji 1.3 1.5% 30/06/2016 5.2% 4.9% 5.2% DCF
Prime Kanda 1.2 1.4% 30/06/2016 5.3% 5.1% 5.4% DCF
Asakusa 1.1 1.4% 30/06/2016 5.9% 5.7% 5.9% DCF
Sun No.5 0.5 0.6% 30/06/2016 5.9% 5.6% 6.1% DCF
Total office 26.0 31.4% 4.8% 4.6% 5.0%
Residential
Tosabori 5.1 6.1% 30/06/2016 5.1% 4.8% 5.1% DCF
Sekijomachi 2.6 3.2% 30/06/2016 5.8% 5.6% 6.2% DCF-50% DC-50%
G-Clef Kamata 1.2 1.5% 30/06/2016 5.5% 5.3% 5.6% DCF
Nishi Kasai 0.6 0.7% 30/06/2016 6.0% 6.1% 6.4% DCF
Total residential 9.5 11.0% 5.4% 5.2% 5.6%
For
per
sona
l use
onl
y