Embed Size (px)
Citation preview

1
Asymmetric Effects of Capital Flight on Domestic Investment in Nigeria:
Evidence from Non-Linear Autoregressive Distributed Lag Model
Lionel Effiom1
Department of Economics
University of Calabar
Calabar, Cross River State, Nigeria
(Corresponding Author)
Uche, Emmanuel
Department of Economics,
Abia State University, Uturu
Abia State, Nigeria
Otei Asuquo Otei
Department of Economics
University of Calabar
Calabar, Cross River State, Nigeria
And
Francis Archibong Effiong
Department of Economics
University of Calabar
Calabar, Cross River State, Nigeria
1 Corresponding Author

2
1. Introduction
Classical economic theory underlines the pivotal role of investment in accelerating the pace
of economic growth. Investment could be conceptualised as either in the direction of human capital
or physical capital. It could also be viewed in terms of its source: in an autarky, aggregate investment
is seen largely as emanating from only within the domestic economy, while in an open economy, it
could be driven by the inflow of capital, either as foreign direct investment or as foreign portfolio
investment. Thus, economic policy must ensure that the economy witnesses and benefits from large
doses of investment, whether domestically-driven or by way of FDI. In other words, there has to be
significant positive change in the capital stock to ensure growth. Furthermore, policy must evolve
ways of making investment more productive by way of enhancing the efficiency of productive factors
in the aggregate input-mix, and also ensure that efforts at domestic mobilization of investment is not
compromised by capital flight. But developing economies, including Nigeria, are not so blessed with
positive doses of these phenomena. While domestic capacity for investments is largely constrained
by structural challenges ranging from the economic, to the social, and even political, it is also made
worse by the blighting effects of flight capital.
There is a recurring and frightening amount of capital exiting the Nigerian economy in recent
times compared to aggregate domestic investment, leading to a reduction of potential growth. For
instance, estimates of flight capital in Nigeria in 2010 exceeded $311million, approximating 158.2%
capital flight-GDP ratio. The proportion of real GDP lost to capital flight in Nigeria stood at 4.7%
(Effiom and Edet, 2019). From 2012 to 2015, the rate of growth of Nigeria’s capital flight has been
decreasing, though it is still significantly huge when considered in absolute values (Englama, et al.
2007). Deppler and Williamson (1987) noted that the growth rate of the domestic economy is
constrained by an amount basically equivalent to the magnitude of capital flight. Capital flight reduces
the investible capital available in the domestic economy (Ndikumana and Boyce 2018). This
submission is corroborated by The World Bank (2015) which notes that in 1990, Nigeria’s domestic
investment stood at $43.8 billion, which dropped consecutively for two periods - $37.3bn in 1992 to
$20.1bn in 1995. However, from 2010 to 2015, there was a significant capital outflow exceeding
$900bn compared to a paltry domestic investment of $134bn. Updated estimates reveal that capital
flight stood at $411.0 in 2015, representing capital flight-GDP ratio of 68.8% (Ndikumana and Boyce,
2018).
Several streams of research have been devoted to investigating the growth impact of capital
flight in Nigeria (see for instance Umoru 2013; Onwioduokit, 2000; Samson and Edeme, 2012;
(Ajayi, 1997, etc). However, only a single study (i.e. Adetiloye, 2012) focuses specifically on
domestic investment impact of capital flight. Even then, that study is fundamentally flawed because

3
the capital flight variable is clearly lacking as an explanatory variable in the empirical model. The
current paper, besides adding to the already rich body of empirical studies on capital flight in Nigeria,
is significant on two scores. First, the study takes a comprehensive and disaggregated view of
domestic investment in Nigeria. Previous studies focused on investment at the Federal or Central
Government, without a corresponding emphasis on that undertaken by subnational units. It must be
noted that Nigeria’s federal political structure consist of a three-tier administrative system with
concurrent albeit unequal spending powers, with the central and state governments having
considerable influence on domestic investment dynamics.
Secondly, studies on the effect of capital flight on growth or on different sectors of the economy
generally assume an underlying linear relationship. These studies are premised on the assumption that
the impact of capital flight on investment is symmetric, meaning that reductions in capital flight
should equally lead to proportionate increases in investment levels. This might not be so given the
mobility and speed in which capital travels internationally with the aid of financial innovation
platforms (Lerner and Tufano, 2011), coupled with the negative indirect impact capital flight might
have on other macroeconomic variables directly associated with investments, such as exchange rate
and inflation. Thus, this paper contributes to the capital flight literature in Nigeria by decomposing
changes in capital flight into their partial sum of negative and positive changes and investigates if
these variations have asymmetric impacts on investment. In contrast to the linear form of the
autoregressive distributed lag (ARDL) framework, the paper employs the nonlinear ARDL (NARDL)
developed by Shin et al. (2014) which permits the separate estimation of the effect of capital flight
increases and capital flight decreases on domestic investment levels. A major research question is: is
there a tendency for domestic investment to maintain a downward spiral or a ratchet effect, even in
the face of lower levels of capital flight? Employing the NARDL, the study finds evidence of
asymmetric impact of capital flight on aggregate investment in Nigeria. This is arguably the first
attempt in the capital flight literature in Nigeria. The findings of the study have implications for
policy, namely, that policy makers might be misled to assuming that periods of decline in capital
flight might necessarily translate to the availability of more financial resources for investment
purposes. The reality might be that the damaging effects of capital flight on the domestic economy
through its influence on macroeconomic indicators of exchange rate, interest rate and inflation might
persist into periods of capital flight decline, thus frustrating the investment capacity of the
government. The remainder of the paper is devoted to finding answers to this enquiry.
2. Literature Review
2.1 Theoretical Linkage between domestic investment and capital flight

4
The underlying notion of capital flight is that it is a transfer of domestic resources, whether they are
of the public or private sources. From the domestic private investment angle, capital flight leads to a
reduction in savings, with banks mobilising less savings deposits. With lower levels of savings
mobilisation, there is an increasing constraint on the banking sector’s capacity to extend credit. This
ultimately results in lower levels of domestic investment itself. As noted by Ajayi, (1997), the tax
base is also adversely affected by capital flight, leading to diminishing government revenue. This
negatively leads to a reduction in public investment, with negative consequences on private
investment. A further corollary of this negative process is that continuous reduction in public revenue
due to the erosion of the tax base via capital flight may lead to an increase of seignorage by the
government. This will inevitably lead to an increase in inflation tax, which may compel investors to
divest in the domestic economy, so as to escape the devaluation of the real worth of their assets
occasioned by the inflation tax surge. Thus, in line with the prediction of the portfolio selection
theory, they may be induced to seek investment opportunities elsewhere (Collier et al. 2004).
Equally important is the fact that increased capital flight can propel uncertainty and doubts on
the part of agents in the capacity of the government to finance its deficit budgets or debt. Thus,
persistent fiscal deficits put pressure on the financing needs of the government. This leads to
inflationary tensions, thus, increasing the tendency for the depletion of domestic assets held by the
private sector. This results in a decrease in private investment, if this occurs. From a different
perspective, persistent budget deficits may result in debt unsustainability. Ndiaye (2014) observes
that in relation to domestic debt, debt unsustainability may lead to a risk of bankruptcy of private
firms, leading ultimately to reduction in private domestic investment. On the other hand, rising and
unsustainable government debt may lead to lack of confidence in government securities. Financial
markets may respond poorly when government bonds are issued. A third consequence of rising debt
is that investors may be forced to anticipate tax increases by the government to deal with the situation.
This increases the risk of a decline in the value of domestically-acquired assets and may compel
private domestic agents to alter their portfolio of assets in favour of foreign denominated assets.
There is also the issue of speculative bubbles in relation to the effect of capital flight on
domestic investment. With capital flight comes diminishing control over outflows of capital.
However, unregulated capital flow exacerbates the volatility which results in uncertainty in the
macroeconomic environment, resulting in a potential loss of private sector assets. Consequently,
domestic private investors may seek for safe havens outside of the domestic environment.
Several approaches have been deployed in measuring capital flight, namely, balance of
payment, residual, and bank deposit approaches. In this study, the residual approach of the World

5
Bank (1985) is used, being the most extensively employed method of measuring capital flight because
it obviates the distinction of capital flight from normal capital outflows (World Bank, 1985)
2.2 Empirical literature
The capital flight literature has a rich historical antecedent, partly because the phenomenon
has lived and lingered for long – not only in Nigeria but in sub-Sahara Africa and other developing
countries. It does appear however that it is worse in the former than in other continents (Collier et al.
2001; Henry, 2012). These studies show that relative to other regions, Africa has low levels of capital
stock. However, African nationals have a tendency to hold a greater proportion of their investments
overseas compared to nationals of other regions.
Trevelline (1999) notes several factors responsible for the birth, growth and sustenance of
capital flight globally. Among these are the ready availability of efficient and safe medium of funds
transfer across national boundaries; developments in information and communications technology
(ICT), as well as efficiency in different modes of transportation which aid in keeping track of
investments overseas. Others are the rate at which information and knowledge about global financial
centres like London and New York are disseminated; the widespread and universal use of the United
States dollar which obviates the need to convert local currencies to the dollar because most developing
countries already hold their liquid assets in the dollar or other global convertible currencies. Tornell
and Velasco (1992) also observe that the institutionalization of capitalism as the dominant economic
system worldwide, as well as the evolution of welfarism to ameliorate the crushing effect of
capitalism, has made private investors to seek safe havens abroad to avoid taxation by the state.
These avenues through which capital exits a country’s economy, combined with unhealthy
domestic macroeconomic and political conditions, results in massive and widespread distortions and
loss of confidence by private capital holders. On the macro front, high and persistent inflation, cost
of capital differentials, differentials in the rate of return on investment, huge budget deficits, exchange
rate devaluation, poor governance, as well as domestic tax cum trade policies may significantly
inspire the flight of capital from the domestic economy (Asongu & Nnanna, 2020; Asongu &
Odhiambo, 2019; Gankou et al.2016; Ndikumana, 2016; Okoli & Akujuobi, 2009; Hermes &
Lensink, 2000; Cuddington, 1987; Lessard and Williamson, 1987; Olopoenia, 2000).
Other studies identify low GDP growth rates (Anetor, 2019; Pastor, 1990; Nyoni, 2000), rising
inflow of foreign aid (Aziz et. al. 2014; Collier, Hoeffler, and Pattillo, 2004), as well as external debt
overhang (Al-Basheer et. al. 2016; Chipalkatti and Rishi, 2001; Demir, 2004). Non-economic or
political factors including political instability, insecurity, leakages in public financial management (
Forson, Obeng and Brafu-Insaidoo,2017;World Bank, 2015; Le and Rishi, 2005), for instance, may

6
conspire with the above factors to encourage flight capital out of the domestic economy. In particular,
Ndikumana (2014) submits that the existence and proliferation of safe or tax havens facilitates capital
flight in sub-Saharan African countries. These mechanisms aid to conceal and transfer illicit capital
procured through embezzlement, over invoicing of imports and under-invoicing of exports,
corruption, tax evasion and sheer and brazen smuggling of natural resources and capital out of the
domestic economy.
The revelations contained in the Panama Papers suggest that capital flight from Africa and
other developing countries are far from abating; indeed, it is increasing in an overwhelming scale. As
early as the 1990s studies indicated massive amounts of capital flight transferred abroad (see for
instance Chang and Cumby, 1991; Ajayi and Khan, 2000; Hermes and Lensink, 2000). With regards
to Nigeria, there seems to be no precise estimate of capital flight from the country due to general
methodological differences and a lack of consensus on measurement parameters in the literature.
However, a study conducted by Le and Zak (2006) estimates that capital flight for Nigeria in 1987
was 31.0% of GDP, while Collier et al. (2001) reveal that as at 1999 Nigeria’s capital flight was
$107billion as against $51.8billion aggregate real GDP for the same year. Using several measures,
Englama et. al. (2007) estimated the capital flight for Nigeria from 1971 to 2006. With the World
Bank (1985), they found a capital flight of $16.14billion, with Morgan Trust co. measure of 1986,
capital flight was $64.26billion, while it found a capital flight of $130.80billion when it deployed the
Modified Approach. In particular, CBN (2015) reveals that the net capital flows for Nigeria was in
the sum of $8.8 trillion and $1.1 trillion in 2011 and 1999, while the IMF (2015) reports a whopping
$11.6 trillion held as offshore assets and $866 billion as income generated by these assets accruing
to other countries. Consequently, countries steeped in capital flight loose tax revenues amounting to
about $255 billion.
While studies devote attention to the investigation of the effect of capital flight on the Nigerian
economy generally using GDP as proxy, there are several studies though, which investigate the
sectoral impact of capital flight. For example, the impact of capital flight on the agricultural sector in
Nigeria was investigated by Usman and Arene (2014). The study found an insignificant but negative
impact of capital flight on the sector. Similarly, Uguru (2016) find evidence of an inverse relationship
between capital flight and tax revenues in Nigeria. A study that is very relevant to our current
investigation is that of Rahmon (2017) who examined the impact of capital flight on domestic
investment in Nigeria. An interesting result emanated from this study, namely “that capital flight has
a statistically significant positive relationship with gross domestic investment in Nigeria contrary to
a priori theoretical expectation”. The rational implication of this is that as capital flight increases,
domestic investment increases. This is indeed curious. However, the policy recommendation of the

7
paper is inconsistent with the findings, when it recommends that “government should intensify its
efforts to ensure speedy recovery of looted funds by corrupt public office holders from foreign
accounts to inject funds into the economy for investment purposes”. One would have thought that
with a positive relationship found between capital flight and domestic investment, the rational policy
outcome should have been an encouragement of capital flight.
Thus given this theoretical inconsistency as well as the realization that to the best of our
knowledge no study is yet to be conducted to ascertain the asymmetric relationship or effects of flight
capital on Nigeria’s domestic investment, the present study undertakes to fill this gap. Our
operationalization of domestic investment excludes private sector investment for, as argued above,
much of capital flight in Nigeria is directed against public resources.
2.3 Stylised facts of capital flight and domestic investment in Nigeria
The Nigerian economy has witnessed massive outflow of capital (mostly dollar denominated) as
politicians, corporate bodies and foreign investors move funds out of the country in response to
insecurity, macroeconomic instability as well as exchange and interest rates differential. Table 1 and
the accompanying figure 1 show that the magnitude of capital flight is alarming. From $3387billion
in 1980, capital flight rose abruptly to $10728billion in 1981 and plummeted the following year,
rising acutely again to $11569.3 in 1983. It should be noted that this period of undulating trends in
capital flight coincided with pervasive economic crises in Nigeria in the 1980s. Capital flight has
been steadily rising from 1998 to its peak value of $37990.8 in 2008, when it further nosedived in
2010.
Table 1: Capital Flight (CAPF) in Nigeria (1980-2017).
YEAR CAPF ($billion) YEAR CAPF ($billion)
1980 3387 1999 2170.9
1981 10728 2000 517.6
1982 -4796.1 2001 3356.5
1983 11569.3 2002 2723.1
1984 1379.8 2003 13106.9
1985 4413.7 2004 9812.1
1986 7980.4 2005 29263.4
1987 7945.8 2006 24307.3
1988 2439.4 2007 26908.4
1989 6081.4 2008 37990.8
1990 9071.9 2009 29029.3
1991 7660.7 2010 18454.6
1992 8440.3 2011 23741.9
1993 2622.5 2012 27304.2
1994 813.5 2013 27238.2
1995 -918.9 2014 26124.7

8
1996 1661.8 2015 26681.5
1997 -3356.8 2016 27070.7
1998 -2030 2017 27054.4 Source: Author’s Computation using data from WDI (2018), CBN (2018) Statistical Bulletin & Boyce
and Ndikumana (2012). We measure capital flight deploying the residual approach, since it is the most
widely used technique (Aziz et al., 2014; Al-Basheer et al., 2016). Here, capital flight is computed by
relating the sources of funds with the uses of funds, the former including all net official flows (
comprising of net increases in foreign debts of the public sector and the net flow of FDI) while the
latter comprise additions to reserves and current account deficit. Algebraically, it is measured as:
Δ EXD + NFDI – (CAD + Δ FER)
Source: Author’s Computation using data from WDI (2018), CBN (2018) Statistical Bulletin
& Boyce and Ndikumana (2012)
Source: Authors’ Computation using data from CBN Statistical Bulletin (2018)
-10000
0
10000
20000
30000
40000
50000
19
80
19
82
19
84
19
86
19
88
19
90
19
92
19
94
19
96
19
98
20
00
20
02
20
04
20
06
20
08
20
10
20
12
20
14
20
16
Figure 1: Capital Flight in Nigeria
CAPF
0.00
500.00
1,000.00
1,500.00
2,000.00
2,500.00
3,000.00
3,500.00
Figure 2: Federal and State Government capital Expenditure
FGCEX GR SGCEX GR

9
Figure 2 further justifies the present effort of investigating the effects of capital flight, not just on
investment spending by the central government but also incorporating capital spending by the states.
From 1981, the combined capital expenditure by the subnational units were at par with that of the
central government. Stable trends were also noticed up till 1999 when states’ investment expenditure
consistently grew above that of the Federal Government. Figure 3 exhibits the fact that
notwithstanding huge public sector investment, capital flight has remained a huge challenge,
competing favourably with domestic investment and exceeding the latter from 2010.
Figure 3: Capital Flight and Domestic Investment in Nigeria (1980-2017) in billions of US dollars.
Source: Author’s computation using data from CBN statistical Bulletin (2018)
3. Research Methodology
3.1 The Model
The analysis provided above on the theoretical nexus between capital flight and domestic investment
justifies the adoption of an eclectic model which is a synthesis of the Keynesian theory of investment
and the Investment Diversion theory of capital flight. The Keynesian theory of investment states that
there is need to induce investment either by way of reduction of interest rates or by increased
government expenditure. The investment diversion theory on the other hand states that
macroeconomic and governmental uncertainties and presence of wide range of financial instruments
abroad, cause economic agents to take away scarce resources from the domestic economy, thereby
reducing investible funds and constraining domestic investment. On this score, following Ndiaye
(2007), Ndikumana (2013) and Asante (2000), the functional form of the model is presented as:
-10000
0
10000
20000
30000
40000
50000
60000
70000
80000
19
80
19
82
19
84
19
86
19
88
19
90
19
92
19
94
19
96
19
98
20
00
20
02
20
04
20
06
20
08
20
10
20
12
20
14
20
16
CAPF

10
FGINV = f(CFL, RGDP, DBT,) ……………….. (1)
The econometric expression of equation (1) assumes the linear form:
FGINV = c0 + c1CFL + c4RDGP + c5DBT + μ ………. (2)
The log-linear specification of equation (2) is expressed as:
LOG(FGINV)= c0 + c1LOG(CFL) + c2LOG(RGDP) + c3 LOG(DBT) + μ ……… (3)
Equation (3) is the Federal Government investment equation to be estimated. For investment by the
state governments, we have the functional form presented thus:
SGINV = δ0 + δ1CFL + δ2RDGP + δ3DBT + μ ……… (4)
The log-linear specification of equation (4) is expressed as:
LOG(SGINVt) = δ0 + δ1LOG(CFL) + δ2LOG(RGDP) + δ3LOG(DBT) + μ …. (5)
For robustness checks, we estimate a third aggregative model to test the asymmetric effects of capital
flight on total domestic investment, defined to mean the sum of federal and state government
investment expenditure.
LOG(TDINVt) = ƛ0 +ƛ1LOG(CFL+) +ƛ2LOG(CFL-) +ƛ3LOG(RGDP) + ƛ4LOG(DBT) + μ … (6)
Where:
FGINV = Federal Government investment as a ratio of the GDP
SGINV = State Government investment as a ratio of the GDP
TDINV = Total domestic investment as a ratio of the GDP
CFL = Capital Flight to the GDP (residual approach estimated by World Bank 1985)
RGDP = Real Gross Domestic Product in billions of dollars
DBT = Total Debt as a ratio of the GDP in billions of dollars
μ = Stochastic error term
c, δ, ƛ = Coefficients of economic relationship to be estimated
The above models indicate that domestic investment is impacted by capital flight, real GDP and the
stock of debt. From a priori, we expect domestic investment to be a decreasing function of capital
flight. Equally, real gross domestic product should exhibit a positive relationship with domestic
investment. The debt stock could either accelerate or decelerate the pace of investment, depending on

11
the structure of repayment and the productivity of the debt. The study employs annual secondary time
series data from 1980 to 2017, sourced from the various editions of the Central Bank of Nigeria
(CBN) Statistical Bulletin, the Nigerian National of Statistics (NBS) and the World Development
Indicators (2018).
3.2. Empirical Methodology
There is a growing body of empirical studies that utilize the nonlinear autoregressive
distributed lag model (NARDL) in analysing asymmetric effects and relationships in macroeconomic
time series data. The NARDL is useful for several reasons. First, it permits the estimation of both
dynamic and static impacts of the explanatory variables on the dependent variable. This is in contrast
to a static model which only permits the estimation of fixed effects only. Second, like the conventional
ARDL, it also affords the opportunity of evaluating the existence of a long-run relationship among
variables, also called the bounds test. Finally, NARDL offers a framework which permits the
evaluation of dynamic effects of both negative and positive changes in the regressors on a specific
dependent variable (Adekunle and Ndukwe, 2018).
Suppose we specify a simple static model that expresses the relationship between domestic
investment (y) and capital flight (X) of the form:
yt + 𝛽t + 𝛽1𝑋t + 𝜇t (7)
Where 𝛽1 is the capital flight elasticity of domestic investment, expected at a priori to be negatively
signed. Equation (1) says that an increase (decrease) in capital flight leads to a contraction (rise) in
domestic investment, whether private or public. Put differently, within a symmetric and linear
context, the response of domestic investment to periods of capital flight surge is just a reflection of
what prevails during periods of downturns in capital flight. However, to investigate the impact of the
two periods concurrently, the nonlinear ARDL technique is employed (Shin et al. 2011 and 2013). In
the NARDL model, nonlinearity is introduced by the decomposition of the conventional ARDL
model to capture for both the long-run and short-run asymmetries in the transmission mechanism
simultaneously.
According to Shin et al. (2013), the asymmetric cointegrating relationship with the NARDL
framework proceeds by decomposing the exogenous variable in Equation (1) into a partial sum
process represented as:
𝑦t = 𝛽+ 𝑋t+ + 𝛽-𝑋t - + 𝜇t (8)

12
Where 𝑦t is k x 1 vector of domestic investment at time t; Xt is a k x 1 vector of multiple regressors
specified such that 𝑋𝑡 = 𝑋0 + 𝑋t+ + 𝑋t
– which is the natural logarithm of capital flight; 𝜇𝑡 represents
the error term, while 𝛽+ and 𝛽- are the corresponding asymmetric long-run parameters, showing that
domestic investment responds asymmetrically during volatile or unstable periods of capital flight
movement. On the other hand, 𝑋t+ and 𝑋t
- signify the partial sum processes of negative (-) and
positive (+) shocks in 𝑋t defined as:
𝑋𝑡+ = ∑ ∆𝑋𝑗
+ ;
𝑡
𝑗=1
𝑋𝑡− = ∑ ∆𝑋𝑗
−
𝑡
𝑗=1
… … … … … … … … … … (9)
∆𝑋𝑡+ = ∑ max ( ∆𝑋𝑗, 0),
𝑡
𝑗=1
∆𝑋𝑡− = ∑ min ( ∆𝑋𝑗, 0),
𝑡
𝑗=1
… … … … … (10)
Where 𝛥𝑋𝑗 represents changes in the explanatory variable 𝑋t,. The ‘+’ and the superscripts represent
the negative and positive processes around a zero threshold, which defines and sets boundaries for
the independent variables. This means that the series of the first difference is assumed to be normally
distributed with zero mean. Equation (11) is a nonlinear ARDL (p,q) framework exhibiting both long
and short run asymmetries:
𝑦𝑡 = ∑ 𝜑𝑗𝑦𝑡−𝑗
𝑝
𝑗=1
+ ∑(𝜋𝑗+1𝑋𝑡−𝑗
+
𝑞
𝑗=0
+ 𝜋𝑗−1𝑋𝑡−𝑗
− ) + 𝜖𝑡 … … … … … (11)
Thus, the conditional error correction model for equation 11 with regards to the negative and positive
partial sums can be expressed as:
∆𝑦𝑡 = 𝜌𝑦𝑡−1 + 𝜃+𝑋𝑡−1+ + 𝜃−𝑋𝑡−1
− + ∑ 𝜑𝑗∆𝑦𝑡−𝑗 +
𝑝−1
𝑗=1
∑(𝜋𝑗+𝑋𝑡−𝑗
+
𝑞−1
𝑗=1
+ 𝜋𝑗−𝑋𝑡−𝑗
− ) + 𝜖𝑡 (12)
Shin et al. (2013) submit that equation 12 adequately corrects for the potentially feeble endogeneity
of non-stationary regressors in a nonlinear ARDL model. This feature guarantees that the causal
relationship proceeds from capital flight to domestic investment both in the long and short run (see
for example, Coers and Sanders, 2013; Jaunky, 2011). The relationship 𝛽t + = −𝜃+⁄𝜌 and 𝛽t
= −𝜃 -⁄𝜌
is used in calculating the long run coefficients, while the null hypothesis of no long run relationship
between the levels of 𝑦t , 𝑋t+ , and 𝑋t
– ( which gives 𝜌 = 𝜃+ = 𝜃 - = 0) will be tested with the bound
testing technique of Pesaran et al. (2001). This method is valid irrespective of the time series
characteristics of 𝑋t.. We estimate the short and long-run asymmetries using the conventional Wald

13
test. The null hypothesis of no asymmetry in the long run coefficients (𝛽x+ = 𝛽x
-) as well as in the
short-run (𝜋j+ = 𝜋j
-) is investigated. This will result in a rejection of either or both.
Before implementing the NARDL framework, the study proceeds by undertaking preliminary
test of the data to ascertain their underlying statistical as well as stationarity properties. While the
former is accomplished by computing the data’s descriptive properties, the latter is achieved by the
use of the Augmented Dickey-Fuller (ADF) and Philip-Peron unit root tests as well as the bounds test
for cointegration. We also test for the direction of causality between capital flight and domestic
investment using the Granger causality test. Post-mortem or diagnostics tests were also conducted to
ensure the validity and reliability of our NARDL estimates. Specifically, we test the assumptions of
normality, linearity, serial correlation, and heteroskedasticity of the estimated model. Of crucial
relevance to this study is the Wald test for asymmetry (both in the short-run and long-run). We test
the null hypothesis that positive and negative changes in capital flight has direct opposite effects on
domestic investment. The decision rule is that if the probability associated with the Wald test is
greater than the conventional significance level of 0.01 or 0.05, then the null hypothesis of no
asymmetry is accepted. On the other hand, if the related probability is less than the conventional
significance level, then we conclude that there is evidence of asymmetric effects of capital flight on
domestic investment in Nigeria.
4. Results and Discussion
Table 2 presents the descriptive statistics of the data. It indicates that our core variables of interest,
namely: capital flight, Federal Government investment, State Government investment and total
domestic investment have mean values of 12615.57, 866.20, 19999.87, and 20866.08 respectively
with corresponding maximum and minimum values as exhibited in the table. While standard
deviation values show some significant drifting of the variables away from their mean values, their
kurtosis however indicate that our policy variables are normally distributed. In particular, capital
flight, and the different layers of investment as well as total domestic investment show kurtosis values
approximately equal to 3. A few of the variables were leptokurtic, with kurtosis values exceeding 3.
All variables are positively skewed, indicating a long right tail, with Jarque-Bera statistic revealing
that the variables are relatively normally distributed.
In Table 3, the results of the stationarity properties of the variables are presented. It is observed that
most of the variables were non-stationary at levels, except inflation. However, upon first differencing,
stationarity was achieved. We thus have a situation of a mixture of variables stationary at levels and
at first difference. Next, cointegration is carried out to evaluate if there is any long run cointegrating
relationship amongst the variables. The bounds test is used for this purpose, and the results are
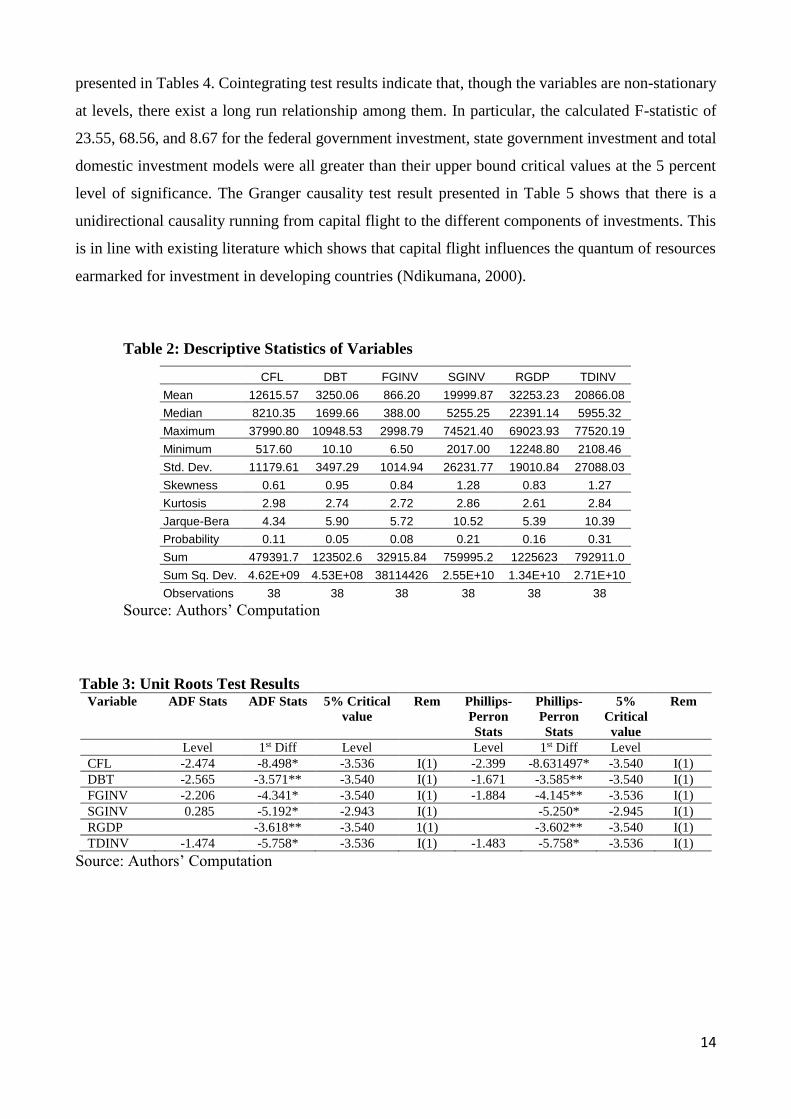
14
presented in Tables 4. Cointegrating test results indicate that, though the variables are non-stationary
at levels, there exist a long run relationship among them. In particular, the calculated F-statistic of
23.55, 68.56, and 8.67 for the federal government investment, state government investment and total
domestic investment models were all greater than their upper bound critical values at the 5 percent
level of significance. The Granger causality test result presented in Table 5 shows that there is a
unidirectional causality running from capital flight to the different components of investments. This
is in line with existing literature which shows that capital flight influences the quantum of resources
earmarked for investment in developing countries (Ndikumana, 2000).
Table 2: Descriptive Statistics of Variables
Source: Authors’ Computation
Table 3: Unit Roots Test Results Variable ADF Stats ADF Stats 5% Critical
value
Rem Phillips-
Perron
Stats
Phillips-
Perron
Stats
5%
Critical
value
Rem
Level 1st Diff Level Level 1st Diff Level
CFL -2.474 -8.498* -3.536 I(1) -2.399 -8.631497* -3.540 I(1)
DBT -2.565 -3.571** -3.540 I(1) -1.671 -3.585** -3.540 I(1)
FGINV -2.206 -4.341* -3.540 I(1) -1.884 -4.145** -3.536 I(1)
SGINV 0.285 -5.192* -2.943 I(1) -5.250* -2.945 I(1)
RGDP -3.618** -3.540 1(1) -3.602** -3.540 I(1)
TDINV -1.474 -5.758* -3.536 I(1) -1.483 -5.758* -3.536 I(1)
Source: Authors’ Computation
CFL DBT FGINV SGINV RGDP TDINV
Mean 12615.57 3250.06 866.20 19999.87 32253.23 20866.08
Median 8210.35 1699.66 388.00 5255.25 22391.14 5955.32
Maximum 37990.80 10948.53 2998.79 74521.40 69023.93 77520.19
Minimum 517.60 10.10 6.50 2017.00 12248.80 2108.46
Std. Dev. 11179.61 3497.29 1014.94 26231.77 19010.84 27088.03
Skewness 0.61 0.95 0.84 1.28 0.83 1.27
Kurtosis 2.98 2.74 2.72 2.86 2.61 2.84
Jarque-Bera 4.34 5.90 5.72 10.52 5.39 10.39
Probability 0.11 0.05 0.08 0.21 0.16 0.31
Sum 479391.7 123502.6 32915.84 759995.2 1225623 792911.0
Sum Sq. Dev. 4.62E+09 4.53E+08 38114426 2.55E+10 1.34E+10 2.71E+10
Observations 38 38 38 38 38 38

15
Table 4: Federal Government Investment NARDL Model Bounds Test
Test Statistic Value K Lower bound
Upper bound
Sig Level
F- statistic 23.55 3 3.62 4.16 5%
Decision: There is co-integration State Government Investment NARDL Model Bounds Test
Test Statistic Value K Lower bound
Upper bound
Sig Level
F- statistic 68.56 3 2.56 3.49 5%
Decision: There is co-integration Total Domestic Investment NARDL Model Bounds Test
Test Statistic Value K Lower bound
Upper bound
Sig Level
F- statistic 8.67 3 2.56 3.49 5%
Decision: There is co-integration Source: Authors’ Computation
Table 5: Granger causality test result
Null Hypothesis: Obs F-Statistic Prob.
CFL does not Granger Cause FGINV 36 6.88814 0.0216
FGINV does not Granger Cause CFL 0.61944 0.5448
SGINV does not Granger Cause CFL 36 0.37571 0.6899
0.37571 0.6899
0.6899
CFL does not Granger Cause SGINV 9.37560 0.0007
9.37560 0.0007
CFL does not Granger Cause TDINV 36 9.40581 0.0006
TDINV does not Granger Cause CFL 0.39547 0.6767
Source: Authors’ computation
4.1 Result of Federal Government Investment – Capital Flight Model
Table 6 presents both the short- and long-run NARDL estimated results of the optimal model (4,3)
obtained via the Akaike Information Criterion (AIC). Results indicate that Federal Government
investment in the current period is adaptive to previous investments. In other words, current levels of
investment responds positively to investments undertaken in the first, second and third lagged periods,
even though it was only significant in the third lag. Capital flight for all the periods indicated negative
relationship with investment. Real GDP is shown to be a significant driver of investment at the
Federal level. From Panel A, we particularly note that increases (positive deviations) in capital flight
[(CFL)_POS(-1))] lead to a significant reduction in investment while negative changes in capital
flight [(CFL)_NEG(-1))] also significantly decreases investment undertaken at the Federal level.

16
Table 6: Estimated NARDL Long run Results of the Federal Government Investment Model (4, 3)
Dependent Variable: LOG (FGINV)
Panel A – Short Run Results
Variable Coefficient Std. Error t-Statistic Prob.
C 4.542638 5.196725 0.874135 0.3930
DLOG(FGINV(-1)) 0.006073 0.167652 0.036226 0.9715
DLOG(FGINV(-2)) 0.193750 0.160727 1.205460 0.2428
DLOG(FGINV(-3)) 0.329962 0.131987 2.499956 0.0217
DLOG(CFL_POS) -0.065503 0.056263 -1.164225 0.2587
DLOG(CFL)_POS(-1)) -0.734328 0.121236 -6.057009 0.0000
DLOG(CFL)_NEG(-1) -0.198383 0.062986 -3.149635 0.0040
DLOG(DBT)_POS(-1) 0.220957 0.039778 5.554805 0.0000
DLOG(DBT)_NEG(-1) -0.047196 0.080512 -0.586201 0.5646
DLOG(RGDP)_POS(-1) 0.378729 0.179856 2.105735 0.0474
DLOG(RGDP)_NEG(-1)) -0.141556 0.049834 -2.840566 0.0105
CointEq(-1) -0.419502 0.145604 -2.881108 0.0077
Adjusted R-squared 0.648224
F-statistic 5.677675
Prob(F-statistic) 0.000297
Durbin-Watson stat 2.122611
Panel B – Long run Results
LOG(CFL)_POS -0.706786 0.138818 -5.091464 0.0000
LOG(CFL)_NEG -0.275903 0.116603 -2.366169 0.0277
Source: Authors’ Computation
From the long run estimated results in Panel B, a 100% increase in capital flight reduces domestic
investment of the Federal Government by almost 71%, while a decrease of capital flight by 100%
will on the average decrease domestic investment by almost 28%, all things being equal. It should be
noted however that the negative effect (-0.275) of decreasing capital flight on investment is less-than
the negative effects of increasing capital flight (-0.706). The short run results in Panel A apparently
mimic that obtained in the long run. They indicate that an increase in capital flight [(CFL)_POS(-1))]
by 100% significantly reduces domestic investment by 73%. However, a reduction in capital flight
[(CFL)_NEG(-1))] still depresses domestic investment, contrary to theoretical expectation. In order
to ascertain the long-run symmetric or asymmetric effects of capital flight on Federal Government
investment, a Wald test is conducted and results reported in Table 7 along with other diagnostic tests
results.
Table 7: Test of Asymmetry of Federal Government Investment Model
Variable Coefficient Prob.
𝛽x+ = 𝛽x
- 5.12675 0.0064
𝜋j+ = 𝜋j
- 0.56443 0.45321
Ramsey RESET linearity test 0.32981 0.34176
Jarque-Bera normality test 0.71134 0.31987
Breusch-Godfrey serial correlation LM test 0.66825 0.22552
ARCH LM heteroscedasticity test 0.87150 0.51074

17
The null hypothesis of the Wald test is that there is symmetry in the positive and negative changes in
capital flight on domestic investment by the Federal Government. The results indicate the presence
of asymmetric effect of capital flight on domestic investment in the long run. This is because the null
hypothesis of no asymmetry or symmetry in the long run coefficients (𝛽x+ = 𝛽x
-) could not be
accepted at the conventional 5 percent significance level. For the short-run (𝜋j+ = 𝜋j
-) however, the
null hypothesis of symmetric effects of capital flight must be accepted. The diagnostic results show
that the model is correctly specified as indicated by the Ramsey Reset specification test, the residuals
are normally distributed (p = 0.32), and do not suffer from autocorrelation (p = 0.23) and is
homoscedastic (p = 0.51)
4.2 Results of State Government Investment – Capital Flight Model
Table 8 presents the results of the non-linear specification of the state government investment–capital
flight model.
Table 8: Estimated NARDL Long run Results of State Government Investment Model (1, 3)
Dependent Variable: LOG (SGINV)
Panel A – Short-run Results
Variable Coefficient Std. Error t-Statistic Prob.
C -24.81505 8.572254 -2.894811 0.0082
DLOG(SGINV(-1)) 0.322011 0.065154 4.942322 0.0001
DLOG (SGINV(-2)) 0.982366 0.132835 7.395390 0.0000
DLOG(CFL_POS) -0.738200 0.341240 -2.163287 0.0371
DLOG(CFL_POS(-1)) 0.198383 0.062986 3.149635 0.0040
DLOG(CFL_NEG(-1)) 0.656253 0.386655 1.697257 0.1031
DLOG(DBT_POS) -0.133827 0.184337 -0.725988 0.4752
DLOG(DBT_NEG) 0.238590 0.055302 4.314280 0.0002
DLOG(RGDP_POS) 3.092691 1.054470 2.932936 0.0075
DLOG(RGDP_NEG) -0.318014 0.099999 -3.180178 0.0037
CointEq(-1) -0.798063 0.200718 -3.976048 0.0004
R-squared 0.737754
Adjusted R-squared 0.628485
F-statistic 6.751718
Prob.(F-statistic) 0.000064
Durbin-Watson stat 2.119733
Panel B – Long-run Results
CFL_POS -0.370815 0.098997 -3.745731 0.0012
CFL_NEG 0.158843 0.025511 6.226427 0.0000
Source: Author’s Analysis
The estimated results reveal that in the short-run, current levels of investments by State Governments
are positively and significantly influenced by previous levels of investments, while real GDP
significantly drives investment at the subnational level. Consistent with theoretical postulation,
results show that State level investment is a decreasing function of positive variations of the debt

18
stock. Specifically, an increase in the debt stock by 100% on the average results in 13.3% decrease
in investment. This position was apparently controverted by the fact that the estimated parameter was
non-significant, implying that investment decisions by subnational governments was not considerably
influenced by the size of the existing stock of debt. Perhaps other considerations, mostly political,
may have weighed in on investment decisions by States. The short-run positive variations in capital
flight both at levels and in its first lag indicated an inverse and significant relationship with and impact
on investment. In particular, a positive increase in capital flight by 100% is associated with about
73% decline in domestic investment. A decrease in capital flight by 100% however exerts a positive
and non-significant increase in domestic investment by 65.6%. While this informally suggest
symmetric effects, it must be stressed that the positive effect of capital flight on domestic investment
exceeds its corresponding negative impact.
Long-run estimated coefficients of capital flight indicate that a 100% increase in capital flight on the
average led to 37% decrease in State Government investment, ceteris paribus, while a 100% negative
deviation in capital flight led to about 15.9% increase in state level domestic investment. Table 9
presents results of the Wald test to formally ascertain the longrun symmetric effects of capital flight
on State Government investment levels in Nigeria.
Table 9: Test of Asymmetry of State Government Investment Model
Variable Coefficient Prob.
𝛽x+ = 𝛽x
- 1.52824 0.1414
𝜋j+ = 𝜋j
- 0.03047 0.9760
Ramsey RESET linearity test 0.80980 0.95521
Jarque-Bera normality test 0.45188 0.98153
Breusch-Godfrey serial correlation LM test 0.43602 0.66625
ARCH LM heteroscedasticity test 0.39418 0.69647
The result of the Wald test of symmetry shows that for both the long- and short-run parameters, the
null hypothesis of symmetry must be accepted, since the probability values exceed the 5%
significance level. Put differently, an increase in capital flight induces a decline in domestic
investment, while a corresponding decrease in capital flight leads to an increase in domestic
investment. The relevant post-estimation tests reveal that the estimated model is well specified as
represented by the Ramsey Reset specification test (p = 0.955), the residuals are normally distributed
(p = 0.9815), and are not serially correlated (p = 0.666) and are homoscedastic (p = 0.696)

19
4.3 Results of Total Domestic Investment – Capital Flight Model
Table 10 and its associated Table 11 are the results of the third model, which serves the purpose of
robustness. It seeks to investigate if there would be any significant difference between the response
of aggregate investment by both tiers of government (Federal and States) to capital flight deviations
in Nigeria.
Table 10: Estimated NARDL Longrun Results of Total Domestic Investment Model (1, 0)
Dependent Variable: LOG (TDINV)
Panel A – Short-run Results
Variable Coefficient Std. Error t-Statistic Prob.
C -26.28644 7.592621 -3.462103 0.0017
DLOG(TDINV(-1)) -0.509840 0.109781 -4.644175 0.0001
DLOG(CFL_POS) -2.822985 0.290040 -9.733076 0.0000
DLOG(CFL)_POS(-1)) -0.733559 0.261911 -2.800797 0.0093
DLOG(CFL)_NEG(-1)) -0.472901 0.178452 -2.650022 0.0133
DLOG(DBT_POS(-1)) -0.935834 1.050526 -0.890825 0.3806
DLOG(DBT_NEG(-1)) 0.307729 0.105011 2.930442 0.0068
DLOG(RGDP_POS(-1)) 3.344110 0.864301 3.869150 0.0006
DLOG(RGDP_NEG(-1)) 0.003000 0.002956 1.014984 0.3191
CointEq(-1) -0.353342 0.103860 -3.402086 0.0021
Adjusted R-squared 0.883012
F-statistic 18.66918
Prob(F-statistic) 0.00000
Durbin-Watson stat 1.93005
Panel B – Long-Run Results
LOG(CFL)_POS -0.318014 0.099999 -3.180178 0.0037
LOG(CFL)_NEG -0.220957 0.039778 -5.554805 0.0000
Source: Authors’ Computation
Table 11: Test of Asymmetry of Total Domestic Investment Model
Variable Coefficient Prob.
𝛽x+ = 𝛽x
- 2.99468 0.0054
𝜋j+ = 𝜋j
- 2.19122 0.0361
Ramsey RESET linearity test 1.03666 0.3079
Jarque-Bera normality test 0.76477 0.4502
Breusch-Godfrey serial correlation LM test 0.29513 0.7699
ARCH LM heteroscedasticity test 0.15927 0.8745
Results confirm that capital flight exerts similar effects on aggregate investments expenditure as it
does when they are isolated. The short run results (Panel A) of the decomposition of the capital flight
variable into both positive and negative deviations show that a 100% increase in capital flight, on the
average, leads to 73.3% decrease in total domestic investment in Nigeria. A reduction in capital flight

20
which was theoretically expected to exert a positive impact on total domestic investment, turned out
with a contrary result. Specifically, it is associated with a 47.2% decline in total domestic investment,
suggesting, by the rule of thumb, a short-run asymmetric impact. The non-linear long-run
decomposition of the positive and negative deviations indicate that positive deviations in capital flight
by 100% impacts negatively on domestic investment by about 31.8%. A surge in capital flight causes
significant reductions in domestic investment, which aligns with theoretical postulations. However,
when capital flight declines by the same amount, domestic investment reduces by 22%. Paradoxically,
declining trend in capital flight did not translate to increases in domestic investment. This contradicts
theoretical expectations, thereby, connoting asymmetric relationship.
Table 11 presents the results of the Wald test of symmetry to determine conclusively the
relationship existing between these deviations. With a probability value of less than 5%, the null
hypothesis of symmetry between the effects of negative and positive deviations of capital flight on
total domestic investment in Nigeria must be refuted. In effect, we conclude that there exist
asymmetric effects of capital flight on public sector investment in Nigeria in both short- and long-
run. The post-estimation tests are all satisfactory.
Our findings broadly agree with empirical evidence furnished from previous studies showing
that capital flight hurts economic growth of victim economies (Akinwale, 2020; Anetor, 2019;
Ndikumana, 2016). Capital flight impacts growth through its direct effect on investments. On this
score, our results are in tandem with that of Ndikumana and Boyce (2018) and The World Bank
(2015) who aver that capital flight in Nigeria has been a significant constraint on investment. The
study’s findings are at variance with Rahmon (2017). Regrettably, however, we could not find a study
to either compare or contrast the findings of this paper with specific regards to the question of
asymmetric effects of capital flight on investments, which was the major thrust of our inquiry.
5. Conclusion and Recommendation
This study employs the NARDL to test the existence or otherwise of symmetry in the response of
public sector investment (States and Federal Governments) to capital flight in Nigeria. Our findings
indicate that over the long term, there exist asymmetric effect of capital flight on Federal Government
investment in Nigeria. This means that an increase in capital flight induces a reduction in the
investment capacity at the Federal level, while a corresponding reduction in capital flight does not
lead to an increase in investment. Investment by subnational governments however revealed the
existence of symmetry in both the short and long run, while overall, total public sector investments
(by both States and Federal Governments) indicated once again the prevalence of asymmetric effects

21
between positive and negative deviations of capital flight. For investments by the States, a surge in
capital flight induced a reduction in investment, while its corresponding decline initiated a rise in
investment.
Several factors could be adduced for this outcome, one of which could be that persistence of
capital flight may worsen the fiscal position of the government, inducing external borrowing, with
consequences on repayment of both principal and interest. Ndiaye (2014) is particularly worried with
the consequences of debt unsustainability in the presence of capital flight, while Ajayi (1997) laments
that external borrowing and the availability of foreign exchange actually fuel its persistence Thus,
even when there is a significant reduction in capital flight, government may have to grapple with the
short to medium term negative effects of its occurrence. In the meantime, investment must be halted
or considerably slowed. Furthermore, the negative macroeconomic distortions of capital flight
especially on inflation and exchange rate stability might account for this asymmetry, considering the
implications of capital flight on the value of government receipts, which form the basis its investments
outlay. Our findings have implications for the range of policy alternatives available to government to
curb the menace of capital flight. Traditional policy tools to control capital flight and boost
investment, for instance, may rest on the erroneous assumption that once capital flight is significantly
curbed, domestic investment may surge almost immediately by default. But this might not be the
case, with the present evidence furnished of asymmetric effects of capital flight on investment
behaviour. This means that besides conventional policy tools, for example, of strengthening
institutions, government must think out of the box in dealing with problems of asymmetric impacts
of capital flight and investment behaviour, in both the short to the long term.
Declarations
Acknowledgments
We sincerely thank the prospective reviewers and editors of this paper, because their inputs will
undoubtedly help improve the quality of the manuscript.
Authors’ Contributions
The First Author (LE) conceptualised the study, wrote the introduction through to the literature
review, the second author (EU) handled the methodology and results section, while OAO and FAE
sourced for data, and also did some parts of the analysis. All authors proofread and approved the
submission of the manuscript
Funding
There is no funding whatsoever for this study
Availability of data and materials

22
Data for this study are sourced from the Central Bank of Nigeria Statistical Bulletin as well as the
World Bank Development Indicators
Competing Interests
I hereby declare that there are no present or potential competing interests for this study

23
References
Adekunle, W. & Ndukwe, I. (2018). The impact of exchange rate dynamics on agricultural output
performance in Nigeria. MPRA Paper No. 87755. Online at https://mpra.ub.uni-
muenchen.de/87755/
Adetiloye, K. A. (2012). Capital flight versus domestic investment in developing countries: An
empirical analysis from Nigeria. International Journal of Economics and Finance 4(2), 175 –
186
Ajayi, S. I. (1997). An analysis of external debt and capital flight in the severely indebted low income
countries in Sub-Saharan Africa. Research Department, International Monetary Fund Working
Paper 68 (Washington DC).
Akinwale, S.O. (2020). Capital flight and economic development: Evidence from Nigeria.
Management and Economics Research Journal, 10(2), pp. 1 – 10
Al-basheer, A.B., Al-Fawwaz, T.M. & Alawneh, A.M. (2016). Economic determinants of capital
flight in Jordan: An empirical study. European Scientific Journal, 12(4): 322-334.
Anetor, F.O. (2019). Macroeconomic determinants of capital flight: Evidence from the Sub-Saharan
African countries. International Journal of Management, Economics and Social Sciences,
Vol. 8(1), 40 – 57.
Asongu, S. A. & Nnanna, J. (2020): Governance and the capital flight trap in Africa, Transnational
Corporations Review, DOI: 10.1080/19186444.2020.1771123
Asongu, S.A. & Odhiambo N. M. (2019). Governance, capital flight and industrialisation in Africa.
Journal of Economic Structures 8(36) https://doi.org/10.1186/s40008-019-0170-2
Aziz, M.S.I., Khayyam, M.O. & Uddin, M.M. (2014). Determinants of capital flight in Bangladesh:
an econometric estimation. Developing Country Studies, 4(25): 121-134.
CBN Statistical Bulletin. (2018). Retrieved from
http://www.cenbank.org/OUT/PUBLICATIONS/STATBULLETIN/RD/2010/STABULL-
2018.PDF
Chipalkatti, N. and Rishi, M. (2001). External debt and capital flight in the Indian economy. Oxford
Development Studies, 29, 31-44. https://doi.org/10.1080/13600810124596
Coers, R. and Sanders, M. (2013). The energy-GDP nexus: Addressing an old question with new
methods. Energy Economics, 36, 708-715
Collier P., A. Hoeffler and C. Pattillo (2004). Aid and capital flight. Oxford University: Centre for
the Study of African Economies.
Collier, P., Hoeffler, A., Pattilo, C., (2001) Flight capital as a portfolio choice. The World Bank
Economic Review 15(1) 15e80
Cuddington, J.T.(1987). Capital Flight: Estimates, issues, and explanations. Princeton Studies in
International Finance, Princeton University, p. 58.
Deppler, M. & Williamson, M. (1987). Capital flight: Concepts, measurement and issues. Staff
Papers for the World Economic Outlook. Washington, DC. International Monetary Fund.
Demir, F. (2004). A failure story: Politics and financial liberalization in Turkey, Revisiting the
revolving door hypothesis. World Development, 32(5), 851-869.
Effiom, L. and Edet, S. E. (2019). Facilitation of foreign direct investment: Evidence from Cross
River State, Nigeria. International Journal of Accounting & Finance 8 (2), 78–98
Englama, A., Oputa, N. C., Ogunleye, T. S., & Omotosho, B. S. (2007). Capital flight from
Nigeria: An empirical estimate. Central Bank of Nigeria Economic and Financial Review, Vol.
45(3).
Forson, R., Obeng, K.C. & Brafu-Insaidoo, W. (2017). Determinants of capital flight in Ghana.
Journal of Business and Enterprises Development, 7, 151-180
Gankou J-M, Bendoma M, Sow MN (2016) The institutional environment and the link between
capital flows and capital flight in Cameroon. African Development Review 28(S1):65–87
24
Hermes, N. and Lensink, R. (2000). Capital flight and the uncertainty of government policies.
University of Groningen.
Jaunky, V. C. (2011). The CO2 emissions-income nexus: Evidence from rich countries. Energy
Policy, 39, 1228-1240.
Le, Quan V. and Rishi, M. (2005). Corruption and capital flight: An empirical assessment.
International Economic Journal, 20(4), 523-540, DOI: 10.1080/10168730601027161 Le and Zak (2006). Corruption and capital flight: an empirical assessment. International Economic
Journal. Vol. 20(1) pp. 532-540
Lerner, J and Tufano, P. (2011). The consequences of financial innovation: A counterfactual research
agenda. Annual Review of Financial Economics. DOI:
10.1146/annurev.financial.050808.114326
Lessard, D. R. and Williamson, J. (1987). Capital flight and Third World debt, Institute of
International Economics, Washington DC,
Ndiaye, A. S. (2009). Effect of capital flight on domestic investment in the franc zone. African
Econometric Society. 14th Annual Conference on Econometric Modeling for Africa, Sheraton
hotel, Abuja, Nigeria, 8-10 July 2009.
Ndiaye, A. S. (2014). The role of capital flight in the fluctuations in domestic investment: Evidence
from African Countries in the Franc Zone. Centre for the Studies of African Economies.
Conference on Economic Development in Africa, St. Catherine’s College, Oxford, United
Kingdom.
Ndiaye, A. S., (2007). Examining the effect of capital flight on domestic investment in the franc zone.
Paper prepared for presentation at the African Econometric Society (AES) 14th Annual
Conference on Econometric
Ndikumana, L. and Boyce, J.K. (2018). Capital flight from Africa: Updated methodology and new
estimates. Political Economy Research Institute (PERI) Report. University of Massachusetts-
Amherst
Ndikumana, L. (2013). Capital flight and tax havens: impact on investment and growth in Africa.
Department of Economics and Political Economy Research Institute, University of
Massachusetts at Amherst.
Ndikumana, L. (2014). Capital flight and tax havens: Impact on investment and growth in Africa.
HS02 Vol. 22 | pages 99 – 124
Ndikumana, L. (2016). Causes and effects of capital flight from Africa: Lessons from case studies.
African Development Review 28(S1):2–7
Nyatepe-coo, A.A. (1994). Capital flight in low-income sub-Saharan Africa. The effects of political
climate and macroeconomic policies. Scandinavian Journal of Development Alternatives, pp
59-68
Nyoni, T. (2000). Capital flight from Tanzania. In Ajayi, I. and M.S. Khan (eds).External debt and
capital flight in Sub-Sahara Africa. Washington, D.C.: The IMF Institute, pp 265-299. Okoli, M. N. & Akujuobi, A. B. C. (2009). Determinations of capital flight: The case of Nigeria.
International Journal of Development and Management Review. Vol. 4 (1), 233–246
Olopoenia, M. (2000). Capital flight from Tanzania. In Ajayi, S .I. and M.S. Khan (eds) External
debt and capital flight in Sub-Sahara Africa. Washington, D.C.: The IMF Institute, pp 238-
264.
Olowofeso, O. E., Adeboye, A. A., Adejo, V.T., Bassey, K. J. and Abraham, O. (2017).
Agricultural sector credit and output relationship in Nigeria: Evidence from nonlinear ARDL.
CBN Journal of Applied Statistics Vol. 8(1), 101–122
Onwioduokit, E.A. (2000). Capital flight from Nigeria: an empirical examination. West African
Monetary Institute, Accra, Ghana.
Pastor, Manuel, Jr (1990). Capital flight from Latin America, World Development 18:1-18.
Pesaran, M.H., Shin, Y. and Smith, R.J. (2001). Bounds testing approaches to the analysis of level
relationships. Journal of Applied Econometrics, 16 (3), 289-326.

25
Rahmon, A. B. (2017). An empirical investigation of capital flight and domestic investment in
Nigeria (1980-2015). Journal of Economics and Sustainable Development, 8(24), 8–16
Salandy, M., and Henry, L. (2013). The impact of capital flight on investment and growth in
Trinidad and Tobago, 1971-2008.https://pdfs.semanticscholar.org Samson, O. and Edeme, R. (2012). Capital flight and Nigeria’s economy. JORIND 10 (2), 304–320
Shin, Y. and Yu, B. and Greenwood-Nimmo, M. (2013). Modelling asymmetric cointegration and
dynamic multipliers in a nonlinear ARDL framework. Festschrift in Honor of Peter Schmidt,
W.C. Horrace and R.C. Sickles, eds., Forthcoming. Available at SSRN:
https://ssrn.com/abstract=1807745or http://dx.doi.org/10.2139/ssrn.1807745
Tornell, A. and Velasco, A. (1992). The tragedy of the commons and economic growth: Why does
capital flow from poor to rich countries? Journal of Political Economy, 100(6), 1208-31.
Uguru, L.C. (2016).On The Tax Implications of Capital Flight: Evidence from Nigeria.
Umoru, D. (2013). Capital flight and the Nigerian economy. European Journal of Business and
Management Vol.5 (4). 40 – 50
Usman, F. R. and Arene, C. J. (2014). Effects of capital flight and its macroeconomic determinants
on agricultural growth in Nigeria. International Journal of Food and Agricultural Economics
2(4), 1 –20.
World Bank (1985). World development report 1985. Washington, D.C.: World Bank.
World Bank (2015). World development indicators 2015. Washington, D.C.: World Bank.


![Jet Airways to relocate Domestic Flight Operations in Mumbai to Terminal 2 from March 15th, 2016 [Company Update]](https://img.pdfslide.net/doc/110x75/56d6bcdb1a28ab30168bbf6b/jet-airways-to-relocate-domestic-flight-operations-in-mumbai-to-terminal-2.jpg)