Embed Size (px)
Citation preview
Asymmetric Information and the Impact on Interest Rates
Evidence from Forecast Data
Asymmetric Information Hypothesis (AIH)
• Asserts that the federal reserve possesses private information about the current and future outlook of the economy which is not available to market participants.
• AIH holds relevance for1. Assessments of monetary policy effectiveness
2. Explaining the counterintuitive response of long-term interest rates to monetary policy decisions
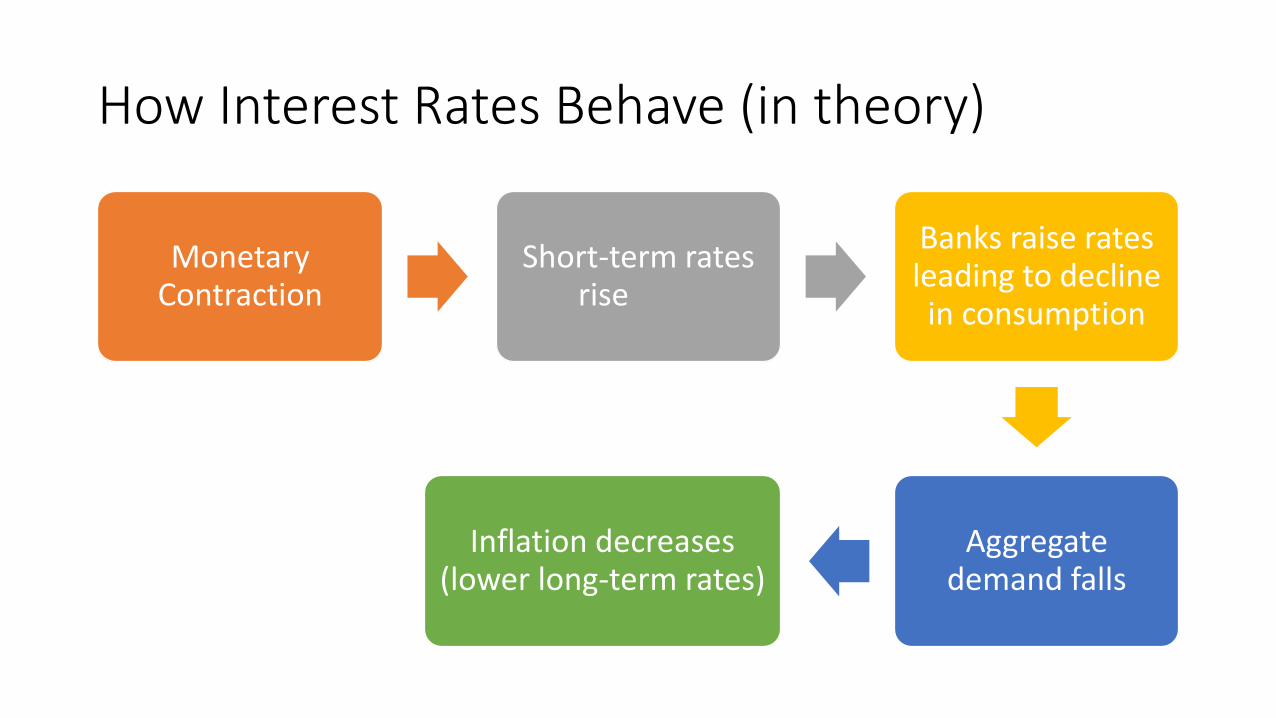
How Interest Rates Behave (in theory)
Monetary Contraction
Short-term rates rise
Banks raise rates leading to decline in consumption
Aggregate demand falls
Inflation decreases (lower long-term rates)
How Interest Rates Behave (empirically)
• (Cook and Hahn, 1989) show that increase in the Fed Funds rate –signifying monetary contraction –causes statistically significant increase in 3-month to 20-yr bonds rates of 55 to10 basis points.
• This empirical result of long-term bond rate behavior is counterintuitive to theoretical expectations.
• (Romer and Romer, 2000) test the assertion that the Fed’s asymmetric information (AIH) explains this unexpected increase in rates.
Romer’s Theoretical Framework
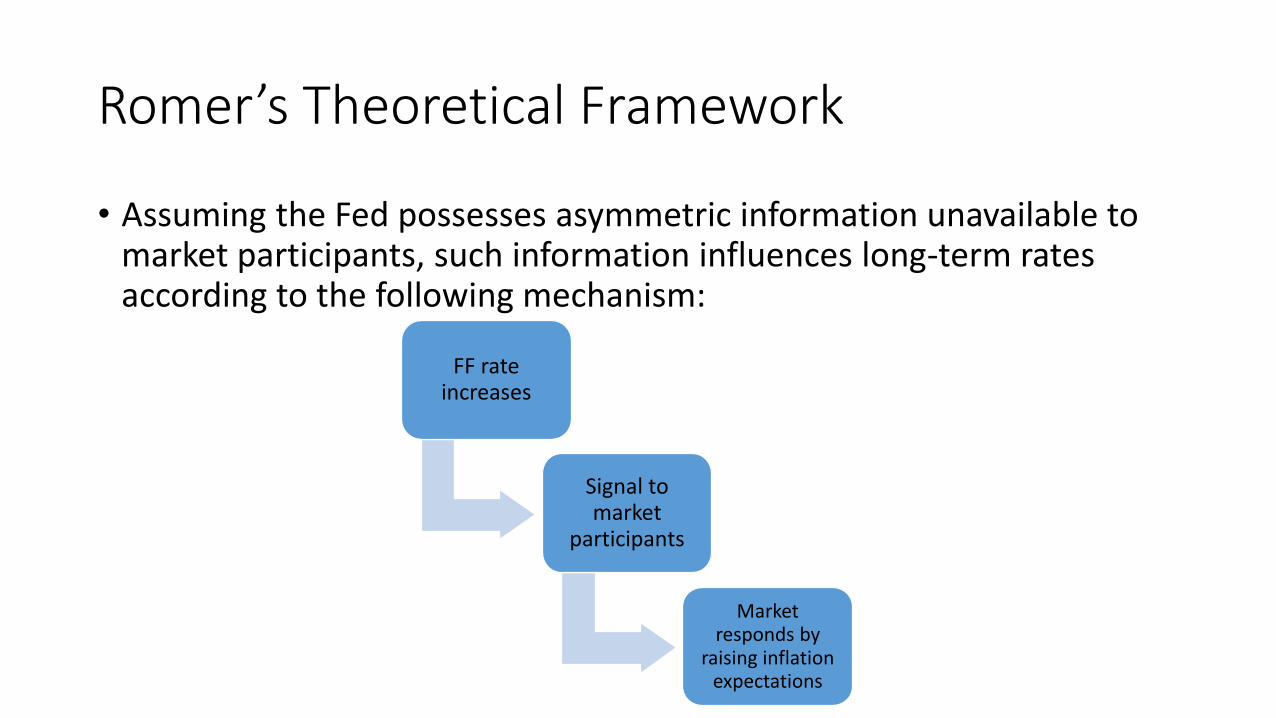
• Assuming the Fed possesses asymmetric information unavailable to market participants, such information influences long-term rates according to the following mechanism:
FF rate increases
Signal to market
participants
Market responds by
raising inflation expectations
Central Bank Forecast Data
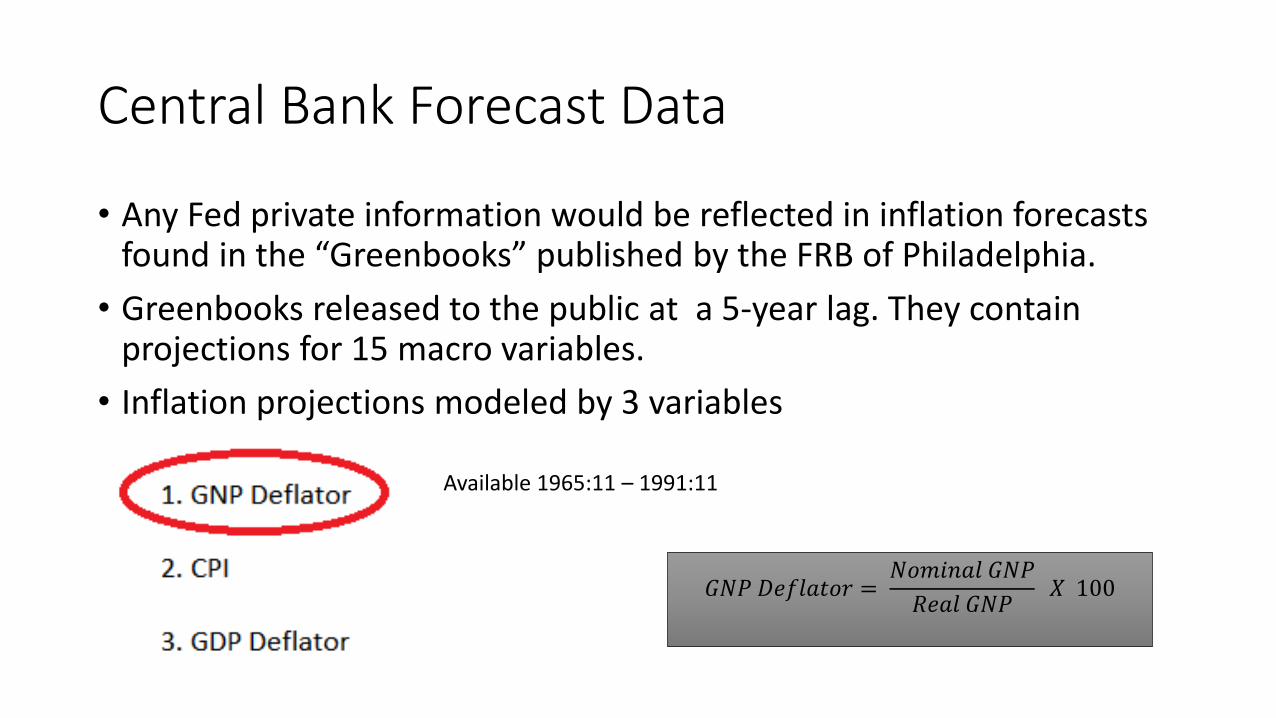
• Any Fed private information would be reflected in inflation forecasts found in the “Greenbooks” published by the FRB of Philadelphia.
• Greenbooks released to the public at a 5-year lag. They contain projections for 15 macro variables.
• Inflation projections modeled by 3 variables
Available 1965:11 – 1991:11
𝐺𝑁𝑃 𝐷𝑒𝑓𝑙𝑎𝑡𝑜𝑟 =𝑁𝑜𝑚𝑖𝑛𝑎𝑙 𝐺𝑁𝑃
𝑅𝑒𝑎𝑙 𝐺𝑁𝑃𝑋 100
Central Bank Forecast Data
• The GNP Deflator monthly series captured in the Greenbooks typically represent forecasts with horizons of five or six quarters.
• Greenbook forecasts are produced only on the occasion of FOMC meetings, which typically occur during the first half of the month.
• There is variability in the timing of FOMC meetings both during the year and within the given month in which a meeting occurs.
• GNP Deflator is expressed as Q/Q growth in price index for GNP, chain weight (annualized percentage points)
Commercial Forecast Data
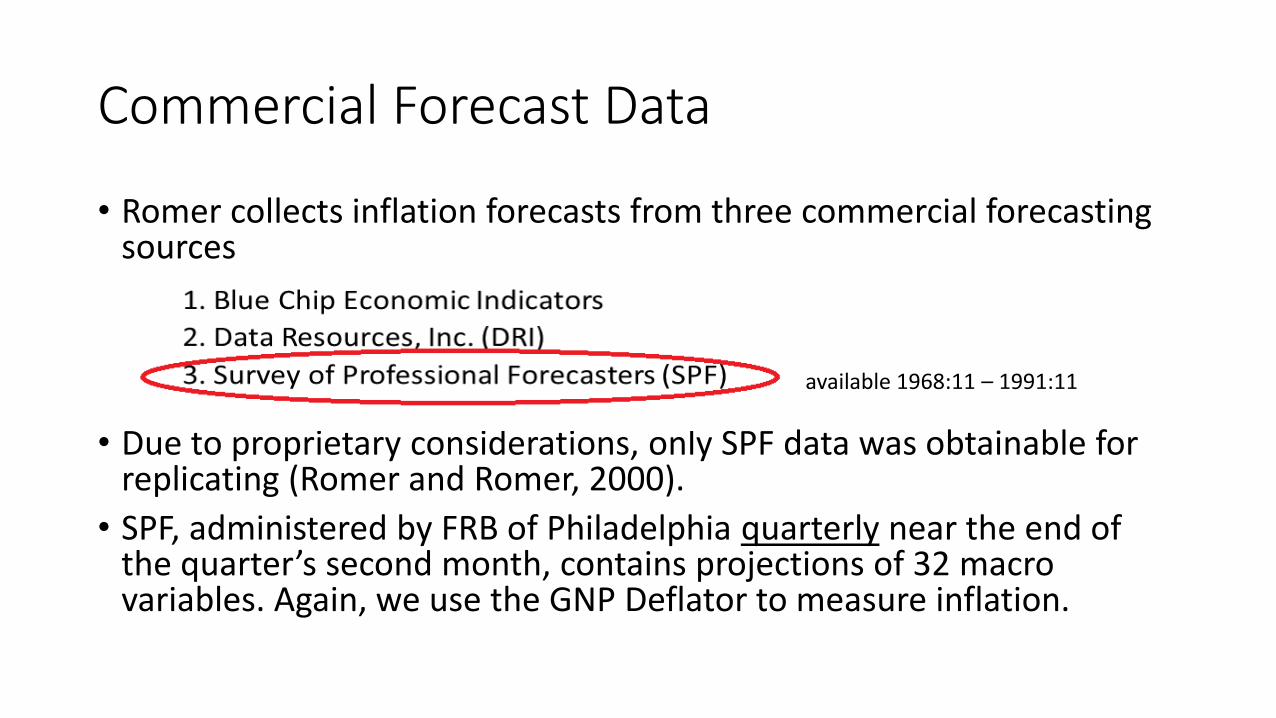
• Romer collects inflation forecasts from three commercial forecasting sources
• Due to proprietary considerations, only SPF data was obtainable for replicating (Romer and Romer, 2000).
• SPF, administered by FRB of Philadelphia quarterly near the end of the quarter’s second month, contains projections of 32 macro variables. Again, we use the GNP Deflator to measure inflation.
available 1968:11 – 1991:11
Actual GNP Deflator
• Actual GNP Deflator quarterly series is acquired from June, September, December, and March issues of the Survey of Current Business over the period 1964:4 – 1991:4
• An important thing to note is the revisionary nature of the GNP Deflator data. As more information becomes available, the Survey publishes revisions of initial forecast estimates.
• (Romer and Romer, 2000) use the second revision since it relies on mostly complete data and is roughly contemporaneous with the forecasts being analyzed.
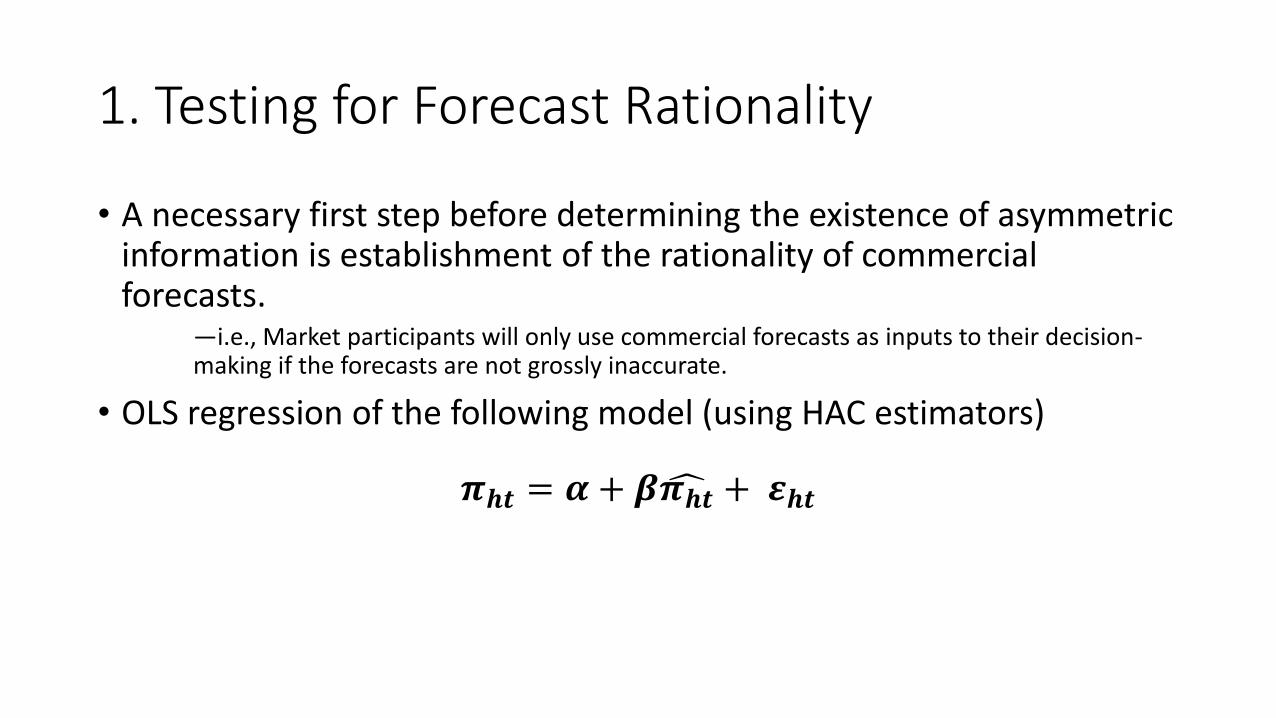
1. Testing for Forecast Rationality
• A necessary first step before determining the existence of asymmetric information is establishment of the rationality of commercial forecasts.
—i.e., Market participants will only use commercial forecasts as inputs to their decision-making if the forecasts are not grossly inaccurate.
• OLS regression of the following model (using HAC estimators)
𝝅𝒉𝒕 = 𝜶 + 𝜷 𝝅𝒉𝒕 + 𝜺𝒉𝒕
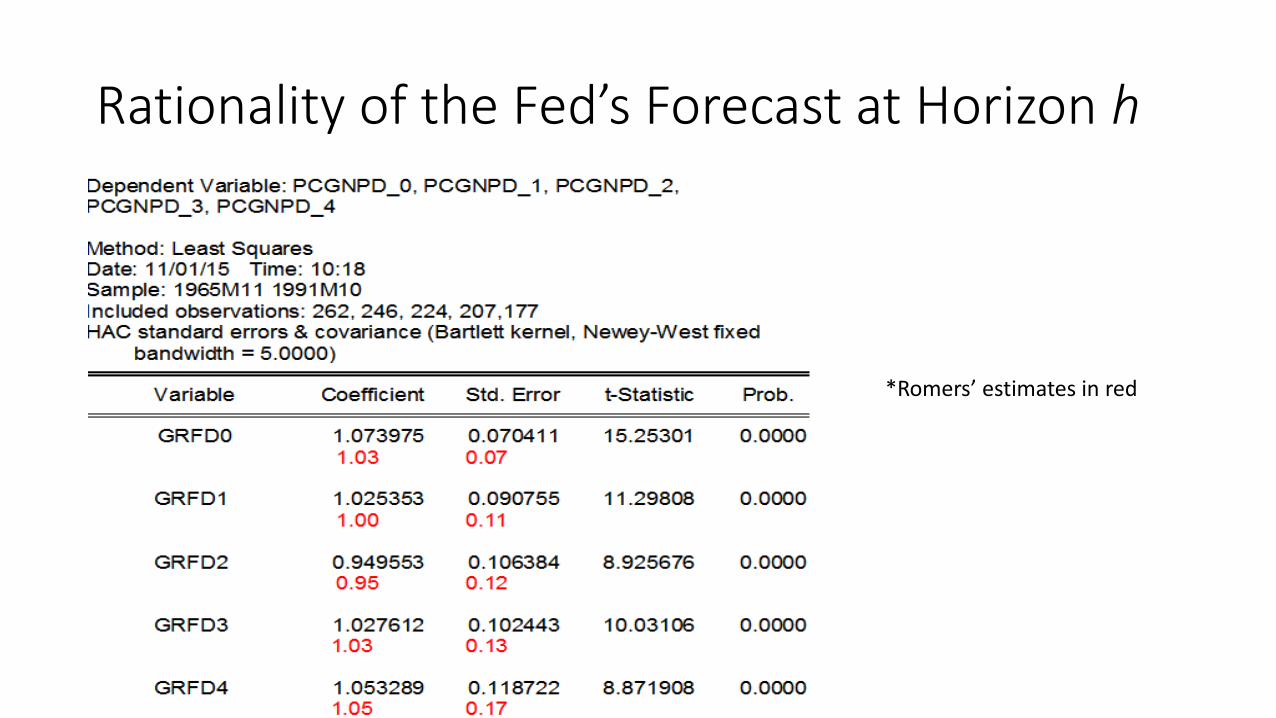
Rationality of the Fed’s Forecast at Horizon h
*Romers’ estimates in red
Replication Comparison
• Rounding to one basis point reveals slight disparity in the replication results for the β coefficients only for the contemporaneous month (h = 0) and at the first horizon (inflation 1 quarter after the forecast made in month t)
—This disparity is likely due to data formatting challenges that have resulted in unequal sample observations being used for estimation.
• The standard errors vary slightly for all horizons. —This is likely due to the same disturbance affecting the β’s as well as Romers’ use of a
combination of Hansen-Hodrick and Newey-West standard errors versus and my useof HAC estimation.
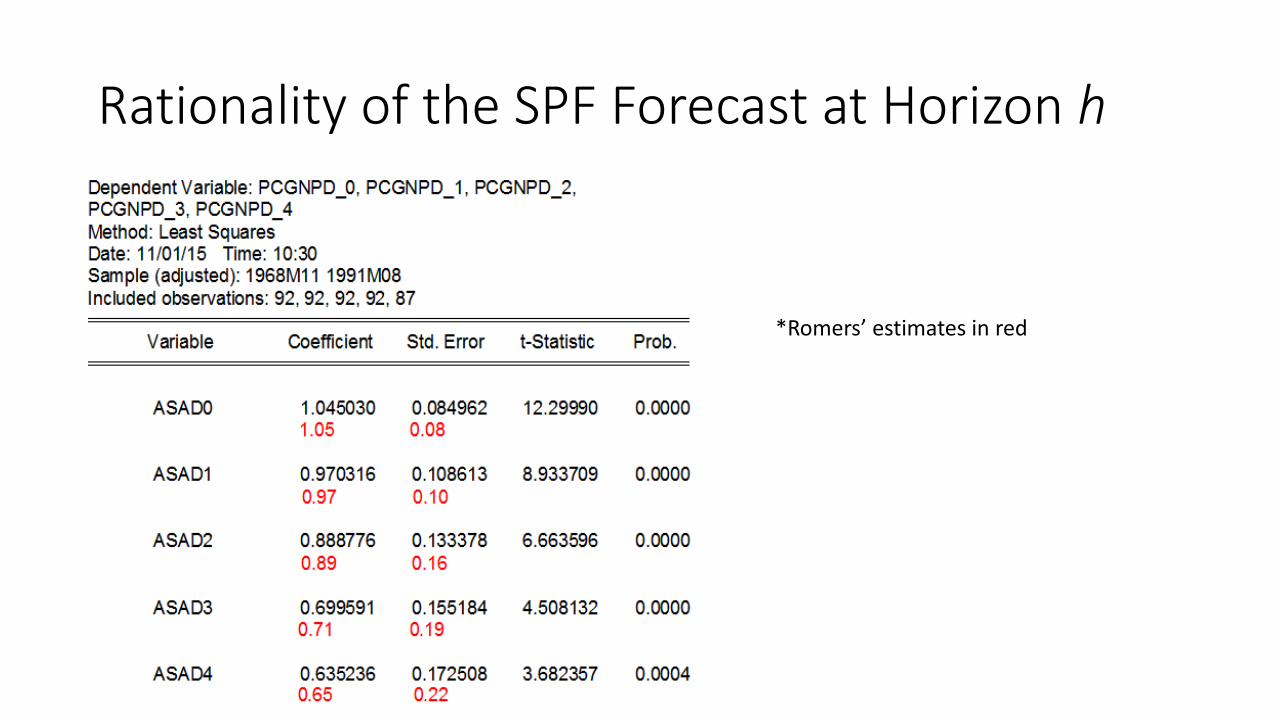
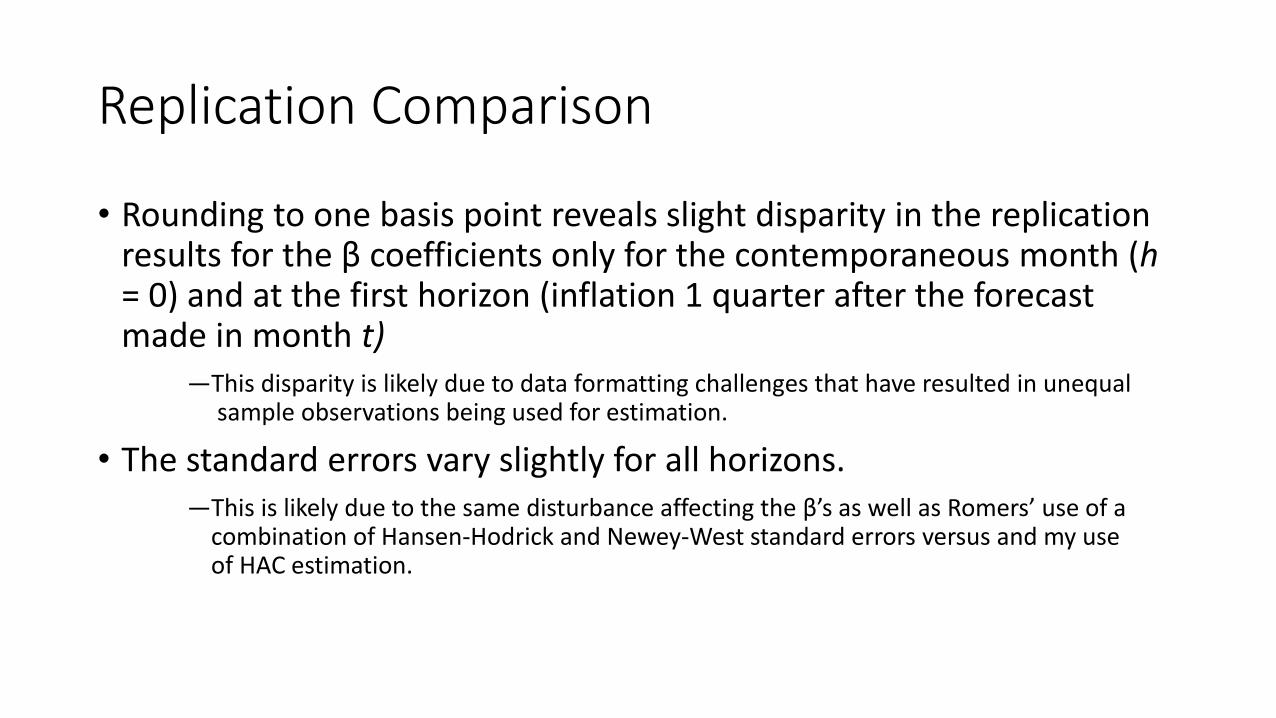
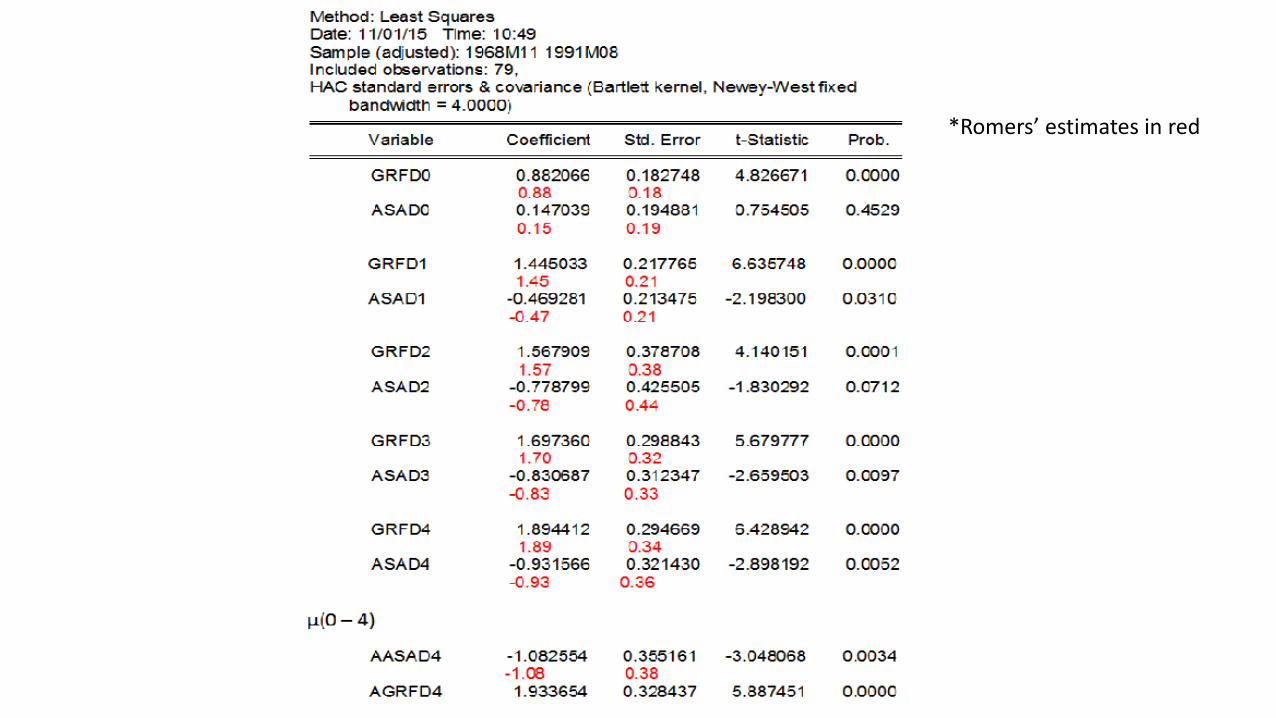
Rationality of the SPF Forecast at Horizon h
*Romers’ estimates in red
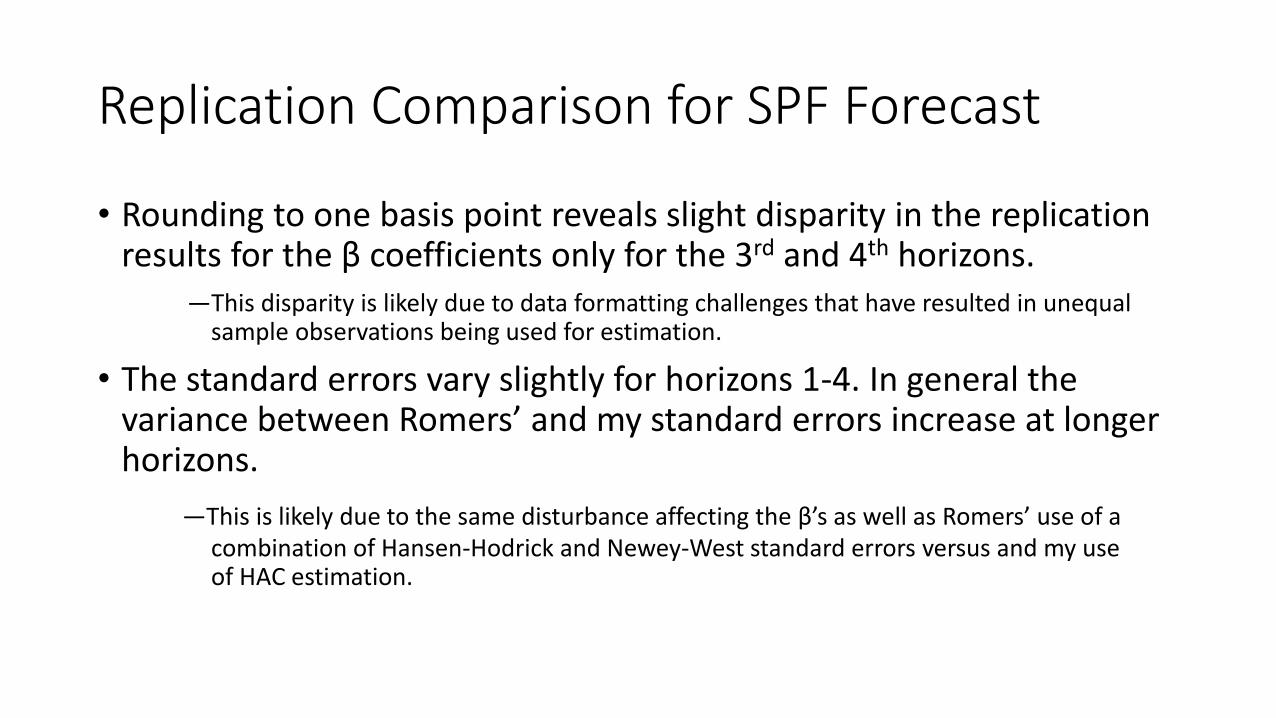
Replication Comparison for SPF Forecast
• Rounding to one basis point reveals slight disparity in the replication results for the β coefficients only for the 3rd and 4th horizons.
—This disparity is likely due to data formatting challenges that have resulted in unequal sample observations being used for estimation.
• The standard errors vary slightly for horizons 1-4. In general the variance between Romers’ and my standard errors increase at longer horizons.
—This is likely due to the same disturbance affecting the β’s as well as Romers’ use of a combination of Hansen-Hodrick and Newey-West standard errors versus and my useof HAC estimation.
1. Test for Forecast Rationality - Evaluation
• (Romer and Romer, 2000) infer that virtually all forecasts across horizons contain useful information in predicting actual inflation.
• β coefficients are positive, generally between 0.5 and 1, and significant at conventional levels.
• My findings support the Romer conclusion across the same sample.
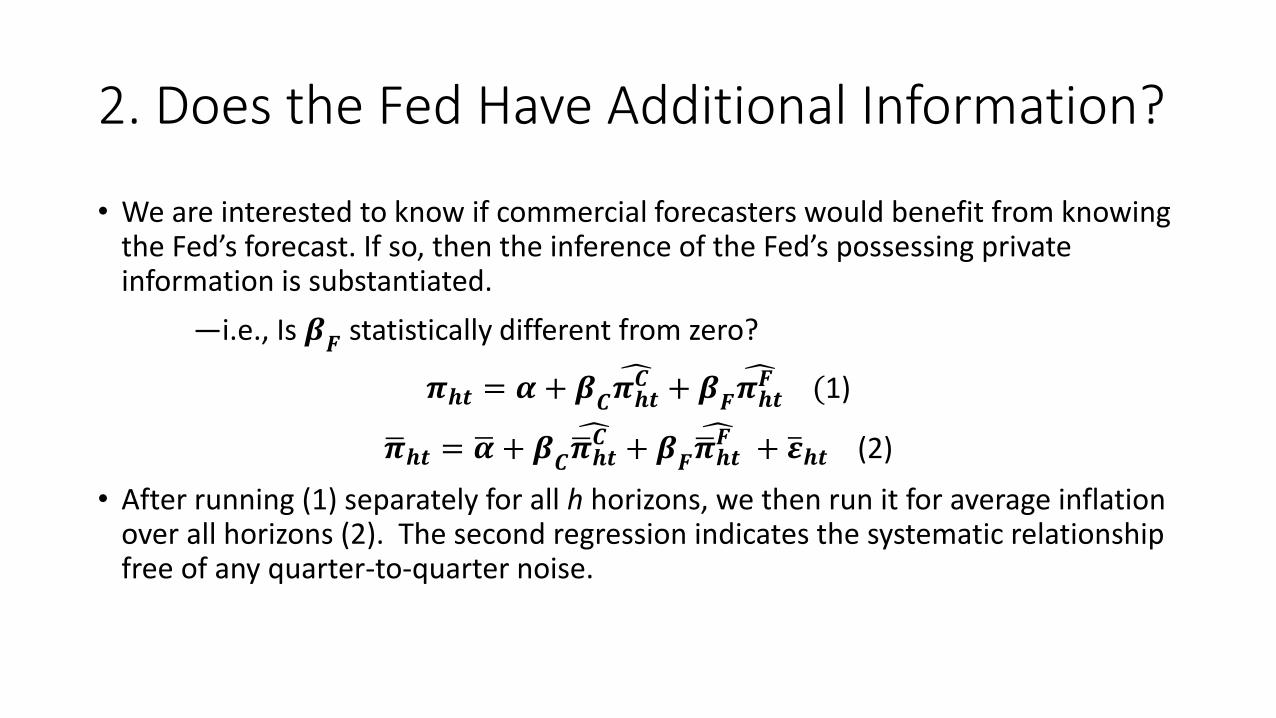
2. Does the Fed Have Additional Information?
• We are interested to know if commercial forecasters would benefit from knowing the Fed’s forecast. If so, then the inference of the Fed’s possessing private information is substantiated.
—i.e., Is 𝜷𝑭
statistically different from zero?
𝝅𝒉𝒕 = 𝜶 + 𝜷𝑪 𝝅𝒉𝒕𝑪 + 𝜷𝑭 𝝅𝒉𝒕𝑭 (1)
𝝅𝒉𝒕 = 𝜶 + 𝜷𝑪 𝝅𝒉𝒕𝑪 + 𝜷𝑭 𝝅𝒉𝒕𝑭 + 𝜺𝒉𝒕 (2)
• After running (1) separately for all h horizons, we then run it for average inflation over all horizons (2). The second regression indicates the systematic relationship free of any quarter-to-quarter noise.
*Romers’ estimates in red
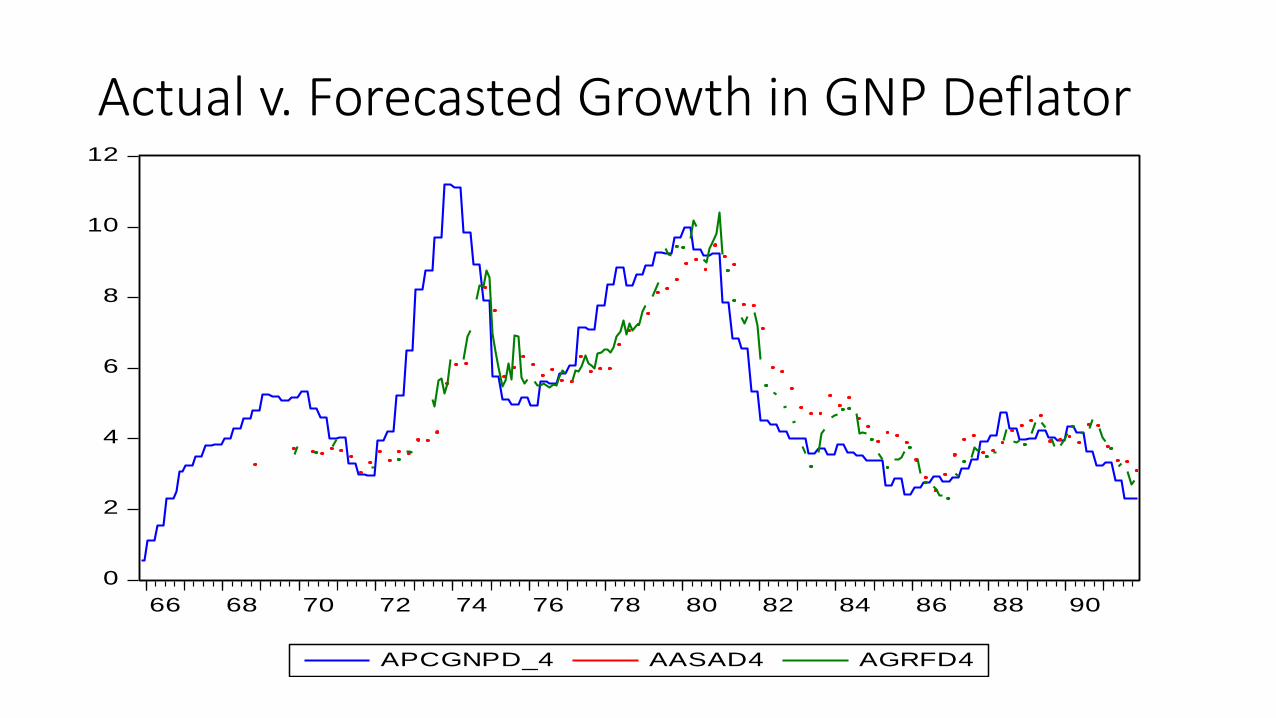
Actual v. Forecasted Growth in GNP Deflator
0
2
4
6
8
10
12
66 68 70 72 74 76 78 80 82 84 86 88 90
APCGNPD_4 AASAD4 AGRFD4
2. Test for Fed Private Information - Evaluation
• The replicated coefficient estimates and standard errors frequently match exactly and never differ by any significant amount across all horizons separately and for the 4-quarter average inflation regression.
• My results are in agreement with the Romers’ that the Fed’s forecasts present overwhelmingly significant indication that it has information unavailable to the public.
• Evidence of this is given by t-statistics on 𝜷𝑭 significant at conventional levels, leading us to reject the null hypothesis of no asymmetric information.
Sources of Asymmetric Information
• Inside information about monetary policy —Fed forecasts have predictive capability at relatively long horizons; thus it may be possible staff members have inside information about the FOMC’s commitment to a particular policy.
• Advance access to official data—Unlikely since the Fed chair only receives data on key economic variables only the
night before release to the public. Lead time should only give an advantage in the short run;
however the Fed’s forecast has predictive power at long horizons.
• Greater allocation of resources for forecasting at the Fed —Fed devotes more inputs toward forecasting than any commercial entity, resulting in superior value of its forecasts.
Robustness Check – Forecast Timing
• Basic specification for regressions (1) and (2) put the Fed forecast at a possible timing disadvantage because the Fed generally makes its forecasts early in the month, whereas the SPF forecasts are generated during the latter part of the month.
• To ensure the preceding results are not attributable to timing disadvantages, we run (1) and (2) with a 1-month lag in the Fed forecast, thereby putting it at a deliberate disadvantage relative to the commercial forecast.
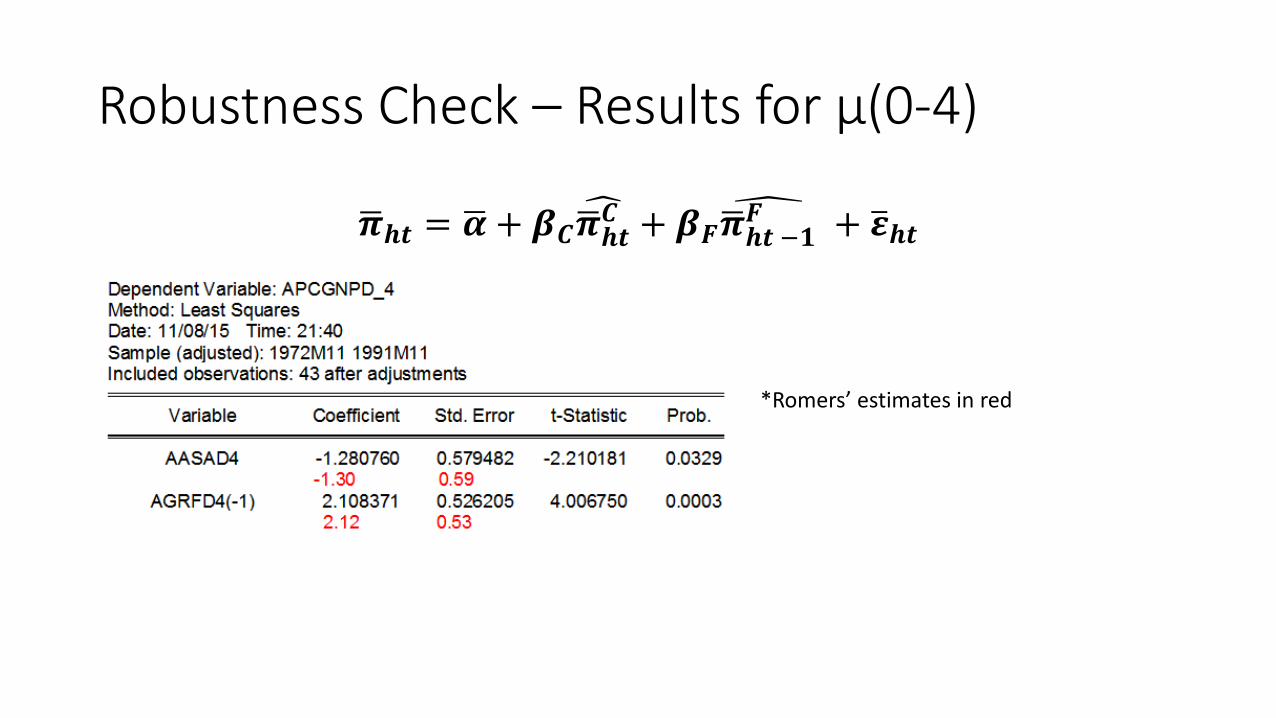
Robustness Check – Results for μ(0-4)
𝝅𝒉𝒕 = 𝜶 + 𝜷𝑪 𝝅𝒉𝒕𝑪 + 𝜷𝑭 𝝅𝒉𝒕 −𝟏𝑭 + 𝜺𝒉𝒕
*Romers’ estimates in red
3. Implication for the Behavior or Interest Rates
• The Fed’s asymmetric information impacts interest rates if it is somehow signaled to the market.
• Theory leads us to look for such signaling in the monetary policy actions of the Fed.
• (Romer and Romer 2000) use the change in the Fed Funds-rate target as an indicator of monetary action for the period 1974:8 – 1979:8, 1984:2 -1991:11. (Excludes the Volcker disinflationary period during the 1980s)
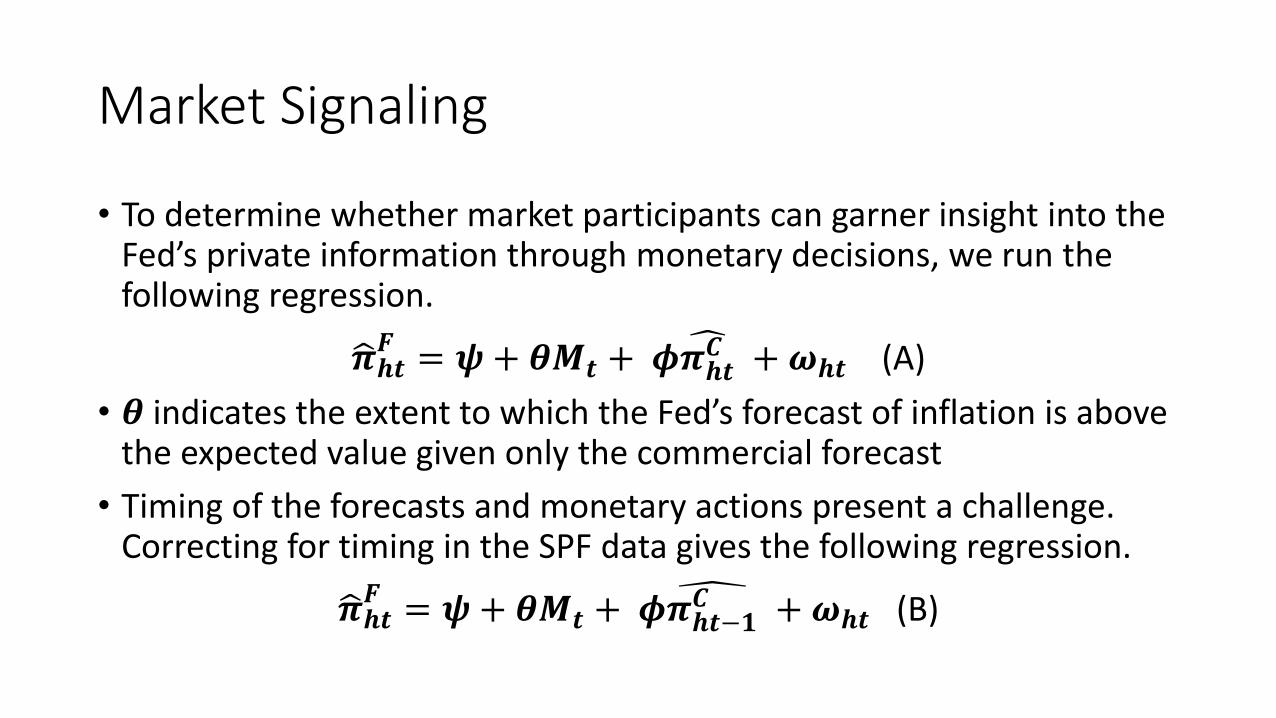
Market Signaling
• To determine whether market participants can garner insight into the Fed’s private information through monetary decisions, we run the following regression.
𝝅𝒉𝒕𝑭 = 𝝍+ 𝜽𝑴𝒕 + 𝝓
𝝅𝒉𝒕𝑪 +𝝎𝒉𝒕 (A)
• 𝜽 indicates the extent to which the Fed’s forecast of inflation is above the expected value given only the commercial forecast
• Timing of the forecasts and monetary actions present a challenge. Correcting for timing in the SPF data gives the following regression.
𝝅𝒉𝒕𝑭 = 𝝍+ 𝜽𝑴𝒕 + 𝝓
𝝅𝒉𝒕−𝟏𝑪 +𝝎𝒉𝒕 (B)
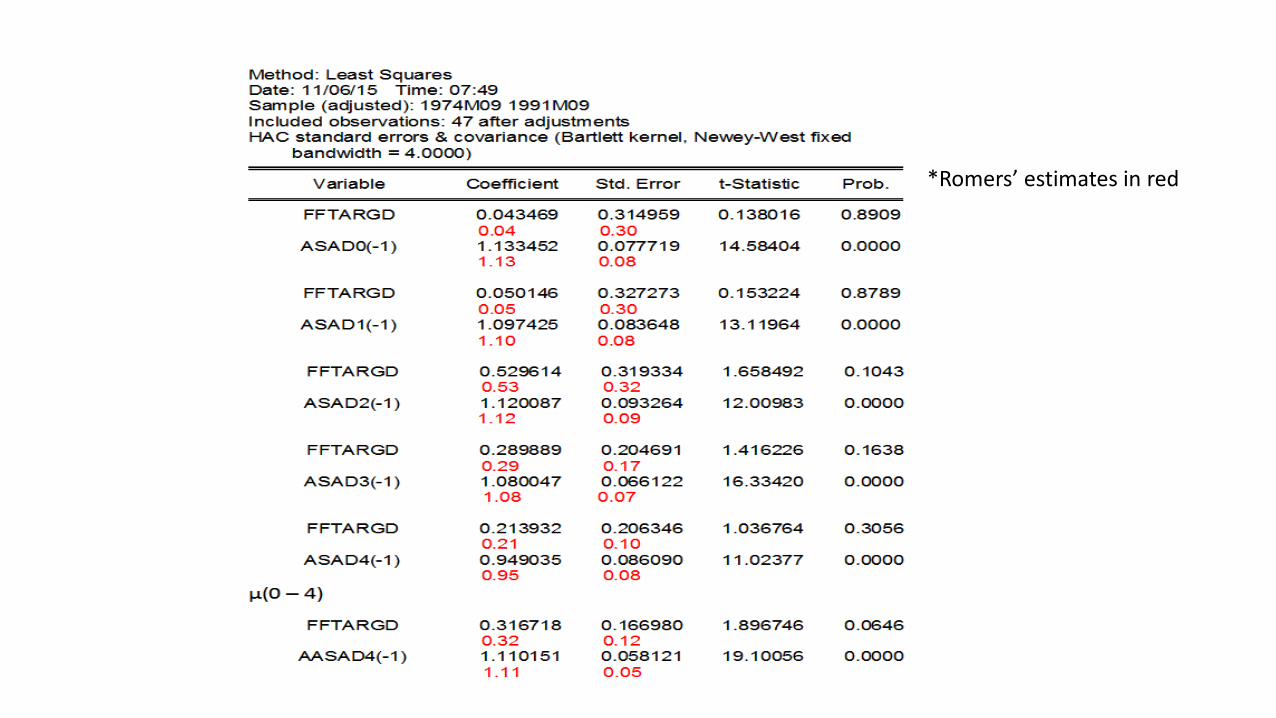
*Romers’ estimates in red
Market Signaling – Evaluation
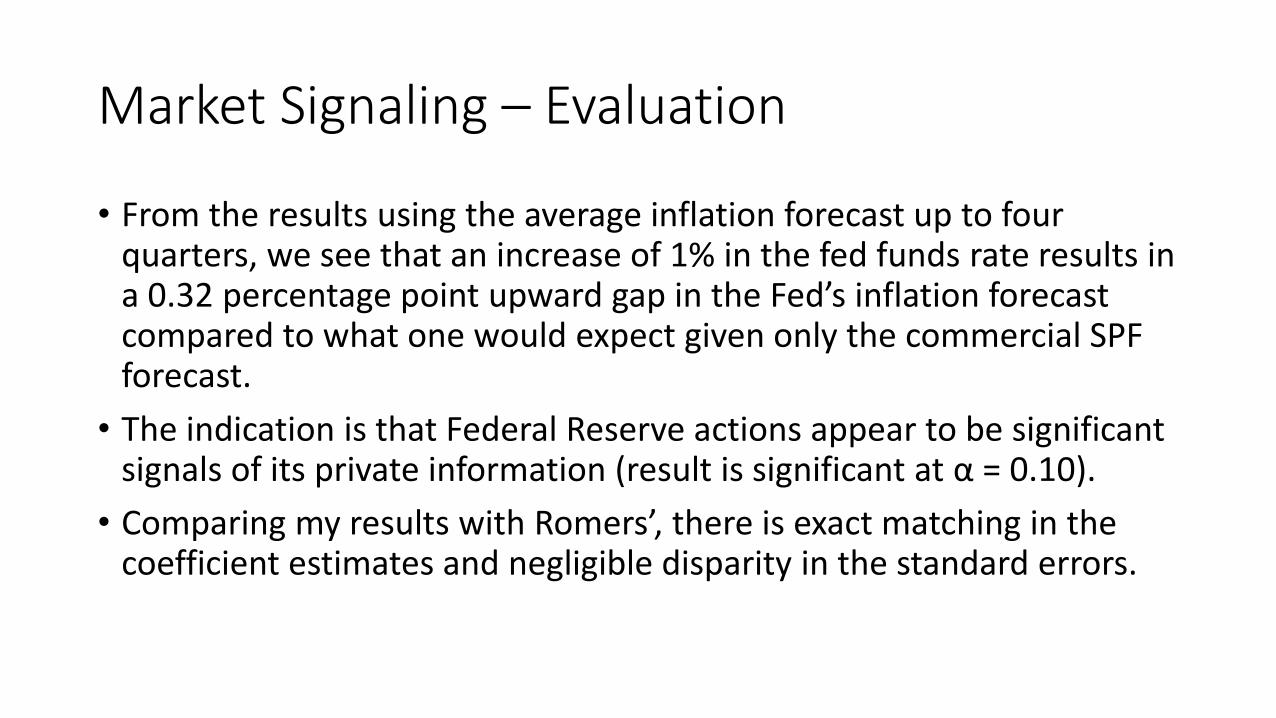
• From the results using the average inflation forecast up to four quarters, we see that an increase of 1% in the fed funds rate results in a 0.32 percentage point upward gap in the Fed’s inflation forecast compared to what one would expect given only the commercial SPF forecast.
• The indication is that Federal Reserve actions appear to be significant signals of its private information (result is significant at α = 0.10).
• Comparing my results with Romers’, there is exact matching in the coefficient estimates and negligible disparity in the standard errors.
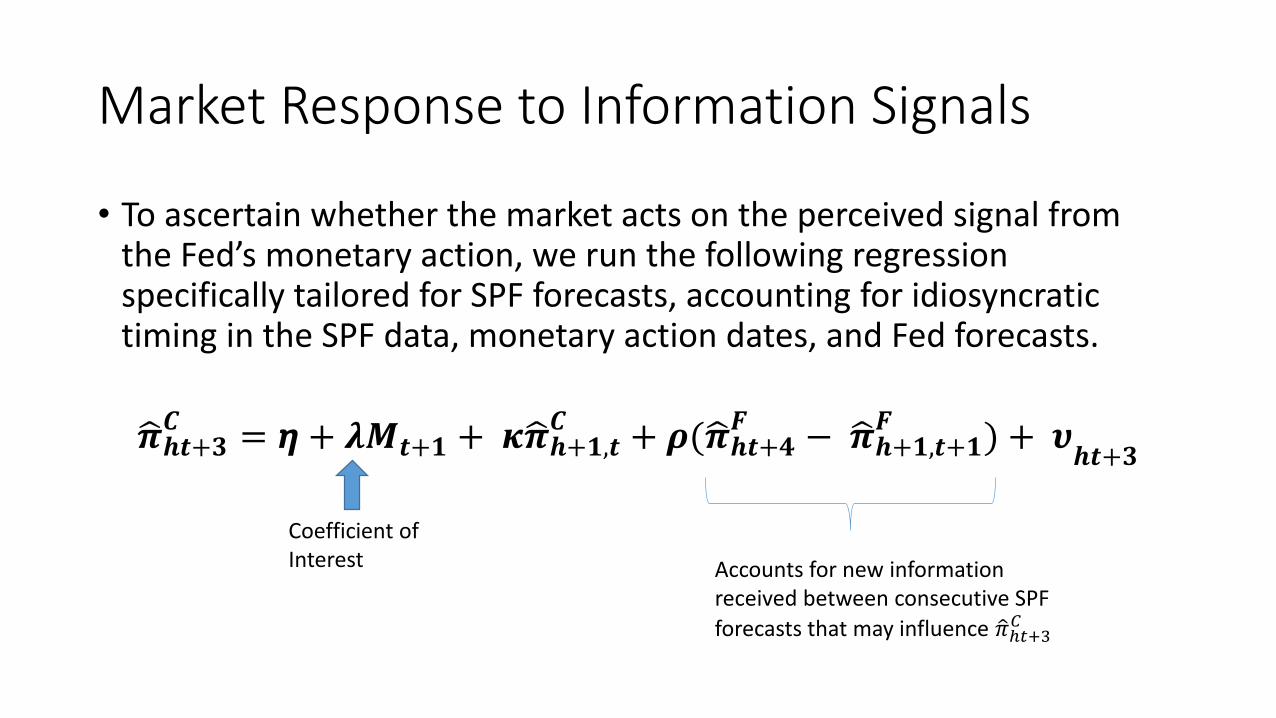
Market Response to Information Signals
• To ascertain whether the market acts on the perceived signal from the Fed’s monetary action, we run the following regression specifically tailored for SPF forecasts, accounting for idiosyncratic timing in the SPF data, monetary action dates, and Fed forecasts.
𝝅𝒉𝒕+𝟑𝑪 = 𝞰 + 𝝀𝑴𝒕+𝟏 + 𝜿 𝝅𝒉+𝟏,𝒕
𝑪 + 𝝆( 𝝅𝒉𝒕+𝟒𝑭 − 𝝅𝒉+𝟏,𝒕+𝟏
𝑭 ) + 𝝊𝒉𝒕+𝟑
Coefficient of Interest Accounts for new information
received between consecutive SPF
forecasts that may influence 𝜋ℎ𝑡+3𝐶
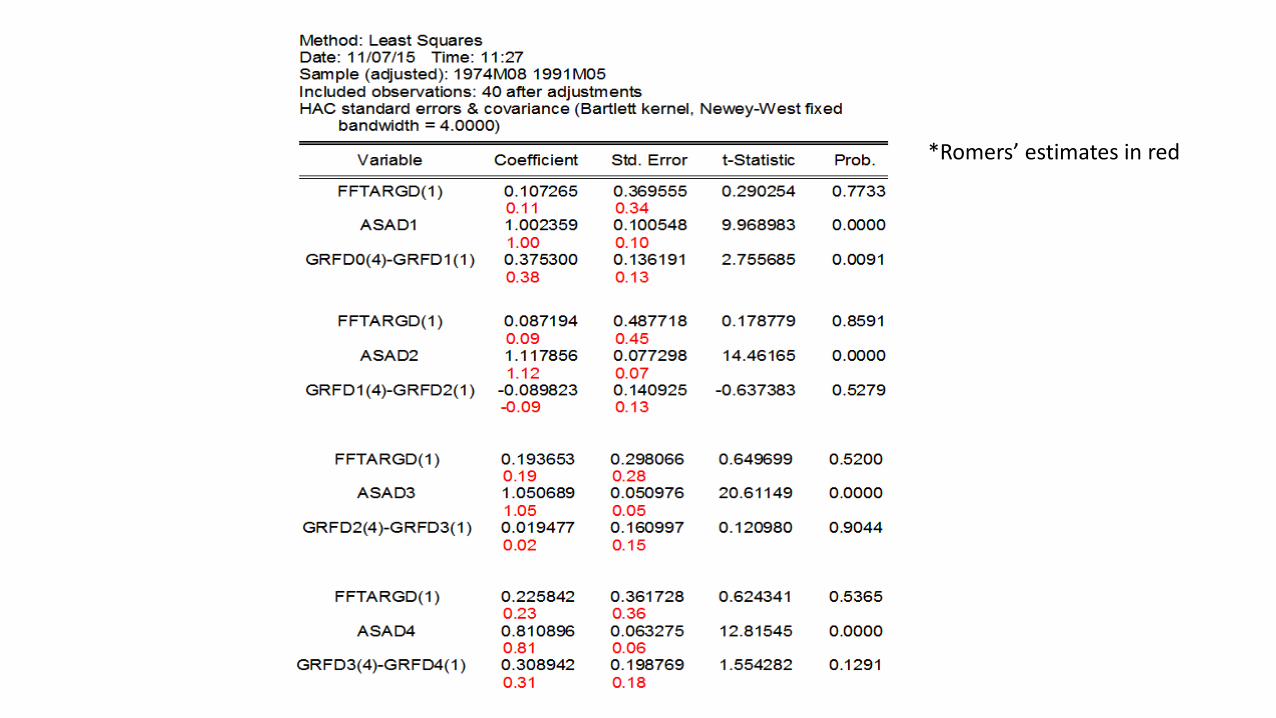
*Romers’ estimates in red
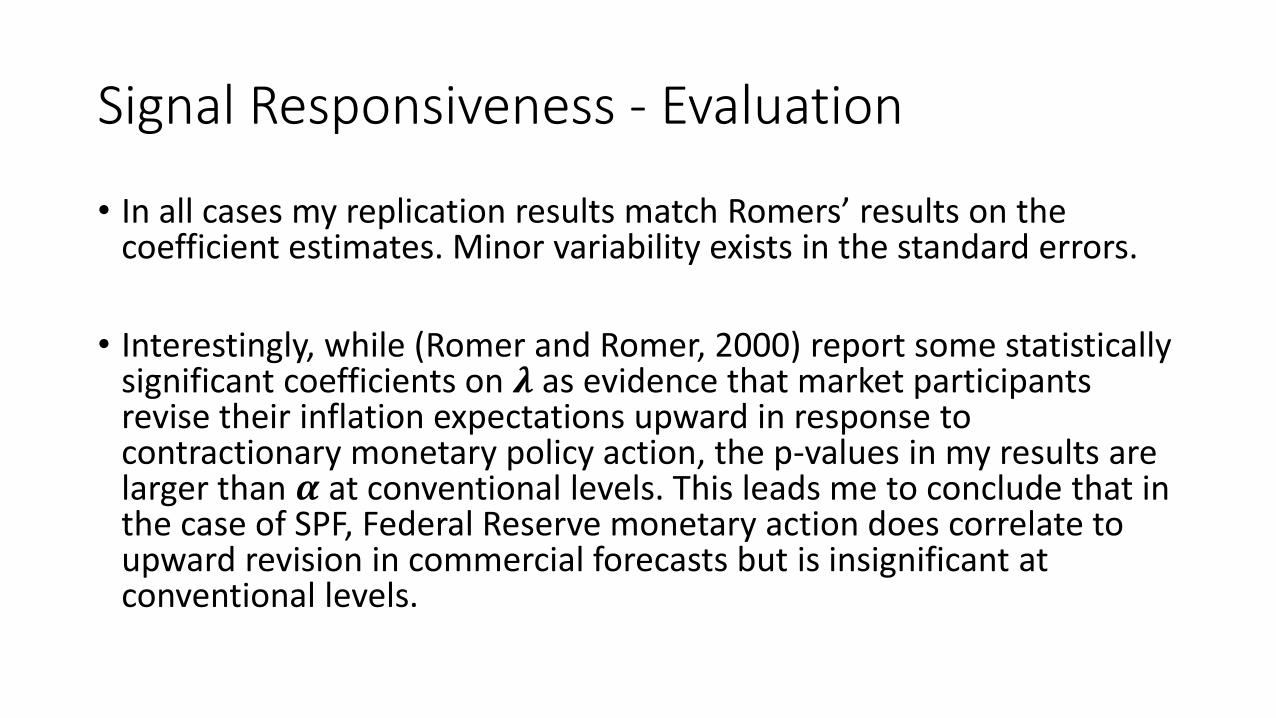
Signal Responsiveness - Evaluation
• In all cases my replication results match Romers’ results on the coefficient estimates. Minor variability exists in the standard errors.
• Interestingly, while (Romer and Romer, 2000) report some statistically significant coefficients on 𝝀 as evidence that market participants revise their inflation expectations upward in response to contractionary monetary policy action, the p-values in my results are larger than 𝜶 at conventional levels. This leads me to conclude that in the case of SPF, Federal Reserve monetary action does correlate to upward revision in commercial forecasts but is insignificant at conventional levels.

AIH as Explanation for Monetary Action Effects on the Term Structure of Interest Rates
• How much of commercial forecasters’ response to monetary actions is attributable to the asymmetric information revealed by the monetary actions themselves?
• Competing theories: 1. Sluggish Inflation – contractionary action induces long-lasting increase in real rates and
correspondingly gradual decline in inflation.
2. Asymmetric information about real rate equilibrium - contractionary action implies current/future real rates are higher than previously believed, causing increase in nominal rates.
3. Overreaction – long-term rates overreact to short-term rates as a violation of the rational expectations theory.
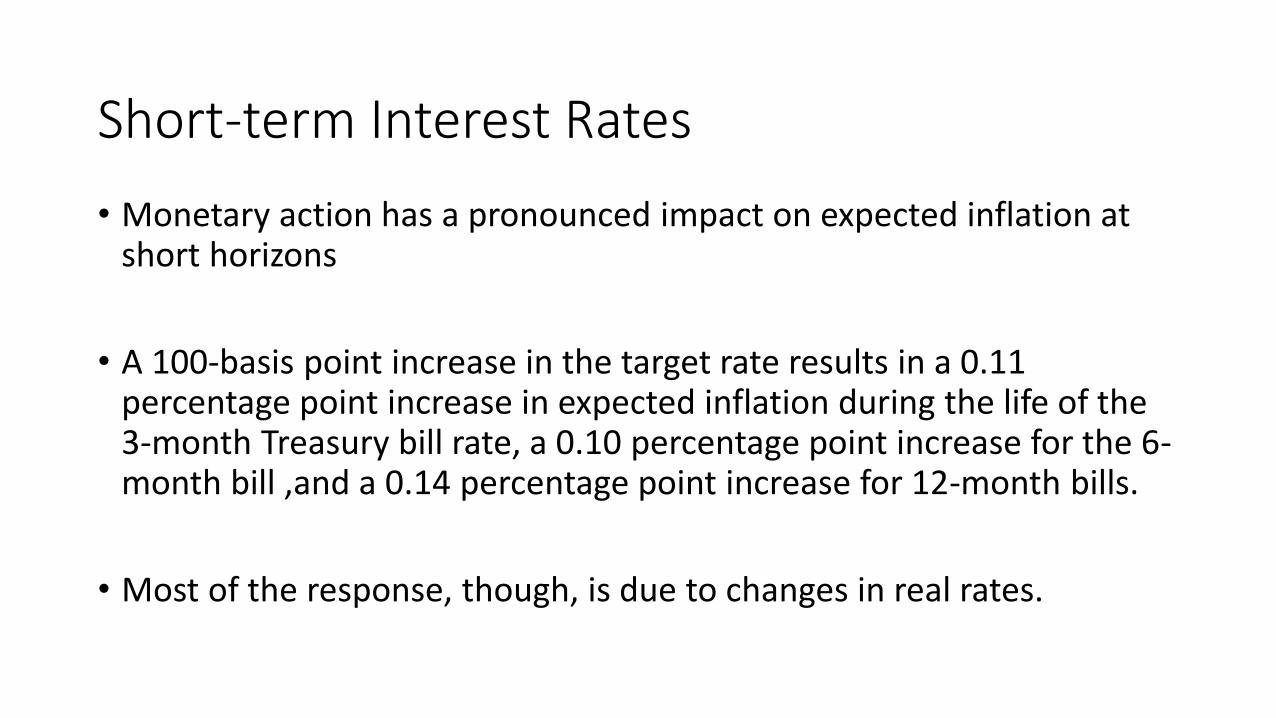
Short-term Interest Rates
• Monetary action has a pronounced impact on expected inflation at short horizons
• A 100-basis point increase in the target rate results in a 0.11 percentage point increase in expected inflation during the life of the 3-month Treasury bill rate, a 0.10 percentage point increase for the 6-month bill ,and a 0.14 percentage point increase for 12-month bills.
• Most of the response, though, is due to changes in real rates.
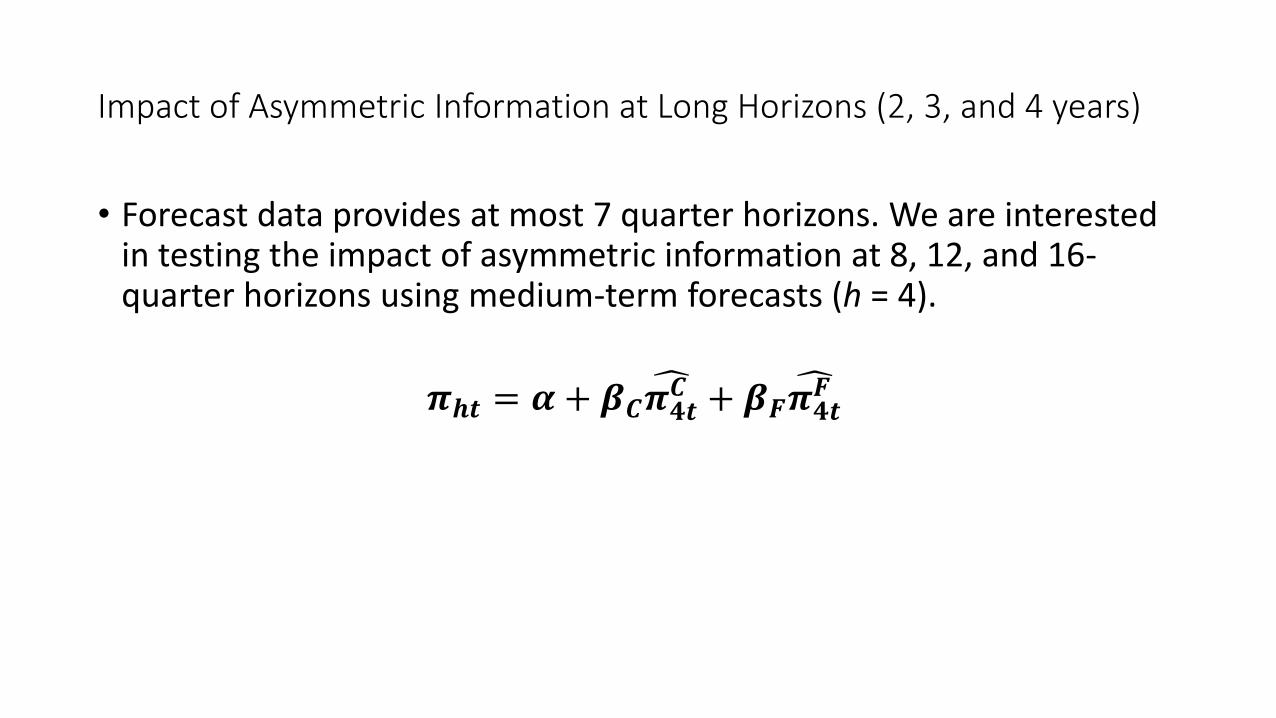
Impact of Asymmetric Information at Long Horizons (2, 3, and 4 years)
• Forecast data provides at most 7 quarter horizons. We are interested in testing the impact of asymmetric information at 8, 12, and 16-quarter horizons using medium-term forecasts (h = 4).
𝝅𝒉𝒕 = 𝜶 + 𝜷𝑪 𝝅𝟒𝒕𝑪 + 𝜷𝑭 𝝅𝟒𝒕𝑭
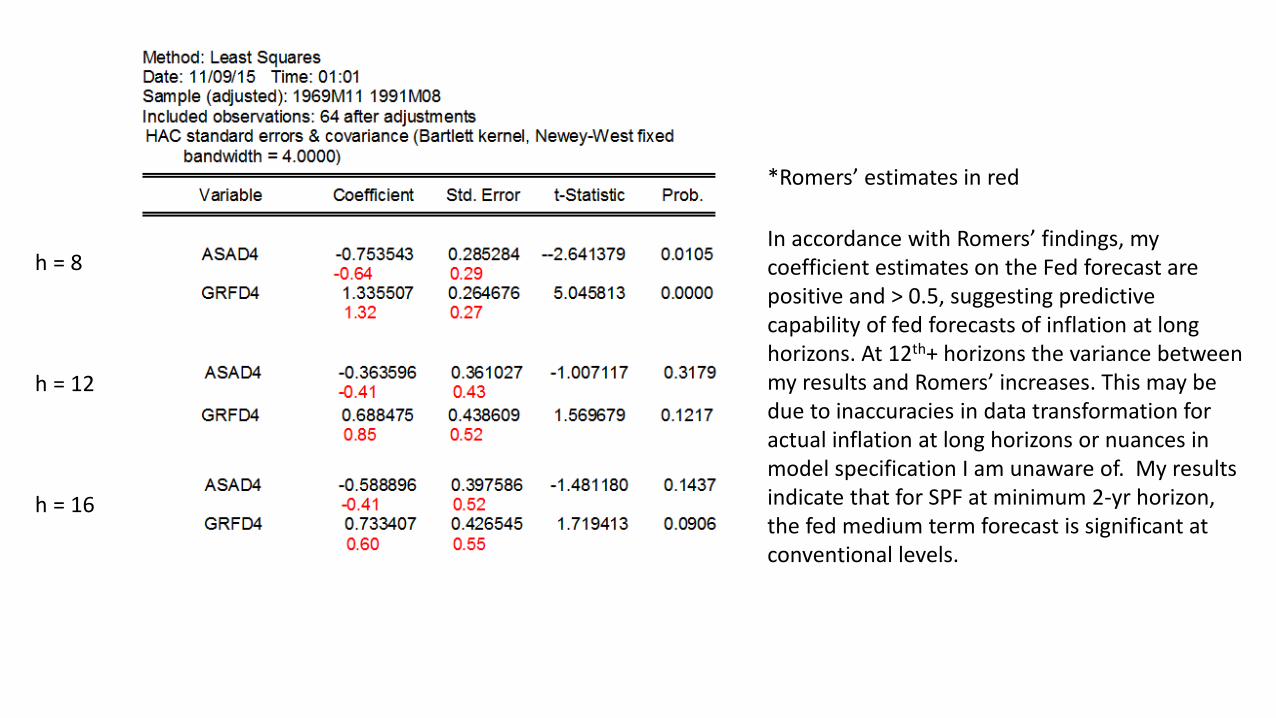
h = 8
h = 12
h = 16
*Romers’ estimates in red
In accordance with Romers’ findings, my coefficient estimates on the Fed forecast are positive and > 0.5, suggesting predictive capability of fed forecasts of inflation at long horizons. At 12th+ horizons the variance between my results and Romers’ increases. This may be due to inaccuracies in data transformation for actual inflation at long horizons or nuances in model specification I am unaware of. My results indicate that for SPF at minimum 2-yr horizon, the fed medium term forecast is significant at conventional levels.
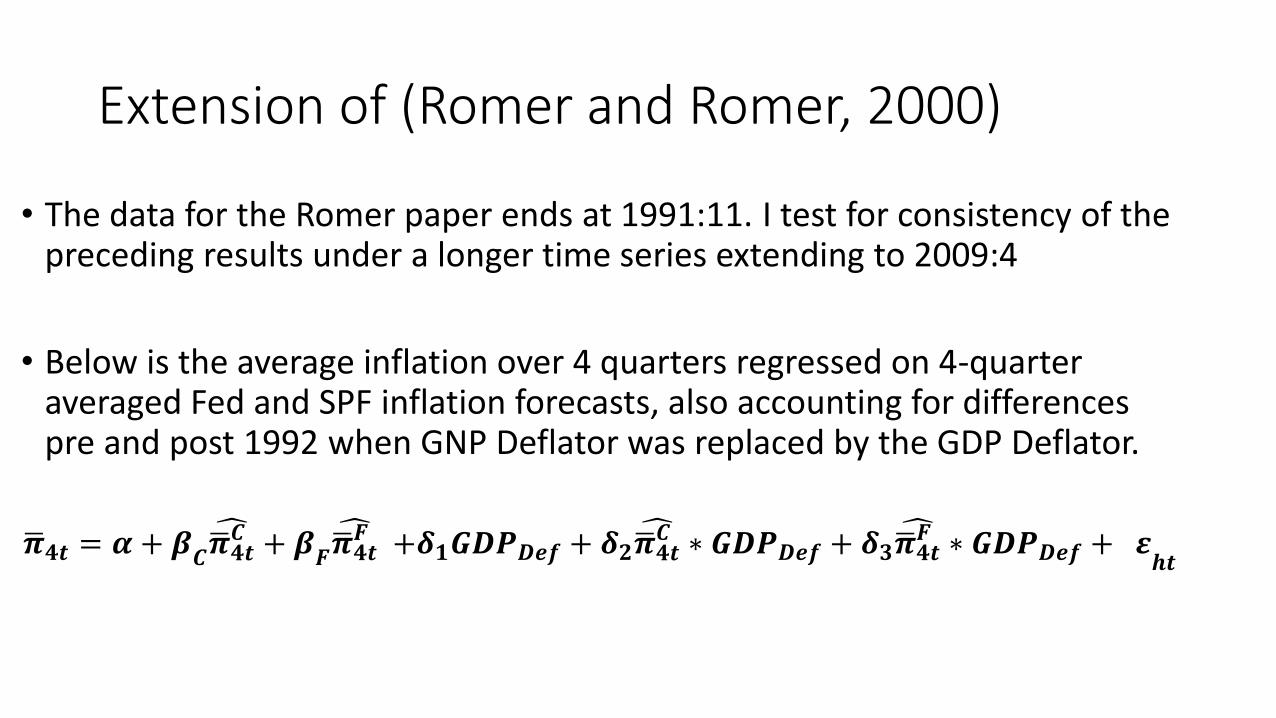
Extension of (Romer and Romer, 2000)
• The data for the Romer paper ends at 1991:11. I test for consistency of the preceding results under a longer time series extending to 2009:4
• Below is the average inflation over 4 quarters regressed on 4-quarter averaged Fed and SPF inflation forecasts, also accounting for differences pre and post 1992 when GNP Deflator was replaced by the GDP Deflator.
𝝅𝟒𝒕 = 𝜶 + 𝜷𝑪 𝝅𝟒𝒕𝑪 + 𝜷𝑭 𝝅𝟒𝒕𝑭 +𝜹𝟏𝑮𝑫𝑷𝑫𝒆𝒇 + 𝜹𝟐
𝝅𝟒𝒕𝑪 ∗ 𝑮𝑫𝑷𝑫𝒆𝒇 + 𝜹𝟑
𝝅𝟒𝒕𝑭 ∗ 𝑮𝑫𝑷𝑫𝒆𝒇 + 𝜺𝒉𝒕
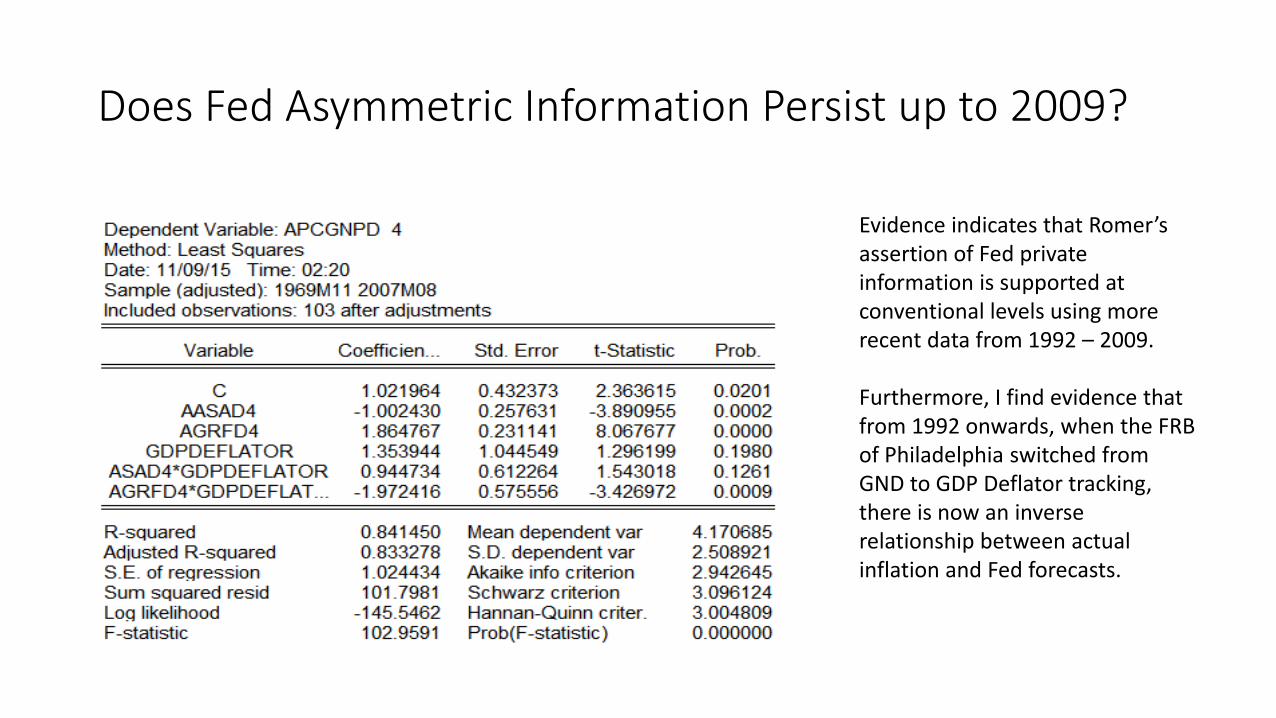
Does Fed Asymmetric Information Persist up to 2009?
Evidence indicates that Romer’sassertion of Fed private information is supported at conventional levels using more recent data from 1992 – 2009.
Furthermore, I find evidence that from 1992 onwards, when the FRB of Philadelphia switched from GND to GDP Deflator tracking, there is now an inverse relationship between actual inflation and Fed forecasts.
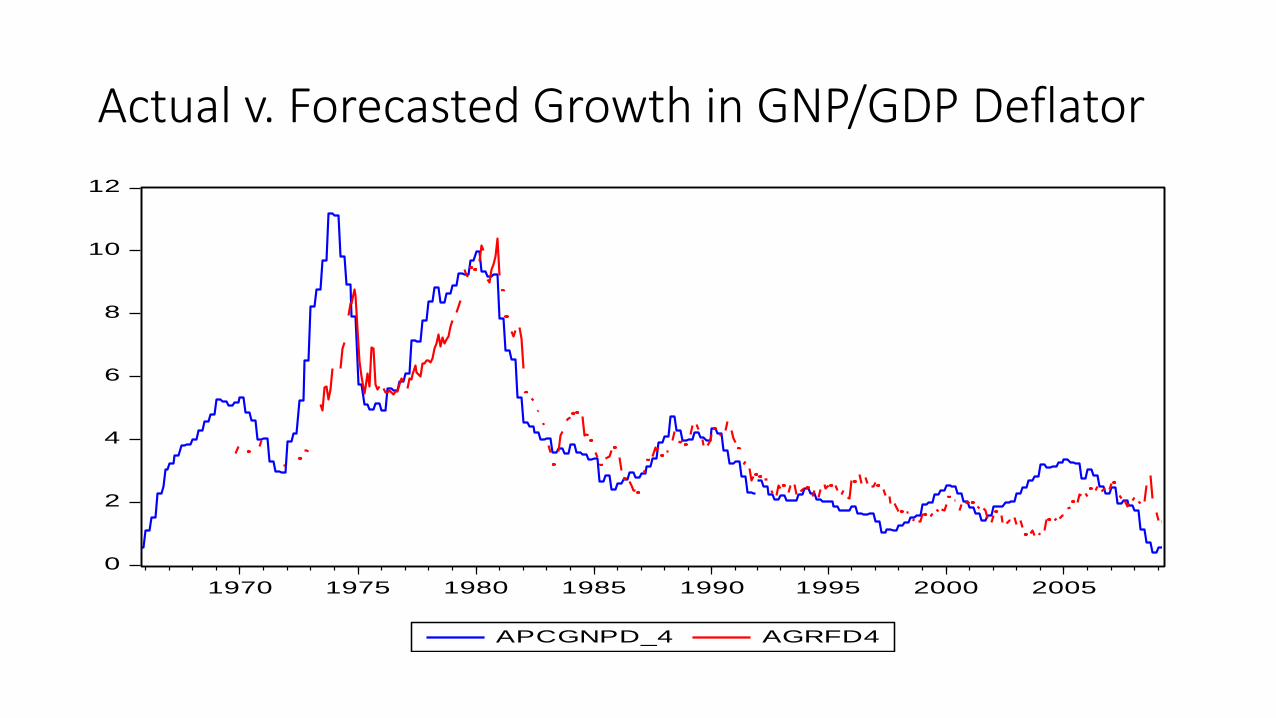
Actual v. Forecasted Growth in GNP/GDP Deflator
0
2
4
6
8
10
12
1970 1975 1980 1985 1990 1995 2000 2005
APCGNPD_4 AGRFD4