Embed Size (px)
Citation preview
DMD #13037
1
Asymmetric intestinal first-pass metabolism causes minimal oral
bioavailability of midazolam in cynomolgus monkey
Tomohiro Nishimura, Nobuyuki Amano, Yoshiyuki Kubo, Midori Ono, Yukio
Kato, Hisashi Fujita, Yoshiaki, Kimura and Akira Tsuji
Affiliations
Division of Pharmaceutical Sciences, Graduate School of Natural Science and
Technology, Kanazawa University, Kakuma-machi, Kanazawa 920-1192, Japan
(T.M., Y.K., Y.K., A.T.); Discovery Research Center, Pharmaceutical Research
Division, Takeda Pharmaceutical Co. Ltd., Osaka 532-8686, Japan (N.A., M.O.,
H.F., Y.K.)
DMD Fast Forward. Published on April 30, 2007 as doi:10.1124/dmd.106.013037
Copyright 2007 by the American Society for Pharmacology and Experimental Therapeutics.
This article has not been copyedited and formatted. The final version may differ from this version.DMD Fast Forward. Published on April 30, 2007 as DOI: 10.1124/dmd.106.013037
at ASPE
T Journals on N
ovember 12, 2021
dmd.aspetjournals.org
Dow
nloaded from
DMD #13037
2
Correspondence to:
Akira Tsuji, Ph. D., Professor
Graduate School of Natural Science and Technology,
Kanazawa University,
Kakuma-machi, Kanazawa 920-1192, Japan
Running Title
Species difference in intestinal first-pass for midazolam
Abbreviations
BCS, biopharmaceutical classification system; CYP, cytochrome P450; FD-4,
FITC-dextran (mw. 4000); P-gp, P-glycoprotein; ER, extraction ratio; LC-MS/MS,
liquid chromatography coupled with tandem mass spectrometry; SLC, solute
carrier.
Number of text pages: 41
Number of tables: 3
Number of figures: 5
Words in abstract: 249
Words in introduction: 796
Words in discussion: 2003
This article has not been copyedited and formatted. The final version may differ from this version.DMD Fast Forward. Published on April 30, 2007 as DOI: 10.1124/dmd.106.013037
at ASPE
T Journals on N
ovember 12, 2021
dmd.aspetjournals.org
Dow
nloaded from
DMD #13037
3
ABSTRACT
Oral bioavailability of some drugs is substantially lower in cynomolgus
monkeys than in various other species, including humans. In the present study,
midazolam was used as a model drug to investigate the reason for the lower
bioavailability in these monkeys. The bioavailability of midazolam after oral
administration was minimal in monkeys and rats, being only 2.1 and 1.1%,
respectively. In monkeys, this low bioavailability could not be explained simply in
terms of a hepatic first-pass effect. To examine the roles of intestinal metabolism
and transport, we evaluated apical-to-basal and basal-to-apical transport of
midazolam, and the formation of metabolites in small intestinal tissues using an
Ussing-type chamber. The values of mucosal extraction ratio were estimated to
be 0.97, 0.93 and 0.89 during apical-to-basal transport in the upper, middle and
lower small intestine of monkeys, respectively, whereas the corresponding
values for rats were close to zero, indicating that extensive metabolism of
midazolam occurs, particularly in the upper region of the small intestine in
monkeys, but not rats. Interestingly, formation of the metabolites was much
greater during transport in the apical-to-basal direction than in the basal-to-apical
direction, and this could be well explained by a mathematical model based on the
assumption that extensive metabolism is associated with the uptake process of
midazolam from the apical cell-surface. Thus, we conclude that an asymmetric
distribution of metabolic activity in the small intestine, leading to extensive
metabolism during uptake from the apical cell-surface, accounts for the minimal
This article has not been copyedited and formatted. The final version may differ from this version.DMD Fast Forward. Published on April 30, 2007 as DOI: 10.1124/dmd.106.013037
at ASPE
T Journals on N
ovember 12, 2021
dmd.aspetjournals.org
Dow
nloaded from
DMD #13037
4
oral bioavailability of midazolam in cynomolgus monkeys.
This article has not been copyedited and formatted. The final version may differ from this version.DMD Fast Forward. Published on April 30, 2007 as DOI: 10.1124/dmd.106.013037
at ASPE
T Journals on N
ovember 12, 2021
dmd.aspetjournals.org
Dow
nloaded from
DMD #13037
5
INTRODUCTION
Absolute bioavailability is an important parameter related to the
pharmacological efficacy of orally administered drugs, and prediction of oral
bioavailability is a key aspect of new drug development. Monkeys are often used
in preclinical studies as non-human primates because of their genetic similarity to
humans. However, the pharmacokinetic properties of drugs in monkeys are not
always similar to those in humans. In particular, monkeys tend to exhibit lower
bioavailability than humans (Sietsema, 1989; Chiou and Buehler, 2002; Ward et
al., 2005), and it is difficult to predict the oral bioavailability in human from data
obtained in monkeys.
Since absolute oral bioavailability is affected by first-pass metabolism
and/or excretion in both small intestine and liver, species difference in each
process should be carefully examined to understand the factors affecting
bioavailability. Chiou and Buehler (2002) showed, by analyzing literature data,
including fraction of dose absorbed (Fa) and absolute bioavailability, that
monkeys have similar intestinal drug absorption, but larger hepatic (nonrenal)
clearance of 43 drugs compared with humans. However, the hepatic blood flow
rate in monkeys is larger than that in humans (Davies and Morris, 1993), so that
the ratio of hepatic clearance to hepatic blood flow rate is not very different
between humans and monkeys (Ward and Smith, 2004), and therefore the
hepatic availability (Fh) may be similar in monkeys and humans. Thus, intestinal
first-pass metabolism must be considered as a candidate mechanism to account
This article has not been copyedited and formatted. The final version may differ from this version.DMD Fast Forward. Published on April 30, 2007 as DOI: 10.1124/dmd.106.013037
at ASPE
T Journals on N
ovember 12, 2021
dmd.aspetjournals.org
Dow
nloaded from
DMD #13037
6
for the poor oral bioavailability in monkeys.
In contrast to Fa and Fh, there have been few systematic studies of the
extent of intestinal metabolism, which directly affects intestinal availability (Fg)
following oral administration. Recently, several researchers have pointed out
the importance of intestinal metabolism in oral bioavailability, suggesting that it
may be a defense mechanism to block passage of xenobiotics across the small
intestine. Intestinal expression of CYP3A, a species of cytochrome P450, has
been reported in rats (Kolars et al., 1992a; Li et al., 2002; Aiba et al., 2005),
monkeys (Hashizume et al., 2001) and humans (Kolars et al., 1992b; Paine et al.,
1997; Zhang et al., 1999). Interplay between CYP3A and an efflux transporter
P-glycoprotein (P-gp), the substrate specificities of which partially overlap, has
been proposed to be involved in determining the efficiency of intestinal first-pass
removal (Watkins, 1997; Benet et al., 2004).
Midazolam, a short-acting benzodiazepine central nervous system
depressant, is a typical substrate of CYP3A, its oral bioavailability being 24 - 46%
in humans (Sakuda et al., 2006). In humans, Fa•Fg and Fh were estimated to be
57 and 56%, respectively (Thummel et al., 1996), indicating that bioavailability of
midazolam is affected by both intestinal and hepatic first-pass effects.
Intraduodenally administered midazolam was rapidly absorbed with a Tmax of 15
- 30 min, suggesting that midazolam is highly permeable and is mostly absorbed
in the upper part of the intestine, where CYP3A expression is higher than in other
regions of the small intestine (Paine et al., 1996; Paine et al., 1997).
This article has not been copyedited and formatted. The final version may differ from this version.DMD Fast Forward. Published on April 30, 2007 as DOI: 10.1124/dmd.106.013037
at ASPE
T Journals on N
ovember 12, 2021
dmd.aspetjournals.org
Dow
nloaded from
DMD #13037
7
Unlike humans, cynomolgus monkeys show minimal bioavailability of
midazolam (about 2 - 6%), though Fh was not small (~66%, (Kanazu et al., 2004;
Sakuda et al., 2006). Interestingly, Sakuda et al. (2006) recently showed that
midazolam is completely absorbed by intestinal tissue in cynomolgus monkey,
implying that intestinal metabolism may have a crucial role in the low
bioavailability of midazolam (Sakuda et al., 2006). In rats, on the other hand,
bioavailability of midazolam after oral administration and administration into a
jejunal loop was only 4.6 and 12%, respectively, but intestinal first-pass removal
was at most 25% (Lau et al., 1996; Higashikawa et al., 1999), suggesting that
intestinal metabolism play a relatively minor role in rats, compared with monkeys.
In the present study, we aimed to clarify the nature of the species
difference in oral bioavailability of midazolam between monkeys and rats,
focusing on the intestinal first-pass. As regards membrane transport in the small
intestine, several transporters have been suggested to contribute to drug
absorption (Tsuji and Tamai, 1996; Katsura and Inui, 2003; Daniel, 2004; Sai and
Tsuji, 2004), and in particular, P-gp is involved in regulation of the intestinal
permeation of various xenobiotics (Terao et al., 1996). Midazolam shows high
membrane permeability and is categorized as BCS class I (Wu and Benet, 2005).
It is believed to be absorbed via passive diffusion, but not transported by P-gp
(Benet and Cummins, 2001; Polli et al., 2001). On the other hand, another report
has suggested that midazolam is a highly permeable P-gp substrate
(Tolle-Sander et al., 2003). Therefore, involvement of P-gp in the absorption of
This article has not been copyedited and formatted. The final version may differ from this version.DMD Fast Forward. Published on April 30, 2007 as DOI: 10.1124/dmd.106.013037
at ASPE
T Journals on N
ovember 12, 2021
dmd.aspetjournals.org
Dow
nloaded from
DMD #13037
8
midazolam remains controversial. To establish whether an efflux transporter is
involved in the intestinal midazolam absorption in monkeys and rats, we
evaluated midazolam transport in both apical-to-basal and basal-to-apical
directions in various regions of the intestine, using an Ussing-type chamber
system.
This article has not been copyedited and formatted. The final version may differ from this version.DMD Fast Forward. Published on April 30, 2007 as DOI: 10.1124/dmd.106.013037
at ASPE
T Journals on N
ovember 12, 2021
dmd.aspetjournals.org
Dow
nloaded from
DMD #13037
9
MATERIALS AND METHODS
Chemicals
Midazolam was purchased from Wako Pure Chemical Industries, Ltd.
(Osaka, Japan), and 1’- and 4-hydroxymidazolam were purchased from Toronto
Research Chemicals Inc. (Ontario, Canada). Anti-human CYP3A4, anti-rabbit
IgG (BD GENTEST), C219 monoclonal antibody (Dako, Carpinteria, CA), and
anti-rat CYP3A2 (Daiichi Pure Chemicals, Tokyo, Japan) were commercial
products.
Animals
Cynomolgus monkeys (5-6 kg, male) were purchased from China
National Scientific Instruments & Materials Import / Export Corporation (China),
and maintained on approximately 108 g of food (Teklad Global 25% Protein
Primate Diet, Harlan Teklad, Madison, WI) once a day, with free access to water.
Beagle dogs (2-3 years old, 14-19 kg, male) were purchased from Shin Nippon
Biomedical Laboratories, Ltd., Japan (Kagoshima, Japan), and maintained on
approximately 350 g of food (VE-10, Nippon Pet Food Ltd., Tokyo, Japan) once a
day, with free access to water. Sprague-Dawley rats (7 weeks old, male) were
purchased from Japan SLC (Hamamatsu, Japan) and maintained with free
access to food and water. Animals were deprived of food for one day before
experiments. Animal studies were performed in accordance with the Guidelines
for the Care and Use of Laboratory Animals, Kanazawa University.
This article has not been copyedited and formatted. The final version may differ from this version.DMD Fast Forward. Published on April 30, 2007 as DOI: 10.1124/dmd.106.013037
at ASPE
T Journals on N
ovember 12, 2021
dmd.aspetjournals.org
Dow
nloaded from
DMD #13037
10
Pharmacokinetic properties of midazolam in monkeys, dogs and rats
Midazolam was dissolved in a mixture of dimethylacetamide and saline
(1:1, v/v) for intravenous bolus injections at a dose of 0.1 mg/mL/kg for rats, and
0.1 mg/0.2 mL/kg for monkeys and dogs. Intravenous bolus injection was
conducted without cannulation into the saphenous vein, cephalic vein and
femoral vein in monkeys, dogs and rats, respectively. Midazolam was suspended
in 0.5% methylcellulose solution for oral administration at a dose of 1 mg/5 mL/kg
for rats, and 1 mg/2 mL/kg for monkeys and dogs. Oral administration to rats was
done by gavage. Blood samples were collected at 5, 10, 15, and 30 min, and 1, 2,
4, 8, and 24 hr after intravenous administration and at 15 and 30 min, and 1, 2, 4,
8, and 24 hr after oral administration in monkeys, dogs and rats.
Transport experiment in Ussing-type chamber
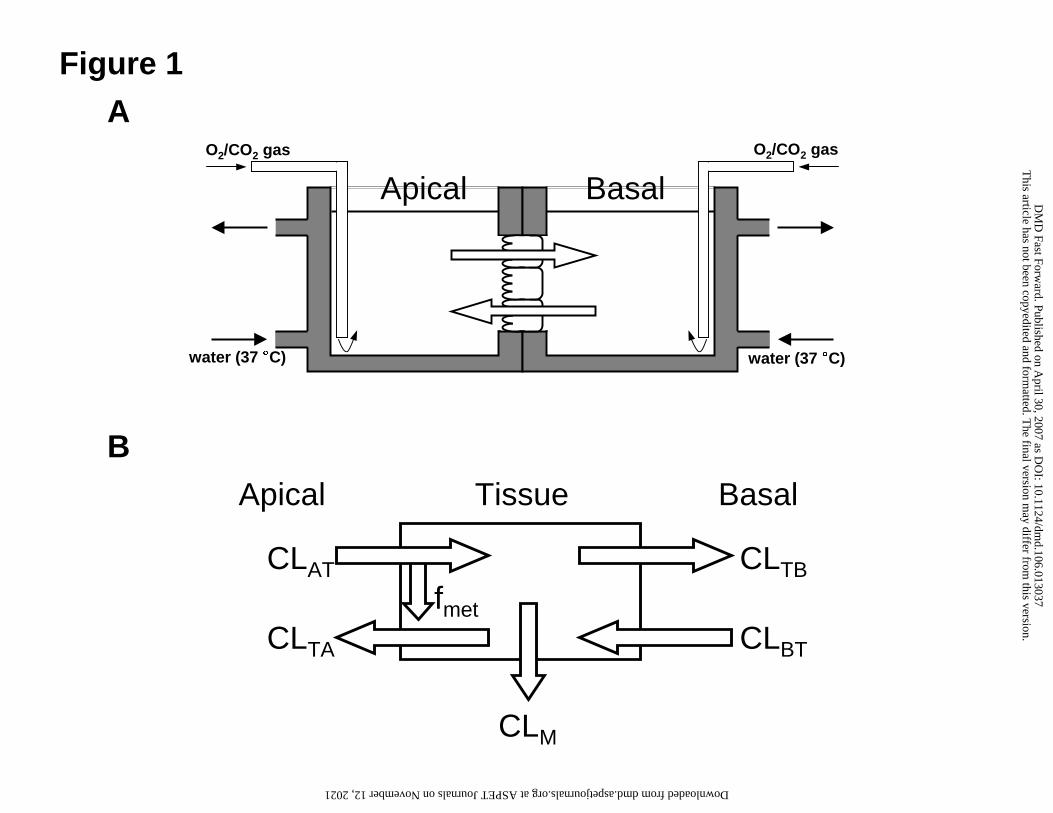
Intestinal absorption mechanism of midazolam was addressed by
Ussing-type chamber method, and the scheme of the apparatus was briefly
described in Fig. 1A. Segments of upper, middle and lower small intestine
isolated from monkeys and rats were used for the Ussing-type chamber study.
The portion approximately 15 and 4 cm from the pylorus was used as the upper
small intestine in monkeys and rats, respectively. Segments of approximately 15
and 5 cm around the middle portion of the small intestine were used as middle
small intestine, and segments of approximately 15 and 5 cm from the ileocecal
This article has not been copyedited and formatted. The final version may differ from this version.DMD Fast Forward. Published on April 30, 2007 as DOI: 10.1124/dmd.106.013037
at ASPE
T Journals on N
ovember 12, 2021
dmd.aspetjournals.org
Dow
nloaded from

DMD #13037
11
junction were used as lower small intestine in monkeys and rats, respectively.
Isolated intestinal tissue sheets from which the muscle layer had been removed
with fine tweezers were mounted vertically in Ussing-type chambers that
provided an exposed area of 0.75 cm2 for monkeys and 0.25 cm2 for rats. The
volume of bathing solution on each side was 1.2 mL, and the solution
temperature was maintained at 37 °C in a water-jacketed reservoir. The test
solution was composed of (mM): 128 NaCl, 5.1 KCl, 1.4 CaCl2, 1.3 MgSO4, 21
NaHCO3, 1.3 KH2PO4, 10 NaH2PO4 and 5 D-glucose (adjusted at pH 6.0 or 7.4
for apical (AP) or basal (BL) side, respectively), and gassed with 95% O2/5% CO2
before and during the transport experiment. The midazolam concentration on the
donor side was set to be 30, 100 or 300 µM for monkeys, and 10, 30, 100 or 300
µM for rats. At the designated times, a 250 µL aliquot of acceptor side buffer was
sampled and replaced with an equal volume of fresh buffer. The experiment was
continued for 120 min, after which time the tissue and buffer on the donor side
was also collected.
Measurement of midazolam and its metabolites by LC-MS/MS analysis
Midazolam, 1’-OH midazolam and 4-OH midazolam in 100 µL aliquots
of plasma were extracted with 10 µL of acetonitrile and 100 µL of internal
standard solution (50 ng/mL triazolam in acetonitrile). The mixtures were
centrifuged at 3,000 rpm to remove precipitated protein, then 100 µL of
supernatant was diluted with 100 µL of 0.01 mol/L ammonium formate (pH 3.0). A
This article has not been copyedited and formatted. The final version may differ from this version.DMD Fast Forward. Published on April 30, 2007 as DOI: 10.1124/dmd.106.013037
at ASPE
T Journals on N
ovember 12, 2021
dmd.aspetjournals.org
Dow
nloaded from
DMD #13037
12
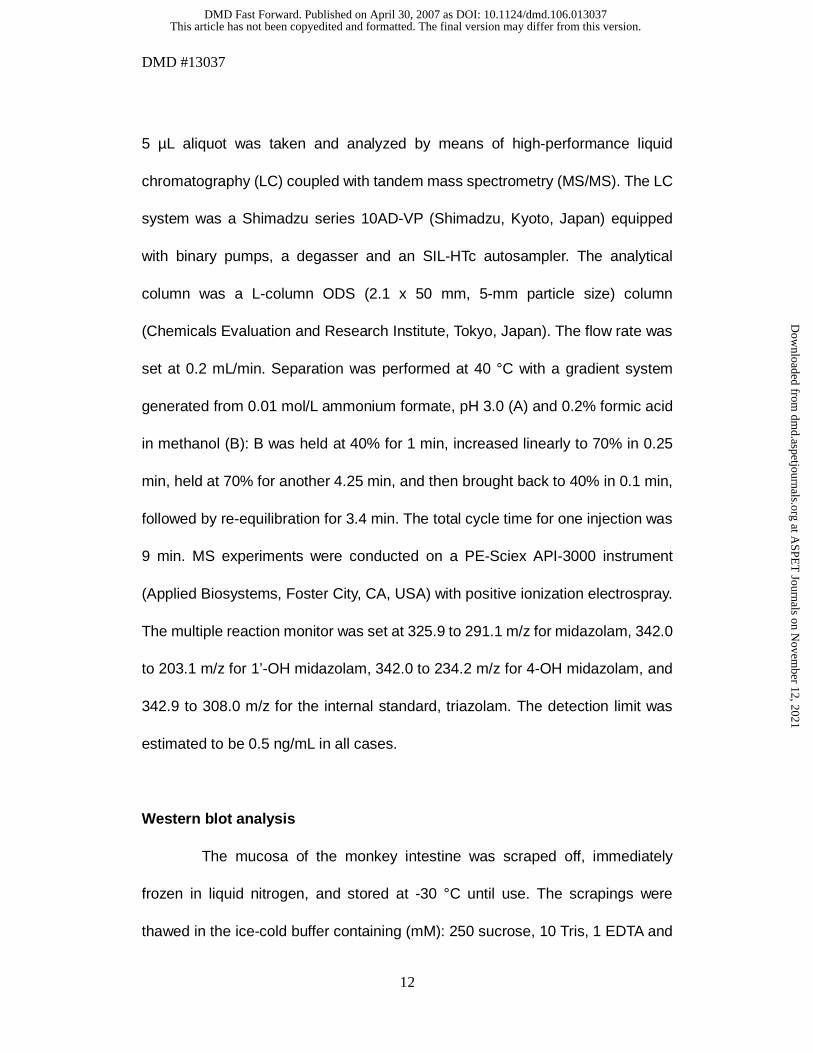
5 µL aliquot was taken and analyzed by means of high-performance liquid
chromatography (LC) coupled with tandem mass spectrometry (MS/MS). The LC
system was a Shimadzu series 10AD-VP (Shimadzu, Kyoto, Japan) equipped
with binary pumps, a degasser and an SIL-HTc autosampler. The analytical
column was a L-column ODS (2.1 x 50 mm, 5-mm particle size) column
(Chemicals Evaluation and Research Institute, Tokyo, Japan). The flow rate was
set at 0.2 mL/min. Separation was performed at 40 °C with a gradient system
generated from 0.01 mol/L ammonium formate, pH 3.0 (A) and 0.2% formic acid
in methanol (B): B was held at 40% for 1 min, increased linearly to 70% in 0.25
min, held at 70% for another 4.25 min, and then brought back to 40% in 0.1 min,
followed by re-equilibration for 3.4 min. The total cycle time for one injection was
9 min. MS experiments were conducted on a PE-Sciex API-3000 instrument
(Applied Biosystems, Foster City, CA, USA) with positive ionization electrospray.
The multiple reaction monitor was set at 325.9 to 291.1 m/z for midazolam, 342.0
to 203.1 m/z for 1’-OH midazolam, 342.0 to 234.2 m/z for 4-OH midazolam, and
342.9 to 308.0 m/z for the internal standard, triazolam. The detection limit was
estimated to be 0.5 ng/mL in all cases.
Western blot analysis
The mucosa of the monkey intestine was scraped off, immediately
frozen in liquid nitrogen, and stored at -30 °C until use. The scrapings were
thawed in the ice-cold buffer containing (mM): 250 sucrose, 10 Tris, 1 EDTA and
This article has not been copyedited and formatted. The final version may differ from this version.DMD Fast Forward. Published on April 30, 2007 as DOI: 10.1124/dmd.106.013037
at ASPE
T Journals on N
ovember 12, 2021
dmd.aspetjournals.org
Dow
nloaded from
DMD #13037
13
Complete Protease Inhibitor Cocktail® (Roche Diagnostics, Indianapolis, IN)
(adjusted to pH 7.4 with 1 N HCl), and homogenized for 30 sec at 25,000 rpm with
an ULTRA-TURRAX® T25 (IKA Werke GmbH & Co. KG, Staufen, Germany).
Scraped rat intestinal mucosa was directly homogenized for 30 sec at 25,000 rpm
with an ULTRA-TURRAX® T8 (IKA Werke GmbH & Co. KG) in the same buffer.
The homogenates were centrifuged at 3,000 g at 4°C for 15 min. The
supernatants were sonicated for 30 sec and centrifuged at 105,000 g, at 4°C for
90 min (CP-56G, RPS50-2, HITACHI, Japan). The pellets were re-suspended
with the same buffer and stored at -30°C until use. Protein concentration was
determined by the Bradford method using a Bio-Rad protein assay kit (Bio-Rad,
Hercules, CA). All samples were diluted to the same protein concentration (4.4
mg protein/mL), and 43.4 mM Tris-HCl, pH 6.8, containing 1% SDS and 5%
ß-mercaptoethanol (final concentrations) was added, followed by urea. Proteins
(20 µg/lane) were separated by SDS-PAGE (10% polyacrylamide gel), and
transferred onto a polyvinylidene difluoride membrane (Millipore Corporation,
Billerica, MA) at 2 mA/cm2 for 120 min. Ponceau S staining confirmed that each
lane was equally efficiently transferred to the membrane (data not shown). For
detection of monkey CYP3A protein, the membrane was incubated in
Tris-buffered saline (20 mM Tris-HCl, pH 7.5 and 137 mM NaCl) containing 5%
skim milk for blocking, and incubated with 0.2% anti-human CYP3A4 antibody
(WB-3A4, BD GENTEST, Woburn, MA) in the above buffer containing 0.5% skim
milk. For detection of rat CYP3A protein, the membrane was incubated in
This article has not been copyedited and formatted. The final version may differ from this version.DMD Fast Forward. Published on April 30, 2007 as DOI: 10.1124/dmd.106.013037
at ASPE
T Journals on N
ovember 12, 2021
dmd.aspetjournals.org
Dow
nloaded from
DMD #13037
14
Tris-buffered saline containing 0.1% Tween 20 and 5% skim milk for blocking,
then incubated with 0.1% anti-rat CYP3A2 antibody (Daiichi Pure Chemicals,
Tokyo, Japan) in the above buffer containing 0.5% skim milk. The membranes
were rinsed with Tris-buffered saline containing 0.1% Tween 20, and reacted with
0.5% horseradish peroxidase-conjugated anti-rabbit IgG (BD GENTEST). Bands
were visualized using an enhanced chemiluminescence detection method with
the ECL Plus Western blotting detection system (GE Healthcare). Quantitative
analysis was done by densitometry using a light-capture apparatus (AE6961FC,
ATTO Bioscience, Tokyo, Japan). Precision Plus Protein Standards (#161-0373,
Bio-Rad, Hercules, CA) covering the range of 10-250 kDa were used.
Data analysis
The area under the curve (AUC) and the mean residence time (MRT)
were calculated by moment analysis of plasma concentration-time profile with the
trapezoidal rule. Pharmacokinetic parameters were calculated in accordance
with their definitions. Cmax and Tmax are the measured maximum plasma
concentration and the time point at which that maximum plasma concentration
was observed, respectively.
Transport and metabolic clearances in the Ussing-type chamber were
estimated by use of the following equations:
In the AP-to-BL direction,
This article has not been copyedited and formatted. The final version may differ from this version.DMD Fast Forward. Published on April 30, 2007 as DOI: 10.1124/dmd.106.013037
at ASPE
T Journals on N
ovember 12, 2021
dmd.aspetjournals.org
Dow
nloaded from
DMD #13037
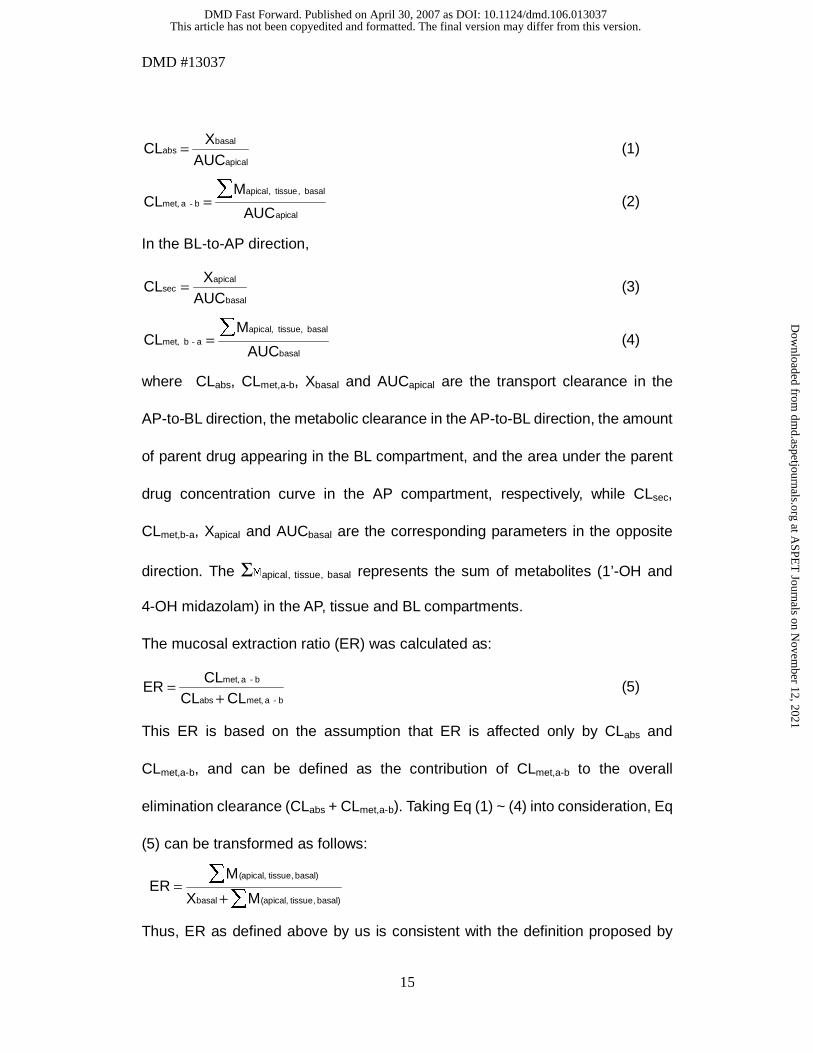
15
CLabs = Xbasal
AUCapical (1)
CLmet, a - b =Mapical, tissue , basal∑
AUCapical (2)
In the BL-to-AP direction,
CLsec = Xapical
AUCbasal (3)
CLmet, b - a =Mapical, tissue, basal∑
AUCbasal (4)
where CLabs, CLmet,a-b, Xbasal and AUCapical are the transport clearance in the
AP-to-BL direction, the metabolic clearance in the AP-to-BL direction, the amount
of parent drug appearing in the BL compartment, and the area under the parent
drug concentration curve in the AP compartment, respectively, while CLsec,
CLmet,b-a, Xapical and AUCbasal are the corresponding parameters in the opposite
direction. The ΣΜapical, tissue, basal represents the sum of metabolites (1’-OH and
4-OH midazolam) in the AP, tissue and BL compartments.
The mucosal extraction ratio (ER) was calculated as:
ER = CLmet, a - b
CLabs + CLmet, a - b (5)
This ER is based on the assumption that ER is affected only by CLabs and
CLmet,a-b, and can be defined as the contribution of CLmet,a-b to the overall
elimination clearance (CLabs + CLmet,a-b). Taking Eq (1) ~ (4) into consideration, Eq
(5) can be transformed as follows:
ER =M(apical, tissue, basal)∑
Xbasal + M(apical, tissue, basal)∑
Thus, ER as defined above by us is consistent with the definition proposed by
This article has not been copyedited and formatted. The final version may differ from this version.DMD Fast Forward. Published on April 30, 2007 as DOI: 10.1124/dmd.106.013037
at ASPE
T Journals on N
ovember 12, 2021
dmd.aspetjournals.org
Dow
nloaded from
DMD #13037
16
Fisher and coworkers (1999b), i.e., the ratio of drug permeation to drug
metabolism.
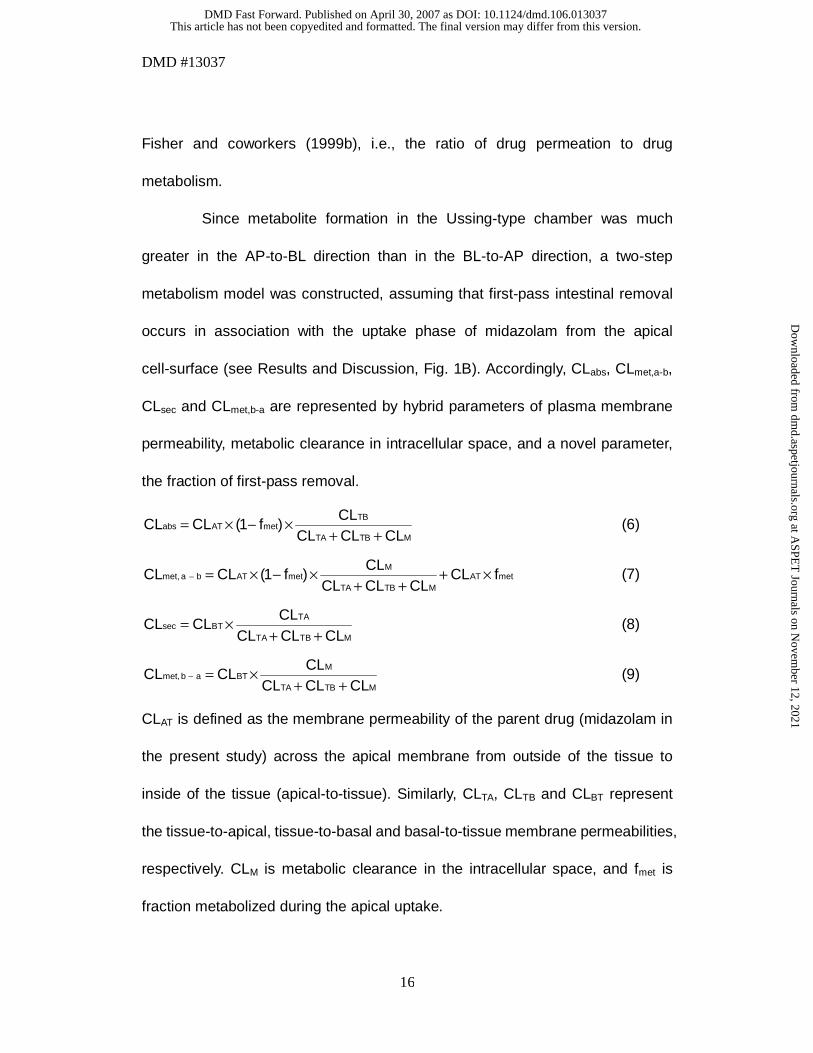
Since metabolite formation in the Ussing-type chamber was much
greater in the AP-to-BL direction than in the BL-to-AP direction, a two-step
metabolism model was constructed, assuming that first-pass intestinal removal
occurs in association with the uptake phase of midazolam from the apical
cell-surface (see Results and Discussion, Fig. 1B). Accordingly, CLabs, CLmet,a-b,
CLsec and CLmet,b-a are represented by hybrid parameters of plasma membrane
permeability, metabolic clearance in intracellular space, and a novel parameter,
the fraction of first-pass removal.
CLabs = CLAT × (1− fmet)× CLTB
CLTA + CLTB + CLM (6)
CLmet, a − b = CLAT × (1− fmet)× CLM
CLTA + CLTB + CLM+ CLAT × fmet (7)
CLsec = CLBT × CLTA
CLTA + CLTB + CLM (8)
CLmet, b − a = CLBT × CLM
CLTA + CLTB + CLM (9)
CLAT is defined as the membrane permeability of the parent drug (midazolam in
the present study) across the apical membrane from outside of the tissue to
inside of the tissue (apical-to-tissue). Similarly, CLTA, CLTB and CLBT represent
the tissue-to-apical, tissue-to-basal and basal-to-tissue membrane permeabilities,
respectively. CLM is metabolic clearance in the intracellular space, and fmet is
fraction metabolized during the apical uptake.
This article has not been copyedited and formatted. The final version may differ from this version.DMD Fast Forward. Published on April 30, 2007 as DOI: 10.1124/dmd.106.013037
at ASPE
T Journals on N
ovember 12, 2021
dmd.aspetjournals.org
Dow
nloaded from
DMD #13037
17
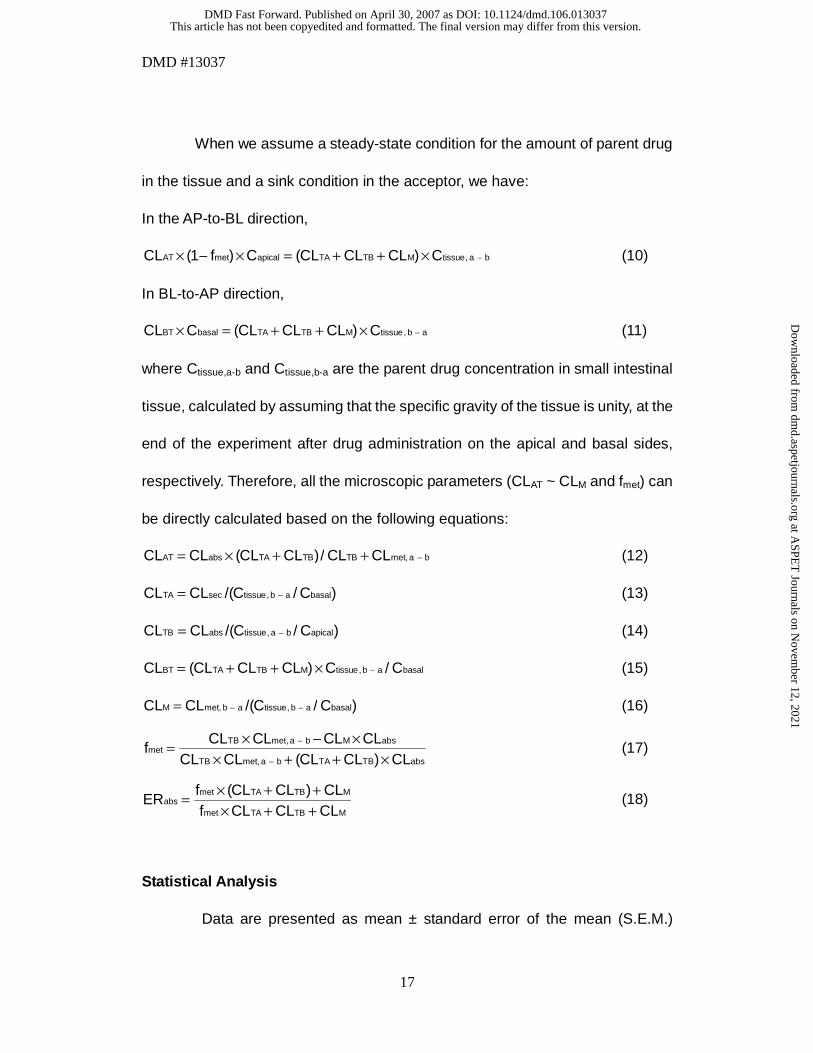
When we assume a steady-state condition for the amount of parent drug
in the tissue and a sink condition in the acceptor, we have:
In the AP-to-BL direction,
CLAT × (1− fmet)× Capical = (CLTA + CLTB + CLM)× Ctissue, a − b (10)
In BL-to-AP direction,
CLBT × Cbasal = (CLTA + CLTB + CLM)× Ctissue, b − a (11)
where Ctissue,a-b and Ctissue,b-a are the parent drug concentration in small intestinal
tissue, calculated by assuming that the specific gravity of the tissue is unity, at the
end of the experiment after drug administration on the apical and basal sides,
respectively. Therefore, all the microscopic parameters (CLAT ~ CLM and fmet) can
be directly calculated based on the following equations:
CLAT = CLabs × (CLTA + CLTB)/ CLTB + CLmet, a − b (12)
CLTA = CLsec /(Ctissue,b − a / Cbasal) (13)
CLTB = CLabs /(Ctissue, a − b / Capical) (14)
CLBT = (CLTA + CLTB + CLM)× Ctissue,b − a / Cbasal (15)
CLM = CLmet, b − a /(Ctissue, b − a / Cbasal) (16)
fmet = CLTB × CLmet,a − b − CLM × CLabs
CLTB × CLmet,a − b + (CLTA + CLTB)× CLabs (17)
ERabs = fmet × (CLTA + CLTB)+ CLM
fmet × CLTA + CLTB + CLM (18)
Statistical Analysis
Data are presented as mean ± standard error of the mean (S.E.M.)
This article has not been copyedited and formatted. The final version may differ from this version.DMD Fast Forward. Published on April 30, 2007 as DOI: 10.1124/dmd.106.013037
at ASPE
T Journals on N
ovember 12, 2021
dmd.aspetjournals.org
Dow
nloaded from
DMD #13037
18
except for Fig. 2 and Table 1. Plasma concentration of midazolam and
pharmacokinetic parameters are presented as mean ± standard deviation (S.D.)
in Fig. 2 and Table 1. Statistical comparisons were performed by ANOVA with
Tukey’s HSD post-hoc comparison test. Values of p < 0.05 were considered to be
significant. Experimental number refers to the number of animals.
This article has not been copyedited and formatted. The final version may differ from this version.DMD Fast Forward. Published on April 30, 2007 as DOI: 10.1124/dmd.106.013037
at ASPE
T Journals on N
ovember 12, 2021
dmd.aspetjournals.org
Dow
nloaded from
DMD #13037
19
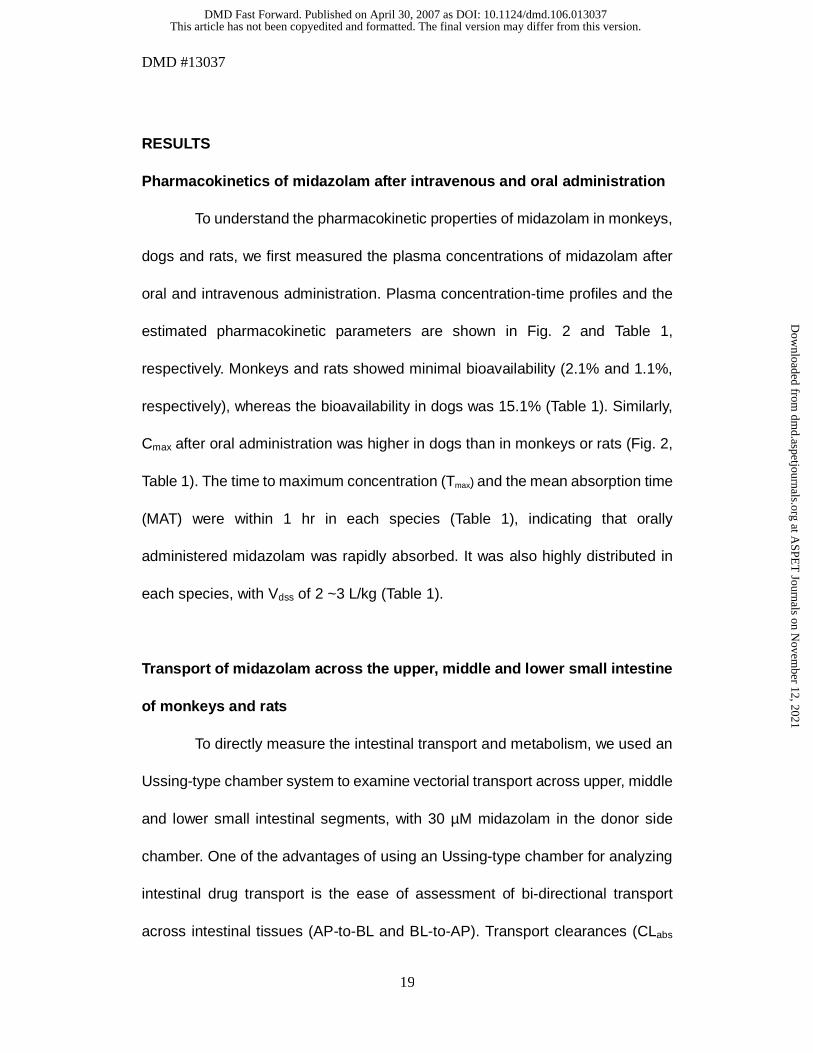
RESULTS
Pharmacokinetics of midazolam after intravenous and oral administration
To understand the pharmacokinetic properties of midazolam in monkeys,
dogs and rats, we first measured the plasma concentrations of midazolam after
oral and intravenous administration. Plasma concentration-time profiles and the
estimated pharmacokinetic parameters are shown in Fig. 2 and Table 1,
respectively. Monkeys and rats showed minimal bioavailability (2.1% and 1.1%,
respectively), whereas the bioavailability in dogs was 15.1% (Table 1). Similarly,
Cmax after oral administration was higher in dogs than in monkeys or rats (Fig. 2,
Table 1). The time to maximum concentration (Tmax) and the mean absorption time
(MAT) were within 1 hr in each species (Table 1), indicating that orally
administered midazolam was rapidly absorbed. It was also highly distributed in
each species, with Vdss of 2 ~3 L/kg (Table 1).
Transport of midazolam across the upper, middle and lower small intestine
of monkeys and rats
To directly measure the intestinal transport and metabolism, we used an
Ussing-type chamber system to examine vectorial transport across upper, middle
and lower small intestinal segments, with 30 µM midazolam in the donor side
chamber. One of the advantages of using an Ussing-type chamber for analyzing
intestinal drug transport is the ease of assessment of bi-directional transport
across intestinal tissues (AP-to-BL and BL-to-AP). Transport clearances (CLabs
This article has not been copyedited and formatted. The final version may differ from this version.DMD Fast Forward. Published on April 30, 2007 as DOI: 10.1124/dmd.106.013037
at ASPE
T Journals on N
ovember 12, 2021
dmd.aspetjournals.org
Dow
nloaded from
DMD #13037
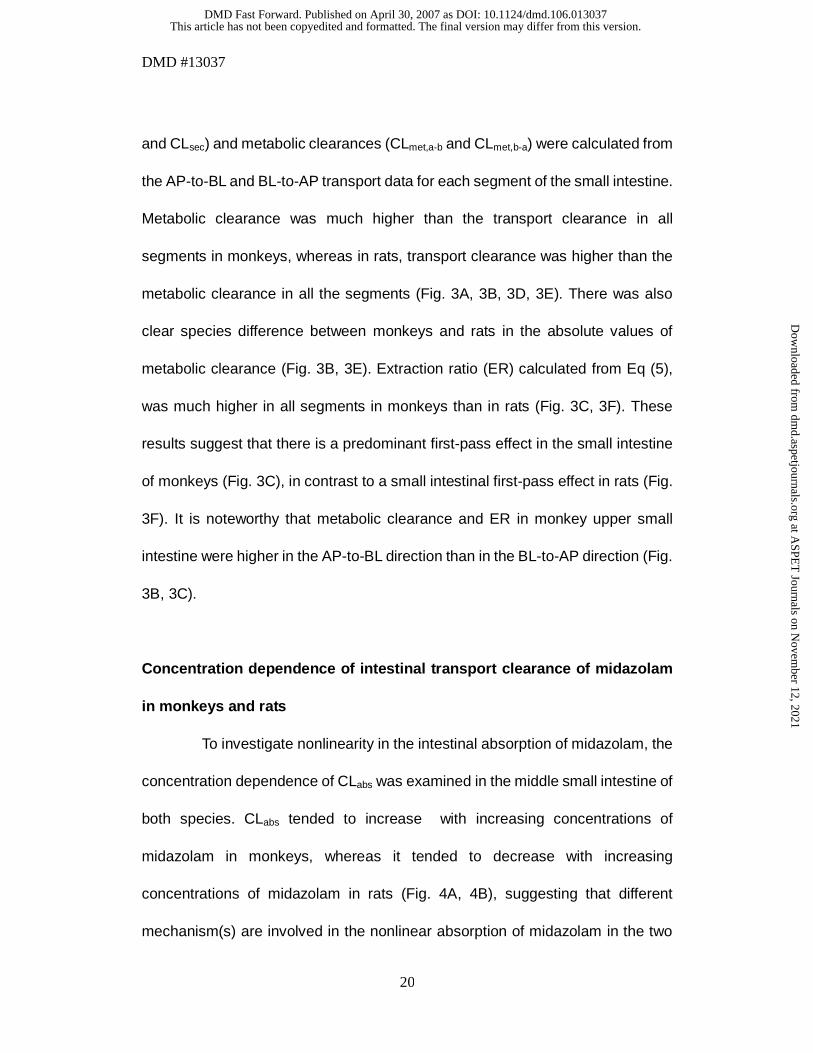
20
and CLsec) and metabolic clearances (CLmet,a-b and CLmet,b-a) were calculated from
the AP-to-BL and BL-to-AP transport data for each segment of the small intestine.
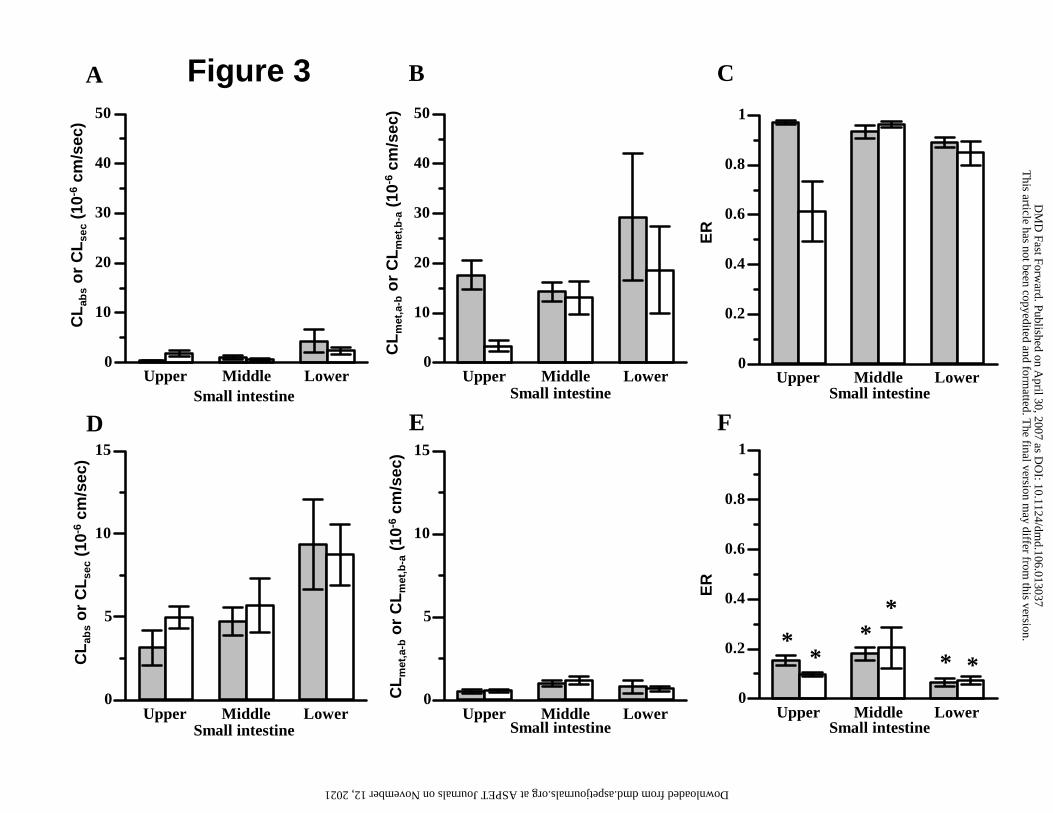
Metabolic clearance was much higher than the transport clearance in all
segments in monkeys, whereas in rats, transport clearance was higher than the
metabolic clearance in all the segments (Fig. 3A, 3B, 3D, 3E). There was also
clear species difference between monkeys and rats in the absolute values of
metabolic clearance (Fig. 3B, 3E). Extraction ratio (ER) calculated from Eq (5),
was much higher in all segments in monkeys than in rats (Fig. 3C, 3F). These
results suggest that there is a predominant first-pass effect in the small intestine
of monkeys (Fig. 3C), in contrast to a small intestinal first-pass effect in rats (Fig.
3F). It is noteworthy that metabolic clearance and ER in monkey upper small
intestine were higher in the AP-to-BL direction than in the BL-to-AP direction (Fig.
3B, 3C).
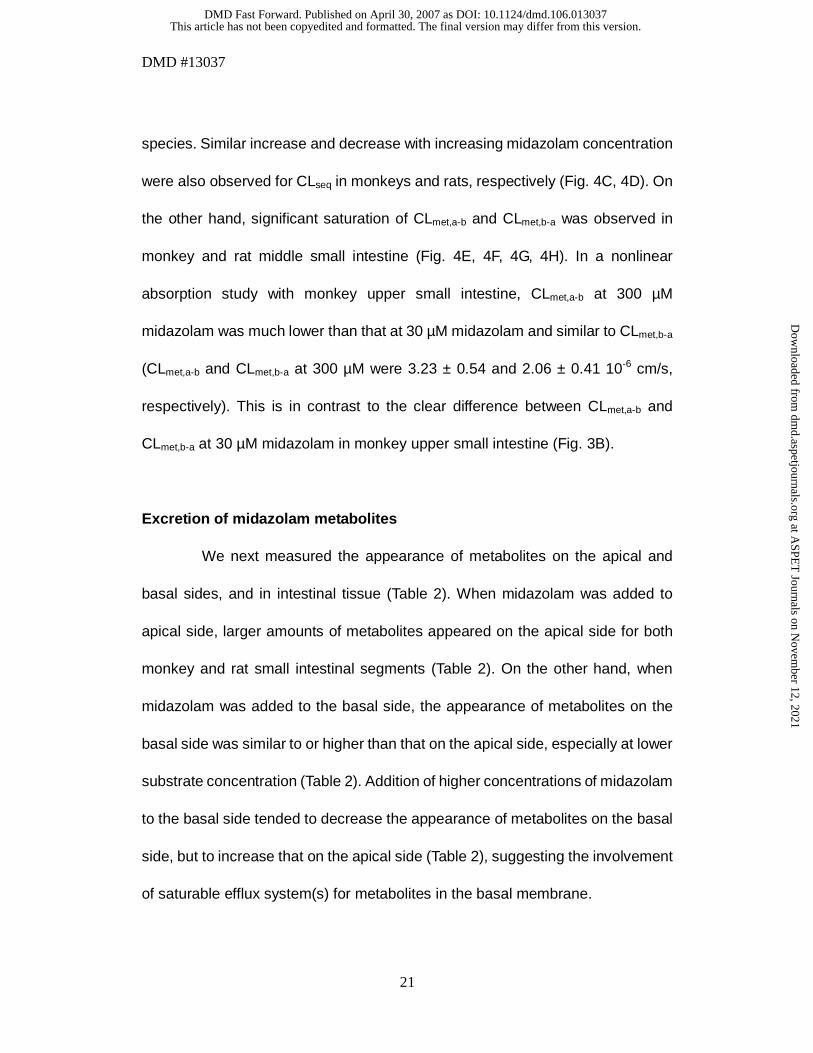
Concentration dependence of intestinal transport clearance of midazolam
in monkeys and rats
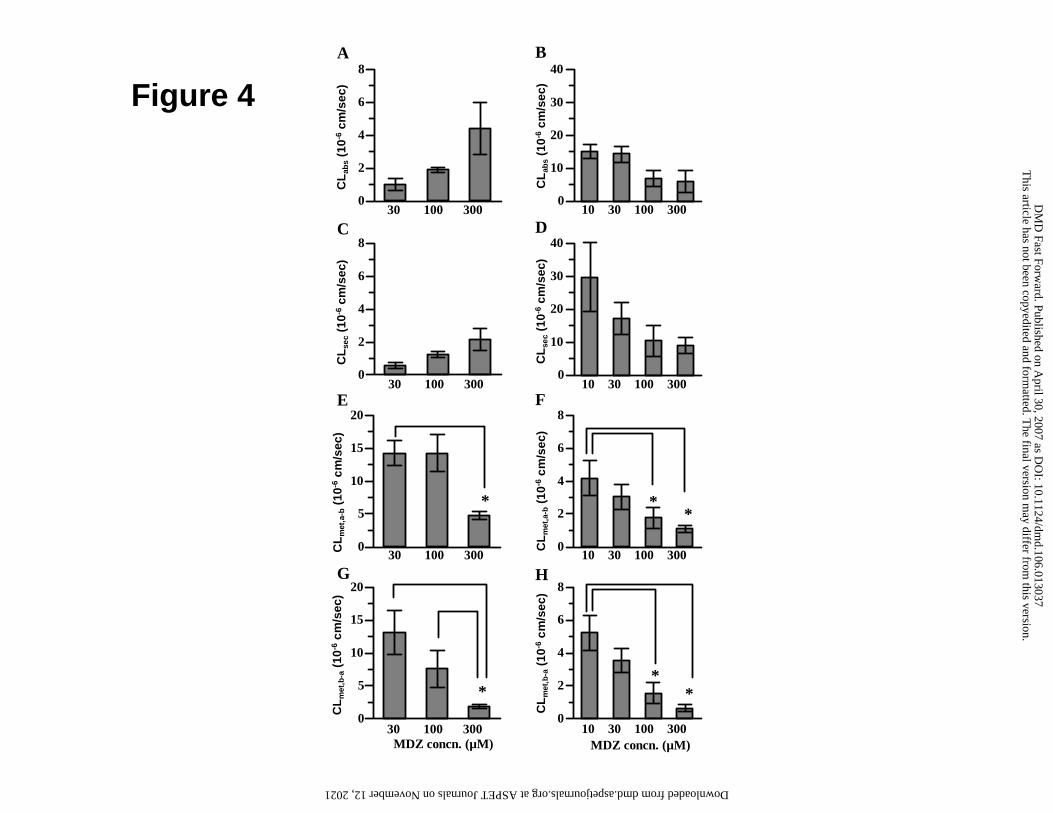
To investigate nonlinearity in the intestinal absorption of midazolam, the
concentration dependence of CLabs was examined in the middle small intestine of
both species. CLabs tended to increase with increasing concentrations of
midazolam in monkeys, whereas it tended to decrease with increasing
concentrations of midazolam in rats (Fig. 4A, 4B), suggesting that different
mechanism(s) are involved in the nonlinear absorption of midazolam in the two
This article has not been copyedited and formatted. The final version may differ from this version.DMD Fast Forward. Published on April 30, 2007 as DOI: 10.1124/dmd.106.013037
at ASPE
T Journals on N
ovember 12, 2021
dmd.aspetjournals.org
Dow
nloaded from
DMD #13037
21
species. Similar increase and decrease with increasing midazolam concentration
were also observed for CLseq in monkeys and rats, respectively (Fig. 4C, 4D). On
the other hand, significant saturation of CLmet,a-b and CLmet,b-a was observed in
monkey and rat middle small intestine (Fig. 4E, 4F, 4G, 4H). In a nonlinear
absorption study with monkey upper small intestine, CLmet,a-b at 300 µM
midazolam was much lower than that at 30 µM midazolam and similar to CLmet,b-a
(CLmet,a-b and CLmet,b-a at 300 µM were 3.23 ± 0.54 and 2.06 ± 0.41 10-6 cm/s,
respectively). This is in contrast to the clear difference between CLmet,a-b and
CLmet,b-a at 30 µM midazolam in monkey upper small intestine (Fig. 3B).
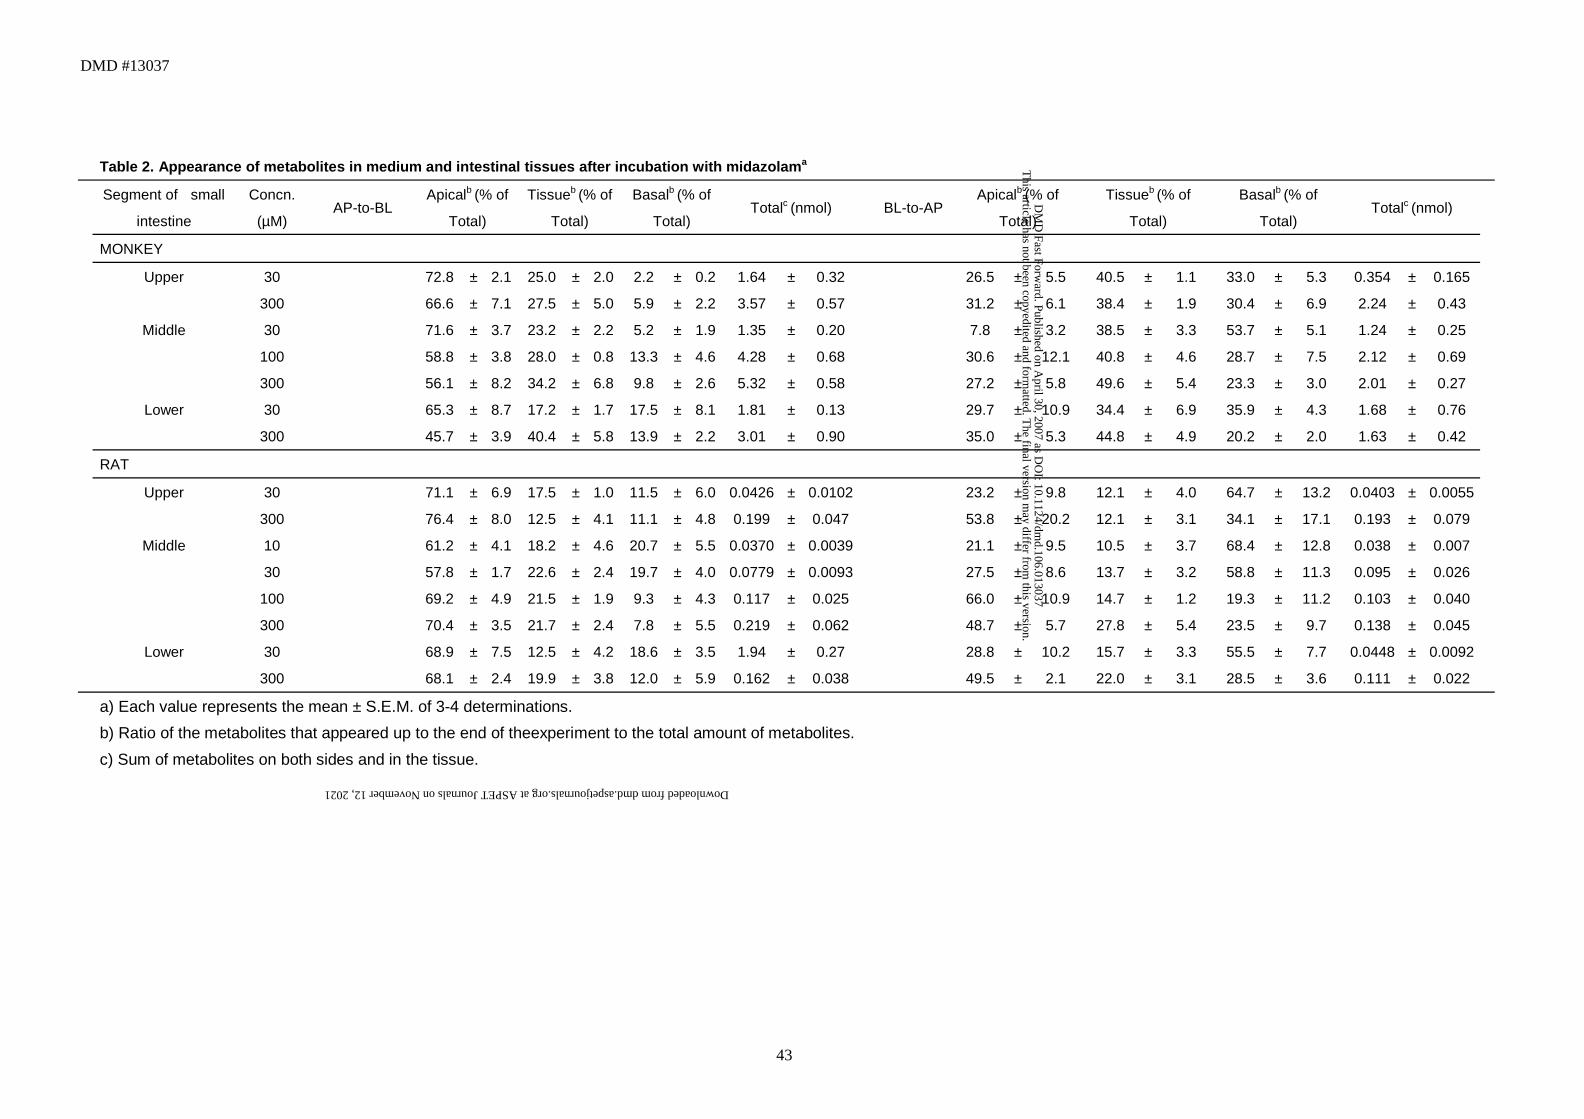
Excretion of midazolam metabolites
We next measured the appearance of metabolites on the apical and
basal sides, and in intestinal tissue (Table 2). When midazolam was added to
apical side, larger amounts of metabolites appeared on the apical side for both
monkey and rat small intestinal segments (Table 2). On the other hand, when
midazolam was added to the basal side, the appearance of metabolites on the
basal side was similar to or higher than that on the apical side, especially at lower
substrate concentration (Table 2). Addition of higher concentrations of midazolam
to the basal side tended to decrease the appearance of metabolites on the basal
side, but to increase that on the apical side (Table 2), suggesting the involvement
of saturable efflux system(s) for metabolites in the basal membrane.
This article has not been copyedited and formatted. The final version may differ from this version.DMD Fast Forward. Published on April 30, 2007 as DOI: 10.1124/dmd.106.013037
at ASPE
T Journals on N
ovember 12, 2021
dmd.aspetjournals.org
Dow
nloaded from
DMD #13037
22
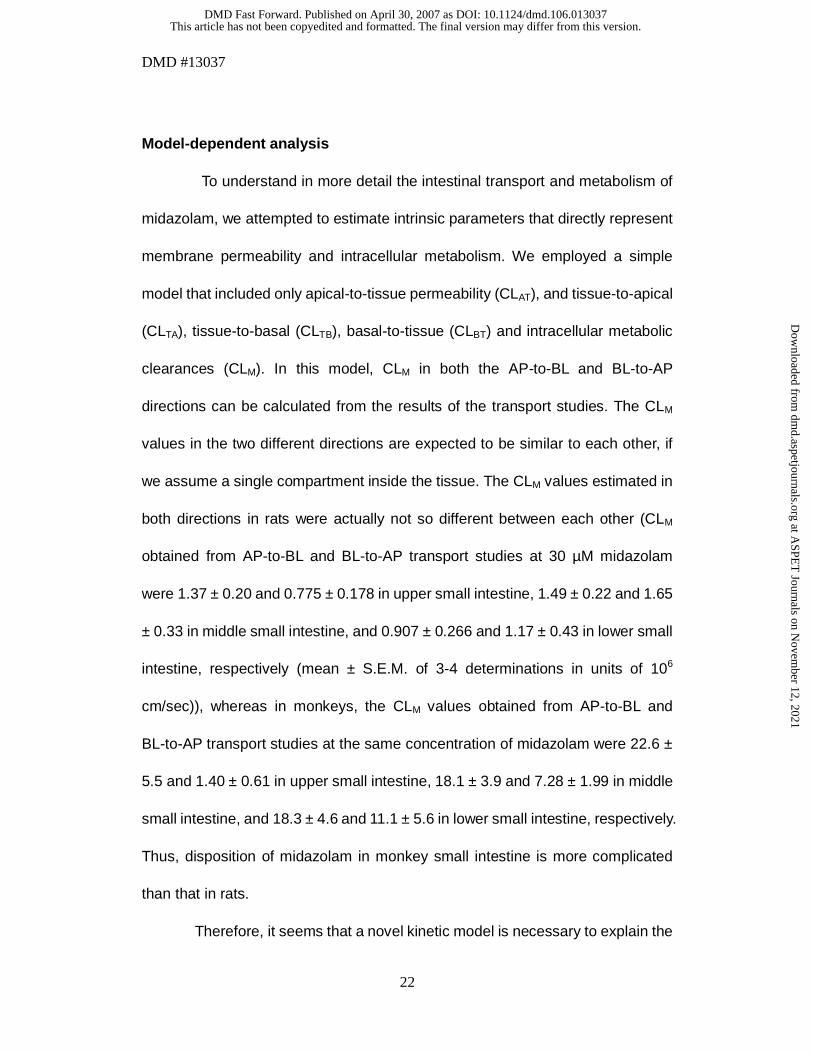
Model-dependent analysis
To understand in more detail the intestinal transport and metabolism of
midazolam, we attempted to estimate intrinsic parameters that directly represent
membrane permeability and intracellular metabolism. We employed a simple
model that included only apical-to-tissue permeability (CLAT), and tissue-to-apical
(CLTA), tissue-to-basal (CLTB), basal-to-tissue (CLBT) and intracellular metabolic
clearances (CLM). In this model, CLM in both the AP-to-BL and BL-to-AP
directions can be calculated from the results of the transport studies. The CLM
values in the two different directions are expected to be similar to each other, if
we assume a single compartment inside the tissue. The CLM values estimated in
both directions in rats were actually not so different between each other (CLM
obtained from AP-to-BL and BL-to-AP transport studies at 30 µM midazolam
were 1.37 ± 0.20 and 0.775 ± 0.178 in upper small intestine, 1.49 ± 0.22 and 1.65
± 0.33 in middle small intestine, and 0.907 ± 0.266 and 1.17 ± 0.43 in lower small
intestine, respectively (mean ± S.E.M. of 3-4 determinations in units of 106
cm/sec)), whereas in monkeys, the CLM values obtained from AP-to-BL and
BL-to-AP transport studies at the same concentration of midazolam were 22.6 ±
5.5 and 1.40 ± 0.61 in upper small intestine, 18.1 ± 3.9 and 7.28 ± 1.99 in middle
small intestine, and 18.3 ± 4.6 and 11.1 ± 5.6 in lower small intestine, respectively.
Thus, disposition of midazolam in monkey small intestine is more complicated
than that in rats.
Therefore, it seems that a novel kinetic model is necessary to explain the
This article has not been copyedited and formatted. The final version may differ from this version.DMD Fast Forward. Published on April 30, 2007 as DOI: 10.1124/dmd.106.013037
at ASPE
T Journals on N
ovember 12, 2021
dmd.aspetjournals.org
Dow
nloaded from
DMD #13037
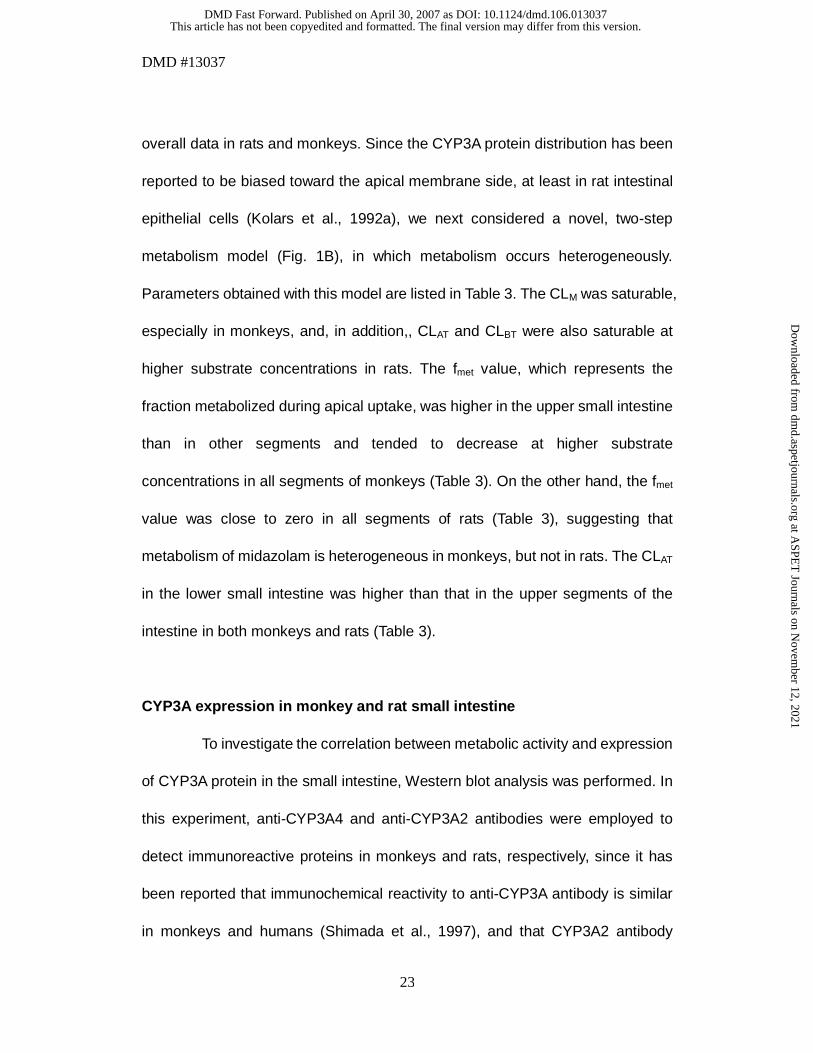
23
overall data in rats and monkeys. Since the CYP3A protein distribution has been
reported to be biased toward the apical membrane side, at least in rat intestinal
epithelial cells (Kolars et al., 1992a), we next considered a novel, two-step
metabolism model (Fig. 1B), in which metabolism occurs heterogeneously.
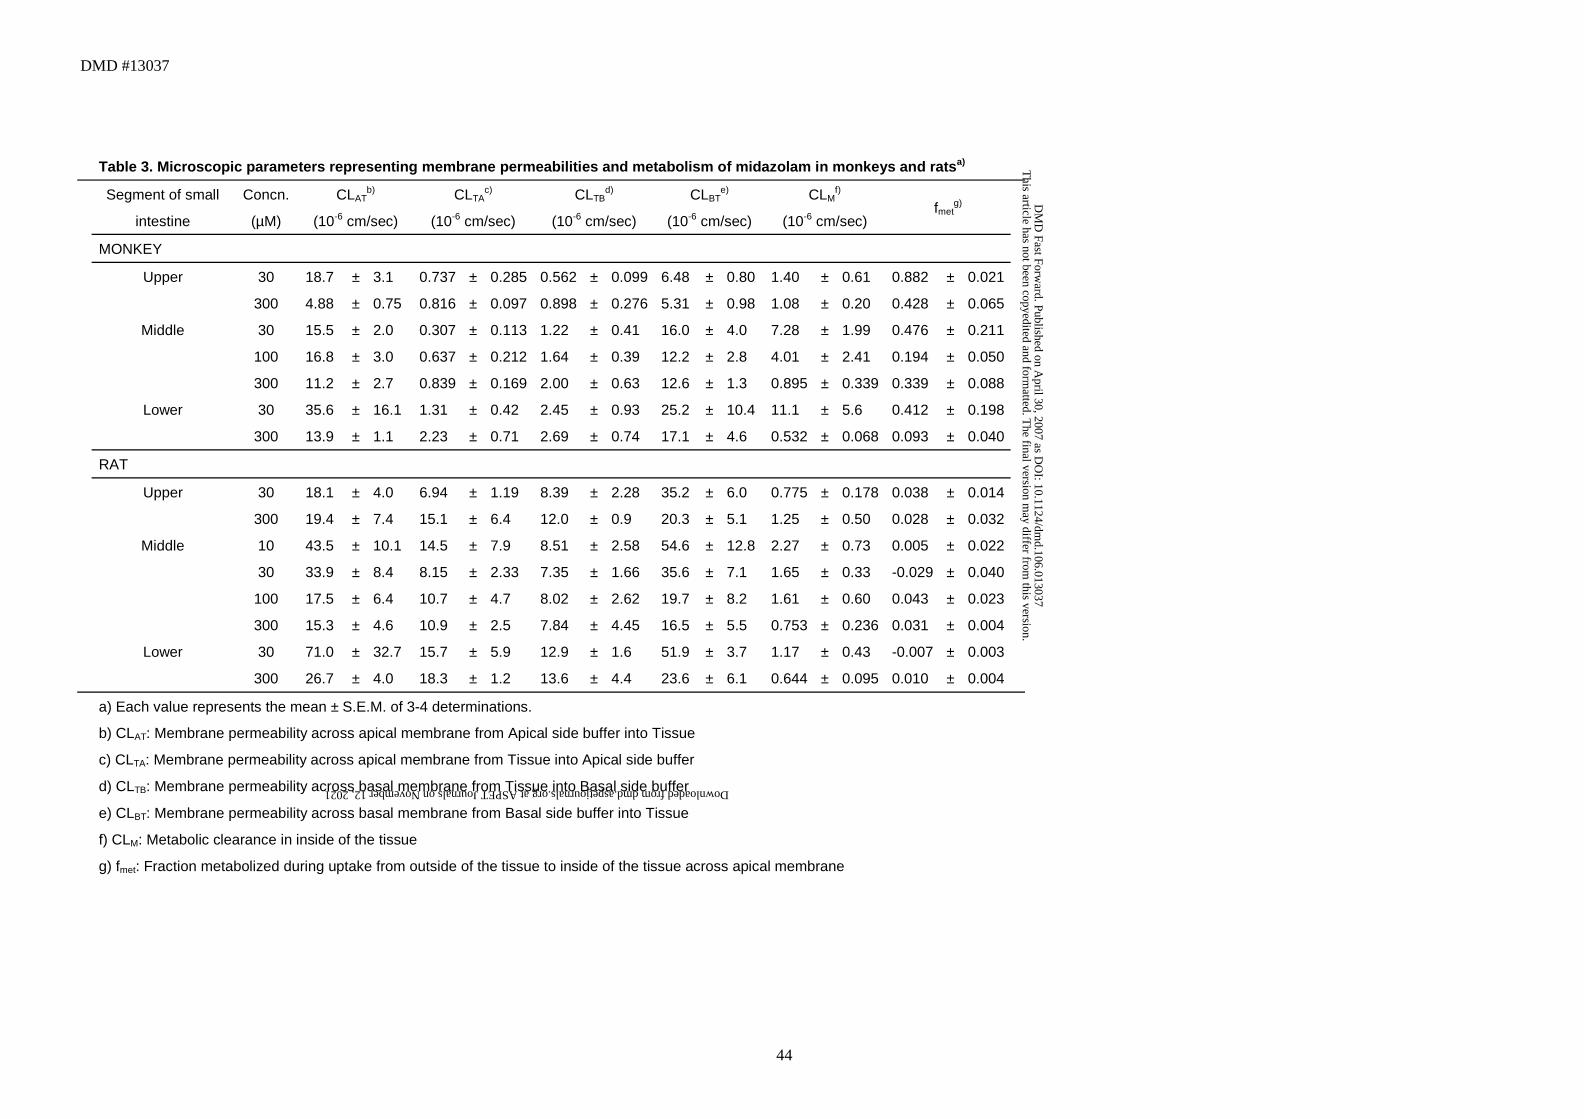
Parameters obtained with this model are listed in Table 3. The CLM was saturable,
especially in monkeys, and, in addition,, CLAT and CLBT were also saturable at
higher substrate concentrations in rats. The fmet value, which represents the
fraction metabolized during apical uptake, was higher in the upper small intestine
than in other segments and tended to decrease at higher substrate
concentrations in all segments of monkeys (Table 3). On the other hand, the fmet
value was close to zero in all segments of rats (Table 3), suggesting that
metabolism of midazolam is heterogeneous in monkeys, but not in rats. The CLAT
in the lower small intestine was higher than that in the upper segments of the
intestine in both monkeys and rats (Table 3).
CYP3A expression in monkey and rat small intestine
To investigate the correlation between metabolic activity and expression
of CYP3A protein in the small intestine, Western blot analysis was performed. In
this experiment, anti-CYP3A4 and anti-CYP3A2 antibodies were employed to
detect immunoreactive proteins in monkeys and rats, respectively, since it has
been reported that immunochemical reactivity to anti-CYP3A antibody is similar
in monkeys and humans (Shimada et al., 1997), and that CYP3A2 antibody
This article has not been copyedited and formatted. The final version may differ from this version.DMD Fast Forward. Published on April 30, 2007 as DOI: 10.1124/dmd.106.013037
at ASPE
T Journals on N
ovember 12, 2021
dmd.aspetjournals.org
Dow
nloaded from
DMD #13037
24
cross-reacts with other protein(s) that probably belong to the CYP3A family in rats
(Aiba et al., 2005). As shown in Fig. 5, CYP3A proteins were detected in all
intestinal segments of both monkeys and rats. Further, CYP3A expression
tended to be higher in the upper small intestine than in other segments in both
monkeys and rats (Fig. 5).
This article has not been copyedited and formatted. The final version may differ from this version.DMD Fast Forward. Published on April 30, 2007 as DOI: 10.1124/dmd.106.013037
at ASPE
T Journals on N
ovember 12, 2021
dmd.aspetjournals.org
Dow
nloaded from

DMD #13037
25
DISCUSSION
Monkeys are sometimes used in preclinical studies because they are
expected to show similar pharmacokinetic characteristics to humans. Indeed,
Ward and Smith (2004) reported that values of total body clearance normalized to
hepatic blood flow in humans were better correlated to those in monkeys than to
those in rats or dogs, while Chiou and Buehler (2002) noted that hepatic
clearance per body weight was higher in monkeys than in humans. However, in
the case of oral administration of drugs, monkeys often show lower bioavailability
than humans (Sietsema, 1989; Chiou and Buehler, 2002; Ward et al., 2005). This
could be explained by insufficient intestinal availability in monkeys. To clarify the
mechanism of this interspecies difference of oral bioavailability, we chose
midazolam as a model drug to analyze intestinal metabolism in monkeys in the
present study, since it is useful as a probe for CYP3A, which is functionally
expressed in the small intestine, and it also shows a marked interspecies
difference in oral bioavailability between human and animals (Sakuda et al.,
2006). We confirmed that the bioavailability of midazolam was at most 2% in both
monkeys and rats (Table 1). However, we observed extensive intestinal
metabolism of midazolam (ER value close to unity) in monkeys, but not in rats
(Fig. 3), suggesting that oral bioavailability is affected by intestinal first-pass
metabolism in monkeys, whereas in rats, bioavailability of midazolam is mainly
determined by hepatic metabolism.
In Ussing chamber experiments, we found that exposure of the apical
This article has not been copyedited and formatted. The final version may differ from this version.DMD Fast Forward. Published on April 30, 2007 as DOI: 10.1124/dmd.106.013037
at ASPE
T Journals on N
ovember 12, 2021
dmd.aspetjournals.org
Dow
nloaded from
DMD #13037
26
surface of intestinal segments to midazolam yielded markedly different values of
the ratio of transport (represented by CLabs) to metabolism (represented by
CLmet,a-b, Fig. 3) in monkeys and rats. The small intestine in monkeys showed
much higher CLmet,a-b than CLabs, whereas CLabs was much larger than CLmet,a-b in
rats, resulting in a species difference of ER between monkeys and rats (Fig. 3).
Thus, most of the midazolam taken up into intestinal tissues is metabolized in
monkeys, whereas little is metabolized in rats. This may support the usefulness
of cynomolgus monkeys, compared with rats, in predicting drug-drug interactions
via CYP3A inhibition and/or induction upon oral administration of midazolam with
other drugs, as proposed by Kanazu et al. (Kanazu et al., 2004).
One of the advantages of the Ussing-type chamber as an experimental
system for analyzing intestinal drug transport is the ease of assessment of
bi-directional transport across intestinal tissues (i.e., in the AP-to-BL and
BL-to-AP directions). The present study has provided the first demonstration,
using an Ussing-type chamber, that the metabolism of midazolam is strongly
dependent on the transport direction in monkey upper small intestine: CLmet-a-b
was much higher than CLmet,b-a at 30 µM midazolam (Fig. 3B), but there was little
difference between CLmet,a-b and CLmet,b-a at 300 µM midazolam (see Results).
Similar “directional metabolism” has been reported in CYP3A4-transfected
Caco-2 cells for midazolam and other compounds (Cummins et al., 2002;
Cummins et al., 2004), and in rat small intestine for verapamil (Johnson et al.,
2003), and was theoretically simulated by Tam et al. (2003). Cummins et al.
This article has not been copyedited and formatted. The final version may differ from this version.DMD Fast Forward. Published on April 30, 2007 as DOI: 10.1124/dmd.106.013037
at ASPE
T Journals on N
ovember 12, 2021
dmd.aspetjournals.org
Dow
nloaded from
DMD #13037
27
(2002) suggested that the difference in ER of K77 (N-methyl
piperazine-Phe-homoPhe-vinylsulfone phenyl), which is a substrate of P-gp and
CYP3A, between the AP-to-�BL and BL-to-AP directions was caused by a
slowing of absorption mediated by P-gp. They also reported that midazolam,
which is not transported by P-gp, exhibited a similar ER difference between the
AP-to-�BL and BL-to-AP directions, and speculated that in this case the ER
difference might be due to a difference in the times required for the intracellular
midazolam concentration to reach a steady state (Cummins et al., 2004).
Although these studies were performed in transfectant cell lines in vitro, we have
shown that such ER differences exist in upper small intestine freshly isolated
from monkeys in the present study (Fig. 3). The mechanism(s) of this ER
difference has not yet been clarified in detail, but it is noteworthy that the
appearance of midazolam metabolites also depended on the direction of
transport, with metabolites being found preferentially on the apical side after
addition of midazolam to the apical side, but not to the basal side (Table 2). This
observation can be explained by asymmetric localization of metabolic activity in
the small intestine. CYP3A is known to show inhomogeneous subcellular
localization in intestinal epithelial cells, and is more abundant in the vicinity of the
apical membrane than the basal membrane, at least in rats (Kolars et al., 1992a).
Consequently, we speculate that intestinal metabolic enzymes tend to rapidly
metabolize drugs absorbed across the apical membrane, compared to those
entering from the basal membrane, thereby providing a barrier against entry of
This article has not been copyedited and formatted. The final version may differ from this version.DMD Fast Forward. Published on April 30, 2007 as DOI: 10.1124/dmd.106.013037
at ASPE
T Journals on N
ovember 12, 2021
dmd.aspetjournals.org
Dow
nloaded from
DMD #13037
28
xenobiotics. However, inhomogeneous subcellular localization of CYP3A in
monkey small intestine has not yet been demonstrated, and it will be necessary
to establish appropriate conditions for detailed immunohistochemical studies to
test this hypothesis. If midazolam taken up across the apical membrane into the
cell is more rapidly metabolized, the time to reach a steady-state concentration
should theoretically be shorter than that when the drug is taken up across the
basal membrane, since the time period required to reach a steady-state depends
on the elimination rate constant inside the cell. By using Caco-2 cells, Fisher and
coworkers have shown that midazolam more rapidly reaches a steady state (~3
min) when added apically than when added basally (>10 min) (Fisher et al., 1999;
Cummins et al., 2002). This finding is consistent with our hypothesis that
midazolam absorbed from intestinal lumen is rapidly metabolized.
Based on the idea that metabolism of midazolam occurs faster when it is
taken up from the apical side, we constructed a novel two-step metabolism model
(Fig. 1B). Although the validity of this model should be confirmed by further
analyses, this model can well describe the directional metabolism, assuming a
single compartment, even though it requires only one additional parameter (fmet)
compared with a single-compartment model, together with membrane
permeability (CLAT – CLBT) and intracellular metabolism (CLM). Based on this
model, ERabs defined by Eq (4) can be described as follows:
ERabs = fmet × (CLTA + CLTB)+ CLM
fmet × CLTA + CLTB + CLM (18)
This article has not been copyedited and formatted. The final version may differ from this version.DMD Fast Forward. Published on April 30, 2007 as DOI: 10.1124/dmd.106.013037
at ASPE
T Journals on N
ovember 12, 2021
dmd.aspetjournals.org
Dow
nloaded from

DMD #13037
29
Therefore, if fmet is negligible, ER is determined only by basolateral efflux (CLTB)
and intracellular metabolism (CLM). On the other hand, if fmet is moderate, apical
back-efflux (CLTA) also affects the ER. Thus, this model can describe the function
of P-gp as a direct contributor to ER. This is consistent with the idea of slow
absorption put forward by Cummins and coworkers (Cummins et al., 2002).
Midazolam is classified into BCS class I, with high membrane permeability (Wu
and Benet, 2005). Nevertheless, saturable transport of midazolam was observed
in apical (CLAT) and basal (CLBT) uptake in rat middle and lower small intestine
(Table 3), and this was compatible with the saturation of CLabs and CLsec in rat
middle small intestine (Fig. 4B, 4D) and lower small intestine (the values of CLabs
and CLsec at 30 µM midazolam in the donor side chamber were 28.0 ± 8.1 and
26.2 ± 5.6, and those at 300 µM midazolam were 10.6 ± 2.8 and 12.7 ± 2.0,
respectively). Apical uptake (CLAT) of midazolam also decreased when a
concentration of 300 µM was given in the upper small intestine of monkeys (Table
3). Nevertheless, CLabs increased as the midazolam concentration was increased
(CLabs at 30 µM midazolam in the donor side chamber was 0.454 ± 0.093 and
CLabs at 300 µM was 0.839 ± 0.172). Regarding the saturation of fmet (Table 3),
the fraction not metabolized (1-fmet) was increased approximately 5-fold at the
higher midazolam concentration. Thus, the apical net influx clearance
(CLAT ×(1-fmet)) was increased at higher midazolam concentration. In addition to
the saturation of CLAT and fmet, intracellular metabolism, represented by CLM, also
appeared to approach saturation as the midazolam concentration was increased
This article has not been copyedited and formatted. The final version may differ from this version.DMD Fast Forward. Published on April 30, 2007 as DOI: 10.1124/dmd.106.013037
at ASPE
T Journals on N
ovember 12, 2021
dmd.aspetjournals.org
Dow
nloaded from
DMD #13037
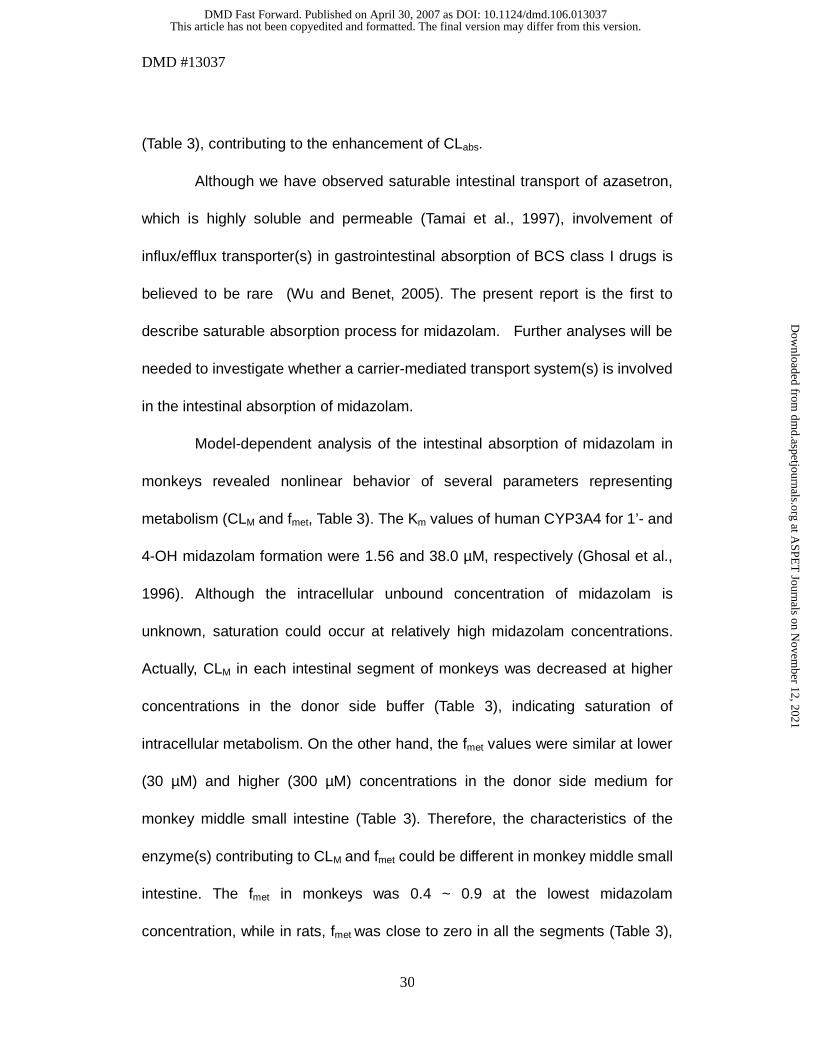
30
(Table 3), contributing to the enhancement of CLabs.
Although we have observed saturable intestinal transport of azasetron,
which is highly soluble and permeable (Tamai et al., 1997), involvement of
influx/efflux transporter(s) in gastrointestinal absorption of BCS class I drugs is
believed to be rare (Wu and Benet, 2005). The present report is the first to
describe saturable absorption process for midazolam. Further analyses will be
needed to investigate whether a carrier-mediated transport system(s) is involved
in the intestinal absorption of midazolam.
Model-dependent analysis of the intestinal absorption of midazolam in
monkeys revealed nonlinear behavior of several parameters representing
metabolism (CLM and fmet, Table 3). The Km values of human CYP3A4 for 1’- and
4-OH midazolam formation were 1.56 and 38.0 µM, respectively (Ghosal et al.,
1996). Although the intracellular unbound concentration of midazolam is
unknown, saturation could occur at relatively high midazolam concentrations.
Actually, CLM in each intestinal segment of monkeys was decreased at higher
concentrations in the donor side buffer (Table 3), indicating saturation of
intracellular metabolism. On the other hand, the fmet values were similar at lower
(30 µM) and higher (300 µM) concentrations in the donor side medium for
monkey middle small intestine (Table 3). Therefore, the characteristics of the
enzyme(s) contributing to CLM and fmet could be different in monkey middle small
intestine. The fmet in monkeys was 0.4 ~ 0.9 at the lowest midazolam
concentration, while in rats, fmet was close to zero in all the segments (Table 3),
This article has not been copyedited and formatted. The final version may differ from this version.DMD Fast Forward. Published on April 30, 2007 as DOI: 10.1124/dmd.106.013037
at ASPE
T Journals on N
ovember 12, 2021
dmd.aspetjournals.org
Dow
nloaded from

DMD #13037
31
indicating that rapid and substantial metabolism of midazolam during apical
uptake in the small intestine occurs in monkeys, but not in rats. On the other hand,
the CLM was not so different between monkeys and rats, especially in the upper
segments of the intestine (Table 3). Thus, the species difference in metabolism of
midazolam arises mainly during the apical uptake phase (fmet). It is not surprising
that the fmet has not been taken into consideration in estimating intestinal drug
absorption, since fmet is monkey-specific (Table 3), and rats, which exhibit minimal
fmet at least for midazolam, are mainly used in preclinical studies. It is generally
considered that molecules responsible for uptake and metabolism (e.g.,
transporters and CYP enzymes) are separately localized in cells (e.g., in
cell-surface membranes and microsomes), so the concept of drug metabolism
during uptake from the apical cell-surface may seem to be unphysiological.
However, the possible existence of monkey-specific molecules has not yet been
excluded. Further, the “directional metabolism” observed in the current study can
be well explained by this model. Therefore, we believe that it is reasonable to
conclude that metabolic events are at least tightly linked with uptake from the
apical cell surface. In other words, we suggest that first-pass intestinal removal is
functionally closely associated with apical uptake in cynomolgus monkeys, even
though it is still unclear whether fmet and CLM are physiologically related to each
other, and whether the molecules responsible for fmet and CLM are different or not.
Further studies are necessary to investigate the molecule(s) responsible for fmet
and CLM.
This article has not been copyedited and formatted. The final version may differ from this version.DMD Fast Forward. Published on April 30, 2007 as DOI: 10.1124/dmd.106.013037
at ASPE
T Journals on N
ovember 12, 2021
dmd.aspetjournals.org
Dow
nloaded from
DMD #13037
32
The CYP3A immunoreactivity was higher in the upper small intestine
than in other segments of both monkeys and rats (Fig. 5). This may be compatible
with the segmental difference in fmet, which was higher in the upper small intestine
than in other segments of both species, although its absolute value was quite
small in rats (Table 3). However, involvement of other metabolic enzyme(s) in
the oxidation of midazolam can not be ruled out. It is important to realize that oral
bioavailability can be affected by many factors, including regional differences in
activities of intestinal metabolic enzymes, and differences in the residence time of
drug molecules in different intestinal segments.
In conclusion, our findings with an Ussing-type chamber system indicate
that the minimal oral bioavailability of midazolam in cynomolgus monkeys is a
consequence of rapid and extensive intestinal metabolism that is associated with
the uptake of midazolam across the apical membrane cell-surface. Since
midazolam is a typical substrate of CYP3A, many other CYP3A substrate drugs
could also be extensively metabolized in monkey intestine and thus show low
bioavailability. On the other hand, saturable transport mechanism(s) are involved
in the uptake of midazolam into intestinal tissues especially in rats. These
findings will be helpful for evaluating the results of preclinical studies and
predicting their relevance to drug absorption in humans.
This article has not been copyedited and formatted. The final version may differ from this version.DMD Fast Forward. Published on April 30, 2007 as DOI: 10.1124/dmd.106.013037
at ASPE
T Journals on N
ovember 12, 2021
dmd.aspetjournals.org
Dow
nloaded from
DMD #13037
33
References
Aiba T, Yoshinaga M, Ishida K, Takehara Y and Hashimoto Y (2005) Intestinal
expression and metabolic activity of the CYP3A subfamily in female rats.
Biol Pharm Bull 28:311-315.
Benet LZ and Cummins CL (2001) The drug efflux-metabolism alliance:
biochemical aspects. Adv Drug Deliv Rev 50 Suppl 1:S3-11.
Benet LZ, Cummins CL and Wu CY (2004) Unmasking the dynamic interplay
between efflux transporters and metabolic enzymes. Int J Pharm 277:3-9.
Chiou WL and Buehler PW (2002) Comparison of oral absorption and
bioavailability of drugs between monkey and human. Pharm Res
19:868-874.
Cummins CL, Jacobsen W and Benet LZ (2002) Unmasking the dynamic
interplay between intestinal P-glycoprotein and CYP3A4. J Pharmacol
Exp Ther 300:1036-1045.
Cummins CL, Jacobsen W, Christians U and Benet LZ (2004)
CYP3A4-transfected Caco-2 cells as a tool for understanding biochemical
absorption barriers: studies with sirolimus and midazolam. J Pharmacol
Exp Ther 308:143-155.
Daniel H (2004) Molecular and integrative physiology of intestinal peptide
transport. Annu Rev Physiol 66:361-384.
Davies B and Morris T (1993) Physiological parameters in laboratory animals and
humans. Pharm Res 10:1093-1095.
This article has not been copyedited and formatted. The final version may differ from this version.DMD Fast Forward. Published on April 30, 2007 as DOI: 10.1124/dmd.106.013037
at ASPE
T Journals on N
ovember 12, 2021
dmd.aspetjournals.org
Dow
nloaded from
DMD #13037
34
Fisher JM, Wrighton SA, Calamia JC, Shen DD, Kunze KL and Thummel KE
(1999) Midazolam metabolism by modified Caco-2 monolayers: effects of
extracellular protein binding. J Pharmacol Exp Ther 289:1143-1150.
Ghosal A, Satoh H, Thomas PE, Bush E and Moore D (1996) Inhibition and
kinetics of cytochrome P4503A activity in microsomes from rat, human,
and cDNA-expressed human cytochrome P450. Drug Metab Dispos
24:940-947.
Hashizume T, Mise M, Matsumoto S, Terauchi Y, Fujii T, Imaoka S, Funae Y,
Kamataki T and Miyazaki H (2001) A novel cytochrome P450 enzyme
responsible for the metabolism of ebastine in monkey small intestine. Drug
Metab Dispos 29:798-805.
Higashikawa F, Murakami T, Kaneda T, Kato A and Takano M (1999)
Dose-dependent intestinal and hepatic first-pass metabolism of
midazolam, a cytochrome P450 3A substrate with differently modulated
enzyme activity in rats. J Pharm Pharmacol 51:67-72.
Johnson BM, Charman WN and Porter CJ (2003) Application of compartmental
modeling to an examination of in vitro intestinal permeability data:
assessing the impact of tissue uptake, P-glycoprotein, and CYP3A. Drug
Metab Dispos 31:1151-1160.
Kanazu T, Yamaguchi Y, Okamura N, Baba T and Koike M (2004) Model for the
drug-drug interaction responsible for CYP3A enzyme inhibition. I:
evaluation of cynomolgus monkeys as surrogates for humans.
This article has not been copyedited and formatted. The final version may differ from this version.DMD Fast Forward. Published on April 30, 2007 as DOI: 10.1124/dmd.106.013037
at ASPE
T Journals on N
ovember 12, 2021
dmd.aspetjournals.org
Dow
nloaded from
DMD #13037
35
Xenobiotica 34:391-402.
Katsura T and Inui K (2003) Intestinal absorption of drugs mediated by drug
transporters: mechanisms and regulation. Drug Metab Pharmacokinet
18:1-15.
Kolars JC, Schmiedlin-Ren P, Dobbins III WO, Schuetz J, Wrighton SA and
Watkins PB (1992a) Heterogeneity of cytochrome P450IIIA expression in
rat gut epithelia. Gastroenterology 102:1186-1198.
Kolars JC, Schmiedlin-Ren P, Schuetz JD, Fang C and Watkins PB (1992b)
Identification of rifampin-inducible P450IIIA4 (CYP3A4) in human small
bowel enterocytes. J Clin Invest 90:1871-1878.
Lau CE, Ma F, Wang Y and Smith C (1996) Pharmacokinetics and bioavailability
of midazolam after intravenous, subcutaneous, intraperitoneal and oral
administration under a chronic food-limited regimen: relating DRL
performance to pharmacokinetics. Psychopharmacology (Berl)
126:241-248.
Li LY, Amidon GL, Kim JS, Heimbach T, Kesisoglou F, Topliss JT and Fleisher D
(2002) Intestinal metabolism promotes regional differences in apical
uptake of indinavir: coupled effect of P-glycoprotein and cytochrome P450
3A on indinavir membrane permeability in rat. J Pharmacol Exp Ther
301:586-593.
Paine MF, Khalighi M, Fisher JM, Shen DD, Kunze KL, Marsh CL, Perkins JD and
Thummel KE (1997) Characterization of interintestinal and intraintestinal
This article has not been copyedited and formatted. The final version may differ from this version.DMD Fast Forward. Published on April 30, 2007 as DOI: 10.1124/dmd.106.013037
at ASPE
T Journals on N
ovember 12, 2021
dmd.aspetjournals.org
Dow
nloaded from
DMD #13037
36
variations in human CYP3A-dependent metabolism. J Pharmacol Exp
Ther 283:1552-1562.
Paine MF, Shen DD, Kunze KL, Perkins JD, Marsh CL, McVicar JP, Barr DM,
Gillies BS and Thummel KE (1996) First-pass metabolism of midazolam
by the human intestine. Clin Pharmacol Ther 60:14-24.
Polli JW, Wring SA, Humphreys JE, Huang L, Morgan JB, Webster LO and
Serabjit-Singh CS (2001) Rational use of in vitro P-glycoprotein assays in
drug discovery. J Pharmacol Exp Ther 299:620-628.
Sai Y and Tsuji A (2004) Transporter-mediated drug delivery: recent progress and
experimental approaches. Drug Discov Today 9:712-720.
Sakuda S, Akabane T and Teramura T (2006) Marked species differences in the
bioavailability of midazolam in cynomolgus monkeys and humans.
Xenobiotica 36:331-340.
Shimada T, Mimura M, Inoue K, Nakamura S, Oda H, Ohmori S and Yamazaki H
(1997) Cytochrome P450-dependent drug oxidation activities in liver
microsomes of various animal species including rats, guinea pigs, dogs,
monkeys, and humans. Arch Toxicol 71:401-408.
Sietsema WK (1989) The absolute oral bioavailability of selected drugs. Int J Clin
Pharmacol Ther Toxicol 27:179-211.
Tam D, Sun HD, Pang KS (2003) Influence of P-glycoprotein, transfer clearances,
and drug binding on intestinal metabolism in Caco-2 cell monolayers or
membrane preparations: A theoretical analysis, Drug Metab Dispos 31:
This article has not been copyedited and formatted. The final version may differ from this version.DMD Fast Forward. Published on April 30, 2007 as DOI: 10.1124/dmd.106.013037
at ASPE
T Journals on N
ovember 12, 2021
dmd.aspetjournals.org
Dow
nloaded from
DMD #13037
37
1214-1226.
Tamai I, Saheki A, Saitoh R, Sai Y, Yamada I and Tsuji A (1997) Nonlinear
intestinal absorption of 5-hydroxytryptamine receptor antagonist caused
by absorptive and secretory transporters. J Pharmacol Exp Ther
283:108-115.
Terao T, Hisanaga E, Sai Y, Tamai I and Tsuji A (1996) Active secretion of drugs
from the small intestinal epithelium in rats by P-glycoprotein functioning as
an absorption barrier. J Pharm Pharmacol 48:1083-1089.
Thummel KE, O'Shea D, Paine MF, Shen DD, Kunze KL, Perkins JD and
Wilkinson GR (1996) Oral first-pass elimination of midazolam involves
both gastrointestinal and hepatic CYP3A-mediated metabolism. Clin
Pharmacol Ther 59:491-502.
Tolle-Sander S, Rautio J, Wring S, Polli JW and Polli JE (2003) Midazolam
exhibits characteristics of a highly permeable P-glycoprotein substrate.
Pharm Res 20:757-764.
Tsuji A and Tamai I (1996) Carrier-mediated intestinal transport of drugs. Pharm
Res 13:963-977.
Ward KW, Nagilla R and Jolivette LJ (2005) Comparative evaluation of oral
systemic exposure of 56 xenobiotics in rat, dog, monkey and human.
Xenobiotica 35:191-210.
Ward KW and Smith BR (2004) A comprehensive quantitative and qualitative
evaluation of extrapolation of intravenous pharmacokinetic parameters
This article has not been copyedited and formatted. The final version may differ from this version.DMD Fast Forward. Published on April 30, 2007 as DOI: 10.1124/dmd.106.013037
at ASPE
T Journals on N
ovember 12, 2021
dmd.aspetjournals.org
Dow
nloaded from
DMD #13037
38
from rat, dog, and monkey to humans. I. Clearance. Drug Metab Dispos
32:603-611.
Watkins PB (1997) The barrier function of CYP3A4 and P-glycoprotein in the
small bowel. Adv Drug Deliv Rev 27:161-170.
Wu CY and Benet LZ (2005) Predicting drug disposition via application of BCS:
transport/absorption/ elimination interplay and development of a
biopharmaceutics drug disposition classification system. Pharm Res
22:11-23.
Zhang QY, Dunbar D, Ostrowska A, Zeisloft S, Yang J and Kaminsky LS (1999)
Characterization of human small intestinal cytochromes P-450. Drug
Metab Dispos 27:804-809.
This article has not been copyedited and formatted. The final version may differ from this version.DMD Fast Forward. Published on April 30, 2007 as DOI: 10.1124/dmd.106.013037
at ASPE
T Journals on N
ovember 12, 2021
dmd.aspetjournals.org
Dow
nloaded from
DMD #13037
39
Legends
Figure 1
Scheme of Ussing-type chamber set up (A). Intestinal tissue sheet is mounted
between the chambers. Buffer is stirred by 95% O2/ 5% CO2 gas. Temperature of
each chamber is maintained by warmed water circulating in the chamber.
Schematic diagram of our novel two-step metabolism model for intestinal
absorption of midazolam (B). CLAT – CLBT mean membrane permeabilities, CLM
means intracellular metabolic clearance and fmet represents the fraction
metabolized during uptake from the apical side.
Figure 2
Plasma concentration of midazolam in cynomolgus monkeys (A), beagle dogs
(B) and Sprague-Dawley rats (C) after intravenous (0.1 mg/kg) (○) and oral (1.0
mg/kg) (●) administration. Midazolam was dissolved in 50% dimethylacetamide
in saline for intravenous administration and suspended in 0.5% methylcellulose
solution for oral administration. Blood samples were collected up to 24 hr after
intravenous and oral administration from all species. The detection limit was
estimated to be 0.5 ng/mL. Each point is the mean ± S.D. of 3 animals. The error
bar is not shown when the S.D. value is smaller than the symbol.
Figure 3
Transport clearance (CLabs and CLsec) (A, D), metabolic clearance (CLmet,a-b and
This article has not been copyedited and formatted. The final version may differ from this version.DMD Fast Forward. Published on April 30, 2007 as DOI: 10.1124/dmd.106.013037
at ASPE
T Journals on N
ovember 12, 2021
dmd.aspetjournals.org
Dow
nloaded from
DMD #13037
40
CLmet,b-a) (B, E) and mucosal extraction ratio (ER) (C, F) of midazolam in
monkeys (A, B, C) and rats (D, E, F) calculated from the Ussing-type chamber
data. Initial concentration of midazolam in the apical or basal compartment was
set at 30 µM. Transport clearances (CLabs and CLsec) were obtained by dividing
the amount of the parent drug by the area under the concentration-time curve
(AUC) of the parent drug in the donor side chamber. Metabolic clearances
(CLmet,a-b and CLmet,b-a) were obtained by dividing the sum of the amount of
metabolites in donor, tissue and acceptor compartments by the AUC of the parent
drug in the donor side chamber. ER was obtained by dividing CLabs by the sum of
CLabs and CLmet,a-b in the AP-to-BL direction, and vice versa. Closed (■) and
open (□) columns represent data for the AP-to-BL and BL-to-AP transport
directions, respectively. Each point is the mean ± S.E.M. of 3 - 4 animals.
Statistical analysis was performed by ANOVA. No significant difference was
observed in transport or metabolic clearances between the AP-to-BL and
BL-to-AP direction and between regions of the small intestine (A, B, D, E)
*Statistically significantly different from monkey.
Figure 4
Nonlinear intestinal transport and metabolism of midazolam in monkeys (A, C, E,
G) and rats (B, D, F, H) evaluated by Ussing-type chamber transport study. CLabs
(A, B), CLsec (C, D), CLmet,a-b (E, F) and CLmet,b-a (G, H) were measured in monkey
and rat middle small intestine. The initial concentration of midazolam in the donor
This article has not been copyedited and formatted. The final version may differ from this version.DMD Fast Forward. Published on April 30, 2007 as DOI: 10.1124/dmd.106.013037
at ASPE
T Journals on N
ovember 12, 2021
dmd.aspetjournals.org
Dow
nloaded from
DMD #13037
41
side chamber was within the range of 30 - 300 µM for monkeys and 10 - 300 µM
for rats. Each point is the mean ± S.E.M. of 3 - 4 animals. Statistical analysis was
performed by ANOVA with Tukey’s HSD test. *, Significant difference (p < 0.05).
Figure 5
Western blot analysis of intestinal CYP3A expression in monkeys (A) and rats (B).
Total membrane proteins (20 µg/lane) prepared from upper, middle and lower
small intestine were subjected to 10% SDS-PAGE. Relative band densities (% of
upper small intestine) of Western blots from the upper panel are shown in the
lower panel. Each column is the mean ± S.E.M. of 3 - 4 animals. Statistical
analysis was performed by ANOVA.
This article has not been copyedited and formatted. The final version may differ from this version.DMD Fast Forward. Published on April 30, 2007 as DOI: 10.1124/dmd.106.013037
at ASPE
T Journals on N
ovember 12, 2021
dmd.aspetjournals.org
Dow
nloaded from

DMD #13037
42
Table 1. Pharmacokinetic parameters for midazolam in rats, dogs, and monkeysa)
MONKEY DOG RAT
Parameters
0.1 mg/kg (iv) 1 mg/kg (oral) 0.1 mg/kg (iv) 1 mg/kg (oral) 0.1 mg/kg (iv) 1 mg/kg (oral)
Cmax (ng/mL) – 1.8 ± 0.8 – 21.3 ± 10.4 – 2.0 ± 0.3
Tmax (hr) – 1.00 ± 0.00 – 0.83 ± 0.29 – 0.42 ± 0.14
AUC0-last (ng·hr/mL) 51.2 ± 14.0 10.1 ± 12.0 29.3 ± 5.3 45.5 ± 23.6 26.4 ± 4.8 3.0 ± 1.2
CLtotal
(mL/hr/kg) 2054 ± 565 – 3486 ± 643 – 3861 ± 639
–
Vdss (mL/kg) 3350 ± 994 – 2124 ± 343 – 2024 ± 98
–
MRT (hr) 1.72 ± 0.64 2.78 ± 2.13 0.63 ± 0.20 1.62 ± 0.12 0.53 ± 0.09 1.01 ± 0.28
F (%) – 2.1 ± 2.4 – 15.1 ± 7.1 – 1.1 ± 0.5
MAT (hr)b) – 1.06 ± 2.22 – 0.99 ± 0.23 – 0.48 ± 0.29
a) Each value represents the mean ± S.D. of 3 determinations.
b) MAT (Mean Absorption Time) was calculated by subtracting MRTi.v. from MRToral.
This article has not been copyedited and form
atted. The final version m
ay differ from this version.
DM
D Fast Forw
ard. Published on April 30, 2007 as D
OI: 10.1124/dm
d.106.013037
at ASPET Journals on November 12, 2021 dmd.aspetjournals.org Downloaded from
DMD #13037
43
Table 2. Appearance of metabolites in medium and intestinal tissues after incubation with midazolama
Segment of small
intestine
Concn.
(µM) AP-to-BL
Apicalb (% of
Total)
Tissueb (% of
Total)
Basalb (% of
Total) Totalc (nmol)
BL-to-AP Apicalb (% of
Total)
Tissueb (% of
Total)
Basalb (% of
Total) Totalc (nmol)
MONKEY
Upper 30 72.8 ± 2.1 25.0 ± 2.0 2.2 ± 0.2 1.64 ± 0.32 26.5 ± 5.5 40.5 ± 1.1 33.0 ± 5.3 0.354 ± 0.165
300 66.6 ± 7.1 27.5 ± 5.0 5.9 ± 2.2 3.57 ± 0.57 31.2 ± 6.1 38.4 ± 1.9 30.4 ± 6.9 2.24 ± 0.43
Middle 30 71.6 ± 3.7 23.2 ± 2.2 5.2 ± 1.9 1.35 ± 0.20 7.8 ± 3.2 38.5 ± 3.3 53.7 ± 5.1 1.24 ± 0.25
100 58.8 ± 3.8 28.0 ± 0.8 13.3 ± 4.6 4.28 ± 0.68 30.6 ± 12.1 40.8 ± 4.6 28.7 ± 7.5 2.12 ± 0.69
300 56.1 ± 8.2 34.2 ± 6.8 9.8 ± 2.6 5.32 ± 0.58 27.2 ± 5.8 49.6 ± 5.4 23.3 ± 3.0 2.01 ± 0.27
Lower 30 65.3 ± 8.7 17.2 ± 1.7 17.5 ± 8.1 1.81 ± 0.13 29.7 ± 10.9 34.4 ± 6.9 35.9 ± 4.3 1.68 ± 0.76
300 45.7 ± 3.9 40.4 ± 5.8 13.9 ± 2.2 3.01 ± 0.90 35.0 ± 5.3 44.8 ± 4.9 20.2 ± 2.0 1.63 ± 0.42
RAT
Upper 30 71.1 ± 6.9 17.5 ± 1.0 11.5 ± 6.0 0.0426 ± 0.0102 23.2 ± 9.8 12.1 ± 4.0 64.7 ± 13.2 0.0403 ± 0.0055
300 76.4 ± 8.0 12.5 ± 4.1 11.1 ± 4.8 0.199 ± 0.047 53.8 ± 20.2 12.1 ± 3.1 34.1 ± 17.1 0.193 ± 0.079
Middle 10 61.2 ± 4.1 18.2 ± 4.6 20.7 ± 5.5 0.0370 ± 0.0039 21.1 ± 9.5 10.5 ± 3.7 68.4 ± 12.8 0.038 ± 0.007
30 57.8 ± 1.7 22.6 ± 2.4 19.7 ± 4.0 0.0779 ± 0.0093 27.5 ± 8.6 13.7 ± 3.2 58.8 ± 11.3 0.095 ± 0.026
100 69.2 ± 4.9 21.5 ± 1.9 9.3 ± 4.3 0.117 ± 0.025 66.0 ± 10.9 14.7 ± 1.2 19.3 ± 11.2 0.103 ± 0.040
300 70.4 ± 3.5 21.7 ± 2.4 7.8 ± 5.5 0.219 ± 0.062 48.7 ± 5.7 27.8 ± 5.4 23.5 ± 9.7 0.138 ± 0.045
Lower 30 68.9 ± 7.5 12.5 ± 4.2 18.6 ± 3.5 1.94 ± 0.27 28.8 ± 10.2 15.7 ± 3.3 55.5 ± 7.7 0.0448 ± 0.0092
300 68.1 ± 2.4 19.9 ± 3.8 12.0 ± 5.9 0.162 ± 0.038 49.5 ± 2.1 22.0 ± 3.1 28.5 ± 3.6 0.111 ± 0.022
a) Each value represents the mean ± S.E.M. of 3-4 determinations.
b) Ratio of the metabolites that appeared up to the end of theexperiment to the total amount of metabolites.
c) Sum of metabolites on both sides and in the tissue.
This article has not been copyedited and form
atted. The final version m
ay differ from this version.
DM
D Fast Forw
ard. Published on April 30, 2007 as D
OI: 10.1124/dm
d.106.013037
at ASPET Journals on November 12, 2021 dmd.aspetjournals.org Downloaded from
DMD #13037
44
Table 3. Microscopic parameters representing membrane permeabilities and metabolism of midazolam in monkeys and ratsa)
Segment of small
intestine
Concn.
(µM)
CLATb)
(10-6 cm/sec)
CLTAc)
(10-6 cm/sec)
CLTBd)
(10-6 cm/sec)
CLBTe)
(10-6 cm/sec)
CLMf)
(10-6 cm/sec) fmet
g)
MONKEY
Upper 30 18.7 ± 3.1 0.737 ± 0.285 0.562 ± 0.099 6.48 ± 0.80 1.40 ± 0.61 0.882 ± 0.021
300 4.88 ± 0.75 0.816 ± 0.097 0.898 ± 0.276 5.31 ± 0.98 1.08 ± 0.20 0.428 ± 0.065
Middle 30 15.5 ± 2.0 0.307 ± 0.113 1.22 ± 0.41 16.0 ± 4.0 7.28 ± 1.99 0.476 ± 0.211
100 16.8 ± 3.0 0.637 ± 0.212 1.64 ± 0.39 12.2 ± 2.8 4.01 ± 2.41 0.194 ± 0.050
300 11.2 ± 2.7 0.839 ± 0.169 2.00 ± 0.63 12.6 ± 1.3 0.895 ± 0.339 0.339 ± 0.088
Lower 30 35.6 ± 16.1 1.31 ± 0.42 2.45 ± 0.93 25.2 ± 10.4 11.1 ± 5.6 0.412 ± 0.198
300 13.9 ± 1.1 2.23 ± 0.71 2.69 ± 0.74 17.1 ± 4.6 0.532 ± 0.068 0.093 ± 0.040
RAT
Upper 30 18.1 ± 4.0 6.94 ± 1.19 8.39 ± 2.28 35.2 ± 6.0 0.775 ± 0.178 0.038 ± 0.014
300 19.4 ± 7.4 15.1 ± 6.4 12.0 ± 0.9 20.3 ± 5.1 1.25 ± 0.50 0.028 ± 0.032
Middle 10 43.5 ± 10.1 14.5 ± 7.9 8.51 ± 2.58 54.6 ± 12.8 2.27 ± 0.73 0.005 ± 0.022
30 33.9 ± 8.4 8.15 ± 2.33 7.35 ± 1.66 35.6 ± 7.1 1.65 ± 0.33 -0.029 ± 0.040
100 17.5 ± 6.4 10.7 ± 4.7 8.02 ± 2.62 19.7 ± 8.2 1.61 ± 0.60 0.043 ± 0.023
300 15.3 ± 4.6 10.9 ± 2.5 7.84 ± 4.45 16.5 ± 5.5 0.753 ± 0.236 0.031 ± 0.004
Lower 30 71.0 ± 32.7 15.7 ± 5.9 12.9 ± 1.6 51.9 ± 3.7 1.17 ± 0.43 -0.007 ± 0.003
300 26.7 ± 4.0 18.3 ± 1.2 13.6 ± 4.4 23.6 ± 6.1 0.644 ± 0.095 0.010 ± 0.004
a) Each value represents the mean ± S.E.M. of 3-4 determinations.
b) CLAT: Membrane permeability across apical membrane from Apical side buffer into Tissue
c) CLTA: Membrane permeability across apical membrane from Tissue into Apical side buffer
d) CLTB: Membrane permeability across basal membrane from Tissue into Basal side buffer
e) CLBT: Membrane permeability across basal membrane from Basal side buffer into Tissue
f) CLM: Metabolic clearance in inside of the tissue
g) fmet: Fraction metabolized during uptake from outside of the tissue to inside of the tissue across apical membrane
This article has not been copyedited and form
atted. The final version m
ay differ from this version.
DM
D Fast Forw
ard. Published on April 30, 2007 as D
OI: 10.1124/dm
d.106.013037
at ASPET Journals on November 12, 2021 dmd.aspetjournals.org Downloaded from
Apical BasalO2/CO2 gas O2/CO2 gas
water (37 °C) water (37 °C)
Figure 1
A
B
CLAT
CLTA
CLTB
CLBT
CLM
fmet
Apical Tissue Basal
This article has not been copyedited and form
atted. The final version m
ay differ from this version.
DM
D Fast Forw
ard. Published on April 30, 2007 as D
OI: 10.1124/dm
d.106.013037 at ASPET Journals on November 12, 2021 dmd.aspetjournals.org Downloaded from
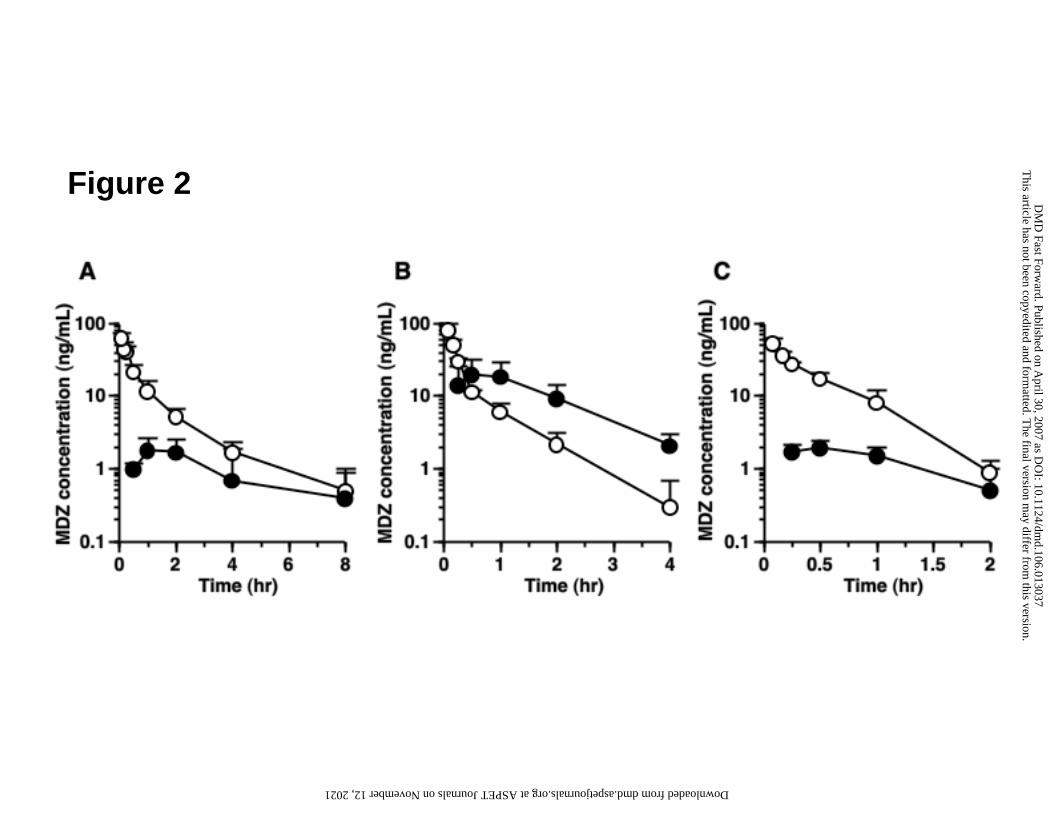
Figure 2
This article has not been copyedited and form
atted. The final version m
ay differ from this version.
DM
D Fast Forw
ard. Published on April 30, 2007 as D
OI: 10.1124/dm
d.106.013037 at ASPET Journals on November 12, 2021 dmd.aspetjournals.org Downloaded from
Upper Middle Lower0
5
10
15
Upper Middle Lower0
10
20
30
40
50
Upper Middle Lower0
5
10
15
Upper Middle Lower0
0.2
0.4
0.6
0.8
1
Upper Middle Lower0
0.2
0.4
0.6
0.8
1
Upper Middle Lower0
10
20
30
40
50
A B C
D E F
**
**
* *
Small intestine Small intestine Small intestine
Small intestine Small intestine Small intestine
CL
abs
or
CL
sec
(10-6
cm/s
ec)
CL
met
,a-b
or
CL
met
,b-a
(10-6
cm/s
ec)
ER
ER
Figure 3C
Lab
so
r C
Lse
c(1
0-6cm
/sec
)
CL
met
,a-b
or
CL
met
,b-a
(10-6
cm/s
ec)
This article has not been copyedited and form
atted. The final version m
ay differ from this version.
DM
D Fast Forw
ard. Published on April 30, 2007 as D
OI: 10.1124/dm
d.106.013037 at ASPET Journals on November 12, 2021 dmd.aspetjournals.org Downloaded from
0
2
4
6
8
0
10
20
30
40
0
10
20
30
40
0
2
4
6
8
30 100 300
0
5
10
15
20
0
2
4
6
8
0
5
10
15
20
0
2
4
6
8
*
*
**
**
A B
C D
E F
G H
30 100 300
30 100 300
30 100 300 10 30 100 300
10 30 100 300
10 30 100 300
10 30 100 300
MDZ concn. (µM) MDZ concn. (µM)
CL
abs
(10-6
cm/s
ec)
CL
sec
(10-6
cm/s
ec)
CL
met
,a-b
(10-6
cm/s
ec)
CL
met
,b-a
(10-6
cm/s
ec)
Figure 4
CL
abs
(10-6
cm/s
ec)
CL
sec
(10-6
cm/s
ec)
CL
met
,a-b
(10-6
cm/s
ec)
CL
met
,b-a
(10-6
cm/s
ec)
This article has not been copyedited and form
atted. The final version m
ay differ from this version.
DM
D Fast Forw
ard. Published on April 30, 2007 as D
OI: 10.1124/dm
d.106.013037 at ASPET Journals on November 12, 2021 dmd.aspetjournals.org Downloaded from
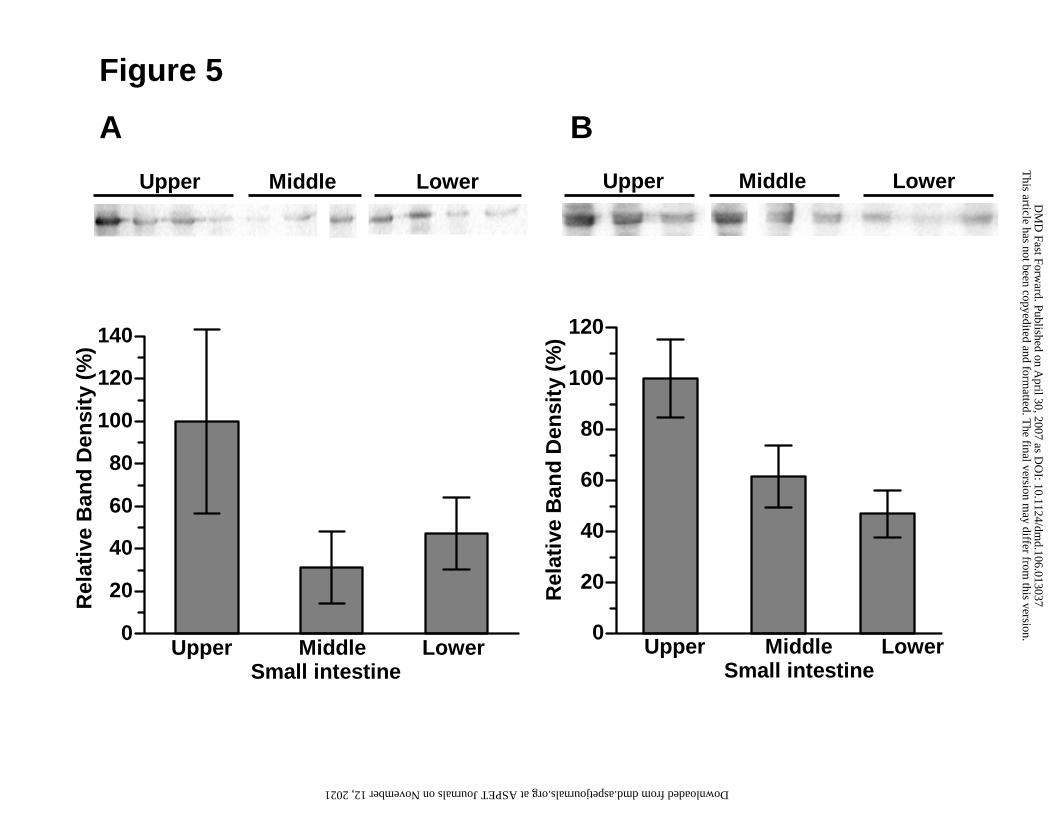
Rel
ativ
e B
and
Den
sity
(%
)
Rel
ativ
e B
and
Den
sity
(%
)
A B
Upper Middle Lower
Figure 5
Small intestineUpper Middle Lower
Small intestine
Upper Middle Lower Upper Middle Lower
0
20
40
60
80
100
120
0
20
40
60
80
100
120
140
This article has not been copyedited and form
atted. The final version m
ay differ from this version.
DM
D Fast Forw
ard. Published on April 30, 2007 as D
OI: 10.1124/dm
d.106.013037 at ASPET Journals on November 12, 2021 dmd.aspetjournals.org Downloaded from


![İNTESTİNAL OBSTRÜKSİYONLAR.ppt [Uyumluluk Modu]€¦ · Barsak ObstrüksiyonuTanımlama İntestinal obstrüksiyon, intestinal içeriğin gastrointestinal sistem içinde distale](https://img.pdfslide.net/doc/110x75/5f603f10302e4166bd691bd7/ntestnal-obstroeks-uyumluluk-modu-barsak-obstrksiyonutanmlama-ntestinal.jpg)