Embed Size (px)
Citation preview
ASYMMETRIC RESPONSES IN SYMMETRICAL
STRUCUTRES
___________________________________________________________________________
A Thesis presented to
the Faculty of the Graduate School
at the University of Missouri-Columbia
___________________________________________________________________________
In Partial Fulfillment
of the Requirements for the Degree
Master of Science
____________________________________________________________________________
by
ADITHYA RAMAMURTHY
Dr. Zaichun Frank Feng, Thesis Supervisor
DECEMBER 2014

© Copyright by Adithya Ramamurthy 2014
All Rights Reserved
The undersigned, appointed by the dean of the Graduate School, have examined the thesis
entitled
ASYMMETRIC RESPONSES IN SYMMETRICAL STRUCUTRES
presented by Adithya Ramamurthy,
a candidate for the degree of Master of Science and hereby certify that, in their opinion, its
worthy of acceptance
Dr. Zaichun Frank Feng
Dr. Stepehen Montgomery Smith
Dr. Sanjeev Khanna

ii
ACKNOWLEDGEMENTS
This page is where I would like to acknowledge all those who helped me with my academic
research. I would like to dedicate my entire work to my family and my academic advisor. A
special note of gratitude to my parents Mr. K. Ramamurthy and Ms. Shantha Ramamurthy, my
brother Mr. Preetham Ramamurthy, sister-in law Ms. Kanchana Preetham and friend Ms.
Shreya Ghoshdastidar. Without their constant love and support, nothing much would have
been possible.
I would like to thank my adviser Dr. Zaichun Frank Feng for his unbelievable support throughout
my entire research work. My research included a lot of complicated calculations, so his timely
assessments and valuable inputs were instrumental in my work being presented as a thesis. His
patience and friendly attitude made my work a lot easier and I guess these qualities makes him
adorable in the entire department. I would also like to thank the members of my thesis
committee Dr. Sanjeev Khanna and Dr. Stephen Montgomery Smith for their support and
valuable inputs to further improve my research work. My research circles around Dr. Frank Pai’s
impressive Finite Element Analysis course and without his class and the valuable resource he
provides, I would have not achieved so much in my Research work.
I would like to acknowledge and thank University of Missouri for allowing me to conduct my
research and providing amenities and assistance whenever required and also Southwest
Airlines Co. for helping me in deeper aspects of my research work and allowing me to
practically examine failed beam components in aircrafts. I would be failing in my duty if I don’t
acknowledge my friends Vivek Krishnamurthy, Gautam Gurnani, Nikhil Dhadke, Akshay
Wankhede, Sagar Gupta, Sachidevi Puttaswamy, Naren, Nikhil Tindal, Dhawal Nikam and Saheli
Goswami. Without these people I wouldn’t have been able to share anything about my
research work or my personal life which counts a lot in the end.
iii
TABLE OF CONTENTS
ACKNOWLEDGEMENTS .................................................................................................................. ii
LIST OF FIGURES ............................................................................................................................ vi
LIST OF TABLES .............................................................................................................................. ix
ABSTRACT ....................................................................................................................................... x
CHAPTER
1. INTRODUCTION ................................................................................................................... 1
1.1 Deformation analysis .................................................................................................. 1
1.2 Stress Strain curve ....................................................................................................... 2
1.2.1 Elastic deformation ........................................................................................... 3
1.2.2 Yield strength of material ................................................................................. 4
1.2.3 Plastic deformation ........................................................................................... 4
1.3 Structures .................................................................................................................... 5
1.4 Boundary conditions and their significance ................................................................ 6
1.4.1 Types of essential boundary conditions ........................................................... 7
1.5 Symmetry breaking ..................................................................................................... 8
1.6 Problem statement ................................................................................................... 12
2. LITERATURE REVIEW ......................................................................................................... 14
2.1 Concept of symmetry breaking in Aircrafts .............................................................. 14
2.1.1 Basic forces acting on a aircraft ...................................................................... 14
2.1.2 Causes of uneven force distribution ............................................................... 15
2.1.3 Process to avoid uneven force distribution .................................................... 17
2.2 Study of truss structures ........................................................................................... 18
iv
2.2.1 Reaction forces in truss structures ................................................................. 20
2.2.2 Tension and compression in members ........................................................... 22
2.2.3 Numerical verification ..................................................................................... 26
2.3 Post buckling phenomena ......................................................................................... 28
3. METHODOLOGY ................................................................................................................ 31
3.1 Concept Generation .................................................................................................. 31
3.2 Newton Raphson Method ......................................................................................... 32
3.3 Finite element analysis .............................................................................................. 34
3.3.1 Finite element software packages .................................................................. 35
3.3.2 Element discretization .................................................................................... 35
3.3.3 Element Nodes ................................................................................................ 36
3.3.4 Element Geometry .......................................................................................... 36
3.3.5 Nodal forces .................................................................................................... 37
3.4 Deformation analysis of beams ................................................................................. 37
3.5 GESA .......................................................................................................................... 40
4. RESULTS AND ANALYSIS .................................................................................................... 42
4.1 Truss structure equivalence to a spring .................................................................... 42
4.2 Symmetry breaking in 7-bar truss structures ............................................................ 47
4.2.1 Effect of cross section on symmetry breaking ................................................ 52
4.2.2 Effect of height of structure on symmetry breaking ...................................... 56
4.3 Symmetry breaking in 5-bar truss structures ............................................................ 60
4.3.1 Effect of cross section on symmetry breaking ................................................ 66
v
4.3.2 Effect of height of structure on symmetry breaking ...................................... 70
4.4 Bifurcation without conforming and influence of base ............................................ 74 4.5 Event investigation .................................................................................................... 78
5. CONCLUSION AND FUTURE WORK ................................................................................... 85
5.1 Conclusion ................................................................................................................. 85
5.2 Future Work .............................................................................................................. 86
REFERENCES ........................................................................................................................... 87
vi
LIST OF FIGURES
Figure1. 1 Stress Strain Curve ......................................................................................................... 3
Figure1. 2Simple seven bar truss with symmetric loading ............................................................. 9
Figure1. 3 Load deformation curve............................................................................................... 10
Figure1. 4 Simple seven bar truss with asymmetric loading ........................................................ 11
Figure1. 5 Load deformation curve............................................................................................... 11
Figure2. 1 Aircraft maintenance .................................................................................................. 17
Figure2. 2 Simple seven bar truss with load at middle ................................................................ 19
Figure2. 3 Reaction forces ............................................................................................................ 21
Figure2. 4 Free body diagram for Node A ................................................................................... 22
Figure2. 5 Free body diagram for node B .................................................................................... 23
Figure2. 6 Free body diagram for Node C..................................................................................... 24
Figure2. 7 Free body diagram for Node D ................................................................................... 25
Figure2. 8 Forces acting on each member.................................................................................... 26
Figure2. 9 Experimental analysis ................................................................................................. 27
Figure2. 10 Simple 3-bar truss member ....................................................................................... 28
Figure2. 11 Load deformation for 3-bar truss ............................................................................. 29
Figure3. 1 Newton Raphson Method ........................................................................................... 33
Figure3. 2 Hinged beam ............................................................................................................... 38
Figure3. 3 Load deformation curve for hinged beam ................................................................... 39
Figure3. 4 Deformed geometry of a hinged beam ....................................................................... 40
Figure4. 1 Experimental setup of a spring .................................................................................... 42
Figure4. 2 F/k*a Vs. Angle graph for a spring ............................................................................... 43
Figure4. 3 Force displacement graph for an inclined spring ........................................................ 44
Figure4. 4 Five-bar truss structure with equal loads acting ......................................................... 45
vii
Figure4. 5 Load deformation for 5-bar spring ............................................................................. 46
Figure4. 6 7-bar truss with symmetric load .................................................................................. 47
Figure4. 7 Load deformation curve for a 7-bar truss with uniform loading ................................. 48
Figure4. 8 Deformed geometry for a 7-bar truss with uniform loading ...................................... 49
Figure4. 9 7-bar truss with non-uniform loading ......................................................................... 50
Figure4. 10 Load deformation curve for a 7-bar truss with non-uniform loading ....................... 51
Figure4. 11 Deformed geometry for a 7-bar truss with non-uniform loading ............................ 52
Figure4. 12 7-bar truss with uniform loading ............................................................................... 53
Figure4. 13 Load deformation curve for a 7-bar truss with uniform loading............................... 54
Figure4. 14 7-bar truss with non-uniform loading ....................................................................... 55
Figure4. 15 Load deformation curve for a 7-bar truss with non-uniform loading ....................... 55
Figure4. 16 7-bar truss with uniform loading ............................................................................... 56
Figure4. 17Load deformation curve for a 7-bar truss with uniform loading ............................... 57
Figure4. 18 Deformed geometry for a 7-bar truss with uniform loading.................................... 58
Figure4. 19 Load deformation curve for a 7-bar truss with non-uniform loading ....................... 58
Figure4. 20 Deformed geometry for 7-bar truss with uniform loading ...................................... 59
Figure4. 21 5-bar truss with uniform loading ............................................................................... 61
Figure4. 22 Load deformation curve for 5-bar truss with uniform loading ................................ 62
Figure4. 23 Deformed geometry for a 5-bar truss with uniform loading.................................... 63
Figure4. 24 5-bar truss with non-uniform loading ...................................................................... 64
Figure4. 25 Load deformation curve for 5-bar truss with non-uniform loading .......................... 64
Figure4. 26 Deformed geometry for a 5-bar truss with non-uniform loading ............................ 65
Figure4. 27 5-bar truss with uniform loading .............................................................................. 66
Figure4. 28 Load deformation curve for 5-bar truss with uniform loading ................................ 67
Figure4. 29 Deformed geometry for a 5-bar truss with uniform loading .................................... 68
Figure4. 30 Load deformation curve 5-bar truss with non-uniform loading ............................... 69
Figure4. 31 Deformed geometry for 5-bar truss with non-uniform loading .............................. 70
Figure4. 32 5-bar truss with uniform loading .............................................................................. 71
Figure4. 33 Load deformation curve for a 5-bar truss with uniform loading............................... 71
viii
Figure4. 34 Deformed geometry of a 5-bar truss with uniform loading ...................................... 72
Figure4. 35 Load deformation curve for a 5-bar truss with non-uniform loading ....................... 73
Figure4. 36 Deformed geometry for a 5-bar truss with non-uniform loading ............................ 74
Figure4. 37 Truss structure with half base ................................................................................... 75
Figure4. 38 Load deformation curve for truss structure with half base ...................................... 76
Figure4. 39 Load deformation curve for an asymmetrically loaded truss structure with half base
...................................................................................................................................................... 77
Figure4. 40 Indiana roof collapse tragedy .................................................................................... 78
Figure4. 41 Experimental analysis of the event ........................................................................... 79
Figure4. 42 Load deformation curve for the event investigation ................................................ 80
Figure4. 43 Deformed geometry ................................................................................................. 81
Figure4. 44 Experimental analysis with wind forces ................................................................... 82
Figure4. 45 Load deformation curve for experimental analysis ................................................... 83
Figure4. 46 Deformed geometry after wind forces ..................................................................... 84
ix
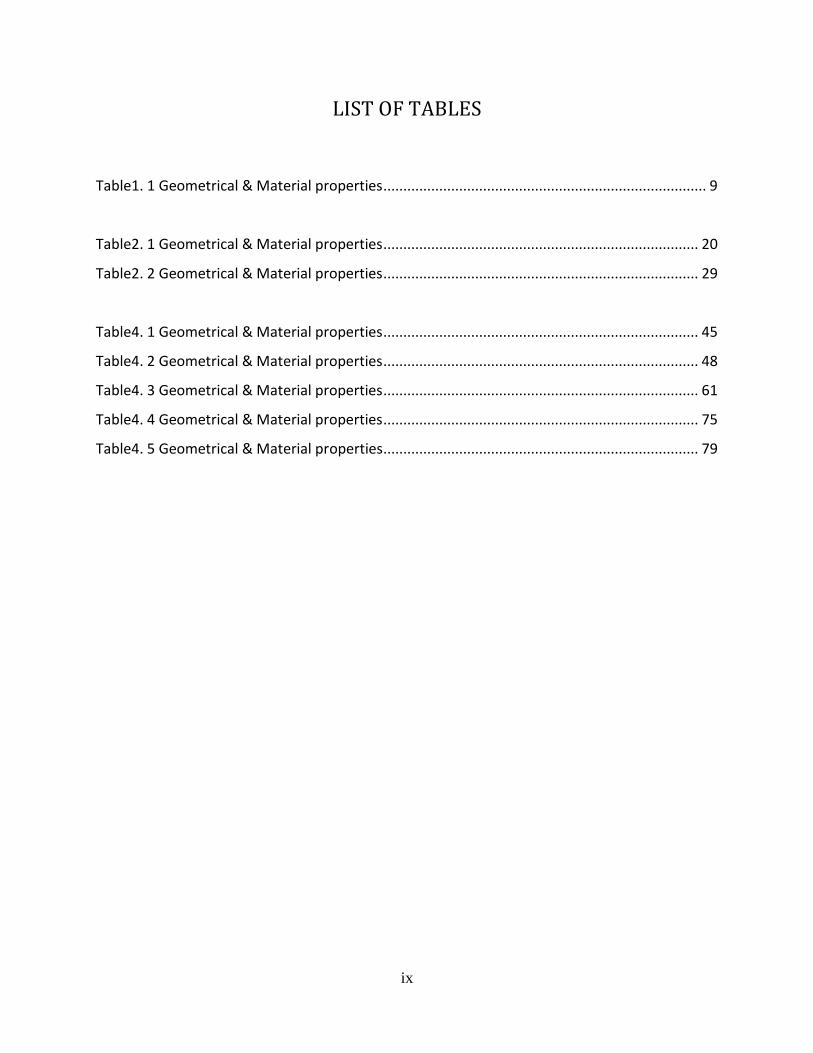
LIST OF TABLES
Table1. 1 Geometrical & Material properties ................................................................................. 9
Table2. 1 Geometrical & Material properties ............................................................................... 20
Table2. 2 Geometrical & Material properties ............................................................................... 29
Table4. 1 Geometrical & Material properties ............................................................................... 45
Table4. 2 Geometrical & Material properties ............................................................................... 48
Table4. 3 Geometrical & Material properties ............................................................................... 61
Table4. 4 Geometrical & Material properties ............................................................................... 75
Table4. 5 Geometrical & Material properties ............................................................................... 79
x
ABSTRACT
Symmetries can be attributed to physical states or physical laws. A symmetry can be exact,
approximate or broken. Exact symmetry means that the symmetry is unconditionally valid,
approximate means its valid in certain conditions, broken symmetry can be interpreted in
various ways. This thesis emphasizes on the interesting as well as distinct results of miniscule
asymmetric disturbance and its effects on the symmetry and structures. Even miniscule
difference in the magnitude of symmetric forces acting on symmetrical structures can result in
an asymmetric response and remarkable difference in the buckling point of a structure. This
might be a major contributing factor for failure in structures, may it be structures used in large
complex assemblies or in Micro Electro Mechanical systems.
A truss element may be quintessential to prove symmetry breaking and its remarkable effects
due to miniscule anomaly in symmetry. If we consider truss structures alone, the results are
intriguing; in the past there have been numerous instances of failure of truss structures of
various sizes and in different applications. In many of such instances causes of failure were
attributed to load exceeding critical load. A thorough study on asymmetric responses show that
buckling load drops down for an asymmetric response when compared to the symmetric
response for the same material properties and geometrical boundary conditions. Hence
studying the asymmetric responses of structures can help designing better components
resulting in less number of failures
1
Chapter 1
Introduction
1.1 Deformation Analysis
In this era of rapid technological advancements and evolving production, safety and integrity of
structures are of vital importance. Numerous processes and software packages are in use to
evaluate the behavior of structural components. Structural components are designed to
withstand various kinds of loads and effects. In accordance with their properties, structural
components are manufactured to handle large magnitude of force and their application range
from buildings to automotive and aircraft sector and hence the margin for failure is very small.
Stress analysis is carried out in design of structures of all dimensions. It can range from aircrafts,
mechanical components, micro electro mechanical systems, bridges, dams or any other
structure. Conventionally the input data for analyzing stresses in a component are the
geometrical properties of the component, constraints attached and the forces that are acting
on it. The output gives us the magnitude of stresses acting on all parts and joints and the
deformation caused as a result of those stresses. In modern era, there arises a need for
accurate finite element formulation and analysis of stresses in components in order to maintain
safety and proper functioning the component. There are numerous computer aided
technologies that provide tremendous accuracy and ease of operation to analyze stress and
deformation in components but the task accurate analysis requires proper understanding of the
mechanics of materials and good mechanical aptitude.
2
1.2 Stress strain curve
Structural components undergo deformation when subjected to loading. Deformation is a
process of change in shape and size of a structure upon loading. The nature of deformation
depends on the type of material, size and geometry of the object, and the forces applied. The
various types of deformation are:
Elastic deformation
Plastic deformation
Metal fatigue
Compressive failure
Fracture
The occurrence of above phases of deformation are dependent on several factors and based on
the phase of deformation, the material will be validated to see if it is strong enough to perform,
needs repair or if it should be disposed of. Usually plastic deformation of a material subjects it
to an irreversible structural mode. Our study mainly deals with truss structures and most of the
truss structures are highly flexible which can undergo large deformations and rotations within
the elastic limit. The basic idea of the deformation of a structure can be inferred from a Stress
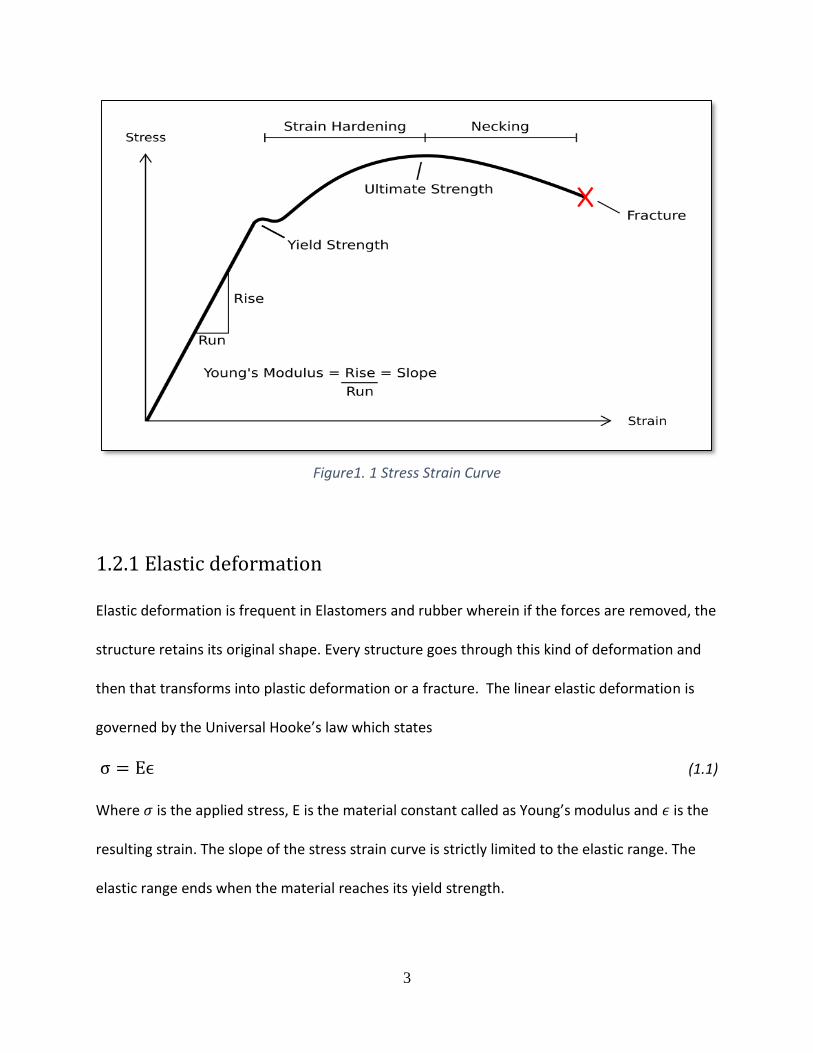
vs Strain curve which is as shown below in figure 1.1
3
Figure1. 1 Stress Strain Curve
1.2.1 Elastic deformation
Elastic deformation is frequent in Elastomers and rubber wherein if the forces are removed, the
structure retains its original shape. Every structure goes through this kind of deformation and
then that transforms into plastic deformation or a fracture. The linear elastic deformation is
governed by the Universal Hooke’s law which states
σ = Eϵ (1.1)
Where 𝜎 is the applied stress, E is the material constant called as Young’s modulus and 𝜖 is the
resulting strain. The slope of the stress strain curve is strictly limited to the elastic range. The
elastic range ends when the material reaches its yield strength.
4
1.2.2 Yield strength of a material
If a perpendicular is drawn from the Yield point shown in figure above to the Y-axis, the yield
strength can be described as the stress a material can without permanent deformation. It is a
point after which the material becomes to plastically deform and can’t go back to its original
shape. The yield strength of the material somewhere falls between the ultimate strength and
the proportional limit.
1.2.3 Plastic deformation
It is an irreversible deformation phase. It can be inferred that plastic deformation will first
undergo elastic deformation (which is reversible) and this is the reason that the material can
retain part of its original shape. The plastic deformation of the material starts when the yield
strength of the material is reached and goes on till a permanent fracture has occurred in the
material. In more technical terms, plastic deformation involves breaking of limited number of
atomic bonds by the movement of dislocations. In the above figure, the plastic deformation is
characterized by a strain hardening area, necking region and finally fracture and this is
applicable to tensile stresses. Since the nature of deformation is rigorous, soft thermoplastics
have rather large plastic deformation range as do ductile metals such as copper, silver and gold.
Steel does have a large plastic deformation range but the effect is rather small in cast iron.
5
1.3 Structures
In engineering terms, a structure is a combination of bodies in space which forms a structural
system capable of supporting loads. A structural system usually consists of various load carrying
elemental structures. The assumptions pertaining to physical characteristics of elemental
structures determine the category or group in which the load carrying elemental structure
belongs to. If the elemental structures were to be categorized in terms of geometries and load
carrying capabilities, they can be divided into six groups, they are:
Cables
Bars
Beams
Membranes
Plates and
Shells
Our study mainly deals with bars and beams. Bars are one-dimensional structures that sustain
extensional, compressional and torsional loads. In this way, a few basic assumptions can be
based according to the force acting. If the bar is only subjected to longitudinal tensile loads, it is
called as a rod. Rods are one of the most commonly used primary elemental structure. Many of
the common mega structures use rod as a primary load carrying element.
Beams are structures which have the capability of withstanding load primarily by resisting
bending. Bending moment is nothing but the reaction of the structural element when the
external force applied causes it to bend. Beams are capable of sustaining extension,
6
compression, bending, flexure and twisting loads. Basically strings, bars and rods are special
cases of general beams.
1.4 Boundary conditions and their significance
Boundary conditions are set of parameters that limit the motion like translation and rotation in
a structure. While structures are being analyzed, boundary conditions play a key role in the
outcome of the analysis. The failure load, behavior and various other outcomes depends a lot
on how the structure is being constrained. Boundary conditions are applied at either the
surface or a point and must be considered carefully since over or under constrained models can
yield erroneous results. In present day structures, there could be massive assemblies of
components which are connected in a complex manner and in these cases; realistic boundary
conditions should be applied for results.
Basic components of structural mechanics include Load-deformation curve, a constitutive law,
equilibrium equations and equations of motions with boundary and initial conditions. The
equilibrium equations state the balancing of internal stresses, body forces and inertial forces of
a differential material particle. The constraints referred in Finite element Analysis are the
boundary conditions. In terms of pure mathematics; a boundary condition is the condition
required to be satisfied at all or part of the boundary or the region in which a set of differential
equation is to be solved. The finite element method distinguishes between essential and
natural boundary conditions. Essential (geometric) boundary conditions are the boundary
conditions that affect the independent motions or the degrees of freedom and are imposed on
7
the primary variable like displacement. The natural boundary conditions do not directly affect
the independent motions and are imposed on secondary variable like forces and tractions. Each
supporting structure is designed so that it can support or transfer a specific type of load.
Supports can be chosen based on the following factors
Purpose of the structure
Number of sub-structures
Type of material being used
Dimensional properties of the structure
Type of the structure etc.,
1.4.1 Types of essential boundary conditions
Structures can be constrained in a few ways; the most commonly used are hinged, roller and
fixed constraint. The hinged support is a type of support which allows moment but restricts
vertical or horizontal movement. Hinged supports are most commonly seen in doors. A hinge
allows a certain degree of rotation and this enables the door to open and close but restricts any
sought of a vertical or horizontal motion. Hinges are included in large structures to reduce or
eliminate the transfer of bending forces between structural components. Hence constraining a
structure tactically can have advantages like low maintenance cost and higher structural
integrity. The fixed supports resist any sought of moment in addition to movement along any
axis. This means that the fixed support resists tension, compression and moment. The roller
8
supports are widely used in many applications and has many unique benefits. The roller
supports are free to rotate and translate along the surface upon which the roller rests. The
resulting force is always a single force that is perpendicular and away from the surface. The
roller cannot provide resistance to lateral forces other than a perfectly vertical load, as soon as
the load exceeds the structure will roll away in response.
1.5 Symmetry breaking
Symmetry for structures strictly restricts it to be invariant to transformation with respect to its
original shape and dimension. Symmetries basically can be observed through geometrical
transformations. Symmetry breaking can mean different things under different circumstances.
Symmetry breaking doesn’t necessarily mean absence of symmetry; it rather means that the
final state of symmetry is characterized by a lower symmetry compared to the original state. In
more theoretical terms this means, the symmetry is transformed to one of its subgroups. The
deformed configurations which signify the transformation in symmetry signifies exactly how the
transformation in symmetry takes place. If we consider a simple example of a simple truss
member as shown below in figure 1.2
9
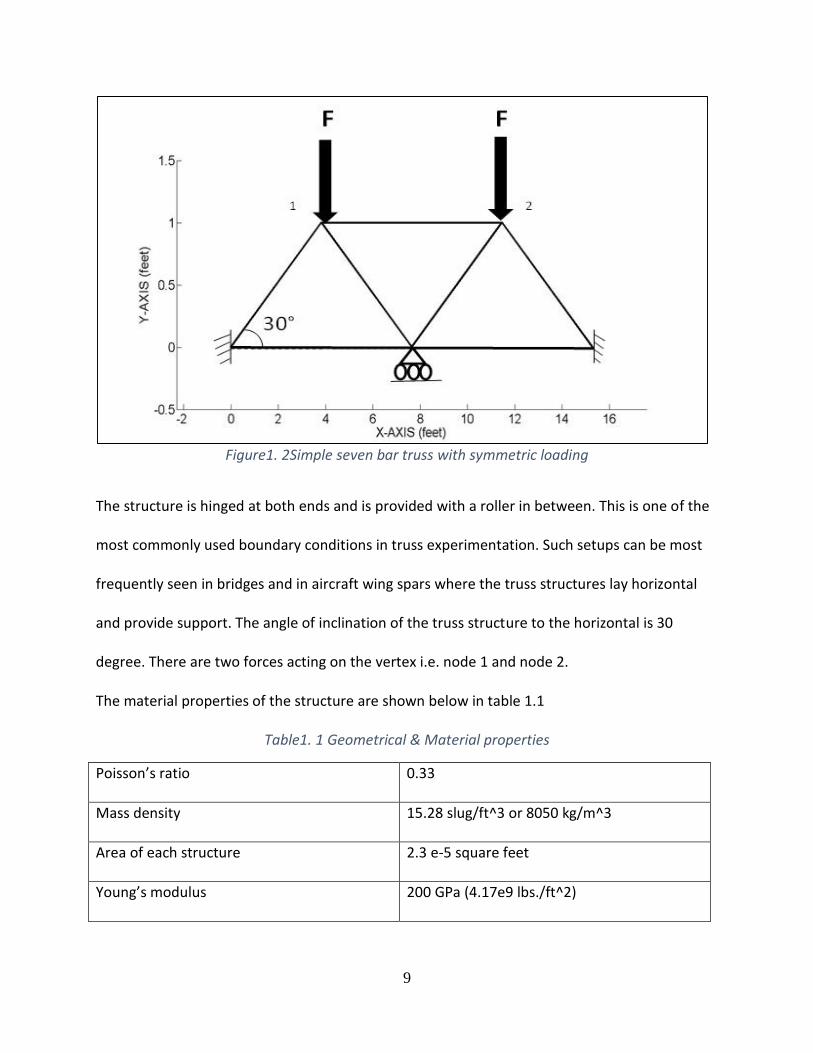
Figure1. 2Simple seven bar truss with symmetric loading
The structure is hinged at both ends and is provided with a roller in between. This is one of the
most commonly used boundary conditions in truss experimentation. Such setups can be most
frequently seen in bridges and in aircraft wing spars where the truss structures lay horizontal
and provide support. The angle of inclination of the truss structure to the horizontal is 30
degree. There are two forces acting on the vertex i.e. node 1 and node 2.
The material properties of the structure are shown below in table 1.1
Table1. 1 Geometrical & Material properties
Poisson’s ratio 0.33
Mass density 15.28 slug/ft^3 or 8050 kg/m^3
Area of each structure 2.3 e-5 square feet
Young’s modulus 200 GPa (4.17e9 lbs./ft^2)
10
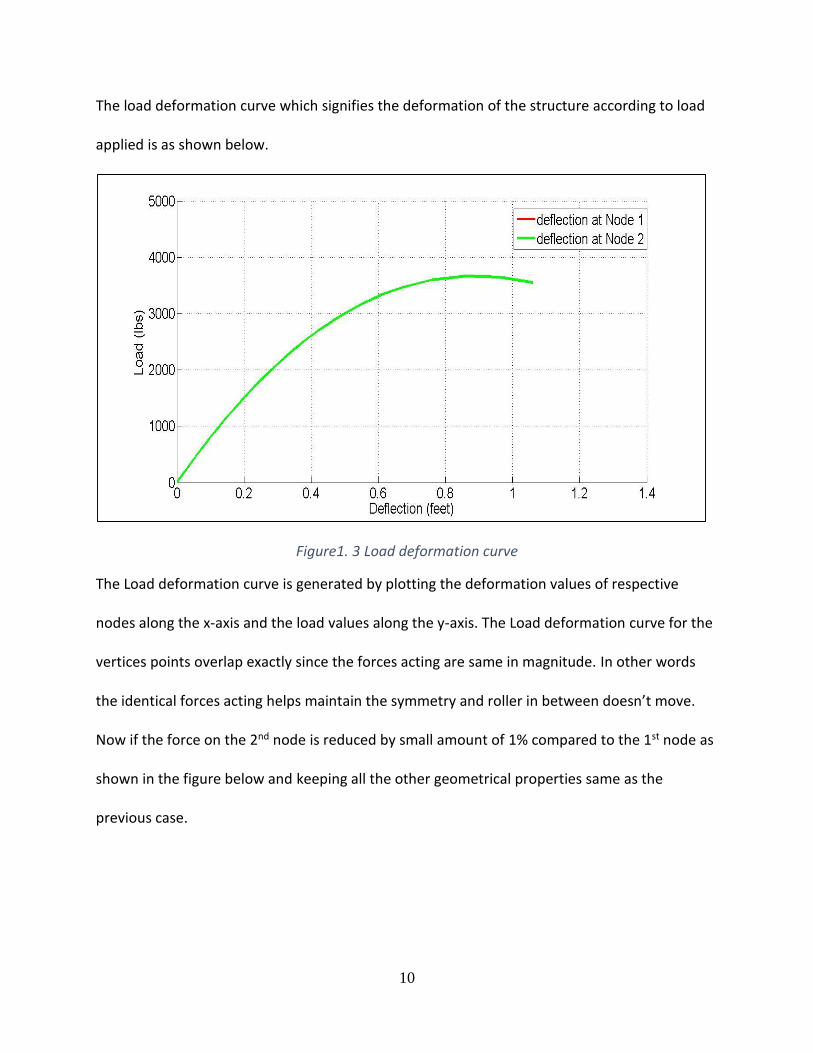
The load deformation curve which signifies the deformation of the structure according to load
applied is as shown below.
Figure1. 3 Load deformation curve
The Load deformation curve is generated by plotting the deformation values of respective
nodes along the x-axis and the load values along the y-axis. The Load deformation curve for the
vertices points overlap exactly since the forces acting are same in magnitude. In other words
the identical forces acting helps maintain the symmetry and roller in between doesn’t move.
Now if the force on the 2nd node is reduced by small amount of 1% compared to the 1st node as
shown in the figure below and keeping all the other geometrical properties same as the
previous case.
11
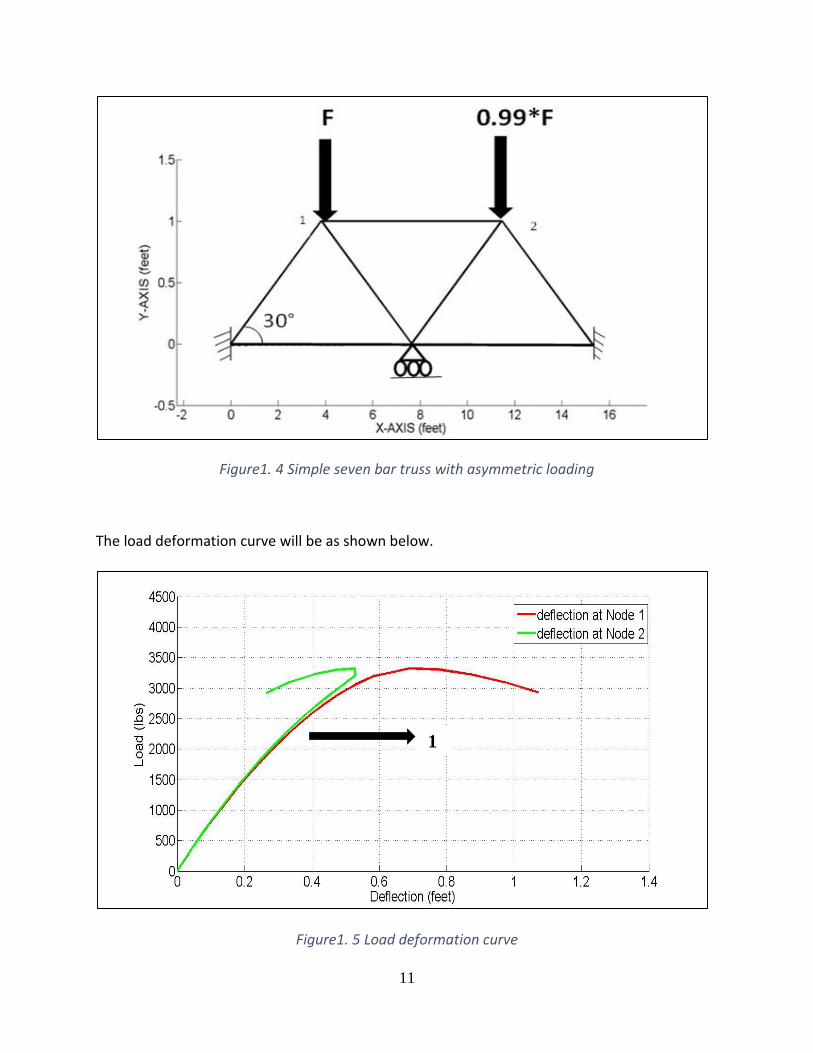
Figure1. 4 Simple seven bar truss with asymmetric loading
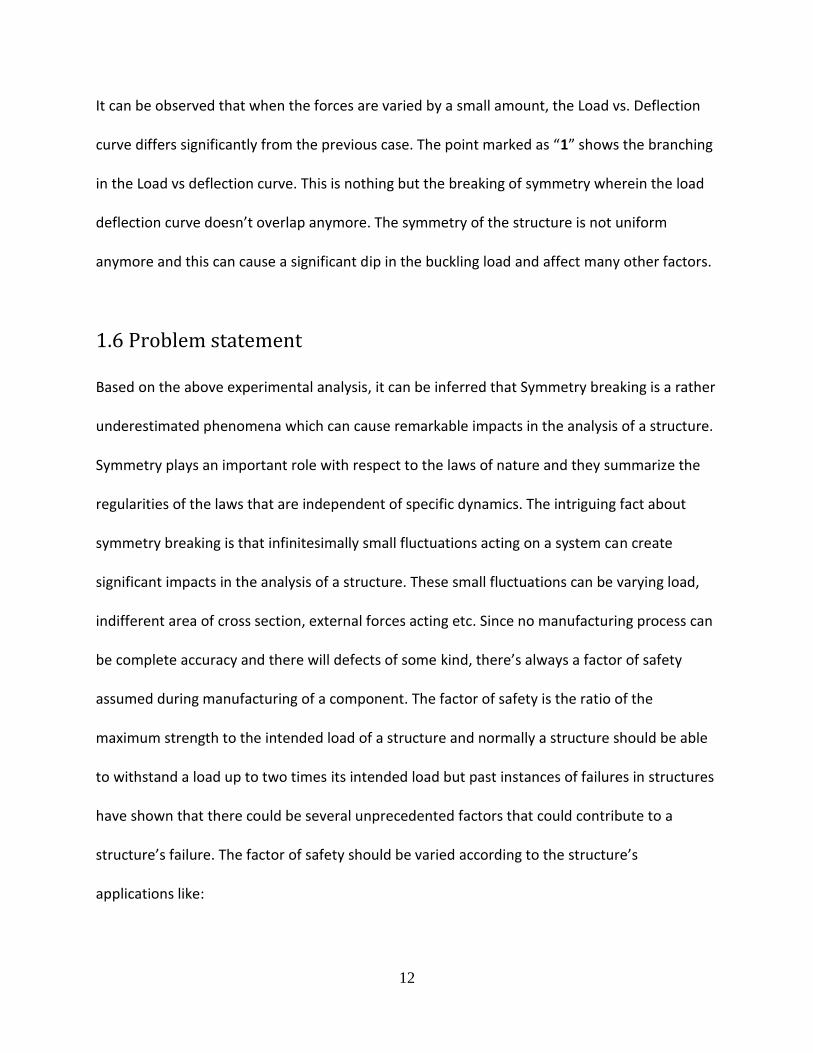
The load deformation curve will be as shown below.
Figure1. 5 Load deformation curve
1
12
It can be observed that when the forces are varied by a small amount, the Load vs. Deflection
curve differs significantly from the previous case. The point marked as “1” shows the branching
in the Load vs deflection curve. This is nothing but the breaking of symmetry wherein the load
deflection curve doesn’t overlap anymore. The symmetry of the structure is not uniform
anymore and this can cause a significant dip in the buckling load and affect many other factors.
1.6 Problem statement
Based on the above experimental analysis, it can be inferred that Symmetry breaking is a rather
underestimated phenomena which can cause remarkable impacts in the analysis of a structure.
Symmetry plays an important role with respect to the laws of nature and they summarize the
regularities of the laws that are independent of specific dynamics. The intriguing fact about
symmetry breaking is that infinitesimally small fluctuations acting on a system can create
significant impacts in the analysis of a structure. These small fluctuations can be varying load,
indifferent area of cross section, external forces acting etc. Since no manufacturing process can
be complete accuracy and there will defects of some kind, there’s always a factor of safety
assumed during manufacturing of a component. The factor of safety is the ratio of the
maximum strength to the intended load of a structure and normally a structure should be able
to withstand a load up to two times its intended load but past instances of failures in structures
have shown that there could be several unprecedented factors that could contribute to a
structure’s failure. The factor of safety should be varied according to the structure’s
applications like:
13
If the components are subjected to repeated shock loading, there should be high factor
of safety
When the stresses acting are unprecedented, the factor of safety will be high and this is
also difficult to predict
When the structure is prone to corrosion, the factor of safety should be high
Therefore a constant monitoring of the impact of symmetry breaking is the need of the hour in
the near future. This need is also necessary considering the constant increase in usage of
structures in aircrafts, automotive, buildings etc.
14
Chapter 2
Literature review
2.1 Concept of Symmetry breaking in Aircrafts
There is no exact term called symmetry breaking in Aviation industry but the concept of
unequal forces acting on the aircraft structures influencing premature failure exists. I was
privileged to meet and work with the Structures team of Southwest Airlines Co. during the
course of my internship and went through some very intriguing processes that are followed
during the Aircraft maintenance. There are various parameters to be considered during
maintenance and following the procedures correctly is of vital importance and requires a
specific skill set and a lot of experience.
2.1.1 Basic forces acting on an aircraft
The aircraft experiences a variety of forces during its flight path and while also on the ground.
Structural integrity is the major factor in aircraft design and construction. Every aircraft is
subjected to structural stress and regardless of the design; every aircraft components must
carry, resist or transmit the load applied on it. Stresses are inevitable for any aircraft or any
structure for that matter and responding to it by operating under safe limits is the best way to
handle stresses in aircrafts. The aircraft body should be durable and strong enough to
overcome all the forces and maintain its shape which is crucial. The basic forces on an aircraft
are tension, compression and bending.
15
Tension is the resistance to pull; it is the stress of stretching an object or pulling at its ends. An
airplane may experience tremendous amount of tension on the fuselage section when in midair
because of the drastic change in temperature and pressure. Tension can be caused when the
engine propels the aircraft forward and the wings, tail and fuselage resists the forward
movement. The aircraft structure is made up of metal (aluminum) and any metal undergoes
expansion or contraction. Even though all of these factors will be considered during the design
of the aircraft, the cracks evolving on the aircraft skin are inevitable.
Compression is the inward force, if the forces acting on the aircraft move towards each other,
they are called compressive forces and they are opposite of tension forces. The compression
mainly occurs on when the aircraft lands and while on the ground.
Bending force is a combination of tension and compression. The wing spars undergo a lot of
bending load. The spar is the main structural component of the wing running through span wise
at right angles to the fuselage. The spar carries flight loads and weight of the wings while
stationery on the ground.
2.1.2 Causes of uneven force distribution
The aircraft as a structure (skin) is made up of aluminum metal and like any other metal; they
contract and expand due to drastic variation in temperature and cabin pressure. It is found that
the aircraft structure expands or balloons up to 20-35 centimeters during its flight path. The
entire aircraft structure is made up of a large number of beams and skin is made up of basic
aluminum metal and the sub-assemblies are held together by thousands of strong rivets. Rivets
16
are permanent mechanical fasteners and because there is a head on each end of an installed
rivet, it can support tension loads. However rivets are much more capable of supporting shear
loads. Due to the unpredictable expansion the original symmetry is broken and the aircraft
experiences a much stronger and penetrating force especially during landing. This is because
the aircraft has already undergone a lot of stress due to take-off, change in temperature,
pressure and the various maneuvers during the flight path. So the portion just above the rear
landing struts undergoes tremendous stress and is one of the most vulnerable as well as most
repaired components during flight maintenance.
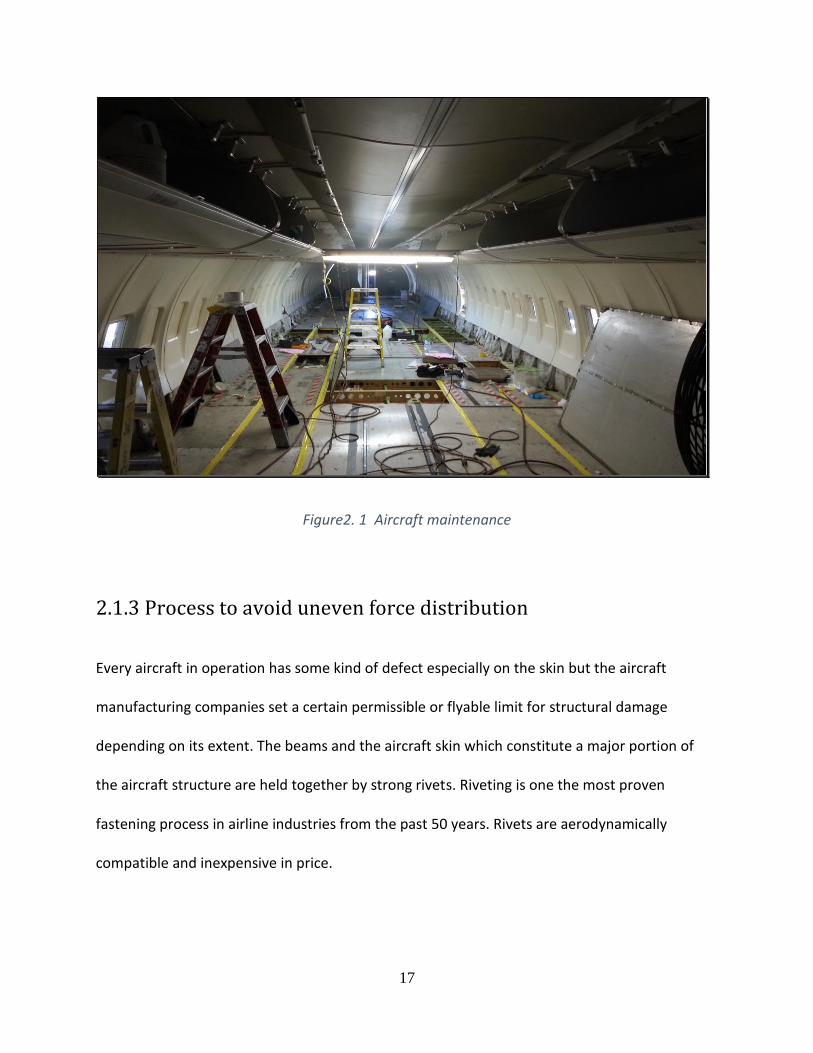
This can impact the original force reaction scenario and if not addressed properly, it can create
adverse effects on the integrity of the flight structure. The beam structures present just above
the rear landing gear struts are under maintenance quite often and the below figure shows one
of the maintenance sessions in progress.
17
Figure2. 1 Aircraft maintenance
2.1.3 Process to avoid uneven force distribution
Every aircraft in operation has some kind of defect especially on the skin but the aircraft
manufacturing companies set a certain permissible or flyable limit for structural damage
depending on its extent. The beams and the aircraft skin which constitute a major portion of
the aircraft structure are held together by strong rivets. Riveting is one the most proven
fastening process in airline industries from the past 50 years. Rivets are aerodynamically
compatible and inexpensive in price.
18
For beams above the landing struts, the rivets which hold them together along the longitudinal
direction are soft rivets instead of the conventional rivets. The soft rivets are identical in
appearance to the conventional ones but they incorporate a body and mandrel of special soft
aluminum alloy. Though it has a lower tensile limit, it helps in the uniform expansion of the
beam structure along the longitudinal direction and this conversely helps in the expansion of
beam structures and helps prevent asymmetric expansion as well as asymmetric forces on it.
This counter strategy implemented by Southwest Airlines has seen comparatively larger life
span of beams above rear landing struts.
2.2 Study of truss structures
A truss is typically a structure comprising of one or more triangular units formed with straight
structures whose ends are connected at joints we refer as nodes. A truss is a slender member,
i.e. the length is much larger than the cross section and hence for many of the experimental
analysis the weight of the truss member is ignored. One of the very important property of
trusses are that it cannot support bending load since each node in a truss element is hinged or
joined and hence they can be treated as a one degree of freedom kinematic pair. Also, the cross
sectional dimensions and the elastic properties of the truss element remains constant. The
solutions for trusses are exact if nonlinear strain-displacement relations are used. Moreover
trusses are more likely to have load buckling and bifurcated solutions than continuous
structures. Since the truss consists of discrete bar elements and external loads are only applied
at joints, there is no spatial discretization required in the modeling of a truss. The dimensional
19
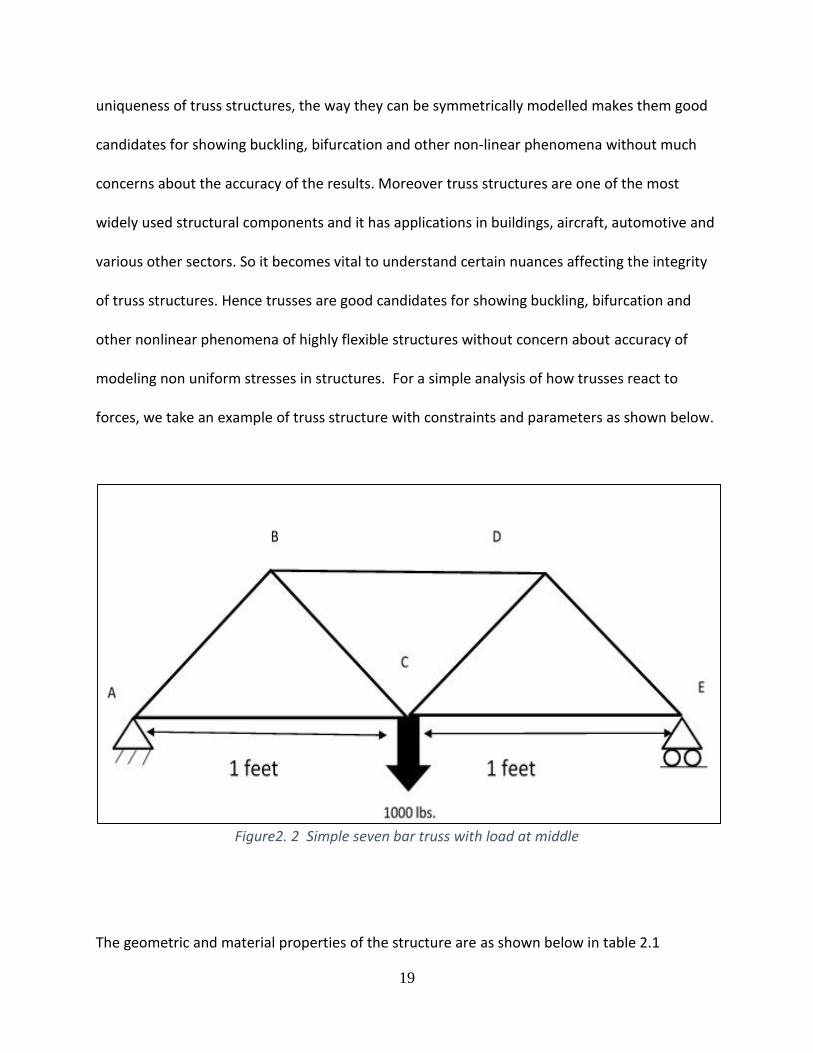
uniqueness of truss structures, the way they can be symmetrically modelled makes them good
candidates for showing buckling, bifurcation and other non-linear phenomena without much
concerns about the accuracy of the results. Moreover truss structures are one of the most
widely used structural components and it has applications in buildings, aircraft, automotive and
various other sectors. So it becomes vital to understand certain nuances affecting the integrity
of truss structures. Hence trusses are good candidates for showing buckling, bifurcation and
other nonlinear phenomena of highly flexible structures without concern about accuracy of
modeling non uniform stresses in structures. For a simple analysis of how trusses react to
forces, we take an example of truss structure with constraints and parameters as shown below.
Figure2. 2 Simple seven bar truss with load at middle
The geometric and material properties of the structure are as shown below in table 2.1
20
Table2. 1 Geometrical & Material properties
Poisson’s ratio 0.33
Mass density 15.28 slug/ft^3 or 8050 kg/m^3
Area of each structure 2.50 e-6 square feet
Young’s modulus 200 GPa (4.17e9 lbs./ft^2)
Length of each structure 1 feet
Angle to the horizontal 60 degree
Number of bars 7
The structure has two constraints. On the left hand side it has a hinged joint which means it is
free to rotate and on the right hand side there is a roller which enables the truss to have
movement along the X-axis. A force of 1 kilo pounds is acting in the middle (Node C). With such
set of constraints and parameters, the truss may represent a small foot bridge with a heavy
person standing in the middle.
2.2.1 Reaction forces in truss structures
Now the reaction forces can be calculated by using the method of joints, we begin by drawing
the free body diagram of the whole truss to find the reaction forces and then we segregate it
joint by joint to calculate the tension in each of the members. First there are the primary
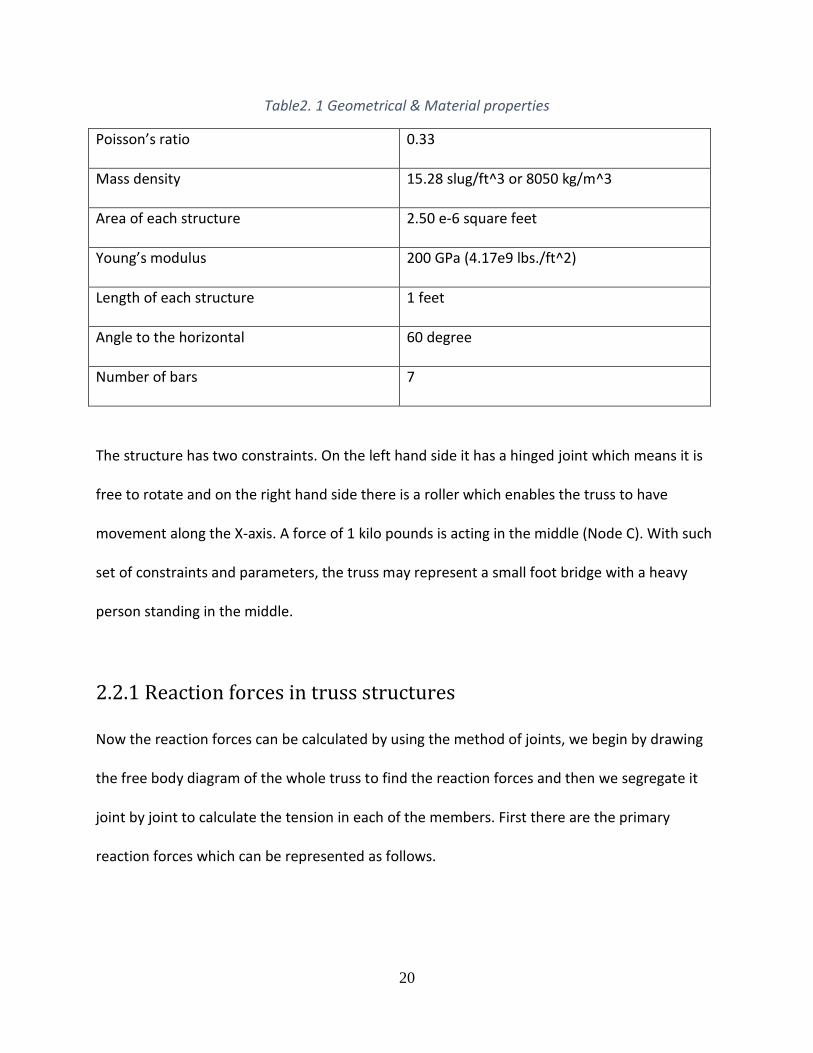
reaction forces which can be represented as follows.
21
Figure2. 3 Reaction forces
If we consider the reaction forces along the X-direction there is just one force along the
horizontal, Σ Fx= 0, hence Fax=0.
If we consider node A about which we compute the moment then we have two forces to
consider and they are at node C and node E and hence we have moment about node A and it
can be calculated as:
Σ MA= -1000 lbs.*1 feet + Fey*2 feet = 0; (2.1)
Solving for Fey in the above equation we get Fey=500 pound force (lbs)
Similarly we have summation of forces along vertical direction is zero, Σ Fy = 0, hence:
Fay -1000 lbs. + Fey=0; (2.2)
Fay-1000 lbs. +500=0;
Solving the above equation, we get Fay= 500 lbs.
22
2.2.2 Tension and compression in members
We can go through the truss structure joint by joint to calculate the tension in each of the
members. We assume that the joints are held together by pins and hence members are free to
rotate, which means that forces can be only applied in the direction of the orientation of the
structure. We also assume that the weight of the truss is negligible compared to the force
applied and hence weight of the members are neglected in our computations.
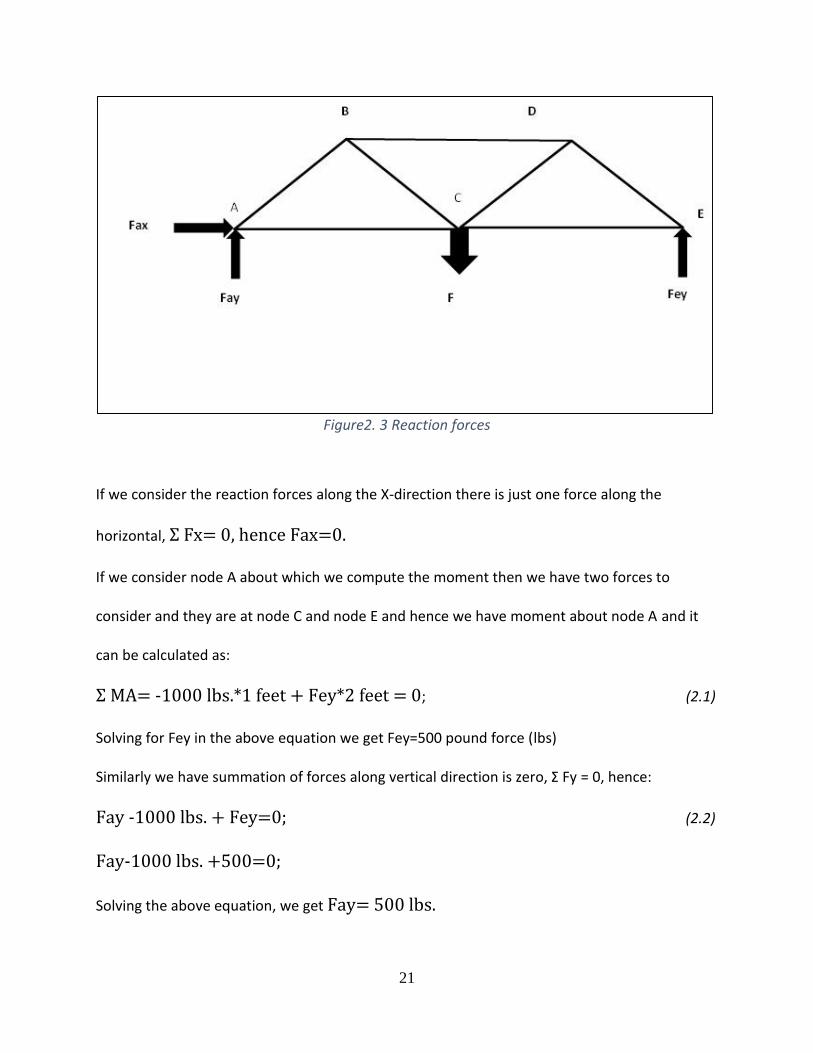
The first step in stress calculations is to draw the free body diagram for each node; we can
calculate the stress in each member. The free body diagram for node A is shown below.
Figure2. 4 Free body diagram for Node A
The tensile forces acting can be further segregated along its axial components and then by
applying the principle that sum of the forces along the horizontal and vertical directions is equal
to zero, we get: Σ Fx= Tab*Cos 60 +Tac =0; (2.3)
23
Σ Fy= Tab* Sin 60 + Fay=0; (2.4)
Solving the above equation, we get Tab= (-500/ Sin 60) = -577.4 lbs.
Now substituting the above value in Equation (2.3), we get Tac= 288.7 lbs.
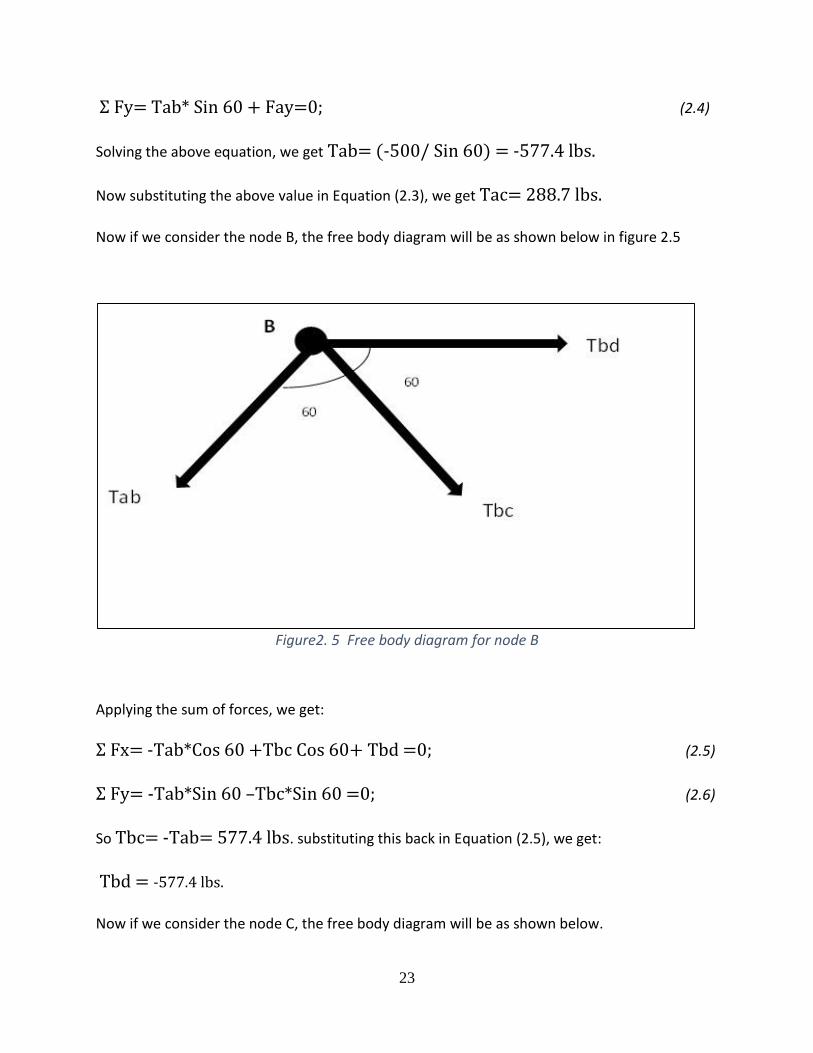
Now if we consider the node B, the free body diagram will be as shown below in figure 2.5
Figure2. 5 Free body diagram for node B
Applying the sum of forces, we get:
Σ Fx= -Tab*Cos 60 +Tbc Cos 60+ Tbd =0; (2.5)
Σ Fy= -Tab*Sin 60 –Tbc*Sin 60 =0; (2.6)
So Tbc= -Tab= 577.4 lbs. substituting this back in Equation (2.5), we get:
Tbd = -577.4 lbs.
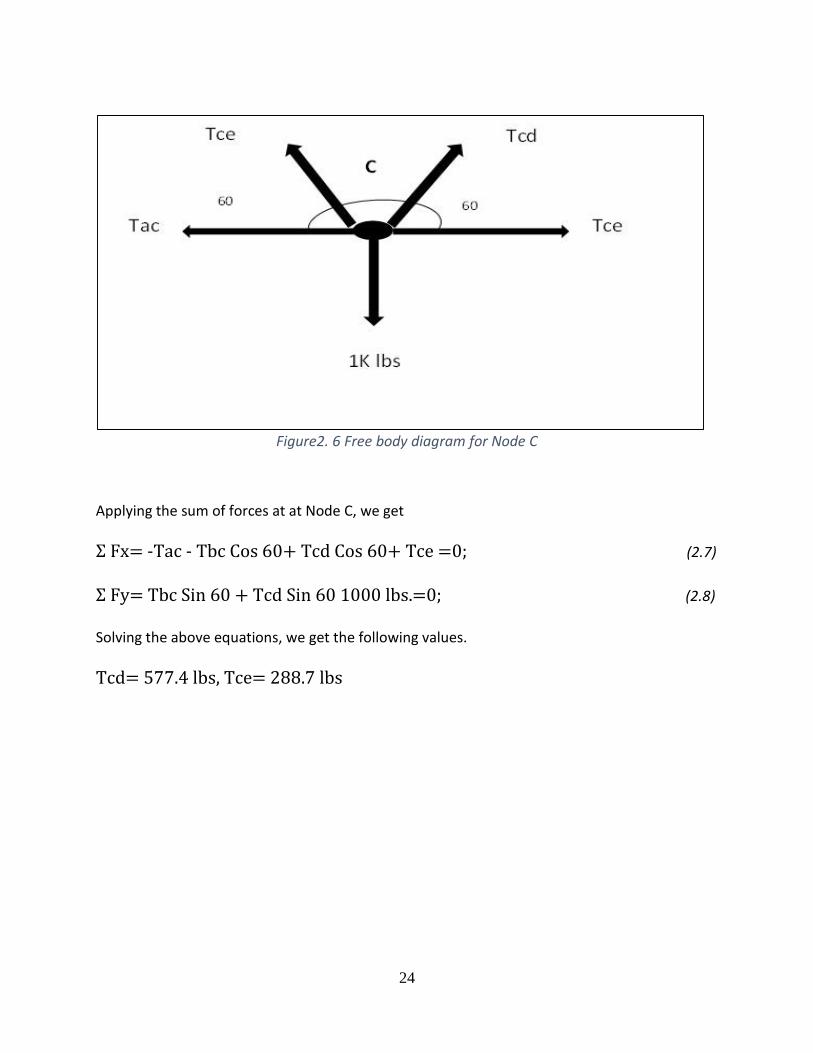
Now if we consider the node C, the free body diagram will be as shown below.
24
Figure2. 6 Free body diagram for Node C
Applying the sum of forces at at Node C, we get
Σ Fx= -Tac - Tbc Cos 60+ Tcd Cos 60+ Tce =0; (2.7)
Σ Fy= Tbc Sin 60 + Tcd Sin 60 1000 lbs.=0; (2.8)
Solving the above equations, we get the following values.
Tcd= 577.4 lbs, Tce= 288.7 lbs
25
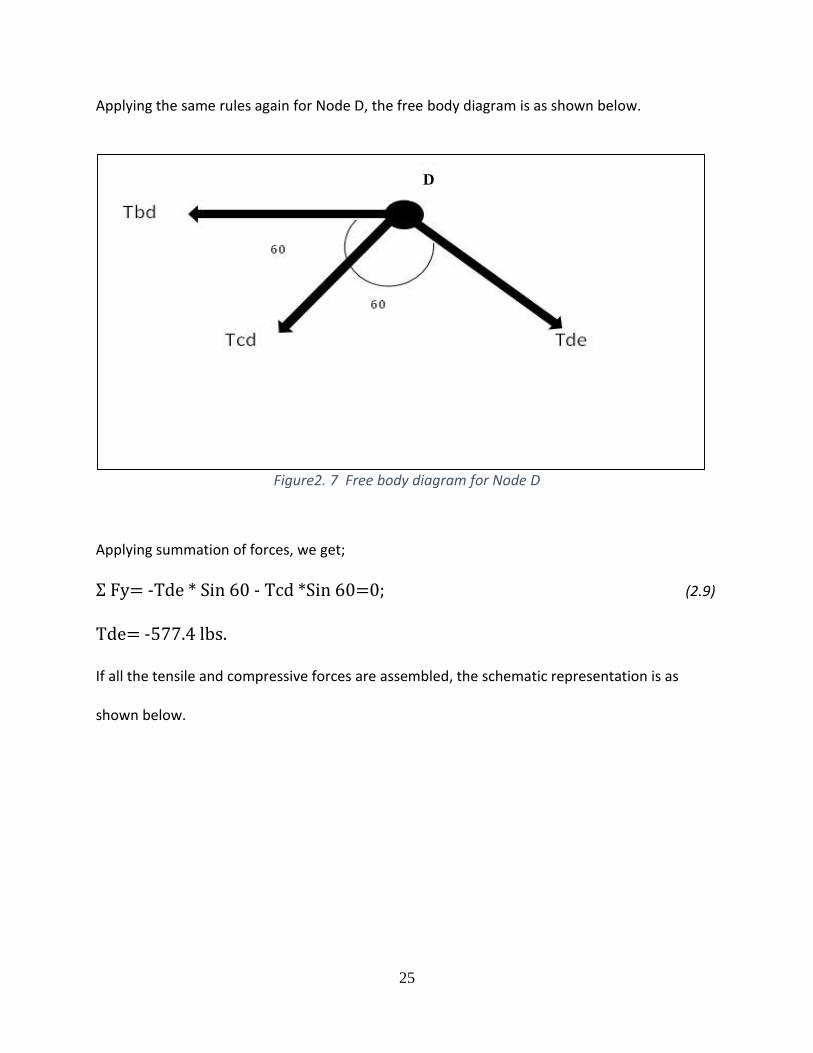
Applying the same rules again for Node D, the free body diagram is as shown below.
Figure2. 7 Free body diagram for Node D
Applying summation of forces, we get;
Σ Fy= -Tde * Sin 60 - Tcd *Sin 60=0; (2.9)
Tde= -577.4 lbs.
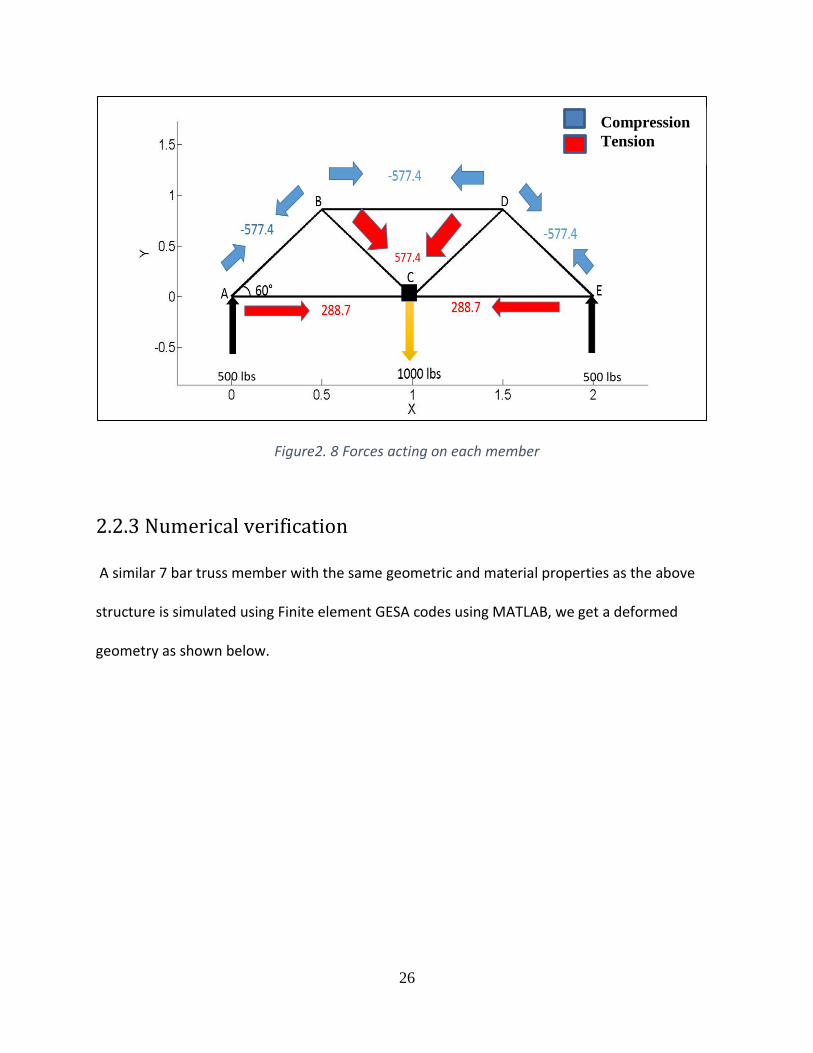
If all the tensile and compressive forces are assembled, the schematic representation is as
shown below.
D
26
Figure2. 8 Forces acting on each member
2.2.3 Numerical verification
A similar 7 bar truss member with the same geometric and material properties as the above
structure is simulated using Finite element GESA codes using MATLAB, we get a deformed
geometry as shown below.
500 lbs 500 lbs
Compression
Tension
27
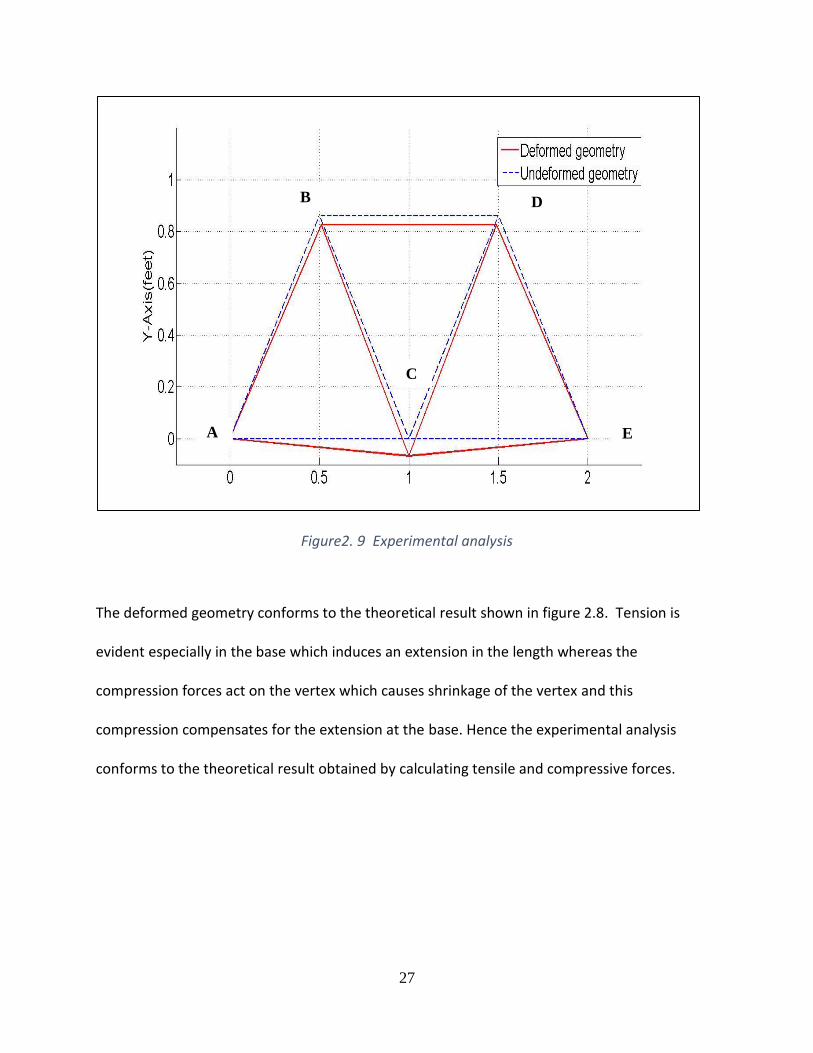
Figure2. 9 Experimental analysis
The deformed geometry conforms to the theoretical result shown in figure 2.8. Tension is
evident especially in the base which induces an extension in the length whereas the
compression forces act on the vertex which causes shrinkage of the vertex and this
compression compensates for the extension at the base. Hence the experimental analysis
conforms to the theoretical result obtained by calculating tensile and compressive forces.
A
B
C
D
E
28
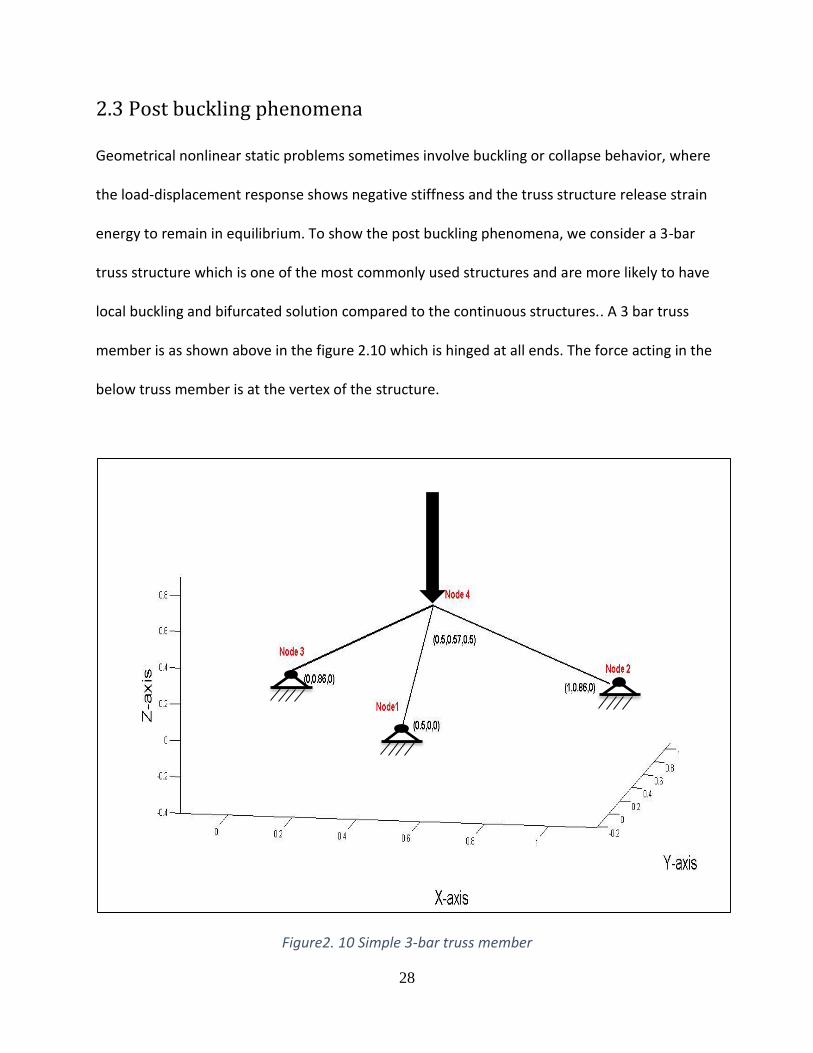
2.3 Post buckling phenomena
Geometrical nonlinear static problems sometimes involve buckling or collapse behavior, where
the load-displacement response shows negative stiffness and the truss structure release strain
energy to remain in equilibrium. To show the post buckling phenomena, we consider a 3-bar
truss structure which is one of the most commonly used structures and are more likely to have
local buckling and bifurcated solution compared to the continuous structures.. A 3 bar truss
member is as shown above in the figure 2.10 which is hinged at all ends. The force acting in the
below truss member is at the vertex of the structure.
Figure2. 10 Simple 3-bar truss member
29
The natural and geometric and material properties of the above truss structure is given below
Table2. 2 Geometrical & Material properties
Type of material Steel
Poisson’s ratio 0.33
Mass density 15.28 feet/slug
Area of each structure 0.023 square feet
Young’s modulus 72 GPa
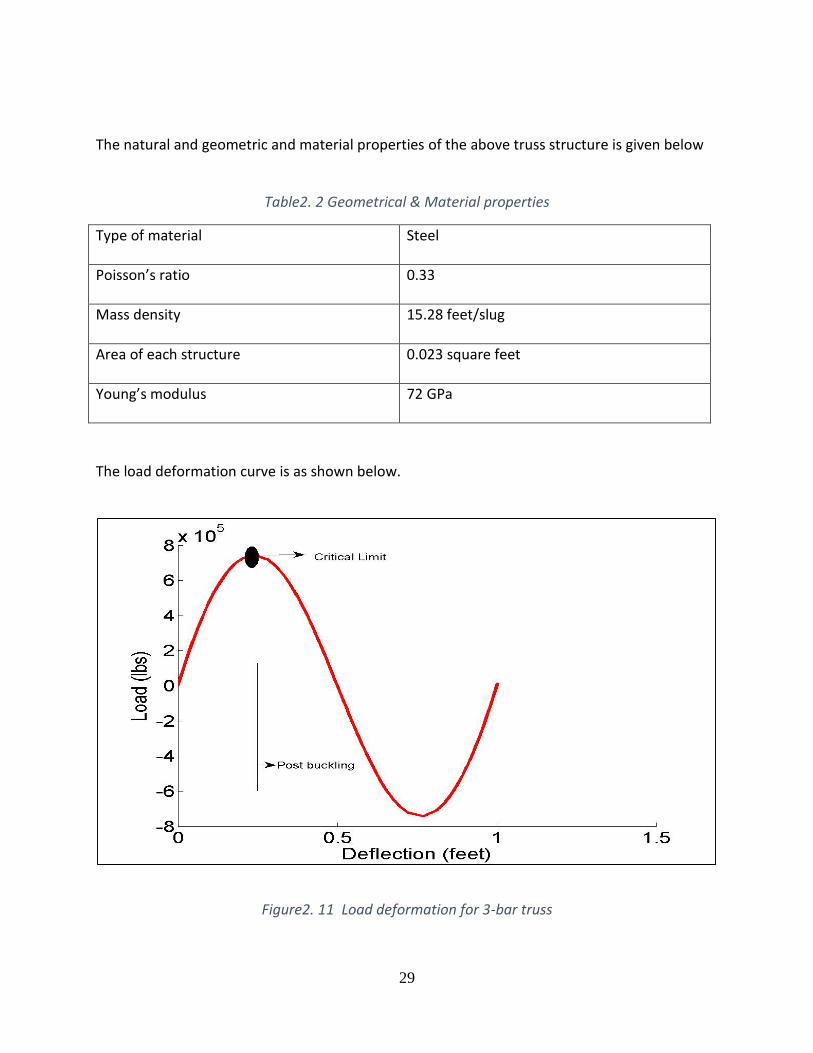
The load deformation curve is as shown below.
Figure2. 11 Load deformation for 3-bar truss
30
The critical load is the load corresponding to the situation in which a perturbation of the
deformation state does not disturb the equilibrium between the external and internal forces. In
case of a truss member, the actual compressive stress at the point of failure is less than the
ultimate compressive stresses that the material is capable of withstanding. As an applied load
increases, it will slowly but steadily become large enough for the member to become unstable
and buckles. In the post buckling section as shown in the figure above, if the load is further
increased, there will be significant and unpredictable deformation. If the member is a part of a
larger assembly, any load beyond the buckling load will cause the member to buckle and
redistribute the load within the structure. For a hinged bar, Euler formula for estimation of
buckling load is given by:
Fcr = π2 ∗ E ∗ Imin (2.10)
E denotes the modulus of elasticity.
Imin refers to the minimal moment of inertia.
L refers to the buckling length of the structure.
Nonlinear post buckling analysis with the effect of plastic deformation the yield transforms the
stable post buckling behavior into unstable because after the yield point, any increase in
deformation causes a decrease of corresponding load. Since the post buckling behavior can
become unstable when the elasto-plastic deformations take place, it becomes extremely
important to investigate the influence of imperfections on loading. These imperfections may be
indifferent loading, indifferent area of cross section etc.
31
CHAPTER 3
METHODOLGY
3.1 Concept generation
The governing equation for any highly flexible structure can be given in Finite element
notations as: [M]{q̈} + [C]{q̇} + [K]{q} = {R} (3.1)
Where {q} is a N*1 displacement vector; {R} is a N*1 force vector caused by external loads; and
[M], [C] and [K} are N*N mass, damping and stiffness matrices respectively. For any static
problem, {q̈}={q̇}=0, and hence equation (3.1) reduces to [K] {q} = {R} (3.2)
Linear analysis is based on the assumptions that the deformed structure returns to its original
form and the changes in shape is small and so is the strain. Also the material properties are
considered to remain constant and hence the loading direction or magnitude does not change.
Hence equation (3.2) has a linear relationship or in other words the matrix [K] largely remains
unchanged and so it doesn’t account for the above criteria. So all linear models assume that the
displacement varies linearly with load and hence linear analysis has a major setback and isn’t
the most accurate of all the analysis. Hence to overcome all these setbacks Non-Linear analysis
should be used.
Our study mainly deals with Non-Linear analysis of structures since highly flexible structures are
designed to undergo large elastic displacements and rotations without plastic deformation
under normal operations. Since large rotations change directional stiffness and mass inertias of
a structure, the analysis of such structures cannot be attributed to linear analysis.
32
Non-Linear analysis accounts for the change in geometric properties since the stiffness matrix
changes. In other words, the matrix [K] in equation (3.2) changes and the structure may not
return to the original form or may be permanently deformed. Non-Linear analysis also accounts
for the material properties of the material, this means that the material properties can change
along the course of deformation. It also supports changes in load direction and constraint
location. There are various approaches to Non-Linear analysis, the most commonly used one
though would be the Newton Raphson method which illustrates the linearized incremental of
equation (3.2) which leads to a different tangent stiffness matrix [𝐾]̂ which is called a tangent
stiffness matrix.
3.2 Newton Raphson method
The Newton Raphson method is highly effective numerical computing method for finding
successively better approximations of roots of a real valued function. Like any other differential
calculus methods, the Newton Raphson is based on the simple idea of linear approximation.
The iterative process follows a set of guidelines to approximate one root, considering the
function, its derivative and an initial value. It can be well described by a figure as shown below;
33
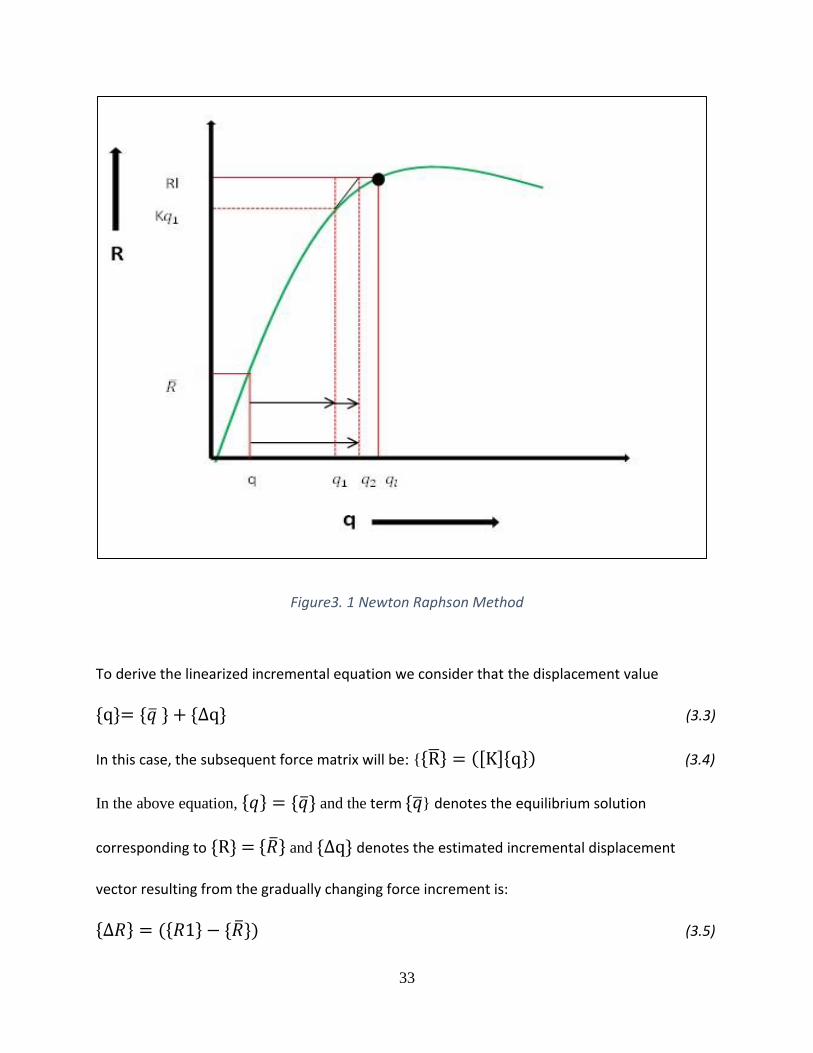
Figure3. 1 Newton Raphson Method
To derive the linearized incremental equation we consider that the displacement value
{q}= {�̅� } + {∆q} (3.3)
In this case, the subsequent force matrix will be: {{R̅} = ([K]{q}) (3.4)
In the above equation, {𝑞} = {�̅�} and the term {�̅�} denotes the equilibrium solution
corresponding to {R} = {�̅�} and {∆q} denotes the estimated incremental displacement
vector resulting from the gradually changing force increment is:
{∆𝑅} = ({𝑅1} − {�̅�}) (3.5)
34
When the above equation is expanded in Taylor’s series and higher order terms are neglected,
we obtain {R} = {R}1 = ([K]{q} + {∂Kijqj
∂qk ∆qk}) (3.6)
In the above equation, {𝑞} = {�̅�} and hence this will simplify to:
([K]{q} + {∂Kijqj
∂qk ∆q}) (3. 7)
In the above equation repeated indices means summations and so the final equation can be
written as [K̂]{∆q} = {∆R} (3.8)
In equation (3.8), [K̂] = ∂Kijqj
∂qk at {q} ={�̅�} (3.9)
So the term [K̂] in equation (3.9) is called the Tangent Stiffness matrix.
For linear problems, [�̂�] = [K], but for non-linear problems [K̂] signifies the tangent stiffness
along the direction of corresponding displacement when this displacement changes by an
infinitesimal amount.
3.3 Finite element analysis
One of the methods used for structural analysis is the Finite element analysis or the Finite
element modelling. Finite element method breaks the structure into discrete points more
generally called as nodes. After this, appropriate numerical techniques can be used to
approximate boundary value problems for partial differential equations. Since an arbitrary
point in an element can be interpolated using the low-order polynomials and deformation of its
surrounding nodes, partial differential equations are converted into ordinary differential
35
equations. The finite element computer aided software can predict deformation, vibration,
heat flow, fluid flow and many other physical effects. Finite element connects many simple
element equations over small subdomains or finite domains to approximate a more larger and
complex domain.
3.3.1 Finite element software packages
There are many intriguing finite element software packages in use today. Many offer open
source package for numerical simulation in structural mechanics. The input to the software is
the dimensions of the structure, constraints, the inherent properties of the structure and the
magnitude and direction of load acting on it. The output normally would be a combination of
numerical values and pertinent deformed configurations which provide a visual reference as to
how the structure deforms. Abaqus, Autodesk, SolidWorks, Hyperworks products and Matlab
are some of the Finite element analysis packages. For our purpose which include enormous
numerical computation and calculation and for the ease of programming, Matlab was a feasible
option. Its interactive environment for numerical computation, visualization and programming
makes it a very sought after package for numerical computing.
3.3.2 Element discretization
The division of structure into a set of elements is called discretization or mesh generation. This
is considered to be one of the most crucial phases in finite element modeling since the accuracy
of the solution largely depends on the quality of meshing. The shape of the structure plays a big
36
part to decide the quality of meshing and hence a triangle is considered to have the simplest
geometric shape followed by rectangle. Generally the elements that are selected should
characterize the governing equations of the problem and the accuracy is dependent on the
number, shape and type of elements used. Discretization or meshing is not always a
straightforward process and can get complicated and hence a sound knowledge of finite
element modeling is always necessary. For example; the density of elements should be such
that the regions of large gradients of the solution are adequately modeled, in other words
higher order elements should be used in the regions of large gradients and mesh refinements
should vary gradually from high-density regions to low-density regions.
3.3.3 Element nodes
Each element possesses a set of distinguished points called as nodal points or nodes. Nodes
serve two purposes; to define the element geometry and also to define the degrees of
freedom. Nodes are located at the end points of the elements or in other words, they are the
connecting points between elements. The elemental nodes are always one more than the
number of discretized elements. More the number of nodes, better the accuracy of the result.
3.3.4 Element geometry
The position of the geometrical nodal points defines the element geometry. Many of the
elements have fairly simple geometry and are easy to define. Curved segments and straight
beams like the one shown above are one-dimensional in nature whereas triangular trusses are
37
two dimensional depending on the number of members present in it. Other members like
tetrahedral are the most commonly used three dimensional structures.
3.3.5 Nodal forces
The R matrix in the universal governing equation (3.1) represents the nodal forces combined in
a matrix form. There is always a set of nodal force in a one-to-one correspondence with the
degrees of freedom. In mechanical elements the correspondence is established through energy
arguments. The nodal displacements though are highly restrictive to the type of material used.
The tangent stiffness matrix constantly keeps updating as the force is increased and the change
of displacement due to increase in force.
3.4 Deformation analysis of beams
A deformation is primarily a process of change in shape and size of an object. The cause for
deformation may be to an applied external force or due to change in temperature. Deformation
due to forces can be attributed to tensile, compressive, shear, bending or twisting forces. When
the force is applied, inter-molecular forces from the structure arise to oppose the forces. If the
magnitude of the applied force is not too large, the inter-molecular forces may be sufficient to
resist the applied force allowing the structure to assume a new equilibrium but if the applied
force is very large, the structure may undergo a permanent deformation or the structure may
even fail. In finite element analysis the structure is discretized into elements which are
connected by nodes.
38
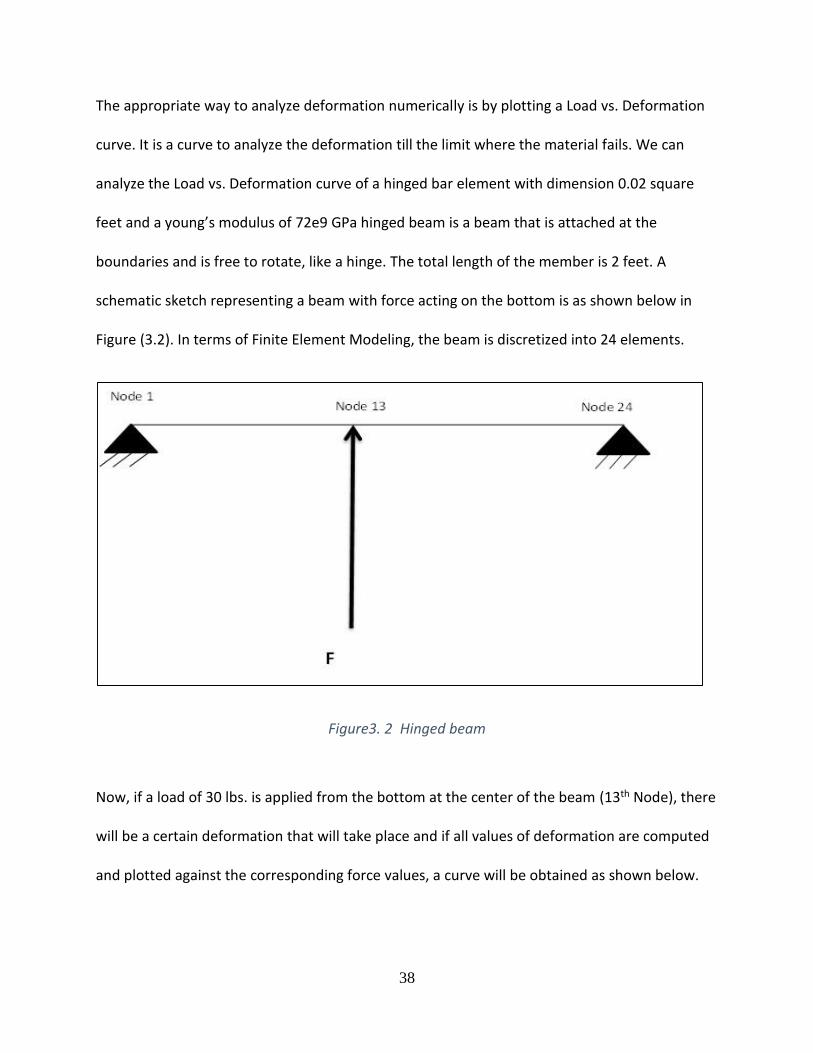
The appropriate way to analyze deformation numerically is by plotting a Load vs. Deformation
curve. It is a curve to analyze the deformation till the limit where the material fails. We can
analyze the Load vs. Deformation curve of a hinged bar element with dimension 0.02 square
feet and a young’s modulus of 72e9 GPa hinged beam is a beam that is attached at the
boundaries and is free to rotate, like a hinge. The total length of the member is 2 feet. A
schematic sketch representing a beam with force acting on the bottom is as shown below in
Figure (3.2). In terms of Finite Element Modeling, the beam is discretized into 24 elements.
Figure3. 2 Hinged beam
Now, if a load of 30 lbs. is applied from the bottom at the center of the beam (13th Node), there
will be a certain deformation that will take place and if all values of deformation are computed
and plotted against the corresponding force values, a curve will be obtained as shown below.
39
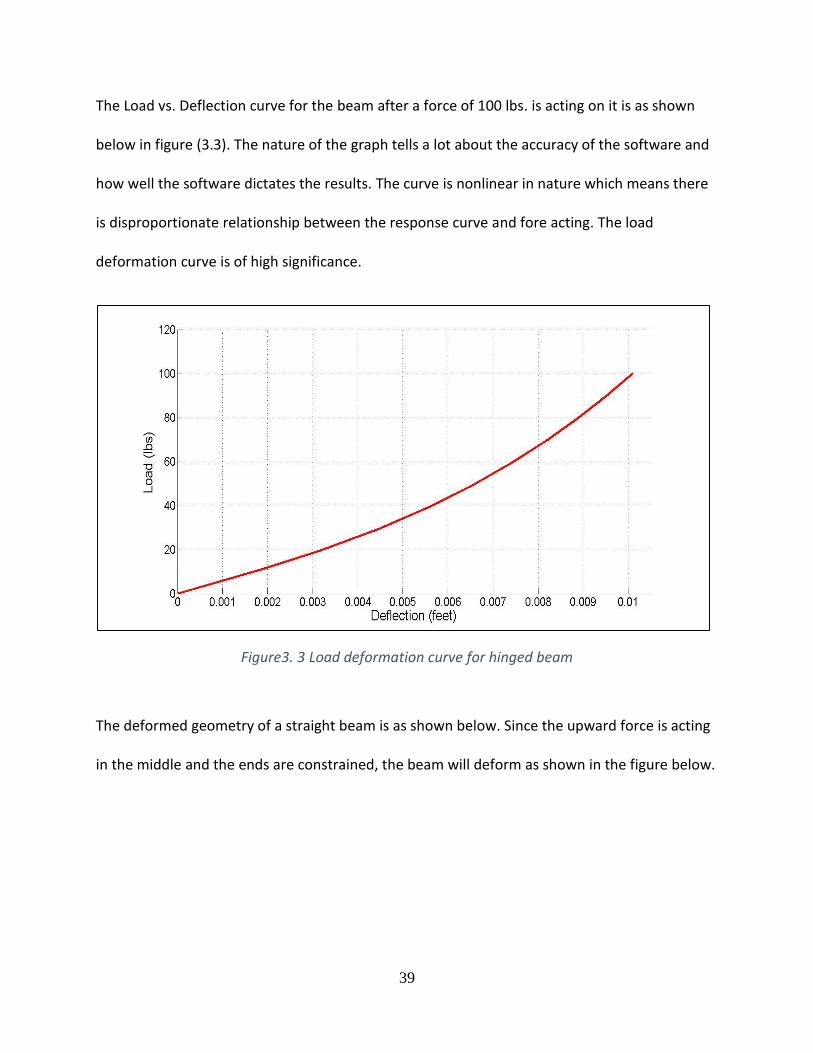
The Load vs. Deflection curve for the beam after a force of 100 lbs. is acting on it is as shown
below in figure (3.3). The nature of the graph tells a lot about the accuracy of the software and
how well the software dictates the results. The curve is nonlinear in nature which means there
is disproportionate relationship between the response curve and fore acting. The load
deformation curve is of high significance.
Figure3. 3 Load deformation curve for hinged beam
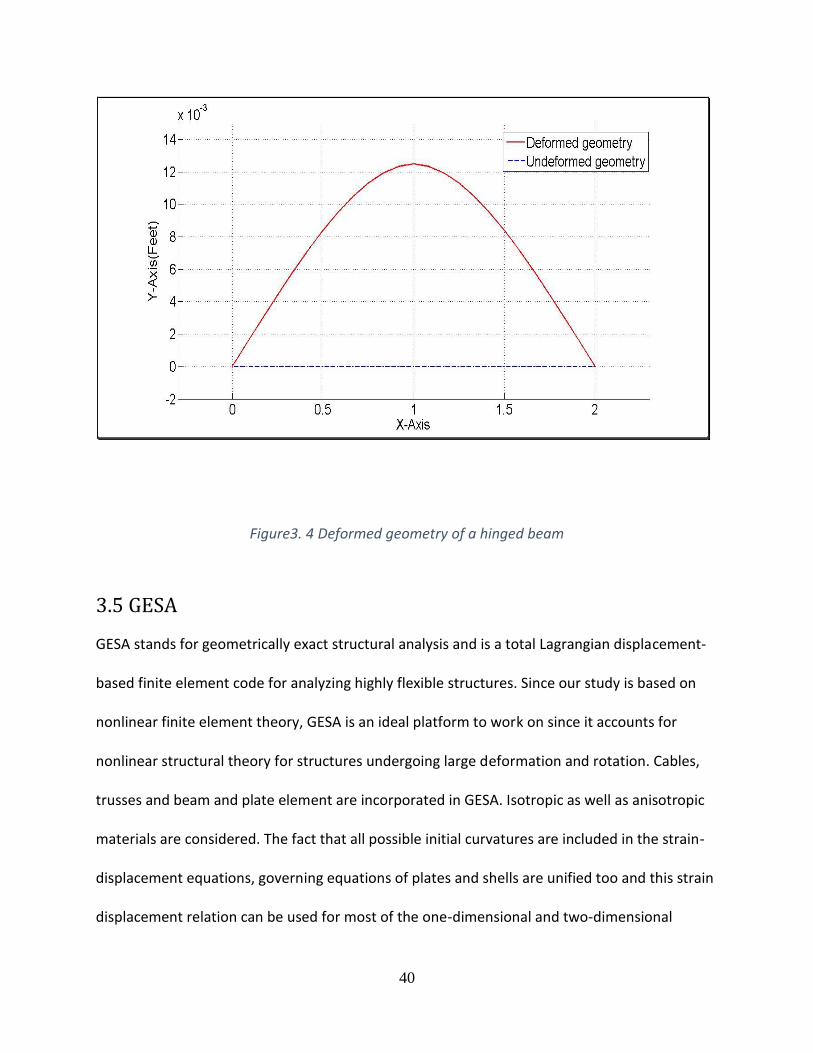
The deformed geometry of a straight beam is as shown below. Since the upward force is acting
in the middle and the ends are constrained, the beam will deform as shown in the figure below.
40
Figure3. 4 Deformed geometry of a hinged beam
3.5 GESA
GESA stands for geometrically exact structural analysis and is a total Lagrangian displacement-
based finite element code for analyzing highly flexible structures. Since our study is based on
nonlinear finite element theory, GESA is an ideal platform to work on since it accounts for
nonlinear structural theory for structures undergoing large deformation and rotation. Cables,
trusses and beam and plate element are incorporated in GESA. Isotropic as well as anisotropic
materials are considered. The fact that all possible initial curvatures are included in the strain-
displacement equations, governing equations of plates and shells are unified too and this strain
displacement relation can be used for most of the one-dimensional and two-dimensional
41
structure which include our study on beams and trusses. Although for two-dimensional
structures, only global transitional degrees of freedom and their derivatives are used in the
strain displacement relation and no independent global rotational degree of freedom are used.
For the purpose of research work, GESA for Nonlinear structural analysis is used. As like the
linear analysis where there is a linear relationship between the structural response and the
magnitude of the load, the nonlinear analysis deals with disproportionate relationship between
the response curve and the magnitude of loading. A finite element analysis is called static if the
parameters are not variably in line with change in time and hence any displacement,
acceleration parameter is not accounted for.
42
Chapter 4
Results
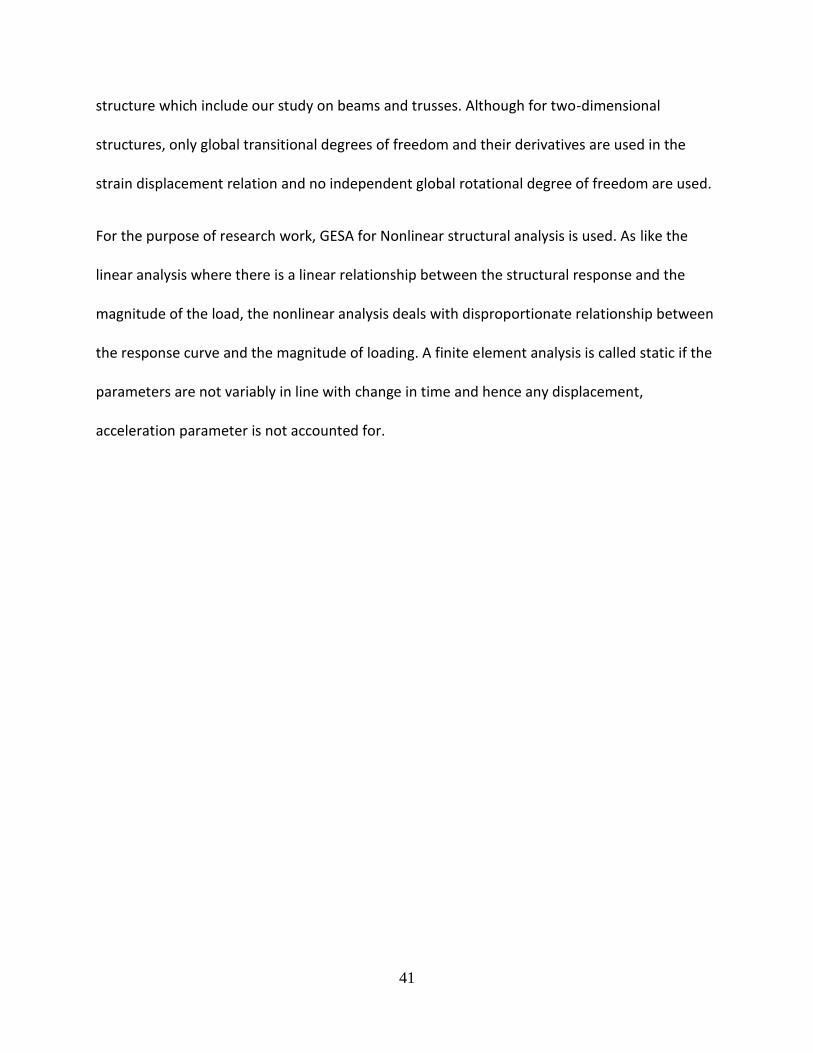
4.1 Truss structure equivalence to a spring
Trusses have the unique property which in a way makes them mechanically equivalent to a
spring since they have no stiffness against the applied loads except for those acting along the
axis. If a spring is considered whose spring constant is denoted by k has one hinged and the
other end slides down a frictionless vertical wall in response to a downward force. The symbol
α denotes the angle between the spring and the horizontal direction in the absence of the
downward force. The change in angle during the downward displacement of the roller is α′.
Figure4. 1 Experimental setup of a spring
43
The equation for the force applied can be given by(K ∗ ∇ ∗ sin α′) − F = 0 (4.1)
Where ∇ refers to the change in length of the spring
The change in angle α′ is proportional to the change in length of the spring and hence the
change in length can be given by ∇= [a/cos (α)-a/cos (α′)]; which simplifies to,
∇ = a*[1/cos (α)-1/cos (α′)] (4.2)
Substituting the above equation in equation (4.1); we get force:
F = K* a*[1/cos (α)-1/cos (α′)]* sinα′, which simplifies to
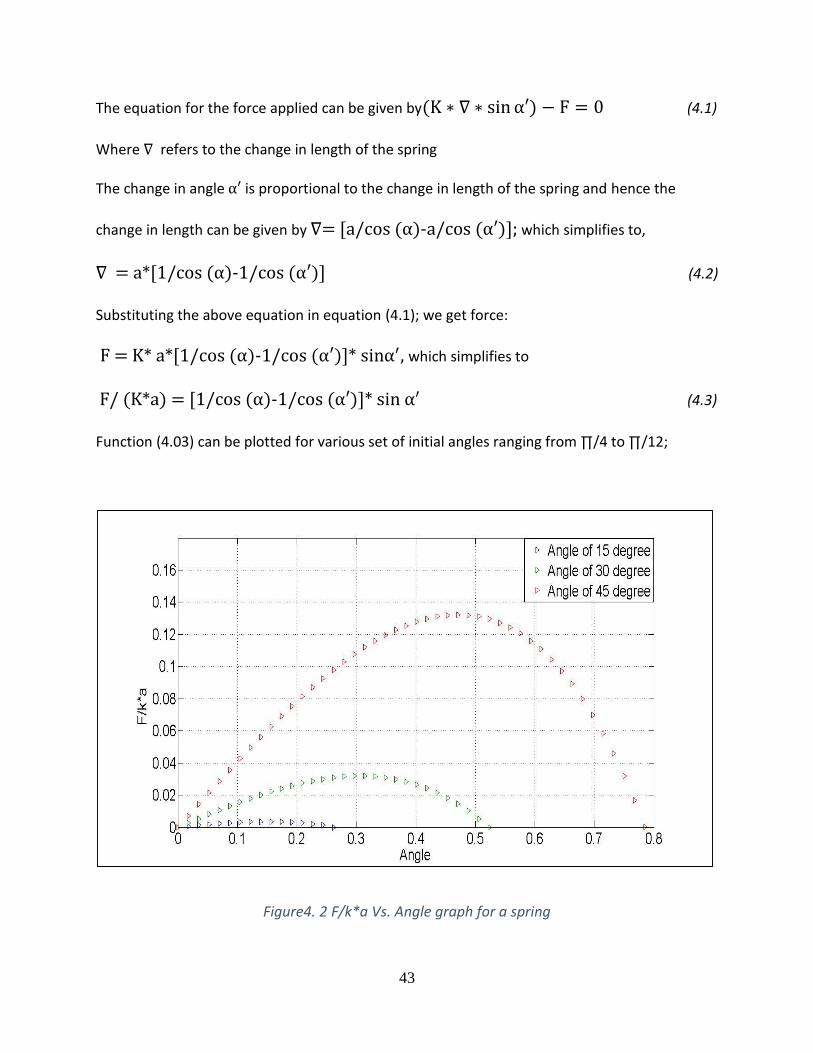
F/ (K*a) = [1/cos (α)-1/cos (α′)]* sin α′ (4.3)
Function (4.03) can be plotted for various set of initial angles ranging from ∏/4 to ∏/12;
Figure4. 2 F/k*a Vs. Angle graph for a spring
44
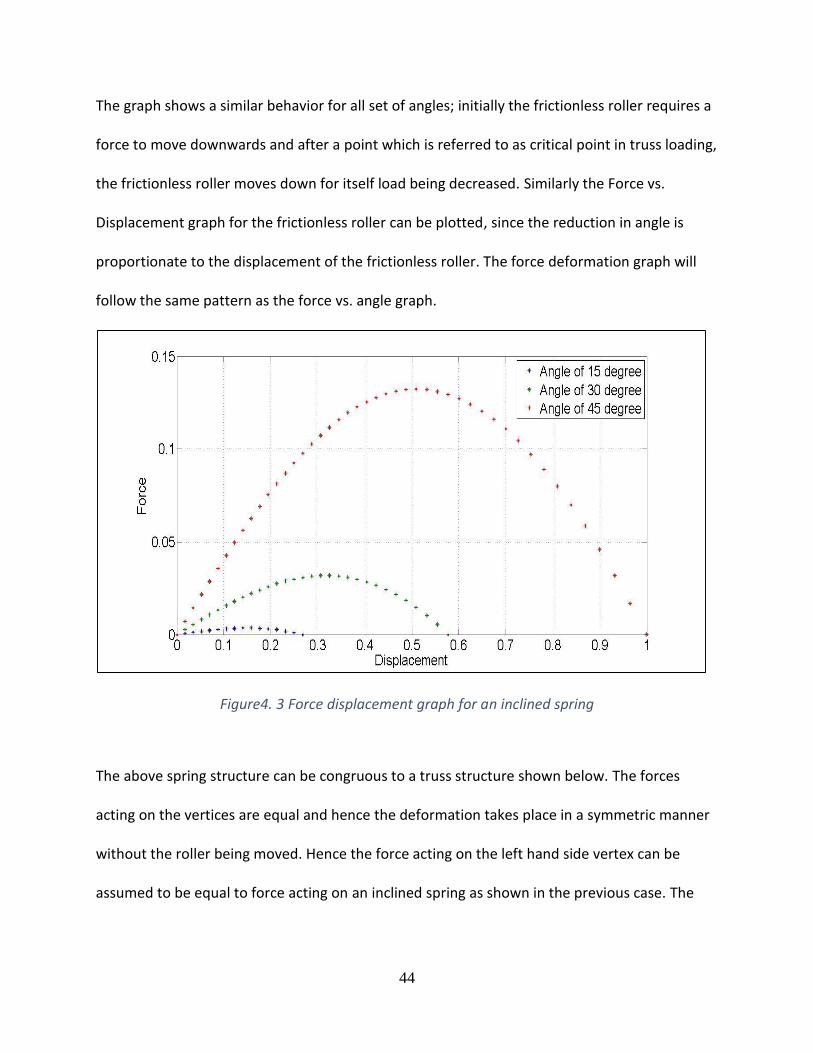
The graph shows a similar behavior for all set of angles; initially the frictionless roller requires a
force to move downwards and after a point which is referred to as critical point in truss loading,
the frictionless roller moves down for itself load being decreased. Similarly the Force vs.
Displacement graph for the frictionless roller can be plotted, since the reduction in angle is
proportionate to the displacement of the frictionless roller. The force deformation graph will
follow the same pattern as the force vs. angle graph.
Figure4. 3 Force displacement graph for an inclined spring
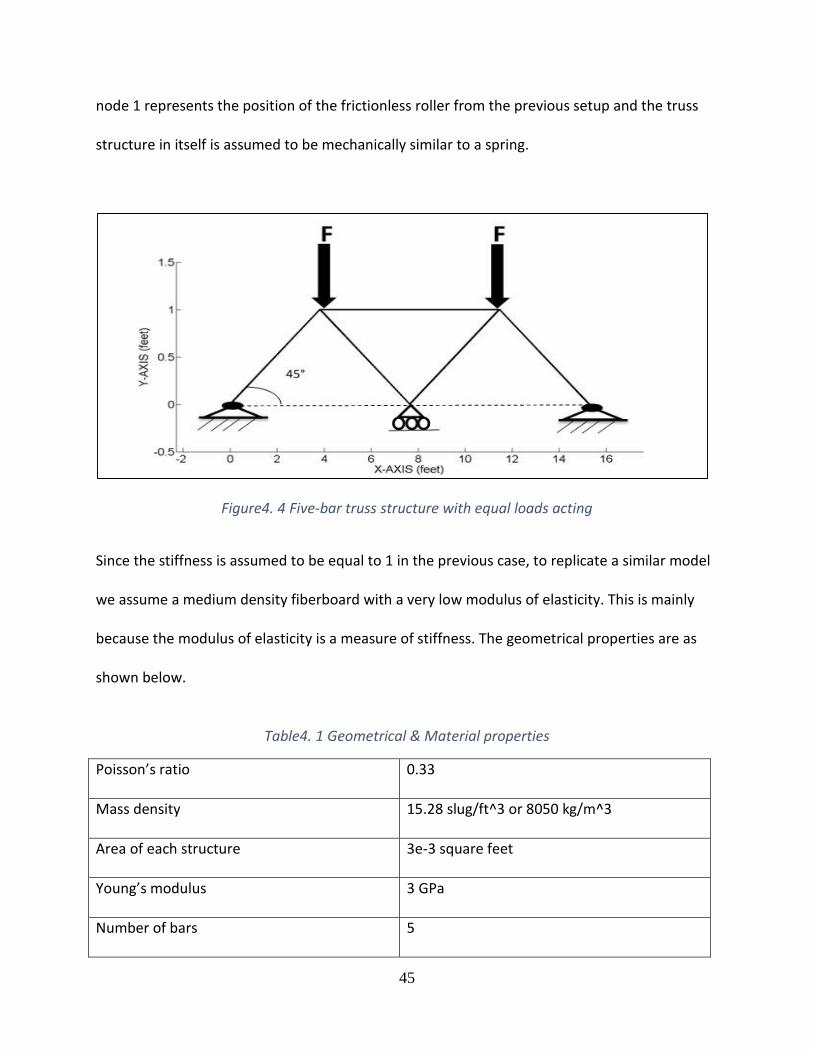
The above spring structure can be congruous to a truss structure shown below. The forces
acting on the vertices are equal and hence the deformation takes place in a symmetric manner
without the roller being moved. Hence the force acting on the left hand side vertex can be
assumed to be equal to force acting on an inclined spring as shown in the previous case. The
45
node 1 represents the position of the frictionless roller from the previous setup and the truss
structure in itself is assumed to be mechanically similar to a spring.
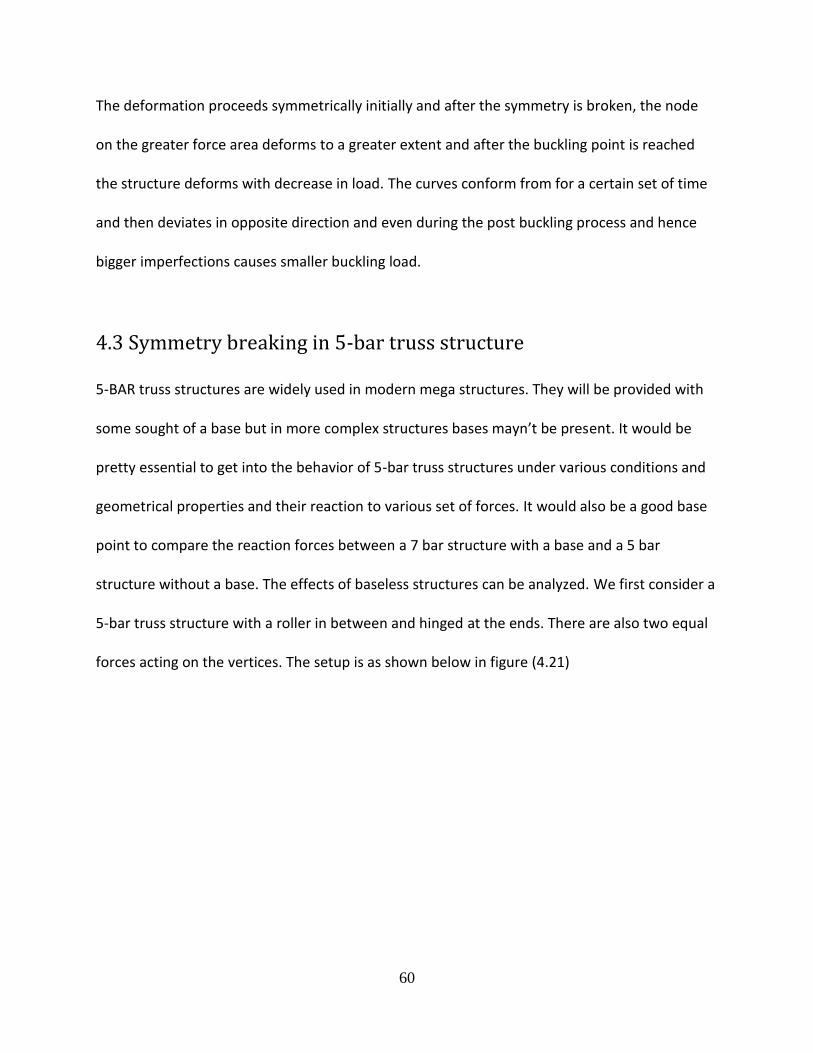
Figure4. 4 Five-bar truss structure with equal loads acting
Since the stiffness is assumed to be equal to 1 in the previous case, to replicate a similar model
we assume a medium density fiberboard with a very low modulus of elasticity. This is mainly
because the modulus of elasticity is a measure of stiffness. The geometrical properties are as
shown below.
Table4. 1 Geometrical & Material properties
Poisson’s ratio 0.33
Mass density 15.28 slug/ft^3 or 8050 kg/m^3
Area of each structure 3e-3 square feet
Young’s modulus 3 GPa
Number of bars 5
46
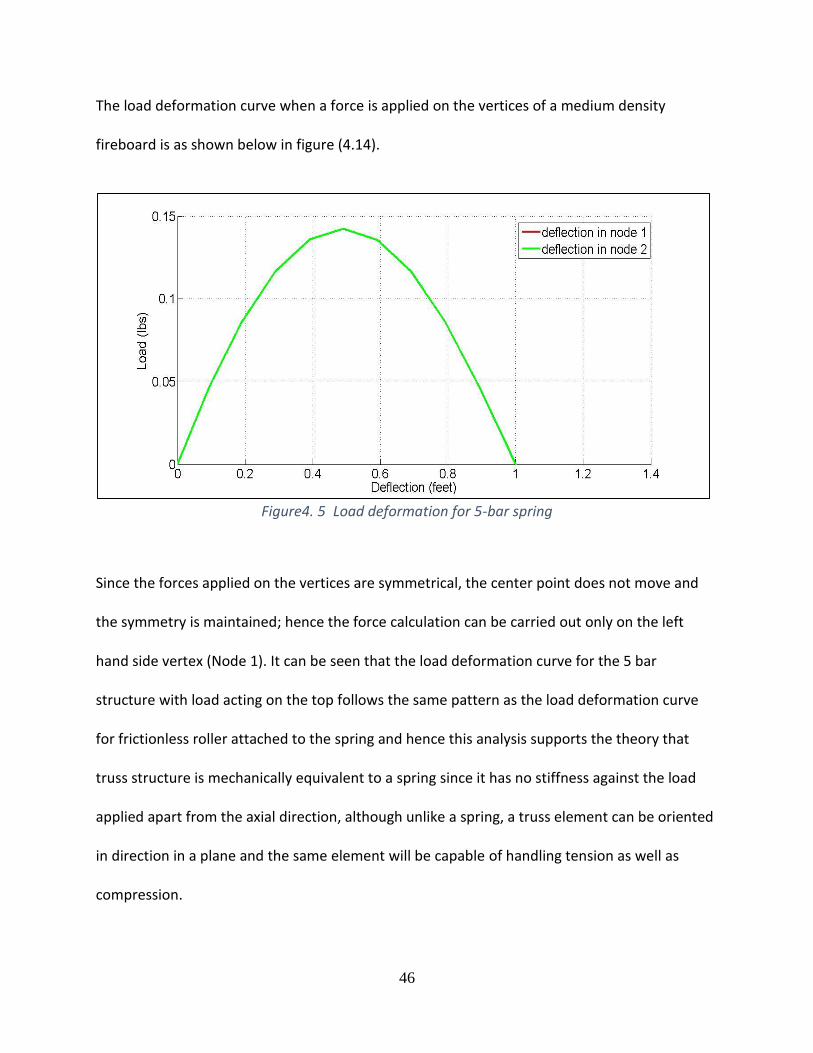
The load deformation curve when a force is applied on the vertices of a medium density
fireboard is as shown below in figure (4.14).
Figure4. 5 Load deformation for 5-bar spring
Since the forces applied on the vertices are symmetrical, the center point does not move and
the symmetry is maintained; hence the force calculation can be carried out only on the left
hand side vertex (Node 1). It can be seen that the load deformation curve for the 5 bar
structure with load acting on the top follows the same pattern as the load deformation curve
for frictionless roller attached to the spring and hence this analysis supports the theory that
truss structure is mechanically equivalent to a spring since it has no stiffness against the load
applied apart from the axial direction, although unlike a spring, a truss element can be oriented
in direction in a plane and the same element will be capable of handling tension as well as
compression.
47
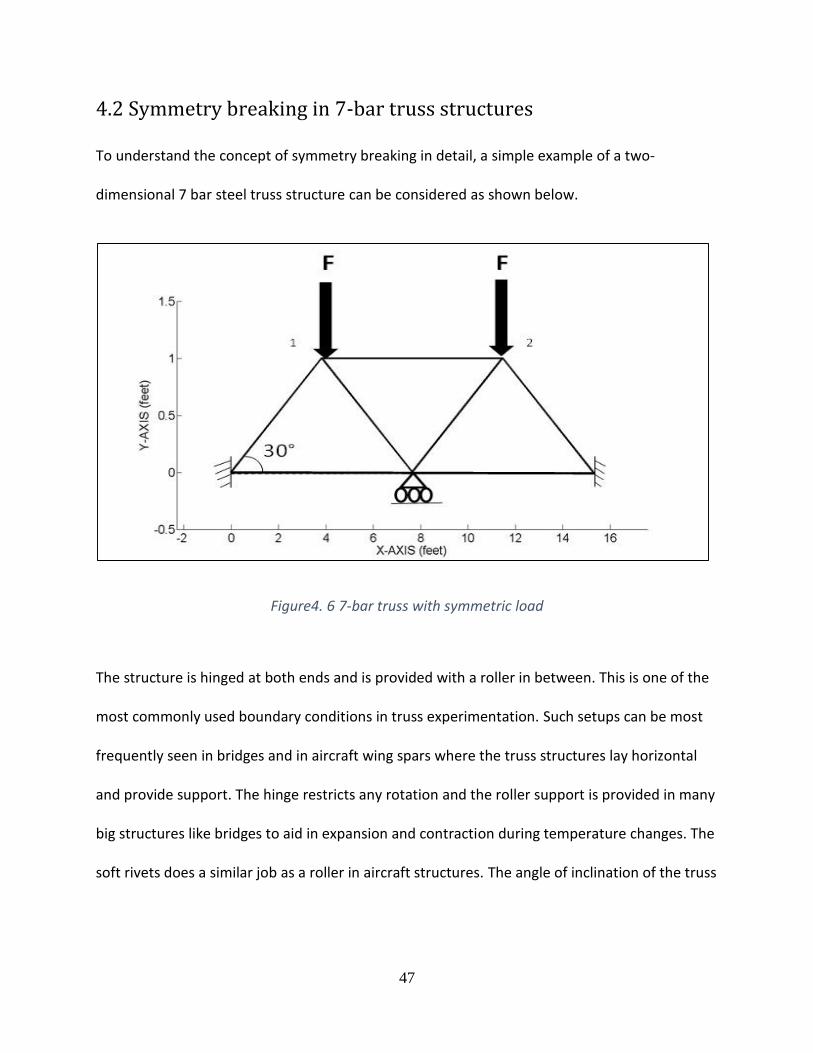
4.2 Symmetry breaking in 7-bar truss structures
To understand the concept of symmetry breaking in detail, a simple example of a two-
dimensional 7 bar steel truss structure can be considered as shown below.
Figure4. 6 7-bar truss with symmetric load
The structure is hinged at both ends and is provided with a roller in between. This is one of the
most commonly used boundary conditions in truss experimentation. Such setups can be most
frequently seen in bridges and in aircraft wing spars where the truss structures lay horizontal
and provide support. The hinge restricts any rotation and the roller support is provided in many
big structures like bridges to aid in expansion and contraction during temperature changes. The
soft rivets does a similar job as a roller in aircraft structures. The angle of inclination of the truss
48
structure in our experimental analysis is 30 degree to the horizontal. There are two equal forces
of 4000 lbs. acting on the vertices i.e. node 1 and node 2.
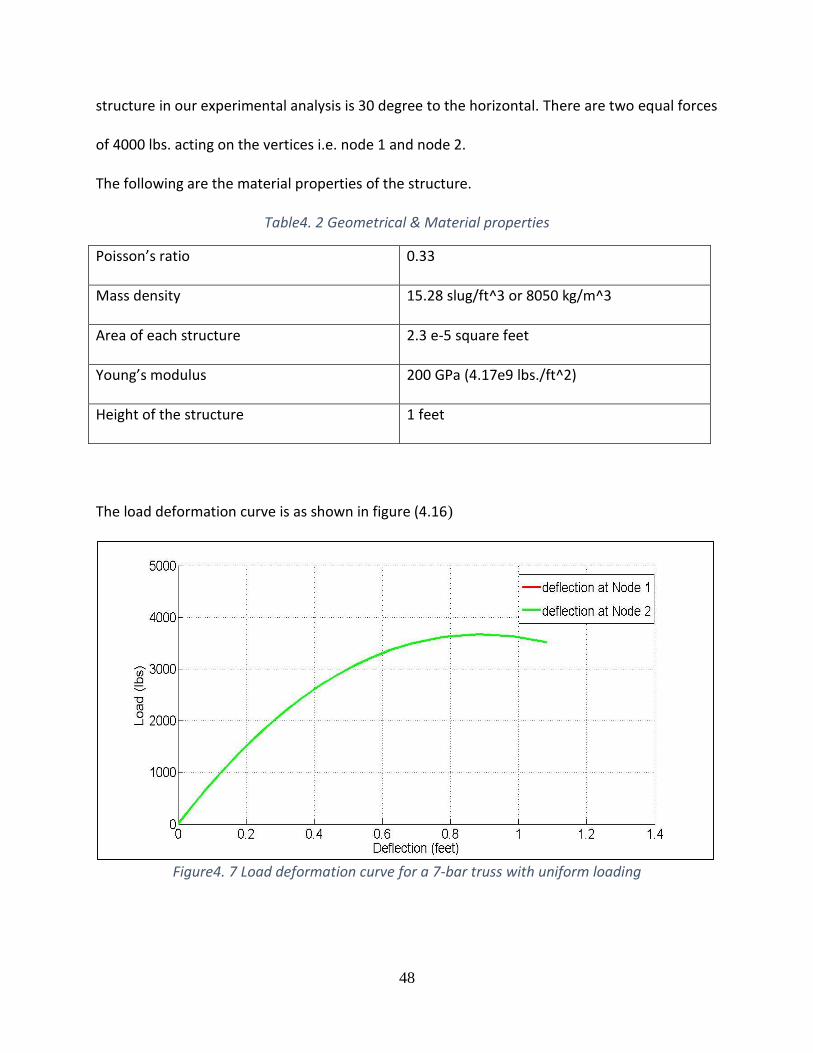
The following are the material properties of the structure.
Table4. 2 Geometrical & Material properties
Poisson’s ratio 0.33
Mass density 15.28 slug/ft^3 or 8050 kg/m^3
Area of each structure 2.3 e-5 square feet
Young’s modulus 200 GPa (4.17e9 lbs./ft^2)
Height of the structure 1 feet
The load deformation curve is as shown in figure (4.16)
Figure4. 7 Load deformation curve for a 7-bar truss with uniform loading
49
The load deformation curve for the vertices does not exhibit a branching and conforms without
deviating since the force applied on the vertices are the same and the roller in the middle does
not move .The load deformation curve proves that the symmetry is being maintained since the
two curves representing the deflection in the two nodes overlap. This means though there is a
deformation in the structure, the symmetry is still very well being maintained. The buckling
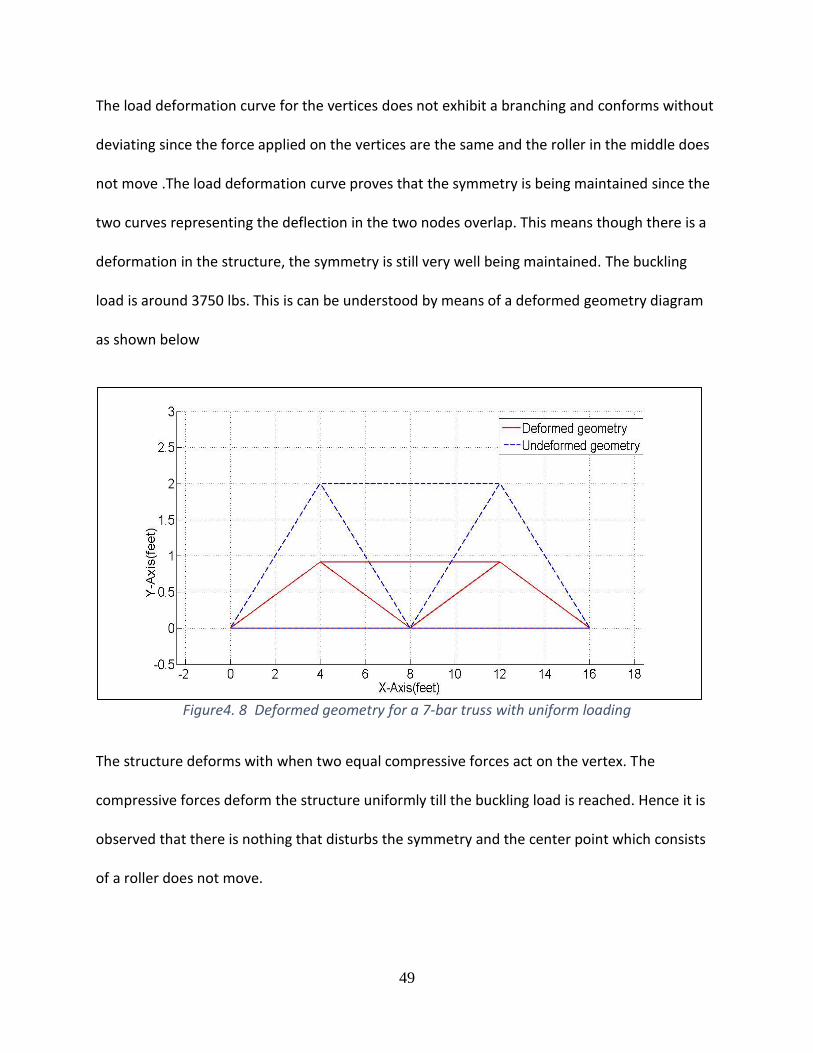
load is around 3750 lbs. This is can be understood by means of a deformed geometry diagram
as shown below
Figure4. 8 Deformed geometry for a 7-bar truss with uniform loading
The structure deforms with when two equal compressive forces act on the vertex. The
compressive forces deform the structure uniformly till the buckling load is reached. Hence it is
observed that there is nothing that disturbs the symmetry and the center point which consists
of a roller does not move.
50
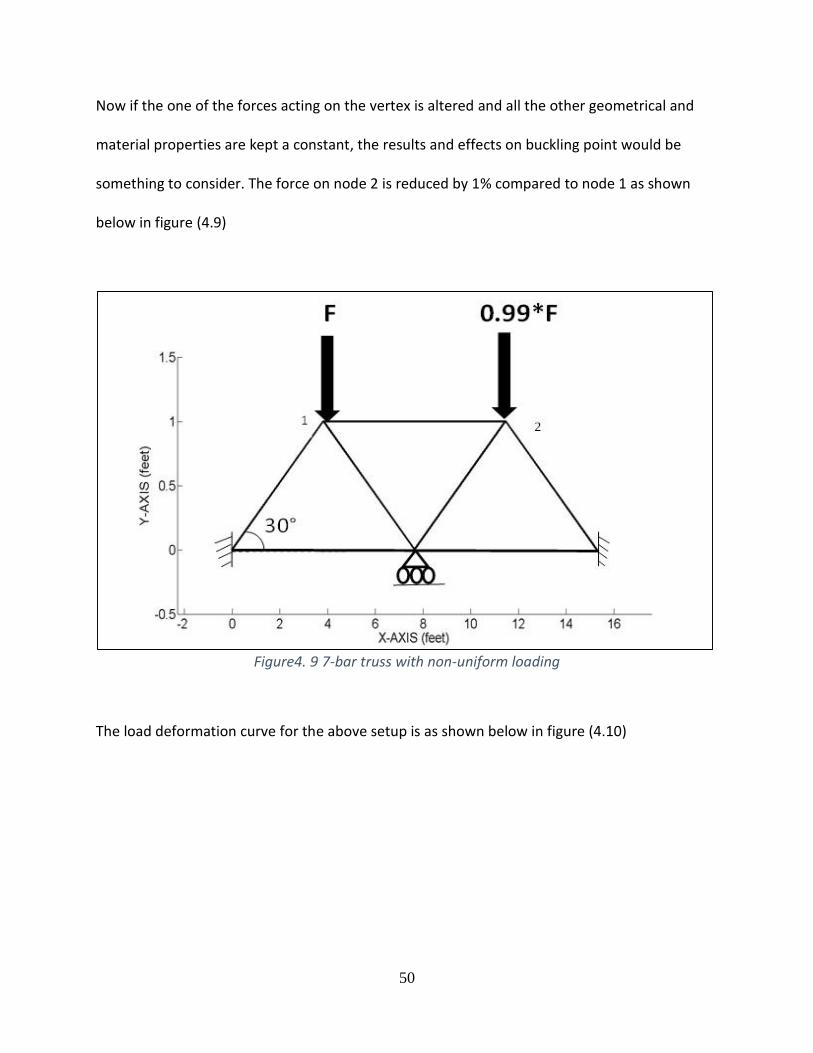
Now if the one of the forces acting on the vertex is altered and all the other geometrical and
material properties are kept a constant, the results and effects on buckling point would be
something to consider. The force on node 2 is reduced by 1% compared to node 1 as shown
below in figure (4.9)
Figure4. 9 7-bar truss with non-uniform loading
The load deformation curve for the above setup is as shown below in figure (4.10)
51
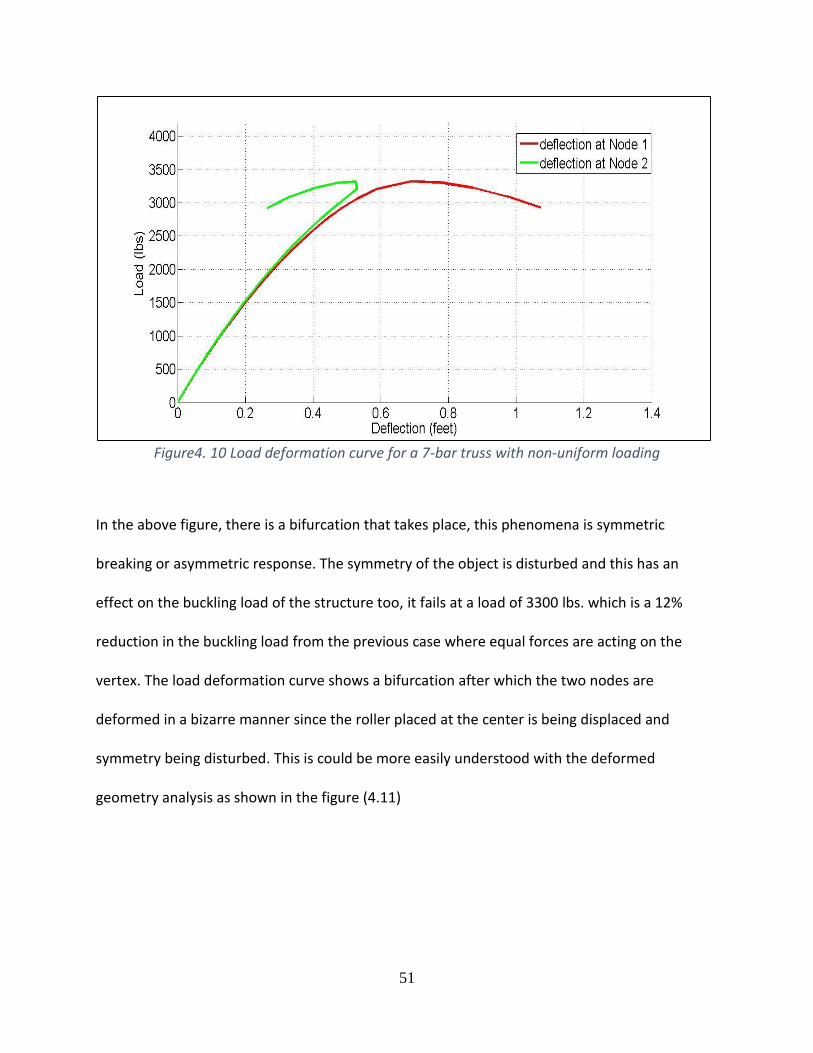
Figure4. 10 Load deformation curve for a 7-bar truss with non-uniform loading
In the above figure, there is a bifurcation that takes place, this phenomena is symmetric
breaking or asymmetric response. The symmetry of the object is disturbed and this has an
effect on the buckling load of the structure too, it fails at a load of 3300 lbs. which is a 12%
reduction in the buckling load from the previous case where equal forces are acting on the
vertex. The load deformation curve shows a bifurcation after which the two nodes are
deformed in a bizarre manner since the roller placed at the center is being displaced and
symmetry being disturbed. This is could be more easily understood with the deformed
geometry analysis as shown in the figure (4.11)
52
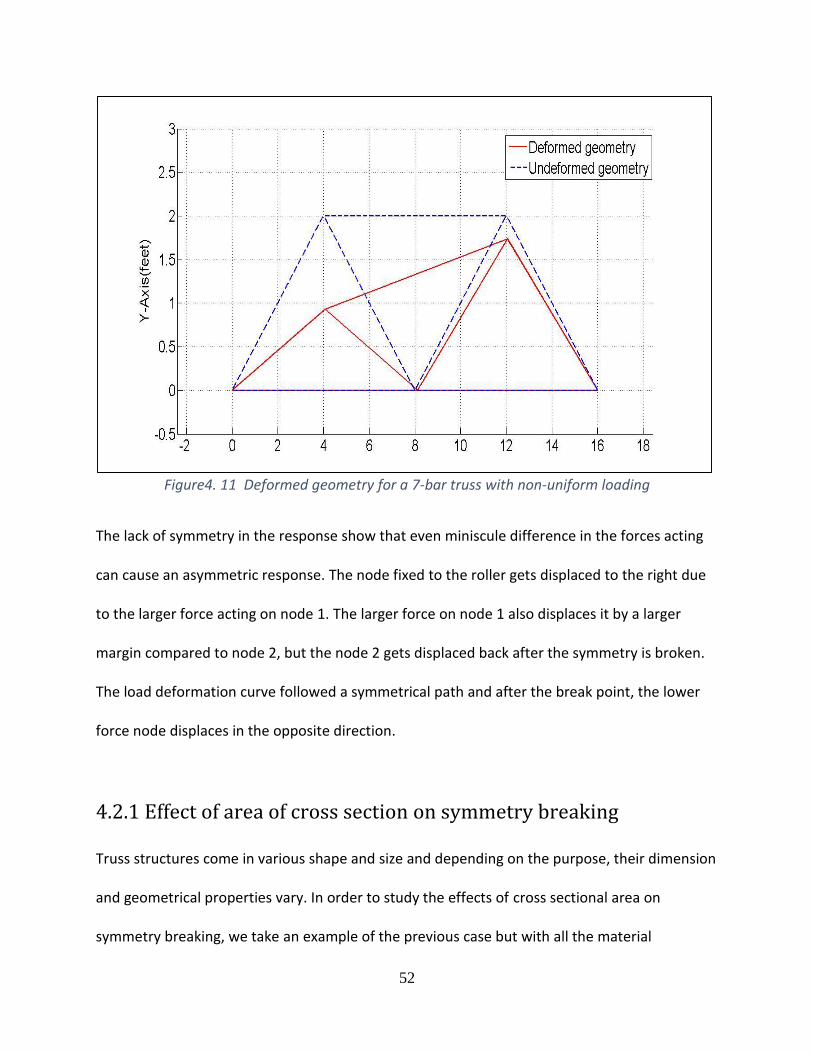
Figure4. 11 Deformed geometry for a 7-bar truss with non-uniform loading
The lack of symmetry in the response show that even miniscule difference in the forces acting
can cause an asymmetric response. The node fixed to the roller gets displaced to the right due
to the larger force acting on node 1. The larger force on node 1 also displaces it by a larger
margin compared to node 2, but the node 2 gets displaced back after the symmetry is broken.
The load deformation curve followed a symmetrical path and after the break point, the lower
force node displaces in the opposite direction.
4.2.1 Effect of area of cross section on symmetry breaking
Truss structures come in various shape and size and depending on the purpose, their dimension
and geometrical properties vary. In order to study the effects of cross sectional area on
symmetry breaking, we take an example of the previous case but with all the material
53
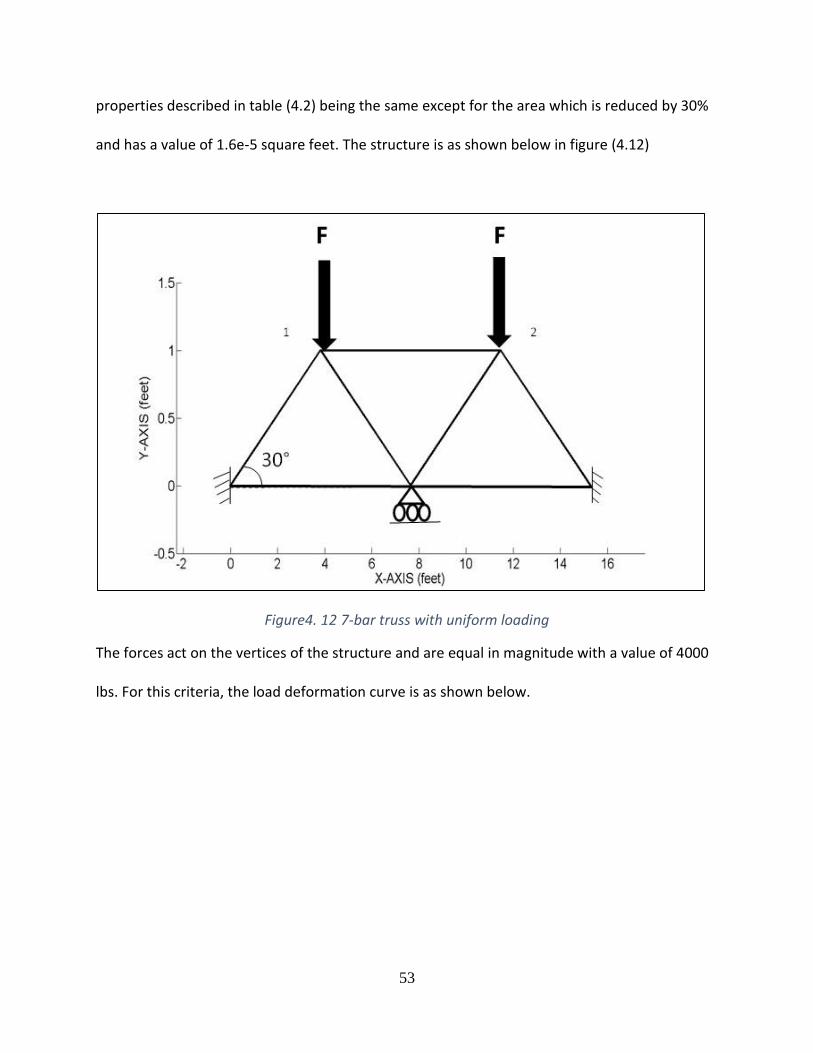
properties described in table (4.2) being the same except for the area which is reduced by 30%
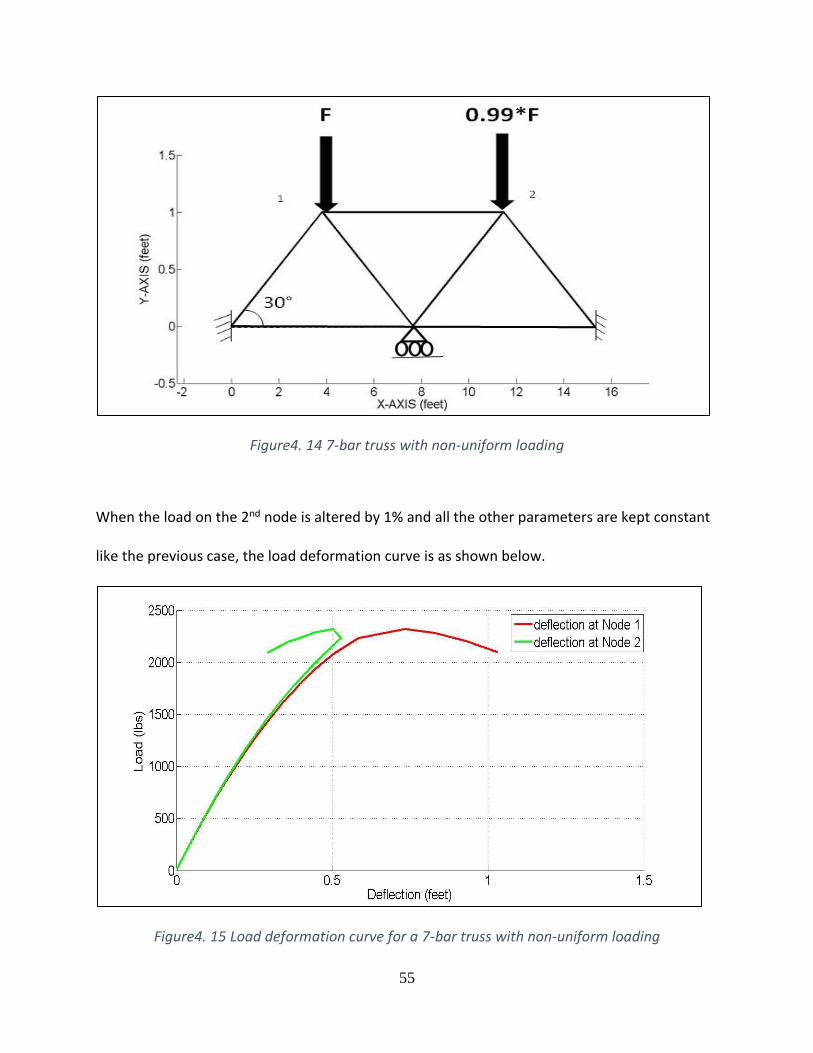
and has a value of 1.6e-5 square feet. The structure is as shown below in figure (4.12)
Figure4. 12 7-bar truss with uniform loading
The forces act on the vertices of the structure and are equal in magnitude with a value of 4000
lbs. For this criteria, the load deformation curve is as shown below.
54
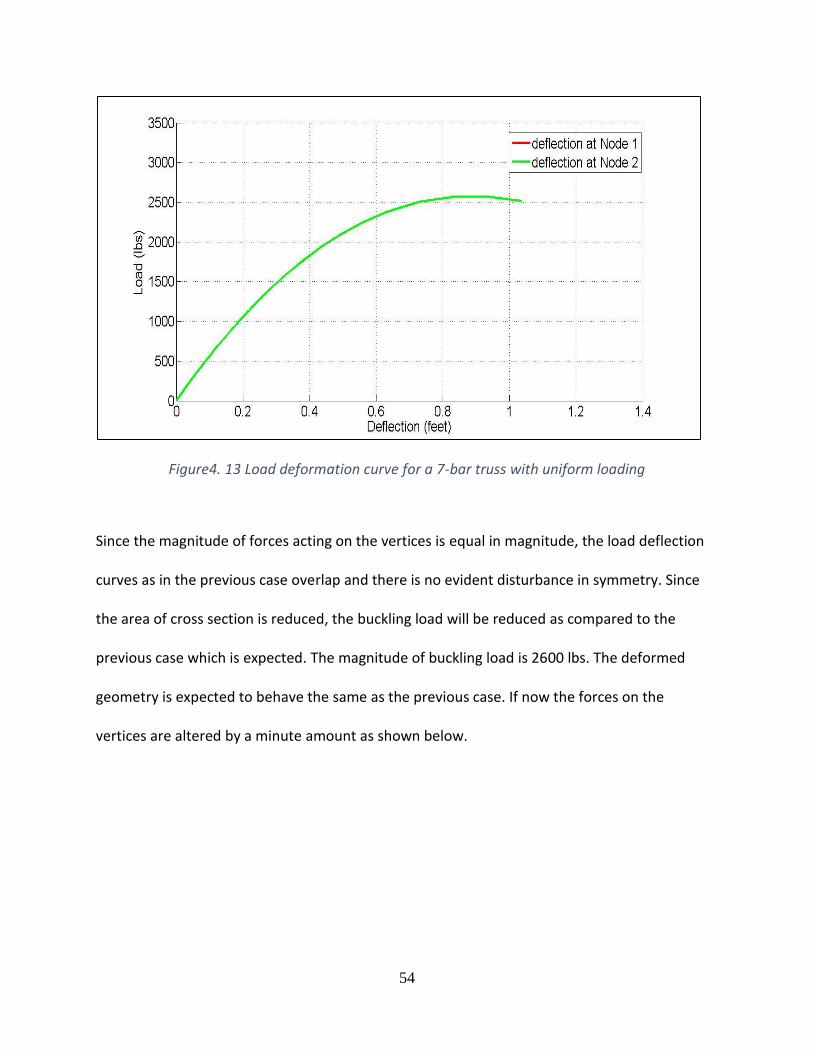
Figure4. 13 Load deformation curve for a 7-bar truss with uniform loading
Since the magnitude of forces acting on the vertices is equal in magnitude, the load deflection
curves as in the previous case overlap and there is no evident disturbance in symmetry. Since
the area of cross section is reduced, the buckling load will be reduced as compared to the
previous case which is expected. The magnitude of buckling load is 2600 lbs. The deformed
geometry is expected to behave the same as the previous case. If now the forces on the
vertices are altered by a minute amount as shown below.
55
Figure4. 14 7-bar truss with non-uniform loading
When the load on the 2nd node is altered by 1% and all the other parameters are kept constant
like the previous case, the load deformation curve is as shown below.
Figure4. 15 Load deformation curve for a 7-bar truss with non-uniform loading
56
The structure seems to fail at around 2300 lbs. which results in an approximately 12% reduction
in buckling load, hence the reduction in area doesn’t seem to effect the buckling load but it
can’t be concluded since other truss structures with different geometrical properties need to be
analyzed.
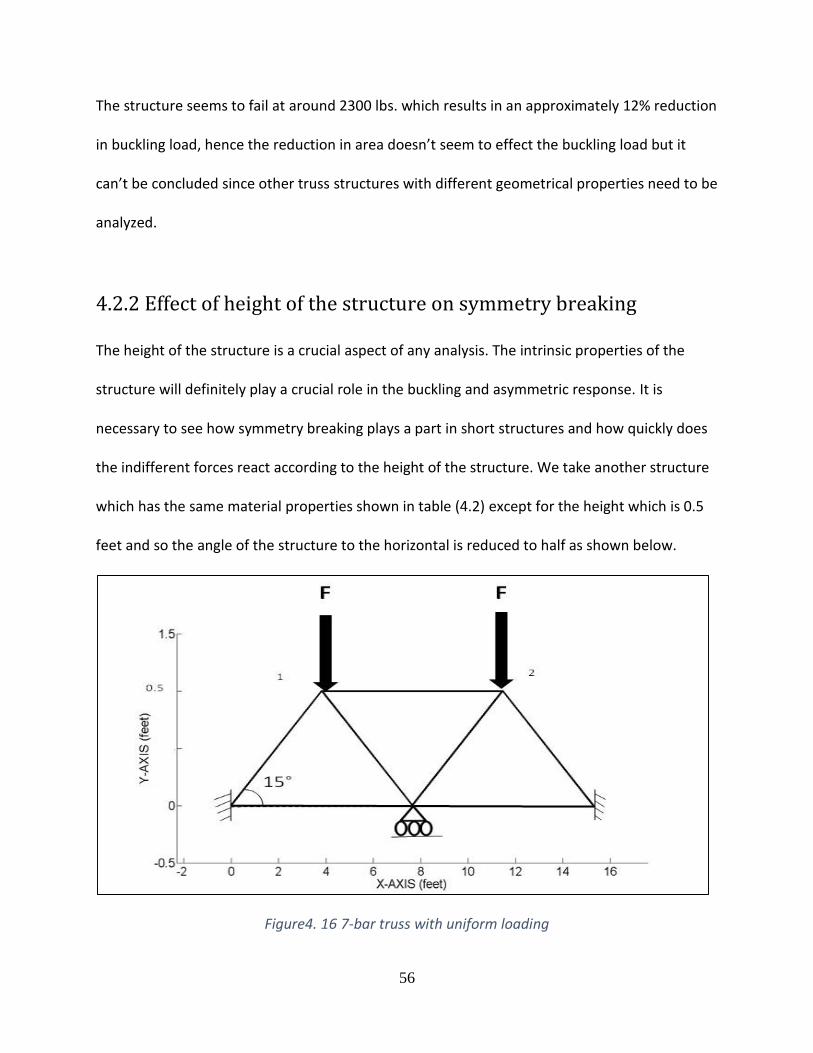
4.2.2 Effect of height of the structure on symmetry breaking
The height of the structure is a crucial aspect of any analysis. The intrinsic properties of the
structure will definitely play a crucial role in the buckling and asymmetric response. It is
necessary to see how symmetry breaking plays a part in short structures and how quickly does
the indifferent forces react according to the height of the structure. We take another structure
which has the same material properties shown in table (4.2) except for the height which is 0.5
feet and so the angle of the structure to the horizontal is reduced to half as shown below.
Figure4. 16 7-bar truss with uniform loading
57
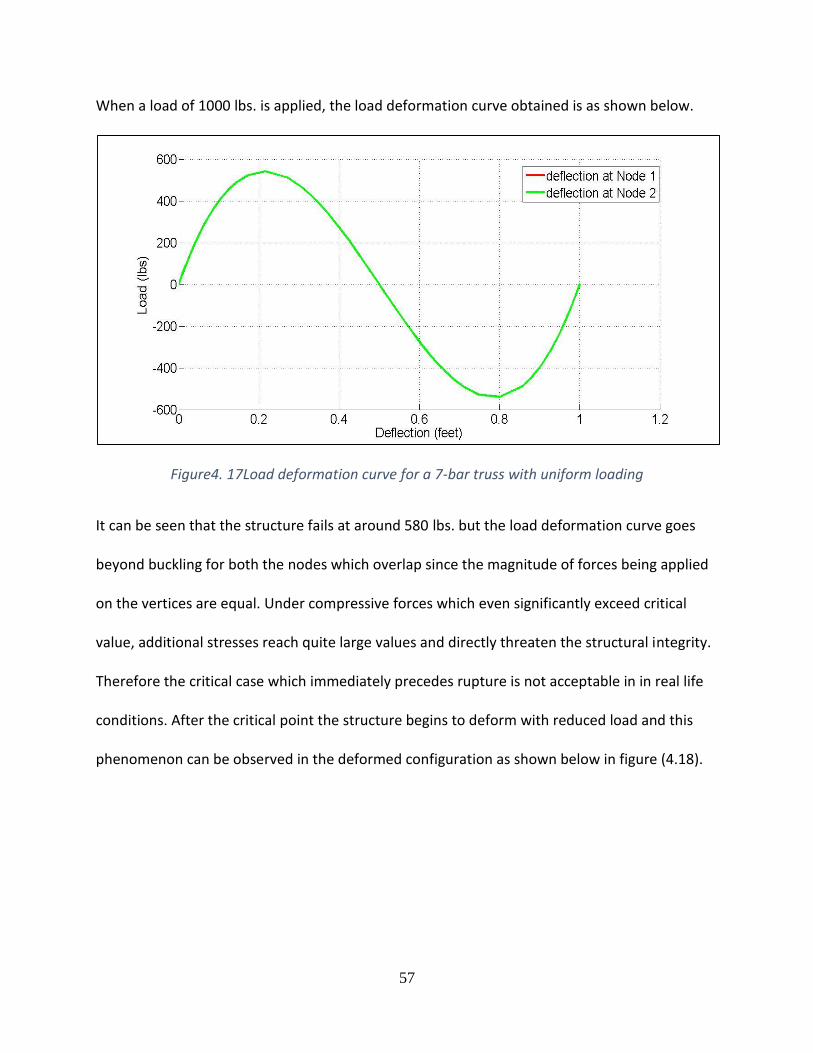
When a load of 1000 lbs. is applied, the load deformation curve obtained is as shown below.
Figure4. 17Load deformation curve for a 7-bar truss with uniform loading
It can be seen that the structure fails at around 580 lbs. but the load deformation curve goes
beyond buckling for both the nodes which overlap since the magnitude of forces being applied
on the vertices are equal. Under compressive forces which even significantly exceed critical
value, additional stresses reach quite large values and directly threaten the structural integrity.
Therefore the critical case which immediately precedes rupture is not acceptable in in real life
conditions. After the critical point the structure begins to deform with reduced load and this
phenomenon can be observed in the deformed configuration as shown below in figure (4.18).
58
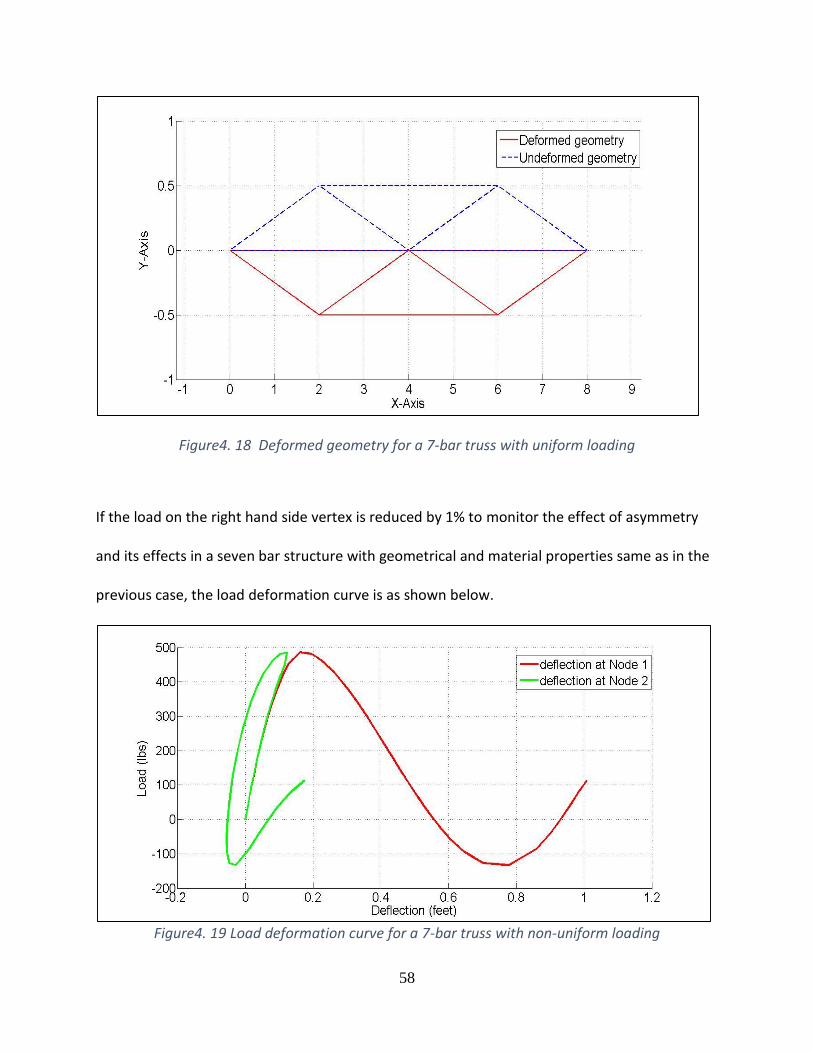
Figure4. 18 Deformed geometry for a 7-bar truss with uniform loading
If the load on the right hand side vertex is reduced by 1% to monitor the effect of asymmetry
and its effects in a seven bar structure with geometrical and material properties same as in the
previous case, the load deformation curve is as shown below.
Figure4. 19 Load deformation curve for a 7-bar truss with non-uniform loading
59
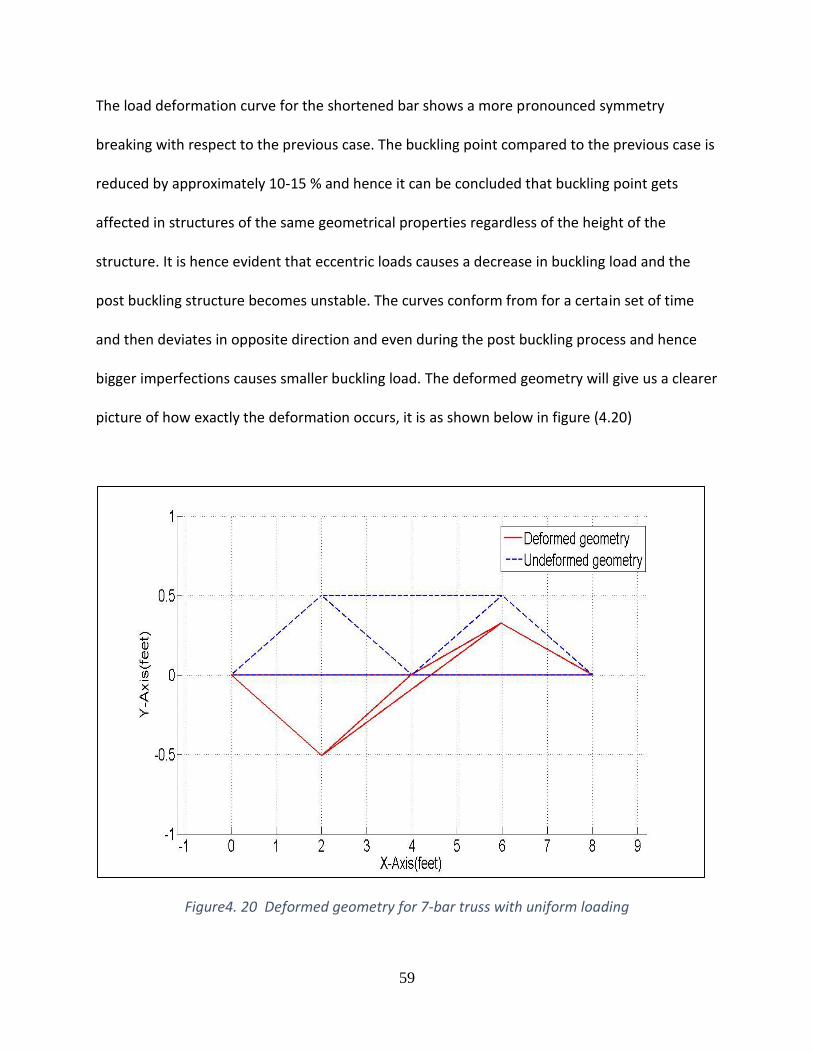
The load deformation curve for the shortened bar shows a more pronounced symmetry
breaking with respect to the previous case. The buckling point compared to the previous case is
reduced by approximately 10-15 % and hence it can be concluded that buckling point gets
affected in structures of the same geometrical properties regardless of the height of the
structure. It is hence evident that eccentric loads causes a decrease in buckling load and the
post buckling structure becomes unstable. The curves conform from for a certain set of time
and then deviates in opposite direction and even during the post buckling process and hence
bigger imperfections causes smaller buckling load. The deformed geometry will give us a clearer
picture of how exactly the deformation occurs, it is as shown below in figure (4.20)
Figure4. 20 Deformed geometry for 7-bar truss with uniform loading
60
The deformation proceeds symmetrically initially and after the symmetry is broken, the node
on the greater force area deforms to a greater extent and after the buckling point is reached
the structure deforms with decrease in load. The curves conform from for a certain set of time
and then deviates in opposite direction and even during the post buckling process and hence
bigger imperfections causes smaller buckling load.
4.3 Symmetry breaking in 5-bar truss structure
5-BAR truss structures are widely used in modern mega structures. They will be provided with
some sought of a base but in more complex structures bases mayn’t be present. It would be
pretty essential to get into the behavior of 5-bar truss structures under various conditions and
geometrical properties and their reaction to various set of forces. It would also be a good base
point to compare the reaction forces between a 7 bar structure with a base and a 5 bar
structure without a base. The effects of baseless structures can be analyzed. We first consider a
5-bar truss structure with a roller in between and hinged at the ends. There are also two equal
forces acting on the vertices. The setup is as shown below in figure (4.21)
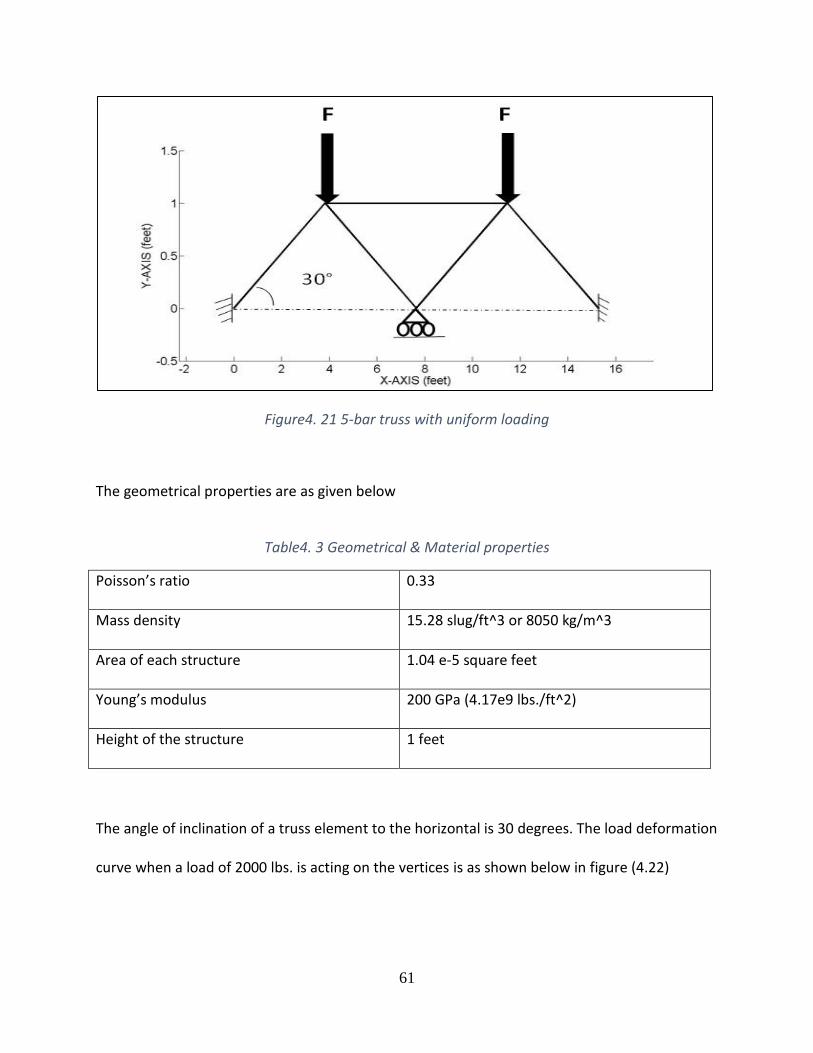
61
Figure4. 21 5-bar truss with uniform loading
The geometrical properties are as given below
Table4. 3 Geometrical & Material properties
Poisson’s ratio 0.33
Mass density 15.28 slug/ft^3 or 8050 kg/m^3
Area of each structure 1.04 e-5 square feet
Young’s modulus 200 GPa (4.17e9 lbs./ft^2)
Height of the structure 1 feet
The angle of inclination of a truss element to the horizontal is 30 degrees. The load deformation
curve when a load of 2000 lbs. is acting on the vertices is as shown below in figure (4.22)
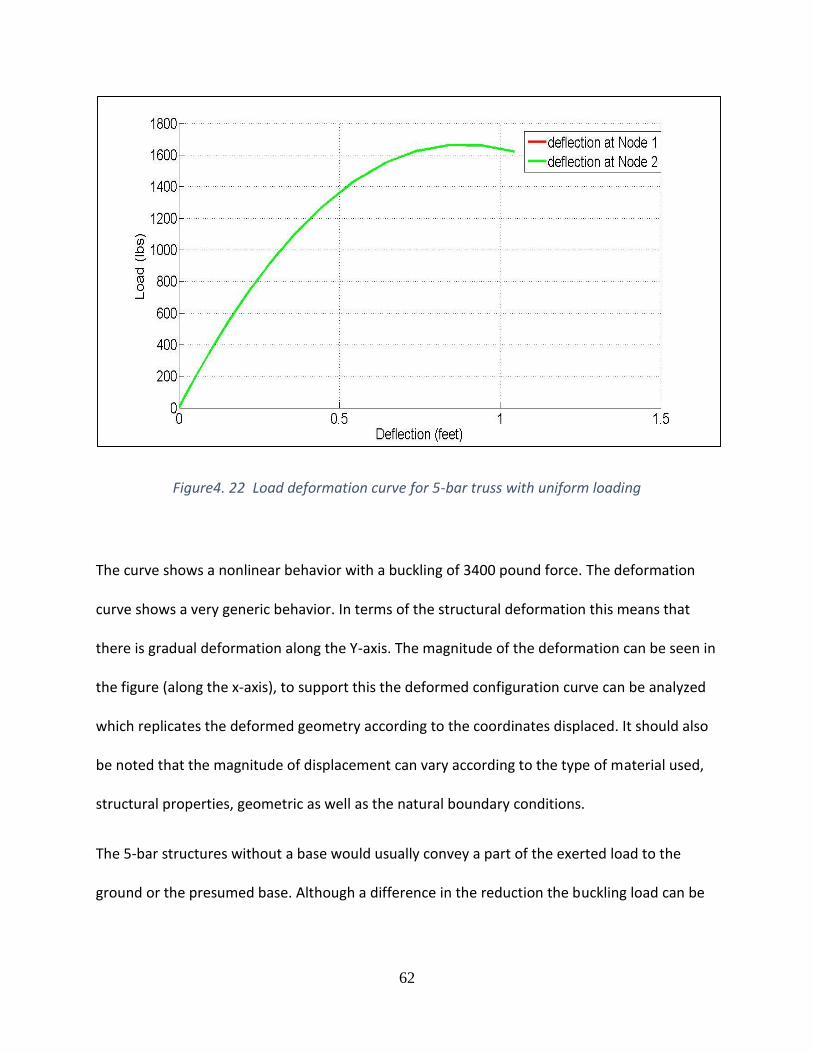
62
Figure4. 22 Load deformation curve for 5-bar truss with uniform loading
The curve shows a nonlinear behavior with a buckling of 3400 pound force. The deformation
curve shows a very generic behavior. In terms of the structural deformation this means that
there is gradual deformation along the Y-axis. The magnitude of the deformation can be seen in
the figure (along the x-axis), to support this the deformed configuration curve can be analyzed
which replicates the deformed geometry according to the coordinates displaced. It should also
be noted that the magnitude of displacement can vary according to the type of material used,
structural properties, geometric as well as the natural boundary conditions.
The 5-bar structures without a base would usually convey a part of the exerted load to the
ground or the presumed base. Although a difference in the reduction the buckling load can be
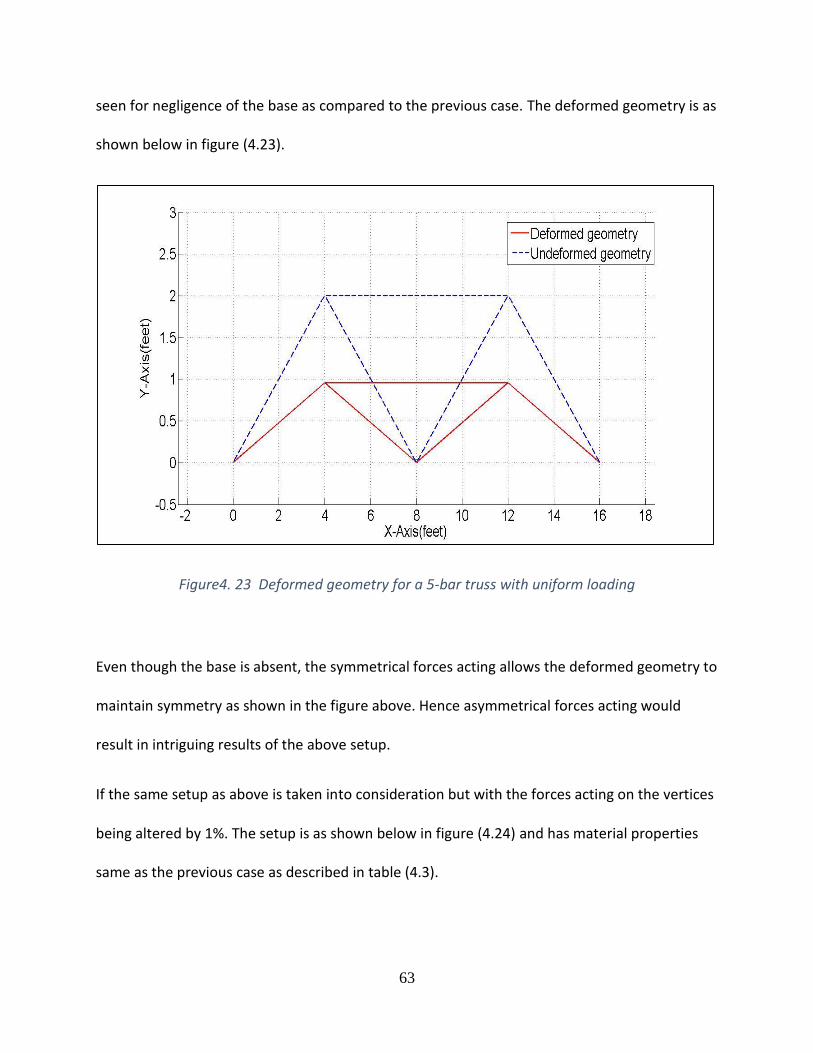
63
seen for negligence of the base as compared to the previous case. The deformed geometry is as
shown below in figure (4.23).
Figure4. 23 Deformed geometry for a 5-bar truss with uniform loading
Even though the base is absent, the symmetrical forces acting allows the deformed geometry to
maintain symmetry as shown in the figure above. Hence asymmetrical forces acting would
result in intriguing results of the above setup.
If the same setup as above is taken into consideration but with the forces acting on the vertices
being altered by 1%. The setup is as shown below in figure (4.24) and has material properties
same as the previous case as described in table (4.3).
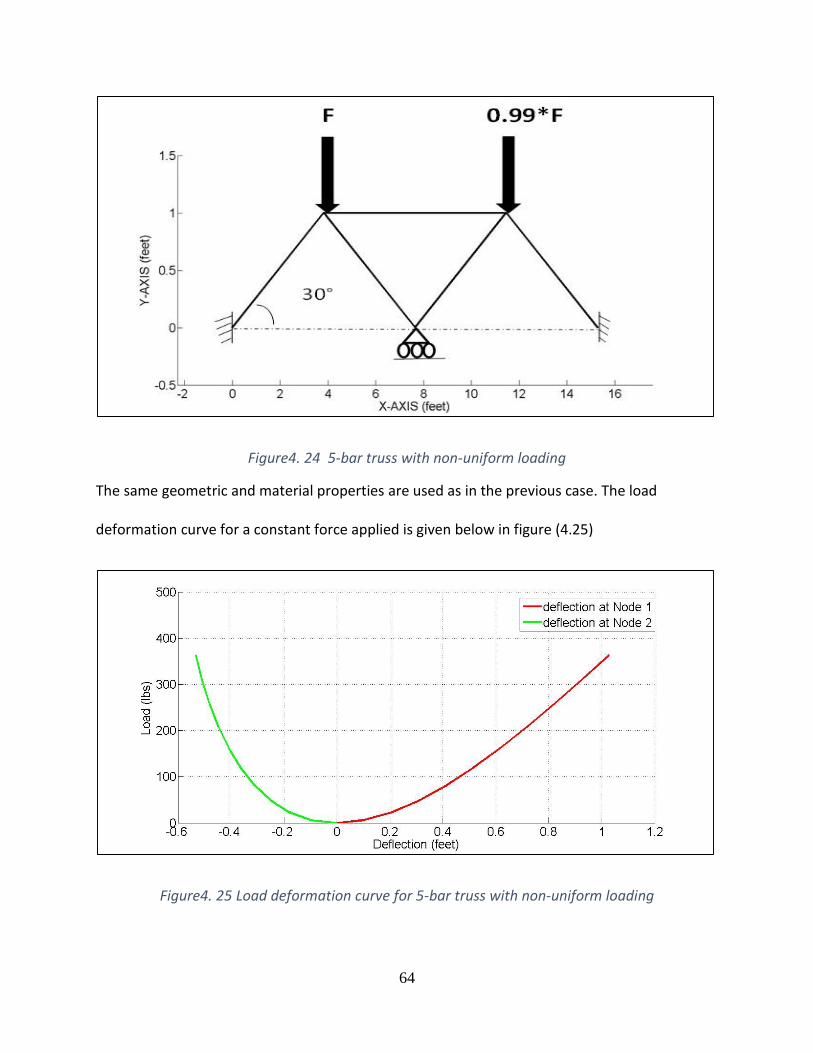
64
Figure4. 24 5-bar truss with non-uniform loading
The same geometric and material properties are used as in the previous case. The load
deformation curve for a constant force applied is given below in figure (4.25)
Figure4. 25 Load deformation curve for 5-bar truss with non-uniform loading
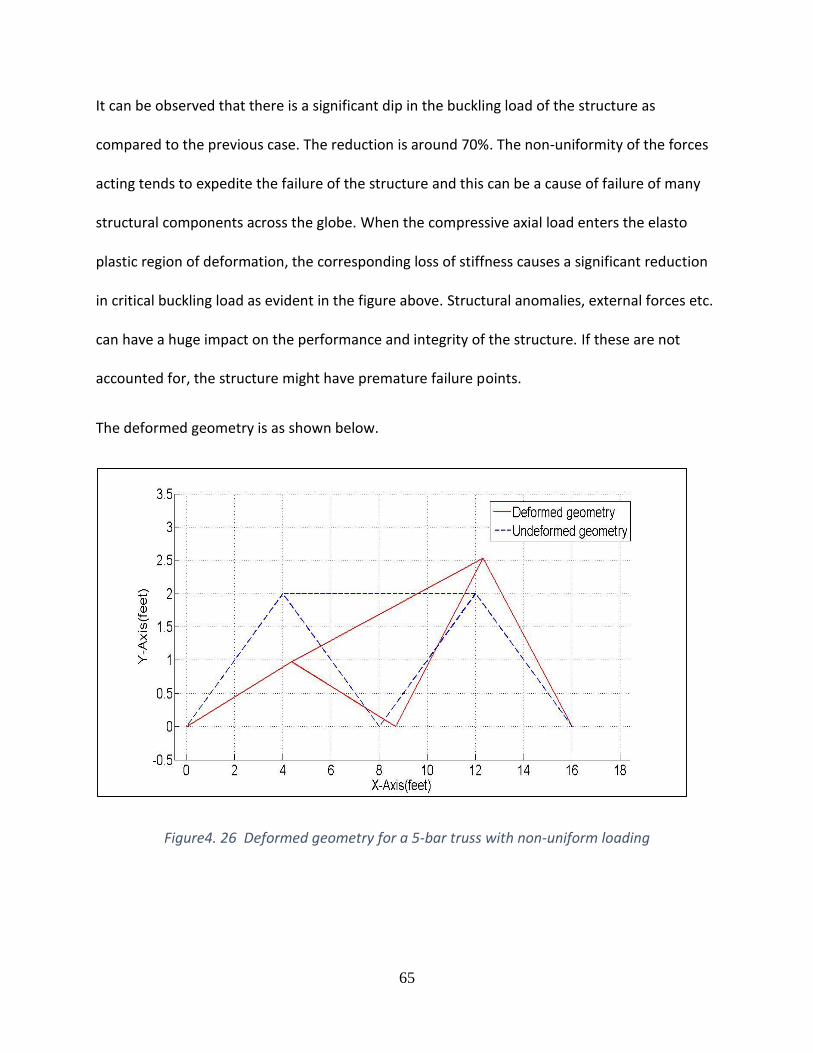
65
It can be observed that there is a significant dip in the buckling load of the structure as
compared to the previous case. The reduction is around 70%. The non-uniformity of the forces
acting tends to expedite the failure of the structure and this can be a cause of failure of many
structural components across the globe. When the compressive axial load enters the elasto
plastic region of deformation, the corresponding loss of stiffness causes a significant reduction
in critical buckling load as evident in the figure above. Structural anomalies, external forces etc.
can have a huge impact on the performance and integrity of the structure. If these are not
accounted for, the structure might have premature failure points.
The deformed geometry is as shown below.
Figure4. 26 Deformed geometry for a 5-bar truss with non-uniform loading
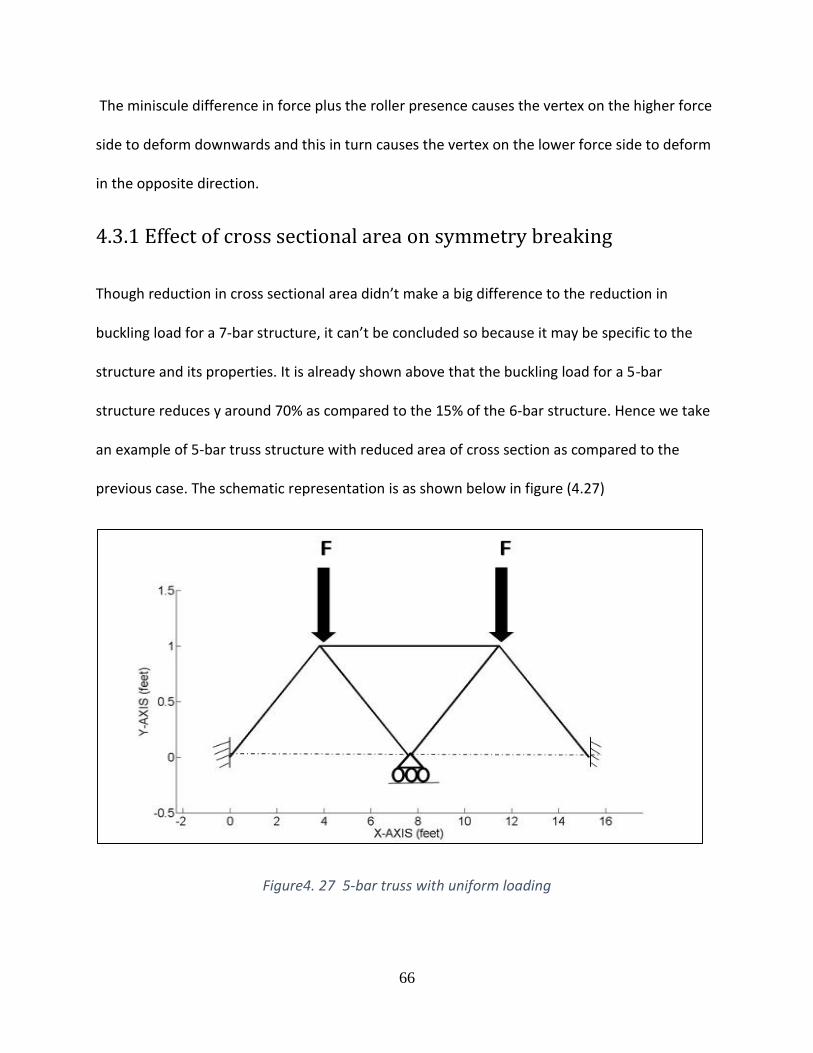
66
The miniscule difference in force plus the roller presence causes the vertex on the higher force
side to deform downwards and this in turn causes the vertex on the lower force side to deform
in the opposite direction.
4.3.1 Effect of cross sectional area on symmetry breaking
Though reduction in cross sectional area didn’t make a big difference to the reduction in
buckling load for a 7-bar structure, it can’t be concluded so because it may be specific to the
structure and its properties. It is already shown above that the buckling load for a 5-bar
structure reduces y around 70% as compared to the 15% of the 6-bar structure. Hence we take
an example of 5-bar truss structure with reduced area of cross section as compared to the
previous case. The schematic representation is as shown below in figure (4.27)
Figure4. 27 5-bar truss with uniform loading
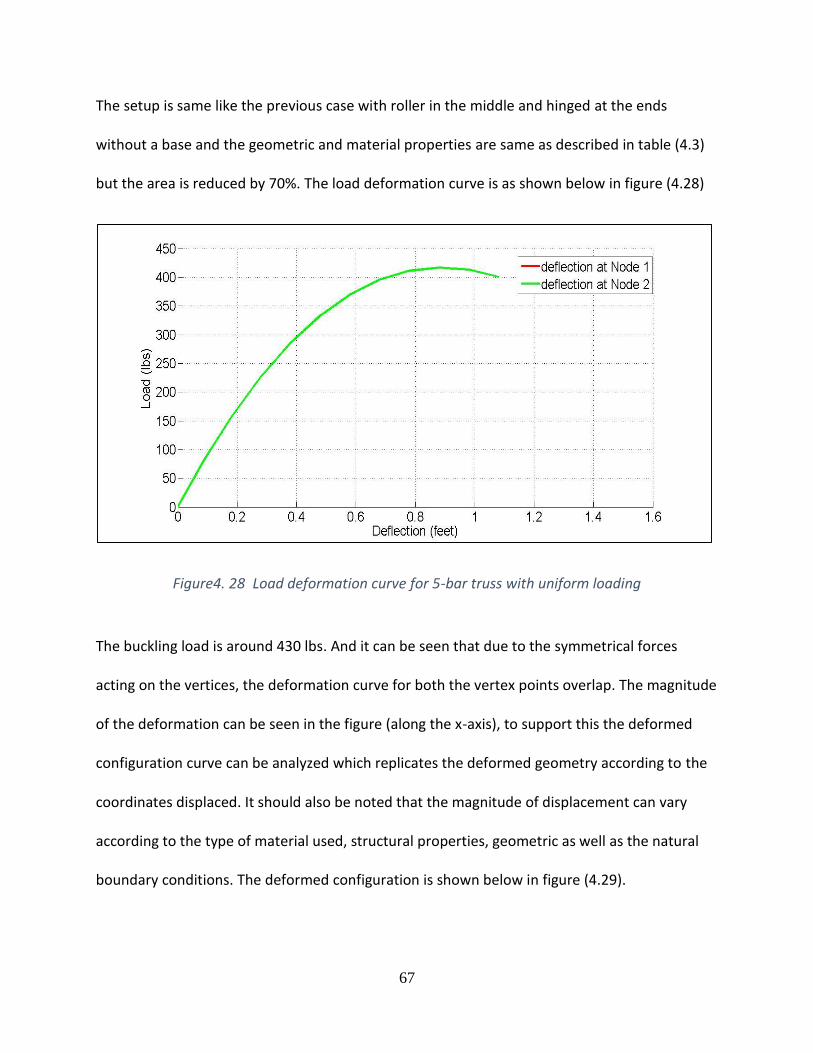
67
The setup is same like the previous case with roller in the middle and hinged at the ends
without a base and the geometric and material properties are same as described in table (4.3)
but the area is reduced by 70%. The load deformation curve is as shown below in figure (4.28)
Figure4. 28 Load deformation curve for 5-bar truss with uniform loading
The buckling load is around 430 lbs. And it can be seen that due to the symmetrical forces
acting on the vertices, the deformation curve for both the vertex points overlap. The magnitude
of the deformation can be seen in the figure (along the x-axis), to support this the deformed
configuration curve can be analyzed which replicates the deformed geometry according to the
coordinates displaced. It should also be noted that the magnitude of displacement can vary
according to the type of material used, structural properties, geometric as well as the natural
boundary conditions. The deformed configuration is shown below in figure (4.29).
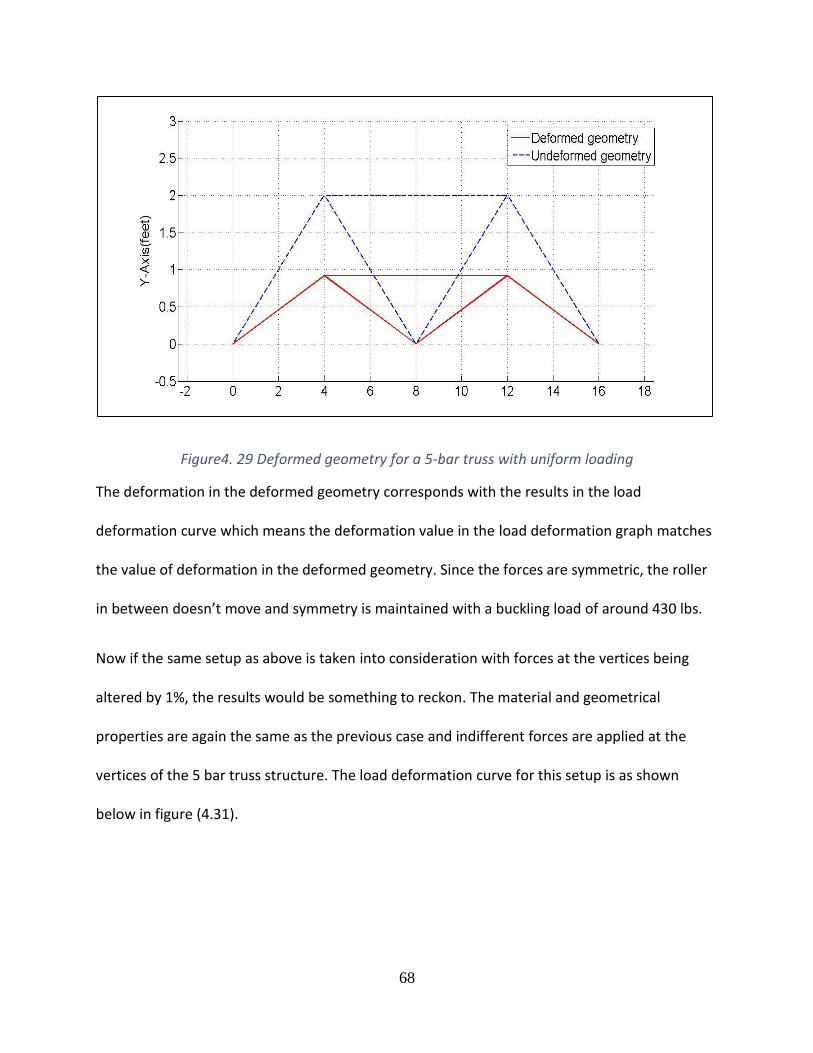
68
Figure4. 29 Deformed geometry for a 5-bar truss with uniform loading
The deformation in the deformed geometry corresponds with the results in the load
deformation curve which means the deformation value in the load deformation graph matches
the value of deformation in the deformed geometry. Since the forces are symmetric, the roller
in between doesn’t move and symmetry is maintained with a buckling load of around 430 lbs.
Now if the same setup as above is taken into consideration with forces at the vertices being
altered by 1%, the results would be something to reckon. The material and geometrical
properties are again the same as the previous case and indifferent forces are applied at the
vertices of the 5 bar truss structure. The load deformation curve for this setup is as shown
below in figure (4.31).
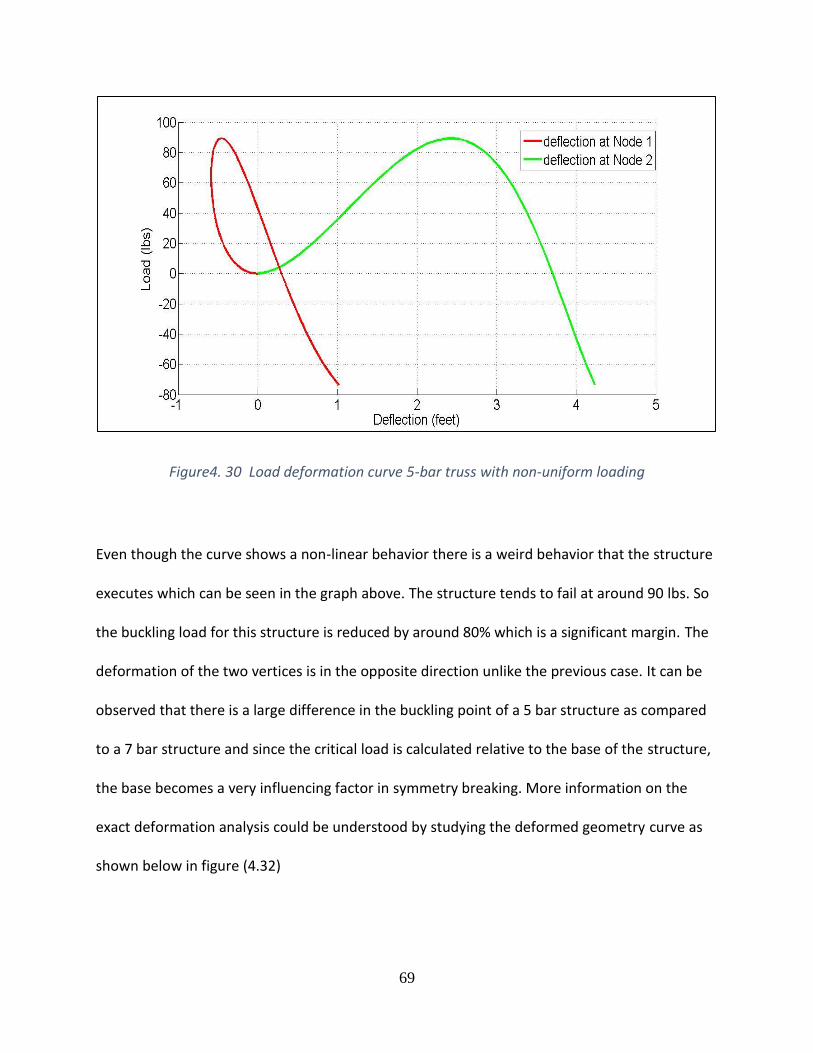
69
Figure4. 30 Load deformation curve 5-bar truss with non-uniform loading
Even though the curve shows a non-linear behavior there is a weird behavior that the structure
executes which can be seen in the graph above. The structure tends to fail at around 90 lbs. So
the buckling load for this structure is reduced by around 80% which is a significant margin. The
deformation of the two vertices is in the opposite direction unlike the previous case. It can be
observed that there is a large difference in the buckling point of a 5 bar structure as compared
to a 7 bar structure and since the critical load is calculated relative to the base of the structure,
the base becomes a very influencing factor in symmetry breaking. More information on the
exact deformation analysis could be understood by studying the deformed geometry curve as
shown below in figure (4.32)
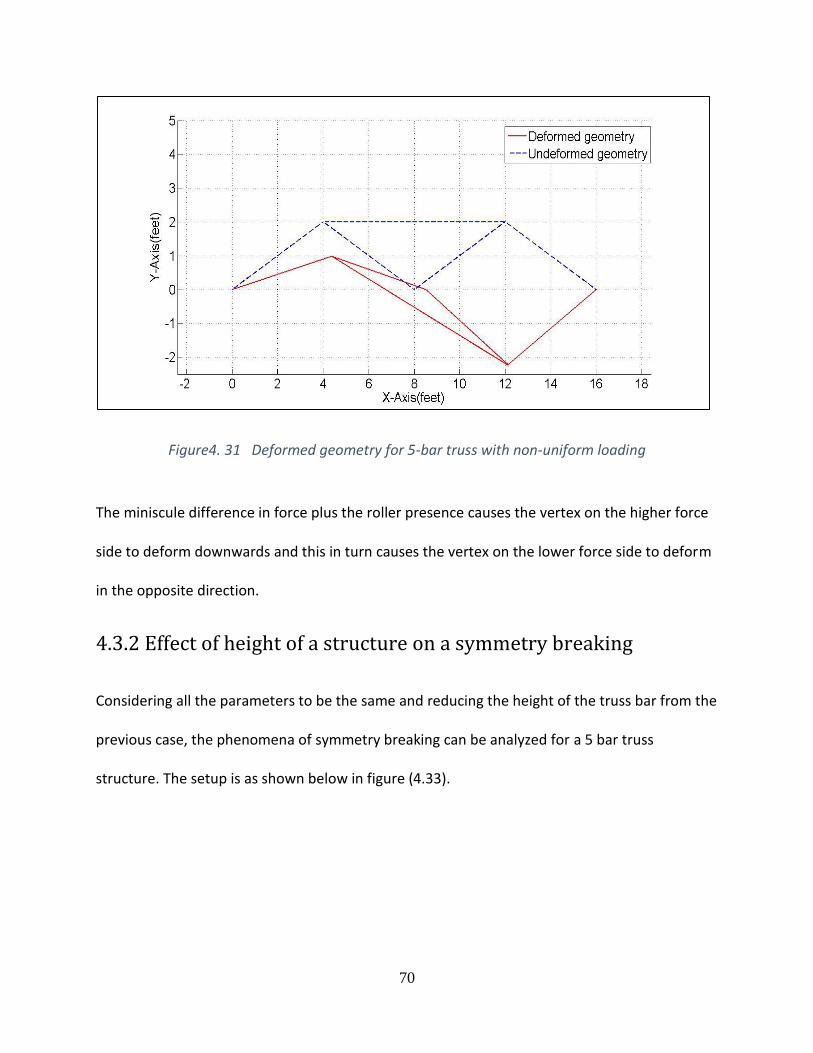
70
Figure4. 31 Deformed geometry for 5-bar truss with non-uniform loading
The miniscule difference in force plus the roller presence causes the vertex on the higher force
side to deform downwards and this in turn causes the vertex on the lower force side to deform
in the opposite direction.
4.3.2 Effect of height of a structure on a symmetry breaking
Considering all the parameters to be the same and reducing the height of the truss bar from the
previous case, the phenomena of symmetry breaking can be analyzed for a 5 bar truss
structure. The setup is as shown below in figure (4.33).
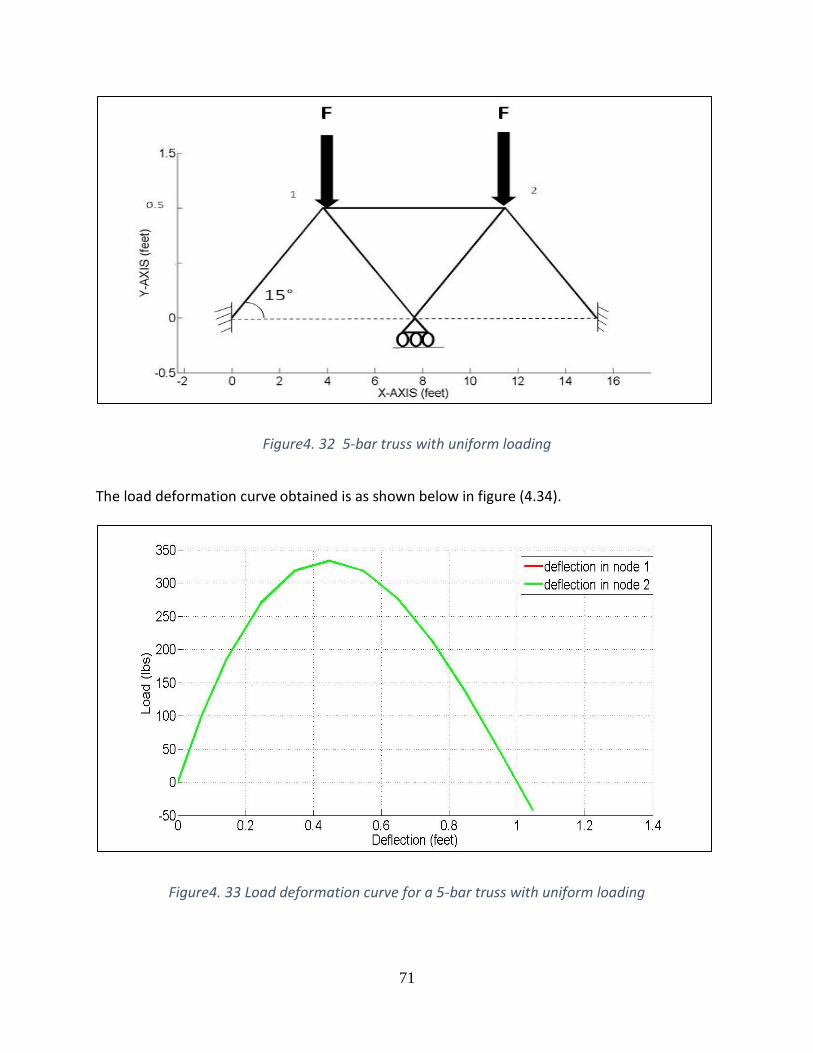
71
Figure4. 32 5-bar truss with uniform loading
The load deformation curve obtained is as shown below in figure (4.34).
Figure4. 33 Load deformation curve for a 5-bar truss with uniform loading
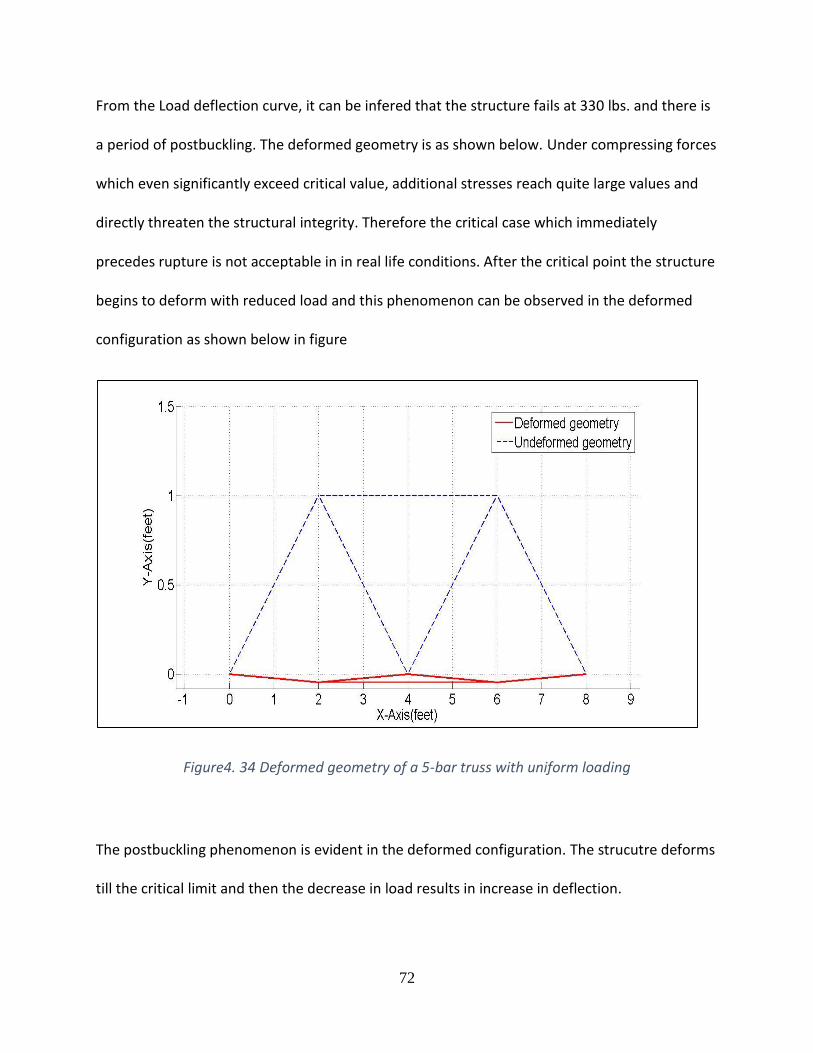
72
From the Load deflection curve, it can be infered that the structure fails at 330 lbs. and there is
a period of postbuckling. The deformed geometry is as shown below. Under compressing forces
which even significantly exceed critical value, additional stresses reach quite large values and
directly threaten the structural integrity. Therefore the critical case which immediately
precedes rupture is not acceptable in in real life conditions. After the critical point the structure
begins to deform with reduced load and this phenomenon can be observed in the deformed
configuration as shown below in figure
Figure4. 34 Deformed geometry of a 5-bar truss with uniform loading
The postbuckling phenomenon is evident in the deformed configuration. The strucutre deforms
till the critical limit and then the decrease in load results in increase in deflection.
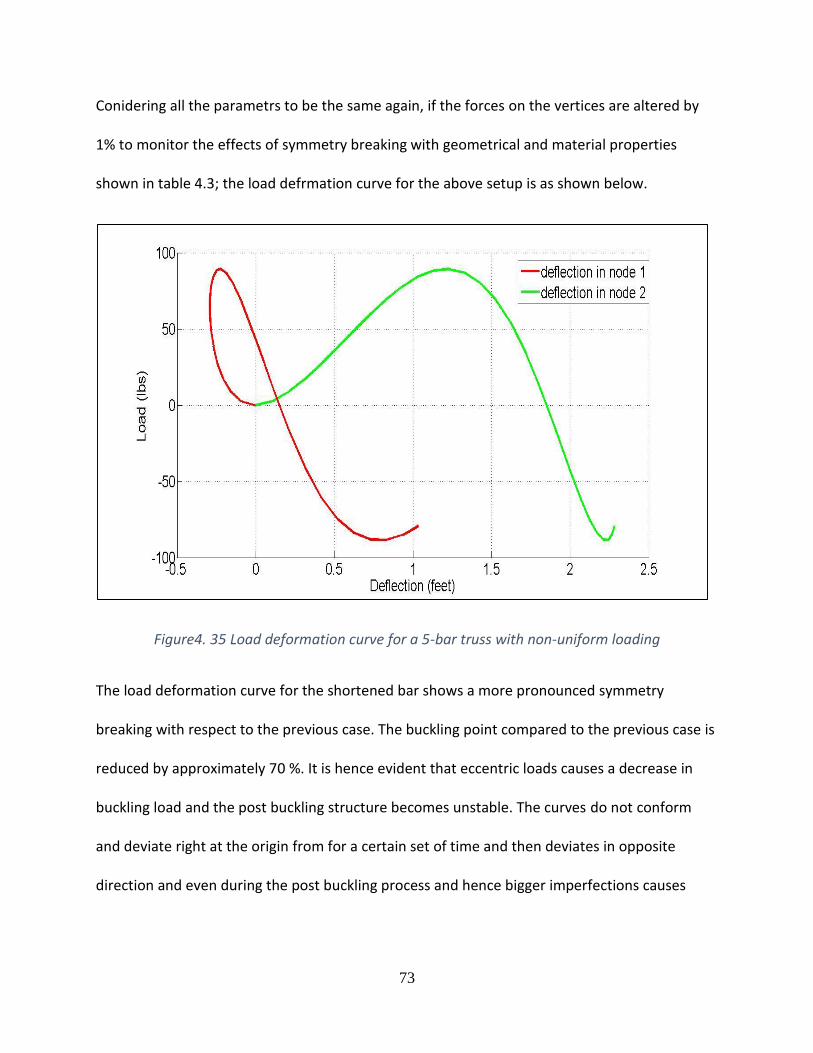
73
Conidering all the parametrs to be the same again, if the forces on the vertices are altered by
1% to monitor the effects of symmetry breaking with geometrical and material properties
shown in table 4.3; the load defrmation curve for the above setup is as shown below.
Figure4. 35 Load deformation curve for a 5-bar truss with non-uniform loading
The load deformation curve for the shortened bar shows a more pronounced symmetry
breaking with respect to the previous case. The buckling point compared to the previous case is
reduced by approximately 70 %. It is hence evident that eccentric loads causes a decrease in
buckling load and the post buckling structure becomes unstable. The curves do not conform
and deviate right at the origin from for a certain set of time and then deviates in opposite
direction and even during the post buckling process and hence bigger imperfections causes
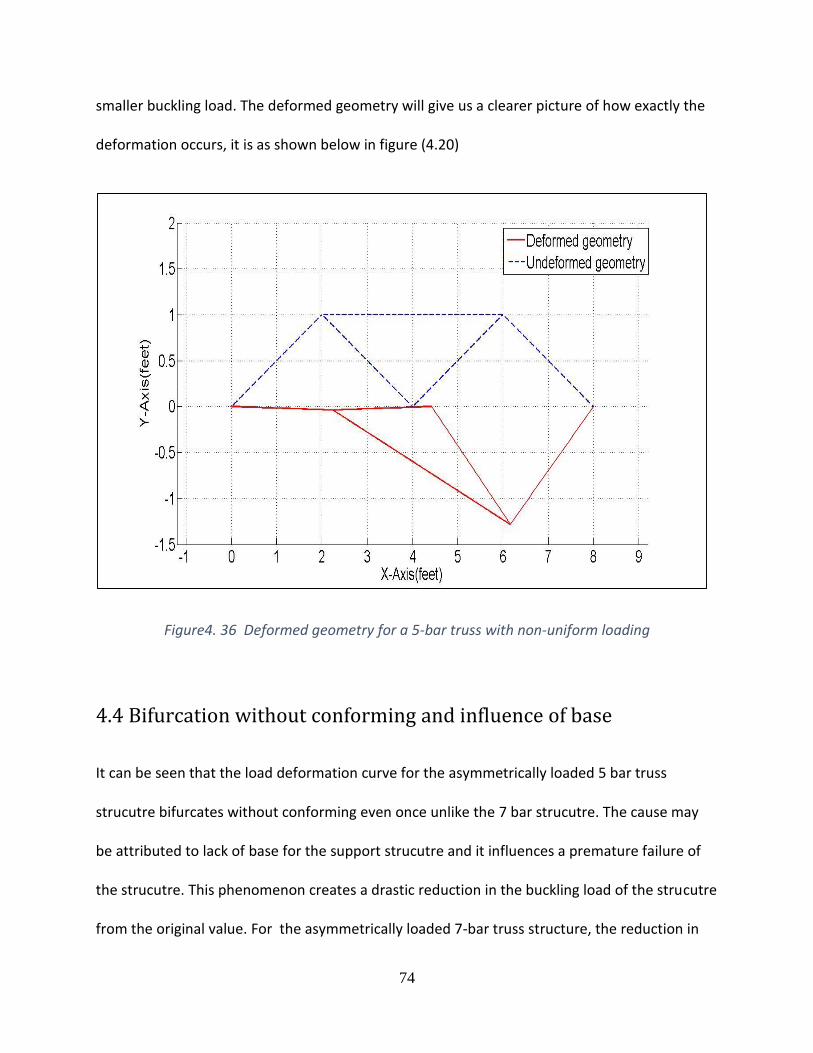
74
smaller buckling load. The deformed geometry will give us a clearer picture of how exactly the
deformation occurs, it is as shown below in figure (4.20)
Figure4. 36 Deformed geometry for a 5-bar truss with non-uniform loading
4.4 Bifurcation without conforming and influence of base
It can be seen that the load deformation curve for the asymmetrically loaded 5 bar truss
strucutre bifurcates without conforming even once unlike the 7 bar strucutre. The cause may
be attributed to lack of base for the support strucutre and it influences a premature failure of
the strucutre. This phenomenon creates a drastic reduction in the buckling load of the strucutre
from the original value. For the asymmetrically loaded 7-bar truss structure, the reduction in
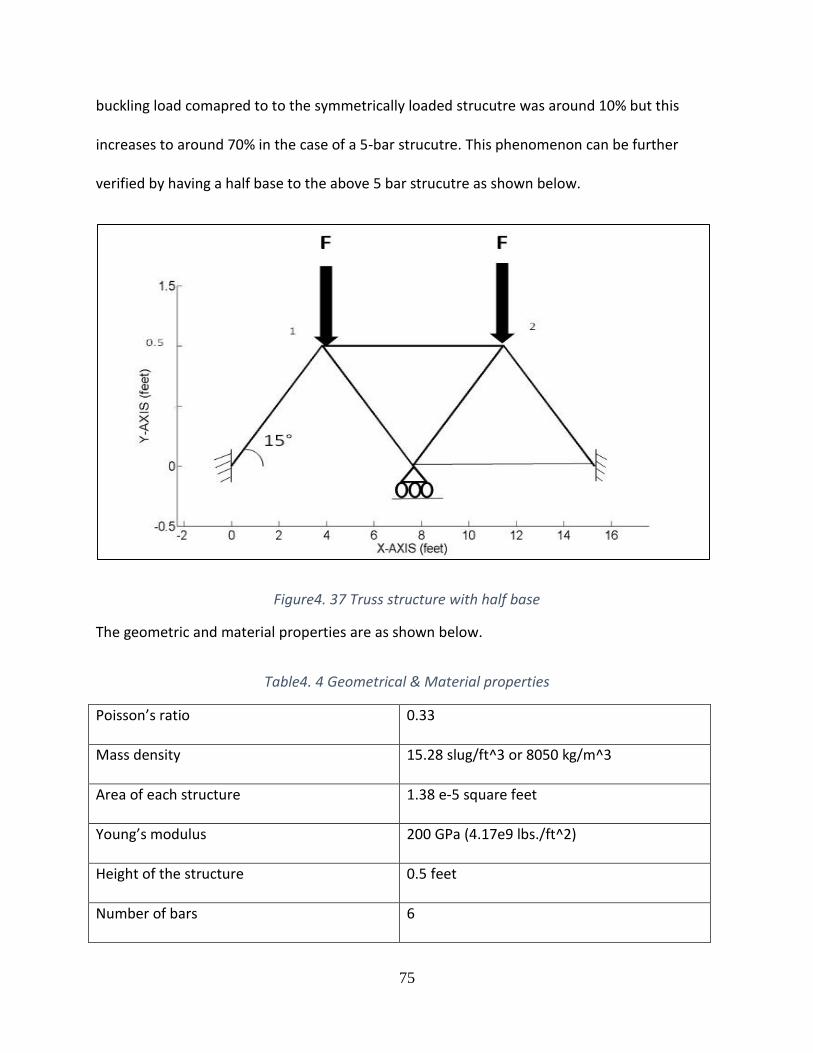
75
buckling load comapred to to the symmetrically loaded strucutre was around 10% but this
increases to around 70% in the case of a 5-bar strucutre. This phenomenon can be further
verified by having a half base to the above 5 bar strucutre as shown below.
Figure4. 37 Truss structure with half base
The geometric and material properties are as shown below.
Table4. 4 Geometrical & Material properties
Poisson’s ratio 0.33
Mass density 15.28 slug/ft^3 or 8050 kg/m^3
Area of each structure 1.38 e-5 square feet
Young’s modulus 200 GPa (4.17e9 lbs./ft^2)
Height of the structure 0.5 feet
Number of bars 6
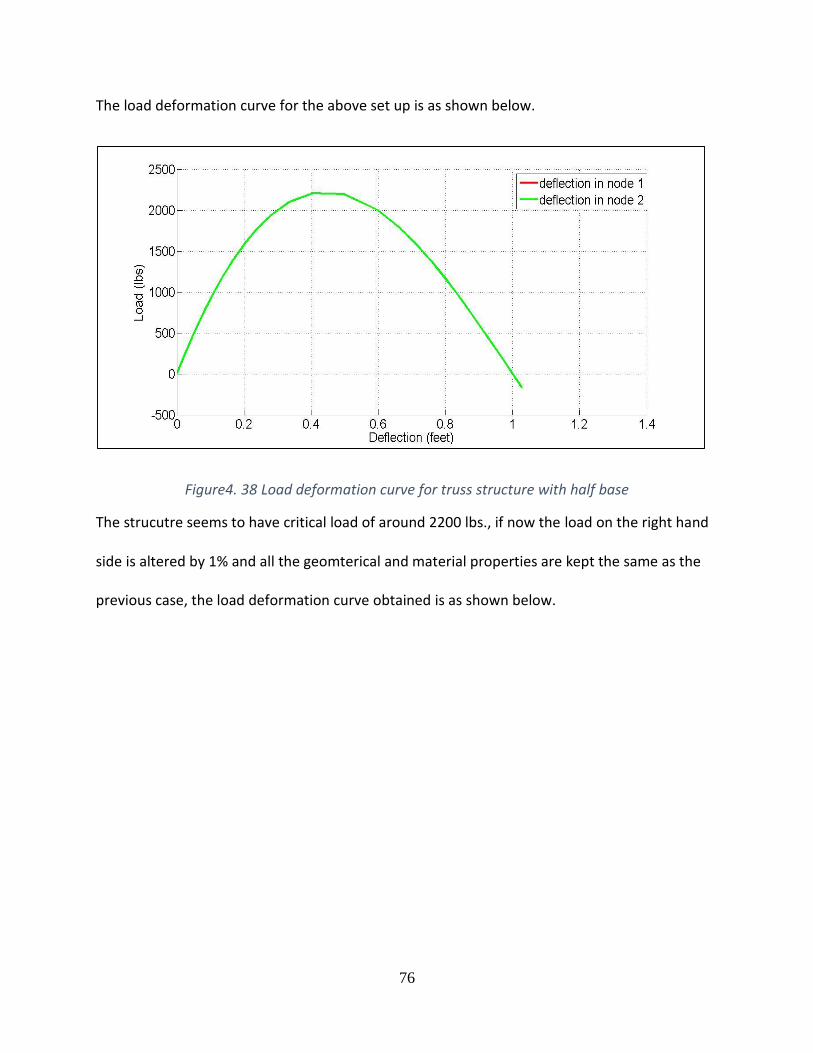
76
The load deformation curve for the above set up is as shown below.
Figure4. 38 Load deformation curve for truss structure with half base
The strucutre seems to have critical load of around 2200 lbs., if now the load on the right hand
side is altered by 1% and all the geomterical and material properties are kept the same as the
previous case, the load deformation curve obtained is as shown below.
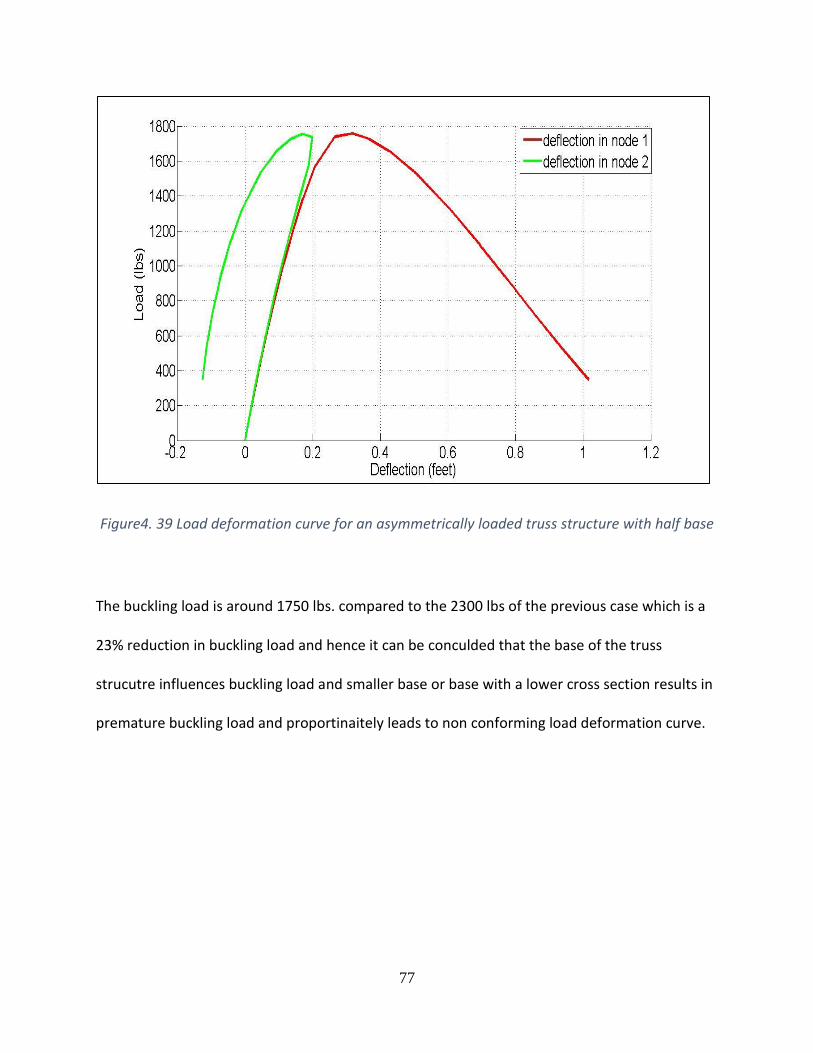
77
Figure4. 39 Load deformation curve for an asymmetrically loaded truss structure with half base
The buckling load is around 1750 lbs. compared to the 2300 lbs of the previous case which is a
23% reduction in buckling load and hence it can be conculded that the base of the truss
strucutre influences buckling load and smaller base or base with a lower cross section results in
premature buckling load and proportinaitely leads to non conforming load deformation curve.
78
4.5 Event investigation
Figure4. 40 Indiana roof collapse tragedy
The above image (found on http://graphics8.nytimes.com/images/2011/08/15/us/15indiana-
span/15indiana-span-articleLarge.jpg) is a picture of the Indiana fair tragedy that took place in
August 2011. The case investigated by Thornton Tomasetti concluded that heavy winds up to 60
mph caused the barriers to pivot from their original position and this caused the lateral load
resisting system to fail. The structure can be broken down and a similar truss model can be
assumed as shown below. External factors like winds and temperature variation cause
remarkable impacts on the behavior of the structure, and hence the geometrical and material
properties play a key role for selecting structures for areas where external forces like winds and
temperature variation play a big part. An experimentation analysis can be carried out by taking
an example of a simple symmetric truss member which resembles the truss structures used in
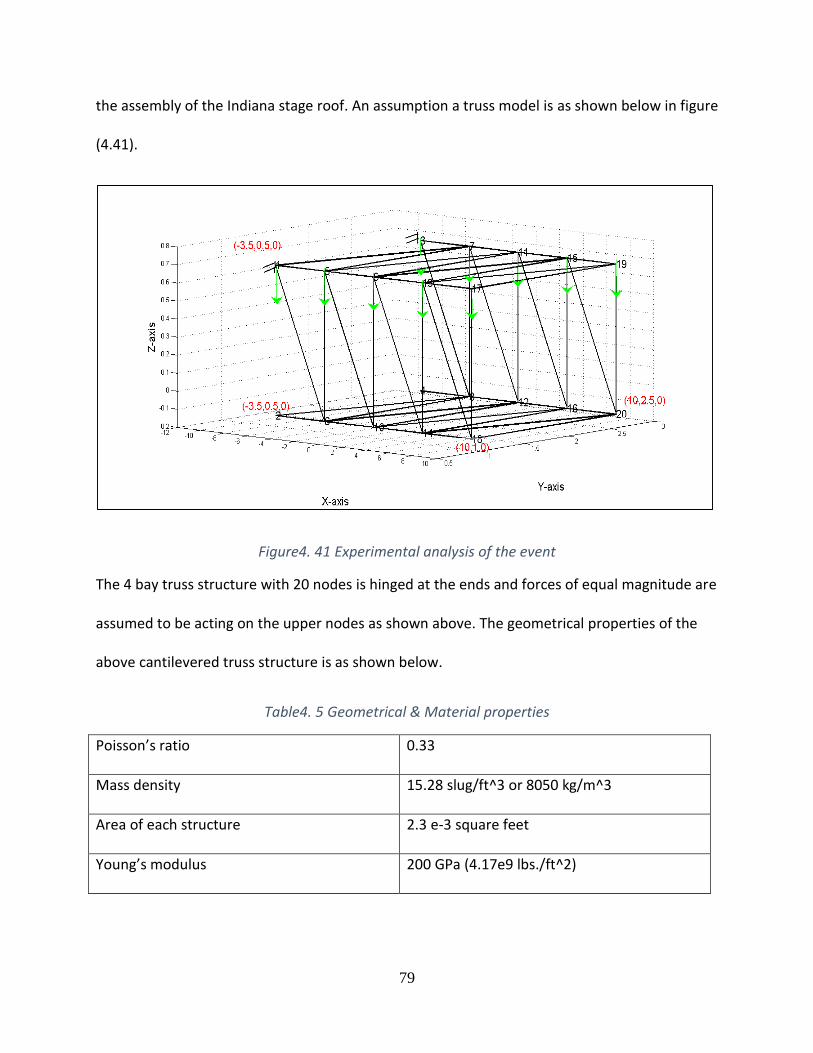
79
the assembly of the Indiana stage roof. An assumption a truss model is as shown below in figure
(4.41).
Figure4. 41 Experimental analysis of the event
The 4 bay truss structure with 20 nodes is hinged at the ends and forces of equal magnitude are
assumed to be acting on the upper nodes as shown above. The geometrical properties of the
above cantilevered truss structure is as shown below.
Table4. 5 Geometrical & Material properties
Poisson’s ratio 0.33
Mass density 15.28 slug/ft^3 or 8050 kg/m^3
Area of each structure 2.3 e-3 square feet
Young’s modulus 200 GPa (4.17e9 lbs./ft^2)
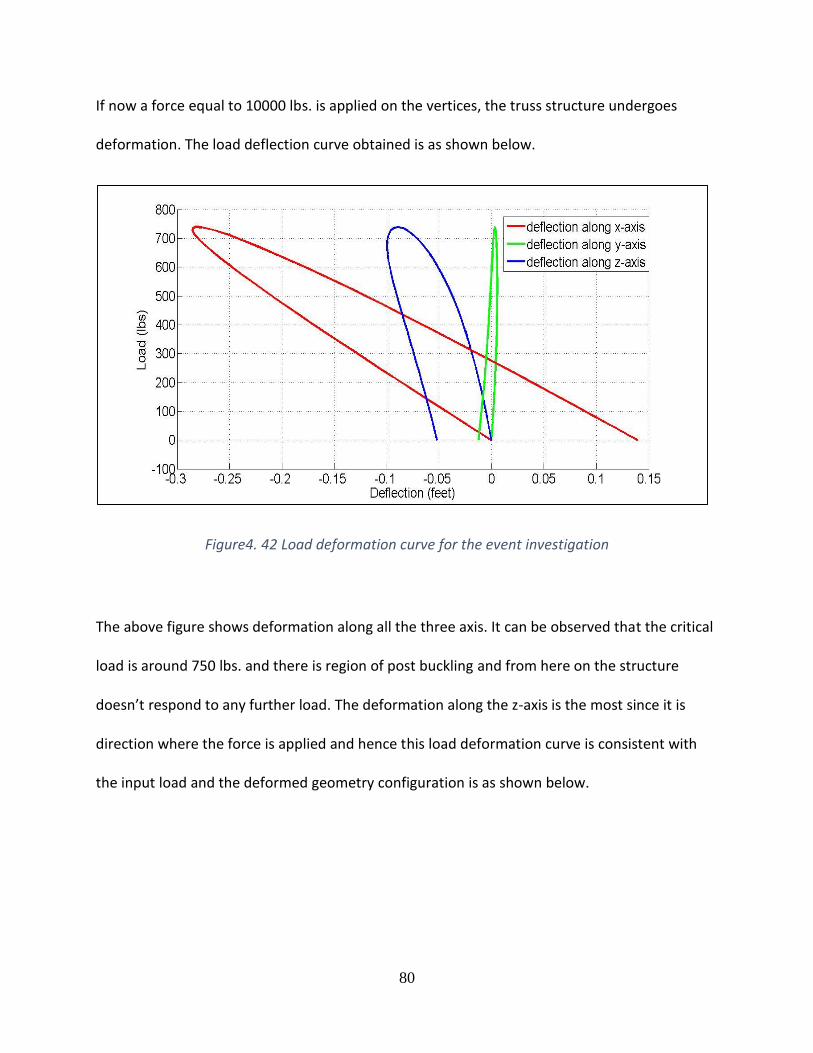
80
If now a force equal to 10000 lbs. is applied on the vertices, the truss structure undergoes
deformation. The load deflection curve obtained is as shown below.
Figure4. 42 Load deformation curve for the event investigation
The above figure shows deformation along all the three axis. It can be observed that the critical
load is around 750 lbs. and there is region of post buckling and from here on the structure
doesn’t respond to any further load. The deformation along the z-axis is the most since it is
direction where the force is applied and hence this load deformation curve is consistent with
the input load and the deformed geometry configuration is as shown below.
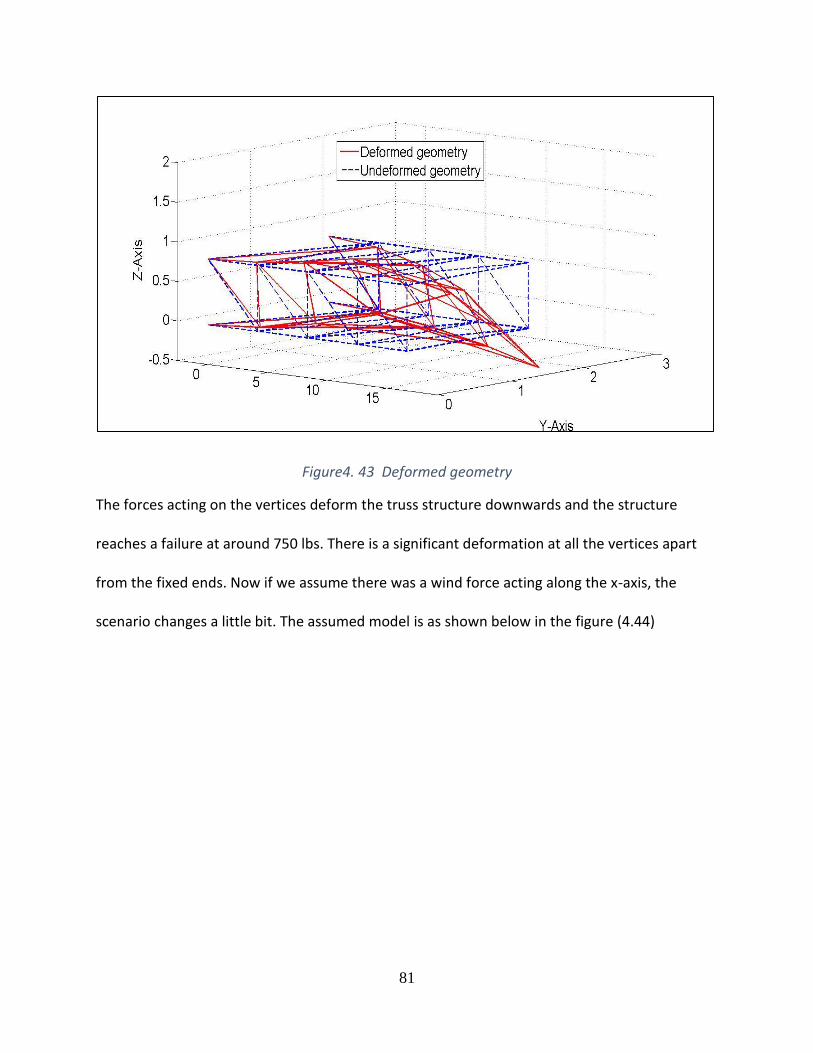
81
Figure4. 43 Deformed geometry
The forces acting on the vertices deform the truss structure downwards and the structure
reaches a failure at around 750 lbs. There is a significant deformation at all the vertices apart
from the fixed ends. Now if we assume there was a wind force acting along the x-axis, the
scenario changes a little bit. The assumed model is as shown below in the figure (4.44)
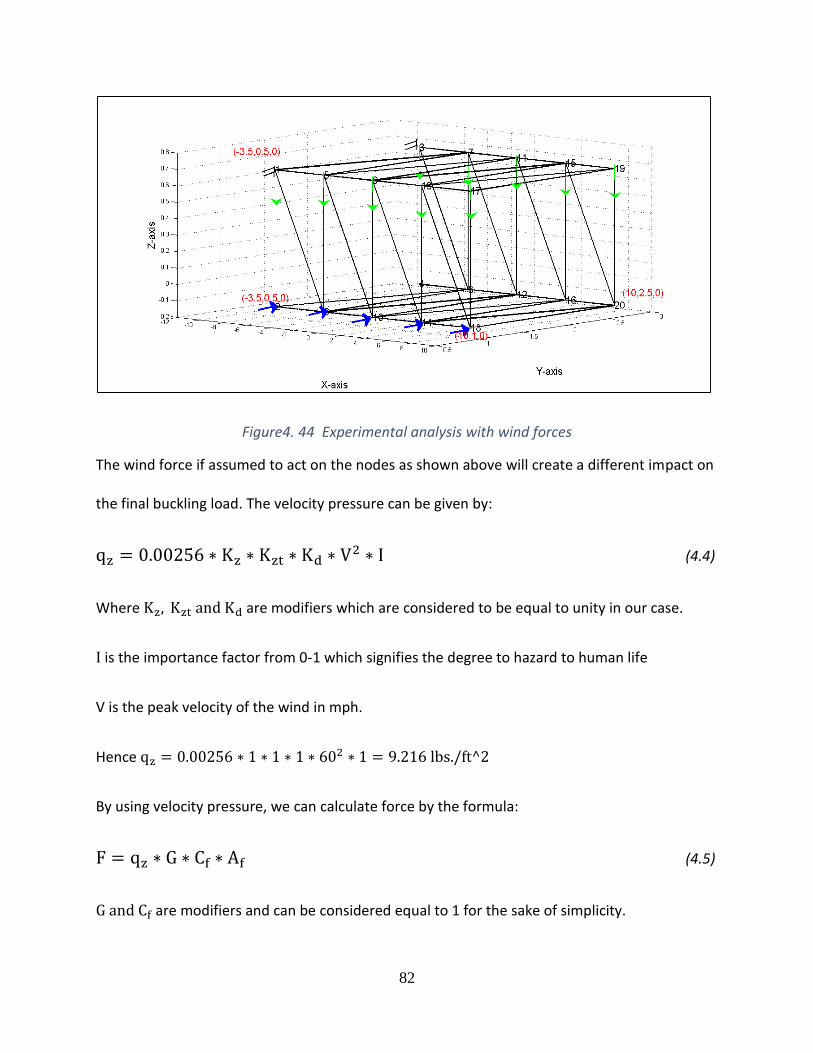
82
Figure4. 44 Experimental analysis with wind forces
The wind force if assumed to act on the nodes as shown above will create a different impact on
the final buckling load. The velocity pressure can be given by:
qz = 0.00256 ∗ Kz ∗ Kzt ∗ Kd ∗ V2 ∗ I (4.4)
Where Kz, Kzt and Kd are modifiers which are considered to be equal to unity in our case.
I is the importance factor from 0-1 which signifies the degree to hazard to human life
V is the peak velocity of the wind in mph.
Hence qz = 0.00256 ∗ 1 ∗ 1 ∗ 1 ∗ 602 ∗ 1 = 9.216 lbs./ft^2
By using velocity pressure, we can calculate force by the formula:
F = qz ∗ G ∗ Cf ∗ Af (4.5)
G and Cf are modifiers and can be considered equal to 1 for the sake of simplicity.
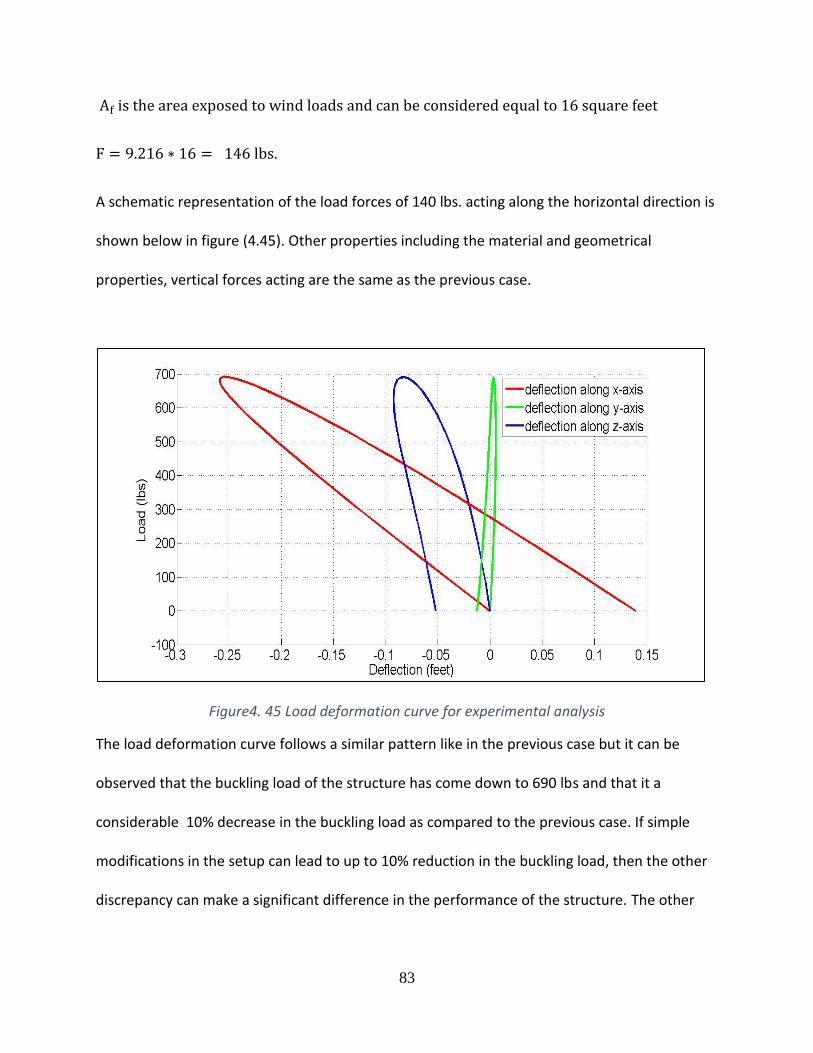
83
Af is the area exposed to wind loads and can be considered equal to 16 square feet
F = 9.216 ∗ 16 = 146 lbs.
A schematic representation of the load forces of 140 lbs. acting along the horizontal direction is
shown below in figure (4.45). Other properties including the material and geometrical
properties, vertical forces acting are the same as the previous case.
Figure4. 45 Load deformation curve for experimental analysis
The load deformation curve follows a similar pattern like in the previous case but it can be
observed that the buckling load of the structure has come down to 690 lbs and that it a
considerable 10% decrease in the buckling load as compared to the previous case. If simple
modifications in the setup can lead to up to 10% reduction in the buckling load, then the other
discrepancy can make a significant difference in the performance of the structure. The other
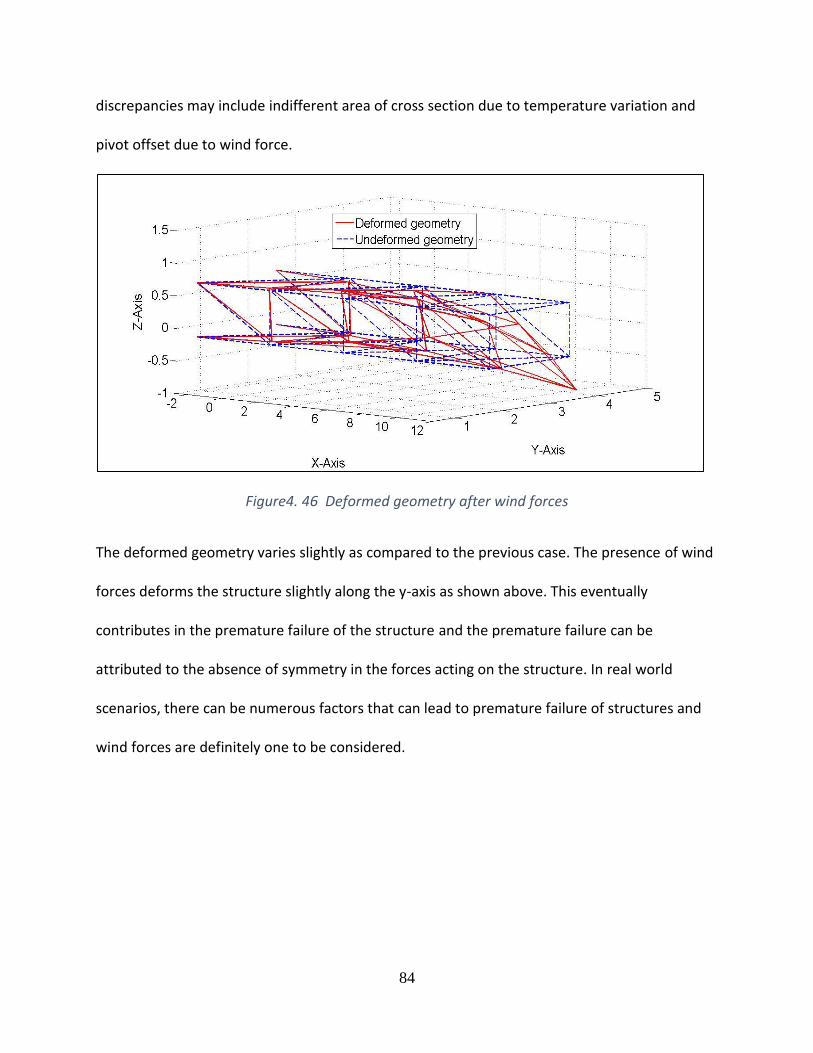
84
discrepancies may include indifferent area of cross section due to temperature variation and
pivot offset due to wind force.
Figure4. 46 Deformed geometry after wind forces
The deformed geometry varies slightly as compared to the previous case. The presence of wind
forces deforms the structure slightly along the y-axis as shown above. This eventually
contributes in the premature failure of the structure and the premature failure can be
attributed to the absence of symmetry in the forces acting on the structure. In real world
scenarios, there can be numerous factors that can lead to premature failure of structures and
wind forces are definitely one to be considered.
85
Chapter 5
Conclusion and future work
5.1 Conclusion
This thesis has demonstrated and outlined the effects of imperfections in structure and that
asymmetric loading can have large impacts in the behavior of the structure and can lead to
premature failures due to reduction in buckling load. The Newton Raphson method or a similar
approximation method has to be used in the nonlinear analysis takes into account all the
material and geometrical properties. Nonlinear post buckling responses show that
imperfections or very small values of eccentric loading can cause a significant decrease of
critical buckling load and post buckling response becomes unstable. Truss structure have been
used in our study since their geometrical uniqueness make them good candidates to show
buckling and the analysis of symmetry breaking. A truss structure is mechanically equivalent to
a spring since it can have only tensile or compressive loads.
Symmetry breaking influences reduction in buckling load and the reduction is specific to the
dimensional properties of the structure. A 7 bar structure with a base has a less reduction in
buckling load for asymmetric loading whereas a 5 bar structure without a base has a significant
dip in buckling load. In structures the effects if symmetry breaking is independent of the area
and height of cross section. Asymmetric conditions can be attributed to the following cases:
Asymmetric loads acting
External factors like temperature and wind
Manufacturing defects
86
In real world cases residual stresses introduced into a bar by manufacturing process are also an
imperfection since material like fibers with residual compressive stress can reach the limit of
proportionality before the theoretical critical limit is attained. Symmetry breaking is
pronounced in shorter structures.
The load deformation curve is a good indicator of the effect of symmetry breaking. When two
nodes are considered, the effect of symmetry breaking can be discerned by the nature of the
graph; more the two curves conform, less is the effect of symmetry breaking.
5.2 Future work
The phenomenon of symmetry breaking can be analyzed in more different cases such as:
1. Structures having indifferent geometrical properties
2. Structures with base having a lower area of cross section compared to the other parts.
3. Materials with lower modulus of elasticity
4. Structures like circular arches which are widely used and can be good candidate to show
the phenomenon of symmetry breaking.
87
REFERENCES
1. Highly flexible structures: Modeling, computation and Experimentation, P. Frank Pai 2007
2. An Introduction to the finite element method (Engineering series) 2005, J Reddy
3. Stanford Encyclopedia of Philosophy, 2003, “Symmetry and Symmetry breaking”,
http://plato.stanford.edu/entries/symmetry-breaking/
4. FEA lecture notes, R.B. Agarwal, Chapter 3 “Truss Element”,
http://www.engr.sjsu.edu/ragarwal/ME160/pdf/Chapter%203%20-%20Truss%20Element.pdf
5. Mechanical Design in Optical Engineering, “Stress-Strain Relationships”,
http://fp.optics.arizona.edu/optomech/references/OPTI_222/OPTI_222_W4.pdf
6. Truss Example- Method of joints, Darryl Morrell
https://www.youtube.com/watch?v=56eTM36Z9-A
7. Nonlinear Analysis, Altair University http://training.altairuniversity.com/wp-
content/uploads/2014/05/nlanalysis.pdf
8. Geometrically nonlinear elasto dynamic analysis of hyper-elastic neo-Hooken FG cylinder
subjected to shock loading using MLPG method, Ghardiri Rad, Shahbian, Hosseini
9. Finite element modeling of magnetoelectric laminate composites in considering nonlinear
and load effects for energy harvesting, Tallebh,H
10. A simple numerical solution procedure for equations of nonlinear finite element method,
Cai, S.B, Li, D.Z, Kim,C.W., Shen , P.S 2013 4th International conference on advances in materials
and manufacturing
88
11. Nonlinear damage identification of breathing cracks in Truss system, Zhao,J., De Smidt,H.,
Sensors and smart structure technologies for Civil, Mechanical and Aerospace systems 2014
12. FEM Modeling: Mesh, Loads and BCs Chapter 7, University of Colorado,
http://www.colorado.edu/engineering/cas/courses.d/IFEM.d/IFEM.Ch07.d/IFEM.Ch07.pdf
13. Linear structural analysis, “ME 24-688 Introduction to CAD/CAE tools.
14. Determining Deflections of Hinge-Connected Beams Using Singularity Functions: Right and
Wrong Ways, Ing-Chang Jong, University of Arkansas
15. Shear strengthening of reinforced concrete beams strengthened using embedded through
section steel barss, Breveglieri., University of FerraraFerrara, Italy
16. Linear and Nonlinear buckling and post buckling analysis of a bar with the influence of
imperfections ISSN 1330-3651,
le:///C:/Users/e109464/Downloads/tv_19_2012_3_695_701.pdf
17. Życzkowsky, M. Post-buckling analysis of non-prismatic columns under general behavior of
loading. // International Journal of Non-Linear Mechanics. 40,3(2005), pp. 445-463
18. Bochenek, B. Problems of structural optimization for postbuckling behaviour. // Structural
and Multidisciplinary Optimization. 25, 5-6(2003), pp. 423-435.
19. Byklum, E.; Steen, E.; Amdahl, J. A semi-analytical model for global buckling and
postbuckling analysis of stiffened panels. // Thin-Walled Structures. 42, 5(2004), pp. 701-717
20. Silva, V. D. Mechanics and Strength of Materials. Springer, Netherland, 2006
21. AutoFEM Analysis Buckling structure
http://www.autofemsoft.com/help/buckling_analysis.html
89
22. An Explanatory Handbook om proposed IS 875 (Part 3) Wind loads on buildings and
structures, Dr.N.M. Bhandari http://www.iitk.ac.in/nicee/IITK-GSDMA/W06.pdf
23. ASCE 7: Minimum Design Loads for buildings and other structures, 49 CFR 193.2013,
American Society of Civil Engineers