Embed Size (px)
Citation preview
Granular Matter manuscript No. GRMA-D-11-00107(preprint of the paper accepted for publication)
Asymptotic behaviour of granular materials
David Masın
Received: — / Accepted: —
Abstract The concept of the asymptotic behaviour
of particulate materials is described, including its en-
hancement by considering asymptotic states in exten-
sion. A 3D discrete element model with elastic sphericalparticles and the granulometry of a real sand is set up.
The numerical sample is stretched from different initial
states, and the influence of the strain rate direction onthe final state is studied within the stress ratio, void
ratio and mean stress space. Asymptotic behaviour is
clearly observed, although the grains remain intact (nograin crushing is considered). The extension asymptotic
states are observed, and the notion of a normal exten-
sion line is introduced. The extension asymptotic states
coincide with the peak states observed in the shear testswith constant stress path direction in dense samples.
Keywords asymptotic behaviour · critical state ·discrete element method · particle crushing · sand
1 Introduction
Asymptotic behaviour is one of the most striking fea-
tures in the behaviour of granular materials. Specificasymptotic states have been known since the early stud-
ies of soil mechanics. Casagrande [4], Hvorslev [27] and
Taylor [60] are among the pioneers who observed crit-
ical state behaviour of soils – a particular asymptoticstate related to constant volume shearing. Schofield and
Wroth [54] and Roscoe and Burland [52] combined the
existence of critical states and compression asymptotic
David MasınCharles University in Prague, Faculty of Science, Albertov 6,12843 Prague 2, Czech RepublicTel.: +420-2-21951552Fax: +420-2-21951556E-mail: [email protected]
states (revealed in normal compression behaviour) into
a unified framework of critical state soil mechanics.
More generally, Gudehus et al. [24,21] understood asymp-
totic states to be attractors in the behaviour of granu-lar materials, which are independent of the initial state.
They proposed that each direction of strain rate with
a volume decrease is uniquely linked to a particularasymptotic stress ratio and a particular path in the
mean stress vs. void ratio plane (normal compression
line). Gudehus [22] later argued that the asymptoticstress ratio should not be expected to remain constant
in the course of loading because of grain crushing and
changing granulometry. The asymptotic state has also
been denoted as the state limit [25], or the swept-out-memory state [24]. More recently, Gudehus [23] and
Gudehus and Masın [25] have extended the asymptotic
state concept into the volume increase (extension) regime,and identified theoretical limits to the asymptotic be-
haviour. The ”extension asymptotic states” have not
yet been observed experimentally.
Asymptotic behaviour has been the subject of ex-
perimental investigation; critical state and normal com-pression behaviour have been well documented. More
generally, compression asymptotic states have been stud-
ied, and confirmed, by Goldscheider [20] and Chu andLo [9], who performed true and axisymmetric triaxial
tests on sands with strain path control. They observed
a unique relationship between the strain path directionand asymptotic stress ratio. Asymptotic behaviour has
also been studied by testing fine-grained soils (clays),
most notably by Topolnicki et al. [61]. They observed
that the stress paths of tests starting at an arbitrarystate became parallel to the asymptotic path in some
cases. Further insight into the micro-mechanics of gran-
ular materials has been given, for example, in [19].
2 David Masın
Another means of investigating the asymptotic state
is the discrete element method (DEM). Different au-thors typically focused on specific asymptotic states;
the existence of the critical state is confirmed in [56,
53,65,48,7,8,67]. Salot et al. [53] and Wang et al. [65]demonstrated that the value of the critical state fric-
tion angle depends on the particle shape. The influ-
ence of the particle shape on the asymptotic behaviourwas also emphasized in [30,17,33,38,57]. Luding and
Alonso-Marroquın [36] observed that the critical state
friction angle was constant for non-adhesive contact be-
haviour, but showed a pressure dependence for adhesiveinter-particle contacts. For further details of the theo-
retical investigation of the micromechanics of granular
assemblies, the reader is referred to [1,51,32] and thereferences therein.
A number of authors argued that the existence of
asymptotic states is directly linked to particle crush-
ing [64,2,7,8,44,45,43]. Using DEM simulations, the
existence of normal compression lines was explained byparticle crushing in references [64,2,7,8,44]. Cheng et
al. [7,8] predicted both critical states and normal com-
pression lines, using the same parameter sets, creatinga more complete picture of the granular material be-
haviour. They argued that particle crushing is a cause
of the asymptotic behaviour.
The aim of this paper is to provide a detailed char-
acterisation of the asymptotic behaviour of particulatematerials. After introducing the asymptotic state frame-
work, a comprehensive DEM model is set up. Using
this model, numerical experiments were performed toreveal the asymptotic states. This included characteris-
tics that have not been investigated before, such as the
asymptotic behaviour in extension. It is also discussed
whether particle crushing is a cause, or a consequence,of the asymptotic properties of granular assemblies.
2 Asymptotic state framework
Asymptotic state is defined as that state reached after a
sufficiently long proportional stretching, i.e. stretching
with a constant direction of the strain rate. Conceptualrepresentation of asymptotic states has been proposed
by Gudehus [23] and Gudehus and Masın [25]. In this
work, we focus on axisymmetric stress and deforma-tion states, where the strain rate tensor is fully charac-
terised by axial ǫa and radial ǫr components. Similarly,
the stress tensor is given by σa (axial stress) and σr(radial stress). It is assumed that the granular materialbehaviour is governed only by its stress state and void
ratio e (defined as the void volume over the solid vol-
ume). The strain rate direction may be characterised
by an angle ψǫ (see Figure 1a), and the stress obliquity
is quantified by the angle ψσ (Figure 1b).
2
ψε.
ε r
aε.
.d
c
−c−i
−d
i
(a)
2σr
σψ
aσ
i
c
−c
−d
d
(b)
Fig. 1 Definition of angles ψǫ and ψσ [25]. ”i” denotesthe isotropic direction, ”c” denotes the isochoric (constantvolume) direction, and ”d” denotes the theoretical limit forasymptotic state behaviour.
2.1 Compression and constant volume asymptoticstates
According to the current understanding of the asymp-totic behaviour of a granular assembly, proportional
deformation (constant ψǫ) will ultimately lead to an
asymptotic state characterised by a constant ψσ. Not
all stretching directions will, however, lead to a uniqueasymptotic state. First, we focus on compression and
constant volume stretching paths, characterised by a
volume decrease (constant volume in the limiting case)and −90◦ ≤ ψǫ ≤ 90◦. These directions of ψǫ are repre-
sented in Figure 2a. Isotropic compression1 ψǫ = 0◦ is
indicated with the index ’i’; limiting values ψǫ = ±90◦
(constant volume shearing) with the index ’c’. Each ψǫ
is related to a unique asymptotic value of ψσ, as demon-
strated in Figure 2b. In the special case of isochoric de-
formation (±c, critical state), the corresponding valueof ψσ is directly linked to the critical state friction angle
by
tanψσ(±c) = ±(
2√2 sinϕc
3∓ sinϕc
)
=
√2
3M (1)
where M = q/p at the critical state (p = (σa + 2σr)/3,
q = σa − σr). Each of the asymptotic states also have
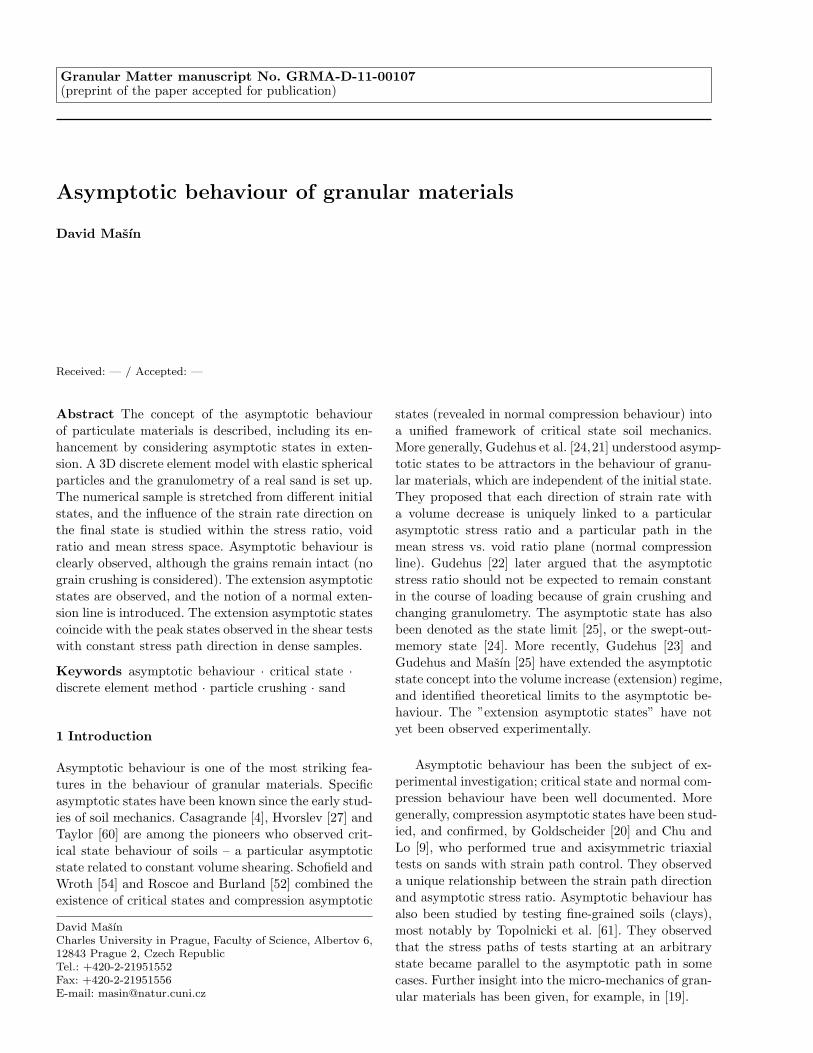
a unique trace in the mean stress p vs. void ratio eplane (Figure 2c). Asymptotic states in this plane are
traditionally denoted as normal compression lines. In
some soils (mainly clays), they are found to be linear in
1 Note that the isotropic asymptotic state is defined hereby ψǫ = 0◦; the corresponding asymptotic ψσ may then differfrom 0◦ in the case of anisotropic structure.
Asymptotic behaviour of granular materials 3
the ln p vs. ln(1 + e) plane [3], but this is not a general
rule. All normal compression lines are bound betweenisotropic normal compression line, attributed to ψǫ(i),
and the critical state line, linked with ψǫ(±c). Different
measures have been defined throughout the literature torepresent the position of the given normal compression
line. The two most commonly used are the relative void
ratio re and the overconsolidation ratio OCR2
re =e− edec − ed
OCR =p∗ep
(2)
where ed and ec are minimum and critical state voidratios at the current mean stress respectively. p∗e is
the Hvorslev equivalent pressure, defined as the mean
stress at the isotropic normal compression line at thecurrent void ratio. It is clear that the isotropic nor-
mal compression line is characterised by re = rei > 1
and OCR = 1, and the critical state line by re = 1
and OCR = OCRc > 1. Each of the compressionasymptotic states can be attributed to a unique value
of 1 ≤ re ≤ rei, or OCRc ≥ OCR ≥ 1.
Compression asymptotic states are predicted by con-stitutive models based on the critical state theory, such
as the Modified Cam clay model [52], or hypoplastic
models [66,39,40]. The models incorporate the notionof a state boundary surface (SBS), which is defined
as a boundary of all possible states in the stress vs.
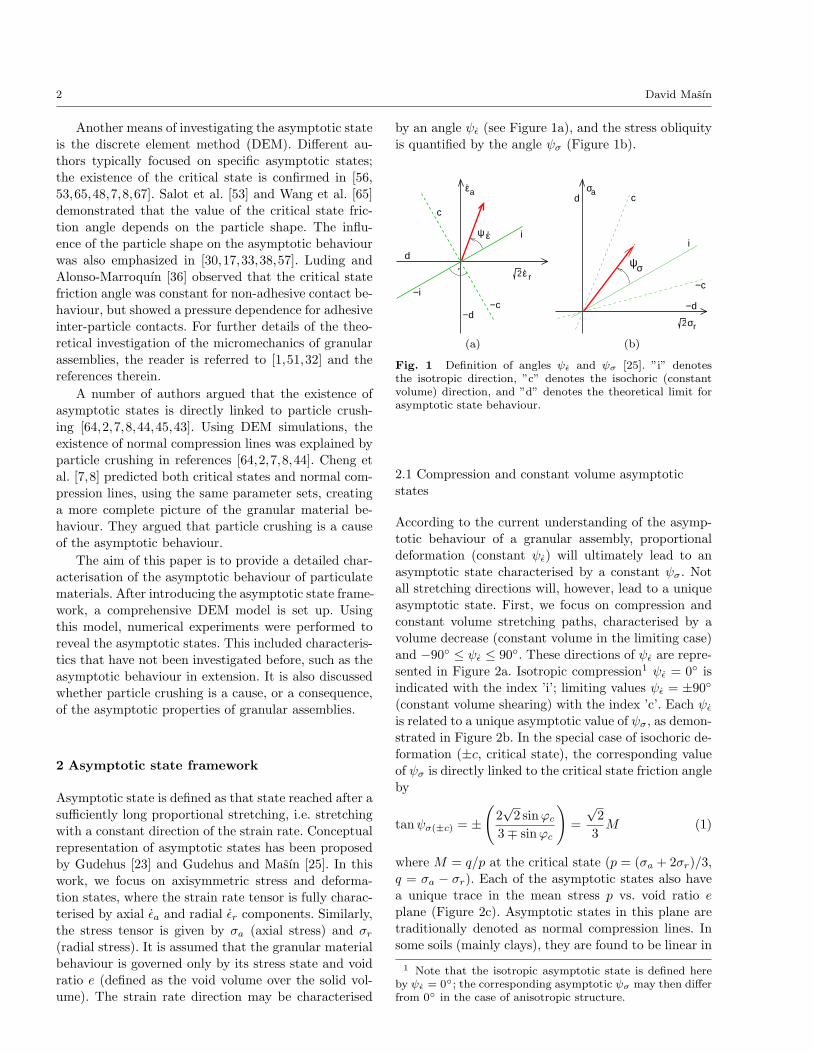
void ratio space. For the purpose of the present dis-
cussion, we also define the asymptotic state boundarysurface (ASBS) (also known as the swept-out-memory
surface [41]), which is an envelope of all asymptotic
states. Critical state soil mechanics models consider thetwo surfaces to coincide. A constant void ratio cross-
section through this surface in the compression regime
is sketched in Figure 2d. In the principal stress vs. voidratio space, the ASBS is a four-dimmensional object;
this is shown in Figure 3d for the axisymmetric case.
An important property of compression asymptotic
states is that they may be reached by proportional com-pression from the stress-free state.
2.2 Extension asymptotic states
Asymptotic behaviour in compression and under con-
stant volume is considered to be a well-proven prop-
erty of a granular assembly. However, the contrary istrue regarding asymptotic behaviour in extension. As
suggested by Gudehus [23] (Chapters 2 and 3) and
Gudehus and Masın [25], asymptotic states can also
2 OCR is traditionally defined as OCR = pc/p, where pcis the preconsolidation pressure. We prefer the definition (2),as no additional assumptions about the quasi-elastic soil be-haviour are needed for its quantification.
ψε.
aε.
2ε r.
d
i
c
−c−i
−d
(a)
ψσ
εψ
c
−c
i
−90°
90°
(b)
10 100 1000 [kPa]
ln(1+e)
isotropic normal compression line
ec
p
critical state line
normal compression line
arbitraryinitialstate
(c)2σr
aσc
−c
−d
d
i
εψ
(d)
Fig. 2 Graphical representation of compression asymptoticstates. Zones relevant to asymptotic states in compression arehighlighted in grey.
2σr
aσ
i
c
−c
e
−d
d
Fig. 3 Sketch of the asymptotic state boundary surface inthe stress vs. void ratio space for the axisymmetric case.
be reached after proportional stretching along exten-sion (volume increase) paths. These asymptotic states
have, to the author’s knowledge, not yet been observed
experimentally; their existence is expected solely from
theoretical arguments. The stretching directions thatlead to extension asymptotic states are depicted in Fig-
ure 4a. Limiting values of ψǫ and ψσ are denoted with
indices ’d’ (asymptotic σr = 0) and ’-d’ (asymptotic
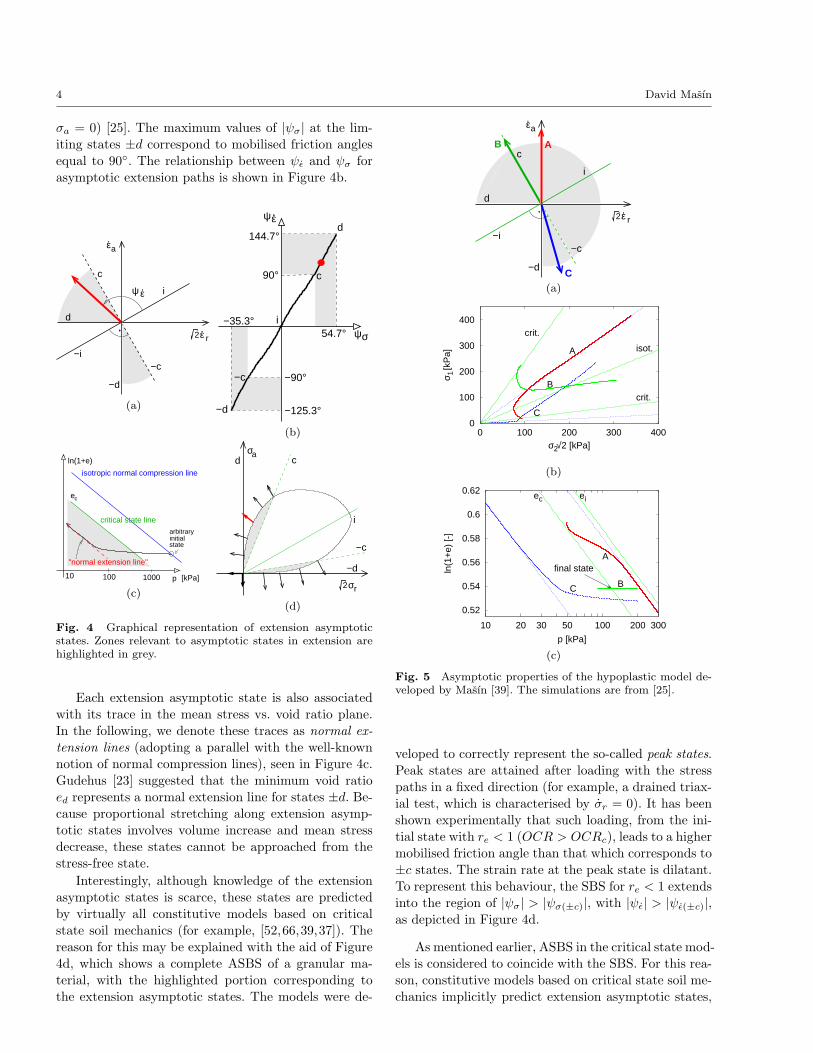
4 David Masın
σa = 0) [25]. The maximum values of |ψσ| at the lim-
iting states ±d correspond to mobilised friction anglesequal to 90◦. The relationship between ψǫ and ψσ for
asymptotic extension paths is shown in Figure 4b.
aε.
2ε r.
ψε.
d
i
c
−c−i
−d
(a)
ψσ
εψ
c
−c
i
−90°
−125.3°
d
−d
144.7°
54.7°−35.3°
90°
(b)
10 100 1000 p [kPa]
ln(1+e)
isotropic normal compression line
ec
critical state line
"normal extension line"
stateinitialarbitrary
(c)2σr
aσc
−c
−d
d
i
(d)
Fig. 4 Graphical representation of extension asymptoticstates. Zones relevant to asymptotic states in extension arehighlighted in grey.
Each extension asymptotic state is also associated
with its trace in the mean stress vs. void ratio plane.
In the following, we denote these traces as normal ex-
tension lines (adopting a parallel with the well-known
notion of normal compression lines), seen in Figure 4c.
Gudehus [23] suggested that the minimum void ratioed represents a normal extension line for states ±d. Be-cause proportional stretching along extension asymp-
totic states involves volume increase and mean stress
decrease, these states cannot be approached from thestress-free state.
Interestingly, although knowledge of the extensionasymptotic states is scarce, these states are predicted
by virtually all constitutive models based on critical
state soil mechanics (for example, [52,66,39,37]). The
reason for this may be explained with the aid of Figure4d, which shows a complete ASBS of a granular ma-
terial, with the highlighted portion corresponding to
the extension asymptotic states. The models were de-
aε.
2ε r.
d
i
c
−c−i
−d
AB
C
(a)
0
100
200
300
400
0 100 200 300 400
σ 1 [k
Pa]
σ2 √2 [kPa]
B
C
A isot.
crit.
crit.
(b)
0.52
0.54
0.56
0.58
0.6
0.62
10 20 30 50 100 200 300
ln(1
+e)
[-]
p [kPa]
A
C B
eiec
final state
(c)
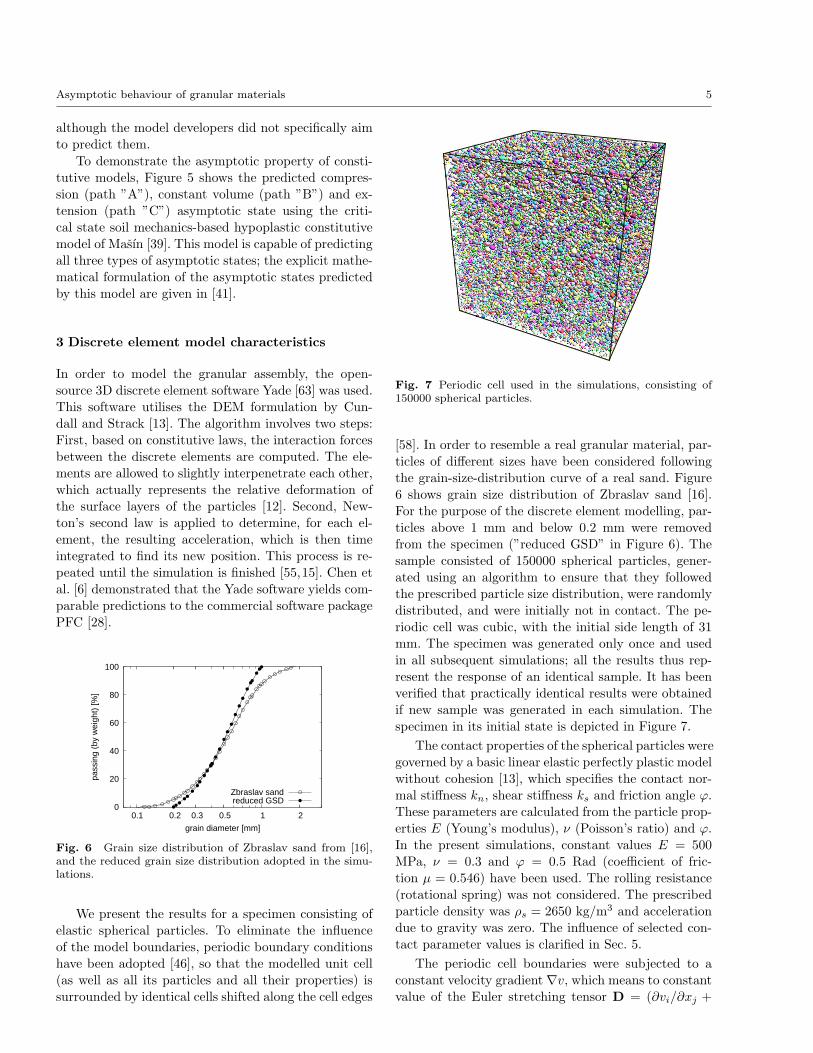
Fig. 5 Asymptotic properties of the hypoplastic model de-veloped by Masın [39]. The simulations are from [25].
veloped to correctly represent the so-called peak states.
Peak states are attained after loading with the stresspaths in a fixed direction (for example, a drained triax-
ial test, which is characterised by σr = 0). It has been
shown experimentally that such loading, from the ini-tial state with re < 1 (OCR > OCRc), leads to a higher
mobilised friction angle than that which corresponds to
±c states. The strain rate at the peak state is dilatant.
To represent this behaviour, the SBS for re < 1 extendsinto the region of |ψσ| > |ψσ(±c)|, with |ψǫ| > |ψǫ(±c)|,as depicted in Figure 4d.
As mentioned earlier, ASBS in the critical state mod-els is considered to coincide with the SBS. For this rea-
son, constitutive models based on critical state soil me-
chanics implicitly predict extension asymptotic states,
Asymptotic behaviour of granular materials 5
although the model developers did not specifically aim
to predict them.
To demonstrate the asymptotic property of consti-tutive models, Figure 5 shows the predicted compres-
sion (path ”A”), constant volume (path ”B”) and ex-
tension (path ”C”) asymptotic state using the criti-cal state soil mechanics-based hypoplastic constitutive
model of Masın [39]. This model is capable of predicting
all three types of asymptotic states; the explicit mathe-
matical formulation of the asymptotic states predictedby this model are given in [41].
3 Discrete element model characteristics
In order to model the granular assembly, the open-
source 3D discrete element software Yade [63] was used.This software utilises the DEM formulation by Cun-
dall and Strack [13]. The algorithm involves two steps:
First, based on constitutive laws, the interaction forcesbetween the discrete elements are computed. The ele-
ments are allowed to slightly interpenetrate each other,
which actually represents the relative deformation of
the surface layers of the particles [12]. Second, New-ton’s second law is applied to determine, for each el-
ement, the resulting acceleration, which is then time
integrated to find its new position. This process is re-peated until the simulation is finished [55,15]. Chen et
al. [6] demonstrated that the Yade software yields com-
parable predictions to the commercial software packagePFC [28].
0
20
40
60
80
100
0.2 0.3 0.5 2 0.1 1
pass
ing
(by
wei
ght)
[%]
grain diameter [mm]
Zbraslav sandreduced GSD
Fig. 6 Grain size distribution of Zbraslav sand from [16],and the reduced grain size distribution adopted in the simu-lations.
We present the results for a specimen consisting of
elastic spherical particles. To eliminate the influence
of the model boundaries, periodic boundary conditionshave been adopted [46], so that the modelled unit cell
(as well as all its particles and all their properties) is
surrounded by identical cells shifted along the cell edges
Fig. 7 Periodic cell used in the simulations, consisting of150000 spherical particles.
[58]. In order to resemble a real granular material, par-
ticles of different sizes have been considered following
the grain-size-distribution curve of a real sand. Figure6 shows grain size distribution of Zbraslav sand [16].
For the purpose of the discrete element modelling, par-
ticles above 1 mm and below 0.2 mm were removedfrom the specimen (”reduced GSD” in Figure 6). The
sample consisted of 150000 spherical particles, gener-
ated using an algorithm to ensure that they followedthe prescribed particle size distribution, were randomly
distributed, and were initially not in contact. The pe-
riodic cell was cubic, with the initial side length of 31
mm. The specimen was generated only once and usedin all subsequent simulations; all the results thus rep-
resent the response of an identical sample. It has been
verified that practically identical results were obtainedif new sample was generated in each simulation. The
specimen in its initial state is depicted in Figure 7.
The contact properties of the spherical particles were
governed by a basic linear elastic perfectly plastic model
without cohesion [13], which specifies the contact nor-
mal stiffness kn, shear stiffness ks and friction angle ϕ.These parameters are calculated from the particle prop-
erties E (Young’s modulus), ν (Poisson’s ratio) and ϕ.
In the present simulations, constant values E = 500MPa, ν = 0.3 and ϕ = 0.5 Rad (coefficient of fric-
tion µ = 0.546) have been used. The rolling resistance
(rotational spring) was not considered. The prescribedparticle density was ρs = 2650 kg/m3 and acceleration
due to gravity was zero. The influence of selected con-
tact parameter values is clarified in Sec. 5.
The periodic cell boundaries were subjected to a
constant velocity gradient ∇v, which means to constant
value of the Euler stretching tensor D = (∂vi/∂xj +
6 David Masın
∂vj/∂xi)/2, as no rotations have been considered. Ax-
isymmetric conditions were applied, such that D22 =D33 (subscripts 2 and 3 represent the horizontal direc-
tions, 1 the vertical direction). The angle ψǫ can then be
calculated by means of Figure 1a, where ǫa = D11 andǫr = D22 = D33. Off-diagonal components of D are al-
ways zero. A constant magnitude of the stretching rate
‖D‖ =√D : D = 167s−1 and step size∆t = 1.2∗10−7 s
was applied at all times. Local non-viscous damping [11,
5], has been used, with a damping coefficient χ = 0.5.
The influence of the selected step size and stretching
rate is discussed in more detail in Sec. 5.
The simulation results have been evaluated in termsof the Cauchy stress tensor σ and void ratio e. The void
ratio has been calculated from the current cell size and
total particle volume (particle overlaps have thus beenneglected). The macroscopic stress σ was obtained from
the inter-particle forces using the procedure outlined
in [31]. The angle ψσ was calculated using Figure 1b,
with σa = σ11 and σr = (σ22 + σ33)/2 (note that theslight difference between σ22 and σ33 has occured due
to the initial random inhomogeneities of the sample).
Only positive values of the angle ψǫ were considered inthis study.
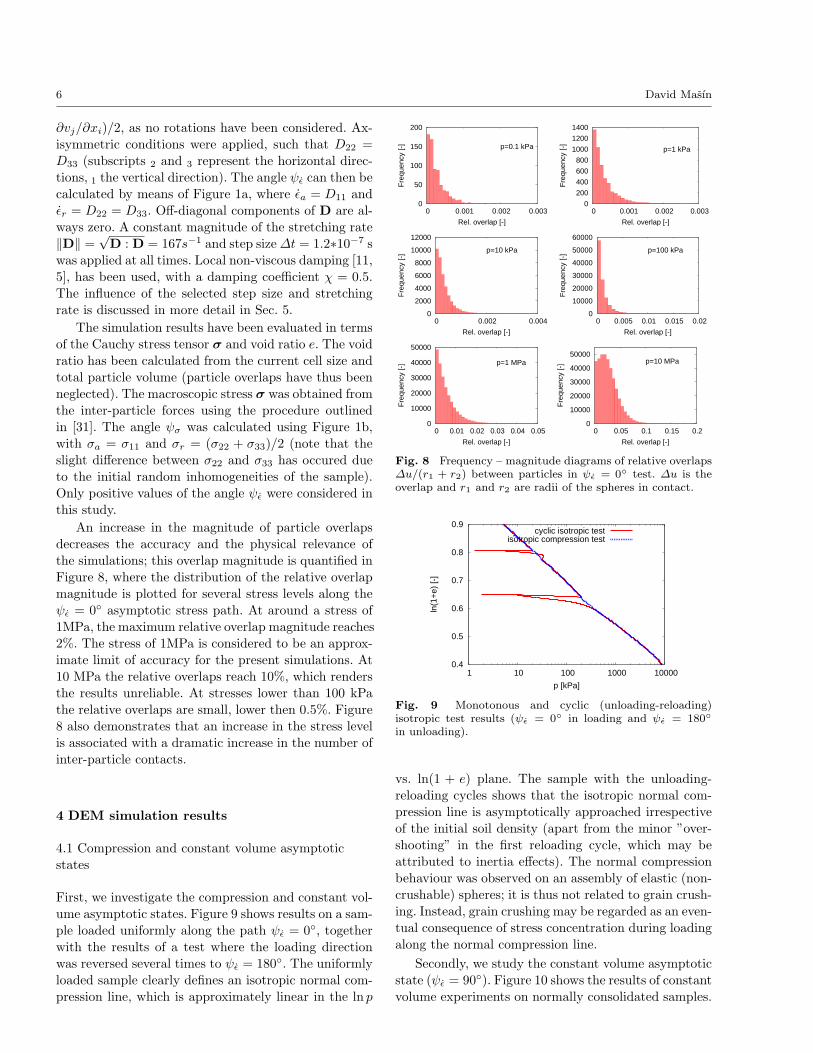
An increase in the magnitude of particle overlaps
decreases the accuracy and the physical relevance of
the simulations; this overlap magnitude is quantified in
Figure 8, where the distribution of the relative overlapmagnitude is plotted for several stress levels along the
ψǫ = 0◦ asymptotic stress path. At around a stress of
1MPa, the maximum relative overlap magnitude reaches2%. The stress of 1MPa is considered to be an approx-
imate limit of accuracy for the present simulations. At
10 MPa the relative overlaps reach 10%, which rendersthe results unreliable. At stresses lower than 100 kPa
the relative overlaps are small, lower then 0.5%. Figure
8 also demonstrates that an increase in the stress level
is associated with a dramatic increase in the number ofinter-particle contacts.
4 DEM simulation results
4.1 Compression and constant volume asymptotic
states
First, we investigate the compression and constant vol-
ume asymptotic states. Figure 9 shows results on a sam-
ple loaded uniformly along the path ψǫ = 0◦, together
with the results of a test where the loading directionwas reversed several times to ψǫ = 180◦. The uniformly
loaded sample clearly defines an isotropic normal com-
pression line, which is approximately linear in the ln p
0
50
100
150
200
0 0.001 0.002 0.003
Fre
quen
cy [-
]
Rel. overlap [-]
p=0.1 kPa
0
200
400
600
800
1000
1200
1400
0 0.001 0.002 0.003
Fre
quen
cy [-
]
Rel. overlap [-]
p=1 kPa
0
2000
4000
6000
8000
10000
12000
0 0.002 0.004
Fre
quen
cy [-
]
Rel. overlap [-]
p=10 kPa
0
10000
20000
30000
40000
50000
60000
0 0.005 0.01 0.015 0.02
Fre
quen
cy [-
]
Rel. overlap [-]
p=100 kPa
0
10000
20000
30000
40000
50000
0 0.01 0.02 0.03 0.04 0.05
Fre
quen
cy [-
]
Rel. overlap [-]
p=1 MPa
0
10000
20000
30000
40000
50000
0 0.05 0.1 0.15 0.2
Fre
quen
cy [-
]
Rel. overlap [-]
p=10 MPa
Fig. 8 Frequency – magnitude diagrams of relative overlaps∆u/(r1 + r2) between particles in ψǫ = 0◦ test. ∆u is theoverlap and r1 and r2 are radii of the spheres in contact.
0.4
0.5
0.6
0.7
0.8
0.9
1 10 100 1000 10000
ln(1
+e)
[-]
p [kPa]
cyclic isotropic testisotropic compression test
Fig. 9 Monotonous and cyclic (unloading-reloading)isotropic test results (ψǫ = 0◦ in loading and ψǫ = 180◦
in unloading).
vs. ln(1 + e) plane. The sample with the unloading-
reloading cycles shows that the isotropic normal com-
pression line is asymptotically approached irrespective
of the initial soil density (apart from the minor ”over-shooting” in the first reloading cycle, which may be
attributed to inertia effects). The normal compression
behaviour was observed on an assembly of elastic (non-crushable) spheres; it is thus not related to grain crush-
ing. Instead, grain crushing may be regarded as an even-
tual consequence of stress concentration during loadingalong the normal compression line.
Secondly, we study the constant volume asymptotic
state (ψǫ = 90◦). Figure 10 shows the results of constant
volume experiments on normally consolidated samples.
Asymptotic behaviour of granular materials 7
2σr
εψ = 90aσ
c
−c
−d
d
i
(a)
0
10
20
30
40
50
0.1 1 10 100 1000 10000
ψσ
[°]
p [kPa]
ψε=90°final state
(b)
0.4
0.5
0.6
0.7
0.8
0.9
0.1 1 10 100 1000 10000
ln(1
+e)
[-]
p [kPa]
isotropic compressionψε=90°
final state
(c)
0.4
0.5
0.6
0.7
0.8
0.9
0 10 20 30 40 50
ln (
1+e)
[-]
ψσ [°]
ψε=90°final state
(d)
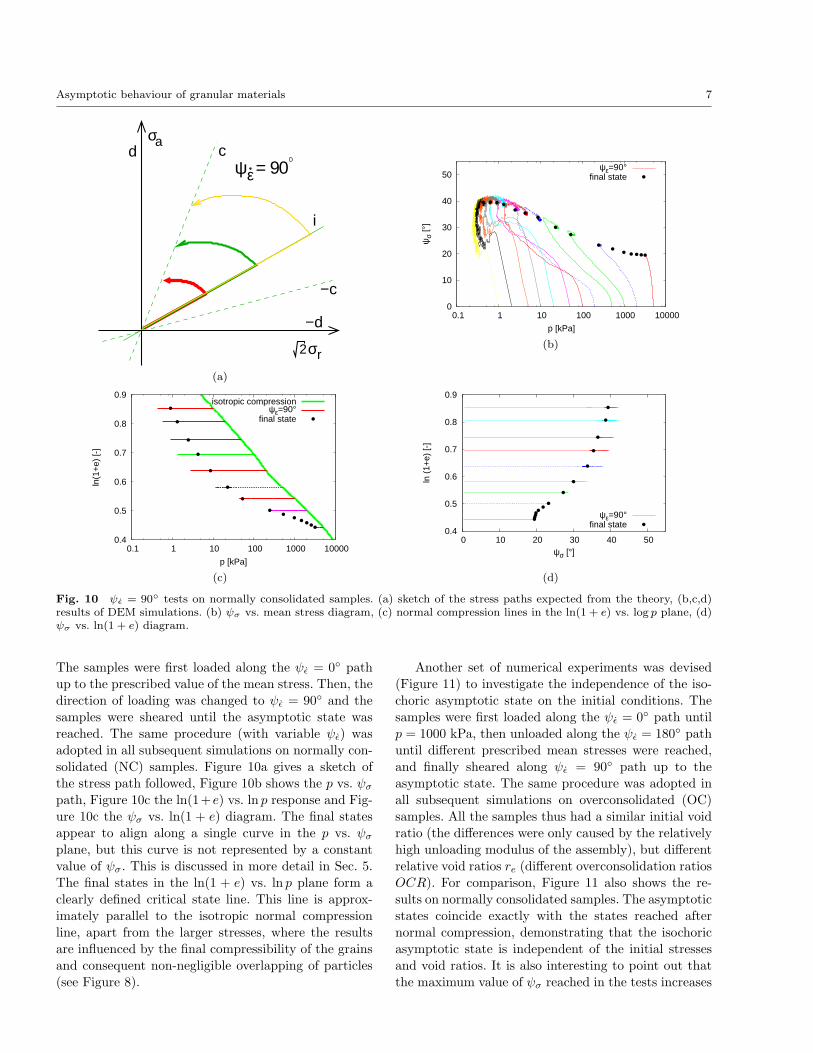
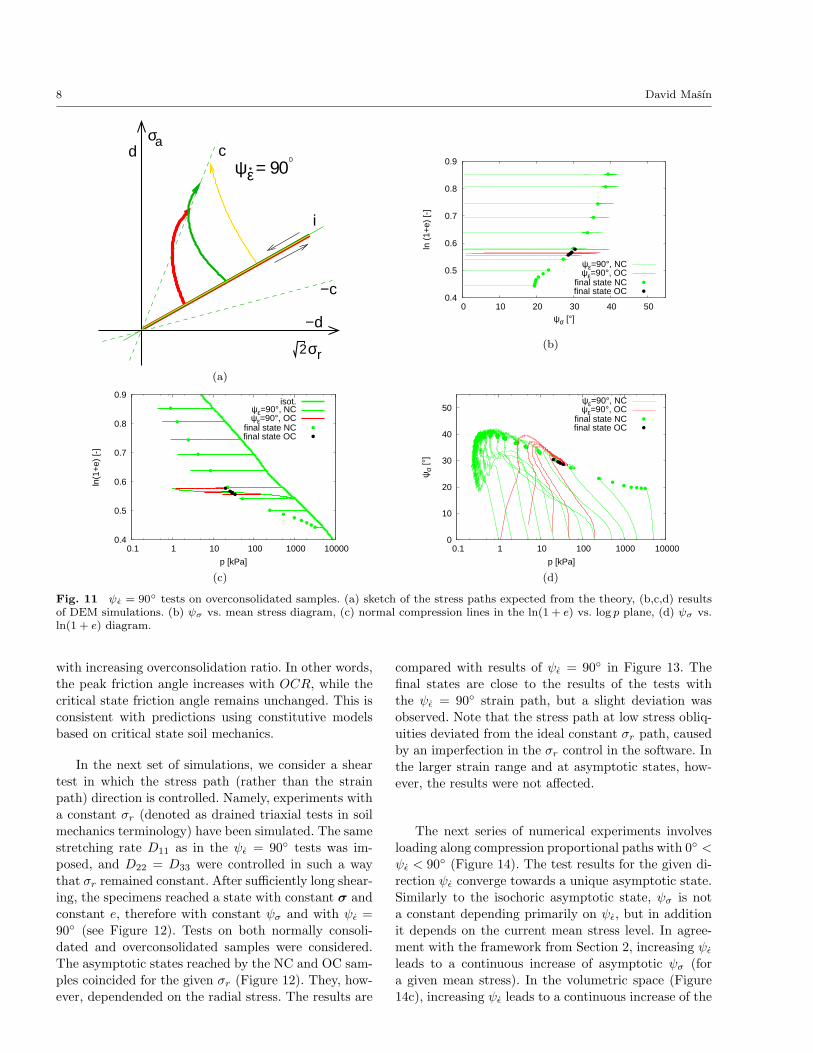
Fig. 10 ψǫ = 90◦ tests on normally consolidated samples. (a) sketch of the stress paths expected from the theory, (b,c,d)results of DEM simulations. (b) ψσ vs. mean stress diagram, (c) normal compression lines in the ln(1 + e) vs. log p plane, (d)ψσ vs. ln(1 + e) diagram.
The samples were first loaded along the ψǫ = 0◦ pathup to the prescribed value of the mean stress. Then, the
direction of loading was changed to ψǫ = 90◦ and the
samples were sheared until the asymptotic state wasreached. The same procedure (with variable ψǫ) was
adopted in all subsequent simulations on normally con-
solidated (NC) samples. Figure 10a gives a sketch ofthe stress path followed, Figure 10b shows the p vs. ψσ
path, Figure 10c the ln(1+e) vs. ln p response and Fig-
ure 10c the ψσ vs. ln(1 + e) diagram. The final states
appear to align along a single curve in the p vs. ψσ
plane, but this curve is not represented by a constant
value of ψσ. This is discussed in more detail in Sec. 5.
The final states in the ln(1 + e) vs. ln p plane form aclearly defined critical state line. This line is approx-
imately parallel to the isotropic normal compression
line, apart from the larger stresses, where the resultsare influenced by the final compressibility of the grains
and consequent non-negligible overlapping of particles
(see Figure 8).
Another set of numerical experiments was devised(Figure 11) to investigate the independence of the iso-
choric asymptotic state on the initial conditions. The
samples were first loaded along the ψǫ = 0◦ path untilp = 1000 kPa, then unloaded along the ψǫ = 180◦ path
until different prescribed mean stresses were reached,
and finally sheared along ψǫ = 90◦ path up to theasymptotic state. The same procedure was adopted in
all subsequent simulations on overconsolidated (OC)
samples. All the samples thus had a similar initial void
ratio (the differences were only caused by the relativelyhigh unloading modulus of the assembly), but different
relative void ratios re (different overconsolidation ratios
OCR). For comparison, Figure 11 also shows the re-sults on normally consolidated samples. The asymptotic
states coincide exactly with the states reached after
normal compression, demonstrating that the isochoricasymptotic state is independent of the initial stresses
and void ratios. It is also interesting to point out that
the maximum value of ψσ reached in the tests increases
8 David Masın
2σr
εψ = 90aσ
c
−c
−d
d
i
(a)
0.4
0.5
0.6
0.7
0.8
0.9
0 10 20 30 40 50
ln (
1+e)
[-]
ψσ [°]
ψε=90°, NCψε=90°, OC
final state NCfinal state OC
(b)
0.4
0.5
0.6
0.7
0.8
0.9
0.1 1 10 100 1000 10000
ln(1
+e)
[-]
p [kPa]
isot.ψε=90°, NCψε=90°, OC
final state NCfinal state OC
(c)
0
10
20
30
40
50
0.1 1 10 100 1000 10000
ψσ
[°]
p [kPa]
ψε=90°, NCψε=90°, OC
final state NCfinal state OC
(d)
Fig. 11 ψǫ = 90◦ tests on overconsolidated samples. (a) sketch of the stress paths expected from the theory, (b,c,d) resultsof DEM simulations. (b) ψσ vs. mean stress diagram, (c) normal compression lines in the ln(1 + e) vs. log p plane, (d) ψσ vs.ln(1 + e) diagram.
with increasing overconsolidation ratio. In other words,the peak friction angle increases with OCR, while the
critical state friction angle remains unchanged. This is
consistent with predictions using constitutive modelsbased on critical state soil mechanics.
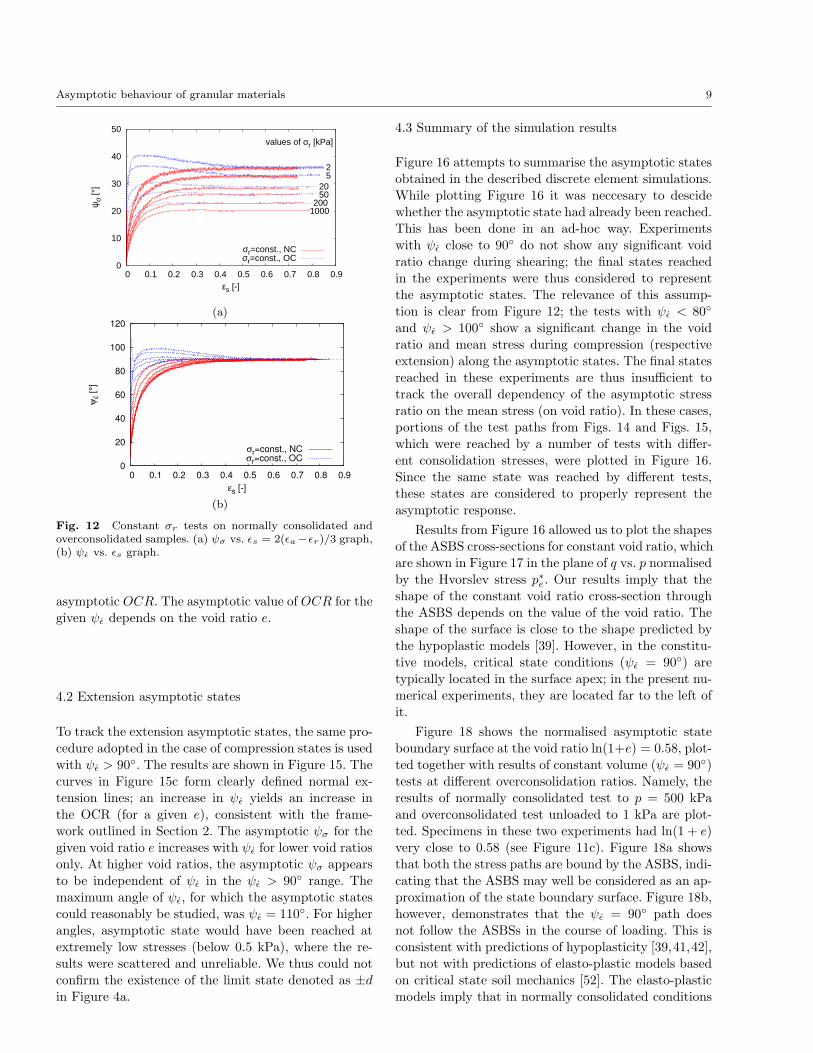
In the next set of simulations, we consider a shear
test in which the stress path (rather than the strainpath) direction is controlled. Namely, experiments with
a constant σr (denoted as drained triaxial tests in soil
mechanics terminology) have been simulated. The samestretching rate D11 as in the ψǫ = 90◦ tests was im-
posed, and D22 = D33 were controlled in such a way
that σr remained constant. After sufficiently long shear-ing, the specimens reached a state with constant σ and
constant e, therefore with constant ψσ and with ψǫ =
90◦ (see Figure 12). Tests on both normally consoli-
dated and overconsolidated samples were considered.The asymptotic states reached by the NC and OC sam-
ples coincided for the given σr (Figure 12). They, how-
ever, dependended on the radial stress. The results are
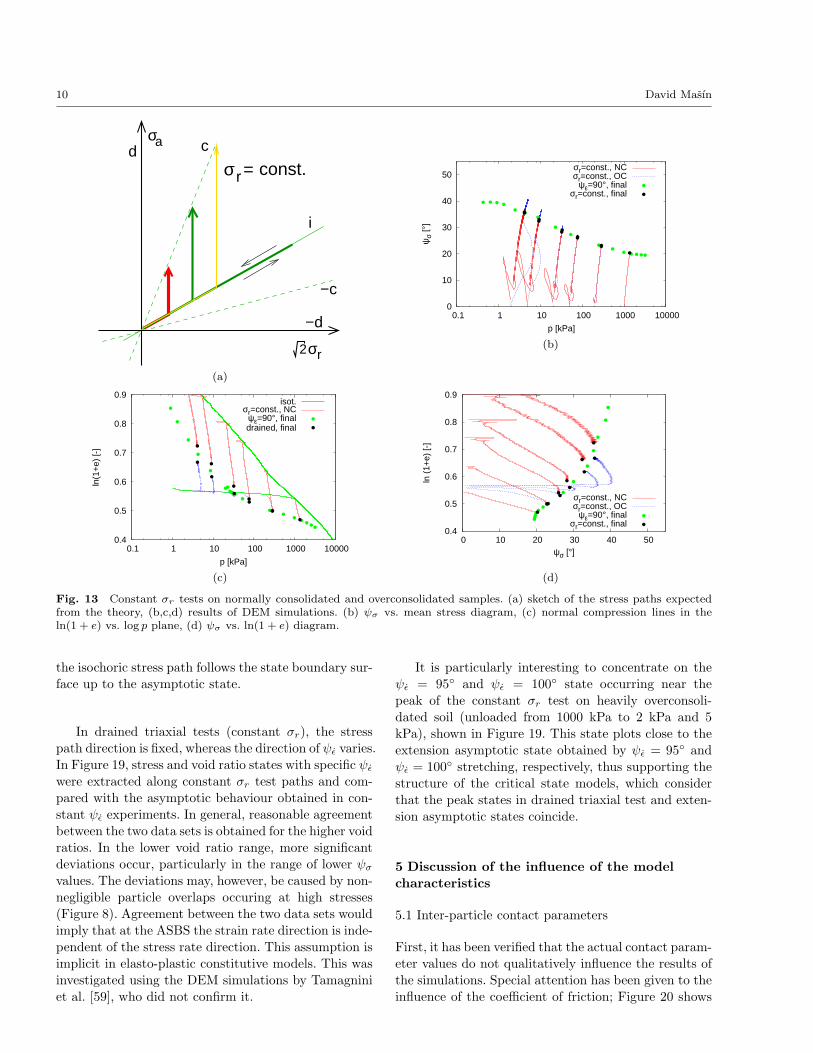
compared with results of ψǫ = 90◦ in Figure 13. Thefinal states are close to the results of the tests with
the ψǫ = 90◦ strain path, but a slight deviation was
observed. Note that the stress path at low stress obliq-uities deviated from the ideal constant σr path, caused
by an imperfection in the σr control in the software. In
the larger strain range and at asymptotic states, how-ever, the results were not affected.
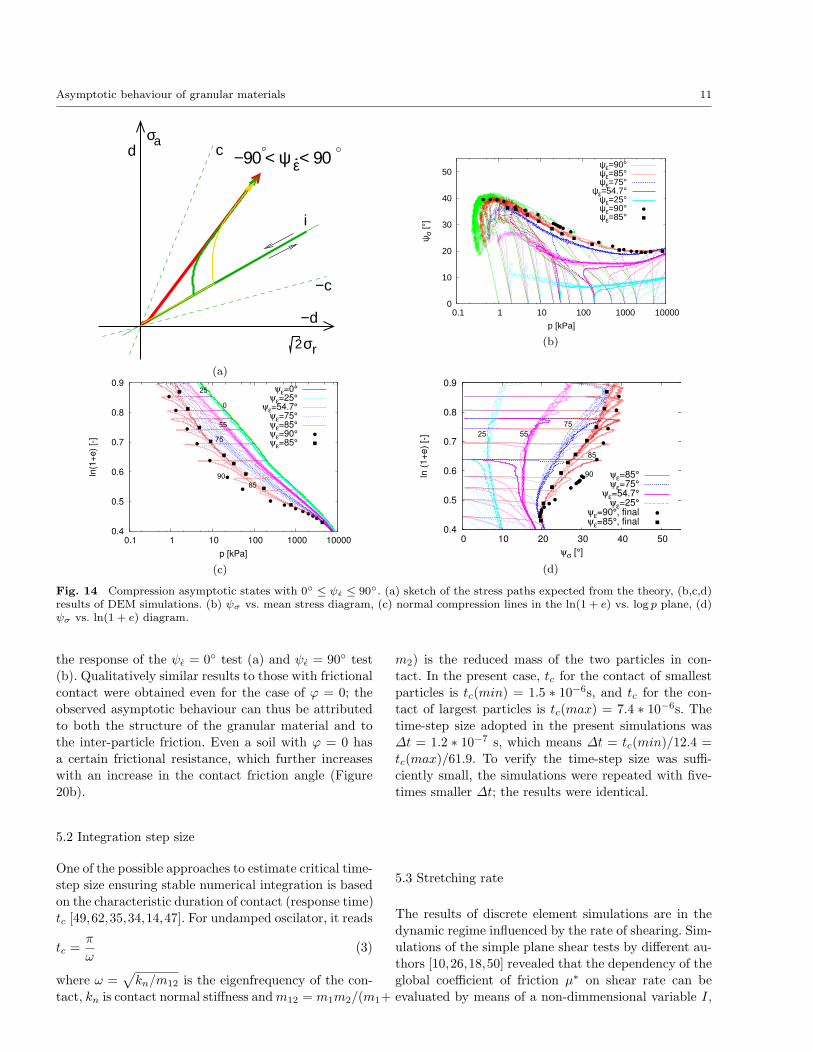
The next series of numerical experiments involvesloading along compression proportional paths with 0◦ <
ψǫ < 90◦ (Figure 14). The test results for the given di-
rection ψǫ converge towards a unique asymptotic state.Similarly to the isochoric asymptotic state, ψσ is not
a constant depending primarily on ψǫ, but in addition
it depends on the current mean stress level. In agree-
ment with the framework from Section 2, increasing ψǫ
leads to a continuous increase of asymptotic ψσ (for
a given mean stress). In the volumetric space (Figure
14c), increasing ψǫ leads to a continuous increase of the
Asymptotic behaviour of granular materials 9
0
10
20
30
40
50
0 0.1 0.2 0.3 0.4 0.5 0.6 0.7 0.8 0.9
ψσ
[°]
εs [-]
1000200
5020
52
values of σr [kPa]
σr=const., NCσr=const., OC
(a)
0
20
40
60
80
100
120
0 0.1 0.2 0.3 0.4 0.5 0.6 0.7 0.8 0.9
ψε
[°]
εs [-]
σr=const., NCσr=const., OC
(b)
Fig. 12 Constant σr tests on normally consolidated andoverconsolidated samples. (a) ψσ vs. ǫs = 2(ǫa−ǫr)/3 graph,(b) ψǫ vs. ǫs graph.
asymptotic OCR. The asymptotic value of OCR for the
given ψǫ depends on the void ratio e.
4.2 Extension asymptotic states
To track the extension asymptotic states, the same pro-
cedure adopted in the case of compression states is used
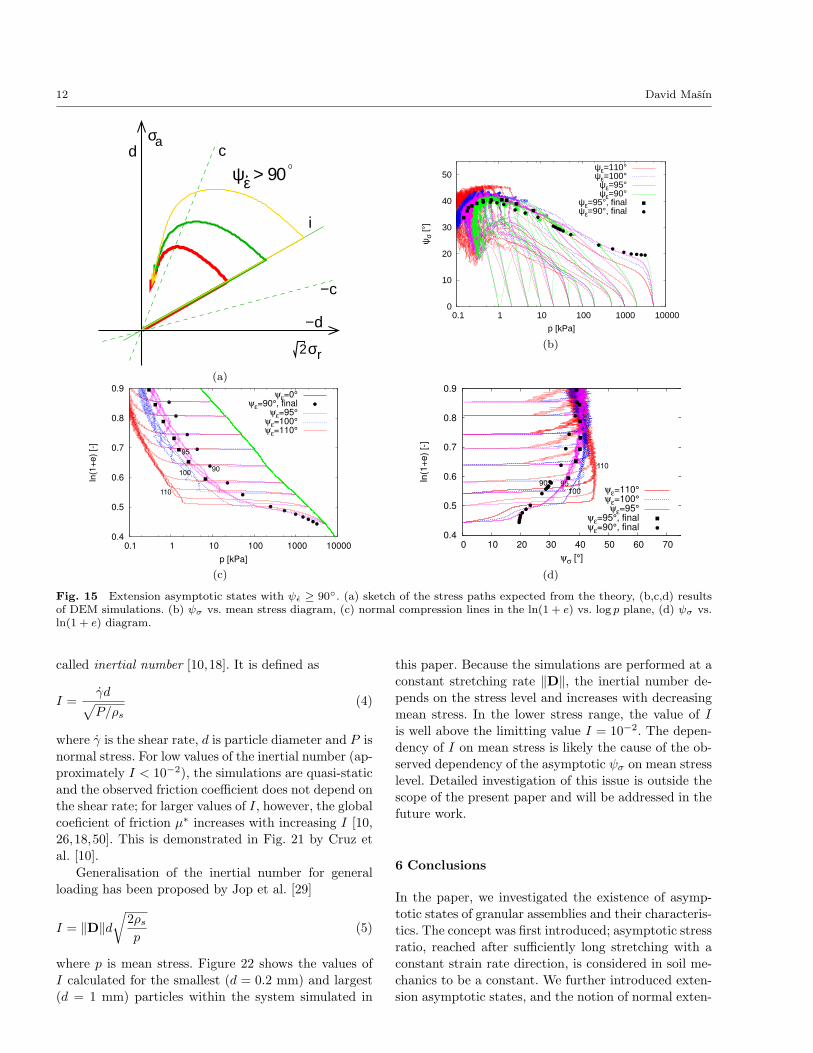
with ψǫ > 90◦. The results are shown in Figure 15. The
curves in Figure 15c form clearly defined normal ex-tension lines; an increase in ψǫ yields an increase in
the OCR (for a given e), consistent with the frame-
work outlined in Section 2. The asymptotic ψσ for thegiven void ratio e increases with ψǫ for lower void ratios
only. At higher void ratios, the asymptotic ψσ appears
to be independent of ψǫ in the ψǫ > 90◦ range. Themaximum angle of ψǫ, for which the asymptotic states
could reasonably be studied, was ψǫ = 110◦. For higher
angles, asymptotic state would have been reached at
extremely low stresses (below 0.5 kPa), where the re-sults were scattered and unreliable. We thus could not
confirm the existence of the limit state denoted as ±din Figure 4a.
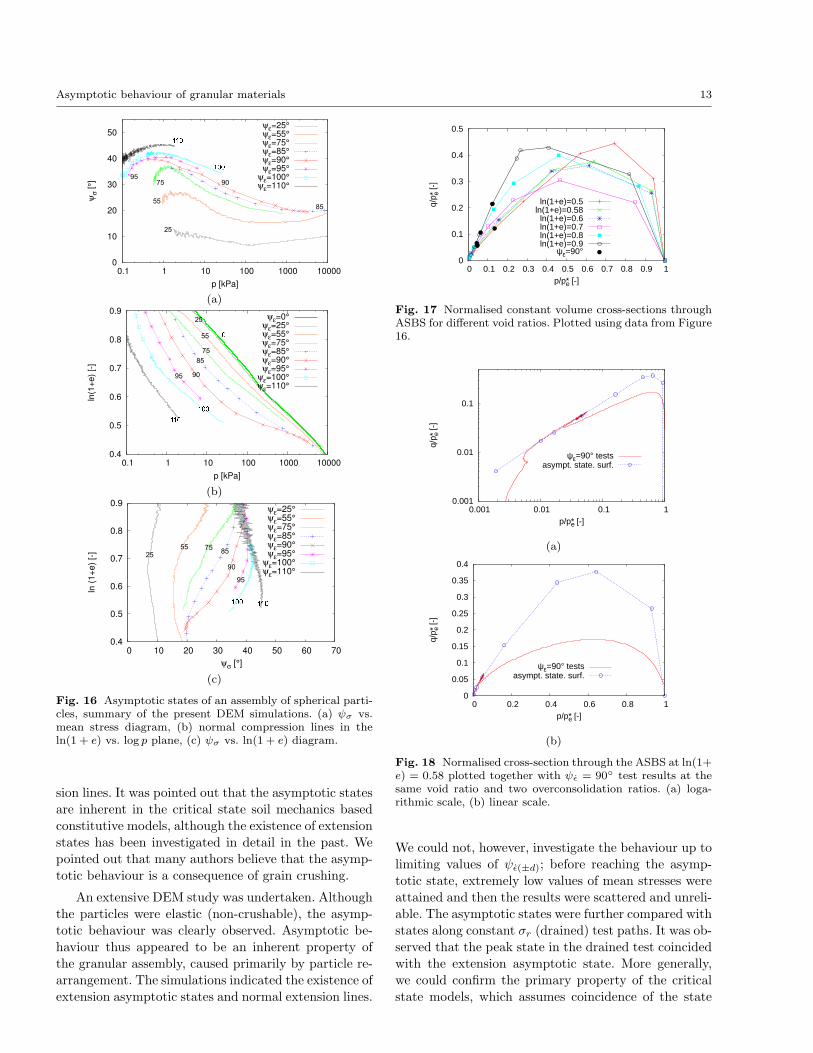
4.3 Summary of the simulation results
Figure 16 attempts to summarise the asymptotic statesobtained in the described discrete element simulations.
While plotting Figure 16 it was neccesary to descide
whether the asymptotic state had already been reached.This has been done in an ad-hoc way. Experiments
with ψǫ close to 90◦ do not show any significant void
ratio change during shearing; the final states reached
in the experiments were thus considered to representthe asymptotic states. The relevance of this assump-
tion is clear from Figure 12; the tests with ψǫ < 80◦
and ψǫ > 100◦ show a significant change in the voidratio and mean stress during compression (respective
extension) along the asymptotic states. The final states
reached in these experiments are thus insufficient totrack the overall dependency of the asymptotic stress
ratio on the mean stress (on void ratio). In these cases,
portions of the test paths from Figs. 14 and Figs. 15,
which were reached by a number of tests with differ-ent consolidation stresses, were plotted in Figure 16.
Since the same state was reached by different tests,
these states are considered to properly represent theasymptotic response.
Results from Figure 16 allowed us to plot the shapesof the ASBS cross-sections for constant void ratio, which
are shown in Figure 17 in the plane of q vs. p normalised
by the Hvorslev stress p∗e. Our results imply that theshape of the constant void ratio cross-section through
the ASBS depends on the value of the void ratio. The
shape of the surface is close to the shape predicted bythe hypoplastic models [39]. However, in the constitu-
tive models, critical state conditions (ψǫ = 90◦) are
typically located in the surface apex; in the present nu-
merical experiments, they are located far to the left ofit.
Figure 18 shows the normalised asymptotic state
boundary surface at the void ratio ln(1+e) = 0.58, plot-
ted together with results of constant volume (ψǫ = 90◦)
tests at different overconsolidation ratios. Namely, theresults of normally consolidated test to p = 500 kPa
and overconsolidated test unloaded to 1 kPa are plot-
ted. Specimens in these two experiments had ln(1 + e)very close to 0.58 (see Figure 11c). Figure 18a shows
that both the stress paths are bound by the ASBS, indi-
cating that the ASBS may well be considered as an ap-proximation of the state boundary surface. Figure 18b,
however, demonstrates that the ψǫ = 90◦ path does
not follow the ASBSs in the course of loading. This is
consistent with predictions of hypoplasticity [39,41,42],but not with predictions of elasto-plastic models based
on critical state soil mechanics [52]. The elasto-plastic
models imply that in normally consolidated conditions
10 David Masın
2σr
σ = r const.
aσ
i
−c
−d
d c
(a)
0
10
20
30
40
50
0.1 1 10 100 1000 10000
ψσ
[°]
p [kPa]
σr=const., NCσr=const., OC
ψε=90°, finalσr=const., final
(b)
0.4
0.5
0.6
0.7
0.8
0.9
0.1 1 10 100 1000 10000
ln(1
+e)
[-]
p [kPa]
isot.σr=const., NC
ψε=90°, finaldrained, final
(c)
0.4
0.5
0.6
0.7
0.8
0.9
0 10 20 30 40 50
ln (
1+e)
[-]
ψσ [°]
σr=const., NCσr=const., OC
ψε=90°, finalσr=const., final
(d)
Fig. 13 Constant σr tests on normally consolidated and overconsolidated samples. (a) sketch of the stress paths expectedfrom the theory, (b,c,d) results of DEM simulations. (b) ψσ vs. mean stress diagram, (c) normal compression lines in theln(1 + e) vs. log p plane, (d) ψσ vs. ln(1 + e) diagram.
the isochoric stress path follows the state boundary sur-face up to the asymptotic state.
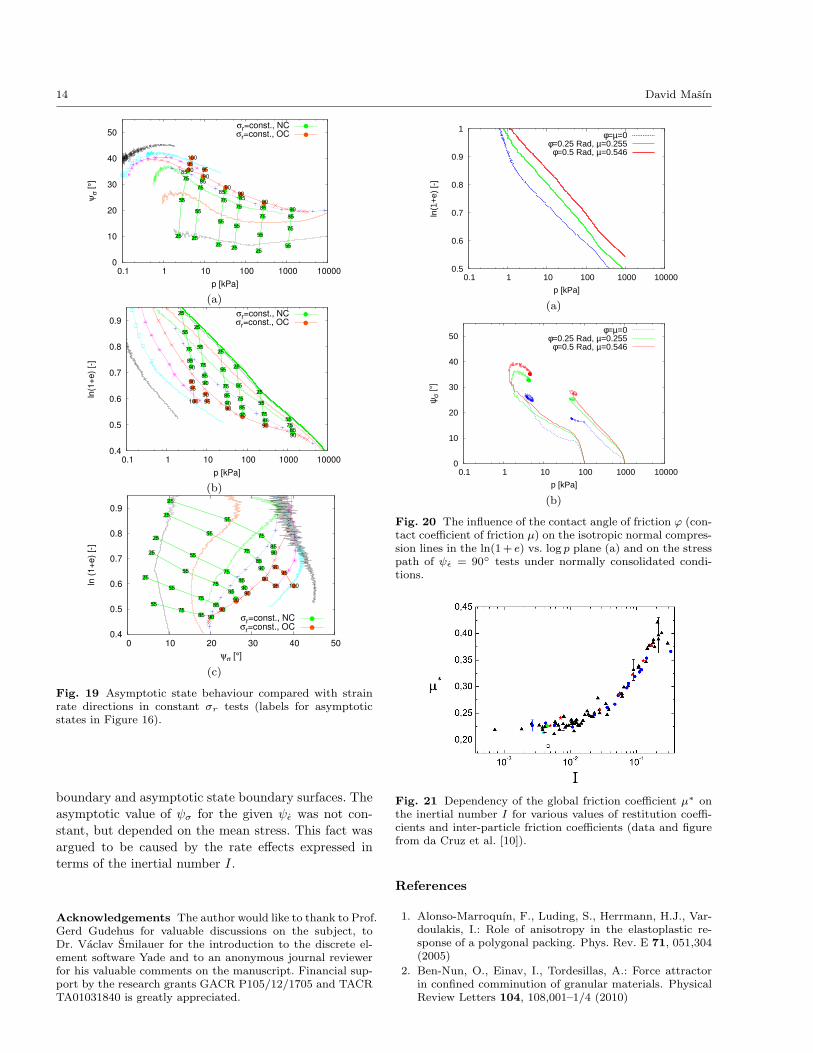
In drained triaxial tests (constant σr), the stress
path direction is fixed, whereas the direction of ψǫ varies.
In Figure 19, stress and void ratio states with specific ψǫ
were extracted along constant σr test paths and com-pared with the asymptotic behaviour obtained in con-
stant ψǫ experiments. In general, reasonable agreement
between the two data sets is obtained for the higher voidratios. In the lower void ratio range, more significant
deviations occur, particularly in the range of lower ψσ
values. The deviations may, however, be caused by non-negligible particle overlaps occuring at high stresses
(Figure 8). Agreement between the two data sets would
imply that at the ASBS the strain rate direction is inde-
pendent of the stress rate direction. This assumption isimplicit in elasto-plastic constitutive models. This was
investigated using the DEM simulations by Tamagnini
et al. [59], who did not confirm it.
It is particularly interesting to concentrate on theψǫ = 95◦ and ψǫ = 100◦ state occurring near the
peak of the constant σr test on heavily overconsoli-
dated soil (unloaded from 1000 kPa to 2 kPa and 5kPa), shown in Figure 19. This state plots close to the
extension asymptotic state obtained by ψǫ = 95◦ and
ψǫ = 100◦ stretching, respectively, thus supporting thestructure of the critical state models, which consider
that the peak states in drained triaxial test and exten-
sion asymptotic states coincide.
5 Discussion of the influence of the model
characteristics
5.1 Inter-particle contact parameters
First, it has been verified that the actual contact param-eter values do not qualitatively influence the results of
the simulations. Special attention has been given to the
influence of the coefficient of friction; Figure 20 shows
Asymptotic behaviour of granular materials 11
2σr
ε−90 < ψ < 90aσ
i
c
−c
−d
d
(a)
0
10
20
30
40
50
0.1 1 10 100 1000 10000
ψσ
[°]
p [kPa]
ψε=90°ψε=85°ψε=75°
ψε=54.7°ψε=25°ψε=90°ψε=85°
(b)
0.4
0.5
0.6
0.7
0.8
0.9
0.1 1 10 100 1000 10000
ln(1
+e)
[-]
p [kPa]
ψε=0°ψε=25°
ψε=54.7°ψε=75°ψε=85°ψε=90°ψε=85°
0
25
55
75
85
90
(c)
25 55
75
85
90
0.4
0.5
0.6
0.7
0.8
0.9
0 10 20 30 40 50
ln(1
+e)
[-]
ψσ [°]
ψε=85°ψε=75°
ψε=54.7°ψε=25°
ψε=90°, finalψε=85°, final
(d)
Fig. 14 Compression asymptotic states with 0◦ ≤ ψǫ ≤ 90◦. (a) sketch of the stress paths expected from the theory, (b,c,d)results of DEM simulations. (b) ψσ vs. mean stress diagram, (c) normal compression lines in the ln(1 + e) vs. log p plane, (d)ψσ vs. ln(1 + e) diagram.
the response of the ψǫ = 0◦ test (a) and ψǫ = 90◦ test(b). Qualitatively similar results to those with frictional
contact were obtained even for the case of ϕ = 0; the
observed asymptotic behaviour can thus be attributedto both the structure of the granular material and to
the inter-particle friction. Even a soil with ϕ = 0 has
a certain frictional resistance, which further increases
with an increase in the contact friction angle (Figure20b).
5.2 Integration step size
One of the possible approaches to estimate critical time-
step size ensuring stable numerical integration is basedon the characteristic duration of contact (response time)
tc [49,62,35,34,14,47]. For undamped oscilator, it reads
tc =π
ω(3)
where ω =√
kn/m12 is the eigenfrequency of the con-
tact, kn is contact normal stiffness andm12 = m1m2/(m1+
m2) is the reduced mass of the two particles in con-tact. In the present case, tc for the contact of smallest
particles is tc(min) = 1.5 ∗ 10−6s, and tc for the con-
tact of largest particles is tc(max) = 7.4 ∗ 10−6s. Thetime-step size adopted in the present simulations was
∆t = 1.2 ∗ 10−7 s, which means ∆t = tc(min)/12.4 =
tc(max)/61.9. To verify the time-step size was suffi-
ciently small, the simulations were repeated with five-times smaller ∆t; the results were identical.
5.3 Stretching rate
The results of discrete element simulations are in the
dynamic regime influenced by the rate of shearing. Sim-
ulations of the simple plane shear tests by different au-thors [10,26,18,50] revealed that the dependency of the
global coefficient of friction µ∗ on shear rate can be
evaluated by means of a non-dimmensional variable I,
12 David Masın
2σr
εψ > 90
aσ
i
c
−c
−d
d
(a)
0
10
20
30
40
50
0.1 1 10 100 1000 10000
ψσ
[°]
p [kPa]
ψε=110°ψε=100°
ψε=95°ψε=90°
ψε=95°, finalψε=90°, final
(b)
0.4
0.5
0.6
0.7
0.8
0.9
0.1 1 10 100 1000 10000
ln(1
+e)
[-]
p [kPa]
ψε=0°ψε=90°, final
ψε=95°ψε=100°ψε=110°
90
95
100
110
(c)
0.4
0.5
0.6
0.7
0.8
0.9
0 10 20 30 40 50 60 70
ln(1
+e)
[-]
ψσ [°]
ψε=110°ψε=100°ψε=95°
ψε=95°, finalψε=90°, final
110
100
9590
(d)
Fig. 15 Extension asymptotic states with ψǫ ≥ 90◦. (a) sketch of the stress paths expected from the theory, (b,c,d) resultsof DEM simulations. (b) ψσ vs. mean stress diagram, (c) normal compression lines in the ln(1 + e) vs. log p plane, (d) ψσ vs.ln(1 + e) diagram.
called inertial number [10,18]. It is defined as
I =γd
√
P/ρs(4)
where γ is the shear rate, d is particle diameter and P isnormal stress. For low values of the inertial number (ap-
proximately I < 10−2), the simulations are quasi-static
and the observed friction coefficient does not depend on
the shear rate; for larger values of I, however, the globalcoeficient of friction µ∗ increases with increasing I [10,
26,18,50]. This is demonstrated in Fig. 21 by Cruz et
al. [10].
Generalisation of the inertial number for generalloading has been proposed by Jop et al. [29]
I = ‖D‖d√
2ρsp
(5)
where p is mean stress. Figure 22 shows the values of
I calculated for the smallest (d = 0.2 mm) and largest
(d = 1 mm) particles within the system simulated in
this paper. Because the simulations are performed at aconstant stretching rate ‖D‖, the inertial number de-
pends on the stress level and increases with decreasing
mean stress. In the lower stress range, the value of Iis well above the limitting value I = 10−2. The depen-
dency of I on mean stress is likely the cause of the ob-
served dependency of the asymptotic ψσ on mean stresslevel. Detailed investigation of this issue is outside the
scope of the present paper and will be addressed in the
future work.
6 Conclusions
In the paper, we investigated the existence of asymp-
totic states of granular assemblies and their characteris-
tics. The concept was first introduced; asymptotic stress
ratio, reached after sufficiently long stretching with aconstant strain rate direction, is considered in soil me-
chanics to be a constant. We further introduced exten-
sion asymptotic states, and the notion of normal exten-
Asymptotic behaviour of granular materials 13
0
10
20
30
40
50
0.1 1 10 100 1000 10000
ψσ
[°]
p [kPa]
ψε=25°ψε=55°ψε=75°ψε=85°ψε=90°ψε=95°
ψε=100°ψε=110°
25
55
75
85
9095
���
���
(a)
0.4
0.5
0.6
0.7
0.8
0.9
0.1 1 10 100 1000 10000
ln(1+e)[-]
p [kPa]
ψε=0°ψε=25°ψε=55°ψε=75°ψε=85°ψε=90°ψε=95°
ψε=100°ψε=110°
25
55
75
85
9095
���
���
�
(b)
0.4
0.5
0.6
0.7
0.8
0.9
0 10 20 30 40 50 60 70
ln(1
+e
)[-
]
ψσ [°]
ψε=25°ψε=55°ψε=75°ψε=85°ψε=90°ψε=95°
ψε=100°ψε=110°
25
55 7585
90
95
��� ���
(c)
Fig. 16 Asymptotic states of an assembly of spherical parti-cles, summary of the present DEM simulations. (a) ψσ vs.mean stress diagram, (b) normal compression lines in theln(1 + e) vs. log p plane, (c) ψσ vs. ln(1 + e) diagram.
sion lines. It was pointed out that the asymptotic statesare inherent in the critical state soil mechanics based
constitutive models, although the existence of extension
states has been investigated in detail in the past. Wepointed out that many authors believe that the asymp-
totic behaviour is a consequence of grain crushing.
An extensive DEM study was undertaken. Although
the particles were elastic (non-crushable), the asymp-
totic behaviour was clearly observed. Asymptotic be-
haviour thus appeared to be an inherent property ofthe granular assembly, caused primarily by particle re-
arrangement. The simulations indicated the existence of
extension asymptotic states and normal extension lines.
0
0.1
0.2
0.3
0.4
0.5
0 0.1 0.2 0.3 0.4 0.5 0.6 0.7 0.8 0.9 1
q/p e*
[-]
p/pe* [-]
ln(1+e)=0.5ln(1+e)=0.58
ln(1+e)=0.6ln(1+e)=0.7ln(1+e)=0.8ln(1+e)=0.9
ψε=90°
Fig. 17 Normalised constant volume cross-sections throughASBS for different void ratios. Plotted using data from Figure16.
0.001
0.01
0.1
0.001 0.01 0.1 1
q/p e*
[-]
p/pe* [-]
ψε=90° testsasympt. state. surf.
(a)
0
0.05
0.1
0.15
0.2
0.25
0.3
0.35
0.4
0 0.2 0.4 0.6 0.8 1
q/p e*
[-]
p/pe* [-]
ψε=90° testsasympt. state. surf.
(b)
Fig. 18 Normalised cross-section through the ASBS at ln(1+e) = 0.58 plotted together with ψǫ = 90◦ test results at thesame void ratio and two overconsolidation ratios. (a) loga-rithmic scale, (b) linear scale.
We could not, however, investigate the behaviour up to
limiting values of ψǫ(±d); before reaching the asymp-
totic state, extremely low values of mean stresses wereattained and then the results were scattered and unreli-
able. The asymptotic states were further compared with
states along constant σr (drained) test paths. It was ob-
served that the peak state in the drained test coincidedwith the extension asymptotic state. More generally,
we could confirm the primary property of the critical
state models, which assumes coincidence of the state
14 David Masın
0
10
20
30
40
50
0.1 1 10 100 1000 10000
ψσ
[°]
p [kPa]
σr=const., NCσr=const., OC
85
85
85
85
85
85
75
90
90
90
90
90
90
95
95
2525
25
100
2525
5555
55
55
55
55 75
75
75
75
75
(a)
0.4
0.5
0.6
0.7
0.8
0.9
0.1 1 10 100 1000 10000
ln(1+e)[-]
p [kPa]
σr=const., NCσr=const., OC
90
90
85
85
85
85
85
85
90
90
100
90
90
90
90
90
95
95
25
25
25
25
25
55
55
55
55
55
55
75
75
75
75
75
75
(b)
0.4
0.5
0.6
0.7
0.8
0.9
0 10 20 30 40 50
ln(1
+e
)[-
]
ψσ [°]
σr=const., NCσr=const., OC
85
85
85
85
85
90
90
90
90
90
90
90
95
95
85
90
90
100
25
25
25
25
25
55
55
55
55
55
55
75
75
75
75
75
75
(c)
Fig. 19 Asymptotic state behaviour compared with strainrate directions in constant σr tests (labels for asymptoticstates in Figure 16).
boundary and asymptotic state boundary surfaces. Theasymptotic value of ψσ for the given ψǫ was not con-
stant, but depended on the mean stress. This fact was
argued to be caused by the rate effects expressed interms of the inertial number I.
Acknowledgements The author would like to thank to Prof.Gerd Gudehus for valuable discussions on the subject, toDr. Vaclav Smilauer for the introduction to the discrete el-ement software Yade and to an anonymous journal reviewerfor his valuable comments on the manuscript. Financial sup-port by the research grants GACR P105/12/1705 and TACRTA01031840 is greatly appreciated.
0.5
0.6
0.7
0.8
0.9
1
0.1 1 10 100 1000 10000
ln(1
+e)
[-]
p [kPa]
φ=µ=0φ=0.25 Rad, µ=0.255
φ=0.5 Rad, µ=0.546
(a)
0
10
20
30
40
50
0.1 1 10 100 1000 10000
ψσ
[°]
p [kPa]
φ=µ=0φ=0.25 Rad, µ=0.255
φ=0.5 Rad, µ=0.546
(b)
Fig. 20 The influence of the contact angle of friction ϕ (con-tact coefficient of friction µ) on the isotropic normal compres-sion lines in the ln(1+ e) vs. log p plane (a) and on the stresspath of ψǫ = 90◦ tests under normally consolidated condi-tions.
Fig. 21 Dependency of the global friction coefficient µ∗ onthe inertial number I for various values of restitution coeffi-cients and inter-particle friction coefficients (data and figurefrom da Cruz et al. [10]).
References
1. Alonso-Marroquın, F., Luding, S., Herrmann, H.J., Var-doulakis, I.: Role of anisotropy in the elastoplastic re-sponse of a polygonal packing. Phys. Rev. E 71, 051,304(2005)
2. Ben-Nun, O., Einav, I., Tordesillas, A.: Force attractorin confined comminution of granular materials. PhysicalReview Letters 104, 108,001–1/4 (2010)
Asymptotic behaviour of granular materials 15
0.001
0.01
0.1
1
0.1 1 10 100 1000 10000
Iner
tial n
umbe
r [-
]
p [kPa]
d=0.2 mmd=1 mm
Fig. 22 The dependency of the inertial number I on meanstress p in the present simulations, calculated for the smallestand largest particles.
3. Butterfield, R.: A natural compression law for soils.Geotechnique 29(4), 469–480 (1979)
4. Casagrande, A.: Characteristics of cohesionless soils af-fecting the stability of slopes and earth fills. Journal ofthe Boston Society of Civil Engineers 23(Jan.), 257–276(1936)
5. Chareyre, B., Villard, P.: Dynamic spar elements and dis-crete element methods in two dimensions for the model-ing of soil-inclusion problems. Journal of EngineeringMechanics 131(7), 689–698 (2005)
6. Chen, F., Drumm, E.C., Guiochon, G.: Predic-tion/verification of particle motion in one dimensionwith discrete element method. Journal of Geotechnicaland Geoenvironmental Engineering ASCE 7(5), 344–352(2007)
7. Cheng, Y.P., Bolton, M.D., Nakata, Y.: Crushing andplastic deformation of soils simulated using DEM.Geotechnique 54(2), 131–141 (2004)
8. Cheng, Y.P., Nakata, Y., Bolton, M.D.: Discrete elementsimulation of crushable soil. Geotechnique 53(7), 633–641 (2003)
9. Chu, J., Lo, S.C.R.: Asymptotic behaviour of a granularsoil in strain path testing. Geotechnique 44(1), 65–82(1994)
10. da Cruz, F., Emam, S., Prochnow, M., Roux, J.N.,Chevoir, F.m.c.: Rheophysics of dense granular materi-als: Discrete simulation of plane shear flows. Phys. Rev.E 72, 021,309 (2005)
11. Cundall, P.A.: Distinct element model of rock and soilstructure. In: E.T. Brown (ed.) Analytical and computa-tional methods in engineering rock mechanics, pp. 129–163. Allen & Unwin, London (1987)
12. Cundall, P.A., Hart, D.H.: Numerical modelling of dis-continua. Engineering Computations 9, 101–113 (1992)
13. Cundall, P.A., Strack, O.D.L.: A discrete numericalmodel for granular assemblies. Geotechnique 29(1), 47–65 (1979)
14. David, C.T., Garcıa-Rojo, R., Herrmann, H.J., Luding,S.: Hysteresis and creep in powders and grains. In:H. Garcıa-Rojo, McNamara (eds.) Powders and Grains,pp. 291–294. Taylor and Francis, London (2005)
15. Donze, F.V., Richefeu, V., Magnier, S.A.: Advances indiscrete element method applied to soil, rock and con-crete mechanics. In: State of the art of geotechnical engi-neering. Electronic Journal of Geotechnical Engineeringp. 44 (2009)
16. Feda, J.: Notes on the effect of grain crushing on thegranular soil behaviour. Engineering Geology 63, 93–98(2002)
17. Ferellec, J.F., McDowell, G.R.: A method to model real-istic particle shape and inertia in DEM. Granular Matter12, 459–467 (2010)
18. GDR-MiDi: On dense granular flows. The EuropeanPhysical Journal E: Soft Matter and Biological Physics14, 341–365 (2004)
19. Geng, J., Howell, D., Longhi, E., Behringer, R.P., Rey-dellet, G., Vanel, L., Clement, E., Luding, S.: Footprintsin sand: The response of a granular material to local per-turbations. Phys. Rev. Lett. 87, 035,506 (2001)
20. Goldscheider, M.: True triaxial tests on dense sand. In:G. Gudehus (ed.) Constitutive relations for soils, pp. 11–54. Workshop Grenoble, Balkema (1982)
21. Gudehus, G.: Attractors for granular storage and flow. In:3rd European Symposium – Storage and Flow of Partic-ulate Solids, Paper for the conf. ’Partec 95’, pp. 333–345(1995)
22. Gudehus, G.: Discussion of paper ”Asymptotic behaviourof a granular soil in strain path testing” by Chu, J. andLo, S.-C. R. Geotechnique 45(2), 337–338 (1995)
23. Gudehus, G.: Physical Soil Mechanics. Springer, Berlin(2011)
24. Gudehus, G., Goldscheider, M., Winter, H.: Mechanicalproperties of sand and clay and numerical intergrationmethods: some sources of errors and bounds of accuracy.In: G. Gudehus (ed.) Finite Elements in Geomechanics,pp. 121–150. Wiley, Chichester (1977)
25. Gudehus, G., Masın, D.: Graphical representation of con-stitutive equations. Geotechnique 59(2), 147–151 (2009)
26. Hatano, T.: Constitutive law of dense granular matter.Journal of Physics: Conference Series 258(1), 012,006(2010)
27. Hvorslev, M.J.: Uber die Festigkeitseigenschaftengestorter bindiger Boden. Ph.D. thesis, Danmarksnaturvidenskabelige samfund, Københaven (1937)
28. ITASCA: The PFC2D user’s manual. ITASCA (2004).Http://www.itascacg.com
29. Jop, P., Forterre, Y., Pouliquen, O.: A constitutive lawfor dense granular flows. Nature 441, 727–730 (2006)
30. Kozicki, J., Tejchman, J.: Numerical simulations of sandbehaviour using DEM with two different descriptions ofgrain roughness. In: E. Onate, D.R.J. Owen (eds.) II In-ternational Conference on Particle-based Methods - Fun-damentals and Applications. PARTICLES 2011 (2011)
31. Kuhl, E., DAddetta, G., Leukart, M., Ramm, E.: Mi-croplane modelling and particle modelling of cohesive-frictional materials. In: P. Vermeer, H. Herrmann, S. Lud-ing, W. Ehlers, S. Diebels, E. Ramm (eds.) Continuousand Discontinuous Modelling of Cohesive-Frictional Ma-terials, Lecture Notes in Physics, vol. 568, pp. 31–46.Springer, Berlin / Heidelberg (2001)
32. Latzel, M., Luding, S., Herrmann, H., Howell, D.,Behringer, R.: Comparing simulation and experiment ofa 2D granular couette shear device. The European Phys-ical Journal E: Soft Matter and Biological Physics 11,325–333 (2003)
33. Lu, N., McDowell, G.R.: The importance of modellingballast particle shape in the discrete element method.Granular Matter 9, 69–80 (2007)
34. Luding, S.: Collisions & contacts between two particles.In: H.J. Herrmann, J.P. Hovi, S. Luding (eds.) Physicsof dry granular Media - NATO ASI Series E350, p. 285.Kluwer Academic Publishers, Dordrecht (1998)
35. Luding, S.: Cohesive, frictional powders: contact modelsfor tension. Granular Matter 10(4), 235–246 (2008)

16 David Masın
36. Luding, S., Alonso-Marroquın, F.: The critical state yieldstress (termination locus) of adhesive powders from a sin-gle numerical experiment. Granular Matter 13, 109–119(2011)
37. Luo, T., Yao, Y., Chu, J.: Asymptotic state behaviourand its modeling for saturated sand. Science in ChinaSeries E: Technological Sciences 52, 2350–2358 (2009)
38. Markauskas, D., Kasianauskas, R., Dziugys, A., Navakas,R.: Investigation of adequacy of multi-sphere approxima-tion of elliptical particles for DEM simulations. GranularMatter 12, 107–123 (2010)
39. Masın, D.: A hypoplastic constitutive model for clays. In-ternational Journal for Numerical and Analytical Meth-ods in Geomechanics 29(4), 311–336 (2005)
40. Masın, D.: Hypoplastic Cam-clay model. Geotechnique62(6), 549–553 (2012)
41. Masın, D., Herle, I.: State boundary surface of a hy-poplastic model for clays. Computers and Geotechnics32(6), 400–410 (2005)
42. Masın, D., Herle, I.: Improvement of a hypoplastic modelto predict clay behaviour under undrained conditions.Acta Geotechnica 2(4), 261–268 (2007)
43. McDowell, G.R., Bolton, M.D.: On micromechanics ofcrushable aggregates. Geotechnique 48(5), 667–679(1998)
44. McDowell, G.R., Harireche, O.: Discrete element mod-elling of yielding and normal compression of sand.Geotechnique 52(4), 299–304 (2002)
45. McDowell, G.R., Humpreys, A.: Yielding of granular ma-terials. Granular Matter 4, 1–8 (2002)
46. Miehe, C., Dettmar, J.: A framework for micromacrotransitions in periodic particle aggregates of granular ma-terials. Comput. Methods Appl. Mech. Engrg. 193, 225–256 (2004)
47. Otsuki, M., Hayakawa, H., Luding, S.: Behavior of pres-sure and viscosity at high densities for two-dimensionalhard and soft granular materials. Progress of TheoreticalPhysics Supplement 184, 110–133 (2010)
48. Pena, A.A., Herrmann, H.J., Lizcano, A., Alonso-Marroquın, F.: Investigation of the asymptotic statesof granular materials using discrete element model ofanisotropic particles. In: H. Garcıa-Rojo, McNamara(eds.) Powders and Grains, pp. 697–700. Taylor and Fran-cis, London (2005)
49. Pena, A.A., Lind, P.G., McNamara, S., Herrmann, H.J.:Geometrical derivation of frictional forces for granularmedia under slow shearing. Acta Mechanica 205, 171–183 (2009)
50. Pouliquen, O., Cassar, C., Forterre, Y., Jop, P., Nico-las, M.: How do grains flow: towards a simple rheologyfor dense granular flows. In: H. Garcıa-Rojo, McNamara(eds.) Powders and Grains. Taylor and Francis, London(2005)
51. Radjai, F., Jean, M., Moreau, J.J., Roux, S.: Force distri-butions in dense two-dimensional granular systems. Phys.Rev. Lett. 77, 274–277 (1996)
52. Roscoe, K.H., Burland, J.B.: On the generalised stress-strain behaviour of wet clay. In: J. Heyman, F.A. Leckie(eds.) Engineering Plasticity, pp. 535–609. CambridgeUniversity Press, Cambridge (1968)
53. Salot, C., Gotteland, P., Villard, P.: Influence of rela-tive density on granular materials behaviour: DEM sim-ulations of triaxial tests. Granular Matter 11, 221–236(2009)
54. Schofield, A.N., Wroth, C.P.: Critical State Soil Mechan-ics. McGraw-Hill, London (1968)
55. Scholtes, L., Donze, F.V., Khanal, M.: Scale effects onstrength of geomaterials, case study: Coal. Journal of theMechanics and Physics of Solids 59, 1131–1146 (2011)
56. Sitharam, T.G., Vinod, J.S.: Critical state behaviour ofgranular materials from isotropic and rebounded paths:DEM simulations. Granular Matter 11, 33–42 (2009)
57. Stahl, M., Konietzky, H.: Discrete element simulation ofballast and gravel under special consideration of grain-shape, grain-size and relative density. Granular Matter13(4), 417–428 (2011)
58. Stransky, J., Jirasek, M.: Calibration of particle-basedmodels using cells with periodic boundary conditions. In:E. Onate, D.R.J. Owen (eds.) II International Conferenceon Particle-based Methods - Fundamentals and Applica-tions. PARTICLES 2011 (2011)
59. Tamagnini, C., Calvetti, F., Viggiani, G.: An assesmentof plasticity theories for modelling the incrementally non-linear behaviour of granular soils. Journal of EngineeringMathematics 52, 265–291 (2005)
60. Taylor, D.W.: Fundamentals of soil mechanics. John Wi-ley, New York (1948)
61. Topolnicki, M., Gudehus, G., Mazurkiewicz, B.K.: Ob-served stress-strain behaviour of remoulded saturatedclays under plane strain conditions. Geotechnique 40(2),155–187 (1990)
62. Tykhoniuk, R., Tomas, J., Luding, S., Kappl, M., Heim,L., Butt, H.J.: Ultrafine cohesive powders: From inter-particle contacts to continuum behaviour. Chemical En-gineering Science 62(11), 28432864 (2007)
63. Smilauer, V., Catalano, E., Chareyre, B., Dorofenko,S., Duriez, J., Gladky, A., Kozicki, J., Modenese, C.,Scholtes, L., Sibille, L., Stransky, J., Thoeni, K.: YadeDocumentation, 1st edn. The Yade Project (2010).Http://yade-dem.org/doc/
64. Walker, D.M., Tordesillas, A., Einav, I., Small, M.: Com-plex networks in confined comminution. Physical ReviewE 84, 021,301–1/9 (2011)
65. Wang, J., Yu, H.S., Langston, P., Fraige, F.: Particleshape effects in discrete element modelling of cohesiveangular particles. Granular Matter 13, 1–12 (2011)
66. von Wolffersdorff, P.A.: A hypoplastic relation for gran-ular materials with a predefined limit state surface.Mechanics of Cohesive-Frictional Materials 1, 251–271(1996)
67. Zhao, X., Evans, T.M.: Numerical analysis of criticalstate behaviors of granular soils under different loadingconditions. Granular Matter 13, 751–764 (2011)
![SIPHONAPTERA (blechy)web.natur.cuni.cz/.../Navody/SFHH/10_Siphonaptera.pdf · 2007. 1. 2. · SIPHONAPTERA (blechy) [= Aphaniptera] Diferenciální diagnóza - laterálnězploštělí](https://img.pdfslide.net/doc/110x75/61218b5c4c13d63b96026cd8/siphonaptera-blechywebnaturcunicznavodysfhh10-2007-1-2-siphonaptera.jpg)