Embed Size (px)
Citation preview
At each grade level, the district monitors the growth and achievement of each student through the use of various assessments and data sources to inform the staff in providing support. At the Pre-Kindergarten level, students are given the Early Learning Assessment and Worthington Curriculum-Based Assessment 2 times a year. The majority of our preschool students made expected or above expected growth, especially in pre-academic tasks such as rhyming words, word meanings, and number words. We did not see as much growth in the social-emotional tasks such as emotional identification, social behaviors, and seeking emotional support; possibly due to limited peer and adult interactions outside of the home during the pandemic. In Grades 1-8, we administer the Measures of Academic Progress (MAP) assessment. From January 2020 - January 2021, our grades 1-8 students grew in reading at similar rates as compared to our grades 1-8 students grew from January 2019 - January 2020 and as compared to pre-pandemic goals. Even during a global pandemic when school was shut down from March - May, reading growth for grades 1-8 students, as evidenced by MAP, remained consistent from the year previous. From January 2020 - January 2021, our grades 1-8 students in math grew at just a slightly slower pace than our grades 1-8 students from January 2019 - January 2020, compared to pre-pandemic norms. Even during a global pandemic when school was shut down from March - May, math growth for 1-8 students as evidenced by MAP remained almost consistent from the year prior. As we finish the school year, transition into summer learning, and continue into the 2021-2022 academic year, teachers will formatively assess key standards at each grade level and adapt instruction as needed to address unfinished learning. At the high school level, progress is monitored through the evaluation of classroom grades throughout the school year. In comparison to years prior, Worthington notes a 1%-2% approximate range in letter grade performance for the first and second quarter. We will continue to monitor progress with state and national assessments (State Tests, ACT, AP) when they become available. Worthington plans to continue monitoring growth for each student through assessments, which are used to inform the teachers and staff to provide additional support, as needed. Students with Individualized Education Plans will also have Progress Report data based on their individual goals and objectives. The following document is dense and digs into the data in a significant way.
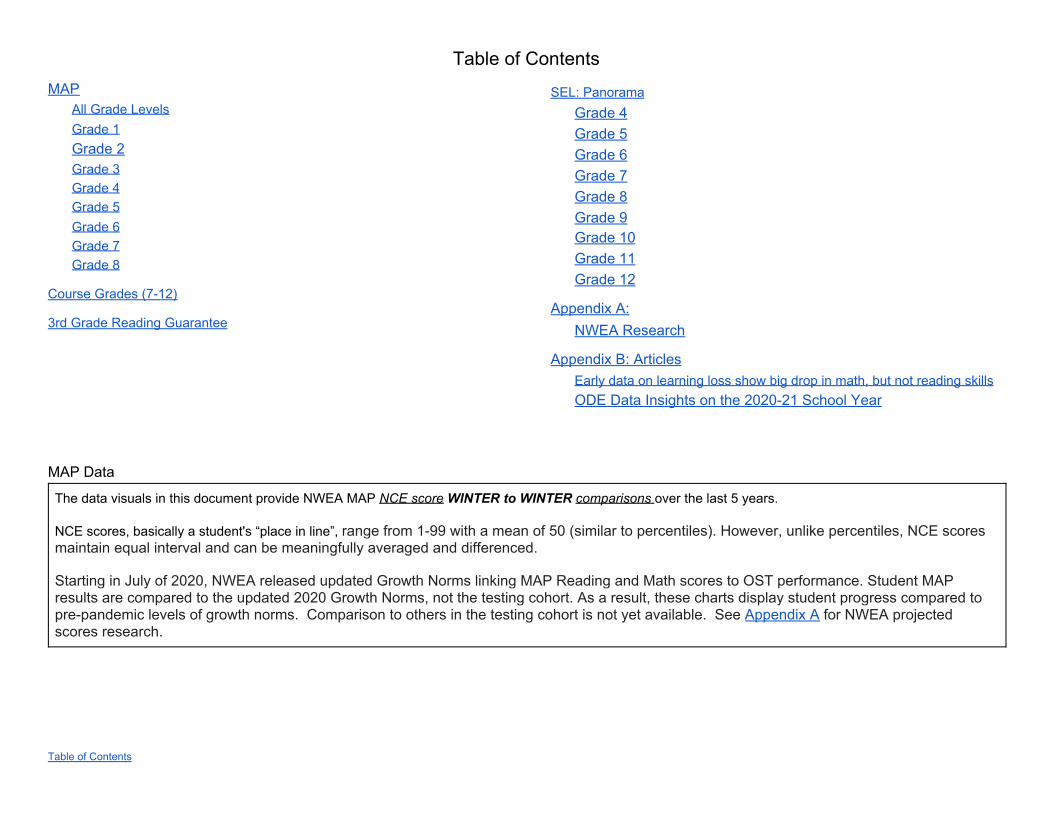
Table of Contents MAP
All Grade Levels Grade 1 Grade 2 Grade 3 Grade 4 Grade 5 Grade 6 Grade 7 Grade 8
Course Grades (7-12)
3rd Grade Reading Guarantee
SEL: Panorama Grade 4 Grade 5 Grade 6 Grade 7 Grade 8 Grade 9 Grade 10 Grade 11 Grade 12
Appendix A: NWEA Research
Appendix B: Articles Early data on learning loss show big drop in math, but not reading skills ODE Data Insights on the 2020-21 School Year
MAP Data
Table of Contents
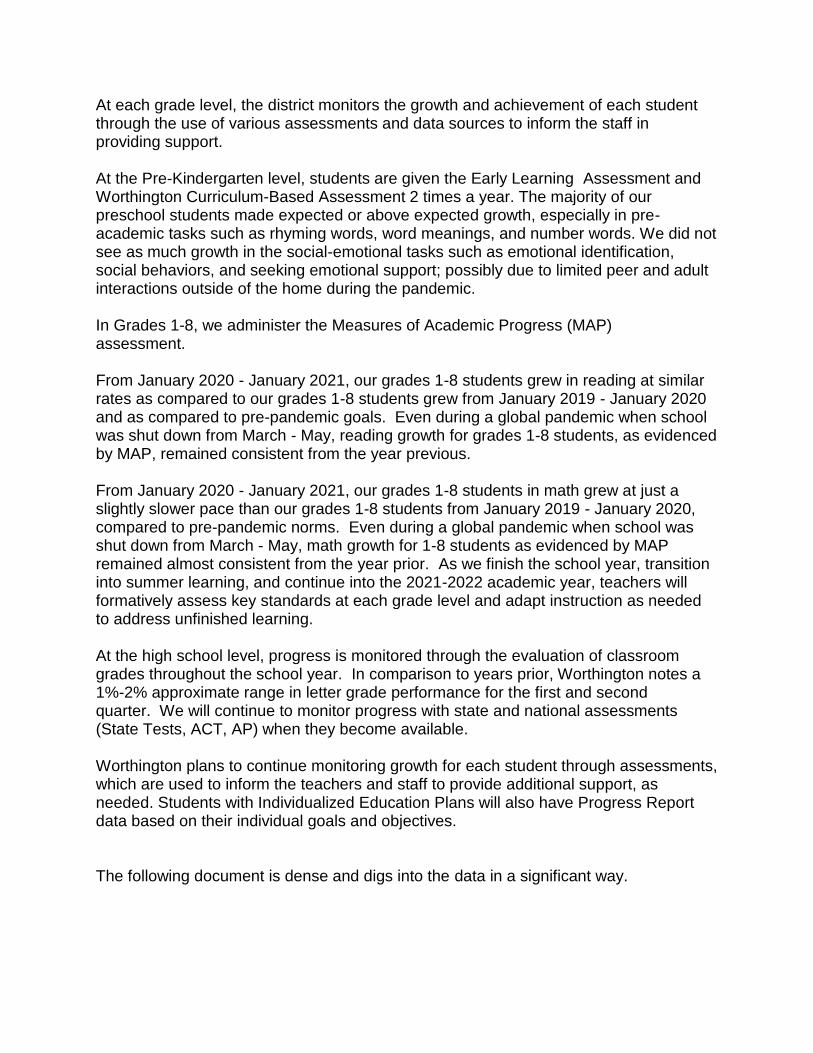
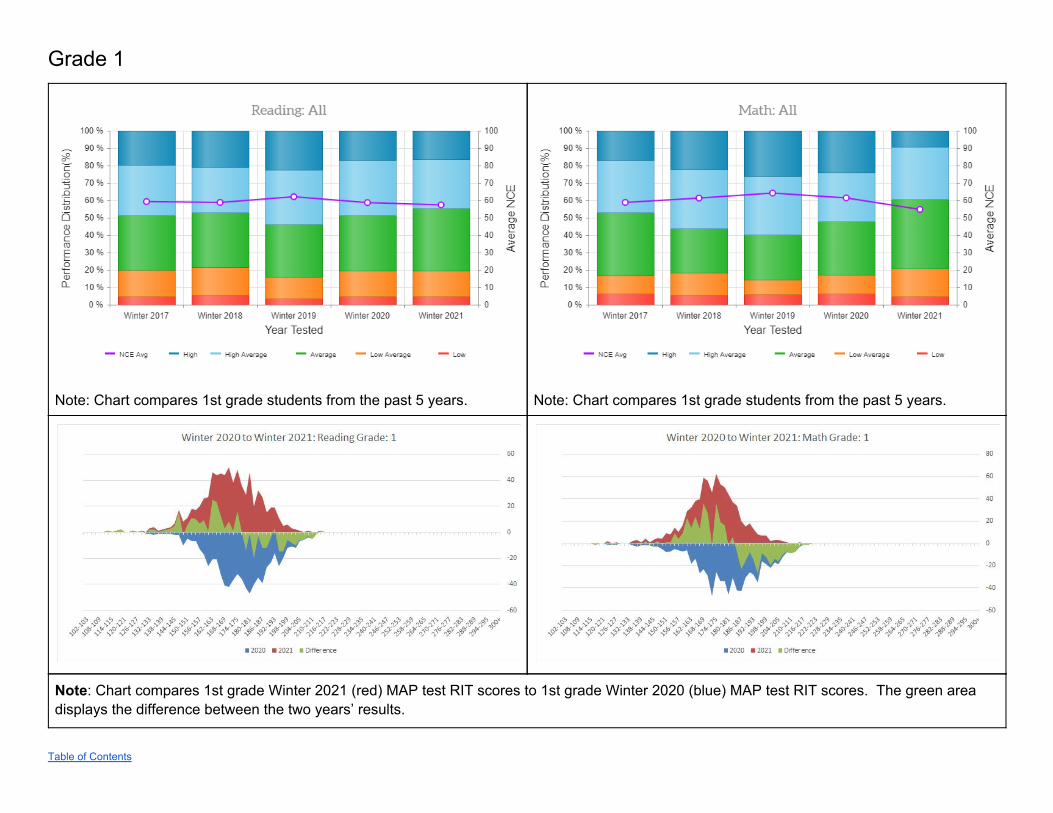
The data visuals in this document provide NWEA MAP NCE score WINTER to WINTER comparisons over the last 5 years. NCE scores, basically a student's “place in line”, range from 1-99 with a mean of 50 (similar to percentiles). However, unlike percentiles, NCE scores maintain equal interval and can be meaningfully averaged and differenced. Starting in July of 2020, NWEA released updated Growth Norms linking MAP Reading and Math scores to OST performance. Student MAP results are compared to the updated 2020 Growth Norms, not the testing cohort. As a result, these charts display student progress compared to pre-pandemic levels of growth norms. Comparison to others in the testing cohort is not yet available. See Appendix A for NWEA projected scores research.
MAP All Grade Levels
Notes:
● Reading performance has been stable. Math declined by 5 NCE points. ○ While our goal is to maintain or increase the average NCE score, growth is not linear. It is common for an individual student’s NCE
scores to increase and decrease +/-15 NCE from test to test. ○ Most of the significant decline in Math NCE scores is seen in grades 1-4.
● Keep in mind ○ Each graph represents different cohorts of students ○ NWEA predicted stable Reading scores and a decline in Math scores from their early Fall results. ○ Students are being compared to the 2020 norms, not to other Winter test takers. ○ Student’s who took the test are being compared to Norms that were computed during non-pandemic learning.
● Response ○ Teachers will use assessment data to gain insight and address unfinished learning the remainder of the school year and into the
future, including Summer School 2021.
Table of Contents
All Grade Levels
All Grade Levels
Grade 1
Table of Contents
Note: Chart compares 1st grade students from the past 5 years.
Note: Chart compares 1st grade students from the past 5 years.
Note: Chart compares 1st grade Winter 2021 (red) MAP test RIT scores to 1st grade Winter 2020 (blue) MAP test RIT scores. The green area displays the difference between the two years’ results.
Grade 2
Table of Contents
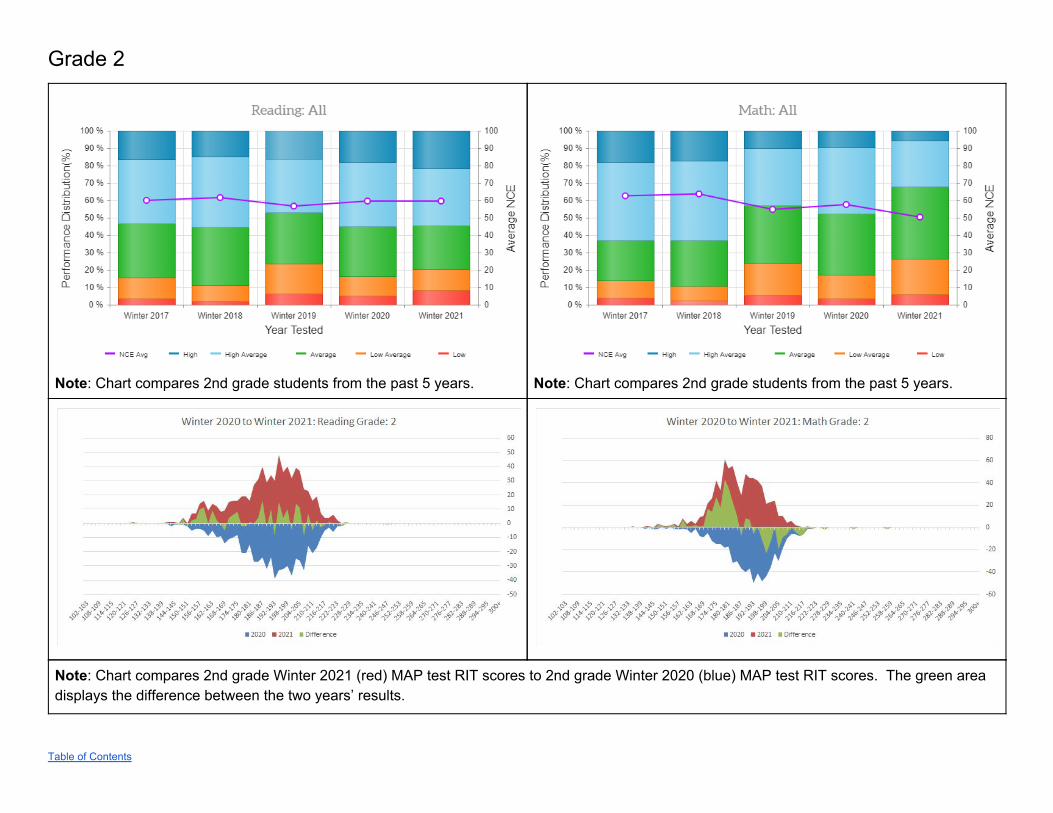
Note: Chart compares 2nd grade students from the past 5 years.
Note: Chart compares 2nd grade students from the past 5 years.
Note: Chart compares 2nd grade Winter 2021 (red) MAP test RIT scores to 2nd grade Winter 2020 (blue) MAP test RIT scores. The green area displays the difference between the two years’ results.
Grade 3
Table of Contents
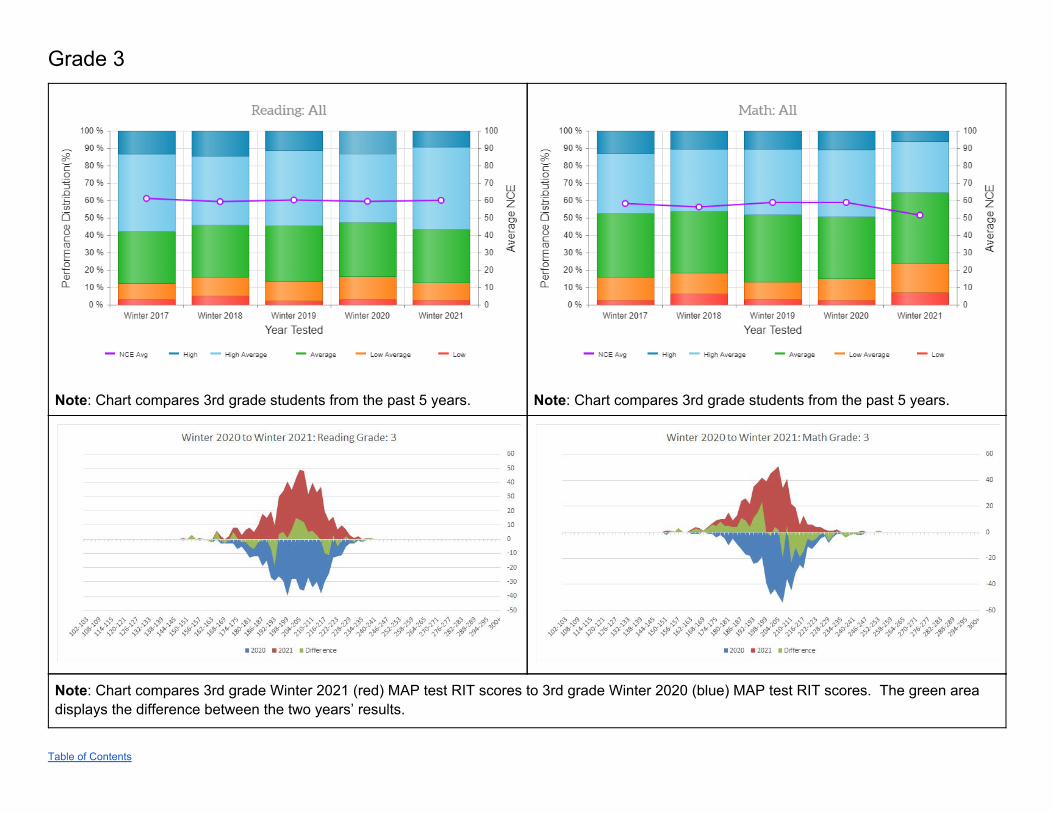
Note: Chart compares 3rd grade students from the past 5 years.
Note: Chart compares 3rd grade students from the past 5 years.
Note: Chart compares 3rd grade Winter 2021 (red) MAP test RIT scores to 3rd grade Winter 2020 (blue) MAP test RIT scores. The green area displays the difference between the two years’ results.
Grade 4
Table of Contents
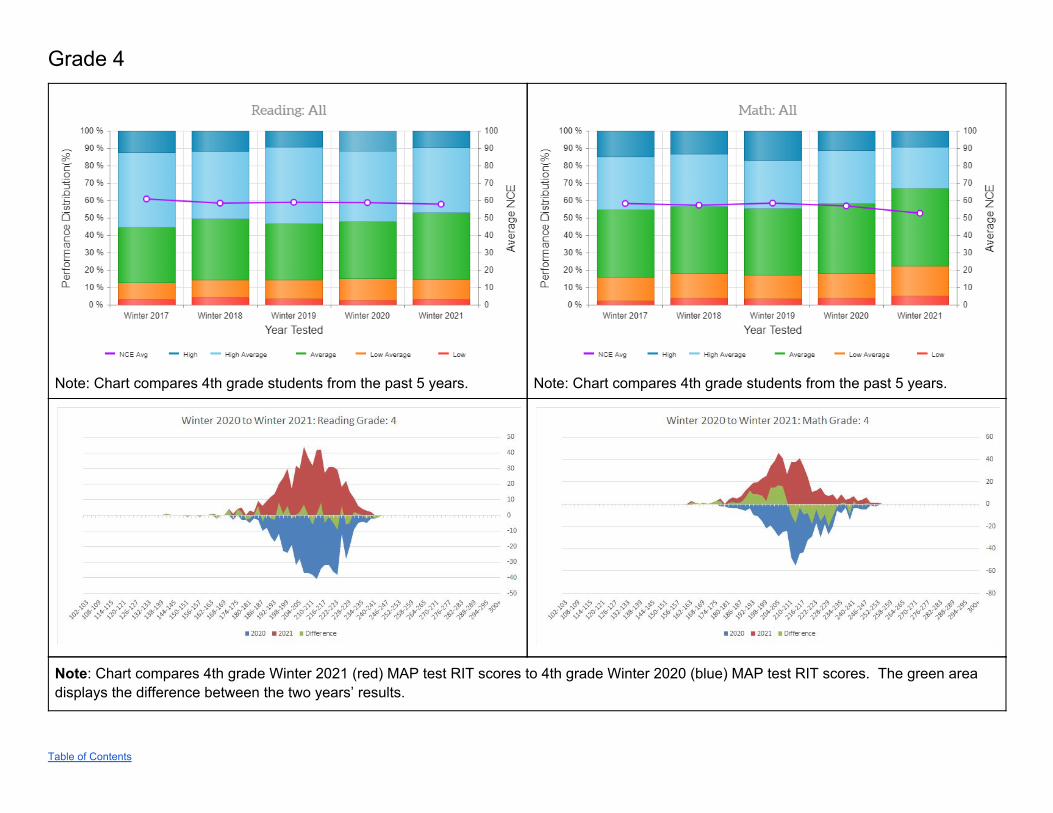
Note: Chart compares 4th grade students from the past 5 years.
Note: Chart compares 4th grade students from the past 5 years.
Note: Chart compares 4th grade Winter 2021 (red) MAP test RIT scores to 4th grade Winter 2020 (blue) MAP test RIT scores. The green area displays the difference between the two years’ results.
Grade 5
Table of Contents
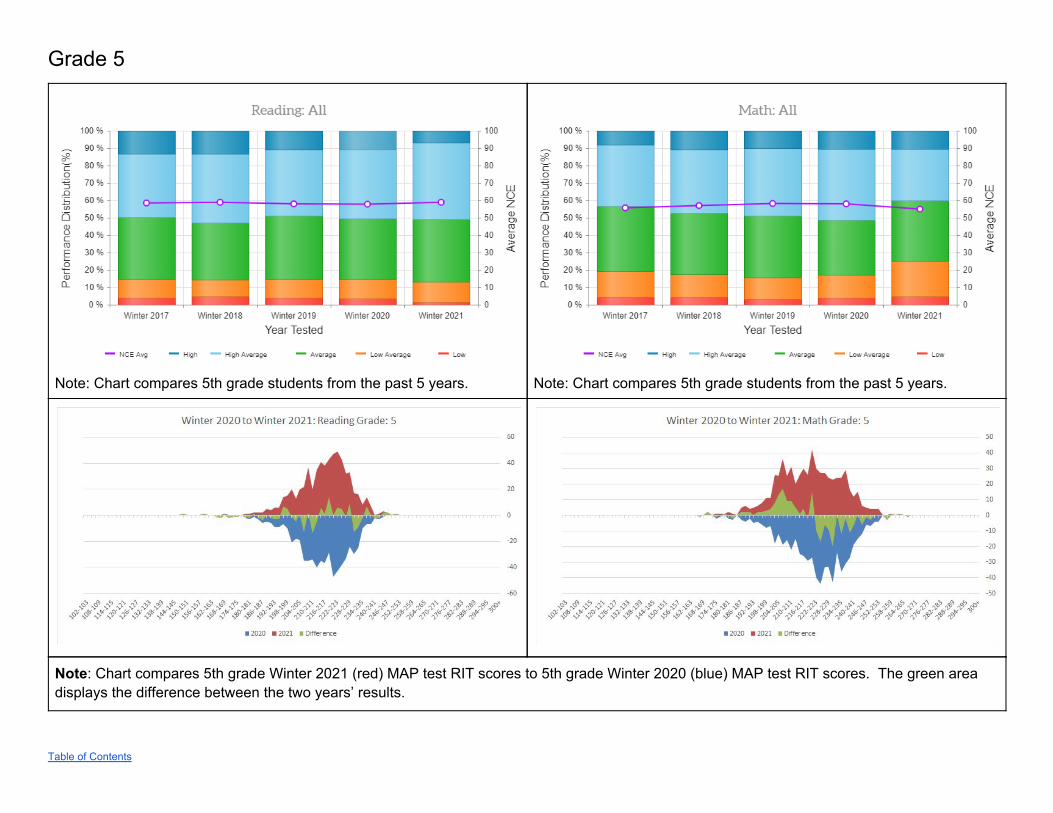
Note: Chart compares 5th grade students from the past 5 years.
Note: Chart compares 5th grade students from the past 5 years.
Note: Chart compares 5th grade Winter 2021 (red) MAP test RIT scores to 5th grade Winter 2020 (blue) MAP test RIT scores. The green area displays the difference between the two years’ results.
Grade 6
Table of Contents
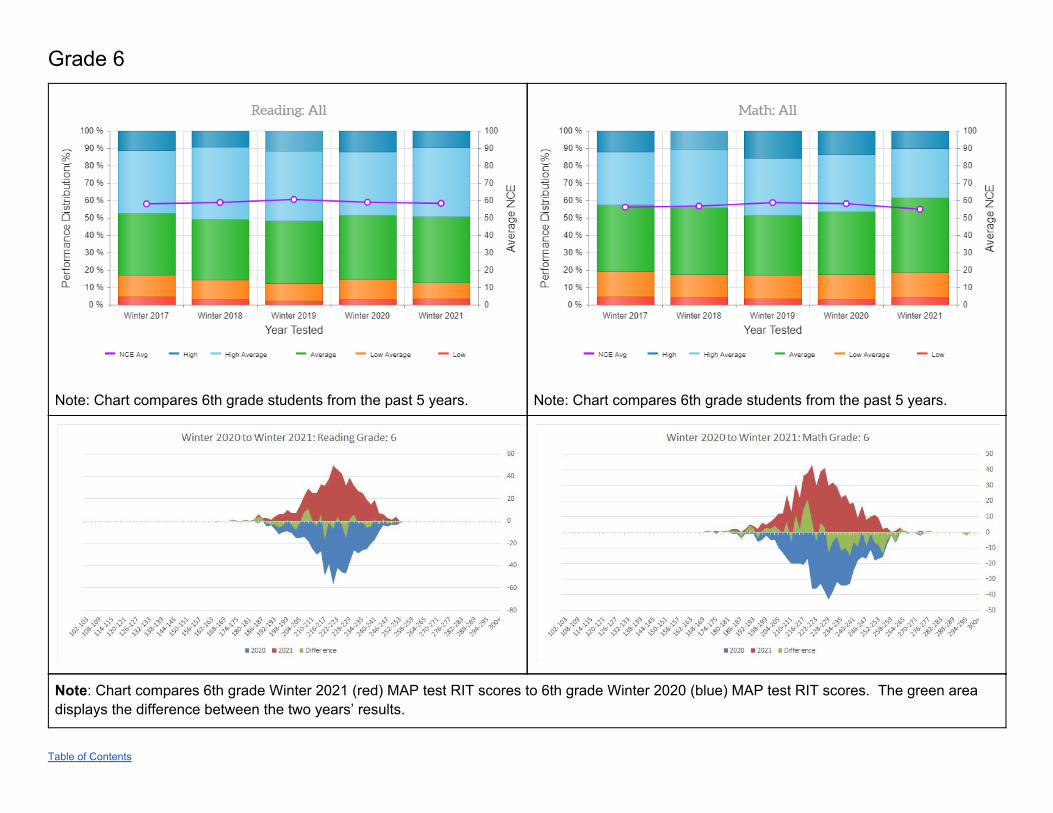
Note: Chart compares 6th grade students from the past 5 years.
Note: Chart compares 6th grade students from the past 5 years.
Note: Chart compares 6th grade Winter 2021 (red) MAP test RIT scores to 6th grade Winter 2020 (blue) MAP test RIT scores. The green area displays the difference between the two years’ results.
Grade 7
Table of Contents
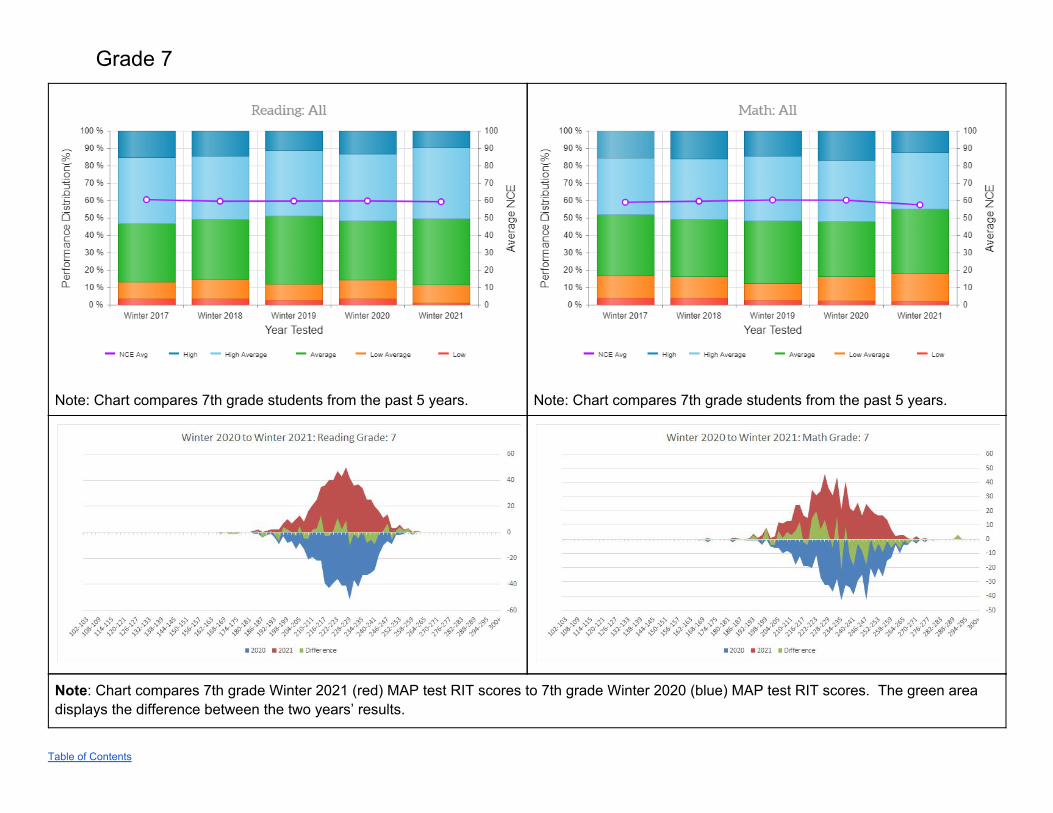
Note: Chart compares 7th grade students from the past 5 years.
Note: Chart compares 7th grade students from the past 5 years.
Note: Chart compares 7th grade Winter 2021 (red) MAP test RIT scores to 7th grade Winter 2020 (blue) MAP test RIT scores. The green area displays the difference between the two years’ results.
Grade 8
Table of Contents
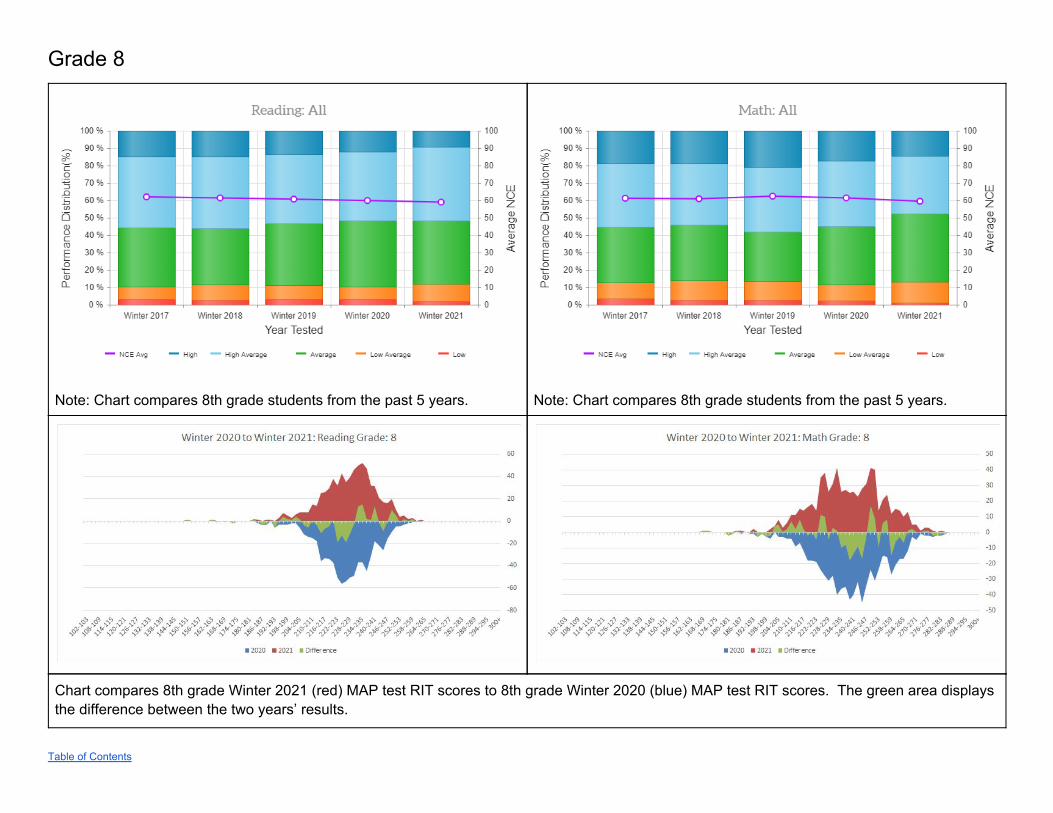
Note: Chart compares 8th grade students from the past 5 years.
Note: Chart compares 8th grade students from the past 5 years.
Chart compares 8th grade Winter 2021 (red) MAP test RIT scores to 8th grade Winter 2020 (blue) MAP test RIT scores. The green area displays the difference between the two years’ results.
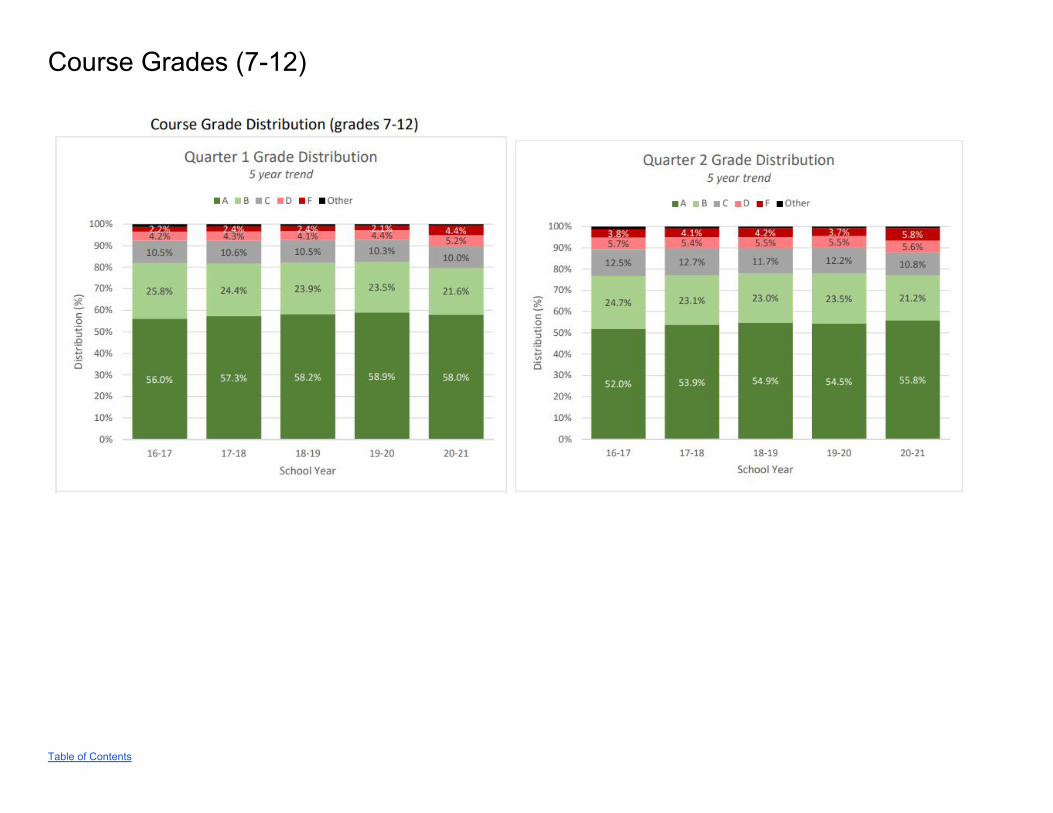
Course Grades (7-12)
Table of Contents
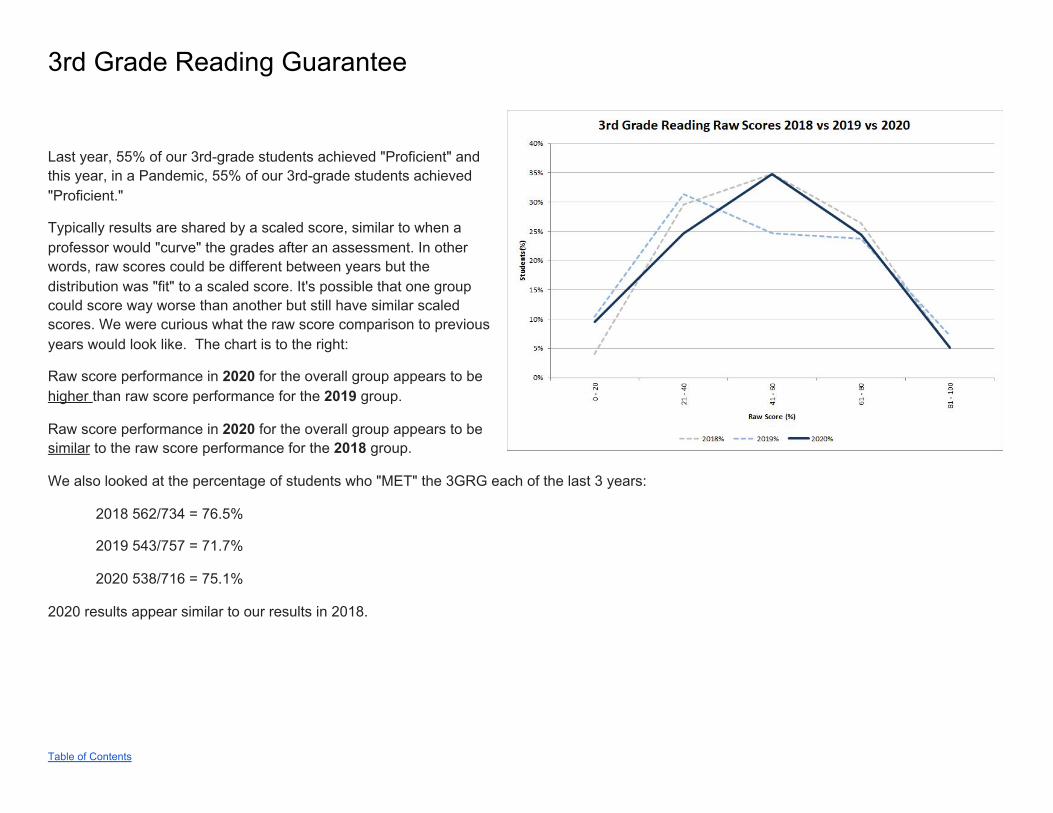
3rd Grade Reading Guarantee
Last year, 55% of our 3rd-grade students achieved "Proficient" and this year, in a Pandemic, 55% of our 3rd-grade students achieved "Proficient."
Typically results are shared by a scaled score, similar to when a professor would "curve" the grades after an assessment. In other words, raw scores could be different between years but the distribution was "fit" to a scaled score. It's possible that one group could score way worse than another but still have similar scaled scores. We were curious what the raw score comparison to previous years would look like. The chart is to the right:
Raw score performance in 2020 for the overall group appears to be higher than raw score performance for the 2019 group.
Raw score performance in 2020 for the overall group appears to be similar to the raw score performance for the 2018 group.
We also looked at the percentage of students who "MET" the 3GRG each of the last 3 years:
2018 562/734 = 76.5%
2019 543/757 = 71.7%
2020 538/716 = 75.1%
2020 results appear similar to our results in 2018.
Table of Contents
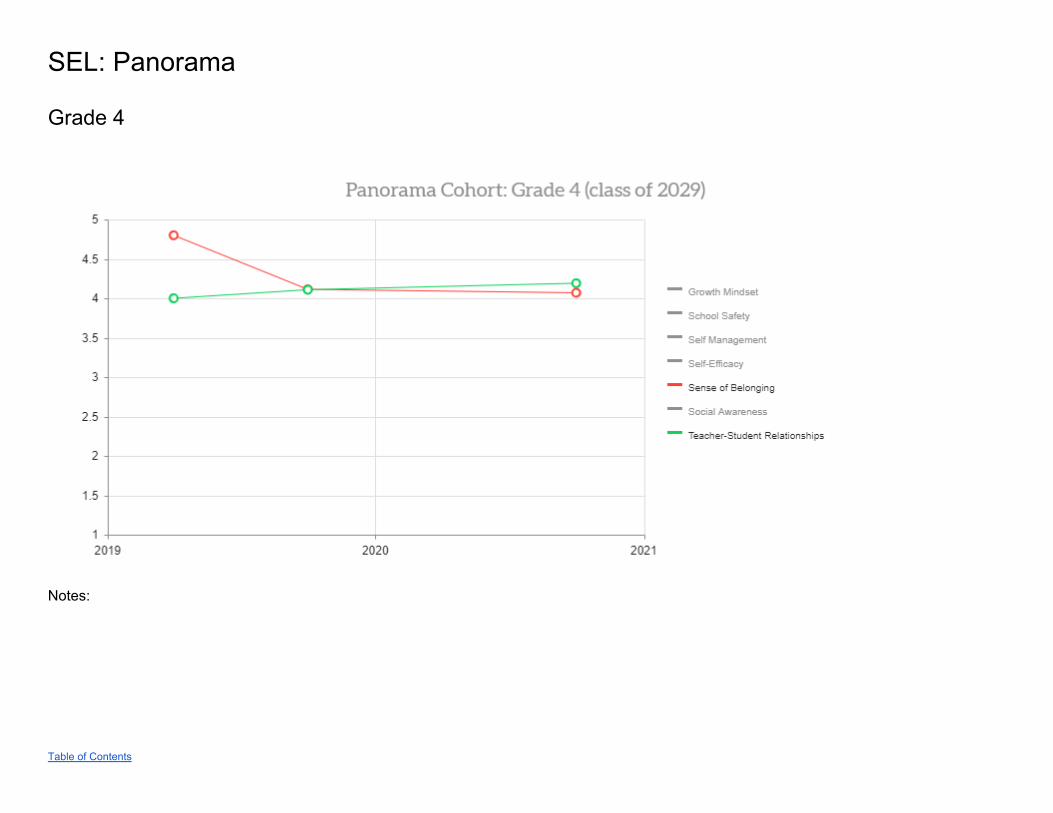
SEL: Panorama
Grade 4
Notes:
Table of Contents
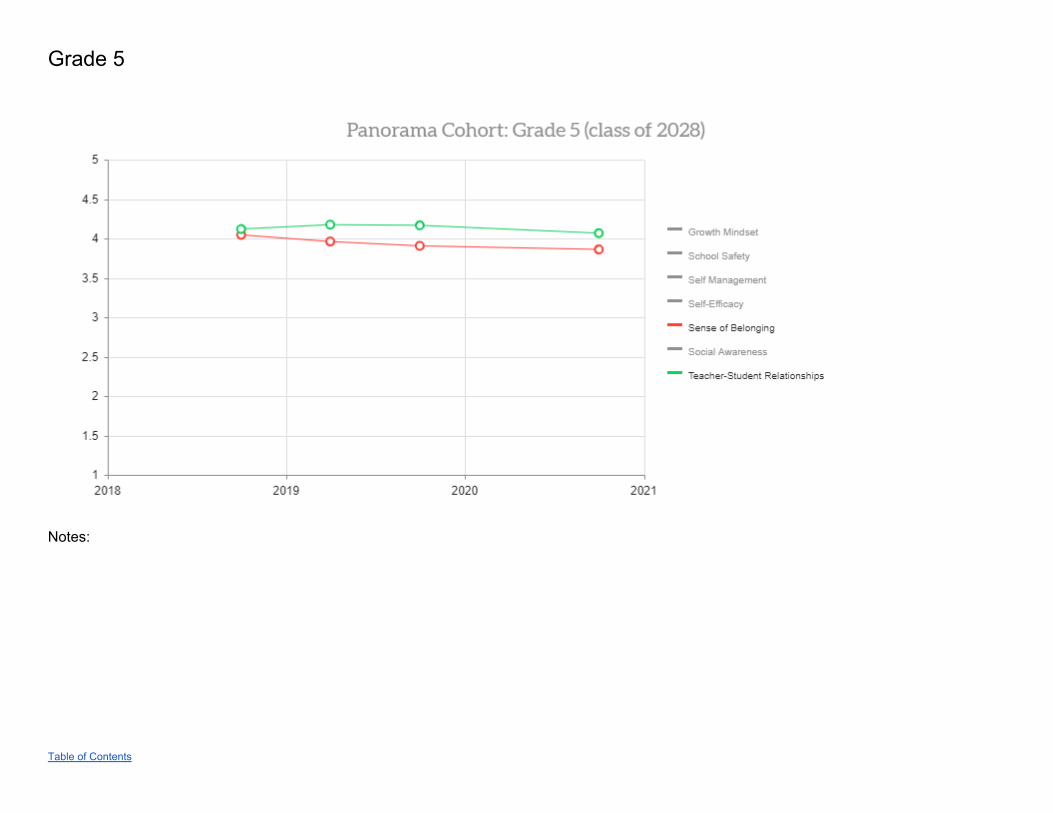
Grade 5
Notes:
Table of Contents
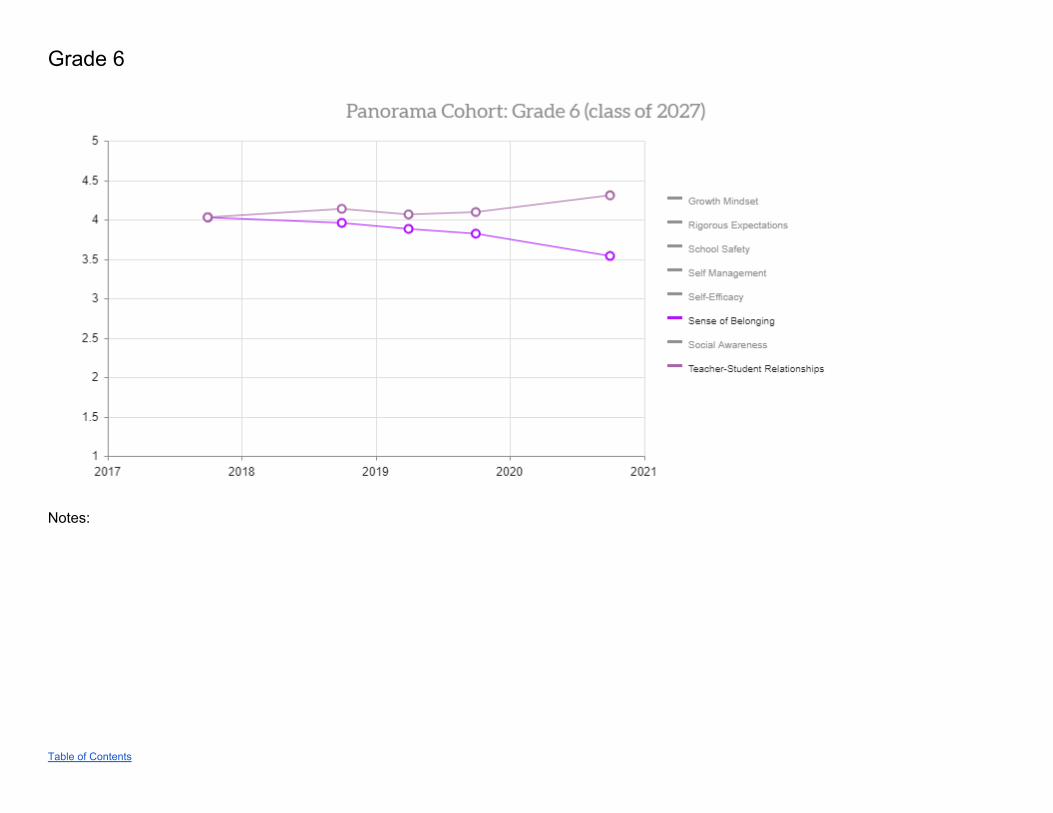
Grade 6
Notes:
Table of Contents
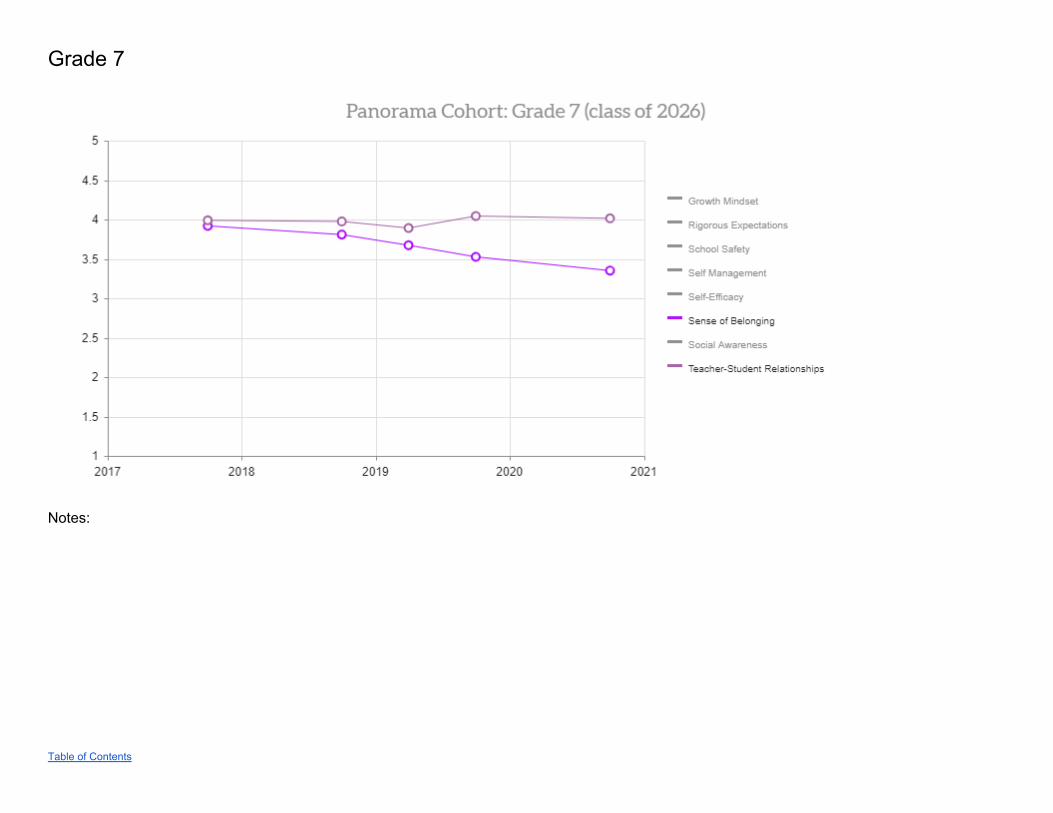
Grade 7
Notes:
Table of Contents
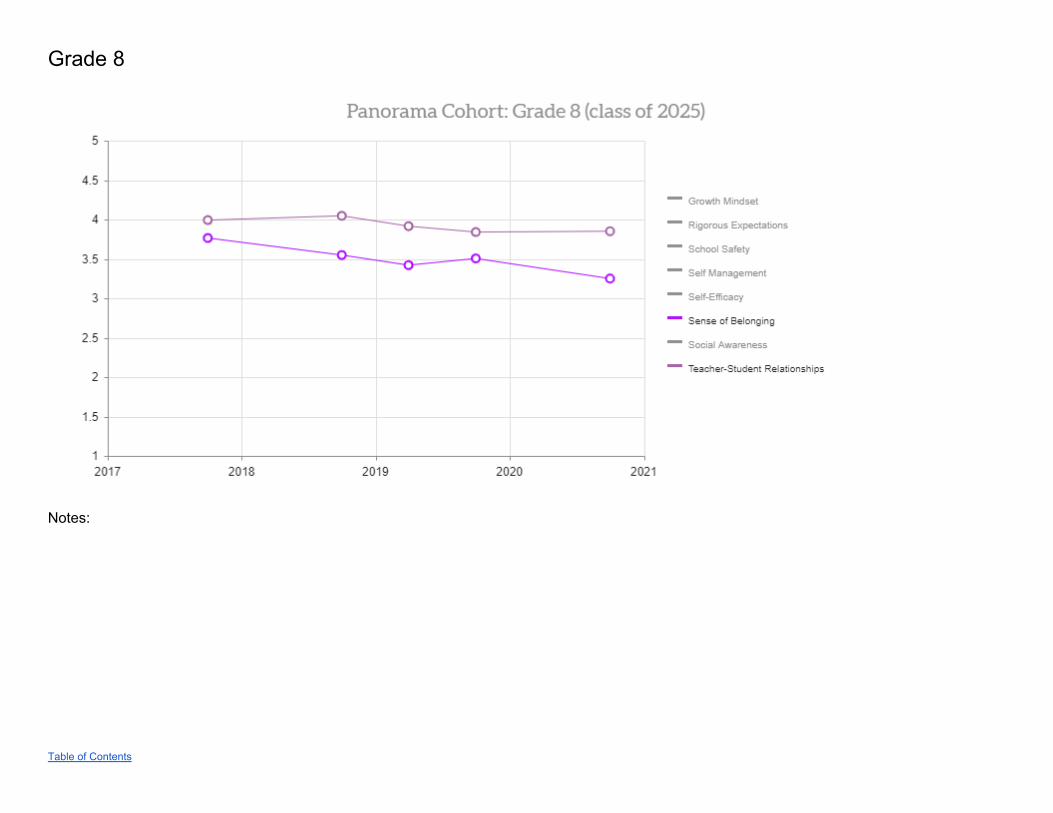
Grade 8
Notes:
Table of Contents
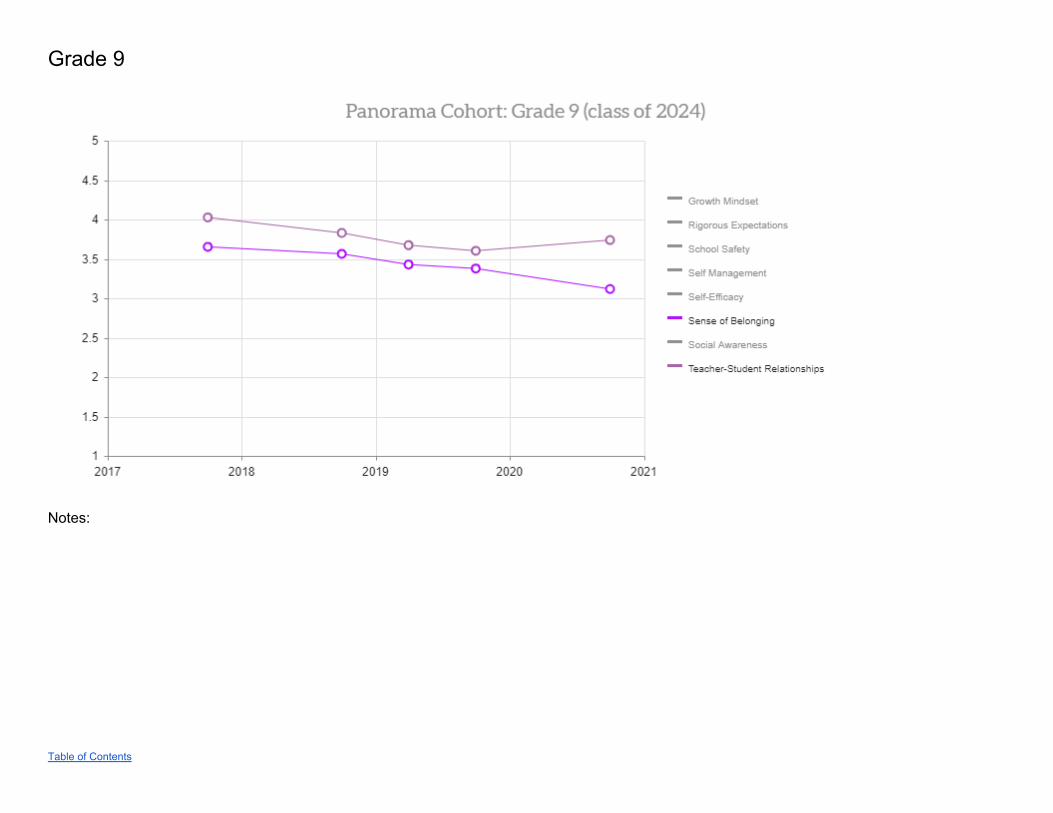
Grade 9
Notes:
Table of Contents
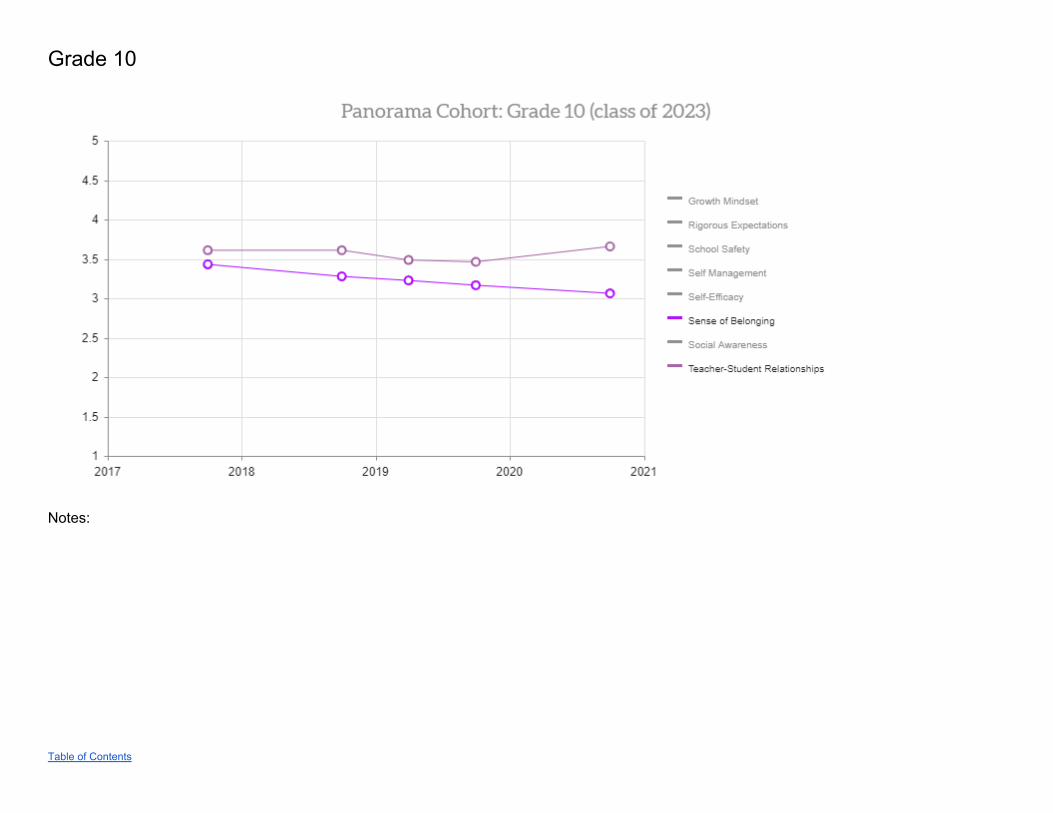
Grade 10
Notes:
Table of Contents
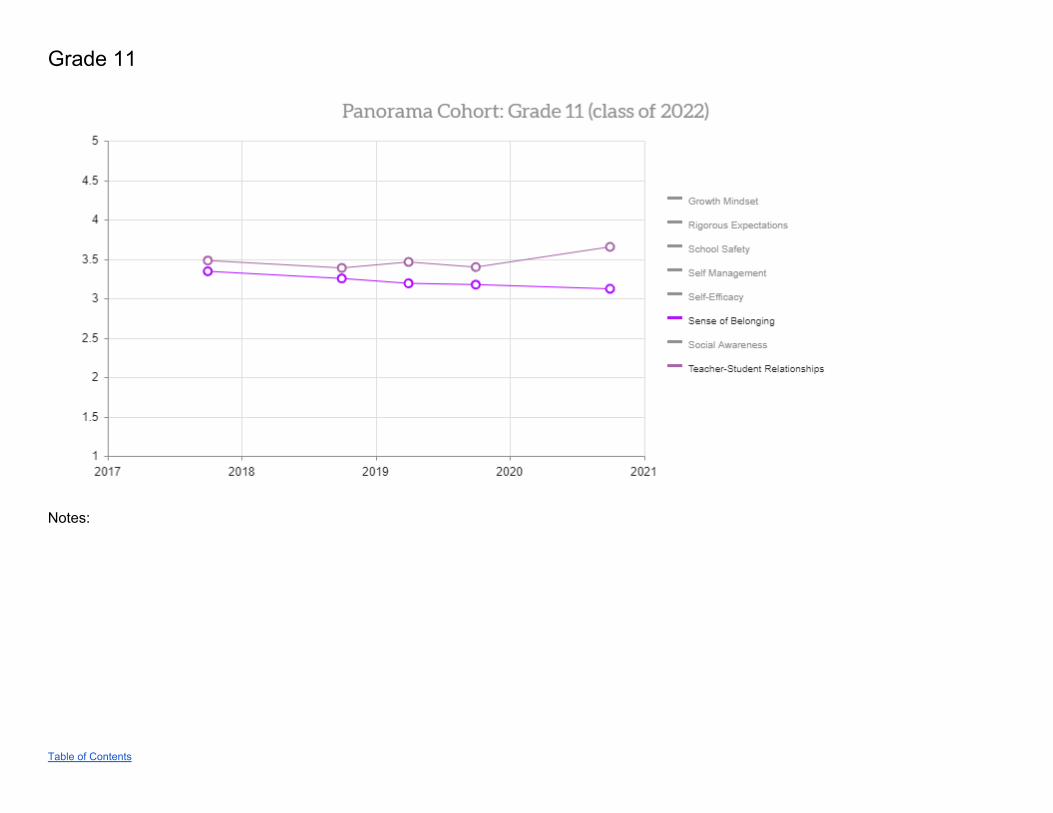
Grade 11
Notes:
Table of Contents
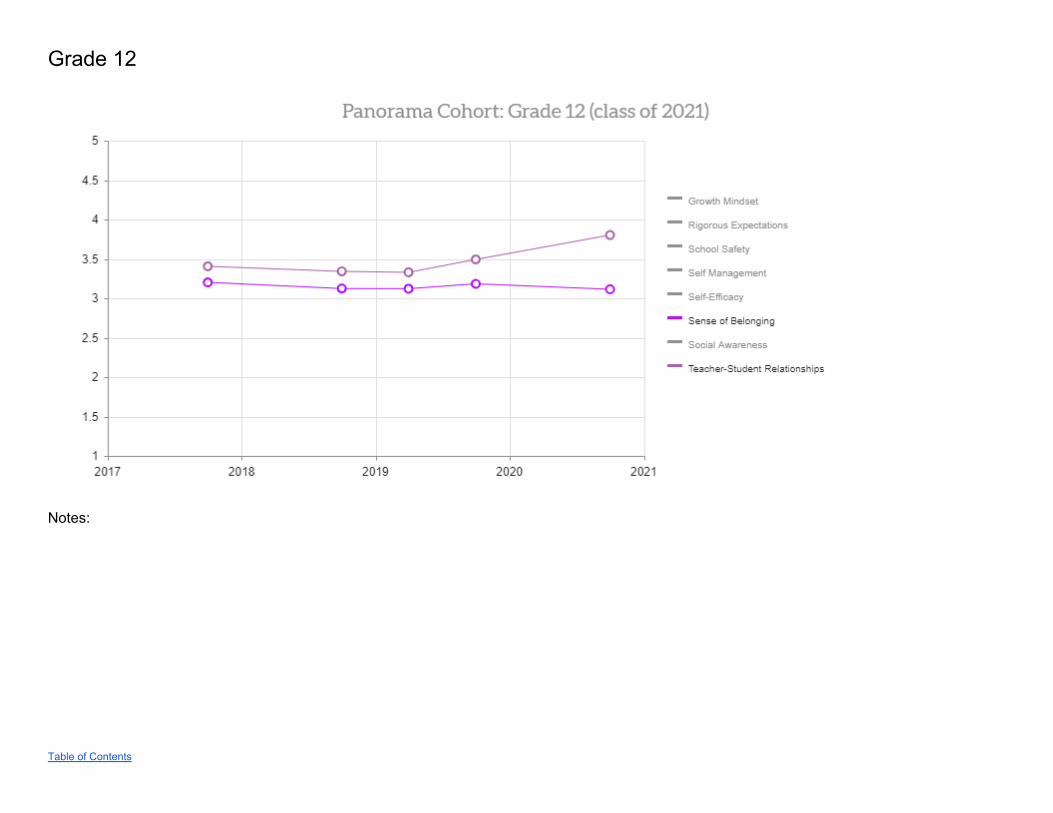
Grade 12
Notes:
Table of Contents
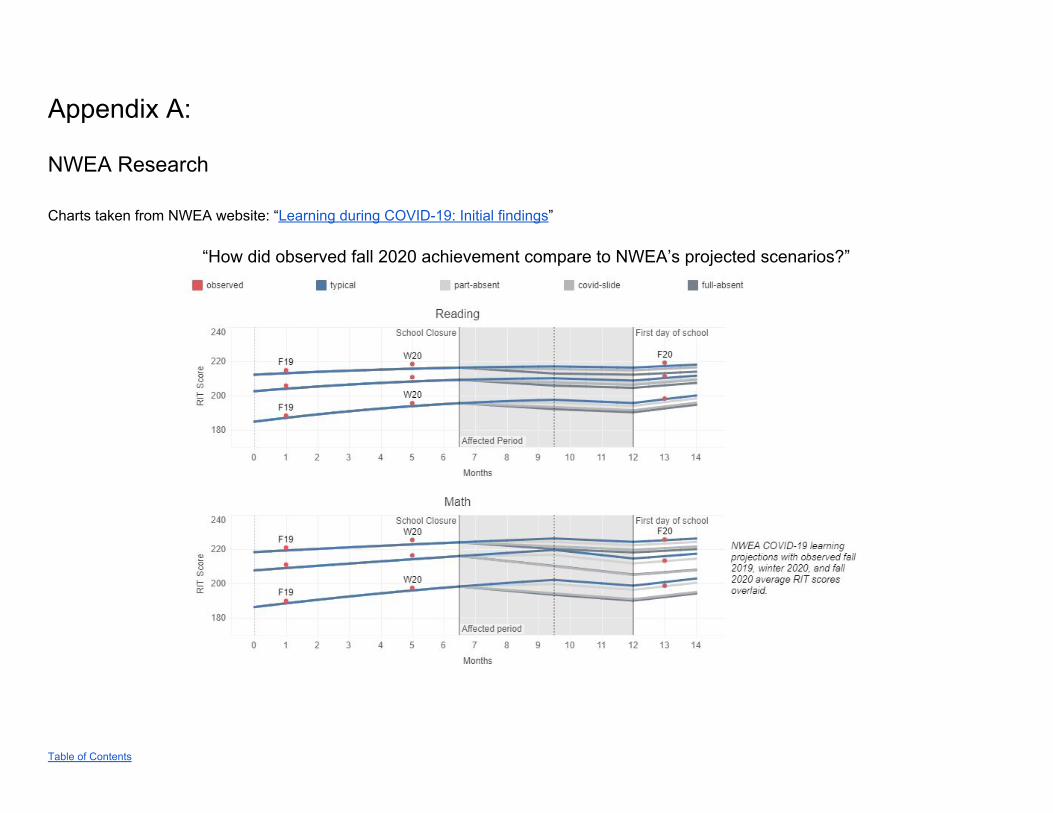
Appendix A:
NWEA Research Charts taken from NWEA website: “Learning during COVID-19: Initial findings”
“How did observed fall 2020 achievement compare to NWEA’s projected scenarios?”
Table of Contents
Appendix B: Articles
Early data on learning loss show big drop in math, but not reading skills
ODE Data Insights on the 2020-21 School Year
Table of Contents