Embed Size (px)
Citation preview

At the Crossroads:
byEdward J. FeserHarvey A. GoldsteinMichael I. LugerPrincipal Investigators
with
Andrius NemickasResearch Associate
prepared forNorth Carolina Alliance for Competitive Technologies
North Carolina Board of Science and Technology
Department of City and Regional PlanningUniversity of North Carolina at Chapel Hill
APRIL 1998
North Carolina’s Place in theKnowledge Economy of the 21st Century


At the Crossroads:North Carolina’s Place inthe Knowledge Economyof the 21st Century
byEdward J. FeserHarvey A. GoldsteinMichael I. LugerPrincipal Investigators
with
Andrius NemickasResearch Associate
prepared forNorth Carolina Alliance for Competitive Technologies
North Carolina Board of Science and Technology
Department of City and Regional PlanningUniversity of North Carolina at Chapel Hill
APRIL 1998

ii At the Crossroads: North Carolina’s Place in the Knowledge Economy

At the Crossroads: North Carolina’s Place in the Knowledge Economy iii
The North Carolina economy today is a picture of stark contrasts: apredominance of traditional manufacturing sectors and anexpanding core of high technology activity; a low-wage, low-skill,
but highly productive workforce and a growing concentration of highlyskilled research and professional workers; a below average volume of R&Din industry and well above average rates of R&D growth in universitiesand teaching hospitals. The general economic and research trends offerboth positive and negative perspectives on the state’s future. Overall, theysuggest impending restructuring of considerable magnitude that will re-quire creative responses from policy makers, industry leaders, and educa-tors.
This report is intended to stimulate our thinking about how to meetthe challenges of the 21st century. In doing so, it raises some old and dif-ficult questions: what can be done to ensure a smooth transition from atraditional manufacturing to a knowledge-based economy? And, how canwe help expand knowledge resources more broadly in geographic terms,so that R&D can occur in non-metropolitan counties with small and me-dium sized manufacturing establishments? Accomplishing those two taskswill help prevent chronic displaced worker problems, and will help in-crease incomes in the state.
The report provides a few principles. Generally, these have beenfollowed in the development of policy in North Carolina. But they sug-gest some additional actions that can be taken.
■■■■■ Put resources where there is likely to be a payoff because ofexisting critical mass.
The report identifies where industrial and university strengths coin-cide. Efforts are already underway in some of those sectors (the Bio-technology Center with pharmaceuticals; MCNC with telecommu-nications and electronics). Further efforts could be made toward otherclusters, e.g., industrial chemicals and environmental technologies.
■■■■■ Identify industries that are likely to be winners.
The limitation of any type of industrial policy is in being able to pickwinners and avoid losers. Indeed, the market does that reasonably
Summary
Findings from this study are containedin three documents. This report con-tains the main report findings and meth-odology. At the Crossroads: Technical Ap-pendix contains extensive technical notesand a set of tables that provide detailedsupporting information. At the Cross-roads: Report Summary constitutes a syn-opsis of the findings and policy implica-tions. Copies of all documents are avail-able from the North Carolina Board ofScience and Technology. ■
Report Documents
iv At the Crossroads: North Carolina’s Place in the Knowledge Economy
well. But, to pull the economy up the trajectory, the state needs to beproactive. Our analysis has identified some good business develop-ment targets. For example, twenty-five industries are technology-intensive and growing in terms of jobs and wages.
■■■■■ Develop home grown businesses that may emerge as head-quarters and/or research centers.
The payoff from successful start-ups and spin-offs is substantial– thecreation of quality jobs and income growth at SAS, Sphinx, Emrex,and Quintiles are cases in point. The North Carolina economy ismuch riper for entrepreneurial development today than it has everbeen.
■■■■■ Invest in knowledge infrastructure.
The old mindset among industrial developers was that roads neededto be built to ensure that jobs would come, especially in non-metro-politan areas. As we move into the 21st century, knowledge infra-structure plays that role. To get growth into regions that need it, weneed to consider the strategic use of telecommunication links, busi-ness parks, institutions of higher education (and training), in addi-tion to transportation nodes. The Global TransPark is one model forthat.
■■■■■ Invest in people.
As traditional industries continue to downsize and new businessesstart-up and expand, our workforce needs to be upgraded so thatemployees can make the transition. Similarly, entry-level workers(in high school) need to be prepared for work that requires compu-tation and a higher level of skills than in the past. This suggests ahost of school-to-work and displaced worker programs. It also im-plies a rethinking of traditional methods of training and educationdelivery, as well as a better meshing of the needs of industry withthe missions’ of the state’s universities and community colleges.
At the Crossroads: North Carolina’s Place in the Knowledge Economy v
AcknowledgmentsWe wish to thank the many individuals that provided invaluable
assistance and comments on different phases of this study. Several peopleserved in an ongoing advisory capacity, reviewing our general approach,methodology, and findings at different stages in the project. They includeJane Smith Patterson of the Board of Science and Technology, Walter H.Plosila of the North Carolina Alliance for Competitive Technologies, RonTyler of Glaxo-Wellcome, Inc., and Harry Leamy of UNC-Charlotte. Mem-bers of the Board of Science and Technology and NC ACTS Board of Direc-tors also provided helpful suggestions and advice, particularly the respec-tive chairmen, Norm Cohen and Dick Daugherty.
The following individuals graciously agreed to be interviewedabout science and technology trends in North Carolina and supplied muchexpert information about the state’s R&D enterprise and its importancefor different segments of the economy (affiliations at time of interview):
Alan Blatecky, MCNC
Alessandro Bocconcelli, Center for Marine ScienceResearch, UNC-Wilmington
Mike Bradley, NC Marine Trades Services, SBTDC
Gordon Clapp, Travel and Tourism Division, NCDepartment of Commerce
Mark Crowell, NC State University
Alvin Cruz, Research Triangle Institute
Jack Daniels, American Association of Textile Chemistsand Colorists
Joseph Denig, Department of Wood and Paper Science,NC State University
George Everett, Manufacturers and Chemical IndustryCouncil of North Carolina
Dean Gokel, Geochem

vi At the Crossroads: North Carolina’s Place in the Knowledge Economy
Ray Hensley, Furniture Technology Center, CatawbaValley Community College
John Irick, Apex Bioscience
Larry Jahn, Department of Wood and Paper Science,NC State University
Philip Johnson, Piedmont Triad Center for AdvancedManufacturing
Betsy Justice, NCEITA
Jasper Memory, UNC General Administration
Fran Meyer, Office of Technology Development, UNC-Chapel Hill
Tom Meyer, Graduate Studies and Research, UNC-Chapel Hill
Susan Moran, Travel and Tourism Division, NC Depart-ment of Commerce
Dennis Naugle, Research Triangle Institute
Steve Oneyear, Piedmont Triad Center for AdvancedManufacturing
Uttam Reddy, International Business Machines
Dan St. Louis, Hosiery Technology Center, CatawbaValley Community College
Kenneth Swartzel, Department of Food Science, NCState University
John Taggart, Division of Coastal Management, DEHNR
Jerry Tew, American Association of Textile Chemists andColorists
Robert Van Brederode, Polymer Extension Program,UNC-Charlotte
Max Wallace, Trimeris
William Weber, Piedmont Triad Center for AdvancedManufacturing
Finally, we thank Tim Maniccia, Anne Edwards, Hannes Traxler, AdhirKackar, Ken Bowers, and Karen Becker for excellent research assistanceand administrative support.

At the Crossroads: North Carolina’s Place in the Knowledge Economy vii
Executive Summary .......................................................................... iii
Acknowledgments ..............................................................................v
Introduction .......................................................................................... 1
Scope of the Report .................................................................................. 2
R&D for Economic Development .................................................... 3
The North Carolina Economy Today .............................................. 4
Research and Development Activity ....................................................... 5
Non-Profits and Federal Agency R&D Performers ................................. 9
North Carolina Industry at the Millenium.................................. 10
R&D Intensity ...................................................................................... 10
Patenting Activity ................................................................................. 13
Technology Intensity ............................................................................. 15
Summarizing Research & Technology in NC Today ............................. 17
The Promise of North Carolina’s Academic Research &Development Infrastructure .................................................. 18
Nationally Competitive Programs ........................................................ 18
Nationally Competitive Disciplines ...................................................... 19
The Industry-University Connection ........................................... 23
Federal R&D Spending and North Carolina ............................... 26
Trends in Federally-Supported R&D in North Carolina ...................... 26
Projected Federal R&D Spending in North Carolina ........................... 30
The Impact of Federal R&D Dollars ..................................................... 32
Implications and Guides to Policy ................................................ 34
Notes .................................................................................................... 37
Table of Contents

viii At the Crossroads: North Carolina’s Place in the Knowledge Economy

At the Crossroads: North Carolina’s Place in the Knowledge Economy 1
Introduction
North Carolina’s economy is at a crossroads. With aboutone-quarter of its workforce in manufacturing, almostten percentage points higher than the national average, the state
still ranks as the most manufacturing-intensive economy in the U.S. Eachyear, North Carolina attracts more new manufacturing plants than mostother states. Although there is also a high rate of plant closings, the state’seconomy is generally healthy, with a statewide unemployment rate near 4percent. Some of the state’s new manufacturing growth is in emergingsectors, notably in software development, health, and pharmaceuticals. Agrowing complex of knowledge resources (universities, medical centers,and research institutes), particularly in the Research Triangle area, has in-duced considerable high tech growth, including a sizable number of newstart-up and spin-off companies. General economic growth, especially inthe high technology industries, has pushed personal income up, rising by6.6 percent between 1995 and 1996 for the state as a whole.
While these trends are indeed positive, the state must not be lulledinto a false sense of security about its economic future. At the Crossroadsconsiders North Carolina’s economic prospects by assessing its researchstrengths in industry and the academy as well as its likely ability to re-spond to shifting R&D funding priorities in Washington. Our focus onR&D recognizes that successful economies in the early 21st century will bethose with a strong knowledge base. In particular, the competitive posi-tion of North Carolina in the global economy of the future will likely reston the ability of businesses and universities to work together to create andcommercialize new products and processes.
The report suggests that North Carolina’s current volume and dis-tribution of knowledge-based resources raises some concerns about thestate’s future. North Carolina’s traditional economic base consists of in-dustries that are declining nationally, and which depend upon relativelymodest amounts of R&D inputs. Because of the sectoral mix, and the promi-nence of manufacturing branch plants, research and development activ-ity in the state is generally relatively low. Moreover, much of the state’sR&D activity is concentrated in only a few technology sectors, institutions,and regions. Limited R&D activity is desirable only in the sense that itrenders the state less vulnerable to cutbacks in federally-funded, defense-related R&D. But, on balance, it is potentially problematic for at least threereasons.

2 At the Crossroads: North Carolina’s Place in the Knowledge Economy
First, R&D that leads to process innovations increases industry pro-ductivity. Productivity, in turn, enables North Carolina businesses to pros-per in the ever-competitive global marketplace. Fewer workers per dollarof output may be employed, but those who remain in the workforce earnhigher wages. That is essential if the state is to rank higher among statesin per capita income (despite a strong economy, it has not been able to riseabove 33rd in rank during the 1990s). Although North Carolina firms maycertainly continue to adopt best-practice process technologies developedoutside the state, the comparative absence of R&D (and headquarters) op-erations of major corporations means that North Carolina’s economic des-tiny is subject to greater external control than is the case for many other-wise comparable manufacturing states.
Second, R&D leading to new products enables the state to grow newbusinesses. New business development is critical to absorb the workersdisplaced in traditional industries as a result of the inevitable movementof labor-intensive production offshore, as well as the continued process ofautomation here. In other words, new process technologies drive produc-tivity advances, raising incomes but freeing up labor that must be absorbedelsewhere in the economy. New enterprise start-ups as a result of researchand development activity in existing industry and universities are neces-sary to provide new employment opportunities.
Finally, a more even geographic and sectoral distribution of knowl-edge resources helps reduce geographic economic inequities. Researchdemonstrates that firms benefit from proximity to research universitiesand institutes through the increased access to knowledge and expertise aswell as trained labor. Firms also benefit, for many of the same reasons,from proximity to R&D performing industries. And, of course, a moreeven distribution of knowledge-intensive, higher wage jobs means a moreeven distribution of income. In North Carolina, the better-paying, hightech jobs are concentrated in a relatively small number of counties (prima-rily in the Raleigh-Durham and Charlotte regions). In 1995, for example,per capita personal income ranged from $12,334 in Hoke county to $28,520in Mecklenberg county.
Scope of the Report
The report raises some old and difficult questions for policy makers:what can be done to ensure a smooth transition from a traditional
manufacturing to a knowledge-based economy? And, how can we helpexpand knowledge resources more broadly in geographic terms, so thatR&D can occur in non-metropolitan counties with small and medium sizedmanufacturing establishments? Accomplishing those two tasks will helpprevent chronic displaced worker problems, and will help increase incomesin the state.
The report is organized into five main sections. The first section elabo-rates the importance of R&D for economic development. The second sec-tion characterizes North Carolina’s current economy in terms of R&Dactivity. The third section assesses the potential for the economy to de-velop leading R&D industries and knowledge resources (universities,medical centers, and research institutes). The fourth section simulates the

At the Crossroads: North Carolina’s Place in the Knowledge Economy 3
effect of changes in R&D spending by the Clinton administration on thestate, considering its industry and university R&D patterns and capabili-ties. The final section proposes some policy actions that would help movethe state into the emerging knowledge economy of the 21st century.
R&D for Economic Development
Research and development is critical to a knowledge-intensive, tech-nology-based economy. It supplies the new ideas and products that
keep businesses on the leading edge of their respective industries, as wellas the innovations that lead to productivity-enhancing improvements inprocess technology. Current trends suggest that the U.S. economy willlikely become even more knowledge-intensive and R&D dependent asglobal competition intensifies. While many other countries compete onthe basis of a ready supply of traditional low cost factors (e.g., labor andland), the U.S. offers a highly skilled workforce, advanced infrastructure,and world-leading research facilities and expertise.
Over forty years ago, noted economists demonstrated that techno-logical change is a major contributor to economic growth. More recently,research has shown that technical change can be induced by R&D activityand that the growth prospects of particular cities and states depend to anincreasing degree on the condition of their ‘knowledge infrastructures.’Regions with strong knowledge bases and the capacity to innovate gener-ate new productive activity from within. They also attract additional tech-nology-based enterprises and workers from outside, which provides fur-ther resources and impetus for improvements in schools and universities.This relates to what has become known as endogenous growth theory:“As the skill or knowledge base of a regional labor force is perpetuallyenhanced from within it becomes a continuous internally created sourceof competitive advantage . . . for an economic system.”1
That is important for North Carolina. R&D can help provide a com-petitive advantage for its existing industries that are subject to increasingpressure from offshore manufacturers. R&D may lead to process innova-tions, enabling goods to be produced at lower unit cost, and to the devel-opment of new products. If existing goods are produced more capital in-tensively, for example, there would be less labor input per unit, but if mar-ket share increased, there could still be more employment, but at a higherwage. The state’s textiles industry is a case in point: value-added hascontinued to grow in the sector since the mid-1980s, even though employ-ment has been cut. Between 1989 and 1994, real GSP growth in SIC 22averaged 5.3 percent annually, over twice the state average, while employ-ment fell 1.5 percent annually. In short, the introduction of new equip-ment, and presumably, better methods, has kept the industry afloat. An-other example of R&D in a traditional industry is the introduction of nu-merically-controlled machines in the apparel industry. Garments are fab-ricated with less labor input, but the automation has kept the manufactur-ers viable in world markets, muting the loss of employment in that indus-try. R&D also has led to new products with substantial new employment

4 At the Crossroads: North Carolina’s Place in the Knowledge Economy
in pharmaceuticals—for example, the development of a variety of pro-tease inhibitors by Glaxo-Wellcome—and in software.
The location of the R&D is important. Several researchers have dem-onstrated a distinct R&D impact gradient: the economic benefits of researchand development are greater the closer one is to the site of the innovation.From North Carolina’s perspective, then, it is not enough to have R&Dconducted for the apparel industry in Massachusetts or Italy (whereverheadquarters or the lab may be), and applied in North Carolina. Chemi-cals manufacturers cannot continue to rely on innovations generated inOhio or Michigan. Likewise, that is true for every industry in the state.Plants that primarily import process and product innovations remain vul-nerable to closures designed to move production to lower labor cost sites.They also tend to employ a lower-skilled and lower-paid mix of workers.A purely production focused economy, particularly one dominated bybranch plants, is subject to a high degree of external control (through non-local headquarters and R&D operations of parent companies). It is, ineffect, less in charge of its own destiny.
The North CarolinaEconomy Today
The North Carolina economy today is a picture of stark contrasts: a pre-dominance of traditional manufacturing sectors and an expanding core
of high technology activity; a low-wage, low-skill, but highly productiveworkforce and a growing concentration of highly skilled research and pro-fessional workers; a below average volume of R&D in industry and wellabove average rates of R&D growth in universities and teaching hospitals.The general economic and research trends offer both positive and nega-tive perspectives on the state’s future. Overall, they suggest impendingrestructuring of considerable magnitude that will require creative responsesfrom policy makers, industry leaders, and educators.
One of the most significant features of the North Carolina economyis its continued manufacturing-intensity. The shift away from manufac-turing toward other sectors (retail trade, services, government and FIRE)has been somewhat more gradual in North Carolina than in most otherstates. Indeed, the share of gross state product (GSP) in manufacturing in1994 in North Carolina remained at 31.5 percent, compared to 19.4 per-cent in the ten largest manufacturing states and 18.4 percent for the U.S.as a whole. The state was the most manufacturing-intensive economy inthe country in 1994. Conversely, North Carolina’s service sector share oftotal GSP ranks 48 among the 50 states and the District of Columbia.
Manufacturing-intensity does not necessarily imply low perfor-mance. North Carolina has consistently paralleled average GSP growthin the south since 1986; in 1994, the state’s real GSP growth significantlyexceeded other southern states, the top ten manufacturing states, and theU.S. as a whole. Annual real growth in gross state product from 1989 to1994 averaged 2.06 percent.

At the Crossroads: North Carolina’s Place in the Knowledge Economy 5
In terms of employment, North Carolina has outpaced the manu-facturing state average since 1969, the earliest year for which comparabledata exist. It paralleled national growth trends closely until the post-re-cession years of 1983-4. Employment in the state recovered more quicklythan the national average over that period and has continued an upwarddivergent trend since. Notably, the state also recovered from the early1990s recession more quickly than the U.S. as a whole, the top ten manu-facturing state average, and the south. Overall, however, the state’s rateof employment growth has not matched the south’s over the full 1969-1994 period. Annual employment growth in North Carolina during the1989 to 1994 period averaged 2.0 percent.
Key specializations in North Carolina (using GSP as a measure) in-clude traditional low-technology industries such as tobacco, textiles, ap-parel, furniture, and farming, as well as several more technology-inten-sive sectors, including chemicals, rubber and plastics, electronics, and airtransportation. Potentially emerging specializations include motor vehiclesand equipment, instruments, fabricated metals, primary metals, and healthservices. The industries with the highest rates of GSP growth between1989 and 1994 include farming; agricultural services, forestry and fishing;textiles; rubber and plastics; electronics; industrial machinery and equip-ment; motor vehicles and equipment; trucking and warehousing; air trans-portation; communications; wholesale trade; banking (nondepository in-stitutions and holding and investment companies); business services; andsocial services and membership organizations.2
Research and Development Activity
In 1993, scientists in North Carolina conducted $2.75 billion in researchand development, ranking the state eighteenth overall, and eighth
among the top ten manufacturing states. By way of comparison, expendi-tures for research and development (from all sources, federal, industryand government) exceeded $33 billion in California, $10 billion in Michi-gan and Pennsylvania, and $2.9 billion in Virginia and Minnesota. NorthCarolina total R&D expenditures relative to other states are increasing,however. The state ranked twenty-first in total R&D expenditures in 1975.3
In 1993, North Carolina’s R&D intensity (typically measured as theratio of total R&D expenditures to gross state product) stood at 1.6 per-cent, up from 1.3 percent in 1985. That was below all major manufactur-ing states except Texas and Georgia, and was significantly below the U.S.average of 2.7 percent. Thus, despite the success of Research Triangle Parkand a number of highly visible R&D performers in the state, North Caro-lina conducts a significantly below-average volume of R&D in relativeterms.
Among R&D performers, the state’s universities and colleges con-ducted $604 million of North Carolina’s $2.75 billion in R&D spending in1993. That 22 percent share is 10 percentage points higher than the na-tional average, and higher than all other major manufacturing states (Fig-ure 1). By contrast, industry R&D constitutes a somewhat smaller share oftotal R&D expenditures in North Carolina (at $1.93 billion or 70 percent in1993) compared to the national and manufacturing state averages (71 and

6 At the Crossroads: North Carolina’s Place in the Knowledge Economy
Federal (6.34%)
Univ. & Coll. (22.04%)
U&C FFRDCs (0.00%)Other Non-profits (1.35%)
Industry (70.27%)
North Carolina
Federal (4.31%)Univ. & Coll. (10.84%)
U&C FFRDCs (3.83%)Other Non-profits (1.45%)
Industry (79.57%)
Top 10 Manufacturing States
Federal (10.10%)Univ. & Coll. (12.08%)
U&C FFRDCs (3.21%)Other Non-profits (3.48%)
Industry (71.13%)
United States
FIGURE 1:R&D Expenditures by Sector, 1993
Source: National Science Foundation
80 percent, respectively). Other non-profits and federal agencies also playa smaller role in the North Carolina R&D enterprise while there are nouniversity-administered federally funded research and development cen-ters (FFRDCs) in the state.
Industry and the federal government are the two principal sourcesof R&D funds in the United States. The federal government provided 21percent of the total R&D funds expended in the state in 1993, a full 13percentage points below the national average of 34 percent. The state’sindustry makes up the difference at 72 versus 58 percent nationally. Otherfunding sources include state and local governments, intra-universityfunds, and foundations and other non-profits (all of which, together, ac-count for roughly 7 percent of R&D funds).
Industrial Research and Development. North Carolina industry con-ducts somewhat less research and development than many comparablemanufacturing states and the national average, though recent 10 to 15 yeartrends indicate significant above-average rates of growth (Table 1). In 1979,total industrial R&D expenditures in North Carolina stood at $327 million.By 1993, they had reached $1.93 billion, a 490 percent increase (comparedto 210 percent nationwide). The high rate of growth is in part due to thesmall base in which the state started. However, industrial R&D growth inNorth Carolina still outpaced Indiana and Georgia, states with a similarsmall base of activity in 1979.
Industrial R&D expenditures for 1993 place the state’s industrial R&Dintensity (the ratio of industrial R&D expenditures to gross state product)
TABLE 1: Trends in Industrial R&D Spending by StateTop 10 Manufacturing States and Selected Others
Total Industrial R&D (Millions) R&D Intensity1979 1993 % Change 1979 1993 % Change
Top 10 Manufacturing States 21,891 72,230 230.0 1.6% 2.1% 30.6 California 7,437 26,541 256.9 2.5% 3.2% 24.9 Texas 1,233 4,882 295.9 0.7% 1.1% 54.3 Ohio 1,635 5,144 214.6 1.4% 2.0% 46.1 Michigan 3,614 9,924 174.6 3.5% 4.6% 31.0 Illinois 1,673 5,242 213.3 1.2% 1.7% 41.0 New York 2,959 8,820 198.1 1.4% 1.6% 16.8 Pennsylvania 2,143 6,711 213.2 1.8% 2.4% 36.0 North Carolina 327 1,929 489.9 0.6% 1.1% 93.2 Indiana 723 2,177 201.1 1.3% 1.7% 36.4 Georgia 147 860 485.0 0.3% 0.5% 79.3
Selected Other StatesNew Jersey 2,191 8,162 272.5 2.6% 3.3% 25.8 Massachusetts 1,690 6,952 311.4 2.7% 4.0% 45.5 Connecticut 985 2,373 140.9 2.7% 2.2% -16.9 Minnesota 802 2,458 206.5 1.7% 2.1% 23.2 Missouri 746 1,375 84.3 1.4% 1.2% -19.2 Florida 620 2,425 291.1 0.7% 0.8% 15.8 Virginia 464 1,087 134.3 0.8% 0.6% -24.0 Wisconsin 420 1,343 219.8 0.8% 4.2% 401.2 Kentucky 209 289 38.3 0.6% 0.4% -39.5 Oklahoma 174 311 78.7 0.6% 0.5% -12.3 South Carolina 82 495 503.7 0.3% 0.7% 108.3
United States 38,226 118,334 209.6 1.5% 1.8% 20.2
Source: Bureau of Economic Analysis and National Science Foundation. Industry R&D intensity is defined as the ratio of industry spending on R&D to gross state product.

At the Crossroads: North Carolina’s Place in the Knowledge Economy 7
at 1.1 percent (nearly double its 1979 figure), though it still remains wellbelow the national average of 1.8 percent. Many other manufacturing states(including California, Texas, Ohio, Michigan, Illinois, New York and Penn-sylvania) conduct significantly more industrial R&D. North Carolina in-dustrial R&D does outpace several nearby states, including South Caro-lina, Virginia, and Georgia.
Significantly, over 99 percent of industrial R&D spending in NorthCarolina is derived from company rather than federal sources (Table 2). In1993, North Carolina firms appear to have garnered only $16 million infederal R&D money, 0.8 percent of total expenditures. The national aver-age breakdown of total industrial R&D expenditures by source is roughly19 percent federal, 81 percent company. Key comparison states appearconsiderably more successful or aggressive in pursuing federal R&D funds.The share of industrial expenditures from federal sources exceeds 10 per-cent in six out of ten major manufacturing states, as well as other compari-son states like Massachusetts, Connecticut, Minnesota, Florida and Virginia.4
Universities, Colleges and Teaching Hospitals. In 1994, North Caro-lina universities and teaching hospitals conducted nearly $680 million inresearch. Overall, academic research institutions in North Carolina ac-count for a 3.2 percent share of the nation’s total spending for R&D inacademic research institutions, compared to 2.7 percent for North
TABLE 2: Composition of Industrial R&D Spending by StateTop 10 Manufacturing States and Select Others, 1993 (Dollars in Millions)
Industrial R&D Spending by Source % FederalTotal Company Federal Share '93
Top 10 Manufacturing States 72,230 60,095 12,135 16.8 California 26,541 19,078 7,463 28.1 Texas 4,882 4,242 640 13.1 Ohio 5,144 4,114 1,030 20.0 Michigan 9,924 9,771 153 1.5 Illinois 5,242 5,006 236 4.5 New York 8,820 7,428 1,392 15.8 Pennsylvania 6,711 5,569 1,142 17.0 North Carolina 1,929 1,913 16 0.8 Indiana 2,177 2,177 0 0.0 Georgia 860 797 63 7.3
Selected Other StatesNew Jersey 8,162 7,784 378 4.6 Massachusetts 6,952 5,074 1,878 27.0 Connecticut 2,373 1,954 419 17.7 Minnesota 2,458 2,080 378 15.4 Missouri 1,375 1,375 0 0.0 Florida 2,425 1,455 970 40.0 Virginia 1,087 492 595 54.7 Wisconsin 1,343 1,343 0 0.0 Kentucky 289 282 7 2.4 Oklahoma 311 309 2 0.6 South Carolina 495 495 0 0.0
United States 118,334 95,521 22,813 19.3
Source: National Science Foundation.

8 At the Crossroads: North Carolina’s Place in the Knowledge Economy
Carolina’s share of gross domestic product (GDP). Three of the top fortyAmerican academic research institutions in total R&D support—Duke Uni-versity (26th ), the University of North Carolina at Chapel Hill (UNC-CH,28th), and North Carolina State University (NCSU, 36th)—are located inNorth Carolina. Those three institutions account for 88 percent of the state’stotal, though other institutions have prominent R&D support in particu-lar disciplines or technology fields.
The rate of growth of total funding for academic R&D activity hassignificantly outpaced the nation and a set of comparison states (Califor-nia, Georgia, Massachusetts, Michigan, Texas, and Virginia). From 1985 to1994, constant dollar funding for academic R&D grew by 94 percent, com-pared to 63 percent for the nation, and 60 percent for the composite groupof comparable states. Among the three largest institutions, R&D expendi-tures at Duke grew by nearly 140 percent over the period, at UNC-CH bynearly 100 percent, and at NCSU by nearly 50 percent. Among mid-sizedinstitutions, expenditures at Wake Forest, North Carolina A&T, and EastCarolina University at least doubled in real terms. Expenditures at UNC-Greensboro, which started from a small base, grew by over 186 percent.5
While the overall level of funding for R&D in North Carolina’s aca-demic institutions grew significantly between 1985 and 1994, the sourcesof funding shifted to a modest degree. Federal R&D support remained atabout the same proportion—slightly more than 60 percent—while indus-try support increased from 6.6 percent to 9.8 percent. During that timestate and local government support as a share decreased (from 18.8 to 13.6percent) while institutional support (including foundations) increased from8.2 to 9.5 percent. Compared to the nation and the group of comparablestates, North Carolina currently has about the same share of federal sup-port, a significantly larger relative share of support from industry and stateand local government, and a significantly smaller share of institutionalsupport.
The shifts in the distribution of funding by institution are more dra-matic. Industry-funded R&D at Duke and UNC-CH grew by over 260and 400 percent in real terms, respectively, between 1985 and 1994. AtWake Forest, industry R&D support grew by over 2000 percent. FederalR&D growth significantly exceeded the national average for all North Caro-lina institutions for which data are available, except North Carolina Cen-tral University (NCCU). The latter’s federal R&D expenditures grew by20 percent, compared to the national average 56 percent. Overall, NCCU’sR&D expenditures fell by 25 percent in real terms over the 1985-1994 period.
Other measures of R&D performance are innovativeness (patentsfiled and issued, licenses, royalties, invention disclosures and startups)and enrollments in science and engineering programs. While basic re-search, along with teaching, are the two traditional functions of researchuniversities, applied research that leads to product and process innova-tions in the marketplace has become an increasingly important activity forboth public and private universities. In fact, by most measures ofinnovativeness, North Carolina’s share of the national total increased from1991 to 1995. Indeed, the state is second only to Massachusetts and ranksabove California, Texas, Virginia, Georgia, and Michigan by most of themeasures. Based on this information, we can conclude that NorthCarolina’s academic institutions are becoming prominent players in tech-

At the Crossroads: North Carolina’s Place in the Knowledge Economy 9
nological innovation and technology transfer. Contrary to conventionalwisdom, in appears that the state’s academic institutions are reasonablybalanced between basic research and technological innovation and techtransfer.6
Many of the students enrolled in graduate science and engineeringprograms in North Carolina originate from out-of-state, but often remainin North Carolina when jobs are available within their areas of specializa-tion. In this sense, the state’s graduate science and engineering programsrepresent a potential ‘brain draw.’ Over the 1985-95 period the number ofenrolled students in graduate science and engineering programs in thestate increased from 6,635 to 9,341, or by 40.8 percent. NCSU and WakeForest account for the bulk of the increase. That brain draw is critical be-cause of the shortage of trained science and technology personnel thatalready exists for North Carolina industry (as well as for industry elsewhere).
Non-Profits and Federal Agency R&D Performers
Although industry and universities conduct most research and devel-opment in North Carolina, several federal agencies and non-profit
research institutes are also important R&D performers. In 1993, expendi-tures by federal agencies in the state spent topped $174 million. The larg-est of those are the U.S. Environmental Protection Agency (the EPA Envi-ronmental Research Center), the National Institutes of Health (the Na-tional Institute of Environmental Health Sciences), the U.S. Departmentof Defense, and the U.S. Department of Agriculture (USDA Southern Re-search Station). There is no reliable source of data available of total R&Dexpenditures by not-for-profit research institutes. However, National Sci-ence Foundation surveys indicate that non-profits in the state (not includ-ing academic institutions) conducted some $37 million in federally-fundedR&D in 1993. The largest player among non-profits is the Research Tri-angle Institute (RTI). RTI, which employs some 1,450, reported over $143million in revenues from research projects in 1996, 86 percent of which arederived from federal sources. Smaller non-profit research institutes in thestate include the North Carolina Biotechnology Center, the National Cen-ter for Health Statistics, the National Institute of Statistical Sciences, andthe Chemical Industry Institute of Toxicology.

10 At the Crossroads: North Carolina’s Place in the Knowledge Economy
North Carolina Industryat the Millenium: Poisedto Grow or Vulnerable?
There is no universally accepted way to measure the strength of a state’sindustrial base in terms of “technology.” In general, desirable indus-
try is that which pays increasingly high wages and employs an increasingnumber of workers. Since high wages relate to high labor productivity(which typically comes from investments in technology), the only way toachieve both outcomes is through an increase in the number of growingand innovative businesses. Businesses grow by producing for an expand-ing world market, and/or by capturing a growing share of that market. Todo the latter, an industry has to be innovative.
Those relationships suggest three measures of industry strength interms of technology: R&D intensity, patent activity, and technology intensity.R&D intensity (R&D expenditures over net sales) and patent activity in anindustry should correlate with innovativeness and growing productivity.In addition, we can consider the technology imbedded in the productionprocess. Technology-intensive businesses are those that produce high techgoods and/or use high tech manufacturing processes.
R&D Intensity
R&D spending data for North Carolina businesses suggest an interest-ing dichotomy: generally, the industries employing the largest num-
ber of workers in the state conduct smaller relative amounts of R&D thanindustries with relatively little employment. The top seven industries interms of R&D spending per dollar of sales (with unweighted R&D-inten-sity scores averaging 20.7), employ only 4.2 percent of the state’s workers(Table 3). The industries with the six largest shares of employment (total-ing 18.7 percent of workers), on the other hand, have an averageunweighted R&D-intensity score of 1.55.
The group of businesses with relatively low R&D intensities includethe state’s traditional employment leaders: furniture and fixtures, textilesand apparel, and lumber and wood products, among others. In 1994, thestate ranked first in terms of employment in furniture and fixtures, to-bacco products, and textiles and apparel, third in lumber and wood prod-ucts, and fifth in stone, clay and glass and radio and television receivingequipment. All of these sectors are significantly less R&D intensive thanthe national average. (The state ranks tenth in total employment in theU.S.) For these businesses to continue to be employment leaders and com-pete successfully in the global economy, they must increase their R&Dactivity.
Among R&D intensive industries, North Carolina ranks third in of-fice, computing, and accounting machines, fifth in drugs and medicinesand industrial chemicals, and eighth in communication equipment. The
At the Crossroads: North Carolina’s Place in the Knowledge Economy 11
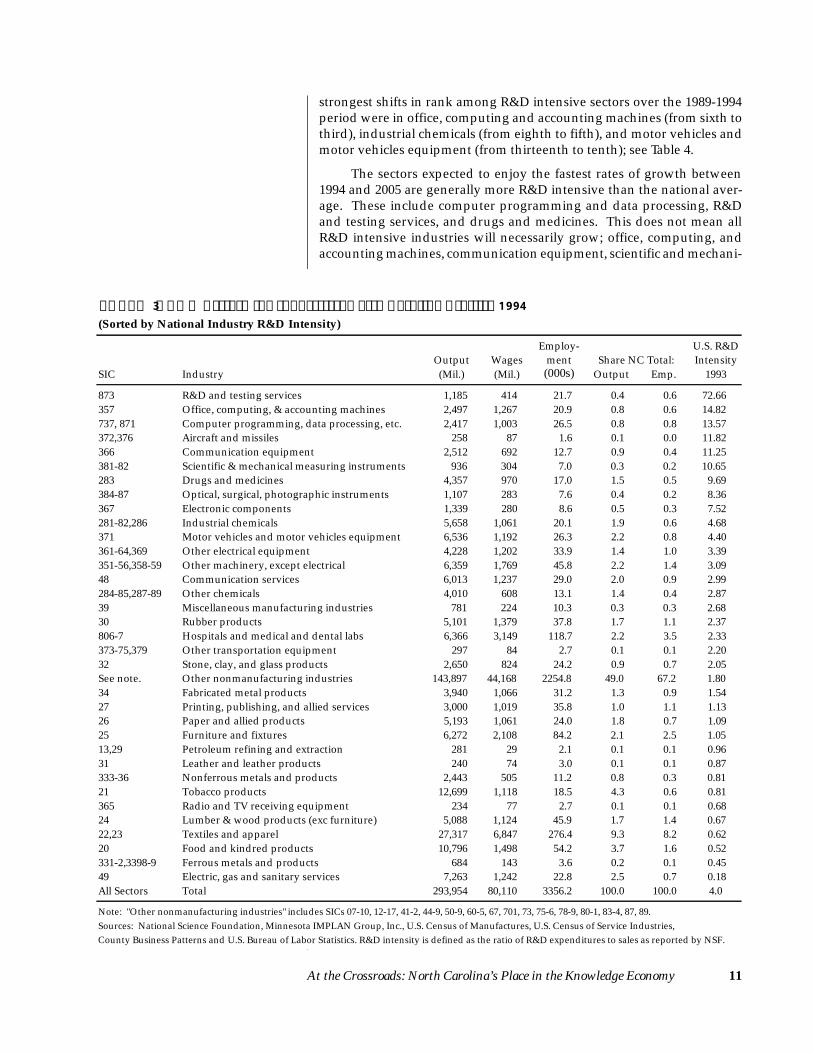
strongest shifts in rank among R&D intensive sectors over the 1989-1994period were in office, computing and accounting machines (from sixth tothird), industrial chemicals (from eighth to fifth), and motor vehicles andmotor vehicles equipment (from thirteenth to tenth); see Table 4.
The sectors expected to enjoy the fastest rates of growth between1994 and 2005 are generally more R&D intensive than the national aver-age. These include computer programming and data processing, R&Dand testing services, and drugs and medicines. This does not mean allR&D intensive industries will necessarily grow; office, computing, andaccounting machines, communication equipment, scientific and mechani-
TABLE 3: R&D Performing Industries: North Carolina Profile, 1994(Sorted by National Industry R&D Intensity)
Employ- U.S. R&DOutput Wages ment Share NC Total: Intensity
SIC Industry (Mil.) (Mil.) (000s) Output Emp. 1993
873 R&D and testing services 1,185 414 21.7 0.4 0.6 72.66 357 Office, computing, & accounting machines 2,497 1,267 20.9 0.8 0.6 14.82 737, 871 Computer programming, data processing, etc. 2,417 1,003 26.5 0.8 0.8 13.57 372,376 Aircraft and missiles 258 87 1.6 0.1 0.0 11.82 366 Communication equipment 2,512 692 12.7 0.9 0.4 11.25 381-82 Scientific & mechanical measuring instruments 936 304 7.0 0.3 0.2 10.65 283 Drugs and medicines 4,357 970 17.0 1.5 0.5 9.69 384-87 Optical, surgical, photographic instruments 1,107 283 7.6 0.4 0.2 8.36 367 Electronic components 1,339 280 8.6 0.5 0.3 7.52 281-82,286 Industrial chemicals 5,658 1,061 20.1 1.9 0.6 4.68 371 Motor vehicles and motor vehicles equipment 6,536 1,192 26.3 2.2 0.8 4.40 361-64,369 Other electrical equipment 4,228 1,202 33.9 1.4 1.0 3.39 351-56,358-59 Other machinery, except electrical 6,359 1,769 45.8 2.2 1.4 3.09 48 Communication services 6,013 1,237 29.0 2.0 0.9 2.99 284-85,287-89 Other chemicals 4,010 608 13.1 1.4 0.4 2.87 39 Miscellaneous manufacturing industries 781 224 10.3 0.3 0.3 2.68 30 Rubber products 5,101 1,379 37.8 1.7 1.1 2.37 806-7 Hospitals and medical and dental labs 6,366 3,149 118.7 2.2 3.5 2.33 373-75,379 Other transportation equipment 297 84 2.7 0.1 0.1 2.20 32 Stone, clay, and glass products 2,650 824 24.2 0.9 0.7 2.05 See note. Other nonmanufacturing industries 143,897 44,168 2254.8 49.0 67.2 1.80 34 Fabricated metal products 3,940 1,066 31.2 1.3 0.9 1.54 27 Printing, publishing, and allied services 3,000 1,019 35.8 1.0 1.1 1.13 26 Paper and allied products 5,193 1,061 24.0 1.8 0.7 1.09 25 Furniture and fixtures 6,272 2,108 84.2 2.1 2.5 1.05 13,29 Petroleum refining and extraction 281 29 2.1 0.1 0.1 0.96 31 Leather and leather products 240 74 3.0 0.1 0.1 0.87 333-36 Nonferrous metals and products 2,443 505 11.2 0.8 0.3 0.81 21 Tobacco products 12,699 1,118 18.5 4.3 0.6 0.81 365 Radio and TV receiving equipment 234 77 2.7 0.1 0.1 0.68 24 Lumber & wood products (exc furniture) 5,088 1,124 45.9 1.7 1.4 0.67 22,23 Textiles and apparel 27,317 6,847 276.4 9.3 8.2 0.62 20 Food and kindred products 10,796 1,498 54.2 3.7 1.6 0.52 331-2,3398-9 Ferrous metals and products 684 143 3.6 0.2 0.1 0.45 49 Electric, gas and sanitary services 7,263 1,242 22.8 2.5 0.7 0.18 All Sectors Total 293,954 80,110 3356.2 100.0 100.0 4.0
Sources: National Science Foundation, Minnesota IMPLAN Group, Inc., U.S. Census of Manufactures, U.S. Census of Service Industries,Note: "Other nonmanufacturing industries" includes SICs 07-10, 12-17, 41-2, 44-9, 50-9, 60-5, 67, 701, 73, 75-6, 78-9, 80-1, 83-4, 87, 89.
County Business Patterns and U.S. Bureau of Labor Statistics. R&D intensity is defined as the ratio of R&D expenditures to sales as reported by NSF.

12 At the Crossroads: North Carolina’s Place in the Knowledge Economy
cal measuring instruments, and motor vehicles and motor vehicle manu-facturing equipment are all expected to suffer significant employmentdeclines over the period at the national level. Neither does it mean thatonly R&D intensive industries should grow. Some growth is expected inrelatively non-R&D intensive non-manufacturing sectors (such as personalservices and retail trade). But note that to the degree R&D intensive sec-tors do increase their relative share of overall NC activity, average wagesare likely to increase. R&D intensive sectors pay significantly higher wagesthan non-R&D performing industries.7
TABLE 4: R&D Performing Industries: North Carolina Performance Indicators(Sorted by National Industry R&D Intensity)
Avg. Pro- Annual % Nat'l Proj. Emp. Rank Emp.ductivity Emp Gro. Yearly Gro. Shift Loc. Quo-
Industry '94 (000s) '89-'94 Emp, '94-'05 Wage '94 Emp. '94 '89-'94 tient '94
R&D and testing services 55 11.66 2.94 17 17 0 1.30 Office, computing, & accounting machines 119 -1.83 -2.28 14 3 3 2.01 Computer prog., data processing, etc. 91 8.08 4.90 22 17 1 0.52 Aircraft and missiles 161 -6.37 -0.54 15 30 -2 0.09 Communication equipment 198 -7.13 -1.27 6 8 0 1.76 Scientific & mechanical measuring instr. 135 -3.04 -1.65 25 22 2 0.51 Drugs and medicines 256 5.05 2.14 19 5 2 2.19 Optical, surgical, photographic instr. 145 2.25 0.43 15 13 0 0.65 Electronic components 156 1.09 0.15 26 9 0 0.53 Industrial chemicals 281 0.23 -0.77 26 5 3 1.55 Motor vehicles and motor vehicles equip 249 7.52 -1.25 22 10 3 0.99 Other electrical equipment 125 -0.31 -1.35 24 8 1 1.65 Other machinery, except electrical 139 -0.79 -0.72 20 10 1 0.95 Communication services 207 4.00 -0.49 30 14 0 0.75 Other chemicals 306 0.11 -0.46 17 12 0 1.23 Miscellaneous manufacturing industries 76 -1.39 0.30 32 16 -1 0.89 Rubber products 135 1.92 0.74 17 8 -1 1.34 Hospitals and medical and dental labs 54 8.63 2.54 22 13 -1 0.83 Other transportation equipment 108 -8.11 -0.76 24 22 -3 0.35 Stone, clay, and glass products 110 -0.38 -1.69 40 5 2 1.53 Other nonmanufacturing industries 64 3.09 1.69 30 12 1 0.89 Fabricated metal products 126 0.65 -1.35 34 16 1 0.76 Printing, publishing, and allied services 84 1.17 0.50 31 18 2 0.77 Paper and allied products 216 -0.49 0.22 17 10 1 1.18 Furniture and fixtures 74 -1.33 0.24 36 1 0 5.67 Petroleum refining and extraction 134 3.04 -1.95 40 32 1 0.15 Leather and leather products 81 -2.57 -3.91 14 11 0 0.88 Nonferrous metals and products 217 1.71 -1.46 31 9 7 1.30 Tobacco products 686 -6.74 -3.46 2 1 0 14.89 Radio and TV receiving equipment 87 15.27 -3.47 21 5 4 1.03 Lumber & wood products (exc furniture) 111 1.38 -0.81 36 3 0 2.06 Textiles and apparel 99 -2.13 -1.67 16 1 0 5.68 Food and kindred products 199 0.97 0.09 42 7 2 1.09 Ferrous metals and products 188 5.16 -2.70 30 27 1 0.30 Electric, gas and sanitary services 319 -2.47 0.18 15 9 -1 0.83 All Sectors 88 9.95 1.30 30 10 1 -----
Sources: National Science Foundation, Minnesota IMPLAN Group, Inc., U.S. Census of Manufactures, U.S. Census of Service Industries,Note: "Other nonmanufacturing industries" includes SICs 07-10, 12-17, 41-2, 44-9, 50-9, 60-5, 67, 701, 73, 75-6, 78-9, 80-1, 83-4, 87, 89.
County Business Patterns and U.S. Bureau of Labor Statistics. Ranks are against the 50 states plus the District of Columbia. "All Sectors" projected growth is for nonfarm employment only.
NC Rank in US

At the Crossroads: North Carolina’s Place in the Knowledge Economy 13
FIGURE 2: Projected Growth by R&D Intensity(R&D Performing Industries. Dots Scaled by NC Employment Location Quotient, 1994)
0%
1%
10%
100%
-6% -4% -2% 0% 2% 4% 6%Projected National Annual Employment Growth 1994-2005
R&
D a
s a
Perc
ent o
f Sal
es (L
ogar
ithm
ic S
cale
)
Location Quotient = 1.0
Other Nonmanf
Tobacco
Textiles & Apparel
Furniture
Pharmaceuticals
R&D Labs
Prog ramming& Software
Hospitals& Labs
Rubber
Communications Equip
Food Products
Utilities
M isc M anf
Optical & Surg icalInstruments
Electronics
Off ice & Computing M achines
Industrial Chemicals
14
2
3
4
5 6
78
A ircraft & M issiles
9
10
11
12
13
Lumber & W ood Products
15 16
1
Figure 2 summarizes the relationship between R&D intensity, pro-jected growth, and the present industrial mix in the state. Figure 2 plotsnational average R&D intensity on the vertical axis and national projectedgrowth on the horizontal axis, while the marker is scaled by the 1994 em-ployment location quotient (or degree of specialization). The graphic sug-gests two things. First, there is a moderate positive relationship betweenR&D intensity and projected employment growth. Second, NorthCarolina’s private sector economy remains largely specialized in indus-tries that are neither R&D intensive nor are expected to grow significantly.8
Patenting Activity
The patent data tell a similar story. In general, they indicate modestrates of industrial patenting activity (and, by implication, innovative
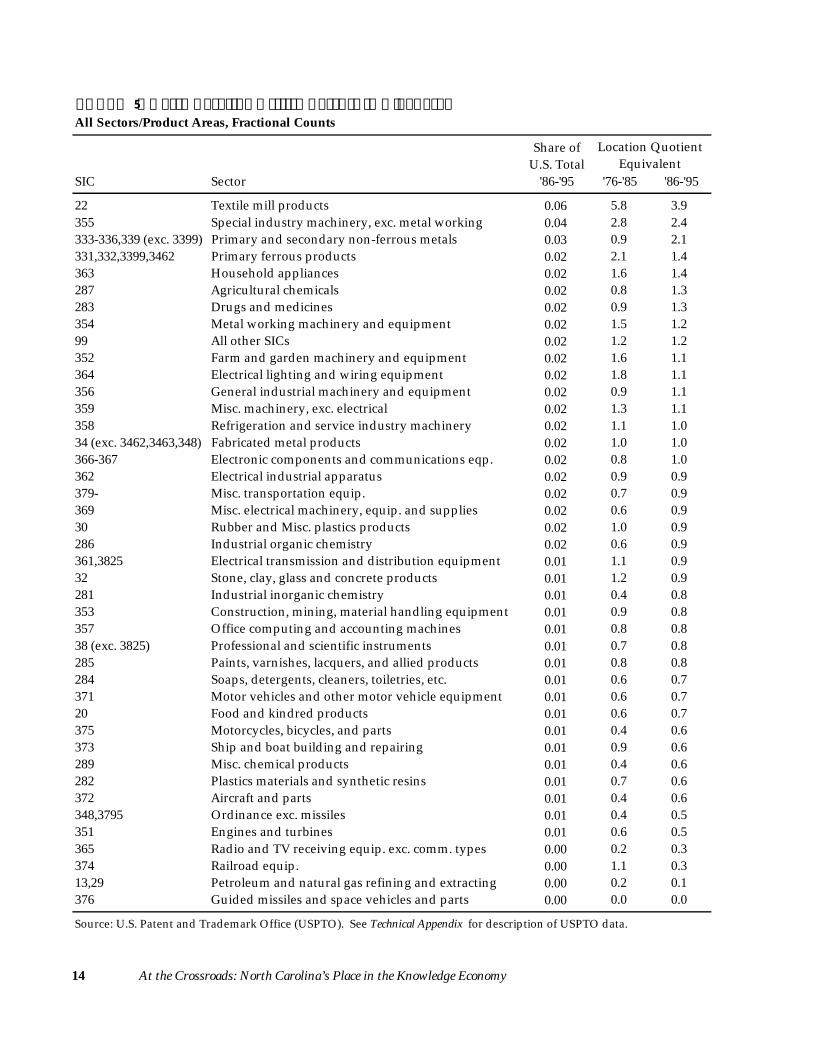
activity) in the state (Table 5). For example, just 6 percent of all U.S. pat-ents related to textile mill products granted between 1986 and 1995 weregranted to first-named inventors in North Carolina. This is despite thefact that North Carolina is ranked first in textiles employment in the U.S.Indeed, North Carolina businesses produce 30 percent of U.S. textiles grossdomestic product.9 Four percent of U.S. special industry machinery, 3 per-cent of primary and secondary non-ferrous metals, and 2 percent of pri-mary ferrous products, household supplies, agricultural chemicals, anddrugs and medicines patents were granted to North Carolina inventors.Despite the state’s position as the country’s tenth largest in employmentterms, in no product area does the state’s share of national patenting ac-tivity exceed 6 percent.
1 Motor Vehicles & Equipment2 Other Electrical Equipment3 Stone, Clay & Glass4 Fabricated Metal5 Other Nonelectrical Machinery6 Communications Services7 Other Chemicals8 Other Transport Equipment9 Nonferrous Metals10 Petroleum11 Ferrous Metals12 Radio & TV Equipment13 Leather Products14 Scientific Instruments15 Paper & Allied Products16 Printing & Publishing
FIGURE 2 Dot Key
Source: U.S. Bureau of Labor Statistics, NSF, IMPLAN.
14 At the Crossroads: North Carolina’s Place in the Knowledge Economy
TABLE 5: North Carolina Utility Patents in U.S. TotalAll Sectors/Product Areas, Fractional Counts
Share ofU.S. Total
SIC Sector '86-'95 '76-'85 '86-'95
22 Textile mill products 0.06 5.8 3.9 355 Special industry machinery, exc. metal working 0.04 2.8 2.4 333-336,339 (exc. 3399) Primary and secondary non-ferrous metals 0.03 0.9 2.1 331,332,3399,3462 Primary ferrous products 0.02 2.1 1.4 363 Household appliances 0.02 1.6 1.4 287 Agricultural chemicals 0.02 0.8 1.3 283 Drugs and medicines 0.02 0.9 1.3 354 Metal working machinery and equipment 0.02 1.5 1.2 99 All other SICs 0.02 1.2 1.2 352 Farm and garden machinery and equipment 0.02 1.6 1.1 364 Electrical lighting and wiring equipment 0.02 1.8 1.1 356 General industrial machinery and equipment 0.02 0.9 1.1 359 Misc. machinery, exc. electrical 0.02 1.3 1.1 358 Refrigeration and service industry machinery 0.02 1.1 1.0 34 (exc. 3462,3463,348) Fabricated metal products 0.02 1.0 1.0 366-367 Electronic components and communications eqp. 0.02 0.8 1.0 362 Electrical industrial apparatus 0.02 0.9 0.9 379- Misc. transportation equip. 0.02 0.7 0.9 369 Misc. electrical machinery, equip. and supplies 0.02 0.6 0.9 30 Rubber and Misc. plastics products 0.02 1.0 0.9 286 Industrial organic chemistry 0.02 0.6 0.9 361,3825 Electrical transmission and distribution equipment 0.01 1.1 0.9 32 Stone, clay, glass and concrete products 0.01 1.2 0.9 281 Industrial inorganic chemistry 0.01 0.4 0.8 353 Construction, mining, material handling equipment 0.01 0.9 0.8 357 Office computing and accounting machines 0.01 0.8 0.8 38 (exc. 3825) Professional and scientific instruments 0.01 0.7 0.8 285 Paints, varnishes, lacquers, and allied products 0.01 0.8 0.8 284 Soaps, detergents, cleaners, toiletries, etc. 0.01 0.6 0.7 371 Motor vehicles and other motor vehicle equipment 0.01 0.6 0.7 20 Food and kindred products 0.01 0.6 0.7 375 Motorcycles, bicycles, and parts 0.01 0.4 0.6 373 Ship and boat building and repairing 0.01 0.9 0.6 289 Misc. chemical products 0.01 0.4 0.6 282 Plastics materials and synthetic resins 0.01 0.7 0.6 372 Aircraft and parts 0.01 0.4 0.6 348,3795 Ordinance exc. missiles 0.01 0.4 0.5 351 Engines and turbines 0.01 0.6 0.5 365 Radio and TV receiving equip. exc. comm. types 0.00 0.2 0.3 374 Railroad equip. 0.00 1.1 0.3 13,29 Petroleum and natural gas refining and extracting 0.00 0.2 0.1 376 Guided missiles and space vehicles and parts 0.00 0.0 0.0
Source: U.S. Patent and Trademark Office (USPTO). See Technical Appendix for description of USPTO data.
Location QuotientEquivalent

At the Crossroads: North Carolina’s Place in the Knowledge Economy 15
This does not mean that the relative rates have not been improvingover time. Between 1976 and 1985, inventors in one half of all U.S. statespatented more industrial inorganic chemistry inventions than inventorsin North Carolina.10 Between 1986 and 1995, the number of states patent-ing more inventions in this area fell to one-third. Other product areaswith significant improvements in local relative patenting rates includeprimary and secondary nonferrous metals, general industrial machinery,detergents and cleaners, aircraft and parts, miscellaneous transportationequipment, motor vehicles and equipment, motorcycles and bicycles, andmiscellaneous chemical products. On the other hand, relative patentingrates in several other product areas declined significantly between the twoten year periods: railroad equipment, ship and boat building and repair-ing, and electrical lighting and wiring equipment.
In summary, most patents granted to North Carolina inventors arein sectors that are still relatively small employers. Of course, the veryinnovativeness of those businesses could result in growth and greateremployment as market shares rise. However, that depends on how suc-cessful those industries are relative to similar businesses elsewhere. NorthCarolina patent grants are in the national top ten in only three areas: tex-tile mill products, special industry machinery, and primary and second-ary non-ferrous metals. The industries that account for almost half thestate’s patent total (electrical equipment and communications equipment,professional and scientific instruments, specialized industrial machinery,and fabricated metal products) happen to be highly innovative everywhere,so they may not capture growing shares of world markets.
Technology Intensity
The last measure of industry strength is what we call technology-inten-siveness, or the propensity to produce high tech goods and/or employ
high tech production processes. Those data are somewhat more encour-aging. In 1996, the twenty-five major technology-intensive industries inthe state totaled 5,800 establishments and nearly 264,000 workers, 3.1 and8.3 percent of all private sector establishments and employment. Overall,those businesses experienced a 20.3 percent increase in employment anda 15.5 percent increase in real wages between 1989 and 1996, or 3 percentand 2.2 percent per year, respectively, a trend that is likely to continue.The weekly wage of the average worker in a technology-related businessalso exceeds the private industry average by 74 percent.11
Motor vehicle parts and accessories and several computers, electron-ics, and software industries dominate the list of fastest growing technol-ogy-intensive four-digit SIC industries (Tables 6-8). Among technology-intensive industries generating the most net new employees between 1989and 1996, three of the top ten are in the computer programming and dataservices sector; two of the top ten are in the motor vehicles sector. Thecomputer programming and data processing sector also claims six of thetop ten four-digit SIC industries generating the most net new establish-ments between 1989 and 1996; three of the remaining four sectors in thetop ten are part of the research, development and testing sector.
To identify technology-intensive busi-nesses in the state, we use an indus-trial classification scheme prepared bythe North Carolina Employment Secu-rity Commission that consists of twentymajor manufacturing and nonmanu-facturing sectors comprised of over 150detailed four-digit SIC industries.12
Unlike the industrial classifications sys-tems used by the U.S. Patent and Trade-mark Office and the National ScienceFoundation, the classification of tech-nology-intensive sectors includesmany emerging non-manufacturingtechnology sectors, including commu-nications services, engineering ser-vices, and a nine-sector breakdown ofcomputer programming, software anddata services. ■
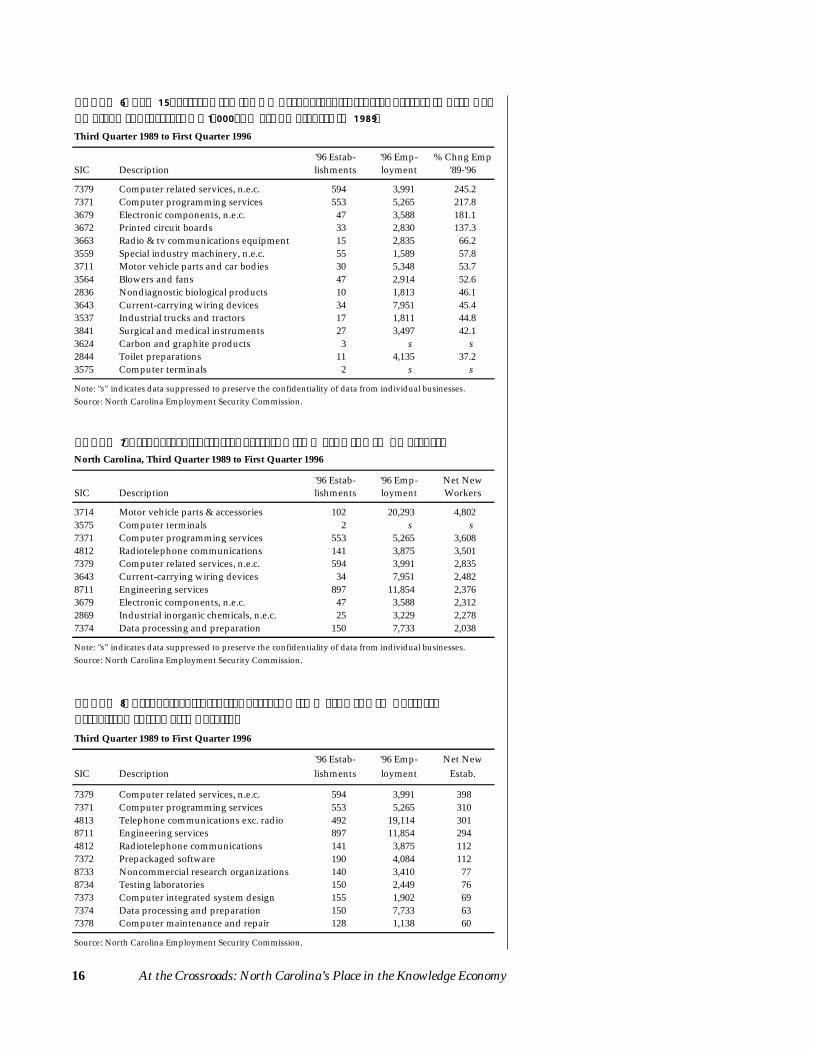
16 At the Crossroads: North Carolina’s Place in the Knowledge Economy
Third Quarter 1989 to First Quarter 1996
'96 Estab- '96 Emp- % Chng EmpSIC Description lishments loyment '89-'96
7379 Computer related services, n.e.c. 594 3,991 245.2 7371 Computer programming services 553 5,265 217.8 3679 Electronic components, n.e.c. 47 3,588 181.1 3672 Printed circuit boards 33 2,830 137.3 3663 Radio & tv communications equipment 15 2,835 66.2 3559 Special industry machinery, n.e.c. 55 1,589 57.8 3711 Motor vehicle parts and car bodies 30 5,348 53.7 3564 Blowers and fans 47 2,914 52.6 2836 Nondiagnostic biological products 10 1,813 46.1 3643 Current-carrying wiring devices 34 7,951 45.4 3537 Industrial trucks and tractors 17 1,811 44.8 3841 Surgical and medical instruments 27 3,497 42.1 3624 Carbon and graphite products 3 s s 2844 Toilet preparations 11 4,135 37.2 3575 Computer terminals 2 s s
Note: "s" indicates data suppressed to preserve the confidentiality of data from individual businesses.Source: North Carolina Employment Security Commission.
TABLE 7: Technology-Intensive Sectors with Most Net New EmployeesNorth Carolina, Third Quarter 1989 to First Quarter 1996
'96 Estab- '96 Emp- Net NewSIC Description lishments loyment Workers
3714 Motor vehicle parts & accessories 102 20,293 4,802 3575 Computer terminals 2 s s 7371 Computer programming services 553 5,265 3,608 4812 Radiotelephone communications 141 3,875 3,501 7379 Computer related services, n.e.c. 594 3,991 2,835 3643 Current-carrying wiring devices 34 7,951 2,482 8711 Engineering services 897 11,854 2,376 3679 Electronic components, n.e.c. 47 3,588 2,312 2869 Industrial inorganic chemicals, n.e.c. 25 3,229 2,278 7374 Data processing and preparation 150 7,733 2,038
Note: "s" indicates data suppressed to preserve the confidentiality of data from individual businesses.Source: North Carolina Employment Security Commission.
Third Quarter 1989 to First Quarter 1996
'96 Estab- '96 Emp- Net NewSIC Description lishments loyment Estab.
7379 Computer related services, n.e.c. 594 3,991 398 7371 Computer programming services 553 5,265 310 4813 Telephone communications exc. radio 492 19,114 301 8711 Engineering services 897 11,854 294 4812 Radiotelephone communications 141 3,875 112 7372 Prepackaged software 190 4,084 112 8733 Noncommercial research organizations 140 3,410 77 8734 Testing laboratories 150 2,449 76 7373 Computer integrated system design 155 1,902 69 7374 Data processing and preparation 150 7,733 63 7378 Computer maintenance and repair 128 1,138 60
Source: North Carolina Employment Security Commission.
TABLE 6: Top 15 Fastest Growing NC Technology-Intensive Sectors in Terms of Employment (Sectors w/ 1,000 or More Employees in 1989)
TABLE 8: Technology-Intensive Sectors with Most Net New Business Establishments, North Carolina

At the Crossroads: North Carolina’s Place in the Knowledge Economy 17
Summarizing Research and Technologyin North Carolina Industry
Combining the R&D intensity, patent activity, and technology inten-sity information, we group R&D performing industries into three
types: high performing, emerging national leaders, and national leaders. Highperformance industries are those that have grown significantly in the last5-10 years and/or that are projected to grow significantly through 2005(based on national-level projections). Emerging national leaders are in-dustries in which North Carolina appears to be developing an advantageor specialization relative to other U.S. states. Finally, current national lead-ers are large, existing specializations in the state. For each of the threetypes, we also identify whether the sector is above average in R&D inten-sity and whether there is evidence of significant increases in associatedNorth Carolina patent activity between 1986 and 1995.13
Drugs and medicines, industrial chemicals, stone, clay and glass prod-ucts, and office, computing, and accounting machines are both currentand emerging national leaders. These North Carolina industries have al-ready achieved a critical mass, and are continuing to garner an even greatershare of U.S. economic activity. That is in contrast to furniture, lumberand wood products, textiles and apparel, and tobacco, which either al-ready rank first in the U.S. in total employment or have declined in na-tional rank. These sectors are also average or below average in R&D in-tensity and there is no indication of upward movement in patenting activity.
TABLE 9: Classification of R&D Performing Sectors in North CarolinaDynamic
High National Leader R&D PatentR&D Performing Sector (NSF Definition) Peformance Emerging Current Intensive? Field(s)?
Communications services YesComputer programming and data processing Yes YesDrugs and medicines Yes Yes Yes Yes YesElectronic components Yes YesHospitals; medical and dental labs YesMotor vehicles and equipment Yes Yes Yes YesR&D and testing services Yes YesRadio and TV receiving equipment Yes Yes YesRubber and miscellaneous plastics products Yes YesFood and kindred products YesIndustrial chemicals Yes Yes Yes YesNonferrous metals and products Yes YesOffice computing & accounting machines Yes Yes YesStone, clay and glass products Yes YesCommunication equipment YesFurniture and fixtures YesLumber and wood products YesTextiles and apparel YesTobacco products Yes
See Technical Appendix Tables 26-28 for details, text for definitions.

18 At the Crossroads: North Carolina’s Place in the Knowledge Economy
Among both the high performance and emerging sectors are drugsand medicines, radio and television receiving equipment, and motor ve-hicles and motor vehicles equipment. These sectors are not only growingrapidly in relative terms, but are also ranked tenth or better in the U.S. interms of total employment. A number of high growth sectors, notablycomputer programming and data processing and R&D and testing ser-vices, do not yet account for a significant share of national activity. Yetthey clearly have significant growth potential and represent what the state’seconomy may come to look like in the coming decades as it continues itsshift away from traditional manufacturing.
The Promise of North Carolina’sAcademic R&D Infrastructure
The R&D strength of universities is as difficult to measure as the strengthof industry. We measured academic research strength in terms of to-
tal annual R&D funding received in 1994, the perceived quality of thegraduate faculty, the number of publications appearing in peer-reviewedjournals per faculty member, and the number of times faculty publica-tions have been cited in peer-reviewed journals. We limited our analysisto the (natural) sciences and engineering.
Nationally Competitive Programs
Nineteen academic programs qualified as “nationally-competitive,” us-ing the measure we devised (Table 10). Eight of those are housed at
Duke, eight at UNC-CH, and three at NCSU. Six programs received “na-tionally-competitive” status at both UNC-CH and Duke: cell and develop-ment biology, pharmacology, biochemistry and molecular biology, physi-ology, molecular and genetic sciences, and neurosciences. Among the en-gineering programs in the state, three at NCSU (electrical, materials sci-ence, and chemical) and one at Duke (biomedical) were judged “nation-ally-competitive.” Some of these programs are getting stronger as well, asthey are also classified as emerging national competitors (Table 11). Amongthose that are on a competitive trajectory but have not yet achieved na-tional prominence include five programs at NCSU (physics, mathematics,chemistry, civil engineering, and statistics) and one program at Duke (me-chanical engineering).
Although only programs at Duke, UNC-CH, and NC State achievecomposite rankings sufficiently high enough to classify them as nation-ally competitive, programs at other academic institutions in the state haveachieved excellence within their regions. Because many of those programsare positioned to provide R&D support, serve as R&D partners with in-dustry, or complement strengths in R&D activity in the state’s primaryresearch universities, they should not be overlooked. Moreover, those pro-grams often form the basis for important university-industry linkages

At the Crossroads: North Carolina’s Place in the Knowledge Economy 19
within their respective regions. There is also potential that some of themmay become national programs in their own right. The national within-discipline rankings of academic programs in terms of R&D funding for thesixteen institutions for which data are available are provided in Table 12.14
Nationally Competitive Disciplines
To identify nationally competitive disciplines, our first approach is sim-ply to sum the composite scores for all NC programs in each given
discipline. Using that method, the most competitive discipline in the staterelative to its discipline nationally is clearly pharmacology (see Table 13). At asecond level in degree of national competitiveness (again, within their re-spective disciplines) are cell and development biology and biochemistryand molecular biology. At a broader third level are physiology, molecularand genetic sciences, ecology, chemistry, neurosciences, statistics/biosta-tistics. That level is more heterogeneous (with scores ranging between24.0 and 31.2) than the fourth level suggested by the breaks, which in-cludes physics, computer science, mathematics, civil engineering, and bio-
Program Institution Score
Biochemistry and Molecular Biology Duke 10.0 Cell and Development Biology Duke 10.0 Pharmacology Duke 9.8 Cell and Development Biology UNCCH 9.7 Biochemistry and Molecular Biology UNCCH 9.5 Electrical Engineering NCSU 9.5 Ecology, Evolution and Behavior Duke 9.3 Pharmacology (1) UNCCH 9.2 Chemistry UNCCH 9.1 Pharmacology (2) UNCCH 9.1 Physiology Duke 9.1 Materials Sciences NCSU 8.9 Molecular and Genetic Sciences Duke 8.9 Chemical Engineering NCSU 8.8 Neurosciences Duke 8.7
Neurosciences UNCCH 8.7 Molecular and Genetic Sciences UNCCH 8.6
Biomedical Engineering Duke 8.5 Physiology UNCCH 8.5
(1) Rank is for interdisciplinary program. (2) Rank is for School of Arts and Sciences. See sidebar for scoring methodology. Sources: National Research Council, Research-Doctorate Programs in the United States; National Science Foundation, CASPAR database; authors' calculations.
TABLE 10: Strongest Science and Engineering Programs

20 At the Crossroads: North Carolina’s Place in the Knowledge Economy
medical engineering. The remaining disciplines are significantly less com-petitive at the national level.
The six most competitive disciplines in the state are all biosciences,while the seventh through ninth most competitive (including statistics/biostatistics) are closely related fields. Those results are driven by boththe success and critical mass of biosciences research at the state’s majoruniversities. Although there are a number of prominent engineering pro-grams in the state (particularly at NCSU), there is not the critical mass inthese areas that there is in the biosciences.
If we average the scores of only those programs within a given disci-pline that achieve a score of 7.0 or greater, the results change somewhat(see Table 13). The most competitive North Carolina discipline, within itsdiscipline nationally, under this approach is electrical engineering, followedby cell and development biology, biochemistry and molecular biology, andpharmacology. Thus, the engineering disciplines are much better repre-sented; they comprise four of the top ten most competitive disciplines (elec-trical, materials, chemical, and biomedical). Nevertheless, the dominance
Discipline Institution Score
Neurosciences Duke 9.2 Physics NCSU 9.2 Electrical Engineering NCSU 9.0 Mathematics NCSU 9.0 Pharmacology Duke 9.0 Pharmacology (1) UNCCH 9.0 Chemical Engineering NCSU 8.8 Materials Sciences NCSU 8.8 Mechanical Engineering Duke 8.8 Biochemistry & Molecular Biology UNCCH 8.6 Chemistry NCSU 8.6 Civil Engineering NCSU 8.6 Molecular and Genetic Sciences Duke 8.6 Pharmacology (2) UNCCH 8.4 Statistics/Biostatistics NCSU 8.2 Cell and Development Biology UNCCH 8.0 Chemistry UNCCH 8.0
(1) Interdisciplinary program. (2) School of Arts and Sciences. See sidebar for scoring methodology. Sources: National Research Council, Research-Doctorate Programs in the United States ; National Science Foundation, CASPAR database; authors' calculations.
TABLE 11: Emerging or Most Dynamic Science and Engineering Programs in North Carolina

At the Crossroads: North Carolina’s Place in the Knowledge Economy 21
To identify the strongest individual academic programs in the state,we calculated scores based upon each program’s national within-discipline ranking under four indicators: total annual R&D fund-ing received in 1994, perceived quality of the graduate faculty, to-tal publications in peer-reviewed journals (over the 1988-92 pe-riod) per faculty member, and total citations of faculty publicationsin peer-reviewed journals (over 1988-92). We allocated points (1-10) for each indicator according to where each program’s nationalrank fell in terms of deciles within its discipline. For instance, aprogram ranked within the top 10 percent of all U.S. programs inits discipline in terms of R&D funding received a maximum of 10points for that indicator. A program ranked in the second decileon the same indicator received 9 points, a program ranked in thethird decile received 8 points, and so on. We then computed anoverall program score as a weighted average of the points for eachof the four indicators. Total R&D funding and perceived facultyquality were assigned weights of 0.3 each, while we gave publica-tions per faculty member and citations weights of 0.2 each. Thussuccess in winning external grants and quality of the faculty weregiven slight emphasis in our calculations. Note that we also em-phasize volume of R&D funding, as opposed to R&D funding perfaculty member. We assume that critical mass and size of programare integral to the national competitiveness of North Carolina uni-versities.
We used the same basic procedures to identify emerging or excep-tionally “dynamic” academic programs, except that the indicators in-clude two measures of change: total R&D funding between 1985
and 1994; change in rank of perceived faculty quality over the 1988-92 period; and change in total publications per faculty memberover the 1988-92 period. The three indicators were assignedweights of 0.4, 0.4, and 0.2, respectively. Note that our rankingsshow some programs as both current and emerging strengths, anindication of present national competitiveness and significant po-tential for an even stronger competitive position in the future.
The identification of the state’s strongest science and engineering dis-ciplines takes into account the number and relative strength ofhighly rated academic programs within a discipline, among all aca-demic institutions in North Carolina. Using two formulas, we gen-erated two alternative lists of most competitive disciplines. Forthe first list, we summed scores of every program within a givendiscipline in the state to arrive at an overall score for that disci-pline. For the second list, we averaged the scores of only thoseprograms within a given discipline that met a minimum thresholdof 7.0. The first formula takes into account the presence of all aca-demic programs within a discipline in the state, albeit weightedby their respective strength. The second formula only takes intoaccount the most highly rated programs nationally, and thereforeregards “middle-of-the-road programs” as less significant contribu-tors to the state’s academic R&D infrastructure. The second ap-proach tends to limit the critical mass effect for some disciplinesthat have many programs in the state. We used only one formulato generate a single list of emerging disciplines in the state: thesum of program scores at or above a threshold level of 7.0. ■
How Were North Carolina’s Academic Programs Ranked?
ASU
Benn
ett
Duk
e
ECU
ECSU
FSU
John
son
NC
A&
T
NC
CU
NC
SU
Shaw
UN
CC
H
UN
CC
UN
CG
WFU
WC
U
WSS
U
Aerospace Engineering 65Chemical EngineeringCivil Engineering 8Electrical EngineeringMechanical Engineering 52Materials Engineering 101 3Other Engineering 69AstronomyChemistry 242 188 275 149 307 321Physics 31 223 167 224 240 207Other Physical Sciences 57Atmospheric Sciences 61Earth Sciences 15Oceanography 45Other Geosciences 120 97Mathematics and Statistics 224Computer Science 181Agricultural Sciences 115 66 9Biological Sciences 336 7 320 206 9 309 224Medical Sciences 40 111 170 42Other Life Sciences 100 156 10 83
Ranked according to total R&D funding. Source: National Science Foundation, CASPAR database and authors' calculations.
TABLE 12: National Rankings of North Carolina Academic Programs, 1994

22 At the Crossroads: North Carolina’s Place in the Knowledge Economy
of biosciences in the state remains. Biosciences make up six of the tenmost competitive disciplines, and, among the second through ninth mostcompetitive disciplines, there is a very narrow range of scores (from 9.0 to8.7). Thus the two composite scoring methods are largely reinforcing intheir general findings.
The ranking of emerging academic disciplines finds electrical, chemical,and materials engineering, followed by molecular and genetic sciences,neurosciences, and pharmacology among the state’s most dynamic disci-plines. Note that the electrical, chemical, and materials engineering disci-plines are comprised of only one program each (at NCSU). Therefore, thecritical mass in these disciplines is relatively low.
One alternative way of generating evidence of disciplinary strengthsin the state is to look at North Carolina’s share of the total national re-search funding generated by all North Carolina academic programs, withina discipline, and compare that to North Carolina’s share of total nationalresearch funding in all disciplines.15 Those data generally confirm thatthe biological and medical sciences are currently the most competitive dis-ciplines in North Carolina at the national level.16
Strongest Disciplines - Formula 1 Score Strongest Disciplines - Formula 2 Score Most Dynamic Disciplines Score
Pharmacology 45.0 Electrical Engineering (3) 9.5 Electrical Engineering (3) 9.0 Cell & Development Biology 35.8 Cell & Development Biology (1) 9.0 Chemical Engineering (1) 8.8 Biochemistry & Molecular Biology 35.3 Biochemistry & Molecular Biology (3) 9.0 Materials Engineering (1) 8.8 Physiology 31.2 Pharmacology (1) 9.0 Molecular & Genetic Sciences (3) 8.6 Molecular & Genetic Sciences 28.5 Materials Sciences (2) 8.9 Neurosciences (2) 8.5 Ecology, Evolution & Behavior 28.0 Chemical Engineering (2) 8.8 Pharmacology (1) 8.4 Chemistry 26.8 Physiology (2) 8.8 Physics (1) 8.3 Neurosciences 25.7 Molecular & Genetic Sciences (3) 8.8 Civil Engineering (1) 8.3 Statistics/Biostatistics 24.0 Neurosciences (1) 8.7 Mechanical Engineering (1) 8.2 Physics 21.5 Biomedical Engineering (1) 8.5 Statistics/Biostatistics (2) 8.2 Computer Science 21.2 Chemistry (1) 8.5 Chemistry (2) 8.1 Mathematics 21.2 Computer Science (2) 8.0 Cell & Development Biology (1) 8.0 Civil Engineering 20.7 Ecology, Evolution & Behavior (2) 8.0 Mathematics (2) 8.0 Biomedical Engineering 19.3 Statistics/Biostatistics (2) 8.0 Industrial Engineering (4) 7.9 Oceanography 16.9 Mechanical Engineering (2) 7.8 Biochemistry & Molecular Biology (2) 7.9 Electrical Engineering 15.7 Physics (4) 7.7 Physiology (2) 7.5 Mechanical Engineering 15.5 Civil Engineering (2) 7.6 Computer Science (1) 7.0 Geosciences 13.9 Mathematics (2) 7.4 Materials Sciences 13.9 Geosciences (3) 7.0 Chemical Engineering 13.4 Industrial Engineering 6.8 Aerospace Engineering 4.2
Formula 1 is based on aggregate scores with all programs included. Formula 2 is the average score for programs scoring 7.0 or higher. Numbers in parentheses are numbers of programs included in calculations. See text and Technical Appendix for additional detail. Sources: National Science Foundation, CASPAR database; National Research Council, Research-Doctorate Programs in the United States ; authors' calculations.
TABLE 13: North Carolina's Strongest and Most Dynamic Disciplines

At the Crossroads: North Carolina’s Place in the Knowledge Economy 23
The Industry-UniversityConnection in North Carolina
We should expect some correlation between the strength of univer-sity-based research and the state’s industrial base. On the one hand,
economists have demonstrated that footloose knowledge-based industriestend to seek locations close to appropriate knowledge resources. SiliconValley developed as a site of high tech research, in part, because of theproximity to Stanford University. Similarly, surveys indicate that firmshave located in the Research Triangle region to be close to labs, expertise,and a well-trained professional labor force from the area’s universities.
The causality between industry base and university strength goes inthe other direction too, however. Existing industries often contribute equip-ment, research funds, unrestricted resources, and professional expertise
to local universities. In addition, footloose academicresearchers specializing in a technology area like tobe located near the pertinent industry cluster. It isnot surprising, then, that UNC-CH, Duke, and NCSUhave grown in national stature in science and tech-nology areas during the past several decades, whilethe industry base in the Triangle was deepening.
The correlation between university and indus-try strength can be seen by comparing informationcontained in different parts of this report. The stron-gest disciplines, by any of the scoring methods used,can be arranged into broad research clusters. Thefollowing four research areas stand out as current oremerging disciplinary strengths in North Carolina.The groupings are not meant to be exact; some re-lated disciplines are omitted and there is some double
counting. They are intended primarily to provoke critical thinking aboutthe condition and potential of North Carolina’s R&D enterprise.
Not surprisingly, there are industry clusters in these same three ar-eas. Table 14 illustrates the concentration of industries in the areas of aca-demic strength, considering the three ways industrial strength was mea-sured. Other research strengths in the state may be added to this frame-work, including the strong presence of environmental research and con-sulting firms (including the Environmental Protection Agency) as well ascontract research organizations and the National Institute of EnvironmentalHealth Sciences.
Another indicator of the dynamic link between industries and univer-sities is the incidence of spin-offs from universities (of course, there are alsospin-offs from other businesses). Our research identified a total of 32 high-technology spin-offs from North Carolina universities between 1972 and 1997(Table 15). Sixteen of those taken place since 1991, implying a considerableincrease in spin-off activity in recent years, though trend is difficult to assesssince older spin-offs are more difficult to identify. Unsurprisingly, the state’sthree largest research universities, UNC-CH, Duke, and NCSU, generatedalmost all the spin-offs, and most were located in the Research Triangle area.
CLUSTER 1: Electronics and related (electrical engineering, ma-terials science, computer sciences).
CLUSTER 2: Life sciences and related (cell and developmentbiology, biochemistry and molecular biology, pharmacology,physiology, molecular and genetic sciences, neurosciences,chemistry, biomedical engineering).
CLUSTER 3: Other chemicals (chemistry and chemical engi-neering).
CLUSTER 4: Environmental (geosciences, oceanography, andecology/evolution and behavior). ■
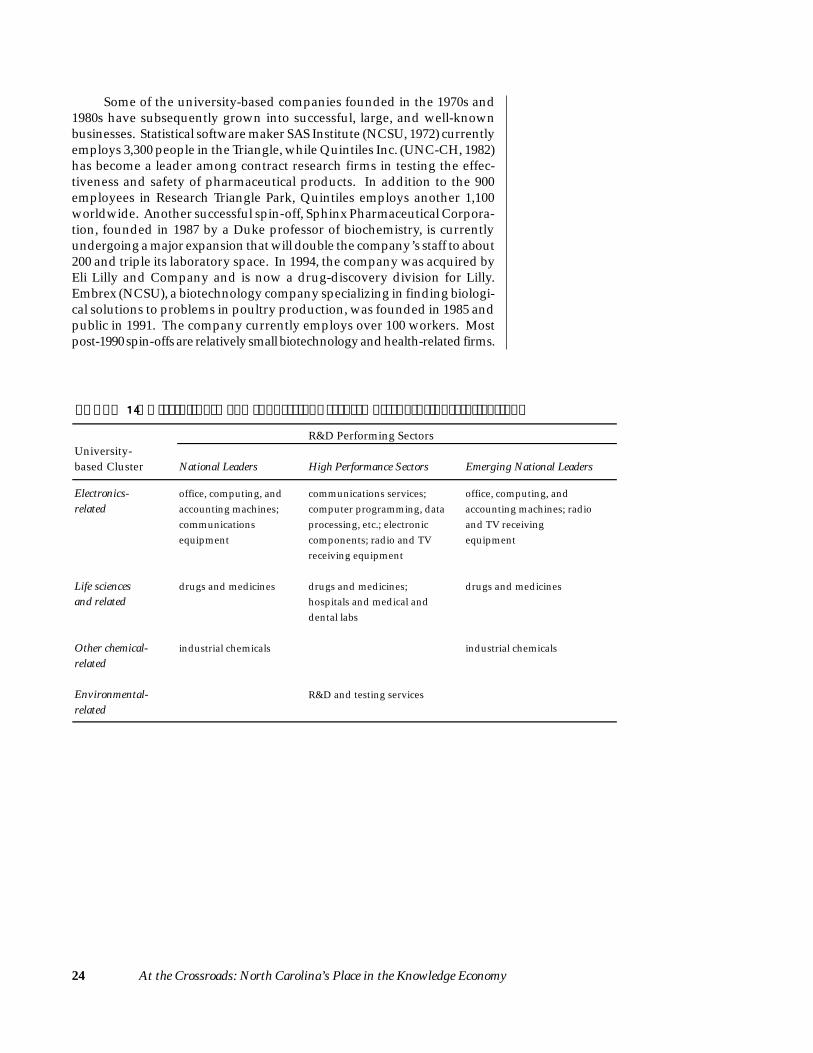
24 At the Crossroads: North Carolina’s Place in the Knowledge Economy
Some of the university-based companies founded in the 1970s and1980s have subsequently grown into successful, large, and well-knownbusinesses. Statistical software maker SAS Institute (NCSU, 1972) currentlyemploys 3,300 people in the Triangle, while Quintiles Inc. (UNC-CH, 1982)has become a leader among contract research firms in testing the effec-tiveness and safety of pharmaceutical products. In addition to the 900employees in Research Triangle Park, Quintiles employs another 1,100worldwide. Another successful spin-off, Sphinx Pharmaceutical Corpora-tion, founded in 1987 by a Duke professor of biochemistry, is currentlyundergoing a major expansion that will double the company’s staff to about200 and triple its laboratory space. In 1994, the company was acquired byEli Lilly and Company and is now a drug-discovery division for Lilly.Embrex (NCSU), a biotechnology company specializing in finding biologi-cal solutions to problems in poultry production, was founded in 1985 andpublic in 1991. The company currently employs over 100 workers. Mostpost-1990 spin-offs are relatively small biotechnology and health-related firms.
TABLE 14: Disciplinary and Industrial Research Strengths/Specializations
R&D Performing SectorsUniversity-based Cluster National Leaders High Performance Sectors Emerging National Leaders
Electronics- office, computing, and communications services; office, computing, andrelated accounting machines; computer programming, data accounting machines; radio
communications processing, etc.; electronic and TV receivingequipment components; radio and TV equipment
receiving equipment
Life sciences drugs and medicines drugs and medicines; drugs and medicinesand related hospitals and medical and
dental labs
Other chemical- industrial chemicals industrial chemicalsrelated
Environmental- R&D and testing servicesrelated

At the Crossroads: North Carolina’s Place in the Knowledge Economy 25
TABLE 15: High-Technology Spin-Offs from North Carolina Universities, 1972-1997
Year Originating CurrentCompany Product Founded University Status Employees
Wedd Food Labs 1972 NCSU Out of Business n.a.SAS Institute Software 1972 NCSU In Production 3,300Family Health International Pharmaceuticals 1973 UNC-CH 150Mycosearch Biotechnology 1979 UNC-CH 10Quintiles (Quintiles Transnational) Contract Research 1982 UNC-CH In Production 2,000Enzyme Technology Research (now AndCare) Medical Technology 1985 Duke In Production 11Piedmont Research 1985 Duke Out of Business n.a.Embrex Biotechnology 1985 NCSU In Production 104Boron Biologics Biotechnology 1986 Duke In Production 8Biosponge Aquaculture Products Biotechnology 1986 Duke Out of Business Since 1991 n.a.Sphinx Pharmaceutical Pharmaceuticals 1987 Duke In Production 96Cree Research Semiconductors 1987 NCSU In Production 100Probiologics Biotechnology 1987 NCSU Out of Business Since 1989 n.a.Gentra Systems 1988 NCSU Out of Business Since 1997 n.a.Pathogene Biologics Biotechnology 1989 NCSU Out of Business Since 1991 n.a.Macronex Biotechnology 1990 Duke Out of Business Since 1996 n.a.Leadcare (now AndCare) Medical Technology 1991 Duke In Production 93D Ultrasound Medical Diagnostic 1991 Duke In Production 19Trimeris Biotechnology 1993 Duke In Production 37LipoMed Medical 1994 NCSU In Production 9EpiGenesis Pharmaceuticals 1995 ECU Not Yet in Production 5Aeolus Pharmaceuticals 1995 Duke 20ClinEffect Systems Medical Software 1995 Duke In Production 10Inspire Pharmaceuticals Pharmaceuticals 1995 UNC-CH Not Yet in Production 19Triangle Pharmaceuticals Pharmaceuticals 1995 Duke 53Novalon Pharmaceutical Pharmaceuticals 1996 UNC-CH 18Xanthon Biotechnology 1996 UNC-CH Not Yet in Production 8MiCell Technologies Chemicals 1996 UNC-CH Not Yet in Production 8Zymotech Biotechnology 1996 NCSU In Production 2Renaissance Cell Technologies Pharmaceuticals 1996 UNC-CH 53 Tex Textiles 1996 NCSU Not Yet in Production 1Telemedicine Technolgies Telecommunications 1997 ECU Not Yet in Production 3
Source: "The Incidence of High-Technology Start-Ups and Spin-Offs in a Technology-Oriented Branch Plant Complex," by S. Ko, Ph.D. dissertation, University of North Carolina at Chapel Hill, 1993; and authors' estimates. List may not be comprehensive. n.a.=not applicable. Piedmont Research and Wedd Food Labs are presumed out of business (not confirmed).

26 At the Crossroads: North Carolina’s Place in the Knowledge Economy
Federal R&D Spendingand North Carolina
The federal government is an important source of R&D funding for in-dustry, universities, and non-profit institutes. Which R&D perform-
ers in the state depend on federal sources of funds? What is the impact offederal spending, in the aggregate, on the state’s economy? Most impor-tant, how would potential changes in federal spending affect NorthCarolina’s R&D effort and economic growth, given the state’s unique setof industry and university strengths? To answer these questions, we ex-amined the distribution of federal spending in the state by performer, de-veloped seven possible scenarios for future patterns of federal spending,traced the impact of those patterns on R&D activity in the state, and usedan input-output multiplier model to trace the effect of changing R&D oneconomic growth. The results paint anoptimistic picture of the state’s positionvis-a-vis future federal R&D spending.At the same time, each dollar of federalR&D money has a smaller impact onNorth Carolina’s economy than it other-wise might if the economy were moreknowledge-intensive.
Trends in Federally-Supported R&D in North
Carolina
In 1995, North Carolina scientists gar-nered $825.4 million in federal R&D
obligations, up from $485.7 million in1985 and $116.9 million in 1975.18 Whilethe state’s share of the total federal R&Dbudget doubled from 0.6 to 1.2 percentbetween 1975 and 1995, it remains wellbelow its share of U.S. gross domesticproduct (Figure 3). Moreover, the ratiosare not converging; North Carolina’sshare of GDP grew from 2.5 to 2.7 overthe five year period between 1988 and1994 while its share of the federal R&Dbudget remained essentially unchanged.The state’s allocation of the federal R&Dbudget is therefore well below whatmight be expected given the size of itseconomy. While that is another indica-tion of the lower technology-intensive-ness of North Carolina industry, it mayalso suggest that industry R&D per-
While industry is now providing the largest share of the nation’s total re-search and development budget (both internally and through support touniversities and research institutes), the centrality of the federal govern-ment to the country’s R&D effort cannot be over-emphasized. The U.S.Government’s response to national challenges following World War II (e.g.,developments in space exploration, atomic weaponry, and energy) built anational science and technology complex that is the envy of the world.17
Federal initiatives continue to contribute mightily to the direction of scienceand technology trends in universities and the private sector. The federalgovernment is the most important underwriter of basic research in academia,much of which would not be supported by businesses. Industry is natu-rally interested primarily in technologies that contribute to the developmentof goods and services in the near term. The federal government is also ableto support research—in academia and industry—that is a clearly in the na-tional interest even though its commercial potential is either minimal oruncertain enough to preclude private sector leadership. Such research, inturn, contributes to the base of scientific knowledge and may end up lead-ing to the creation of critical new technologies and products, the profitabil-ity and significance of which are not easily foreseeable.
In North Carolina, strong federal support of university R&D and active fed-eral laboratories such as the Environmental Protection Agency and the Na-tional Institute of Environmental Health Sciences, undergird the state’s sci-ence and technology enterprise, strengthening mutually-reinforcing ties be-tween public, non-profit, and private sector R&D performers. Through fed-eral R&D support, universities are able not only to make new scientific andtechnological discoveries, but also to provide critical research experience togenerations of students that eventually assume positions in the state’s fed-eral labs, R&D-performing businesses, and non-profit research houses. De-mand for skilled and creative R&D personnel feeds supply and vice versa asthe North Carolina R&D infrastructure evolves and grows. Knowledgespillovers–informal exchanges of information, expertise, and ideas betweenindustry, academic, and public sector actors–contribute further strength tothe state’s R&D enterprise. Federal government support is central to thesedynamics. ■
The Federal Government Role in R&D.

At the Crossroads: North Carolina’s Place in the Knowledge Economy 27
formers are less successful in attracting federal R&D dollars. (In contrastto industry, non-profit and academic performers in the state have garneredabove average shares of federal R&D funds.)19
Over 53 percent of total federal R&D dollars spent in North Carolinain 1995 went to universities, colleges and teaching hospitals (Table 16).Another 27 percent were earmarked for federal labs. Industry’s share ofthe state’s federal R&D dollars is both low and declining. Between 1992and 1995, universities, federal labs, and non-profits increased their shareof federal dollars while industry’s declined by nearly one-half. A majority(53 percent) of the state’s federal R&D funds in 1995 were provided by theDepartment of Health and Human Services (HHS), followed by Defense(17 percent), the Environmental Protection Agency (EPA; 14 percent), andthe National Science Foundation (NSF; 6 percent). Yet that distribution offunds differs widely across the different types of performers (industry,federal, universities, non-profits). In 1995, industry received the bulk ofits support from Defense, while the vast majority of federal funds to uni-versities and other non-profits were granted by HHS. Federal labs in NorthCarolina were fairly evenly split between EPA, Defense, and HHS (Figure 4).
0.5%
1.0%
1.5%
2.0%
2.5%
3.0%
1977 1978 1979 1980 1981 1982 1983 1984 1985 1986 1987 1988 1989 1990 1991 1992 1993 1994
Share of GDP
Share of Federal R&D Obligations
Source: NSF, BEA
FIGURE 3: North Carolina’s Share of Federal R&D versus its Share of GDP
TABLE 16: Federal R&D Spending in North CarolinaBy Agency and Performer, Fiscal Year 1995 (Dollars in Thousands)
Federal Univ & Other Non- State & PercentAgency Intramural Industry Colleges Profits Loc Govt TOTAL Share
Agriculture 16,903 80 15,574 19 10 32,586 3.9 Commerce 5,387 6,796 5,680 74 478 18,415 2.2 Defense 53,262 48,037 33,218 2,231 0 136,748 16.6 Energy 844 50 11,296 1,314 0 13,504 1.6 HHS 68,595 15,207 310,668 37,036 3,225 434,731 52.7 Interior 3,265 95 285 0 0 3,645 0.4 Transportation 0 1,654 2,438 250 2,076 6,418 0.8 EPA 71,885 24,401 8,169 11,752 0 116,207 14.1 NASA 16 877 7,484 3,361 0 11,738 1.4 NSF 22 2,716 45,653 2,965 85 51,441 6.2
TOTAL 220,179 99,913 440,465 59,002 5,874 825,433 Percent Share 26.7 12.1 53.4 7.1 0.7
Source: National Science Foundation, Federal Funds Survey, Early Release Tables . Only ten major R&D funding agencies included; does not include R&D plant.

28 At the Crossroads: North Carolina’s Place in the Knowledge Economy
The particular mix of federal funding by agency is an importantmeans of gauging the possible impact of changing federal R&D trendsand priorities on the state’s economy. The budget agreement betweencongress and the president signed in mid-1997 calls for the protection ofenvironmental and health-related research efforts. Other areas, however,are slated for decline, with defense research the most significant of these.Between 1992 and 1995, the agencies with the largest real dollar increasesin obligations to North Carolina performers were HHS, EPA, NSF, andCommerce (Table 17). By contrast, defense obligations in the state—whichare granted primarily to industry—fell considerably, consistent with na-tional R&D priorities. Over this period at the national level, NSF, NASA,EPA, and the Department of Transportation (DOT), Commerce, and HHSall increased their shares of the total federal R&D budget, while the sharesof the Departments of Interior, Energy, Defense, and Agriculture (USDA)all declined. With the bulk of North Carolina’s federal R&D funding com-ing from NSF, EPA, and HHS, the state is well positioned given these trends.Overall, federal R&D support in North Carolina increased by 11.5 percentin real terms between 1992 and 1995, compared with a real decline of 3.9percent in the U.S. as a whole.
The largest individual performers of federal R&D in the state areUNC-Chapel Hill, Duke University, private industry, EPA, HHS (prima-rily the National Institute of Environmental Health Sciences—NIEHS), NCState University, the Department of Defense, Wake Forest University, andResearch Triangle Institute.20 Some of those performers are likely to fare
FIGURE 4: Federal Obligations for R&D in North CarolinaBy Agency and Type of Performer, Fiscal Year 1995
Source: National Science Foundation, Federal Funds Survey, Early Release Tables.
Industry Performers
Defense (49%)
EPA (24%)
HHS (15%)
Comm
erce (7%)
Others (5%)
Federal Intramural PerformersDefense (24%
)
HHS (31%)
EPA (33%)
Agriculture (8%)
Others (4%)
University & College Performers
HHS (70%)
NSF (10%)
Defense (8%)
Agriculture (4%)
Energy (3%)
Others (5%)
Other Non-Profit Performers
HHS (62%)
EPA (20%)
NASA (6%)
NSF (5%)
Defense (4%)
Others (3%)
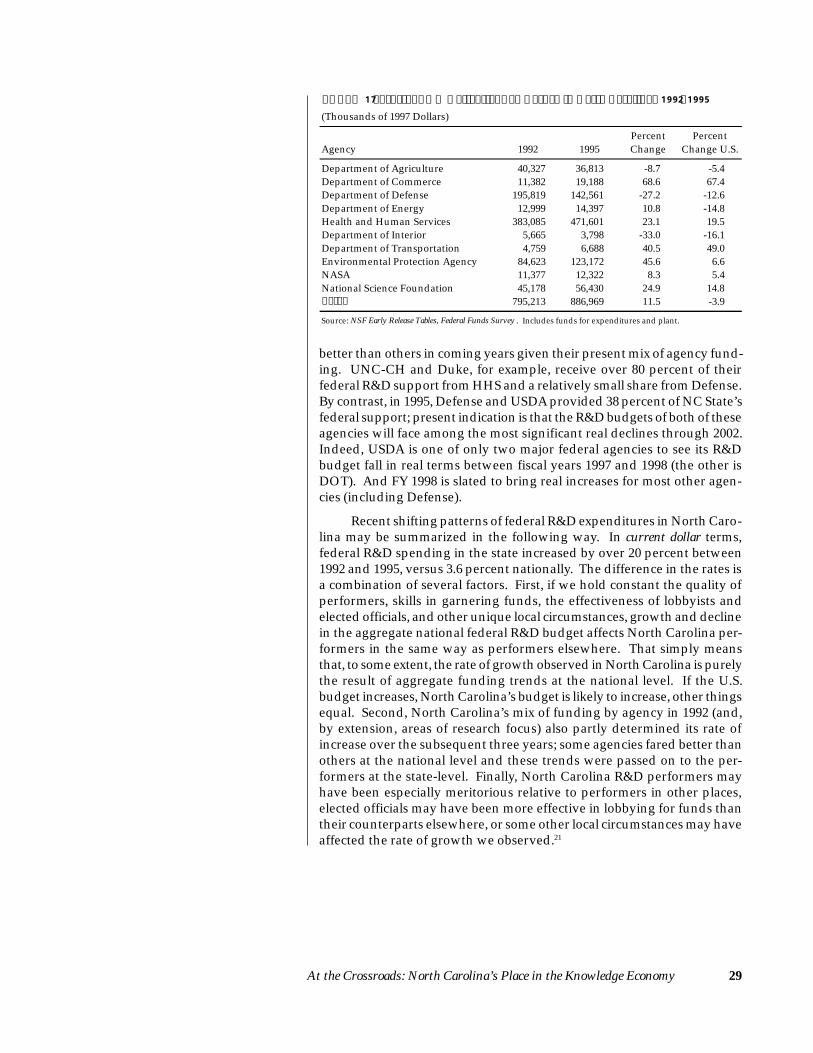
At the Crossroads: North Carolina’s Place in the Knowledge Economy 29
better than others in coming years given their present mix of agency fund-ing. UNC-CH and Duke, for example, receive over 80 percent of theirfederal R&D support from HHS and a relatively small share from Defense.By contrast, in 1995, Defense and USDA provided 38 percent of NC State’sfederal support; present indication is that the R&D budgets of both of theseagencies will face among the most significant real declines through 2002.Indeed, USDA is one of only two major federal agencies to see its R&Dbudget fall in real terms between fiscal years 1997 and 1998 (the other isDOT). And FY 1998 is slated to bring real increases for most other agen-cies (including Defense).
Recent shifting patterns of federal R&D expenditures in North Caro-lina may be summarized in the following way. In current dollar terms,federal R&D spending in the state increased by over 20 percent between1992 and 1995, versus 3.6 percent nationally. The difference in the rates isa combination of several factors. First, if we hold constant the quality ofperformers, skills in garnering funds, the effectiveness of lobbyists andelected officials, and other unique local circumstances, growth and declinein the aggregate national federal R&D budget affects North Carolina per-formers in the same way as performers elsewhere. That simply meansthat, to some extent, the rate of growth observed in North Carolina is purelythe result of aggregate funding trends at the national level. If the U.S.budget increases, North Carolina’s budget is likely to increase, other thingsequal. Second, North Carolina’s mix of funding by agency in 1992 (and,by extension, areas of research focus) also partly determined its rate ofincrease over the subsequent three years; some agencies fared better thanothers at the national level and these trends were passed on to the per-formers at the state-level. Finally, North Carolina R&D performers mayhave been especially meritorious relative to performers in other places,elected officials may have been more effective in lobbying for funds thantheir counterparts elsewhere, or some other local circumstances may haveaffected the rate of growth we observed.21
TABLE 17: Federal R&D Obligations by Agency in North Carolina, 1992-1995(Thousands of 1997 Dollars)
Percent PercentAgency 1992 1995 Change Change U.S.
Department of Agriculture 40,327 36,813 -8.7 -5.4 Department of Commerce 11,382 19,188 68.6 67.4 Department of Defense 195,819 142,561 -27.2 -12.6 Department of Energy 12,999 14,397 10.8 -14.8 Health and Human Services 383,085 471,601 23.1 19.5 Department of Interior 5,665 3,798 -33.0 -16.1 Department of Transportation 4,759 6,688 40.5 49.0 Environmental Protection Agency 84,623 123,172 45.6 6.6 NASA 11,377 12,322 8.3 5.4 National Science Foundation 45,178 56,430 24.9 14.8 Total 795,213 886,969 11.5 -3.9
Source: NSF Early Release Tables, Federal Funds Survey . Includes funds for expenditures and plant.

30 At the Crossroads: North Carolina’s Place in the Knowledge Economy
Projected Federal R&D Spending in North Carolina
We constructed several scenarios based on different assumptions aboutthe growth or decline of federal R&D spending, and the state’s abil-
ity to capture a growing share of the pie. Our most optimistic scenario issimply an extrapolation of the current trend. We then specify three alter-natives—one in which the federal government keeps R&D spending con-stant in real dollars, another in which R&D spending is constant in nomi-nal dollars, and a third in which R&D is cut to achieve a balanced budgetby 2001. In each of those cases, we assume, in turn, that the state main-tains its share of R&D dollars and is able to increase its share, due to afavorable mix of industries.
The scenarios are summarized in Figure 5. They are referred to ascurrent trend, constant dollar-constant share, constant dollar-growingshare, current dollar-constant share, current dollar-growing share, balancedbudget-constant share, and balanced budget-growing share. Estimatedexpenditures in 1995 are $664.4 million in 1994 dollars. In four of the sevenscenarios, we project real federal R&D expenditures to increase in NorthCarolina between 1995 and 2002. In the case of balanced budget-growingshare, for example, the favorable research mix (in health and the environ-ment) in North Carolina outweighs the expected decline in the state due
1995 1996 1997 1998 1999 2000 2001 2002
300,000
400,000
500,000
600,000
700,000
800,000
900,000
1,000,000
1,100,000
Current Dollar-CS
Balanced Budget-CS
Constant Dollar-CS
Current Dollar-GS
Balanced Budget-GS
Constant Dollar-GS
Current Trend
Constant Dollar-GS
Balanced Budget-GS
Current Dollar-GSConstant Dollar-CS
Balanced Budget-CS
Current Dollar-CS
FIGURE 5: Projected Federal R&D Expenditures in North Carolina 1995-2002 (1994 Dollars)
Source: Authors' estimates.
1995 Expenditures $664.4 Million
2002 ExpendituresCurrent Trend: Constant Dollar-GS: Balanced Budget-GS:Current Dollar-GS:Constant Dollar-CS:Balanced Budget-CS:Current Dollar-CS:
(Millions)1,037.2
742.2 697.9672.4664.4639.6563.3
Current Trend
CS: Constant ShareGS: Growing Share

At the Crossroads: North Carolina’s Place in the Knowledge Economy 31
Federal research and development money spent inNorth Carolina affects the state in two fundamentalways. First, each dollar generates more than a dollarof economic activity through successive rounds ofspending (termed multiplier or ripple effects). Afterearning a federal research contract, R&D performerssuch as universities, businesses, and non-profits pur-chase goods and services from North Carolina ven-dors and hire personnel to carry out the work. Thatspending constitutes the direct effect of each dollar offederal money committed to the state. Direct expen-ditures are less than total expenditures because somepurchases are made from vendors located out of state(that out-of-state spending constitutes leakage of fed-eral R&D spending). In-state vendors themselvespurchase goods and services from other North Caro-lina vendors, who, in turn, also purchase goods andservices, and so on. The result of all successive roundsof purchases for goods and services are termed indi-rect effects. Finally, the workers and families of the R&Dperformers and vendors make purchases with incomepaid (directly or indirectly) from the federal funds.Those also generate multiplier effects (termed inducedeffects). The sum of total direct, indirect, and inducedeffects exceeds the initial amount that R&D perform-ers expend within the state. The ratio of this sum tothe direct expenditures constitutes the multiplier, thedollar value increase in activity generated with eachdollar of federal expenditure.
The second fundamental way in which federal re-search and development money affects the state ismore difficult to quantify. Federal R&D money gen-erates spillovers, which are essentially new technolo-gies, knowledge, and information that is exploited bythe private sector to develop new products or pro-cesses.22 A recent study of federal spending in Mas-sachusetts identified two means by which a reduc-tion in spillovers adversely affects the economy.23 First,as noted above, federal R&D generates much basic
research that the private sector relies upon in conduct-ing its own basic and applied research and develop-ment. Reductions in federal R&D spending harmpublic sector agencies and universities the most, re-ducing basic research that these institutions performand subsequently R&D undertaken by industry. Thesize of that effect may potentially be large, since in-dustry is the largest overall R&D performer in theeconomy.24
Second, reductions in R&D both directly through fed-eral R&D reductions as well as indirectly through in-duced reductions in industry R&D result in fewer newproducts, services, and technologies, eventually re-ducing economic growth and possibly damaging thelong-term competitiveness of local businesses. Thereis growing hard evidence that for-profit firms relyheavily on basic science to develop new goods andservices. One recent study has found, for example,that U.S.-invented patents typically include many ci-tations to basic scientific papers, most of which areauthored by scientists at universities and laboratoriessupported by major agencies such as the National Sci-ence Foundation and the National Institutes ofHealth.25 In fact, the study found that “more than 70percent of the scientific papers cited on the front pagesof U.S. industry patents came from public science—science performed at universities, government labs,and other public agencies.”26 Reductions in federalR&D, then, may act to: reduce R&D directly in the statevia immediate reductions in financial support to pub-lic, private and non-profit R&D performers; reduceR&D indirectly in the state via subsequent additionalreductions in private sector R&D induced by the initialdirect decline in R&D; and reduce the development andintroduction of new goods and services that sustaingrowth and maintain competitiveness. Note that weonly quantify the first type of effect, though we notethe possible significance of the others.27 ■
Gauging the Impact of Federal Spending
to the anticipated fall in real spending at the national level. Put anotherway, even though the total R&D budget may fall at the national level, fed-eral R&D in North Carolina may increase because of the state’s emphasisin the two protected research areas: environment and health. That is notto say that federal R&D spending in the state would not have grown evenfaster in the absence of balanced budget pressures. The current trend pro-vides one possible scenario along those lines. It also indicates how dra-matic the recent trends in federal spending in the state have been, at leastbetween 1992 and 1995. It is most reasonable to view the current trend asthe extreme upper bound in the range of possible federal spending sce-

32 At the Crossroads: North Carolina’s Place in the Knowledge Economy
narios. The extreme lower bound is represented by the current dollar-constant share projection.
Given the current health of the economy, and the nature of thepresident’s FY 1999 budget proposal which would balance the budgetsooner than we forecast, we believe that the actual trend is likely to liesomewhere between balanced budget-growing share and the currenttrend. In general, North Carolina’s outlook is optimistic even in the faceof federal cutbacks in discretionary spending aimed at balancing the bud-get. Of course, the outcome will not be as favorable for North Carolina ifcongress and the president renege on their commitment to protect envi-ronmental and health-related research. In addition, wide swings in fed-eral R&D support are unlikely because of the mix of spending in the state.The health and environmental R&D budgets have been relatively stableover time, particularly in comparison to smaller agencies and the Depart-ment of Defense.
The Impact of Federal R&D Dollars
Our analysis indicates that each dollar of federal R&D moneynow spent in North Carolina generates approximately 75 cents of
additional economic activity (Table 18). Of the total $664.4 million in fed-eral R&D expenditures in North Carolina in 1995, $328.3 million (or 49.4percent) represents direct in-state spending either as purchases of goodsand services from North Carolina vendors by R&D performers or as ex-penditures by R&D employees made within the state. The $328.3 millionin direct expenditures generated an additional $249.5 million in indirectand induced spending, for a total impact of $577.8 million. The ratio ofdirect in-state spending to total impacts is the aggregate multiplier. FY1995 federal spending accounted for $216.2 million in income, nearly 9,000jobs, and $340.7 million in value added (or gross state product).28
The expenditure impacts represent about 0.18 percent of total stateoutput, 0.16 percent of income, 0.21 percent of employment, and 0.19 per-cent value-added. Those figures demonstrate the limited nature of multi-plier effects associated with federal R&D and serve to emphasize that themost important influence of federal spending in the state is probably re-lated to indirect spillover effects. Put differently, if federal R&D spendingfell to zero tomorrow, the immediate impact on the state in terms of re-duced jobs, income, and gross state product would be slight. In time, how-ever, the absence of federal funds would almost certainly severely limitthe R&D capacity of the state’s economy and thereby eventually limit ad-ditional growth and development.
We can also examine how the several R&D spending projectionstranslate into different impacts on the state’s economy by calculating theratio of the 1995 total output impact to the 2002 total output impact foreach scenario (Figure 6). The output impact of federal spending in 2002 is56 percent higher (in real terms) than in 1995 under the rosiest scenario (a‘gain’ of 5,022 jobs). By contrast, the total expenditure impact of federalspending under the worst case scenario would fall by 15 percent in 2002 (a‘loss’ of 1,300 jobs). and 7,588 jobs, a real decrease of 15 percent. As notedabove, however, we believe that the former is more likely than the latter.29
To conduct the impact analysis, we con-structed estimates of two types of ex-penditures by all R&D performers inthe state: detailed purchases of com-modities per R&D dollar (e.g., comput-ers, instruments, measuring devices,chemicals, rental cars, hotels and othertravel expenses, etc.); and expendituresfor personnel. These data were thenincorporated in an input-output model(IMPLAN Pro) to calculate the totaleconomic impacts of alternative levelsof federal R&D spending. See At theCrossroads: Technical Appendix for addi-tional detail. ■

At the Crossroads: North Carolina’s Place in the Knowledge Economy 33
TABLE 18: Summary of Results of Impact EstimationFiscal Year 1995 (Output, Income and Value-Added in Millions, 1994 Dollars)
Estimated Federal R&D Expenditures in North Carolina 664.4
Direct In-State Expenditures 328.3
Indirect Expenditures 99.5Induced Expenditures 150.0
Total Expenditures 577.8
Aggregate Output Multiplier 1.76
Total Income Impact 216.2Total Employment Impact 8,950
Total Value-Added Impact 340.7
Relative Impact
Share of 1994 Total NC Output 0.18% Share of 1994 Total NC Income 0.16%
Share of 1994 Total NC Employment 0.21% Share of 1994 Total NC Value-Added 0.19%
Note: Aggregate multiplier assuming 25 percent higher local purchases is 1.77.
Source: Authors' estimates; IMPLAN.
-20% -10% 0% 10% 20% 30% 40% 50% 60%
Current Trend
Constant Dollar-Growing Share
Balanced Budget-Growing Share
Current Dollar-Growing Share
Constant Dollar-Constant Share
Balanced Budget-Constant Share
Current Dollar-Constant Share
FIGURE 6: Total Relative Output Impact from Alternative ProjectedChanges in Federal In-State R&D Expenditures, 1995-2002(2002 Output Impact over 1995 Output Impact, Constant Dollars)
-15.2%
-3.7%
0.0%
1.2%
5.0%
11.7%
56.1%
Source: Authors' estimates; IMPLAN.

34 At the Crossroads: North Carolina’s Place in the Knowledge Economy
Goods IdeasKnowledge
Employment Income Spin-offs Wealth
Localplants
Regionalheadquarters
Developing new products, processes
Adapting goods forregional market
Production,assembly
National,internationalheadquaters
ECONOMIC DEVELOPMENT
Road, rail,post, phones
INFRASTRUCTUREAir transport,
telecommunications
Universities,research institutes,
advanced networking
Engineers,scientists,
entrepreneursManagerial,
administrative,technical workers
Low and semi-skilled workers
W O R K E R S
Exportpromotion
Knowledgecreation
Importsubstitution
Figure 7: The Evolution of Knowledge along Economic Development Continuum
Implications and Guides to Policy
The report raises some old and difficult questions for policy makers:what can be done to ensure a smooth transition from a traditional
manufacturing to a knowledge-based economy? And, how can we helpexpand knowledge resources more broadly in geographic terms, so thatR&D can occur in non-metropolitan counties with small and medium sizedmanufacturing establishments? Accomplishing those two tasks will helpprevent chronic displaced worker problems, and will help increase incomesin the state.
Our analysis of the impact of possible changes in federal R&D spend-ing suggests that the state is well poised to capitalize on projected shifts infederal research priorities towardhealth and the environment. Thatis particularly encouraging sincethe current budget picture suggestsa growth in federal R&D spendingin North Carolina even with a bal-anced budget. However, federalR&D dollars that come into NorthCarolina do not have as large aripple effect as they could becauseof the state’s relatively modest con-centration of high technology in-dustry. Much R&D-related spend-ing leaks out of the state (as NorthCarolina R&D performers pur-chase inputs and services from hightechnology firms located elsewherein the U.S.). As the knowledge in-tensiveness of the economy grows,a greater share of such spendingwill remain inside the state’s bor-ders.
The challenge facing decisionmakers may be cast in terms of thetrajectory on along which econo-mies move as they develop (see Fig-ure 7).30 Less developed economies(or regions) produce goods, prima-rily to ensure that local needs aremet (import substitution). Themeasure of their success is employ-ment growth. Those economiesrequire a healthy number of lowand semi-skilled workers as well asroads, rail lines, postal service, andtelephones. At the next stage of de-velopment, economies produce forexport and to generate income forthe region. They may develop re-

At the Crossroads: North Carolina’s Place in the Knowledge Economy 35
gional headquarters. They require technical, managerial, and administra-tive workers, and more rapid communications. The most mature econo-mies produce knowledge and generate wealth. As loci of control, theydevelop into national or international headquarters locations. Their per-sonnel needs are skewed toward knowledge workers while their infra-structure needs are tilted toward knowledge resources.
We can consider North Carolina to be moving up this trajectory. Table19 translates the trajectory into specific business requirements. In the earlystages of development (the lower part of the trajectory), businesses needworker and managerial training, technical assistance, and help establish-ing buyer-supplier networks. As the businesses become more mature, theirneeds change. Those at the top of the trajectory require specialized equip-ment, a good work environment, and connections with knowledge re-sources around the world. This table also shows an intermediate point alongthe trajectory where businesses commercialize either applied or basic research.For that, licensing and patenting assistance is needed, as well as incubatorspace, marketing assistance, entrepreneurial training, and financing.
The state can help move the economy up the trajectory by providingthe appropriate services. Indeed, many of the state’s efforts over the pasttwo decades fit into this matrix. The development of MCNC and the Bio-technology Center, for example, are consistent with later-stage develop-ment. The development of the information superhighway similarly al-lows businesses to connect with knowledge resources around the world.
Table 19: Appropriate Services Along Economic Development Continuum
Improving production techniques and inputs
Conducting applied research
Commercializing outputs of basic and
applied research
Conducting basic research
• Provide worker training • Provide technical training
• Provide licensing and patenting assistance
• Provide/operate specialized equipment and facilities
• Provide managerial training
• Provide/operate testing and calibration equipment
• Provide incubator space • Provide a good work environment
• Offer technical assistance to help solve problems
• Help organizations link to local universities/ institutes
• Help organizations obtain financing for start-up or expansion
• Help organizations connect to appropriate knowledge resources around the world
• Build/operate a pilot plant
• Provide crunch space • Provide marketing assistance
• Help establish buyer-supplier networks
• Provide entrepreneurial training
Lower level of economic development
Higher level of economic development

36 At the Crossroads: North Carolina’s Place in the Knowledge Economy
In terms of assistance for commercializing the results of applied andbasic research, the state already provides some of the needed servicesthrough the university system. In addition, the Technology DevelopmentAuthority identifies targets for start-up capital. But the relevant questionis what more can be done? The report provides a few principles:
■■■■■ Put resources where there is likely to be a payoff because ofexisting critical mass.
The report identifies where industrial and university strengths coin-cide. Efforts are already underway in some of those sectors (the Bio-technology Center with pharmaceuticals; MCNC with telecommu-nications and electronics). Further efforts could be made toward otherclusters, e.g., industrial chemicals and environmental technologies.
■■■■■ Identify industries that are likely to be winners.
The limitation of any type of industrial policy is in being able to pickwinners and avoid losers. Indeed, the market does that reasonablywell. But, to pull the economy up the trajectory, the state needs to beproactive. Our analysis has identified some good business develop-ment targets. For example, twenty-five industries are technology-intensive and growing in terms of jobs and wages.
■■■■■ Develop home grown businesses that may emerge as head-quarters and/or research centers.
The payoff from successful start-ups and spin-offs is substantial—the creation of quality jobs and income growth at SAS, Sphinx, Emrex,and Quintiles are cases in point. The North Carolina economy is muchriper for entrepreneurial development today than it has ever been.
■■■■■ Invest in knowledge infrastructure.
The old mindset among industrial developers was that roads neededto be built to ensure that jobs would come, especially in non-metro-politan areas. As we move into the 21st century, knowledge infra-structure plays that role. To get growth into regions that need it, weneed to consider the strategic use of telecommunication links, busi-ness parks, institutions of higher education (and training), in additionto transportation nodes. The Global TransPark is one model for that.
■■■■■ Invest in people.
As traditional industries continue to downsize and new businessesstart-up and expand, our workforce needs to be upgraded so thatemployees can make the transition. Similarly, entry-level workers(in high school) need to be prepared for work that requires compu-tation and a higher level of skills than in the past. This suggests ahost of school-to-work and displaced worker programs. It also im-plies a rethinking of traditional methods of training and educationdelivery, as well as a better meshing of the needs of industry withthe missions’ of the state’s universities and community colleges.

At the Crossroads: North Carolina’s Place in the Knowledge Economy 37
1. Stough, R., “Introduction,” Annals of Regional Science 32 (1), 1-5, 1998. Seealso Lucas, R. E., “On the Mechanics of Economic Development,” Journal ofMonetary Economics 22 (1), 3-42, 1988.
2. See Technical Appendix Tables 1 and 2.
3. Data are from the National Science Foundation. See Technical AppendixTable 3.
4. The data are from the National Science Foundation (NSF) and should beinterpreted cautiously. Determining the source of industrial R&D dollarsis more difficult than identifying total R&D expenditures. AlthoughNSF’s Survey of Industrial R&D solicits expenditure source informationfrom U.S. businesses, significant under-reporting of some questionnaireitems is common. There is evidence, for example, that responding firmsmay have a tendency to incorrectly identify the source of their R&Dfunds, either as a result of poor internal information or confidentialityconcerns. Moreover, in some states (including North Carolina) the sampleof responding firms is relatively small. The problem is compounded bylower item response rates typical on expenditure source questions.
We compared early release expenditure data from the most recent Surveyof Industrial R&D to federal obligations data from the NSF Federal FundsSurvey (see Technical Appendix Table 4). While the former survey istargeted to businesses, the latter is completed by federal agencies. It maybe a more reliable indicator of the volume of federal funds distributed tothe state’s industries. In fact, the ratio of federal obligations to industry tototal expenditures by industry hovered near 5 percent in North Carolinabetween 1993 and 1995, a figure that is among the lowest in the country.The national average over the period exceeded 24 percent. By all availabledata, there is thus reasonably strong evidence that North Carolinaindustry’s dependence on federal R&D funding is substantially belowaverage.
5. For university R&D spending and science student enrollment data, seeTechnical Appendix Tables 5-8; data are from the National Science Foundation.
6. Technical Appendix Tables 9-19 report detailed Association of UniversityTechnology Managers AUTM Licensing Survey data for patent applications,patent issues, licensing, royalties, invention disclosures, and start-upcompanies data for North Carolina universities and their comparableinstitutions in California, Georgia, Massachusetts, Michigan, Texas, andVirginia.
Notes

38 At the Crossroads: North Carolina’s Place in the Knowledge Economy
7. In 1994, the average wage for the ten most R&D intensive industries inNorth Carolina was 54 percent higher than the wage for the ten least R&Dintensive sectors. In the same period, R&D intensive sectors in the statealso paid higher wages relative to comparable sectors in other states thandid North Carolina’s non-R&D intensive sectors. While the state rankedtenth in overall employment in the U.S. in 1994, it ranked thirtieth inaverage wages. The average wage rank for the ten least R&D intensivesectors in the state in 1994 was 25 (ranging from second in the tobaccoproducts sector to forty-second in the food and kindred products indus-try). By contrast, the average wage rank for the 10 most R&D intensiveindustries was 19 (ranging from sixth in communication equipment tothirtieth in aircraft and missiles). With the continued growth of R&Dintensive industries, average absolute and relative wages in the state arelikely to increase.
8. The trends described in Tables 3 and 4 and Figure 2 warrant a degree ofcaution. North Carolina’s economy has consistently outperformed thenational average in recent years and may do so through 2005. Moreover,some sectors (e.g., textiles) have enjoyed strong growth in output at thesame time reducing employment. Unfortunately, state-level employmentor output projections were not available at the degree of sectoral disaggre-gation necessary to replicate NSF industry categories. (Output or grossstate product projections were not available at an appropriate level ofdisaggregation at the national level either.) This prevented us frommaking a direct comparison between specializations and projectedgrowth while also accounting for average R&D intensity. However, ifnational projections provide at least some indication of the relativeperformance of specific industries, the basic findings are reasonable. Theeconomy will still undergo a shift from traditional to more knowledgeintensive activities. The management or facilitation of this transition islikely to become a major issue as the state’s R&D enterprise continues toevolve.
9. “The U.S. Textile Industry,” Office of the Chief Economist, AmericanTextile Manufacturers Institute, Washington, DC, 1996.
10. See Technical Appendix Table 22.
11. See Technical Appendix Tables 24 and 25.
12. See Technical Appendix Table 23. The classification used here is slightlydifferent than the North Carolina Employment Security Commission’s(NCESC) original. NCESC’s classification was originally a three-digit SIClevel system. In expanding it to four digit SIC sectors, a limited number ofsectors were added (e.g., oil exploration services) or deleted (e.g., architec-tural services) to ensure that it distinguished as closely as possible onlyand all technology intensive businesses.
13. Technical Appendix Tables 26-28 provide additional detail (including SICclassification) for each of the R&D performing industries. The tables alsoindicate related high growth four-digit SIC sectors for each major R&Dperforming industry.
14. Note that UNC-Charlotte did not respond to the latest NSF survey thuspreventing the inclusion of that university’s programs in our study.
15. The measure is similar to a location quotient, with a norm equal to 1.0.That is, a location quotient equal to 1.0 for a given discipline means that

At the Crossroads: North Carolina’s Place in the Knowledge Economy 39
R&D funding for that discipline is exactly proportional to total R&Dfunding in the state. On the other hand, a location quotient equal to 2.0would mean that the discipline has double the proportional amount ofR&D funding.
16. In 1994, location quotients for biological, medical, and other life sciencesall exceeded 1.0, along with materials engineering. Those four fields maybe regarded as potential specializations in the state. There is a significantbreak in the location quotients between agricultural sciences (at 1.0) andall other disciplines (the next highest is oceanography at .8). Observingthose measures over time also suggests the erosion of state specializationsin agricultural sciences, other physical sciences, and, interestingly,computer sciences between 1985 and 1994, at least in terms of R&Dfunding. The location quotients for these sectors all dropped significantlyover the period.
The NSF disciplines and their 1994 R&D funding location quotients areaerospace engineering (.01), agricultural sciences (1.0), astronomy (0),atmospheric sciences (.01), biological sciences (1.2), chemical engineering(.6), chemistry (.7), civil engineering (.7), computer science (.6), earthsciences (.6), electrical engineering (.6), materials engineering (1.6),mathematics and statistics (.8), mechanical engineering (.6), medicalservices (1.4), oceanography (.8), other engineering (.7), other geosciences(.5), other life sciences (1.3), other physical sciences (.2), and physics (.6).
17. Allocating Federal Funds for Science and Technology, Committee on Criteriafor Federal Support of Research and Development, National AcademyPress, Washington, DC, 1995.
18. Data are from the National Science Foundation’s Survey of Federal Funds,which primarily reports data for the following agencies: Agriculture,Commerce, Defense, Energy, Health and Human Services, Interior,Transportation, EPA, NASA, and the National Science Foundation. Theseagencies account for over 97 percent of federal R&D spending in NorthCarolina.
19. While North Carolina’s slice of the federal research and developmentbudget has held relatively steady, the distribution of the budget amongother states has shifted significantly, with some states’ share of federalR&D declining and others’ increasing. Over the last two decades,Georgia, Missouri, Florida, Colorado, and Texas have experiencedincreases in their share of the federal R&D budget, while shares held byNew Mexico, New York, Massachusetts, and California have all declined.Georgia’s dramatic increase is due specifically to that state’s developmentof the Air Force’s F-22 fighter aircraft. Once R&D on the F-22 is complete,Georgia’s share is expected to decline. See The Future of Science andTechnology in the South Atlantic: Trends and Indicators, Center for Science,Technology, and Congress, American Association for the Advancement ofScience, Washington, DC, September 1997.
20. See Technical Appendix Table 36.
21. Shift-share analysis, a technique usually applied to the study of industrygrowth, provides one means of quantifying these different influences (seeTechnical Appendix Table 37). The technique simply involves the evaluationof plausible counterfactuals. The national R&D budget grew by 3.6percent in current dollar terms; other things equal, we would expectNorth Carolina’s federal R&D budget to grow at the same rate. Call that

40 At the Crossroads: North Carolina’s Place in the Knowledge Economy
the “national growth effect.” The remaining 16.7 point difference ingrowth rates is made up of a “mix effect” and a “local skill” effect. Themix effect assumes that each agency’s spending in the state should grow(or decline) at a rate equivalent to its rate of change at the national level.Calculating that effect for the 1992-1995 period suggests that 13.5 points ofthe 20.3 percent state growth rate resulted from the state’s favorableagency mix in 1992; North Carolina’s total budget grew partly becausemost of its R&D funding is granted by agencies that enjoyed increasesover the period, some share of which were funneled to North Carolinaperformers. Finally, the difference between the mix effect and thenational growth effect may be attributed to local circumstances or skill inobtaining funds. The analysis, summarized in the bottom of AppendixTable 37, suggests that between 1992 and 1995, the state’s federal R&Dbudget grew by 3.6 percent simply as a result of the rate of increase of thetotal R&D budget at the national level, by 13.5 percent due to the favor-able agency mix and research focus in the state in the beginning of theperiod, and by 3.2 percent due to unique circumstances, political will, orskill (including research merit) in obtaining federal money.
22. “Real Effects of Academic Research,” by A. Jaffe, American Economic Review79 (5), 957-70, 1989. See also “The Search for R&D Spillovers,” by Z.Griliches, Scandinavian Journal of Economics 94 (Supplement), 29-47, 1992.
23. Planning for Change/Planning for Growth: Implications of Reduced FederalResearch Spending for Massachusetts, by A. Jaffe, Economic ResourcesGroup, Inc., February 1996.
24. Planning for Change/Planning for Growth, p. 31-2.
25. “The increasing linkage between U.S. technology and public science,” byF. Narin, K. S. Hamilton, and D. Olivastro, Research Policy 26 (3), pp. 317-30,1997.
26. “Industry Technology Has Strong Roots in Public Science,” CHI ResearchNewsletter, Vol. V, No. 1, March 1997. See www.chiresearch.com/nlt_v1.html (viewed 9/12/97).
27. Although some studies have attempted to quantify spillover effects in oneform or another (see, for example, Planning for Change/Planning for Growth,op. cit., and The Impact of Tufts University School of Veterinary Medicine on theMassachusetts Economy, Nexus Associates, Inc., Belmont, MA, October1995), we did not for several reasons. First, there is no established andaccepted methodology available for quantifying spillovers. Even input-output based analysis of spending multiplier impacts, which is well-accepted, can potentially generate misleading findings. Producingfindings that vastly under- or over-state spillover effects will not serve thepolicy process and may actually be worse, from a policy perspective, thantreating them in a qualitative manner.
Second, there is good reason to believe that any quantitative estimates ofspillovers would be subject to a potentially wide range of error, particu-larly from a state-specific perspective. While private sector R&D perform-ers undoubtedly draw on basic federally-supported science from theuniversities, federal labs, and non-profits, they do not necessarily drawonly or even predominantly on locally-produced science. Scientificfindings are published for a global audience and are increasingly availablevia Internet and other easily accessible sources. Although some researchhas shown that there is some evidence of localized spillovers (see, for
At the Crossroads: North Carolina’s Place in the Knowledge Economy 41
example, “Geographic Localization of Knowledge Spillovers as Evidencedby Patent Citations,” by A. B. Jaffe, M. Trajtenberg, and R. Henderson,Quarterly Journal of Economics 108, pp. 577-98, 1993), it is not yet strongenough to draw many firm conclusions.
Third, fully quantifying the spillover effects would require some estimateof value of downstream goods and services introduced by North Carolinacompanies indirectly as a result of federally-supported R&D conductedwithin the state. The information requirements of such an undertakingare well beyond the scope of this study and, in our view, well beyond thepresent state of knowledge regarding the link between local R&D,innovation, and economic growth. Evidence of the linkages betweenpublically supported R&D and private sector activity may shed some lighton the significance of university, government laboratory, and non-profitR&D activity on aggregate economic growth, but this is different thanattempting to quantify overall impacts in monetary terms.
In electing not to quantify spillover effects, we are not asserting theirinsignificance. On the contrary, we find that they are likely the mostsignificant adverse impacts associated with potential reductions in federalR&D activity in North Carolina. Just as linkages between universities andthe private sector are beginning to increase through spin-offs and otheractivity, a reduction in R&D support that hits universities hardest maylimit subsequent economic growth in the state. The problem is that thedifficulty with placing a number on this impact means that the probabilityof a misleading finding is very high. Indeed, one recent review ofacademic studies of spillover effects found that while most analyses are“flawed and subject to a variety of reservations,” “the overall impressionremains that R&D spillovers are both prevalent and important” (“TheSearch for R&D Spillovers,” p. 29). It is for this reason that we havechosen to consider them in qualitative rather than quantitative fashion.
28. At 1.76, the aggregate multiplier is lower than some other similar studieshave found. A 1984 study of the impact of UNC-Chapel Hill’s totalsponsored research budget on the state’s economy found a multiplier of2.0, for example. On the one hand, this study uses a highly disaggregatedinput-output model which is subject to less error than the aggregatedmodels used in most earlier studies. Our multiplier may simply be moreaccurate. On the other hand, it is possible that using regional purchasecoefficients to estimate local purchases (see Technical Appendix) is underes-timating in-state expenditures. To test this, we inflated all local spendingcoefficients by 25 percent (to a maximum of 1.0) and recalculated theimpacts. The multiplier under the inflated coefficients increased to only1.77.
The impact of federal R&D spending differs significantly by sector.Services account for the bulk of the total direct, indirect, and inducedexpenditure impacts (at 36 percent), followed by finance, insurance, andreal estate (19 percent), wholesale trade (18 percent), manufacturing (13percent), and transportation, communications and utilities (8 percent).The breakdown suggests the relative degree to which each sector wouldbe affected by a reduced federal spending, at least in the short term. Inthe long term, once spillover effects are taken into account, the distribu-tion of impacts might look different. The manufacturing sector, forexample, depends heavily on R&D to continually introduce new productsand technologies. Reductions in federal spending might be expected toeventually hit this sector harder than the current distribution of multiplierimpacts implies.

42 At the Crossroads: North Carolina’s Place in the Knowledge Economy
29. See Technical Appendix Table 40.
30. Figure 7 and Table 19 are from “‘Knowledge Parks’ and the EconomicDevelopment Trajectory,” by M. I. Luger, Proceedings of the Sheffield RegionalTechnopole Symposium, Sheffield, England, 1996.

At the Crossroads: North Carolina’s Place in the Knowledge Economy 43