Embed Size (px)
Citation preview
AT&T Financialand OperationalResults
Consolidated
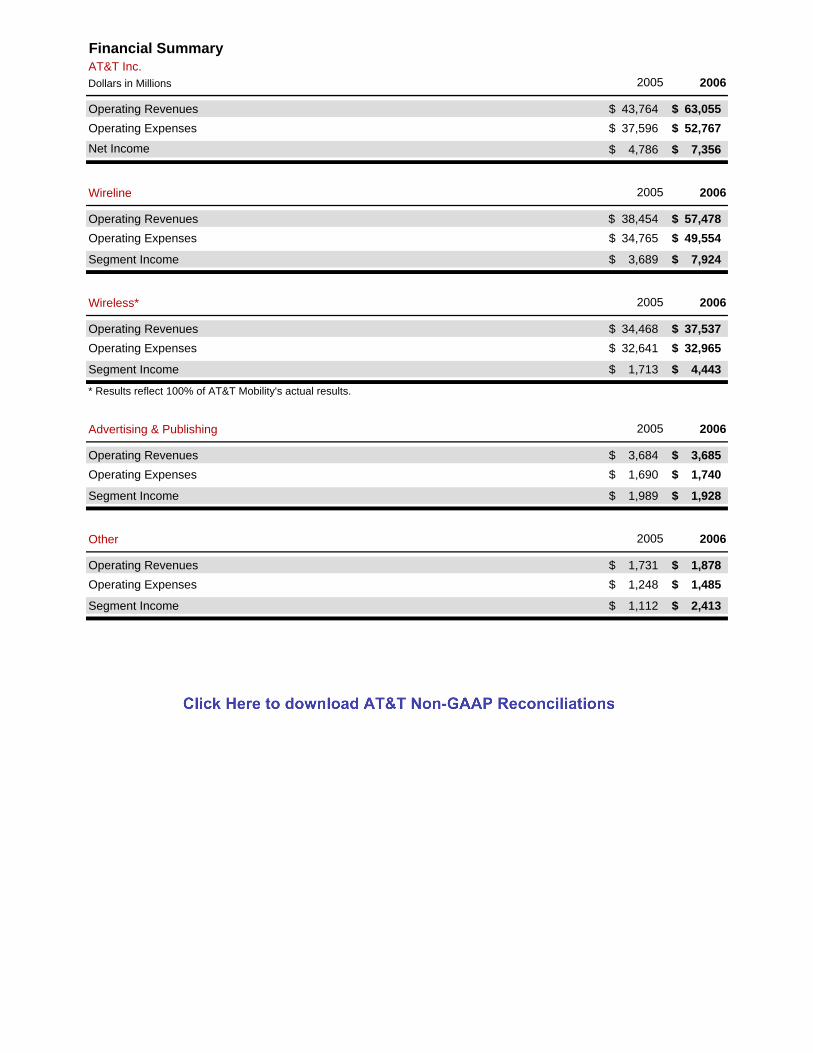
AT&T Inc.Dollars in Millions 2005 2006
Operating Revenues 43,764$ 63,055$ Operating Expenses 37,596$ 52,767$ Net Income 4,786$ 7,356$
Wireline 2005 2006
Operating Revenues 38,454$ 57,478$ Operating Expenses 34,765$ 49,554$
Segment Income 3,689$ 7,924$
Wireless* 2005 2006
Operating Revenues 34,468$ 37,537$ Operating Expenses 32,641$ 32,965$
Segment Income 1,713$ 4,443$
* Results reflect 100% of AT&T Mobility's actual results.
Advertising & Publishing 2005 2006
Operating Revenues 3,684$ 3,685$ Operating Expenses 1,690$ 1,740$
Segment Income 1,989$ 1,928$
Other 2005 2006
Operating Revenues 1,731$ 1,878$ Operating Expenses 1,248$ 1,485$
Segment Income 1,112$ 2,413$
Financial Summary
AT&T Inc.
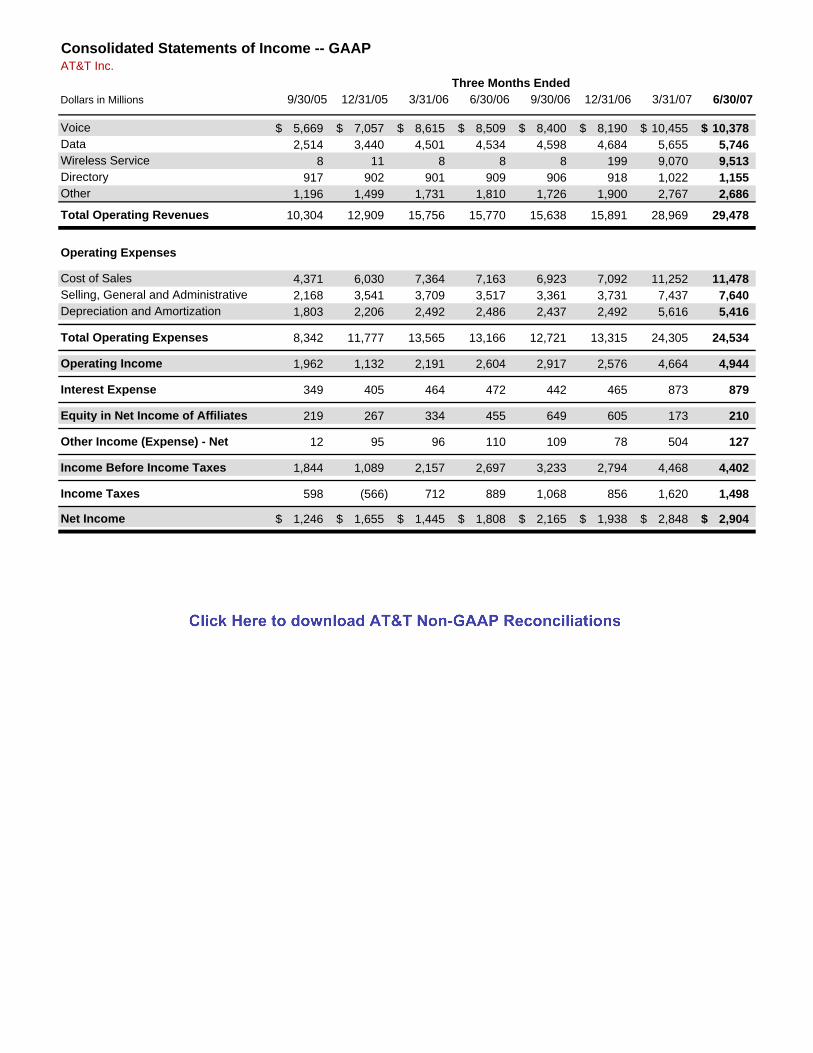
9/30/05 12/31/05 3/31/06 6/30/06 9/30/06 12/31/06 3/31/07 6/30/07
Voice 5,669$ 7,057$ 8,615$ 8,509$ 8,400$ 8,190$ 10,455$ 10,378$ Data 2,514 3,440 4,501 4,534 4,598 4,684 5,655 5,746 Wireless Service 8 11 8 8 8 199 9,070 9,513 Directory 917 902 901 909 906 918 1,022 1,155 Other 1,196 1,499 1,731 1,810 1,726 1,900 2,767 2,686
Total Operating Revenues 10,304 12,909 15,756 15,770 15,638 15,891 28,969 29,478
Operating Expenses
Cost of Sales 4,371 6,030 7,364 7,163 6,923 7,092 11,252 11,478 Selling, General and Administrative 2,168 3,541 3,709 3,517 3,361 3,731 7,437 7,640 Depreciation and Amortization 1,803 2,206 2,492 2,486 2,437 2,492 5,616 5,416
Total Operating Expenses 8,342 11,777 13,565 13,166 12,721 13,315 24,305 24,534
Operating Income 1,962 1,132 2,191 2,604 2,917 2,576 4,664 4,944
Interest Expense 349 405 464 472 442 465 873 879
Equity in Net Income of Affiliates 219 267 334 455 649 605 173 210
Other Income (Expense) - Net 12 95 96 110 109 78 504 127
Income Before Income Taxes 1,844 1,089 2,157 2,697 3,233 2,794 4,468 4,402
Income Taxes 598 (566) 712 889 1,068 856 1,620 1,498
Net Income 1,246$ 1,655$ 1,445$ 1,808$ 2,165$ 1,938$ 2,848$ 2,904$
Dollars in MillionsThree Months Ended
Consolidated Statements of Income -- GAAP
AT&T Inc.
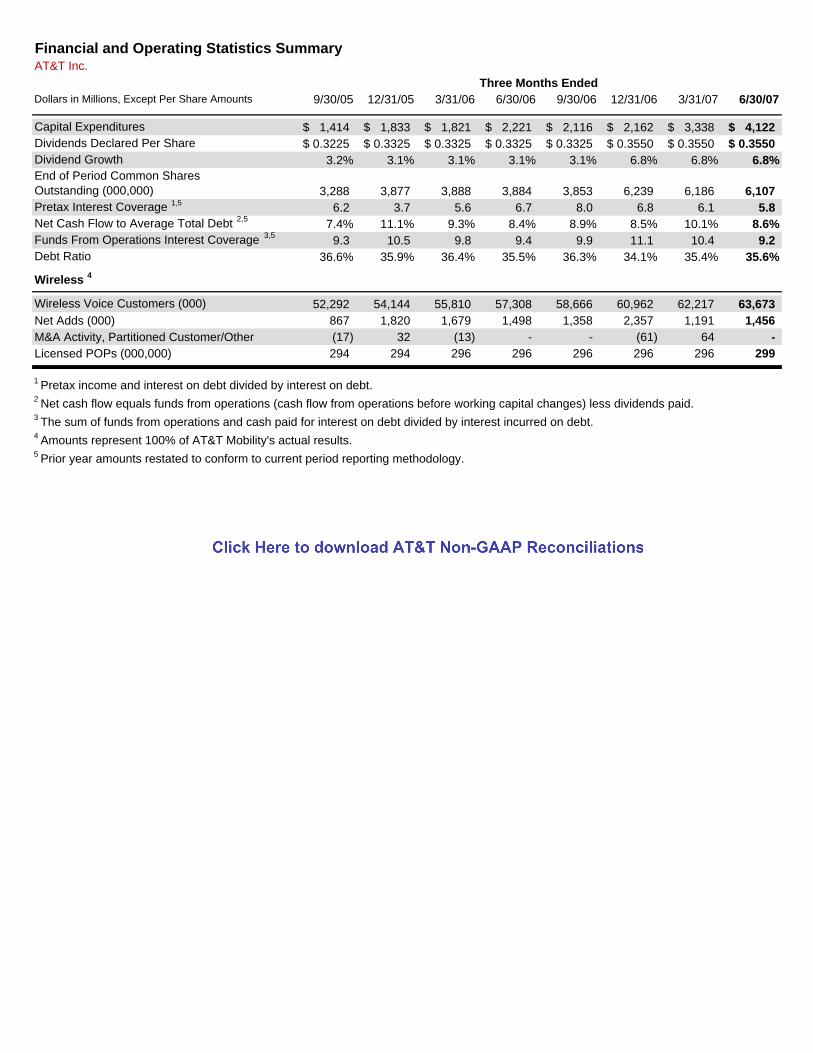
Dollars in Millions, Except Per Share Amounts 9/30/05 12/31/05 3/31/06 6/30/06 9/30/06 12/31/06 3/31/07 6/30/07
Capital Expenditures 1,414$ 1,833$ 1,821$ 2,221$ 2,116$ 2,162$ 3,338$ 4,122$ Dividends Declared Per Share 0.3225$ 0.3325$ 0.3325$ 0.3325$ 0.3325$ 0.3550$ 0.3550$ 0.3550$ Dividend Growth 3.2% 3.1% 3.1% 3.1% 3.1% 6.8% 6.8% 6.8%End of Period Common Shares Outstanding (000,000) 3,288 3,877 3,888 3,884 3,853 6,239 6,186 6,107 Pretax Interest Coverage 1,5 6.2 3.7 5.6 6.7 8.0 6.8 6.1 5.8 Net Cash Flow to Average Total Debt 2,5 7.4% 11.1% 9.3% 8.4% 8.9% 8.5% 10.1% 8.6%Funds From Operations Interest Coverage 3,5 9.3 10.5 9.8 9.4 9.9 11.1 10.4 9.2 Debt Ratio 36.6% 35.9% 36.4% 35.5% 36.3% 34.1% 35.4% 35.6%
Wireless 4
Wireless Voice Customers (000) 52,292 54,144 55,810 57,308 58,666 60,962 62,217 63,673Net Adds (000) 867 1,820 1,679 1,498 1,358 2,357 1,191 1,456M&A Activity, Partitioned Customer/Other (17) 32 (13) - - (61) 64 - Licensed POPs (000,000) 294 294 296 296 296 296 296 299
4 Amounts represent 100% of AT&T Mobility's actual results. 5 Prior year amounts restated to conform to current period reporting methodology.
Three Months Ended
Financial and Operating Statistics Summary
1 Pretax income and interest on debt divided by interest on debt.2 Net cash flow equals funds from operations (cash flow from operations before working capital changes) less dividends paid.3 The sum of funds from operations and cash paid for interest on debt divided by interest incurred on debt.
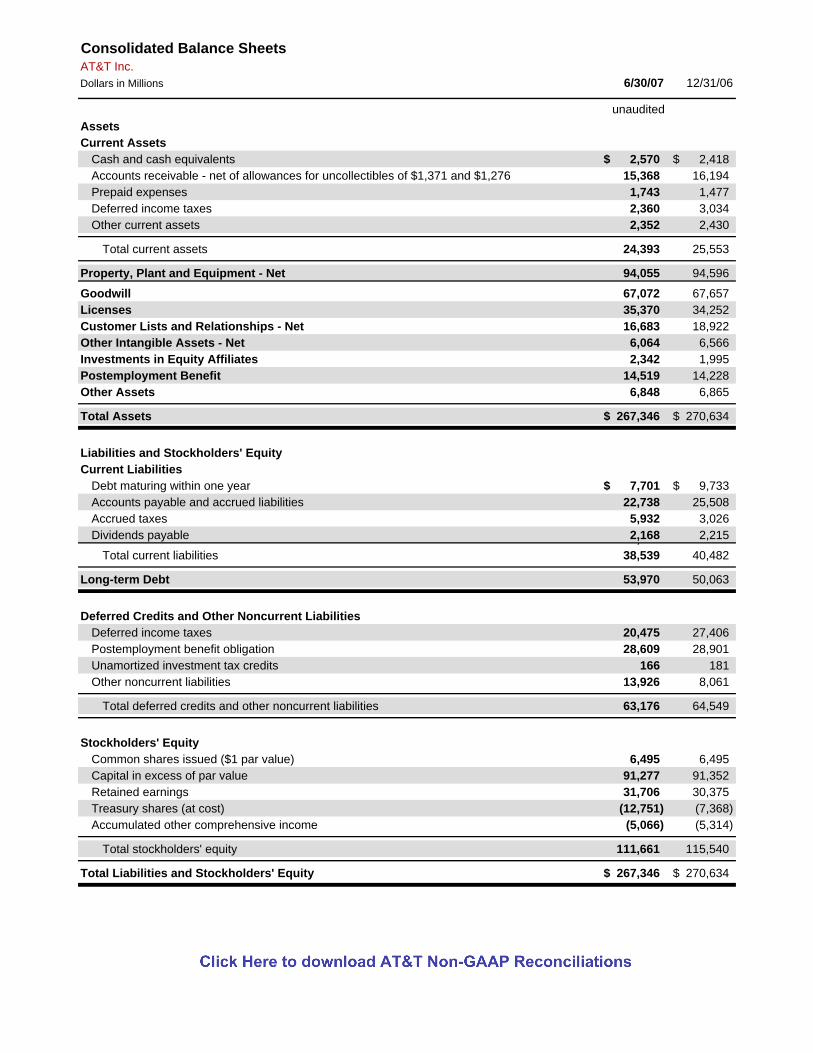
Dollars in Millions 6/30/07 12/31/06
unauditedAssetsCurrent Assets
Cash and cash equivalents 2,570$ 2,418$ Accounts receivable - net of allowances for uncollectibles of $1,371 and $1,276 15,368 16,194 Prepaid expenses 1,743 1,477 Deferred income taxes 2,360 3,034 Other current assets 2,352 2,430
Total current assets 24,393 25,553
Property, Plant and Equipment - Net 94,055 94,596
Goodwill 67,072 67,657 Licenses 35,370 34,252 Customer Lists and Relationships - Net 16,683 18,922 Other Intangible Assets - Net 6,064 6,566 Investments in Equity Affiliates 2,342 1,995 Postemployment Benefit 14,519 14,228 Other Assets 6,848 6,865
Total Assets 267,346$ 270,634$
Liabilities and Stockholders' EquityCurrent Liabilities
Debt maturing within one year 7,701$ 9,733$ Accounts payable and accrued liabilities 22,738 25,508 Accrued taxes 5,932 3,026 Dividends payable 2,168 2,215 ,
Total current liabilities 38,539 40,482
Long-term Debt 53,970 50,063
Deferred Credits and Other Noncurrent LiabilitiesDeferred income taxes 20,475 27,406 Postemployment benefit obligation 28,609 28,901 Unamortized investment tax credits 166 181 Other noncurrent liabilities 13,926 8,061
Total deferred credits and other noncurrent liabilities 63,176 64,549
Stockholders' EquityCommon shares issued ($1 par value) 6,495 6,495 Capital in excess of par value 91,277 91,352 Retained earnings 31,706 30,375 Treasury shares (at cost) (12,751) (7,368) Accumulated other comprehensive income (5,066) (5,314)
Total stockholders' equity 111,661 115,540
Total Liabilities and Stockholders' Equity 267,346$ 270,634$
Consolidated Balance SheetsAT&T Inc.
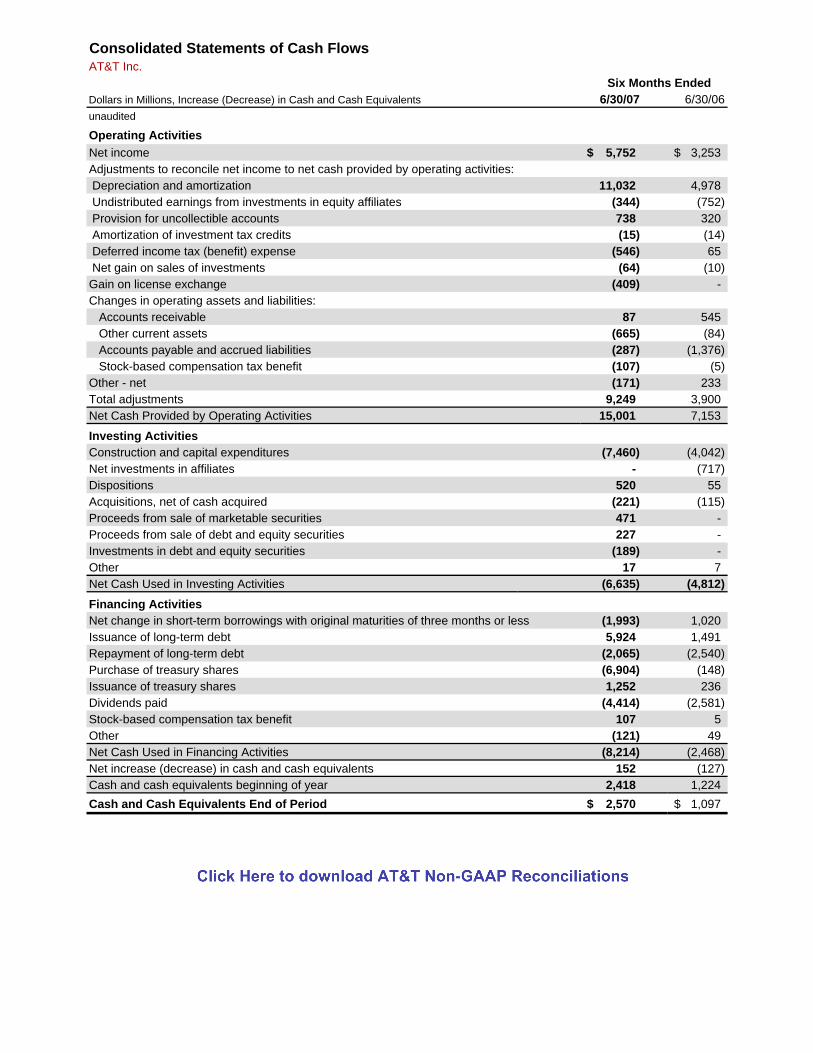
Dollars in Millions, Increase (Decrease) in Cash and Cash Equivalents 6/30/07 6/30/06unaudited
Operating ActivitiesNet income 5,752$ 3,253$ Adjustments to reconcile net income to net cash provided by operating activities: Depreciation and amortization 11,032 4,978 Undistributed earnings from investments in equity affiliates (344) (752) Provision for uncollectible accounts 738 320 Amortization of investment tax credits (15) (14) Deferred income tax (benefit) expense (546) 65 Net gain on sales of investments (64) (10) Gain on license exchange (409) - Changes in operating assets and liabilities: Accounts receivable 87 545 Other current assets (665) (84) Accounts payable and accrued liabilities (287) (1,376) Stock-based compensation tax benefit (107) (5) Other - net (171) 233 Total adjustments 9,249 3,900 Net Cash Provided by Operating Activities 15,001 7,153
Investing ActivitiesConstruction and capital expenditures (7,460) (4,042) Net investments in affiliates - (717) Dispositions 520 55 Acquisitions, net of cash acquired (221) (115) Proceeds from sale of marketable securities 471 - Proceeds from sale of debt and equity securities 227 - Investments in debt and equity securities (189) - Other 17 7 Net Cash Used in Investing Activities (6,635) (4,812) Financing ActivitiesNet change in short-term borrowings with original maturities of three months or less (1,993) 1,020 Issuance of long-term debt 5,924 1,491 Repayment of long-term debt (2,065) (2,540) Purchase of treasury shares (6,904) (148) Issuance of treasury shares 1,252 236 Dividends paid (4,414) (2,581) Stock-based compensation tax benefit 107 5 Other (121) 49 Net Cash Used in Financing Activities (8,214) (2,468) Net increase (decrease) in cash and cash equivalents 152 (127) Cash and cash equivalents beginning of year 2,418 1,224 Cash and Cash Equivalents End of Period 2,570$ 1,097$
Six Months Ended
Consolidated Statements of Cash FlowsAT&T Inc.