Embed Size (px)
Citation preview
DMD/2004/2931
Revised version
Atazanavir: Effects on P-gp transport and
CYP3A metabolism in vitro
Elke S. Perloff, Su X. Duan, Paul R. Skolnik, David J. Greenblatt,
Lisa L. von Moltke
Department of Pharmacology and Experimental Therapeutics,
Tufts University School of Medicine and Tufts New England Medical Center,
Boston, MA 02111 (ESP, SXD, DJG, LLvM)
Center for HIV Care and Research, Section of Infectious Disease,
Boston University School of Medicine and Boston Medical Center,
Boston, MA 02118 (PRS)
DMD Fast Forward. Published on March 11, 2005 as doi:10.1124/dmd.104.002931
Copyright 2005 by the American Society for Pharmacology and Experimental Therapeutics.
This article has not been copyedited and formatted. The final version may differ from this version.DMD Fast Forward. Published on March 11, 2005 as DOI: 10.1124/dmd.104.002931
at ASPE
T Journals on A
pril 22, 2020dm
d.aspetjournals.orgD
ownloaded from
DMD/2004/2931 2
Running Title: Effects of atazanavir on P-gp and CYP3A in vitro
Corresponding author: David J. Greenblatt, M.D. Department of Pharmacology and Experimental Therapeutics Tufts University School of Medicine 136 Harrison Avenue Boston, MA 02111 Phone: +1-617-636-6997 Fax: +1-617-636-6738 Email: [email protected]
Contents: 18 text pages including 2 title pages
1 table
9 figures
35 references
Abstract: 260 words
Introduction: 472 words
Discussion: 886 words
Abbreviations: HLM: human liver microsomes
Rh123: rhodamine 123
HIV: human immunodeficiency virus
This article has not been copyedited and formatted. The final version may differ from this version.DMD Fast Forward. Published on March 11, 2005 as DOI: 10.1124/dmd.104.002931
at ASPE
T Journals on A
pril 22, 2020dm
d.aspetjournals.orgD
ownloaded from

DMD/2004/2931 3
Abstract
The effect of atazanavir on P-glycoprotein expression and activity, as well as its inhibitory
potency against CYP3A activity, was evaluated in vitro. Induction of P-gp activity and expression
was studied using LS180V cells. P-gp inhibition was studied using both LS180V cells and Caco-
2 cells. P-gp activity was assessed by measuring P-gp mediated rhodamine123 (Rh123) transport,
and P-gp expression was determined using SDS-PAGE/western blot analysis. CYP3A inhibition
was tested using triazolam hydroxylation in human liver microsomes (HLM). Extended (3-day)
exposure of LS180V cells to 30 µM atazanavir caused a 2.5-fold increase in immunoreactive P-
gp expression as well as a concentration-dependent decrease of intracellular Rh123 to a mean
45% (SD 5.2%) of control. Acute exposure (60 min) of LS180V cells to atazanavir increased
intracellular Rh123 concentrations up to 300% of control at 100 µM atazanavir. At 30 µM and
above, acute atazanavir exposure reversed P-gp induction caused by 3-day pre-treatment with 10
µM ritonavir. P-gp inhibition was also observed in Caco-2 cells, causing an effect comparable to
that observed for the known P-gp inhibitor verapamil (50% of control). In HLM, atazanavir was
an inhibitor of triazolam hydroxylation, with inhibitory potency greatly increased by
preincubation. IC50 values with and without pre-incubation were 0.31 µM (SD 0.13) and 5.7 µM
(SD 4.1), respectively. Thus atazanavir is an inhibitor and inducer of P-gp as well as a potent
inhibitor of CYP3A in vitro, suggesting a potential for atazanavir to cause drug-drug interactions
in vivo.
This article has not been copyedited and formatted. The final version may differ from this version.DMD Fast Forward. Published on March 11, 2005 as DOI: 10.1124/dmd.104.002931
at ASPE
T Journals on A
pril 22, 2020dm
d.aspetjournals.orgD
ownloaded from

DMD/2004/2931 4
Atazanavir (BMS-232632, Reyataz TM) is an azapeptide HIV-1 protease inhibitor recently
approved by the FDA for the combination treatment of HIV-1 infection (Musial et al., 2004;
Orrick and Steinhart, 2004; Piliero, 2002; Goldsmith and Perry, 2003). Atazanavir is the seventh
addition to the family of HIV protease inhibitors, but appears to be more potent than other
members of its class. Atazanavir shows high relative selectivity for HIV-1 protease (Robinson et
al., 2000) and appears to lack the adverse effects on blood lipid profiles seen with other protease
inhibitors, possibly eliminating the need for cholesterol-lowering co-medications (Goldsmith and
Perry, 2003). Additionally, the pharmacokinetic properties of atazanavir allow for once daily
dosing (200-800 mg/day), thus substantially reducing the total pill burden associated with
antiretroviral combination therapy (Goldsmith and Perry, 2003). The primary resistance mutation
of atazanavir is distinct, with the potential for low cross-resistance to other related compounds
(Colonno et al., 2004). Similar to other protease inhibitors, atazanavir is extensively metabolized,
mainly by CYP3A (Goldsmith and Perry, 2003). Atazanavir has been successfully used in
combination therapy in both treatment naive and treatment experienced patients (Haas et al.,
2003; Havlir and O'Marro, 2004; Squires et al., 2004).
HIV patients are typically treated with multiple other drugs in addition to their
antiretroviral regimen. While these combination drug regimens have substantially improved
survival, they are also associated with a large potential for drug-drug interactions (de Maat et al.,
2003). Drugs used in HIV treatment therefore need to be evaluated carefully with regard to their
effects on hepatic and intestinal metabolizing enzymes (especially CYP3A) as well as their
interactions with drug transporters (especially P-glycoprotein, P-gp). Several HIV protease
inhibitors as well as non-nucleoside reverse transcriptase inhibitors have already been identified
as substrates, inhibitors, or inducers of P-gp and CYP3A (Kim et al., 1998; von Moltke et al.,
1998b, 2000, 2001; Profit et al., 1999; Perloff et al., 2000, 2001, 2002, 2003; Störmer et al.,
This article has not been copyedited and formatted. The final version may differ from this version.DMD Fast Forward. Published on March 11, 2005 as DOI: 10.1124/dmd.104.002931
at ASPE
T Journals on A
pril 22, 2020dm
d.aspetjournals.orgD
ownloaded from

DMD/2004/2931 5
2002) .
P-gp mediated drug transport in vitro has been successfully studied using the human colon
adenocarcinoma cell lines Caco-2 (Artursson et al., 1996; Quaroni and Hochman, 1996) and
LS180 (Herzog et al., 1993; Schuetz et al., 1996; Perloff et al., 2000; Störmer et al., 2002). Rh123
cell exclusion studies in LS180V cells are especially useful because this model allows the
assessment of P-gp induction (activity and expression) and P-gp inhibition in the same cell line
(Perloff et al., 2003).
In order to anticipate drug-drug interactions associated with combination drug therapy, this
in vitro study investigated the effects of the HIV protease inhibitor atazanavir on the activity of P-
gp mediated Rh123 transport, on P-gp expression, as well as on CYP3A mediated drug
metabolism.
This article has not been copyedited and formatted. The final version may differ from this version.DMD Fast Forward. Published on March 11, 2005 as DOI: 10.1124/dmd.104.002931
at ASPE
T Journals on A
pril 22, 2020dm
d.aspetjournals.orgD
ownloaded from

DMD/2004/2931 6
Methods
Chemicals
Atazanavir was extracted into methanol from its clinical dosage form. It was assumed that
atazanavir was completely extracted from the dosage form. Quantification could not be
performed for lack of a pure reference standard. Other drugs and chemicals were purchased from
commercial sources, or were kindly provided by their pharmaceutical manufacturers.
Cell Lines
The human colon adenocarcinoma cell line LS180 (Pinto et al., 1983) was obtained from
the American Type Culture Collection (Manassas, VA). Cells were selected for elevated P-gp
levels with increasing concentrations of vinblastine (1-2-4-8 ng/ml) and maintained at 4 ng/ml
until initiation of induction experiments (similar to (Herzog et al., 1993)). The vinblastine
selected cell line is denoted LS180V. LS180V cells were grown in MEM supplemented with 10%
fetal bovine serum, 0.1 mM non-essential amino acids, 1 mM pyruvic acid, 100 units/ml
penicillin, 0.1 mg/ml streptomycin, and 4 ng/ml vinblastine.
The human colon adenocarcinoma cell line Caco-2 was obtained from the American Type
Culture Collection (Manassas, VA) and used at passages 20-30. Caco-2 cells were grown in
MEM (Minimal Essential Media) supplemented with 10% fetal bovine serum, 0.1 mM non-
essential amino acids, 1 mM pyruvic acid, 100 units/ml penicillin, and 0.1 mg/ml streptomycin.
Induction and inhibition of Rh123 transport in LS180V cells
LS180V cells were seeded at 1x10⁵/cm2 in 24-well tissue culture cluster plates (Corning
Costar Corp., Cambridge, MA). Cells were grown in a humidified chamber (37°C, 5% CO2) to
90% confluence (3 to 4 days), when media was replaced by vinblastine-free media containing 1-
This article has not been copyedited and formatted. The final version may differ from this version.DMD Fast Forward. Published on March 11, 2005 as DOI: 10.1124/dmd.104.002931
at ASPE
T Journals on A
pril 22, 2020dm
d.aspetjournals.orgD
ownloaded from
DMD/2004/2931 7
100 µM atazanavir and 0.5% DMSO. The known P-gp inducer ritonavir (Perloff et al., 2000;
Perloff et al., 2001) served as a positive control, and vehicle (media with 0.5% DMSO) served as
a negative control. Experiments were done in duplicate. After 72 hours, cells were washed three
times with MEM (containing 10% calf serum and 0.5% DMSO) and supplied with vinblastine-
free media with or without inhibitor (100 µM verapamil, 3–100 µM atazanavir). Plates were
incubated for 30 min and Rh123 (final concentration 5 µM) was added. Cells were placed in the
incubator for 90 min and subsequently washed three times with MEM (containing 10% calf
serum and 0.5% DMSO). Cells were lysed for 30 min (0.5% deoxycholate, 1% triton-X, 1 mM
PMSF in 0.05 M KH2PO4) and Rh123 concentrations in the lysate were quantified by
fluorescence measurement at 500/550 nm (excitation/emission).
Determination of protein concentration demonstrated comparable cell density in each well.
In similar experiments, LS180V cell morphology was evaluated microscopically (Perloff et al.,
2001) to assure cell viability. Furthermore, the Rh123 accumulation methodology verifies cell
viability and cell membrane integrity itself, such that cell membrane disruption by potential
inhibitors yields results that are highly indicative of toxicity. If the LS180V cell membrane is
compromised due to toxicity, the washing procedure during Rh123 accumulation experiments
greatly reduces intracellular Rh123 (10-fold less compared to positive control values) and VER
has no reversal effect.
We have previously observed that induction studies exhibit some variability in verapamil
inhibitory potential, while relative induction results remain fairly constant. This finding may be
due to the multiple steps involved in the experiments. However, the possibility of differential
effects on transporters other than P-gp by the study drugs can not be excluded and may contribute
to the variable effects of verapamil on Rh123 accumulation in induced cells. In any case, this
This article has not been copyedited and formatted. The final version may differ from this version.DMD Fast Forward. Published on March 11, 2005 as DOI: 10.1124/dmd.104.002931
at ASPE
T Journals on A
pril 22, 2020dm
d.aspetjournals.orgD
ownloaded from
DMD/2004/2931 8
should not affect comparisons of Rh123 concentrations between different treatments within the
same experiment.
Induction of P-gp protein expression in LS180V cells
LS180V cells were seeded at 0.5x10⁵/cm2 in 5-cm round tissue culture dishes (Corning
Costar Corp., Cambridge, MA). Cells were grown in a humidified chamber (37°C, 5% CO2) to
70% confluence (3 to 4 days), when media was replaced by vinblastine-free media containing 3
and 30 µM atazanavir and 0.5% DMSO. The known P-gp inducer ritonavir served as a positive
control, vehicle (media with 0.5% DMSO) served as a negative control. Experiments were done
in triplicate. After 72 hours, cells were lysed (0.5% deoxycholate, 1% triton-X, 1 mM PMSF in
0.05 M KH2PO4), sonicated and centrifuged. Supernatants were analyzed for protein
concentration using the BCA protein assay (Pierce, Rockford, IL) and stored at –80°C until
western blot analysis. The 72-hours exposure time for induction experiments was selected based
on time-course experiments performed with ritonavir in LS180V cells (Perloff et al., 2000, 2001).
Samples were separated by SDS-PAGE on 4-15% acryl amide gradient gels (Ready-Gel,
BioRad, Hercule, CA) and transferred to PVDF membranes (Immobilon P, Millipore, Bedford,
MA). The 170 kD P-gp protein was detected using the monoclonal mouse anti-human P-gp
(C219) primary antibody (Signet, Dedham, MA), and a HRP linked sheep anti-mouse IgG
secondary antibody (Amersham Pharmacia Biotech Inc., Piscataway, NJ) with SuperSignal
chemiluminescence reagent (Pierce, Rockford, IL). Sample preparation, electrophoresis and
transfer were performed at 4°C. Images were acquired using a Kodak Image Station IS440CF
(Eastman Kodak Company, Rochester, NY). Western blots were quantified using computer image
analysis (Kodak 1D Image Analysis Software, v3.6.2, Eastman Kodak Company, Rochester, NY).
Blots were quantified based on a calibration curve run together with each set of samples,
This article has not been copyedited and formatted. The final version may differ from this version.DMD Fast Forward. Published on March 11, 2005 as DOI: 10.1124/dmd.104.002931
at ASPE
T Journals on A
pril 22, 2020dm
d.aspetjournals.orgD
ownloaded from
DMD/2004/2931 9
allowing for comparison of relative P-gp contents between samples.
Inhibition of Rh123 transport in Caco-2 cells
Caco-2 cells were seeded at 1-2x10⁵/cm2 in 24-well polycarbonate membrane transwell
plates (0.33 cm diameter, 3 µm pore size) (Corning Costar Corp., Cambridge, MA). Cells were
grown in a humidified chamber (37°C, 5% CO2) with media changes every 3-5 days. Transport
experiments were conducted in confluent cells on day 12-16 post seeding. Transepithelial
electrical resistance was >300 Ωcm2, confirming high monolayer confluence. Methanolic
solutions of atazanavir were evaporated to dryness, dissolved in 0.5% DMSO and reconstituted in
OptiMEM media (GibcoBRL, Rockville, MD). Solubility of atazanavir in media was verified by
HPLC analysis. Peak heights were linear with drug concentration over the concentration ranges
used (up to 250 µM). Rh123 was added as a concentrated methanolic solution, with final
methanol concentration <0.5%. Media containing Rh123 (5 µM) was added to the apical (A) or
basolateral (B) chamber, with the potential inhibitor present in both chambers. Cells were
incubated at 37°C, 5% CO2 for 180 min and samples were taken (50 µl and 200 µl, respectively,
from chamber A and B) from the chamber initially not containing Rh123. Samples from chamber
A were diluted with 150 µl methanol. Rh123 concentrations were determined as described above.
CYP3A mediated biotransformation activity in vitro
Healthy liver tissue was obtained from the International Institute for the Advancement of
Medicine (Exton, PA, USA), the Liver Tissue Procurement and Distribution System (University
of Minnesota, Minneapolis, MI, USA) or the National Disease Research Interchange
(Philadelphia, PA, USA) The tissue was kept at –80°C until time of microsome preparation.
This article has not been copyedited and formatted. The final version may differ from this version.DMD Fast Forward. Published on March 11, 2005 as DOI: 10.1124/dmd.104.002931
at ASPE
T Journals on A
pril 22, 2020dm
d.aspetjournals.orgD
ownloaded from
DMD/2004/2931 10
Microsomes were prepared and stored as described previously (von Moltke et al., 1993).
Triazolam-4-hydroxylation and triazolam-α-hydroxylation were used as index reactions for
CYP3A activity in vitro. Incubations were performed as described previously (von Moltke et al.,
1998a, b, 2000, 2001; Weemhoff et al., 2003; Greenblatt et al., 2003). In brief, incubation
mixtures contained 0.05 M KH2PO4 buffer (pH 7.4 at 25°C), 0.5 mM NADP, 3.75 mM DL-
isocitric acid, 1 U/ml of isocitrate dehydrogenase and 5 mM Mg2+. Final volumes were 250 µl
with a microsomal protein concentration of 250 µg/ml and a triazolam concentration of 250 µM.
Incubation time was 20 min. Atazanavir and ketoconazole (established as a reversible inhibitor of
CYP3A) were evaluated for inhibitory activity. Both were tested for reversible (without pre-
incubation of inhibitor with microsomes) and mechanism-based inhibition (20 min preincubation
of inhibitor with buffer, cofactors and microsomes at 37°C prior to exposure to substrate). The
effect of increasing preincubation times (5 – 20 min) on the inhibitory effects of atazanavir and
ketoconazole was also evaluated.
Triazolam and its metabolites α-hydroxy-triazolam and 4-hydroxy-triazolam were
quantified by isocratic HPLC with UV detection at 220 nm (von Moltke et al., 1998a).
Data Analysis
For studies of intracellular Rh123 concentrations, immunoactive protein expression, and
Rh123 transport, differences between experimental conditions and the corresponding vehicle
control were evaluated using Student’s t-test, with p<0.05 being the boundary for statistical
significance.
For CYP inhibition studies, IC50 values (inhibitor concentrations corresponding to a 50%
decrease in reaction velocity) were generated by nonlinear regression using SigmaPlot (v8.02,
SPSS Inc., Chicago, IL) using methodology described previous (von Moltke et al., 1998b).
This article has not been copyedited and formatted. The final version may differ from this version.DMD Fast Forward. Published on March 11, 2005 as DOI: 10.1124/dmd.104.002931
at ASPE
T Journals on A
pril 22, 2020dm
d.aspetjournals.orgD
ownloaded from
DMD/2004/2931 11
Results
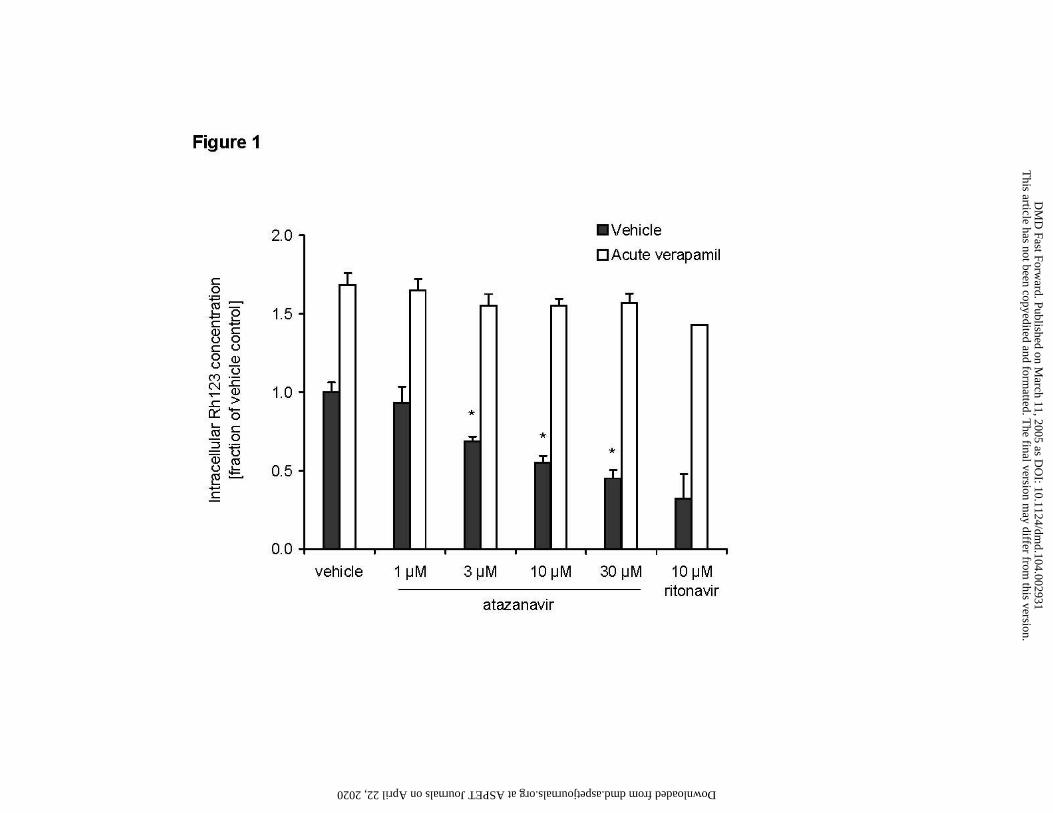
Induction of Rh123 transport activity by atazanavir in LS180V cells
Extended exposure (3 days) of LS180V cells to increasing concentrations of atazanavir
reduced intracellular Rh123 accumulation in a concentration dependent manner to 45% of vehicle
control at 30 µM atazanavir (Figure 1, solid bars). The positive control ritonavir (10 µM) caused
a decrease in Rh123 uptake to 32% of control. Addition of the P-gp inhibitor verapamil reversed
the effect in both controls and drug treated cells, increasing accumulation of Rh123 to up to 70%
above control values (Figure 1, open bars).
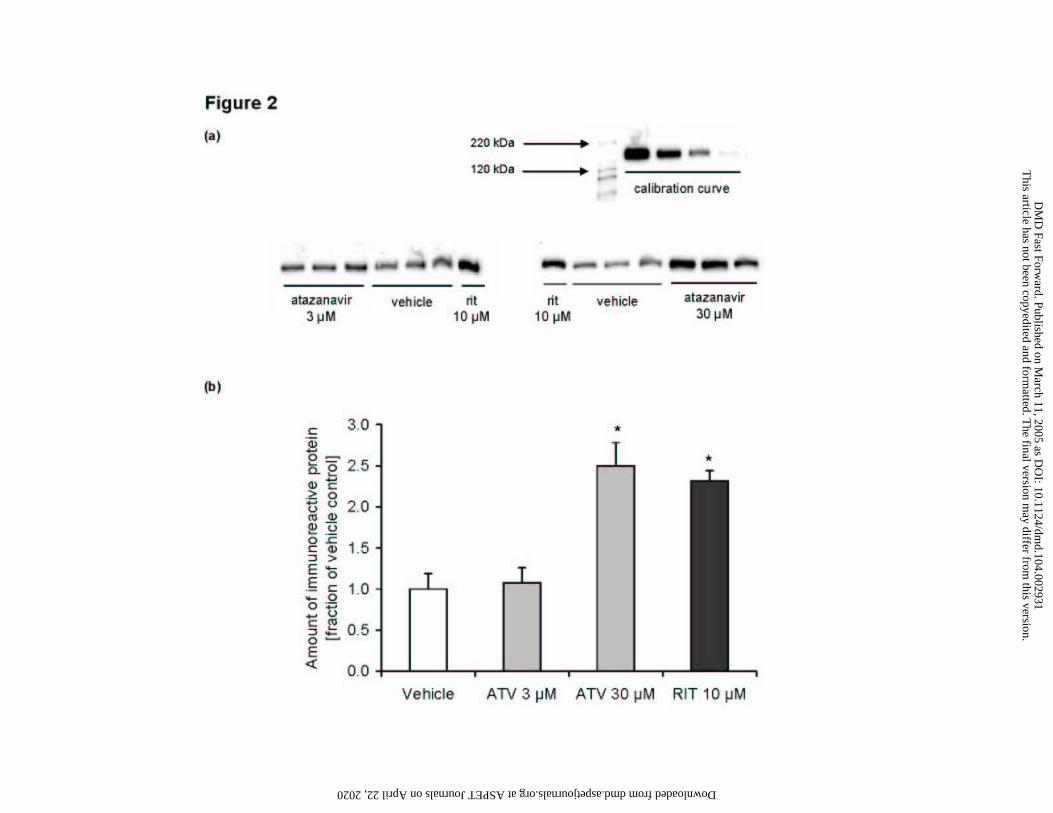
Induction of P-gp protein expression by atazanavir in LS180V cells
Atazanavir was also evaluated for its ability to induce P-gp expression in LS180V cells
after extended exposure. Western blot analysis of membrane preparations of the exposed cells
revealed a concentration-dependent increase in immunoreactive P-gp after 3-day atazanavir
exposure. While 3 µM atazanavir did not cause a detectable increase in of P-gp expression, at 30
µM atazanavir a 2.5-fold increase in P-gp expression over vehicle control was observed (Figure
2). This effect was comparable to the 2.3-fold induction caused by 10 µM ritonavir, a known P-
gp inducer used as a positive control. These western blot data correspond well to the Rh123 cell
exclusion results for atazanavir showing an inductive effect comparable to that seen with
ritonavir. Together, these results indicate that after extended exposure to atazanavir or ritonavir,
active Rh123 efflux from the cell is increased as a result of P-gp induction.
Inhibition of Rh123 transport activity by atazanavir in LS180V cells
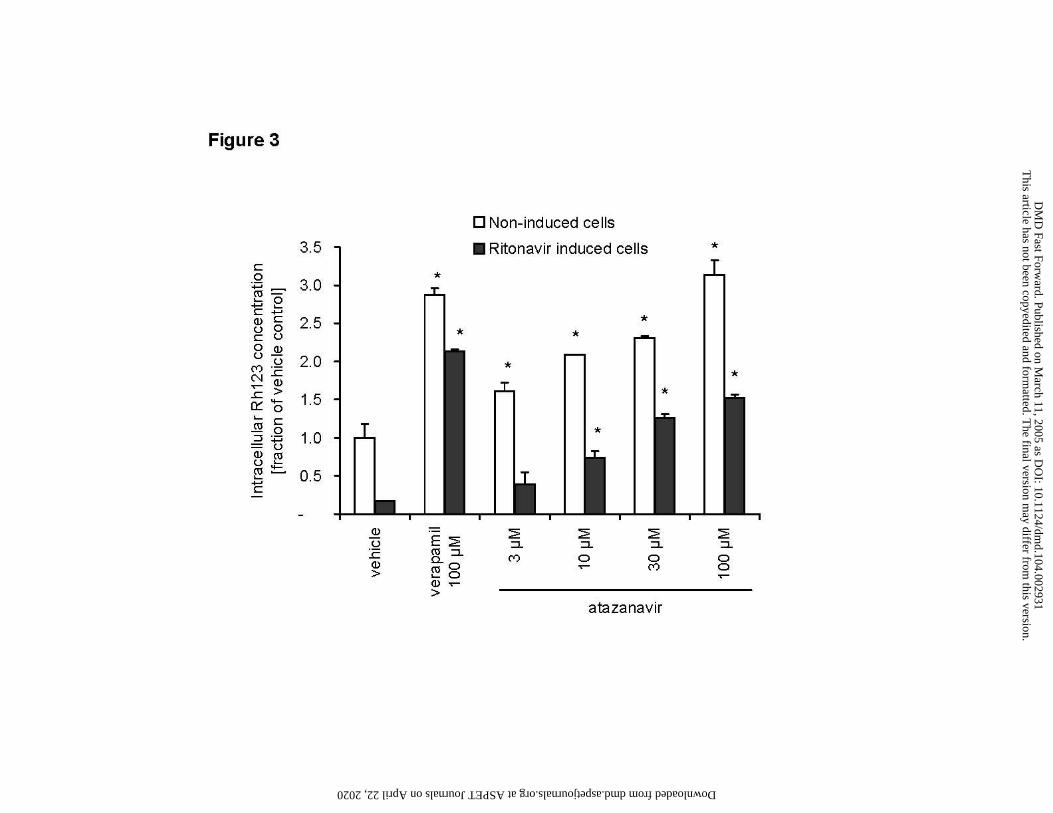
Acute exposure (60 min) of LS180V cells to increasing concentrations of atazanavir (3 –
This article has not been copyedited and formatted. The final version may differ from this version.DMD Fast Forward. Published on March 11, 2005 as DOI: 10.1124/dmd.104.002931
at ASPE
T Journals on A
pril 22, 2020dm
d.aspetjournals.orgD
ownloaded from

DMD/2004/2931 12
100 µM) inhibited Rh123 cell exclusion leading to increased intracellular Rh123 concentrations.
The effect was concentration dependent and ranged from a 1.6-fold increase over control at 3 µM
atazanavir to a 3-fold increase at 100 µM atazanavir, an effect comparable to that observed for the
known P-gp inhibitor verapamil (Figure 3, open bars).
An additional measure of P-gp inhibitory potency is the ability of a drug to reverse P-gp
induction caused by extended exposure to a known P-gp inducer. In LS180V cells pretreated with
the inducer ritonavir (10 µM) for 3 days, the decrease in Rh123 accumulation was readily
reversed by acute (60 min) exposure to 100 µM verapamil. Treatment with increasing
concentrations of atazanavir showed the same effect, with lower atazanavir concentrations (3 µM,
10 µM) leading to partial reversal of the ritonavir induction and higher atazanavir concentrations
resulting in intracellular Rh123 concentrations up to 1.5-fold of those seen in uninduced controls
(Figure 3, solid bars).
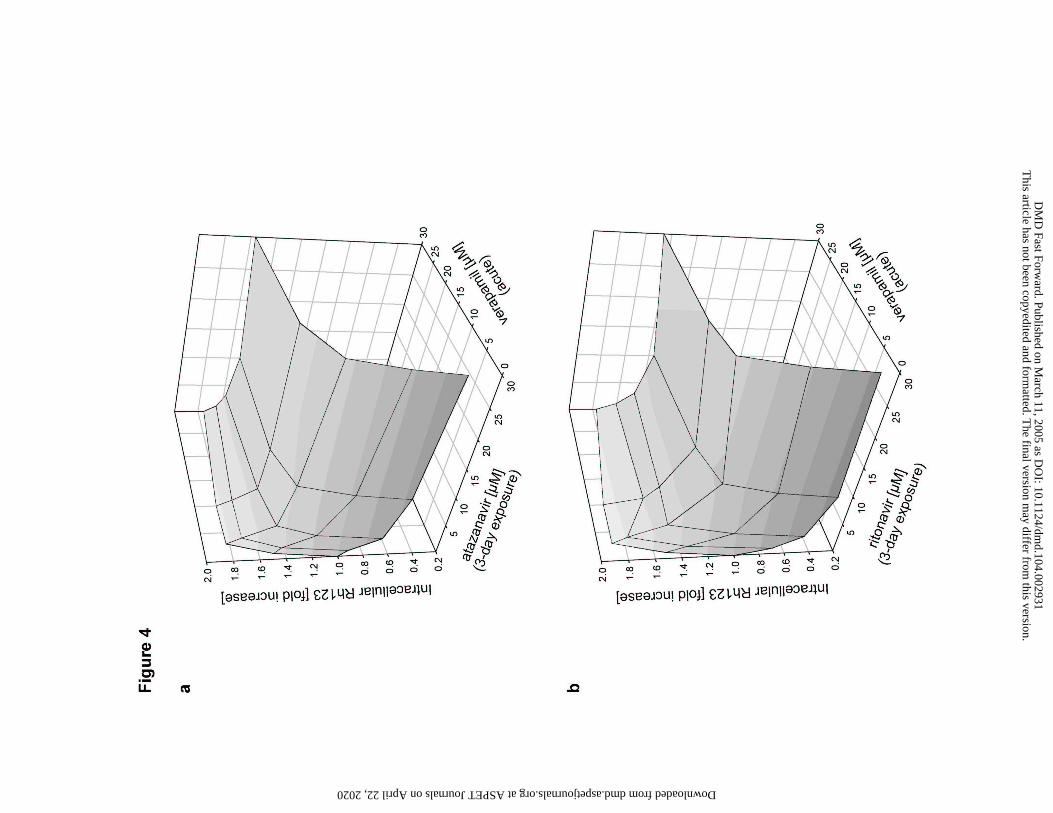
Combined induction and inhibition of Rh123 transport activity in LS180V cells
LS180V cells subjected to 3-day induction by increasing concentrations (0, 3, 10, 30 µM)
of atazanavir and ritonavir were subsequently exposed acutely to increasing concentrations (0, 3,
10, 30 µM) of the P-gp inhibitor verapamil. At all inducer concentrations tested, verapamil was
able to reverse the decrease in Rh123 accumulation caused by P-gp induction. Increasing
concentrations of the inducing agent (atazanavir: Figure 4a; ritonavir: Figure 4b) initially
required increasing concentrations of verapamil for reversal of the inductive effect. The increase
in inducer concentration from 10 µM to 30 µM, however, showed little effect on the verapamil
concentration required to reverse the effect, suggesting that the induction effect plateaus at about
10 µM for both compounds (Figure 4).
This article has not been copyedited and formatted. The final version may differ from this version.DMD Fast Forward. Published on March 11, 2005 as DOI: 10.1124/dmd.104.002931
at ASPE
T Journals on A
pril 22, 2020dm
d.aspetjournals.orgD
ownloaded from

DMD/2004/2931 13
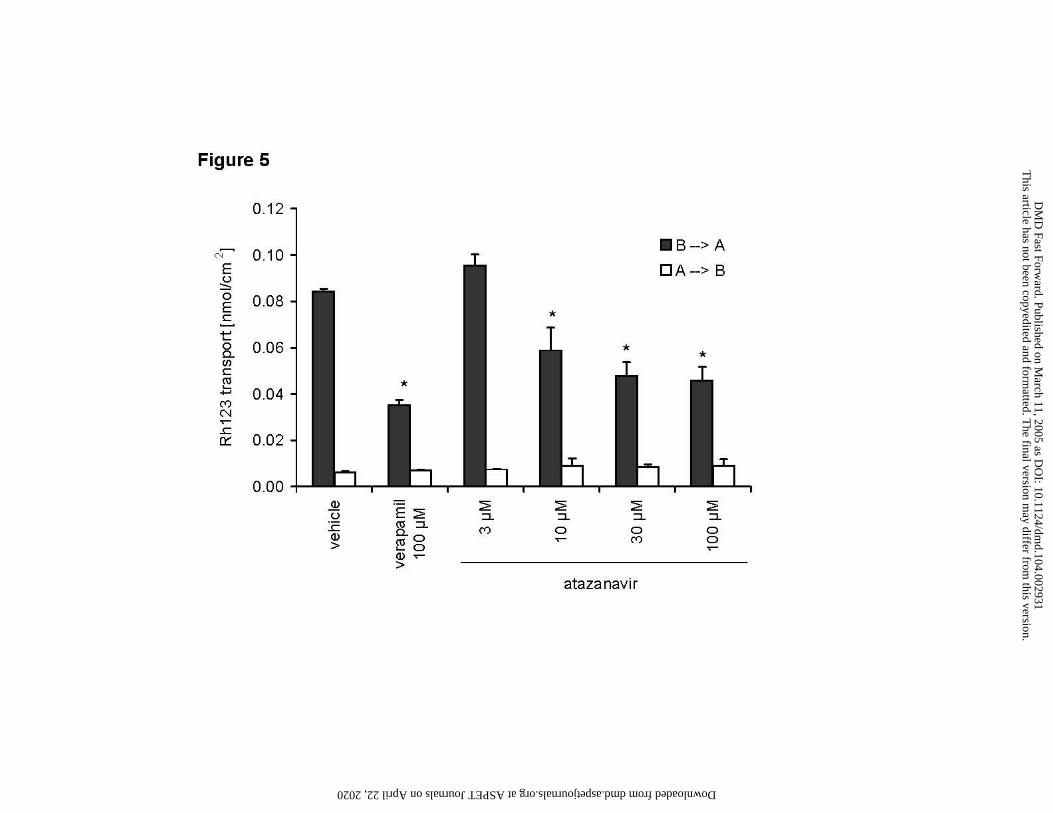
Inhibition of Rh123 transport by atazanavir in Caco-2 cells
Atazanavir was evaluated for its potential to inhibit P-gp mediated basolateral to apical
Rh123 transport across Caco-2 monolayers. Atazanavir (3 – 100 µM) caused a concentration
dependent reduction of basolateral to apical Rh123 transport, while apical to basolateral transport
remained unchanged (Figure 5). At the highest concentration tested (100 µM), atazanavir reduced
Rh123 transport to 54% of control, while the known P-gp inhibitor verapamil (100 µM) caused a
reduction to 42% of control under the same conditions.
P-gp modulation by atazanavir in relation to the effects of other HIV protease inhibitors
At a concentration of 10 µM, induction and inhibition of P-gp activity in LS180V cells by
atazanavir was compared to the effects of six other protease inhibitors (ritonavir, saquinavir,
indinavir, amprenavir, nelfinavir, and lopinavir) under the same conditions.
Induction of Rh123 efflux from LS180V cells
The most potent inducers of P-gp activity were ritonavir and nelfinavir, which decreased in
intracellular Rh123 accumulation to 30% and 32% of control, respectively, at 10 µM. The
inductive effect associated with extended exposure to atazanavir (53% of control) was
comparable to lopinavir (56%) and saquinavir (58%). Indinavir showed a slightly weaker effect
with a reduction to only 66% of control values. The observed effects were reversed by acute
exposure to the P-gp inhibitor verapamil (100 µM), which restored intracellular Rh123
concentrations to 1.2- to 1.7-fold of control values (Figure 6). Amprenavir, the seventh HIV
protease inhibitor currently available for clinical use, showed an atypical response in this
extended exposure experiment, resulting in a 2-fold increase in intracellular Rh123 (data not
This article has not been copyedited and formatted. The final version may differ from this version.DMD Fast Forward. Published on March 11, 2005 as DOI: 10.1124/dmd.104.002931
at ASPE
T Journals on A
pril 22, 2020dm
d.aspetjournals.orgD
ownloaded from

DMD/2004/2931 14
shown). Increasing the number of MEM washes did not affect the atypical increase in Rh123
concentrations seen with amprenavir, which is contradictory to findings from western blot
analysis (Perloff et al., 2000) showing increased protein expression. The finding might be due to
incomplete removal of AMP by washing, or irreversible alterations of the P-gp protein during the
72 hour exposure leading to reduced activity.
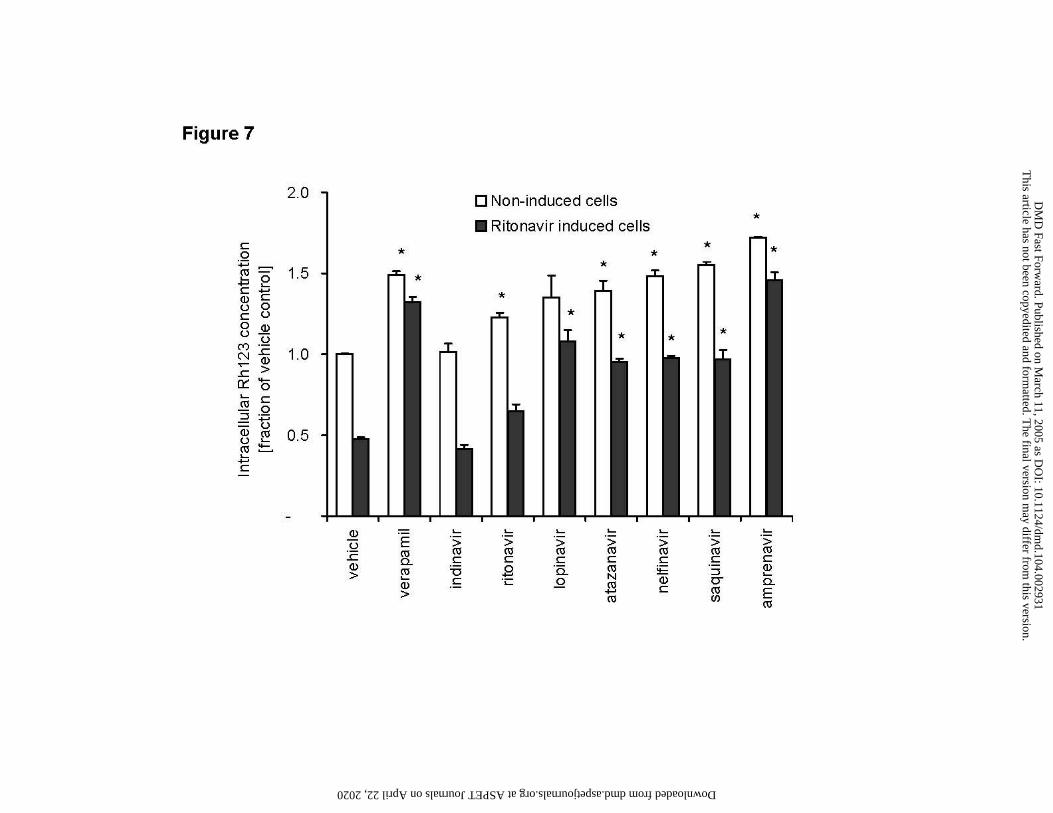
Inhibition of Rh123 efflux from LS180V cells
Indinavir was the only HIV protease inhibitor that did not cause any degree of P-gp
inhibition, with intracellular Rh123 concentrations comparable to those of vehicle controls, both
in non-induced and ritonavir induced LS180V cells (Figure 7). Of the remaining six compounds,
ritonavir appeared to be the weakest inhibitor. Acute ritonavir treatment (10 µM) caused a 20%
increase in intracellular Rh123 concentration in non-induced cells and did not completely reverse
the inductive effect caused by chronic ritonavir induction (Figure 7, solid bars). Atazanavir,
lopinavir, nelfinavir, and saquinavir showed a similar degree of inhibition with intracellular
Rh123 concentrations of 35% - 55% higher than vehicle control values. All four HIV protease
inhibitors were able to reverse the reduction in P-gp activity caused by the preceding ritonavir
induction resulting in Rh123 concentrations similar (95% - 108%) to those seen in vehicle treated
cells (Figure 7). The most potent inhibitor in this model was amprenavir, which caused a 72%
increase in Rh123 concentrations in non-induced cells and reversed ritonavir induction to values
substantially above control values (145% of vehicle controls).
Inhibition of CYP3A mediated metabolism in HLM by atazanavir
Atazanavir caused a concentration dependent inhibition of CYP3A. Without preincubation,
the formation of α-hydroxy-triazolam and 4-hydroxy-triazolam from triazolam (substrate
This article has not been copyedited and formatted. The final version may differ from this version.DMD Fast Forward. Published on March 11, 2005 as DOI: 10.1124/dmd.104.002931
at ASPE
T Journals on A
pril 22, 2020dm
d.aspetjournals.orgD
ownloaded from

DMD/2004/2931 15
concentration 250 µM) in HLM was reduced to 9% of control at an atazanavir concentration of
50 µM (Figure 8a, solid line), an effect comparable to that of 1 µM ketoconazole (Figure 8b, solid
line).
Preincubation of HLM with atazanavir (20 min) substantially increased the inhibitory
effect, suggesting that atazanavir inhibition of CYP3A may have a mechanism-based
(irreversible) component. As a result, a tenfold lower atazanavir concentration (5 µM) was
required to achieve maximal inhibition (6% of control) of CYP3A activity (Figure 8b, dashed
line). Mean IC50 values for atazanavir concentration versus triazolam-α-hydroxylation decreased
from 5.7 µM (SD 4.1 µM) to 0.31 µM (SD 0.13 µM) with preincubation. Preincubation did not
affect the inhibition caused by ketoconazole, with IC50 values of 0.18 µM (SD 0.14 µM) and 0.22
µM (SD 0.24 µM), respectively (Figure 8b, dashed line). IC50 values for atazanavir and
ketoconazole vs. triazolam-α-hydroxylation and triazolam-4-hydroxylation in 4 human livers are
reported in Table 1.
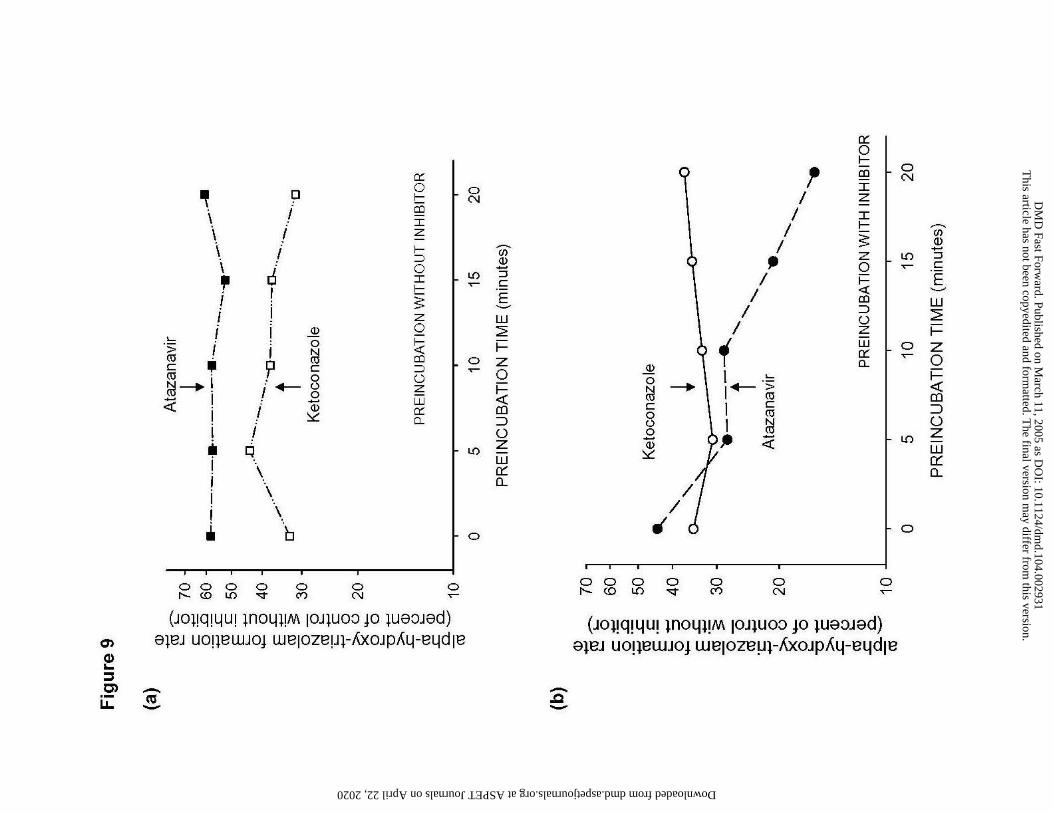
Additionally, the effect of increasing preincubation times for HLM with and without
inhibitor was evaluated in one human liver. Preincubation of HLM with cofactor alone at 37°C (5
-20 min) had no effect on the inhibition of CYP3A activity by atazanavir or ketoconazole (Figure
9a). Preincubation of HLM with atazanavir, however led to an increase in inhibitory effect with
increasing preincubation time (Figure 9b), consistent with the possibility that atazanavir acts as
an irreversible (mechanism based) inhibitor of CYP3A. No such effect was seen with the known
reversible CYP3A inhibitor ketoconazole.
This article has not been copyedited and formatted. The final version may differ from this version.DMD Fast Forward. Published on March 11, 2005 as DOI: 10.1124/dmd.104.002931
at ASPE
T Journals on A
pril 22, 2020dm
d.aspetjournals.orgD
ownloaded from
DMD/2004/2931 16
Discussion
The present in vitro study showed that atazanavir could significantly modulate P-
glycoprotein activity and expression, based on transport of the index substrate Rh123 in cell
culture. Additionally, atazanavir was shown to be an inhibitor of CYP3A activity in human liver
microsomes. Inhibitory potency was increased by preincubation, consistent with mechanism-
based inhibition, as is the case for a number of HIV protease inhibitors including ritonavir and
lopinavir (von Moltke et al., 2000; Weemhoff et al., 2003).
Expression of transporters other than P-gp, including MRP and dipeptide transporters (Li et
al., 2003) in Caco-2 cells, require the use of an index substrate that is relatively specific for the
transporter studied. The fluorescent dye Rh123 is frequently used as a P-gp index substrate. A
drug screen of the National Cancer Institute in 58 different cell lines showed a good correlation
of Rh123 transport with P-gp expression, while no correlation was found with the expression of
MRP in these cell lines (Lee et al., 1994). Experiments with our Caco-2 cell line (data not shown)
demonstrated that 2 mM probenecid and 100 µM indomethacin, both known inhibitors of MRP1,
did not inhibit Rh123 transport, thus eliminating MRP1 as a contributing factor to Rh123
transport. In LS180V cells, the effects of P-gp induction (extended exposure to 10 µM ritonavir)
and P-gp inhibition (acute exposure to 100 µM verapamil) were comparable between Rh123 and
diethyloxacarbocyanine iodide, a compound that is a substrate of P-gp but not MRP (Minderman
et al., 1996).
Both inductive and inhibitory effects by atazanavir on Rh123 transport in vitro were
concentration dependent in the range of 3 – 100 µM. The inhibitory effect of atazanavir on
triazolam hydroxylation occurred at tenfold lower concentrations, with a mean IC50 value of 0.3
µM for mechanism-based inhibition. Since antiretroviral drugs are used in combination therapy,
This article has not been copyedited and formatted. The final version may differ from this version.DMD Fast Forward. Published on March 11, 2005 as DOI: 10.1124/dmd.104.002931
at ASPE
T Journals on A
pril 22, 2020dm
d.aspetjournals.orgD
ownloaded from
DMD/2004/2931 17
the effect of atazanavir inhibitors on LS180V cells pretreated with a P-gp inducer (10 µM
ritonavir) was also tested. Atazanavir increased intracellular Rh123 accumulation and reversed
the inductive effect caused by extended ritonavir exposure.
Peak plasma concentrations of atazanavir are usually in the range of 2.9-5.9 µg/L
(approximately 4-8 µM) (Goldsmith and Perry, 2003), and concentrations in the intestine after
oral administration of therapeutic atazanavir doses (400 mg) will substantially exceed plasma
concentrations and may reach millimolar levels. Considering those in vivo atazanavir
concentrations, these data suggest a potential for atazanavir to cause drug interactions at the level
of both P-gp mediated drug transport and enteric CYP3A mediated drug metabolism. Plasma
concentration of atazanavir are likely to be sufficient to cause inhibition of CYP3A mediated
hepatic metabolism as well; however, the effects of atazanavir on P-gp activity are probably
limited to the intestine, where drug concentrations are higher. The inhibition of P-gp transport
and CYP3A metabolism would explain the recent finding that addition of atazanavir to a regimen
of saquinavir and ritonavir resulted in a 60% and 40% increase of saquinavir and ritonavir AUC
values, respectively (Boffito et al., 2004). Compared to the effects of the other six HIV protease
inhibitors on P-gp activity in LS180V cells, atazanavir appears to be comparable to saquinavir
and lopinavir with respect to both induction and inhibition of Rh123 transport in LS180V cells.
While no previous data is available for atazanavir, P-gp induction and inhibition have been
reported for other protease inhibitors (Profit et al., 1999; Perloff et al., 2000, 2001, 2002; Perloff
et al., 2001; Perloff et al., 2002; Vishnuvardhan et al., 2003). IC50 values have been reported as
6.7 µM for ritonavir (Perloff et al., 2002), and 1.7 µM for lopinavir (Vishnuvardhan et al., 2003)
in Caco-2 cells, indicating more potent P-gp inhibition. Profit et al. tested four protease inhibitors
for P-gp inhibition and found indinavir to have no effect, nelfinavir to cause moderate inhibition,
This article has not been copyedited and formatted. The final version may differ from this version.DMD Fast Forward. Published on March 11, 2005 as DOI: 10.1124/dmd.104.002931
at ASPE
T Journals on A
pril 22, 2020dm
d.aspetjournals.orgD
ownloaded from
DMD/2004/2931 18
and saquinavir and ritonavir to be potent inhibitors of Rh123 transport in Caco-2 cells (Profit et
al., 1999). In our LS180V cell model, we found similar relative inhibition by indinavir (none),
nelfinavir (moderate), and saquinavir (potent); however, ritonavir appears to be only a moderate
inhibitor in this model. It should be noted that although the effects of atazanavir in this study fell
within the range observed for other HIV-protease inhibitors, unexpected yet clinically important
distinct drug interactions associated with atazanavir cannot be excluded.
While several clinical studies have investigated the effects of comedications on atazanavir
pharmacokinetics (Goldsmith and Perry, 2003), little information is available on the effects of
atazanavir on the pharmacokinetics of other drugs. Studies investigating the potential for CYP
induction by atazanavir would provide additional information about its potential for causing drug
interactions, since concomitant induction and inhibition of P-gp and CYP may result in dose-
dependent as well as time-dependent clinical effects. Additionally, a potential interplay has been
suggested between metabolic enzymes and transporters that could confound in vitro predictions
of drug interactions (Benet et al., 2003). Therefore, clinical drug interaction studies testing
atazanavir together with drugs that are selective substrates of P-gp and CYP3A, respectively, are
needed to evaluate the clinical relevance of these in vitro findings.
In conclusion, atazanavir is capable of altering both P-gp and CYP3A activity in vitro.
Atazanavir induces P-gp activity and expression, inhibits P-gp mediated Rh123 transport, and
acts as a potent mechanism-based inhibitor of CYP3A activity at clinically relevant
concentrations.
This article has not been copyedited and formatted. The final version may differ from this version.DMD Fast Forward. Published on March 11, 2005 as DOI: 10.1124/dmd.104.002931
at ASPE
T Journals on A
pril 22, 2020dm
d.aspetjournals.orgD
ownloaded from
DMD/2004/2931 19
References Artursson P, Palm K and Luthman K (1996) Caco-2 monolayers in experimental and theoretical
predictions of drug transport. Adv Drug Deliv Rev 22:67-84.
Benet LZ, Cummins CL and Wu CY (2003) Transporter-enzyme interactions: implications for predicting drug-drug interactions from in vitro data. Curr Drug Metab 4:393-398.
Boffito M, Kurowski M, Kruse G, Hill A, Benzie AA, Nelson MR, Moyle GJ, Gazzard BG and Pozniak AL (2004) Atazanavir enhances saquinavir hard-gel concentrations in a ritonavir-boosted once-daily regimen. AIDS 18:1291-1297.
Colonno R, Rose R, McLaren C, Thiry A, Parkin N and Friborg J (2004) Identification of I50L as the signature atazanavir (ATV)-resistance mutation in treatment-naive HIV-1-infected patients receiving ATV-containing regimens. J Infect Dis 189:1802-1810.
de Maat MM, Ekhart GC, Huitema AD, Koks CH, Mulder JW and Beijnen JH (2003) Drug interactions between antiretroviral drugs and comedicated agents. Clin Pharmacokinet 42:223-282.
Goldsmith DR and Perry CM (2003) Atazanavir. Drugs 63:1679-1693.
Greenblatt DJ, von Moltke LL, Harmatz JS, Chen G, Weemhoff JL, Jen C, Kelley CJ, LeDuc BW and Zinny MA (2003) Time course of recovery of cytochrome P450 3A function after single doses of grapefruit juice. Clin Pharmacol Ther 74:121-129.
Haas DW, Zala C, Schrader S, Piliero P, Jaeger H, Nunes D, Thiry A, Schnittman S and Sension M (2003) Therapy with atazanavir plus saquinavir in patients failing highly active antiretroviral therapy: a randomized comparative pilot trial. AIDS 17:1339-1349.
Havlir DV and O'Marro SD (2004) Atazanavir: new option for treatment of HIV infection. Clin Infect Dis 38:1599-1604.
Herzog CE, Tsokos M, Bates SE and Fojo AT (1993) Increased mdr-1/P-glycoprotein expression after treatment of human colon carcinoma cells with P-glycoprotein antagonists. J Biol Chem 268:2946-2952.
Kim RB, Fromm MF, Wandel C, Leake B, Wood AJ, Roden DM and Wilkinson GR (1998) The drug transporter P-glycoprotein limits oral absorption and brain entry of HIV-1 protease inhibitors. J Clin Invest 101:289-294.
Lee JS, Paull K, Alvarez M, Hose C, Monks A, Grever M, Fojo AT and Bates SE (1994) Rhodamine efflux patterns predict P-glycoprotein substrates in the National Cancer Institute drug screen. Mol Pharmacol 46:627-638.
Li Q, Sai Y, Kato Y, Tamai I and Tsuji A (2003) Influence of drugs and nutrients on transporter gene expression levels in Caco-2 and LS180 intestinal epithelial cell lines. Pharm Res 20:1119-1124.
This article has not been copyedited and formatted. The final version may differ from this version.DMD Fast Forward. Published on March 11, 2005 as DOI: 10.1124/dmd.104.002931
at ASPE
T Journals on A
pril 22, 2020dm
d.aspetjournals.orgD
ownloaded from
DMD/2004/2931 20
Minderman H, Vanhoefer U, Toth K, Yin MB, Minderman MD, Wrzosek C, Slovak ML and Rustum YM (1996) DiOC2(3) is not a substrate for multidrug resistance protein (MRP)-mediated drug efflux. Cytometry 25:14-20.
Musial BL, Chojnacki JK and Coleman CI (2004) Atazanavir: a new protease inhibitor to treat HIV infection. Am J Health Syst Pharm 61:1365-1374.
Orrick JJ and Steinhart CR (2004) Atazanavir. Ann Pharmacother 38:1664-1674.
Perloff MD, Störmer E, von Moltke LL and Greenblatt DJ (2003) Rapid assessment of P-glycoprotein inhibition and induction in vitro. Pharm Res 20:1177-1183.
Perloff MD, von Moltke LL, Fahey JM, Daily JP and Greenblatt DJ (2000) Induction of P-glycoprotein expression by HIV protease inhibitors in cell culture. AIDS 14:1287-1289.
Perloff MD, von Moltke LL and Greenblatt DJ (2002) Fexofenadine transport in Caco-2 cells: inhibition with verapamil and ritonavir. J Clin Pharmacol 42:1269-1274.
Perloff MD, Von Moltke LL, Marchand JE and Greenblatt DJ (2001) Ritonavir induces P-glycoprotein expression, multidrug resistance-associated protein (MRP1) expression, and drug transporter-mediated activity in a human intestinal cell line. J Pharm Sci 90:1829-1837.
Piliero PJ. (2002) Atazanavir: a novel HIV-1 protease inhibitor. Expert Opin Investig Drugs
11:1295-1301.
Pinto M, Robine-Leon S, Appay M, Kedinger M, Triadou N, Dussaulx E, Lacroix B, Simon-Assmann P, Haffen K, Fogh J and Zweibaum A (1983) Enterocyte-like differentiation and polarisation of the human colon carcinoma cell line Caco-2 in culture. Biol Cell 47:323-330.
Profit L, Eagling VA and Back DJ (1999) Modulation of P-glycoprotein function in human lymphocytes and Caco-2 cell monolayers by HIV-1 protease inhibitors. AIDS 13:1623-1627.
Quaroni A and Hochman J (1996) Developement of intestinal cell culture models for drug transport and metabolism studies. Adv Drug Deliv Rev 22:3-52.
Robinson BS, Riccardi KA, Gong YF, Guo Q, Stock DA, Blair WS, Terry BJ, Deminie CA, Djang F, Colonno RJ and Lin PF (2000) BMS-232632, a highly potent human immunodeficiency virus protease inhibitor that can be used in combination with other available antiretroviral agents. Antimicrob Agents Chemother 44:2093-2099.
Schuetz EG, Beck WT and Schuetz JD (1996) Modulators and substrates of P-glycoprotein and cytochrome P4503A coordinately up-regulate these proteins in human colon carcinoma cells. Mol Pharmacol 49:311-318.
This article has not been copyedited and formatted. The final version may differ from this version.DMD Fast Forward. Published on March 11, 2005 as DOI: 10.1124/dmd.104.002931
at ASPE
T Journals on A
pril 22, 2020dm
d.aspetjournals.orgD
ownloaded from
DMD/2004/2931 21
Squires K, Lazzarin A, Gatell JM, Powderly WG, Pokrovskiy V, Delfraissy JF, Jemsek J, Rivero A, Rozenbaum W, Schrader S, Sension M, Vibhagool A, Thiry A and Giordano M (2004) Comparison of once-daily atazanavir with efavirenz, each in combination with fixed-dose zidovudine and lamivudine, as initial therapy for patients infected with HIV. J Acquir Immune Defic Syndr 36:1011-1019.
Störmer E, von Moltke LL, Perloff MD and Greenblatt DJ (2002) Differential modulation of P-glycoprotein expression and activity by non-nucleoside HIV-1 reverse transcriptase inhibitors in cell culture. Pharm Res 19:1038-1045.
Vishnuvardhan D, von Moltke LL, Richert C and Greenblatt DJ (2003) Lopinavir: Acute exposure inhibits p-glycoprotein; extended exposure induces P-glycoprotein. AIDS 17:1092-1094.
von Moltke LL, Durol AL, Duan SX and Greenblatt DJ (2000) Potent mechanism-based inhibition of human CYP3A in vitro by amprenavir and ritonavir: comparison with ketoconazole. Eur J Clin Pharmacol 56:259-261.
von Moltke LL, Greenblatt DJ, Duan SX, Harmatz JS and Shader RI (1998a) Inhibition of triazolam hydroxylation by ketoconazole, itraconazole, hydroxyitraconazole and fluconazole in-vitro. Pharm Pharmacol Commun 4:443-445.
von Moltke LL, Greenblatt DJ, Granda BW, Giancarlo GM, Duan SX, Daily JP, Harmatz JS and Shader RI (2001) Inhibition of human cytochrome P450 isoforms by nonnucleoside reverse transcriptase inhibitors. J Clin Pharmacol 41:85-91.
von Moltke LL, Greenblatt DJ, Grassi JM, Granda BW, Duan SX, Fogelman SM, Daily JP, Harmatz JS and Shader RI (1998b) Protease inhibitors as inhibitors of human cytochromes P450: high risk associated with ritonavir. J Clin Pharmacol 38:106-111.
von Moltke LL, Greenblatt DJ, Harmatz JS and Shader RI (1993) Alprazolam metabolism in vitro: Studies of human, monkey, mouse and rat liver microsomes. Pharmacology 47:268-276.
Weemhoff JL, von Moltke LL, Richert C, Hesse LM, Harmatz JS and Greenblatt DJ (2003) Apparent mechanism-based inhibition of human CYP3A in-vitro by lopinavir. J Pharm Pharmacol 55:381-386.
This article has not been copyedited and formatted. The final version may differ from this version.DMD Fast Forward. Published on March 11, 2005 as DOI: 10.1124/dmd.104.002931
at ASPE
T Journals on A
pril 22, 2020dm
d.aspetjournals.orgD
ownloaded from
DMD/2004/2931 22
Footnotes:
* Financial support: This work was supported by grants AI-58784, MH-58435, DA-13209, DA-58435, DA-13834, AT-01381, DA-05258, AG-17880, and RR-00054 by the U.S. Department of Health and Human Services. Address for reprint requests: David J. Greenblatt, M.D. Department of Pharmacology and Experimental Therapeutics Tufts University School of Medicine 136 Harrison Avenue Boston, MA 02111 U.S.A. Phone: +1-617-636-6997 Fax: +1-617-636-6738 email: [email protected]
This article has not been copyedited and formatted. The final version may differ from this version.DMD Fast Forward. Published on March 11, 2005 as DOI: 10.1124/dmd.104.002931
at ASPE
T Journals on A
pril 22, 2020dm
d.aspetjournals.orgD
ownloaded from

DMD/2004/2931 23
Figure legends
Figure 1
Induction of P-gp activity by atazanavir
Intracellular Rh123 accumulation in LS180V cells after extended (3 day) exposure to vehicle,
atazanavir, and ritonavir, and reversal of the effect by acute (2 hour) exposure to verapamil (100
µM)
Solid bars: induction followed by 2-hour exposure to vehicle (media with 0.5% DMSO)
Open bars: induction followed by 2-hour exposure to verapamil (100 µM)
Data are means ± SD of duplicate samples. Values are fractions of vehicle control. Asterisk (*)
indicates significant difference (p < 0.05, Student’s t-test) compared to corresponding vehicle
control in the same category. Absolute value of vehicle control was 21 pmol Rh123/mg protein.
Figure 2
Induction of P-gp expression by atazanavir
Immunoreactive P-gp protein in LS180V cells after extended (3 day) exposure to vehicle,
atazanavir, and ritonavir
a) Western blot images
b) Results of quantitative image analysis
Data are means ± SD of triplicate samples. Asterisk (*) indicates significant difference (p < 0.05)
compared to corresponding vehicle. The calibration curve was generated using ritonavir-induced
LS180V cell preparations.
Figure 3
Inhibition of P-gp activity by atazanavir and reversal of induction by ritonavir
This article has not been copyedited and formatted. The final version may differ from this version.DMD Fast Forward. Published on March 11, 2005 as DOI: 10.1124/dmd.104.002931
at ASPE
T Journals on A
pril 22, 2020dm
d.aspetjournals.orgD
ownloaded from
DMD/2004/2931 24
Intracellular Rh123 accumulation in LS180V cells after acute (2 hour) exposure to atazanavir (3 -
100 µM), and verapamil (100 µM)
Open bars: non-induced LS180V cells
Solid bars: ritonavir induced LS180V cells
Data are means ± SD of duplicate samples. Values are fractions of vehicle control. Asterisk (*)
indicates significant difference (p < 0.05) compared to corresponding vehicle control in the same
category. Absolute value of vehicle control was 7.3 pmol Rh123/mg protein.
Figure 4
Concentration dependent reversal of atazanavir and ritonavir mediated P-gp induction by
verapamil
Intracellular Rh123 accumulation in LS180V cells after extended (3 day) exposure to increasing
concentrations of
(a) Atazanavir, or
(b) Ritonavir,
and reversal of the effect by acute (2 hour) exposure to increasing concentrations of verapamil
Data are means of duplicate samples. Values are fractions of vehicle control. Absolute value of
vehicle control was 21 pmol Rh123/mg protein for atazanavir (a) and 19.6 pmol Rh123 for
ritonavir (b).
Figure 5
Inhibition of P-gp activity by atazanavir in Caco-2 cell monolayers
Effects of atazanavir (3 – 100 µM), and verapamil (100 µM) on the differential transport of
Rh123 in Caco-2 cell monolayers.
This article has not been copyedited and formatted. The final version may differ from this version.DMD Fast Forward. Published on March 11, 2005 as DOI: 10.1124/dmd.104.002931
at ASPE
T Journals on A
pril 22, 2020dm
d.aspetjournals.orgD
ownloaded from
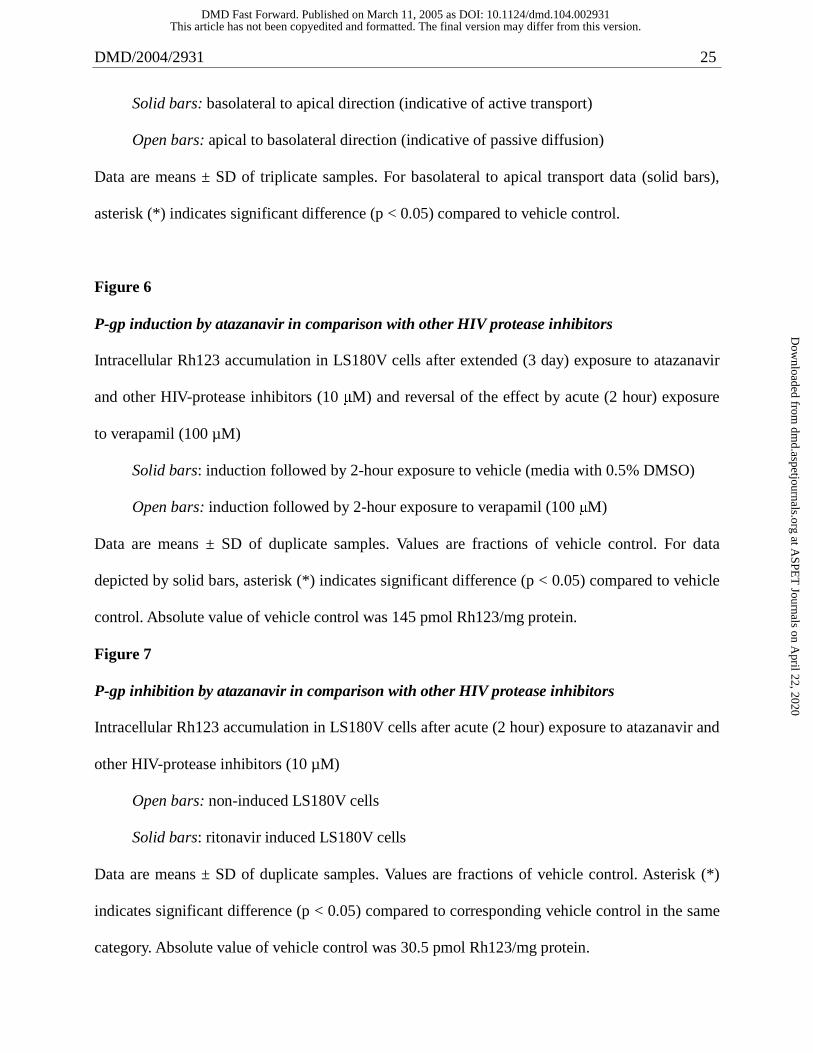
DMD/2004/2931 25
Solid bars: basolateral to apical direction (indicative of active transport)
Open bars: apical to basolateral direction (indicative of passive diffusion)
Data are means ± SD of triplicate samples. For basolateral to apical transport data (solid bars),
asterisk (*) indicates significant difference (p < 0.05) compared to vehicle control.
Figure 6
P-gp induction by atazanavir in comparison with other HIV protease inhibitors
Intracellular Rh123 accumulation in LS180V cells after extended (3 day) exposure to atazanavir
and other HIV-protease inhibitors (10 µM) and reversal of the effect by acute (2 hour) exposure
to verapamil (100 µM)
Solid bars: induction followed by 2-hour exposure to vehicle (media with 0.5% DMSO)
Open bars: induction followed by 2-hour exposure to verapamil (100 µM)
Data are means ± SD of duplicate samples. Values are fractions of vehicle control. For data
depicted by solid bars, asterisk (*) indicates significant difference (p < 0.05) compared to vehicle
control. Absolute value of vehicle control was 145 pmol Rh123/mg protein.
Figure 7
P-gp inhibition by atazanavir in comparison with other HIV protease inhibitors
Intracellular Rh123 accumulation in LS180V cells after acute (2 hour) exposure to atazanavir and
other HIV-protease inhibitors (10 µM)
Open bars: non-induced LS180V cells
Solid bars: ritonavir induced LS180V cells
Data are means ± SD of duplicate samples. Values are fractions of vehicle control. Asterisk (*)
indicates significant difference (p < 0.05) compared to corresponding vehicle control in the same
category. Absolute value of vehicle control was 30.5 pmol Rh123/mg protein.
This article has not been copyedited and formatted. The final version may differ from this version.DMD Fast Forward. Published on March 11, 2005 as DOI: 10.1124/dmd.104.002931
at ASPE
T Journals on A
pril 22, 2020dm
d.aspetjournals.orgD
ownloaded from
DMD/2004/2931 26
Figure 8
Inhibition of CYP3A activity by atazanavir
Formation rates of α-hydroxytriazolam from triazolam (250 µM) in human liver microsomes
with increasing concentration of inhibitor.
(a) Atazanavir: with 20 min pre-incubation (0.1 – 5 µM, dashed line) and without
preincubation (1 – 50 µM, solid line)
(b) Ketoconazole (0.05 – 1 µM): with 20 min preincubation (dashed line) and without pre-
incubation (solid line)
Values are percent of controls without inhibitors. Data are means ± SEM of 4 human livers. IC50
values are reported in Table 1.
Figure 9
Effect of pre-incubation time on the inhibition of CYP3A activity by atazanavir
Formation rates of α-hydroxytriazolam from triazolam (250 µM) in human liver microsomes
with increasing preincubation time.
(a) Preincubation of HLM without inhibitors followed by with atazanavir (2.5 µM, filled
symbols), or ketoconazole (0.1 µM, open symbols)
(b) Preincubation of HLM with inhibitors (atazanavir 2.5 µM; ketoconazole 0.1 µM)
followed by the standard incubation procedure with atazanavir (2.5 µM, filled
symbols), or ketoconazole (0.1 µM, open symbols)
Values are percent of controls without inhibitors. Data are single observations determined in one
human liver (HL03).
This article has not been copyedited and formatted. The final version may differ from this version.DMD Fast Forward. Published on March 11, 2005 as DOI: 10.1124/dmd.104.002931
at ASPE
T Journals on A
pril 22, 2020dm
d.aspetjournals.orgD
ownloaded from

DMD/2004/2931 27
Table 1
IC50 values for atazanavir and ketoconazole vs. triazolam hydroxylation in HLM
IC50 values [µM]
HL01 HL02 HL03 HL04 Mean SD
Triazolam-α-hydroxylation
Atazanavir
without preincubation 5.11 11.63 2.52 3.47 5.68 4.11
with 20 min preincubation 0.22 0.49 0.32 0.22 0.31 0.13
Ketoconazole
without preincubation 0.11 0.34 0.08 0.06 0.15 0.13
with 20 min preincubation 0.08 0.58 0.12 0.09 0.22 0.24
Triazolam-4-hydroxylation
Atazanavir
without preincubation 6.88 8.73 2.51 3.08 5.30 3.00
with 20 min preincubation 0.20 0.36 0.30 0.19 0.26 0.08
Ketoconazole
without preincubation 0.12 0.43 0.08 0.05 0.17 0.18
with 20 min preincubation 0.10 0.50 0.13 0.09 0.21 0.20
This article has not been copyedited and formatted. The final version may differ from this version.DMD Fast Forward. Published on March 11, 2005 as DOI: 10.1124/dmd.104.002931
at ASPE
T Journals on A
pril 22, 2020dm
d.aspetjournals.orgD
ownloaded from
This article has not been copyedited and form
atted. The final version m
ay differ from this version.
DM
D Fast Forw
ard. Published on March 11, 2005 as D
OI: 10.1124/dm
d.104.002931 at ASPET Journals on April 22, 2020 dmd.aspetjournals.org Downloaded from
This article has not been copyedited and form
atted. The final version m
ay differ from this version.
DM
D Fast Forw
ard. Published on March 11, 2005 as D
OI: 10.1124/dm
d.104.002931 at ASPET Journals on April 22, 2020 dmd.aspetjournals.org Downloaded from
This article has not been copyedited and form
atted. The final version m
ay differ from this version.
DM
D Fast Forw
ard. Published on March 11, 2005 as D
OI: 10.1124/dm
d.104.002931 at ASPET Journals on April 22, 2020 dmd.aspetjournals.org Downloaded from
This article has not been copyedited and form
atted. The final version m
ay differ from this version.
DM
D Fast Forw
ard. Published on March 11, 2005 as D
OI: 10.1124/dm
d.104.002931 at ASPET Journals on April 22, 2020 dmd.aspetjournals.org Downloaded from
This article has not been copyedited and form
atted. The final version m
ay differ from this version.
DM
D Fast Forw
ard. Published on March 11, 2005 as D
OI: 10.1124/dm
d.104.002931 at ASPET Journals on April 22, 2020 dmd.aspetjournals.org Downloaded from

This article has not been copyedited and form
atted. The final version m
ay differ from this version.
DM
D Fast Forw
ard. Published on March 11, 2005 as D
OI: 10.1124/dm
d.104.002931 at ASPET Journals on April 22, 2020 dmd.aspetjournals.org Downloaded from
This article has not been copyedited and form
atted. The final version m
ay differ from this version.
DM
D Fast Forw
ard. Published on March 11, 2005 as D
OI: 10.1124/dm
d.104.002931 at ASPET Journals on April 22, 2020 dmd.aspetjournals.org Downloaded from

This article has not been copyedited and form
atted. The final version m
ay differ from this version.
DM
D Fast Forw
ard. Published on March 11, 2005 as D
OI: 10.1124/dm
d.104.002931 at ASPET Journals on April 22, 2020 dmd.aspetjournals.org Downloaded from
This article has not been copyedited and form
atted. The final version m
ay differ from this version.
DM
D Fast Forw
ard. Published on March 11, 2005 as D
OI: 10.1124/dm
d.104.002931 at ASPET Journals on April 22, 2020 dmd.aspetjournals.org Downloaded from