Embed Size (px)
Citation preview
UNITED STATESSECURITIES AND EXCHANGE COMMISSION
Washington, D.C. 20549
FORM 20-FANNUAL REPORT PURSUANT TO SECTION 13 OR 15(d)
OF THE SECURITIES EXCHANGE ACT OF 1934for the fiscal year ended: December 31, 2014
Commission file number: 001-36671
Atento S.A.(Exact name of Registrant as specified in its charter)
Atento S.A.(Exact name of Registrant’s name into English)
Grand Duchy of Luxembourg(Jurisdiction of incorporation or organization)
4 rue Lou Hemmer, L - 1748 Luxembourg FindelGrand Duchy of Luxembourg(Address of principal executive offices)
Mauricio Teles Montilha, Chief Financial OfficerAddress: Avenida das Nações Unidas, 14.171, 2º andar, Rochaverá, Ebony Tower, 04794-000, São Paulo, Brasil
Telephone No.: +55 (11) 3779-0881e-mail: [email protected]
(Name, Telephone, E-mail and/or Facsimile number and Address of Company Contact Person)
Securities registered or to be registered pursuant to Section 12(b) of the Act:Title of each class Name of each exchange on which registered
Ordinary Shares, no par value New York Stock ExchangeSecurities registered or to be registered pursuant to Section 12(g) of the Act:
None(Title of Class)
Securities for which there is a reporting obligation pursuant to Section 15(d) of the Act:None
(Title of Class)
Indicate the number of outstanding shares of each of the issuer’s classes of capital stock or common stock as of the close of the periodcovered by the annual report.
73,619,511 ordinary sharesIndicate by check mark if the registrant is a well-known seasoned issuer, as defined in Rule 405 of the Securities Act.
‘ Yes È NoIf this report is an annual or transition report, indicate by check mark if the registrant is not required to file reports pursuant to Section 13 or15(d) of the Securities Exchange Act of 1934.
‘ Yes È NoIndicate by check mark whether the registrant (1) has filed all reports required to be filed by Section 13 or 15(d) of the Securities ExchangeAct of 1934 during the preceding 12 months (or for such shorter period that the registrant was required to file such reports), and (2) hasbeen subject to such filing requirements for the past 90 days.
È Yes ‘ NoIndicate by check mark whether the registrant has submitted electronically and posted on its corporate Web site, if any, every InteractiveData File required to be submitted and posted pursuant to Rule 405 of Regulation S-T during the preceding 12 months (or for such shorterperiod that the registrant was required to submit and post such files).
È Yes ‘ NoIndicate by check mark whether the registrant is a large accelerated filer, an accelerated filer, or a non-accelerated filer. See definition of“accelerated filer and large accelerated filer” in Rule 12b-2 of the Exchange Act. (Check one):
Large accelerated filer ‘ Accelerated filer ‘ Non-accelerated filer È
Indicate by check mark which basis of accounting the registrant has used to prepare the financial statements included in this filing:US GAAP ‘ International Financial Reporting Standards as issued
by the International Accounting Standards Board ÈOther ‘
If “Other” has been checked in response to the previous question indicate by check mark which financial statement item the registrant haselected to follow.
‘ Item 17 ‘ Item 18If this is an annual report, indicate by check mark whether the registrant is a shell company (as defined in Rule 12b-2 of the Exchange Act).
‘ Yes È No
Atento S.A.TABLE OF CONTENTS
PRESENTATION OF FINANCIAL INFORMATION 4TRADEMARKS AND TRADE NAMES 5CAUTIONARY STATEMENT WITH RESPECT TO FORWARD-LOOKING STATEMENTS 5PART I 7ITEM 1. IDENTITY OF DIRECTORS, SENIOR MANAGEMENT AND ADVISERS 7
A. Directors and Senior Management 7B. Advisers 7C. Auditors 7
ITEM 2. OFFER STATISTICS AND EXPECTED TIMETABLE 7A. Offer Statistics 7B. Method and Expected Timetable 7
ITEM 3. KEY INFORMATION 7A. Selected Financial Data 7B. Capitalization and Indebtedness 14C. Reasons for the Offer and Use of Proceeds 14D. Risk Factors 14
ITEM 4. INFORMATION ON THE COMPANY 33A. History and Development of the Company 33B. Business Overview 35C. Organizational Structure 43D. Property, Plant and Equipment 43
ITEM 4A. UNRESOLVED STAFF COMMENTS 45ITEM 5. OPERATING AND FINANCIAL REVIEW AND PROSPECTS 45
A. Operating Results 47B. Liquidity and Capital Resources 61C. Research and Development, Patents and Licenses, etc. 70D. Trend Information 70E. Off-Balance Sheet Arrangements 71F. Tabular Disclosure of Contractual Obligations 72G. Safe harbor 72
ITEM 6. DIRECTORS, SENIOR MANAGEMENT AND EMPLOYEES 72A. Directors and Senior Management 72B. Compensation 76C. Board practices 77D. Employees 79E. Share Ownership 81
ITEM 7. MAJOR SHAREHOLDERS AND RELATED PARTY TRANSACTIONS 82A. Major Shareholders 82B. Related Party Transactions 84C. Interests of Experts and Counsel 87
ITEM 8. FINANCIAL INFORMATION 87A. Consolidated Statements and Other Financial Information 87B. Significant Changes 89
ITEM 9. THE OFFER AND LISTING 89A. Offering and Listing Details 89B. Plan of Distribution 89C. Markets 90D. Selling Shareholders 90E. Dilution 90F. Expenses of the Issue 90
ITEM 10. ADDITIONAL INFORMATION 90A. Share Capital 90B. Memorandum and Articles of Association 90C. Material Contracts 96D. Exchange Controls 97E. Taxation 97F. Dividends and Paying Agents 99
G. Statement by Experts 99H. Documents on Display 99I. Subsidiary Information 99
ITEM 11. QUANTITATIVE AND QUALITATIVE DISCLOSURES ABOUT MARKET RISK 100ITEM 12. DESCRIPTION OF SECURITIES OTHER THAN EQUITY SECURITIES 103
A. Debt Securities 103B. Warrants and Rights 103C. Other Securities 103D. American Depositary Shares 103
PART II 104ITEM 13. DEFAULTS, DIVIDEND ARREARAGES AND DELINQUENCIES 104ITEM 14. MATERIAL MODIFICATIONS TO THE RIGHTS OF SECURITY HOLDERS AND USE OF
PROCEEDS 104ITEM 15. CONTROLS AND PROCEDURES 104
A. Disclosure Controls and Procedures 104B. Management’s Annual Report on Internal Control over Financial Reporting 104C. Attestation Report of the Registered Public Accounting Firm 104D. Changes in Internal Control over Financial Reporting 104
ITEM 15T. CONTROLS AND PROCEDURES 104ITEM 16. [RESERVED] 104ITEM 16A. AUDIT COMMITTEE FINANCIAL EXPERT 104ITEM 16B. CODE OF ETHICS 104ITEM 16C. PRINCIPAL ACCOUNTANT FEES AND SERVICES 105ITEM 16D. EXEMPTIONS FROM THE LISTING STANDARDS FOR AUDIT COMMITTEE 105ITEM 16E. PURCHASES OF EQUITY SECURITIES BY THE ISSUER AND AFFILIATED
PURCHASERS 105ITEM 16F. CHANGE IN REGISTRANT’S CERTIFYING ACCOUNTANT 105ITEM 16G. CORPORATE GOVERNANCE 105ITEM 16H. MINE SAFETY DISCLOSURE 105PART III 106ITEM 17. FINANCIAL STATEMENTS 106ITEM 18. FINANCIAL STATEMENTS 106ITEM 19. EXHIBITS 106
PRESENTATION OF FINANCIAL AND OTHER INFORMATION
Basis of Presentation and Other Information
Except where the context otherwise requires or where otherwise indicated, the terms “Atento”, “we”, “us”,“our”, “the Company”, and “our business” refer to Atento S.A., a public limited liability company (sociétéanonyme) incorporated under the laws of Luxembourg on March 5, 2014, together with its consolidatedsubsidiaries.
“AIT Group” refers to Atento Inversiones Teleservicios S.A.U. and its subsidiaries (including AtentoVenezuela, S.A. and Teleatención de Venezuela, C.A.) as held by Telefónica, S.A. (together with its consolidatedsubsidiaries, “Telefónica” or the “Telefónica Group”) prior to the Acquisition. “Atento Group” refers to thedirect and indirect subsidiaries and assets of Atento Inversiones y Teleservicios, S.A.U. (excluding AtentoVenezuela, S.A. and Teleatención de Venezuela, C.A.) that were acquired indirectly by funds associated withBain Capital Partners, LLC (together with affiliates of such funds, “Bain Capital”) on December 12, 2012 (the“Acquisition”) through Atalaya Luxco Midco S.à.r.l. (the “Successor”) and certain of its affiliates. Use of theterm “Predecessor” refers to the Atento Group prior to the Acquisition, and use of the term “Atento” refers to theAtento Group subsequent to the Acquisition.
Atento S.A. was formed as a direct subsidiary of Atalaya Luxco Topco S.C.A. (“Topco”). In April 2014,Topco also incorporated Atalaya Luxco PIKCo S.C.A. (“PikCo”) and on May 15, 2014 Topco contributed toPikCo: (i) all of its equity interests in its then direct subsidiary, Atalaya Luxco Midco S.à.r.l. (“Midco”), theconsideration for which was an allocation to PikCo’s account “capital contributions not remunerated by shares”(the “Reserve Account”) equal to €2 million, resulting in Midco becoming a direct subsidiary of PikCo; and(ii) all of its debt interests in Midco (comprising three series of preferred equity certificates (the “Original LuxcoPECs”)), the consideration for which was the issuance by PikCo to Topco of preferred equity certificates havingan equivalent value. On May 30, 2014, Midco authorized the issuance of, and PikCo subscribed for, a fourthseries of preferred equity certificates (together with the Original Luxco PECs, the “Luxco PECs”).
In connection with the completion of Atento’s initial public offering (the “IPO”), Topco transferred itsentire interest in Midco (being €31,000 of share capital) to PikCo, the consideration for which was an allocationto PikCo’s Reserve Account equal to €31,000. PikCo then contributed (the “Contribution”) all of the LuxcoPECs to Midco, the consideration for which was an allocation to Midco’s Reserve Account equal to the value ofthe Luxco PECs immediately prior to the Contribution. Upon completion of the Contribution, the Luxco PECswere capitalized by Midco. PikCo then transferred the remainder of its interest in Midco (being €12,500 of sharecapital) to the Company, in consideration for which the Company issued two new shares of its capital stock toPikCo. The difference between the nominal value of these shares and the value of Midco’s net equity wasallocated to the Company’s share premium account. As a result of this transfer, Midco became a direct subsidiaryof Atento S.A. The Company completed a share split (the “Share Split”) whereby Atento issued approximately2,219.212 ordinary shares for each ordinary share outstanding as of September 3, 2014. The foregoing iscollectively referred as the “Reorganization Transaction”.
On October 7, 2014, upon the closing of our initial public offering, Atento issued 4,819,511 ordinary shareswithout nominal value at a price of $15.00 per share. As a result of the completion of the IPO, including theShare Split and the Reorganization Transaction, Atento has 73,619,511 ordinary shares outstanding and owns100% of the issued and outstanding share capital of Midco.
As mentioned above, pursuant to the implementation of the Reorganization Transaction Midco became awholly-owned subsidiary of Atento, which was a newly-formed company incorporated under the laws ofLuxembourg with nominal assets and liabilities for the purpose of facilitating the IPO, and did not conduct anyoperations prior to the completion of the IPO. Following the Reorganization Transaction and the IPO, Atento’sfinancial statements presented the consolidated results of Midco’s operations. The consolidated financialstatements of Midco are substantially the same as the consolidated financial statements of Atento after to theIPO, as adjusted for the Reorganization Transaction. Upon consummation, the Reorganization Transaction wasretroactively reflected in Atento’s calculations for earnings per share.
In this Annual Report, all references to “U.S. dollar” and “$” are to the lawful currency of the United Statesand all references to “euro” or “€” are to the single currency of the participating member states of the Europeanand Monetary Union of the Treaty Establishing the European Community, as amended from time to time. Inaddition, all references to Brazilian Reais (BRL), Mexican Peso (MXN), Chilean Peso (CLP), Argentinean Peso(ARS), Colombian Peso (COP) and Peruvian Nuevos Soles (PEN) are to the lawful currencies of Brazil, Mexico,Chile, Argentina, Colombia and Peru, respectively.
3
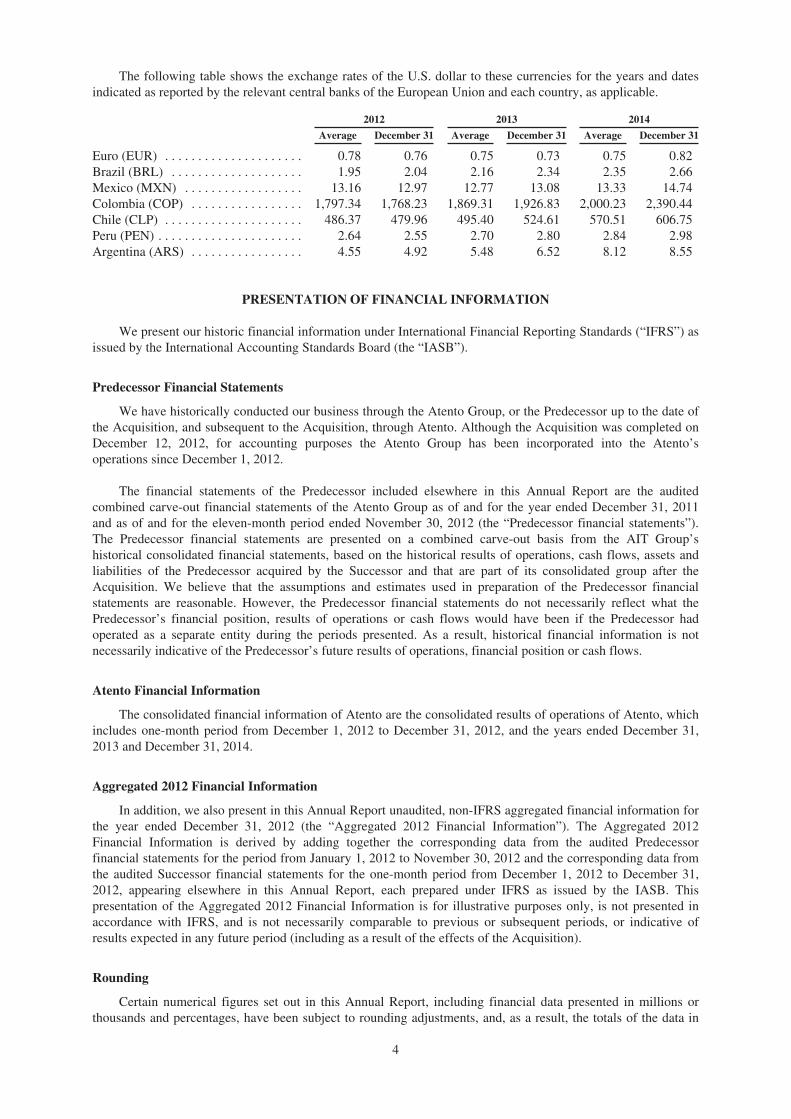
The following table shows the exchange rates of the U.S. dollar to these currencies for the years and datesindicated as reported by the relevant central banks of the European Union and each country, as applicable.
2012 2013 2014
Average December 31 Average December 31 Average December 31
Euro (EUR) . . . . . . . . . . . . . . . . . . . . . 0.78 0.76 0.75 0.73 0.75 0.82Brazil (BRL) . . . . . . . . . . . . . . . . . . . . 1.95 2.04 2.16 2.34 2.35 2.66Mexico (MXN) . . . . . . . . . . . . . . . . . . 13.16 12.97 12.77 13.08 13.33 14.74Colombia (COP) . . . . . . . . . . . . . . . . . 1,797.34 1,768.23 1,869.31 1,926.83 2,000.23 2,390.44Chile (CLP) . . . . . . . . . . . . . . . . . . . . . 486.37 479.96 495.40 524.61 570.51 606.75Peru (PEN) . . . . . . . . . . . . . . . . . . . . . . 2.64 2.55 2.70 2.80 2.84 2.98Argentina (ARS) . . . . . . . . . . . . . . . . . 4.55 4.92 5.48 6.52 8.12 8.55
PRESENTATION OF FINANCIAL INFORMATION
We present our historic financial information under International Financial Reporting Standards (“IFRS”) asissued by the International Accounting Standards Board (the “IASB”).
Predecessor Financial Statements
We have historically conducted our business through the Atento Group, or the Predecessor up to the date ofthe Acquisition, and subsequent to the Acquisition, through Atento. Although the Acquisition was completed onDecember 12, 2012, for accounting purposes the Atento Group has been incorporated into the Atento’soperations since December 1, 2012.
The financial statements of the Predecessor included elsewhere in this Annual Report are the auditedcombined carve-out financial statements of the Atento Group as of and for the year ended December 31, 2011and as of and for the eleven-month period ended November 30, 2012 (the “Predecessor financial statements”).The Predecessor financial statements are presented on a combined carve-out basis from the AIT Group’shistorical consolidated financial statements, based on the historical results of operations, cash flows, assets andliabilities of the Predecessor acquired by the Successor and that are part of its consolidated group after theAcquisition. We believe that the assumptions and estimates used in preparation of the Predecessor financialstatements are reasonable. However, the Predecessor financial statements do not necessarily reflect what thePredecessor’s financial position, results of operations or cash flows would have been if the Predecessor hadoperated as a separate entity during the periods presented. As a result, historical financial information is notnecessarily indicative of the Predecessor’s future results of operations, financial position or cash flows.
Atento Financial Information
The consolidated financial information of Atento are the consolidated results of operations of Atento, whichincludes one-month period from December 1, 2012 to December 31, 2012, and the years ended December 31,2013 and December 31, 2014.
Aggregated 2012 Financial Information
In addition, we also present in this Annual Report unaudited, non-IFRS aggregated financial information forthe year ended December 31, 2012 (the “Aggregated 2012 Financial Information”). The Aggregated 2012Financial Information is derived by adding together the corresponding data from the audited Predecessorfinancial statements for the period from January 1, 2012 to November 30, 2012 and the corresponding data fromthe audited Successor financial statements for the one-month period from December 1, 2012 to December 31,2012, appearing elsewhere in this Annual Report, each prepared under IFRS as issued by the IASB. Thispresentation of the Aggregated 2012 Financial Information is for illustrative purposes only, is not presented inaccordance with IFRS, and is not necessarily comparable to previous or subsequent periods, or indicative ofresults expected in any future period (including as a result of the effects of the Acquisition).
Rounding
Certain numerical figures set out in this Annual Report, including financial data presented in millions orthousands and percentages, have been subject to rounding adjustments, and, as a result, the totals of the data in
4
this Annual Report may vary slightly from the actual arithmetic totals of such information. Percentages andamounts reflecting changes over time periods relating to financial and other data set forth in “Selected HistoricalFinancial Information” and “Management’s Discussion and Analysis of Financial Condition and Results ofOperations” are calculated using the numerical data in the financial statements of the Predecessor or theSuccessor, or the tabular presentation of other data (subject to rounding) contained in this Annual Report, asapplicable, and not using the numerical data in the narrative description thereof.
TRADEMARKS AND TRADE NAMES
This Annual Report includes our trademarks as “Atento,” which are protected under applicable intellectualproperty laws and are the property of the Company or our subsidiaries. This Annual Report also containstrademarks, service marks, trade names and copyrights of other companies, which are the property of theirrespective owners. Solely for convenience, trademarks and trade names referred to in this Annual Report mayappear without the ® or TM symbols, but such references are not intended to indicate, in any way, that we will notassert, to the fullest extent under applicable law, our rights or the right of the applicable licensor to thesetrademarks and trade names.
CAUTIONARY STATEMENT WITH RESPECT TO FORWARD-LOOKING STATEMENTS
This Annual Report contains estimates and forward-looking statements, principally in “Item 3. KeyInformation—D. Risk Factors”, “Item 4. Information on the Company—B. Business Overview” and “Item 5.Operating and Financial Review and Prospects”. Some of the matters discussed concerning our businessoperations and financial performance include estimates and forward-looking statements within the meaning ofthe U.S. Private Securities Litigation Reform Act of 1995.
Our estimates and forward-looking statements are based mainly on our current expectations and estimateson projections of future events and trends, which affect or may affect our businesses and results of operations.Although we believe that these estimates and forward-looking statements are based upon reasonableassumptions, they are subject to certain risks and uncertainties and are made in light of information currentlyavailable to us. Our estimates and forward-looking statements may be influenced by the following factors, amongothers:
• the competitiveness of the customer relationship management and business process (“CRM BPO”)market;
• the loss of one or more of our major clients, a small number of which account for a significant portionof our revenue, in particular Telefónica;
• risks associated with operating in Latin America, where a significant proportion of our revenue isderived and where a large number of our employees are based;
• our clients deciding to enter or further expand their own CRM BPO businesses in the future;
• any deterioration in global markets and general economic conditions, in particular in Latin Americaand in the telecommunications and the financial services industries from which we derive most of ourrevenue;
• increases in employee benefits expenses, changes to labor laws and labor relations;
• failure to attract and retain enough sufficiently trained employees at our service delivery centers tosupport our operations;
• inability to maintain our pricing and level of activity and control our costs;
• consolidation of potential users of CRM BPO services;
• the reversal of current trends towards CRM BPO solutions;
• fluctuations of our operating results from one quarter to the next due to various factors includingseasonality;
• the significant leverage our clients have over our business relationships;
• the departure of key personnel or challenges with respect to labor relations;
• the long selling and implementation cycle for CRM BPO services;
5
• difficulty controlling our growth and updating our internal operational and financial systems as a resultof our increased size;
• inability to fund our working capital requirements and new investments;
• fluctuations in, or devaluation of, the local currencies in the countries in which we operate against ourreporting currency, the U.S. dollars;
• current political and economic volatility, particularly in Brazil, Mexico, Argentina and Europe;
• our ability to acquire and integrate companies that complement our business;
• technology’s quality and reliability provided by our technology and telecommunications providers, ourreliance on a limited number of suppliers of such technology and the services and products of ourclients;
• our ability to invest in and implement new technologies;
• disruptions or interruptions in our client relationships;
• actions of the Brazilian, EU, Spanish, Argentinian, Mexican and other governments and theirrespective regulatory agencies, including adverse competition law rulings and the introduction of newregulations that could require us to make additional expenditures;
• damage or disruptions to our key technology systems or the quality and reliability of the technologyprovided by technology telecommunications providers;
• an increase in the cost of telecommunications services and other services on which we and our industryrely;
• an actual or perceived failure to comply with data protection regulations, in particular any actual orperceived failure to ensure secure transmission of sensitive or confidential customer data through ournetworks;
• the effect of labor disputes on our business; and
• other risk factors listed in the section of this Annual Report entitled “Item 3. Key Information—D. RiskFactors”.
The words “believe”, “may”, “will”, “estimate”, “continue”, “anticipate”, “intend”, “expect” and similarwords are intended to identify estimates and forward-looking statements. Estimates and forward-lookingstatements are intended to be accurate only as of the date they were made, and we undertake no obligation toupdate or to review any estimate and/or forward-looking statement because of new information, future events orother factors. Estimates and forward-looking statements involve risks and uncertainties and are not guarantees offuture performance. Our future results may differ materially from those expressed in these estimates and forward-looking statements. You should therefore not make any investment decision based on these estimates andforward-looking statements.
The forward-looking statements contained in this report speak only as of the date of this report. We do notundertake to update any forward-looking statement to reflect events or circumstances after that date or to reflectthe occurrence of unanticipated events.
6
PART I
ITEM 1. IDENTITY OF DIRECTORS, SENIOR MANAGEMENT AND ADVISERS
A. Directors and Senior Management
Not applicable.
B. Advisers
Not applicable.
C. Auditors
Not applicable.
ITEM 2. OFFER STATISTICS AND EXPECTED TIMETABLE
A. Offer Statistics
Not applicable.
B. Method and Expected Timetable
Not applicable.
ITEM 3. KEY INFORMATION
A. Selected Financial Data
The following selected financial information should be read in conjunction with the section “Item 5.Operating and Financial Review and Prospects” and our consolidated financial statements, included elsewhere inthis Annual Report.
Historically, as described in “Presentation of financial and other information” above, we conducted ourbusiness through the Atento Group (“Predecessor”) through November 30, 2012, and subsequent to theAcquisition, through Atalaya Luxco Midco S.à.r.l (“Midco” or the “Successor”), and therefore our historicalfinancial statements present the results of operations of Predecessor and Successor, respectively. Prior tocompletion of the IPO we implemented the Reorganization Transaction pursuant to which the Successor becamea wholly-owned subsidiary of Atento S.A., a newly-formed public limited liability holding company incorporatedunder the laws of Luxembourg with nominal assets and liabilities for the purpose of facilitating the IPO, andwhich not had conducted any operations prior to the completion of the IPO. Following the ReorganizationTransaction and the IPO, our financial statements present the results of operations of Atento. The consolidatedfinancial statements of Atento are substantially the same as the consolidated financial statements of Midco priorto the IPO, as adjusted for the Reorganization Transaction. Upon consummation, the Reorganization Transactionwas reflected retroactively in the Company’s earnings per share calculations.
The following table sets forth selected historical financial data of the Atento Group and Atento. We prepareour financial statements in accordance with IFRS as issued by the IASB. As a result of the Acquisition, weapplied acquisition accounting whereby the purchase price paid was allocated to the acquired assets and assumedliabilities at fair value. Our financial reporting periods presented in the table below are as follow:
• The financial statements of the Predecessor included elsewhere in this Annual Report are the auditedcombined carve-out financial statements of the Atento Group as of and for the year ended December2011 and as of and for the eleven-month period ended November 30, 2012 (the “Predecessor financialstatements”). The Predecessor financial statements are presented on a combined carve-out basis fromthe AIT Group’s historical consolidated financial statements, based on the historical results ofoperations, cash flows, assets and liabilities of the Predecessor acquired by the Successor and that arepart of its consolidated group after the Acquisition. We believe that the assumptions and estimates usedin preparation of the Predecessor financial statements are reasonable. However, the Predecessorfinancial statements do not necessarily reflect what the Predecessor’s financial position, results ofoperations or cash flows would have been if the Predecessor had operated as a separate entity duringthe periods presented. As a result, historical financial information is not necessarily indicative of thePredecessor’s future results of operations, financial position or cash flows.
7
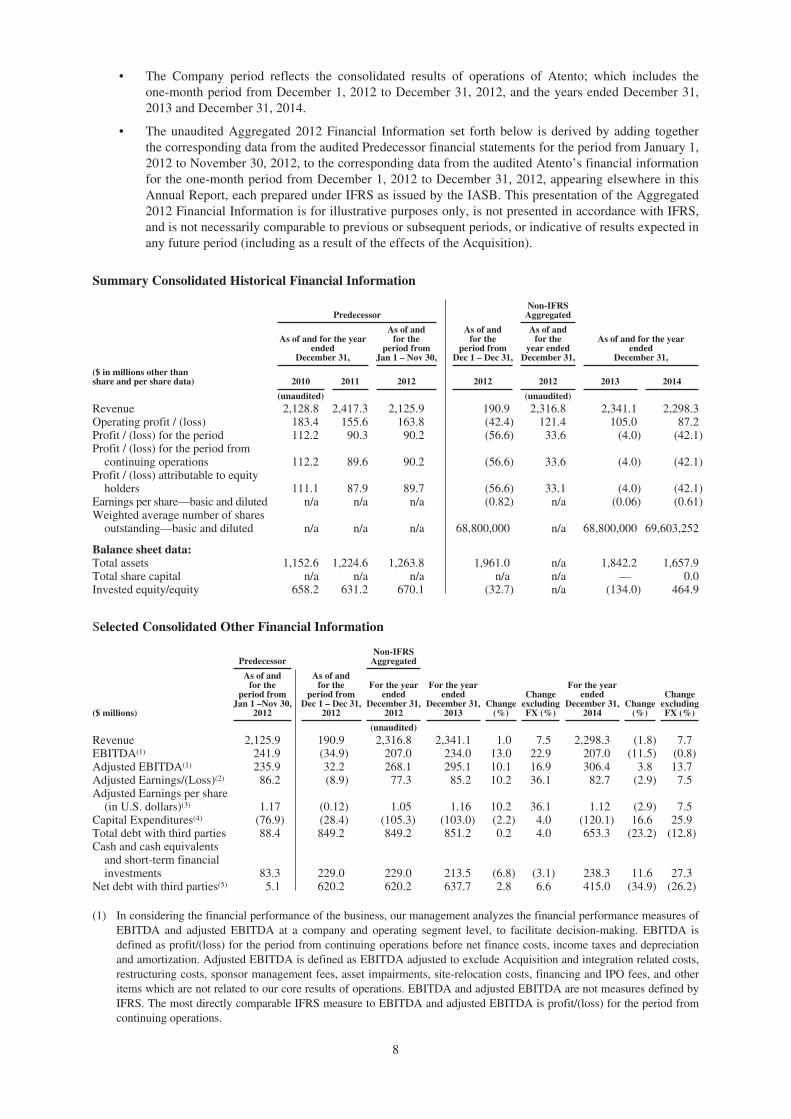
• The Company period reflects the consolidated results of operations of Atento; which includes theone-month period from December 1, 2012 to December 31, 2012, and the years ended December 31,2013 and December 31, 2014.
• The unaudited Aggregated 2012 Financial Information set forth below is derived by adding togetherthe corresponding data from the audited Predecessor financial statements for the period from January 1,2012 to November 30, 2012, to the corresponding data from the audited Atento’s financial informationfor the one-month period from December 1, 2012 to December 31, 2012, appearing elsewhere in thisAnnual Report, each prepared under IFRS as issued by the IASB. This presentation of the Aggregated2012 Financial Information is for illustrative purposes only, is not presented in accordance with IFRS,and is not necessarily comparable to previous or subsequent periods, or indicative of results expected inany future period (including as a result of the effects of the Acquisition).
Summary Consolidated Historical Financial Information
PredecessorNon-IFRS
Aggregated
As of and for the yearended
December 31,
As of andfor the
period fromJan 1 – Nov 30,
As of andfor the
period fromDec 1 – Dec 31,
As of andfor the
year endedDecember 31,
As of and for the yearended
December 31,
($ in millions other thanshare and per share data) 2010 2011 2012 2012 2012 2013 2014
(unaudited) (unaudited)Revenue 2,128.8 2,417.3 2,125.9 190.9 2,316.8 2,341.1 2,298.3Operating profit / (loss) 183.4 155.6 163.8 (42.4) 121.4 105.0 87.2Profit / (loss) for the period 112.2 90.3 90.2 (56.6) 33.6 (4.0) (42.1)Profit / (loss) for the period from
continuing operations 112.2 89.6 90.2 (56.6) 33.6 (4.0) (42.1)Profit / (loss) attributable to equity
holders 111.1 87.9 89.7 (56.6) 33.1 (4.0) (42.1)Earnings per share—basic and diluted n/a n/a n/a (0.82) n/a (0.06) (0.61)Weighted average number of shares
outstanding—basic and diluted n/a n/a n/a 68,800,000 n/a 68,800,000 69,603,252
Balance sheet data:Total assets 1,152.6 1,224.6 1,263.8 1,961.0 n/a 1,842.2 1,657.9Total share capital n/a n/a n/a n/a n/a — 0.0Invested equity/equity 658.2 631.2 670.1 (32.7) n/a (134.0) 464.9
Selected Consolidated Other Financial Information
PredecessorNon-IFRS
Aggregated
($ millions)
As of andfor the
period fromJan 1 –Nov 30,
2012
As of andfor the
period fromDec 1 – Dec 31,
2012
For the yearended
December 31,2012
For the yearended
December 31,2013
Change(%)
ChangeexcludingFX (%)
For the yearended
December 31,2014
Change(%)
ChangeexcludingFX (%)
(unaudited)Revenue 2,125.9 190.9 2,316.8 2,341.1 1.0 7.5 2,298.3 (1.8) 7.7EBITDA(1) 241.9 (34.9) 207.0 234.0 13.0 22.9 207.0 (11.5) (0.8)Adjusted EBITDA(1) 235.9 32.2 268.1 295.1 10.1 16.9 306.4 3.8 13.7Adjusted Earnings/(Loss)(2) 86.2 (8.9) 77.3 85.2 10.2 36.1 82.7 (2.9) 7.5Adjusted Earnings per share
(in U.S. dollars)(3) 1.17 (0.12) 1.05 1.16 10.2 36.1 1.12 (2.9) 7.5Capital Expenditures(4) (76.9) (28.4) (105.3) (103.0) (2.2) 4.0 (120.1) 16.6 25.9Total debt with third parties 88.4 849.2 849.2 851.2 0.2 4.0 653.3 (23.2) (12.8)Cash and cash equivalents
and short-term financialinvestments 83.3 229.0 229.0 213.5 (6.8) (3.1) 238.3 11.6 27.3
Net debt with third parties(5) 5.1 620.2 620.2 637.7 2.8 6.6 415.0 (34.9) (26.2)
(1) In considering the financial performance of the business, our management analyzes the financial performance measures ofEBITDA and adjusted EBITDA at a company and operating segment level, to facilitate decision-making. EBITDA isdefined as profit/(loss) for the period from continuing operations before net finance costs, income taxes and depreciationand amortization. Adjusted EBITDA is defined as EBITDA adjusted to exclude Acquisition and integration related costs,restructuring costs, sponsor management fees, asset impairments, site-relocation costs, financing and IPO fees, and otheritems which are not related to our core results of operations. EBITDA and adjusted EBITDA are not measures defined byIFRS. The most directly comparable IFRS measure to EBITDA and adjusted EBITDA is profit/(loss) for the period fromcontinuing operations.
8
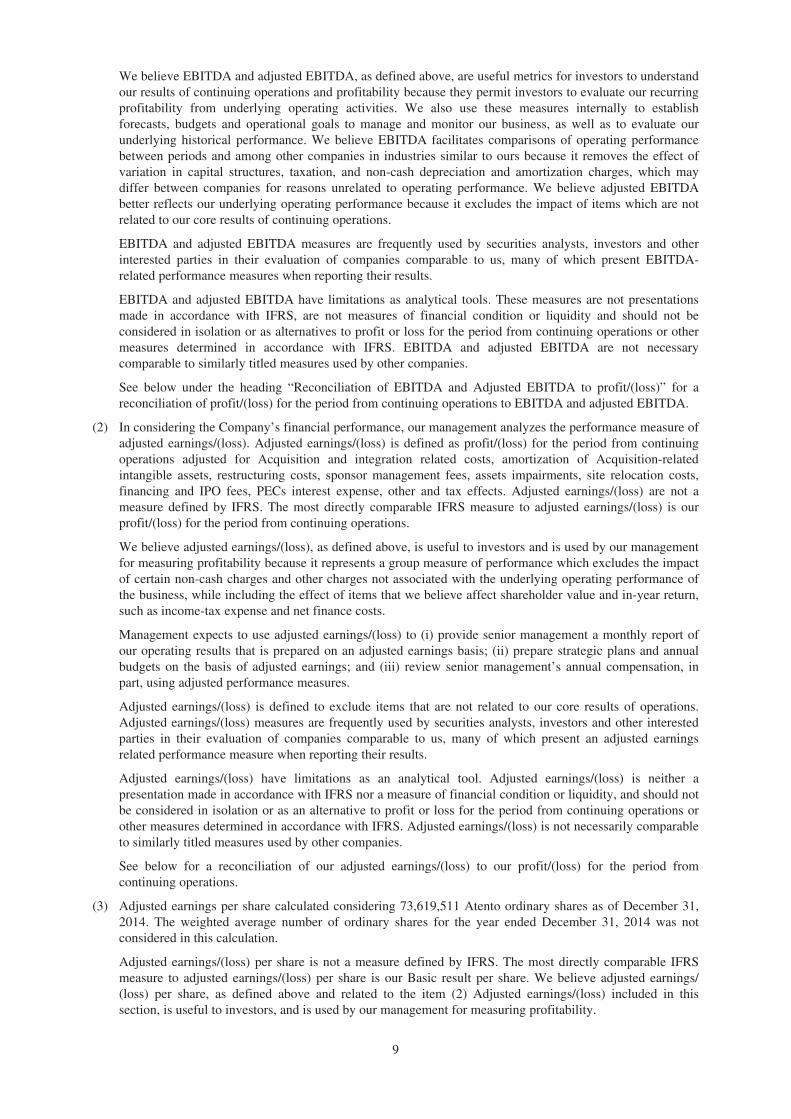
We believe EBITDA and adjusted EBITDA, as defined above, are useful metrics for investors to understandour results of continuing operations and profitability because they permit investors to evaluate our recurringprofitability from underlying operating activities. We also use these measures internally to establishforecasts, budgets and operational goals to manage and monitor our business, as well as to evaluate ourunderlying historical performance. We believe EBITDA facilitates comparisons of operating performancebetween periods and among other companies in industries similar to ours because it removes the effect ofvariation in capital structures, taxation, and non-cash depreciation and amortization charges, which maydiffer between companies for reasons unrelated to operating performance. We believe adjusted EBITDAbetter reflects our underlying operating performance because it excludes the impact of items which are notrelated to our core results of continuing operations.
EBITDA and adjusted EBITDA measures are frequently used by securities analysts, investors and otherinterested parties in their evaluation of companies comparable to us, many of which present EBITDA-related performance measures when reporting their results.
EBITDA and adjusted EBITDA have limitations as analytical tools. These measures are not presentationsmade in accordance with IFRS, are not measures of financial condition or liquidity and should not beconsidered in isolation or as alternatives to profit or loss for the period from continuing operations or othermeasures determined in accordance with IFRS. EBITDA and adjusted EBITDA are not necessarycomparable to similarly titled measures used by other companies.
See below under the heading “Reconciliation of EBITDA and Adjusted EBITDA to profit/(loss)” for areconciliation of profit/(loss) for the period from continuing operations to EBITDA and adjusted EBITDA.
(2) In considering the Company’s financial performance, our management analyzes the performance measure ofadjusted earnings/(loss). Adjusted earnings/(loss) is defined as profit/(loss) for the period from continuingoperations adjusted for Acquisition and integration related costs, amortization of Acquisition-relatedintangible assets, restructuring costs, sponsor management fees, assets impairments, site relocation costs,financing and IPO fees, PECs interest expense, other and tax effects. Adjusted earnings/(loss) are not ameasure defined by IFRS. The most directly comparable IFRS measure to adjusted earnings/(loss) is ourprofit/(loss) for the period from continuing operations.
We believe adjusted earnings/(loss), as defined above, is useful to investors and is used by our managementfor measuring profitability because it represents a group measure of performance which excludes the impactof certain non-cash charges and other charges not associated with the underlying operating performance ofthe business, while including the effect of items that we believe affect shareholder value and in-year return,such as income-tax expense and net finance costs.
Management expects to use adjusted earnings/(loss) to (i) provide senior management a monthly report ofour operating results that is prepared on an adjusted earnings basis; (ii) prepare strategic plans and annualbudgets on the basis of adjusted earnings; and (iii) review senior management’s annual compensation, inpart, using adjusted performance measures.
Adjusted earnings/(loss) is defined to exclude items that are not related to our core results of operations.Adjusted earnings/(loss) measures are frequently used by securities analysts, investors and other interestedparties in their evaluation of companies comparable to us, many of which present an adjusted earningsrelated performance measure when reporting their results.
Adjusted earnings/(loss) have limitations as an analytical tool. Adjusted earnings/(loss) is neither apresentation made in accordance with IFRS nor a measure of financial condition or liquidity, and should notbe considered in isolation or as an alternative to profit or loss for the period from continuing operations orother measures determined in accordance with IFRS. Adjusted earnings/(loss) is not necessarily comparableto similarly titled measures used by other companies.
See below for a reconciliation of our adjusted earnings/(loss) to our profit/(loss) for the period fromcontinuing operations.
(3) Adjusted earnings per share calculated considering 73,619,511 Atento ordinary shares as of December 31,2014. The weighted average number of ordinary shares for the year ended December 31, 2014 was notconsidered in this calculation.
Adjusted earnings/(loss) per share is not a measure defined by IFRS. The most directly comparable IFRSmeasure to adjusted earnings/(loss) per share is our Basic result per share. We believe adjusted earnings/(loss) per share, as defined above and related to the item (2) Adjusted earnings/(loss) included in thissection, is useful to investors, and is used by our management for measuring profitability.
9
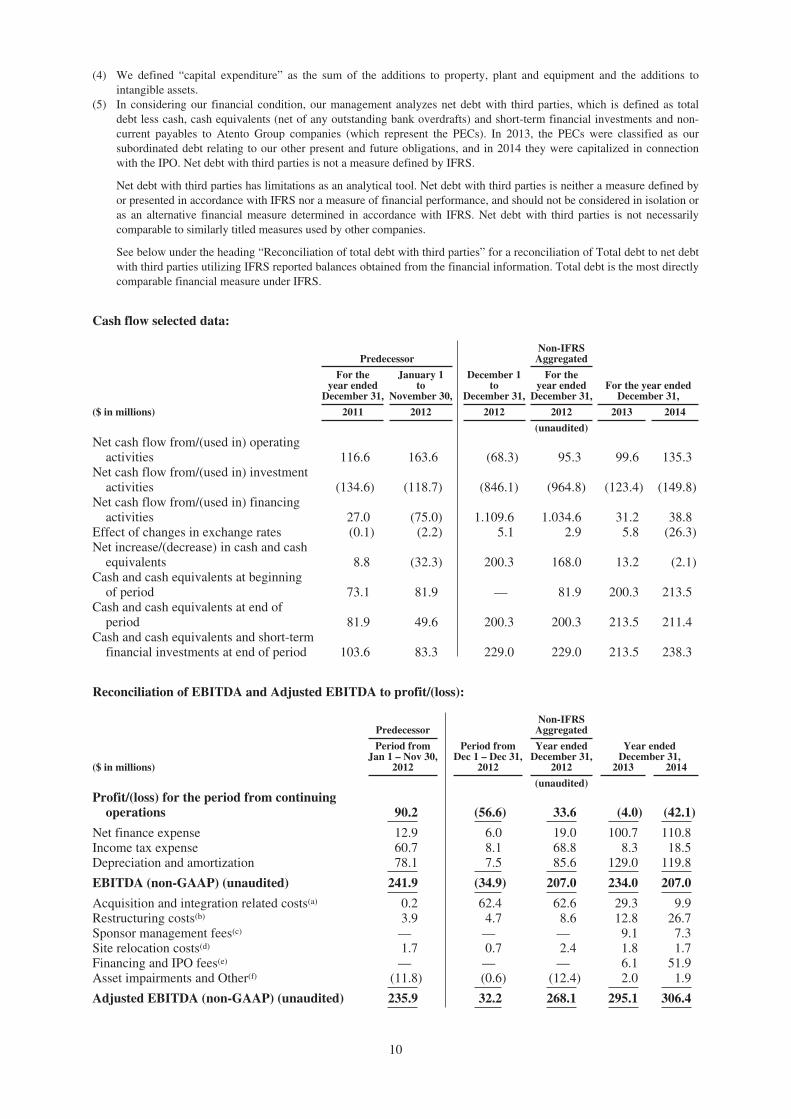
(4) We defined “capital expenditure” as the sum of the additions to property, plant and equipment and the additions tointangible assets.
(5) In considering our financial condition, our management analyzes net debt with third parties, which is defined as totaldebt less cash, cash equivalents (net of any outstanding bank overdrafts) and short-term financial investments and non-current payables to Atento Group companies (which represent the PECs). In 2013, the PECs were classified as oursubordinated debt relating to our other present and future obligations, and in 2014 they were capitalized in connectionwith the IPO. Net debt with third parties is not a measure defined by IFRS.
Net debt with third parties has limitations as an analytical tool. Net debt with third parties is neither a measure defined byor presented in accordance with IFRS nor a measure of financial performance, and should not be considered in isolation oras an alternative financial measure determined in accordance with IFRS. Net debt with third parties is not necessarilycomparable to similarly titled measures used by other companies.
See below under the heading “Reconciliation of total debt with third parties” for a reconciliation of Total debt to net debtwith third parties utilizing IFRS reported balances obtained from the financial information. Total debt is the most directlycomparable financial measure under IFRS.
Cash flow selected data:
PredecessorNon-IFRS
Aggregated
For theyear ended
December 31,
January 1to
November 30,
December 1to
December 31,
For theyear ended
December 31,For the year ended
December 31,
($ in millions) 2011 2012 2012 2012 2013 2014
(unaudited)Net cash flow from/(used in) operating
activities 116.6 163.6 (68.3) 95.3 99.6 135.3Net cash flow from/(used in) investment
activities (134.6) (118.7) (846.1) (964.8) (123.4) (149.8)Net cash flow from/(used in) financing
activities 27.0 (75.0) 1.109.6 1.034.6 31.2 38.8Effect of changes in exchange rates (0.1) (2.2) 5.1 2.9 5.8 (26.3)Net increase/(decrease) in cash and cash
equivalents 8.8 (32.3) 200.3 168.0 13.2 (2.1)Cash and cash equivalents at beginning
of period 73.1 81.9 — 81.9 200.3 213.5Cash and cash equivalents at end of
period 81.9 49.6 200.3 200.3 213.5 211.4Cash and cash equivalents and short-term
financial investments at end of period 103.6 83.3 229.0 229.0 213.5 238.3
Reconciliation of EBITDA and Adjusted EBITDA to profit/(loss):
PredecessorNon-IFRS
Aggregated
Period fromJan 1 – Nov 30,
Period fromDec 1 – Dec 31,
Year endedDecember 31,
Year endedDecember 31,
($ in millions) 2012 2012 2012 2013 2014
(unaudited)Profit/(loss) for the period from continuing
operations 90.2 (56.6) 33.6 (4.0) (42.1)
Net finance expense 12.9 6.0 19.0 100.7 110.8Income tax expense 60.7 8.1 68.8 8.3 18.5Depreciation and amortization 78.1 7.5 85.6 129.0 119.8
EBITDA (non-GAAP) (unaudited) 241.9 (34.9) 207.0 234.0 207.0
Acquisition and integration related costs(a) 0.2 62.4 62.6 29.3 9.9Restructuring costs(b) 3.9 4.7 8.6 12.8 26.7Sponsor management fees(c) — — — 9.1 7.3Site relocation costs(d) 1.7 0.7 2.4 1.8 1.7Financing and IPO fees(e) — — — 6.1 51.9Asset impairments and Other(f) (11.8) (0.6) (12.4) 2.0 1.9
Adjusted EBITDA (non-GAAP) (unaudited) 235.9 32.2 268.1 295.1 306.4
10
(a) Acquisition and integration costs incurred in 2012, 2013, and 2014 are costs associated with the Acquisitionand post-Acquisition process targeting primarily financial and operational improvements. Nearly all of the$62.6 million in expenses for the year ended December 31, 2012, are directly related to Acquisition andintegration related costs (banking, advisory, legal fees, etc.). For the year ended December 31, 2013, of the$29.3 million, $27.9 million are related to professional fees incurred to establish Atento as a standalonecompany not affiliated to Telefónica. These projects are mainly related to full strategy review includinggrowth implementation plan and operational set-up with a leading consulting firm ($14.7 million),improvement of financial and cash flow reporting ($5.9 million), improving the efficiency in procurement($4.8 million) and headhunting fees related primarily to strengthening the senior management team post-Acquisition ($1.4 million). Acquisition and integration related cost incurred for the year endedDecember 31, 2014 primarily resulted from consulting fees incurred in connection with the full strategyreview including our growth implementation plan and operational set-up with a leading consulting firm($4.0 million), improving the efficiency in procurement ($2.3 million), and IT transformation projects($2.5 million). These projects have substantially been completed by the end of 2014.
(b) Restructuring costs incurred in 2012, 2013 and 2014 primarily included a number of restructuring activitiesand other personnel costs that were not related to our core result of operations. In 2012, restructuring costsprimarily represented costs incurred in Chile related to the implementation of a new service delivery modelwith Telefónica, which affected the profile of certain operations personnel, and other restructuring costs forcertain changes to the executive team in EMEA and Americas region. For the year ended December 31,2013, $8.6 million of our restructuring costs were related to the relocation of corporate headquarters andseverance payments directly related to the Acquisition. In addition in 2013, we incurred in restructuringcosts in Spain of $1.5 million (relating to restructuring expenses incurred as a consequence of significantreduction in activity levels as a result of adverse market conditions in Spain), and in Chile of $1.4 million(relating to restructuring expenses incurred in connection with the implementation of a new service deliverymodel with Telefónica). Restructuring costs incurred for the year ended December 31, 2014, are primarilyrelated to headcount restructuring activities in Spain. In addition, we incurred restructuring costs not relatedto our core results of operations in Argentina and Peru of $4.8 million related to the restructuring of specificoperations, Chile of $2.5 million related to restructuring expenses incurred in connection with theimplementation of a new service delivery model with Telefónica, and in connection with certain changes tothe executive team, and an additional $0.7 million related to the relocation of corporate headquarters.
(c) Sponsor management fees represent the annual advisory fee paid to Bain Capital Partners, LLC that areexpensed during the period presented. These fees have ceased following the offering.
(d) Site relocation costs incurred for the year ended December 31, 2012, 2013 and 2014 include costs associatedwith our current strategic initiative of relocating call centers from tier 1 cities to tier 2 cities in Brazil inorder to get efficiencies through rental cost reduction and attrition and absenteeism improvement.
(e) Financing and IPO fees for the year ended December 31, 2013 primarily relate to professional fees incurredin 2013 in connection with the issuance of the Senior Secured Notes and to pay financial advisory fees.Financing fees and IPO fees for the year ended December 31, 2014 primarily relate to fees incurred inconnection with the IPO process including advisory, auditing and legal expenses among others. These feeshave ceased in 2014.
(f) Asset impairments and other costs incurred for the year ended 31, 2012 related to a release of an employeebenefit accrual of $11.3 million following the better-than-expected outcome of the collective bargainagreement negotiation in Spain. Asset impairment and other costs for the year ended December 31, 2013relates to charges associated to projects for inventory control in Brazil which are not related to our coreresults of operations. Asset impairment and other cost incurred for the year ended December 31, 2014,mainly relate to the goodwill and other intangible asset impairment relating to our operation in CzechRepublic of $3.7 million and Spain of $28.8 million and other non-recurrent costs of $4.6 million during theyear ended December 31, 2014, primarily related to a Revenue adjustment in Spain ($2.4 million) related toprior fiscal years and a one off tax penalty in Colombia ($1.3 million), offset by the amendment of the MSAwith Telefónica by which the minimum revenue commitment for Spain was reduced against a $34.5 millionpenalty fee compensated by Telefónica.
11
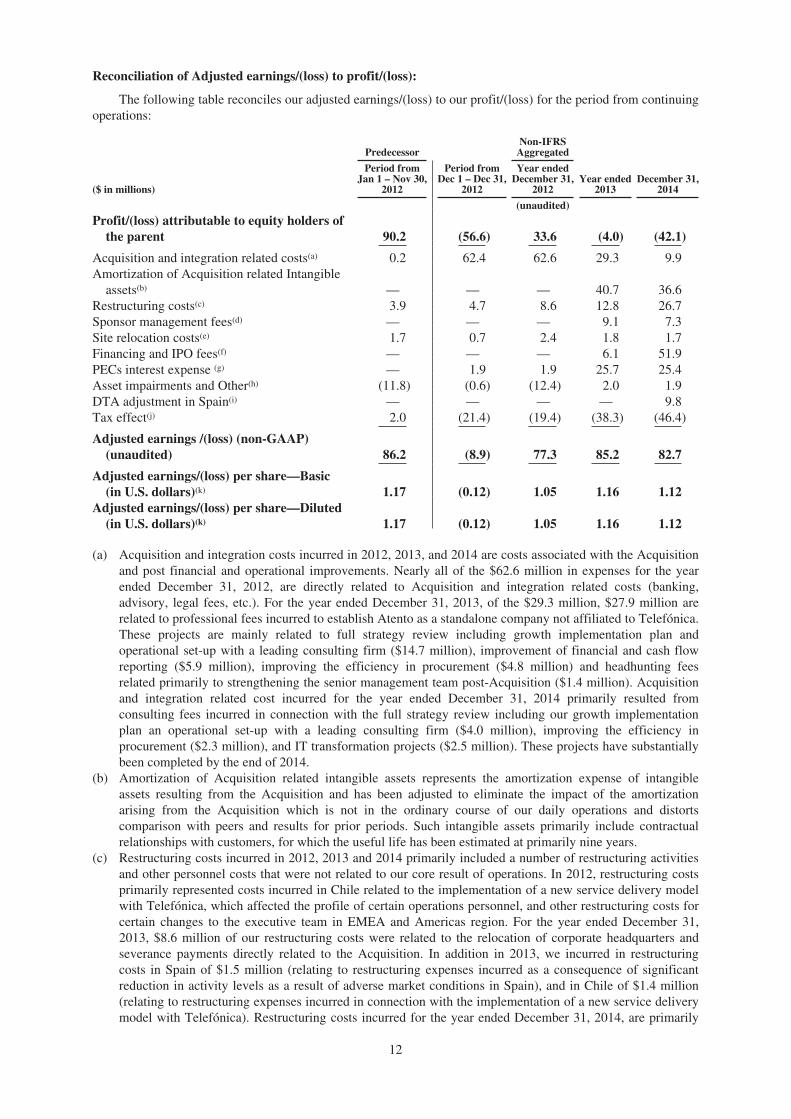
Reconciliation of Adjusted earnings/(loss) to profit/(loss):
The following table reconciles our adjusted earnings/(loss) to our profit/(loss) for the period from continuingoperations:
PredecessorNon-IFRS
Aggregated
($ in millions)
Period fromJan 1 – Nov 30,
2012
Period fromDec 1 – Dec 31,
2012
Year endedDecember 31,
2012Year ended
2013December 31,
2014
(unaudited)
Profit/(loss) attributable to equity holders ofthe parent 90.2 (56.6) 33.6 (4.0) (42.1)
Acquisition and integration related costs(a) 0.2 62.4 62.6 29.3 9.9Amortization of Acquisition related Intangible
assets(b) — — — 40.7 36.6Restructuring costs(c) 3.9 4.7 8.6 12.8 26.7Sponsor management fees(d) — — — 9.1 7.3Site relocation costs(e) 1.7 0.7 2.4 1.8 1.7Financing and IPO fees(f) — — — 6.1 51.9PECs interest expense (g) — 1.9 1.9 25.7 25.4Asset impairments and Other(h) (11.8) (0.6) (12.4) 2.0 1.9DTA adjustment in Spain(i) — — — — 9.8Tax effect(j) 2.0 (21.4) (19.4) (38.3) (46.4)
Adjusted earnings /(loss) (non-GAAP)(unaudited) 86.2 (8.9) 77.3 85.2 82.7
Adjusted earnings/(loss) per share—Basic(in U.S. dollars)(k) 1.17 (0.12) 1.05 1.16 1.12
Adjusted earnings/(loss) per share—Diluted(in U.S. dollars)(k) 1.17 (0.12) 1.05 1.16 1.12
(a) Acquisition and integration costs incurred in 2012, 2013, and 2014 are costs associated with the Acquisitionand post financial and operational improvements. Nearly all of the $62.6 million in expenses for the yearended December 31, 2012, are directly related to Acquisition and integration related costs (banking,advisory, legal fees, etc.). For the year ended December 31, 2013, of the $29.3 million, $27.9 million arerelated to professional fees incurred to establish Atento as a standalone company not affiliated to Telefónica.These projects are mainly related to full strategy review including growth implementation plan andoperational set-up with a leading consulting firm ($14.7 million), improvement of financial and cash flowreporting ($5.9 million), improving the efficiency in procurement ($4.8 million) and headhunting feesrelated primarily to strengthening the senior management team post-Acquisition ($1.4 million). Acquisitionand integration related cost incurred for the year ended December 31, 2014 primarily resulted fromconsulting fees incurred in connection with the full strategy review including our growth implementationplan an operational set-up with a leading consulting firm ($4.0 million), improving the efficiency inprocurement ($2.3 million), and IT transformation projects ($2.5 million). These projects have substantiallybeen completed by the end of 2014.
(b) Amortization of Acquisition related intangible assets represents the amortization expense of intangibleassets resulting from the Acquisition and has been adjusted to eliminate the impact of the amortizationarising from the Acquisition which is not in the ordinary course of our daily operations and distortscomparison with peers and results for prior periods. Such intangible assets primarily include contractualrelationships with customers, for which the useful life has been estimated at primarily nine years.
(c) Restructuring costs incurred in 2012, 2013 and 2014 primarily included a number of restructuring activitiesand other personnel costs that were not related to our core result of operations. In 2012, restructuring costsprimarily represented costs incurred in Chile related to the implementation of a new service delivery modelwith Telefónica, which affected the profile of certain operations personnel, and other restructuring costs forcertain changes to the executive team in EMEA and Americas region. For the year ended December 31,2013, $8.6 million of our restructuring costs were related to the relocation of corporate headquarters andseverance payments directly related to the Acquisition. In addition in 2013, we incurred in restructuringcosts in Spain of $1.5 million (relating to restructuring expenses incurred as a consequence of significantreduction in activity levels as a result of adverse market conditions in Spain), and in Chile of $1.4 million(relating to restructuring expenses incurred in connection with the implementation of a new service deliverymodel with Telefónica). Restructuring costs incurred for the year ended December 31, 2014, are primarily
12
related to headcount restructuring activities in Spain. In addition, we incurred restructuring costs not relatedto our core results of operations in Argentina and Peru of $4.8 million related to the restructuring of specificoperations, Chile of $2.5 million related to restructuring expenses incurred in connection with theimplementation of a new service delivery model with Telefónica, and in connection with certain changes tothe executive team, and an additional $0.7 million related to the relocation of corporate headquarters.
(d) Sponsor management fees represent the annual advisory fee paid to Bain Capital Partners, LLC that areexpensed during the period presented. These fees have ceased in following the offering.
(e) Site relocation costs incurred for the year ended December 31, 2012, 2013 and 2014 include costs associatedwith our current strategic initiative of relocating call centers from tier 1 cities to tier 2 cities in Brazil inorder to get efficiencies through rental cost reduction and attrition and absenteeism improvement.
(f) Financing and IPO fees for the year ended December 31, 2013 primarily relate to professional fees incurredin 2013 in connection with the issuance of the Senior Secured Notes and to pay financial advisory fees.Financing fees and IPO fees for the year ended December 31, 2014 primarily relate to fees incurred inconnection with the IPO process including advisory, auditing and legal expenses among others. These feeshave ceased in 2014.
(g) PECs Interest expense represents accrued interest on the preferred equity certificates that were capitalized inconnection with the IPO.
(h) Asset impairments and other costs incurred for the year ended 31, 2012 related to a release of an employeebenefit accrual of $11.3 million following the better-than-expected outcome of the collective bargainagreement negotiation in Spain. Asset impairment and other costs for the year ended December 31, 2013relates to charges associated to projects for inventory control in Brazil which are not related to our coreresults of operations. Asset impairment and other cost incurred for the year ended December 31, 2014,mainly relate to the goodwill and other intangible asset impairment relating to our operation in CzechRepublic of $3.7 million and Spain of $28.8 million and other non-recurrent costs of $4.6 million during theyear ended December 31, 2014, primarily related to a revenue adjustment in Spain ($2.4 million) related toprior fiscal years and a one off tax penalty in Colombia ($1.3 million), offset by the amendment of the MSAwith Telefónica by which the minimum revenue commitment for Spain was reduced against a $34.5 millionpenalty fee compensated by Telefónica.
(i) Deferred tax asset adjustment as a consequence of the tax rate reduction in Spain from 30% to 28% in 2015and to 25% in 2016.
(j) The tax effect represents the tax impact of the total adjustments based on a tax rate of 33.0% for the periodfrom January 1, 2012 to November 30, 2012, 31.0% for the one-month period from December 1, 2012 toDecember 31, 2012, 30.0% for 2013 and 39.5% for the year ended December 31, 2014. The adjustments forthe year ended December 31, 2014 include $43.8 million of IPO fees that are not deductible and$9.8 million of DTA adjustments that are both excluded from the adjustments base for tax effect calculation.
(k) The adjusted earnings/(loss) per share, for the period presented in the table above, were calculatedconsidering the number of ordinary shares of 73,619,511 as of December 31, 2014.
13
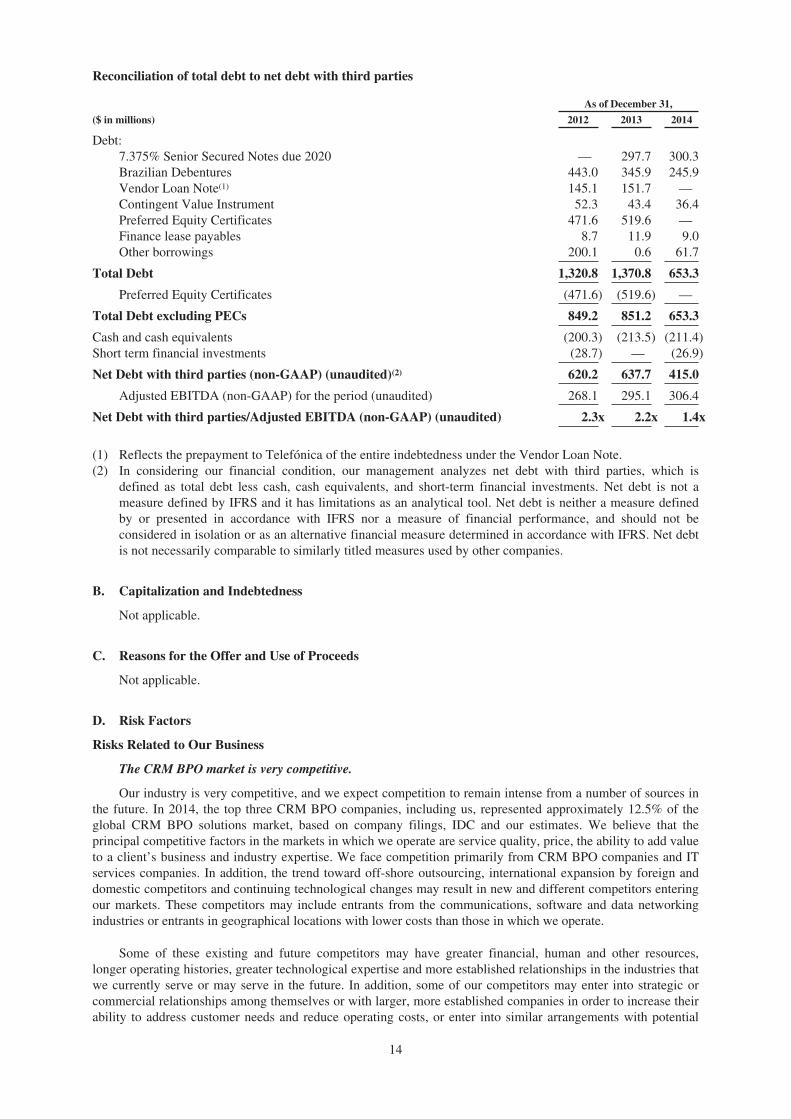
Reconciliation of total debt to net debt with third parties
As of December 31,
($ in millions) 2012 2013 2014
Debt:7.375% Senior Secured Notes due 2020 — 297.7 300.3Brazilian Debentures 443.0 345.9 245.9Vendor Loan Note(1) 145.1 151.7 —Contingent Value Instrument 52.3 43.4 36.4Preferred Equity Certificates 471.6 519.6 —Finance lease payables 8.7 11.9 9.0Other borrowings 200.1 0.6 61.7
Total Debt 1,320.8 1,370.8 653.3
Preferred Equity Certificates (471.6) (519.6) —
Total Debt excluding PECs 849.2 851.2 653.3
Cash and cash equivalents (200.3) (213.5) (211.4)Short term financial investments (28.7) — (26.9)
Net Debt with third parties (non-GAAP) (unaudited)(2) 620.2 637.7 415.0
Adjusted EBITDA (non-GAAP) for the period (unaudited) 268.1 295.1 306.4
Net Debt with third parties/Adjusted EBITDA (non-GAAP) (unaudited) 2.3x 2.2x 1.4x
(1) Reflects the prepayment to Telefónica of the entire indebtedness under the Vendor Loan Note.(2) In considering our financial condition, our management analyzes net debt with third parties, which is
defined as total debt less cash, cash equivalents, and short-term financial investments. Net debt is not ameasure defined by IFRS and it has limitations as an analytical tool. Net debt is neither a measure definedby or presented in accordance with IFRS nor a measure of financial performance, and should not beconsidered in isolation or as an alternative financial measure determined in accordance with IFRS. Net debtis not necessarily comparable to similarly titled measures used by other companies.
B. Capitalization and Indebtedness
Not applicable.
C. Reasons for the Offer and Use of Proceeds
Not applicable.
D. Risk Factors
Risks Related to Our Business
The CRM BPO market is very competitive.
Our industry is very competitive, and we expect competition to remain intense from a number of sources inthe future. In 2014, the top three CRM BPO companies, including us, represented approximately 12.5% of theglobal CRM BPO solutions market, based on company filings, IDC and our estimates. We believe that theprincipal competitive factors in the markets in which we operate are service quality, price, the ability to add valueto a client’s business and industry expertise. We face competition primarily from CRM BPO companies and ITservices companies. In addition, the trend toward off-shore outsourcing, international expansion by foreign anddomestic competitors and continuing technological changes may result in new and different competitors enteringour markets. These competitors may include entrants from the communications, software and data networkingindustries or entrants in geographical locations with lower costs than those in which we operate.
Some of these existing and future competitors may have greater financial, human and other resources,longer operating histories, greater technological expertise and more established relationships in the industries thatwe currently serve or may serve in the future. In addition, some of our competitors may enter into strategic orcommercial relationships among themselves or with larger, more established companies in order to increase theirability to address customer needs and reduce operating costs, or enter into similar arrangements with potential
14
clients. Further, trends of consolidation in our industry and among CRM BPO competitors may result in newcompetitors with greater scale, a broader footprint, better technologies and price efficiencies attractive to ourclients. Increased competition, our inability to compete successfully, pricing pressures or loss of market sharecould result in reduced operating profit margins which could have a material adverse effect on our business,financial condition, results of operations and prospects.
Telefónica, certain of its affiliates and a few other major clients account for a significant portion of ourrevenue and any loss of a large portion of business from these clients could have a material adverse effecton our business, financial condition, results of operations and prospects.
We have derived and believe that we will continue to derive a significant portion of our revenue fromcompanies within the Telefónica Group and a few other major client groups. For the years ended December 31,2012, 2013 and 2014, we generated 50.0%, 48.5% and 46.5%, respectively, of our revenue from the servicesprovided to the Telefónica Group. Our contracts with Telefónica Group companies in Brazil and Spaincomprised approximately 66.3% and 65.3%, respectively, of our revenue from the Telefónica Group for the yearsended December 31, 2013 and 2014. Our 15 largest client groups (including the Telefónica Group) on aconsolidated basis accounted for a total of 82.1% of the year ended December 31, 2014.
We are party to a master services agreement (the “MSA”) with Telefónica for the provision of certainCRM BPO services to Telefónica Group companies which governs the services agreements entered with theTelefónica Group companies. As of December 31, 2014, 38 companies within the Telefónica Group were a partyto 160 arm’s-length contracts with us. While our service contracts with the Telefónica Group companies havetraditionally been renewed, there can be no assurance that such contracts will be renewed upon their expiration.The MSA expires on December 31, 2021, and although the MSA is an umbrella agreement which governs ourservices agreements with the Telefónica Group companies, the termination of the MSA on December 31, 2021does not automatically result in a termination of any of the local services agreements in force after that date. TheMSA contemplates a right of termination prior to December 31, 2021 if a change of control of the Companyoccurs as a result of a sale to a Telefónica competitor. In addition, there can be no assurance that the MSA will berenewed upon its expiration. Furthermore, the MSA or any other agreement with any of the Telefónica Groupcompanies may be amended in a manner adverse to us or terminated early.
In addition, there can be no assurance that the volume of work to be performed by us for the variousTelefónica Group companies will not vary significantly from year to year in the aggregate, particularly since weare not the exclusive outsourcing provider for the Telefónica Group. As a consequence, our revenue or marginsfrom the Telefónica Group may decrease in the future. A number of factors other than the price and quality of ourwork and the services we provide could result in the loss or reduction of business from Telefónica Groupcompanies, and we cannot predict the timing or occurrence of any such event. For example, a Telefónica Groupcompany may demand price reductions, increased quality standards, change its CRM BPO strategy, or undercertain circumstances transfer some or all of the work and services we currently provide to Telefónica in-house.
The loss of a significant part of our revenue derived from these clients, in particular the Telefónica Group,as a result of the occurrence of one or more of the above events would have a material adverse effect on ourbusiness, financial condition, results of operations and prospects.
A substantial portion of our revenue, operations and investments are located in Latin America and we aretherefore exposed to risks inherent in operating and investing in the region.
For the year ended December 31, 2014, we derived 33.9% of our revenue from Americas and 51.6% fromBrazil. We intend to continue to develop and expand our facilities in the Americas and Brazil. Our operations andinvestments in the Americas and Brazil are subject to various risks related to the economic, political and socialconditions of the countries in which we operate, including risks related to the following:
• inconsistent regulations, licensing and legal requirements may increase our cost of operations as weendeavor to comply with myriad of laws that differ from one country to another in an unpredictable andadverse manner;
• currencies may be devalued or may depreciate or currency restrictions or other restraints on transfer offunds may be imposed;
• the effects of inflation and currency depreciation and fluctuation may require certain of our subsidiariesto undertake a mandatory recapitalization;
• governments may expropriate or nationalize assets or increase their participation in companies;
15
• governments may impose burdensome regulations, taxes or tariffs;
• political changes may lead to changes in the business environments in which we operate; and
• economic downturns, political instability and civil disturbances may negatively affect our operations.
Any deterioration in global market and economic conditions, especially in Latin America, and, inparticular in the telecommunications and financial services industries from which we generate most ofour revenue, may adversely affect our business, financial condition, results of operations and prospects.
Global market and economic conditions, including in Latin America, in the past several years havepresented volatility and increasing risk perception, with tighter credit conditions and recession or slow growth inmost major economies continuing into 2015. Our results of operations are affected directly by the level ofbusiness activity of our clients, which in turn is affected by the level of economic activity in the industries andmarkets that they serve. Many of our clients’ industries are especially vulnerable to any crisis in the financial andcredit markets or economic downturn. A substantial portion of our clients are concentrated in thetelecommunications and financial services industries which were especially vulnerable to the global financialcrisis and economic downturn that began in 2008. For the year ended December 31, 2014, 49.1% of our revenuewas derived from clients in the telecommunications industry. During the same period, clients in the financialservices industry (including insurance) contributed 35.2% to our revenue. Our business and future growth largelydepend on continued demand for our services from clients in these industries.
As our business has grown, we have become increasingly exposed to adverse changes in general globaleconomic conditions, which may result in reductions in spending by our clients and their customers. Globaleconomic concerns such as the varying pace of global economic recovery continue to create uncertainty andunpredictability and may have an adverse effect on the cost and availability of credit, leading to decreasedspending by businesses. Any deterioration of general economic conditions, or weak economic performance in theeconomies of the countries in which we operate, in particular in Brazil and Americas where, for the years endedDecember 31, 2012, 2013 and 2014, 83.7%, 84.5% and 85.5% of our revenue (in each case, before holdingcompany level revenue and consolidation adjustments), respectively, was generated and in our key markets suchas the telecommunications and financial services industries where, for the year ended December 31, 2014, 84.3%of our revenue was generated, may have a material adverse effect on our business, financial condition, results ofoperations and prospects.
Increases in employee benefits expenses as well as changes to labor laws could reduce our profit margin.
Employee benefits expenses accounted for $1,609.5 million in 2012, $1,643.5 million in 2013 and$1,636.4 million in 2014, representing 69.5%, 70.2% and 71.2%, respectively, of our revenue in those periods.
Employee salaries and benefits expenses in many of the countries in which we operate, principally in LatinAmerica, have increased during the periods presented in this Annual Report as a result of economic growth,increased demand for CRM BPO services and increased competition for trained employees such as employees atour service delivery centers in Latin America. See “Management’s Discussion and Analysis of FinancialCondition and Results of Operations—Total operating expenses.”
We will attempt to control costs associated with salaries and benefits as we continue to add capacity inlocations where we consider wage levels of skilled personnel to be satisfactory, but we may not be successful indoing so. We may need to increase salaries more significantly and rapidly than in previous periods in an effort toremain competitive, which may have a material adverse effect on our cash flows, business, financial condition,results of operations, profit margins and prospects. In addition, we may need to increase employee compensationmore than in previous periods to remain competitive in attracting the quantity and quality of employees that ourbusiness requires. Wage increases or other expenses related to the termination of our employees may reduce ourprofit margins and have a material adverse effect on our cash flows, business, financial condition, results ofoperations and prospects. If we expand our operations into new jurisdictions, we may be subject to increasedoperating costs, including higher employee benefits expenses in these new jurisdictions relative to our currentoperating costs, which could have a negative effect on our profit margin.
Furthermore, most of the countries in which we operate have labor protection laws, including statutorilymandated minimum annual wage increases, legislation that imposes financial obligations on employers and lawsgoverning the employment of workers. These labor laws in one or more of the key jurisdictions in which weoperate, particularly Brazil, may be modified in the future in a way that is detrimental to our business. If these
16
labor laws become more stringent, or if there are continued increases in statutory minimum wages or higher laborcosts in these jurisdictions, it may become more difficult for us to discharge employees, or cost-effectivelydownsize our operations as our level of activity fluctuates, both of which would likely reduce our profit marginsand have a material adverse effect on our business, financial condition, results of operations and prospects.
We may fail to attract and retain key sufficiently trained employees at our service delivery centers tosupport our operations, which could have a material adverse effect on our business, financial condition,results of operations and prospects.
The CRM BPO industry relies on large numbers of trained employees at service centers, and our successdepends to a significant extent on our ability to attract, hire, train and retain employees. The CRM BPO industry,including us, experiences high employee turnover. On average in the year ended December 31, 2014, weexperienced monthly turnover rates of 7.1% of our overall operations personnel (we include both permanent andtemporary employees, counting each from his or her first day of employment with us) requiring us tocontinuously hire and train new employees, particularly in Latin America, where there is significant competitionfor trained employees with the skills necessary to perform the services we offer to our clients. In addition, wecompete for employees, not only with other companies in our industry, but also with companies in otherindustries and in many locations where we operate there are a limited number of properly trained employees.Increased competition for these employees, in the CRM BPO industry or otherwise, could have an adverse effecton our business. Additionally, a significant increase in the turnover rate among trained employees could increaseour costs and decrease our operating profit margins.
In addition, our ability to maintain and renew existing engagements, obtain new business and increase ourmargins will depend, in large part, on our ability to attract, train and retain employees with skills that enable us tokeep pace with growing demands for outsourcing, evolving industry standards, new technology applications andchanging client preferences. Our failure to attract, train and retain personnel with the experience and skillsnecessary to fulfill the needs of our existing and future clients or to assimilate new employees successfully intoour operations could have a material adverse effect on our business, financial condition, results of operations andprospects.
Our profitability will suffer if we are not able to maintain our pricing or control or adjust costs to thelevel of our activity.
Our profit margin, and therefore our profitability, is largely a function of our level of activity and the rateswe are able to recover for our services. If we are unable to maintain the pricing for our services or an appropriateseat utilization rate, without corresponding cost reductions, our profitability will suffer. The pricing and levels ofactivity we are able to achieve are affected by a number of factors, including our clients’ perceptions of ourability to add value through our services, the length of time it takes for volume of new clients to ramp up,competition, introduction of new services or products by us or our competitors, our ability to accurately estimate,attain and sustain revenue from client contracts, margins and cash flows over increasingly longer contract periodsand general economic and political conditions.
Our profitability is also a function of our ability to control our costs and improve our efficiency. As weincrease the number of our employees and execute our strategies for growth, we may not be able to manage thesignificantly larger and more geographically diverse workforce that may result, which could adversely affect ourability to control our costs or improve our efficiency. Further, because there is no certainty that our business willgrow at the rate that we anticipate, we may incur expenses for the increased capacity for a significant period oftime without a corresponding growth in our revenues.
If our clients decide to enter or further expand their own CRM BPO businesses in the future or currenttrends towards providing CRM BPO services and/or outsourcing activities are reversed, it may materiallyadversely affect our business, results of operations, financial condition and prospects.
None of our current agreements with our clients prevents them from competing with us in our CRM BPObusiness and none of our clients have entered into any non-compete agreements with us. Our current clients mayseek to provide CRM BPO services similar to those we provide. Some clients conduct CRM BPO services forother parts of their own businesses and for third parties. Any decision by our key clients to enter into or furtherexpand their CRM BPO business activities in the future could cause us to lose valuable clients and suppliers andmay materially adversely affect our business, financial condition, results of operations and prospects.
17
Moreover, we have based our strategy of future growth on certain assumptions regarding our industry, legalframework, services and future demand in the market for such services. However, the trend to outsource businessprocesses may not continue and could be reversed by factors beyond our control, including negative perceptionsattached to outsourcing activities or government regulations against outsourcing activities. Current or prospectiveclients may elect to perform such services in-house to avoid negative perceptions that may be associated withusing an off-shore provider. Political opposition to CRM BPO or outsourcing activities may also arise in certaincountries if there is a perception that CRM BPO or outsourcing activities have a negative effect on employmentopportunities.
In addition, our business may be adversely affected by potential new laws and regulations prohibiting orlimiting outsourcing of certain core business activities of our clients in key jurisdictions in which we conduct ourbusiness, such as in Brazil. The introduction of such laws and regulations or the change in interpretation ofexisting laws and regulations could adversely affect our business, financial condition, results of operations andprospects.
The consolidation of the potential users of CRM BPO services may adversely affect our business,financial condition, results of operations and prospects.
Consolidation of the potential users of CRM BPO services may decrease the number of clients who contractour services. Any significant reduction in or elimination of the use of the services we provide as a result ofconsolidation would result in reduced net revenue to us and could harm our business. Such consolidation mayencourage clients to apply increasing pressure on us to lower the prices we charge for our services, which couldhave a material adverse effect on our business, financial condition, results of operations and prospects.
Our operating results may fluctuate from one quarter to the next due to various factors includingseasonality.
Our operating results may differ significantly from quarter to quarter and our business may be affected byfactors such as: client losses, the timing of new contracts and of new product or service offerings, termination ofexisting contracts, variations in the volume of business from clients resulting from changes in our clients’operations or the onset of certain parts of the year, such as the summer vacation period in our geographicallydiverse markets and the year-end holiday season in Latin America, the business decisions of our clients regardingthe use of our services, start-up costs, delays or difficulties in expanding our operational facilities andinfrastructure, changes to our revenue mix or to our pricing structure or that of our competitors, inaccurateestimates of resources and time required to complete ongoing projects, currency fluctuation and seasonal changesin the operations of our clients.
We typically generate less revenue in the first quarter of the year than in the second quarter as our clientsgenerally spend less after the year-end holiday season. We have also found that our revenue increases in the lastquarter of the year, particularly in November and December when our business benefits from the increasedactivity of our clients and their customers, who generally spend more money and are otherwise more activeduring the year-end holiday season. These seasonal effects also cause differences in revenue and income amongthe various quarters of any financial year, which means that the individual quarters of a year should not bedirectly compared with each other or used to predict annual financial results.
In addition, the sales cycle for our services, typically from six to 12 months (from the date the contract isentered into until the beginning of the provision of services), and the internal budget and approval processes ofour prospective clients, make it difficult to predict the timing of new client engagements. Also, we recognizerevenue only upon actual provision of the contracted services and when the criteria for recognition are achieved.The financial benefit of gaining a new client may not be realized at the intended time due to delays in theimplementation of our services or due to an increase in the start-up costs required in building our infrastructure.These factors may make it difficult for us to prepare accurate internal financial forecasts or replace anticipatedrevenue that is not received as a result of these delays.
Our key clients have significant leverage over our business relationships, upon which we are dependent.
We are dependent upon the business relationships we have developed with our clients. Our service contractsgenerally allow our clients to modify such relationships and our commensurate level of work. Typically, theinitial term of our service contracts is one to two years. Generally, our specific service contracts provide for earlytermination, in some cases without cause, by either party, provided 30 to 90 days prior written notice is given.
18
Clients may also unilaterally reduce the use and number of services under our contracts without penalty. Thetermination or reduction in services by a substantial percentage or a significant reduction in the price of thesecontracts could adversely affect our business and reduce our margins. The revenue generated from our fifteenlargest client groups (including Telefónica Group companies) for the year ended December 31, 2014 represented82.1% of our revenue. Excluding revenue generated from the Telefónica Group, our next 15 largest client groupsfor the year ended December 31, 2014 represented in aggregate 36.0% of our revenue. In addition, a contracttermination or significant reduction in the services contracted to us by a major client could result in a higher thanexpected number of unassigned employees, which would increase our employee benefits expenses associatedwith terminating employees. We may not be able to replace any major client that elects to terminate or not torenew its contract with us, which would have a material adverse effect on our business, financial condition,results of operations and prospects.
We may face difficulties as we expand our operations into countries in which we have no prior operatingexperience.
We may expand our global footprint in order to maintain an appropriate cost structure and meet our clients’delivery needs. This may involve expanding into countries other than those in which we currently operate andwhere we have less familiarity with local procedures. It may involve expanding into less developed countries,which may have less political, social or economic stability and less developed infrastructure and legal systems.As we expand our business into new countries we may encounter economic, regulatory, personnel, technologicaland other difficulties that increase our expenses or delay our ability to start up our operations or becomeprofitable in such countries. This may affect our relationships with our clients and could have an adverse effecton our business, financial condition, results of operations and prospects.
Our success depends on our key employees.
Our success depends on the continued service and performance of our executive officers and other keypersonnel in each of our business units, including our structure personnel. There is competition for experiencedsenior management and personnel with expertise in the CRM BPO industry, and we may not be able to retain ourkey personnel or recruit skilled personnel with appropriate qualifications and experience. Although we haveentered into employment contracts with our executive officers, it may not be possible to require specificperformance under a contract for personal services and in any event these agreements do not ensure the continuedservice of these executive officers. The loss of key members of our personnel, particularly to competitors, couldhave a material adverse effect on our business, financial condition, results of operations and prospects.
If we experience challenges with respect to labor relations, our overall operating costs and profitabilitycould be adversely affected and our reputation could be harmed.
While we believe we have good relations with our employees, any work disruptions or collective laboractions may have an adverse impact on our services. Approximately 83% of our workforce is under collectivebargaining agreements. Collective bargaining agreements are generally renegotiated every one to three years withthe principal labor unions in seven of the countries in which we operate. If these labor negotiations are notsuccessful or we otherwise fail to maintain good relations with employees, we could suffer a strike or othersignificant work stoppage or other form of industrial action, which could have a material adverse effect on ourbusiness, financial condition, results of operations and prospects and harm our reputation.
We have a long selling cycle for our CRM BPO services that requires significant funds and managementresources, and a long implementation cycle that requires significant resource commitments.
We have a long selling cycle for our CRM BPO services, which requires significant investment of capital,resources and time by both our clients and us. Before committing to use our services, potential clients require usto expend substantial time and resources educating them as to the value of our services and assessing thefeasibility of integrating our systems and processes with theirs. Our clients then evaluate our services beforedeciding whether to use them. Therefore, our selling cycle, which generally ranges from six to 12 months, issubject to many risks and delays over which we have little or no control, including our clients’ decision to choosealternatives to our services (such as other providers or in-house offshore resources) and the timing of our clients’budget cycles and approval processes.
Implementing our services involves a significant commitment of resources over an extended period of timefrom both our clients and us. Our clients may also experience delays in obtaining internal approvals or delays
19
associated with technology or system implementations, thereby delaying further the implementation process. Ourcurrent and future clients may not be willing or able to invest the time and resources necessary to implement ourservices, and we may fail to close sales with potential clients to which we have devoted significant time andresources, which could have a material adverse effect on our business, financial condition, results of operationsand prospects.
Natural events, wars, terrorist attacks and other acts of violence involving any of the countries in whichwe or our clients have operations could adversely affect our operations and client confidence.
Natural events (such as floods and earthquakes), terrorist attacks and other acts of violence or war mayadversely disrupt our operations, lead to economic weakness in the countries in which they occur and affectworldwide financial markets, and could potentially lead to economic recession, which could have a materialadverse effect on our business, financial condition, results of operations and prospects. These events couldadversely affect our clients’ levels of business activity and precipitate sudden significant changes in regional andglobal economic conditions and cycles. These events also pose significant risks to our people and to our businessoperations around the world.
We may have difficulty controlling our growth and updating our internal operational and financialsystems.
Since our founding in 1999, and particularly from 2004, we have experienced rapid growth and significantlyexpanded our operations in key regions and client industries. Our number of workstations increased from 75,682as of December 31, 2012, to 79,197 as of December 31, 2013 and 86,071 as of December 31, 2014. The averagenumber of employees (excluding internships) increased from 150,248 for the year ended December 31, 2012 to155,832 for the year ended December 31, 2013 and decreased to 154,176 for the year ended December 31, 2014.
This rapid growth places significant demands on our management and financial and operational resources.In order to manage growth effectively, we must recruit new employees and implement and improve operationalsystems, procedures and internal controls on a timely basis. In addition, we need to update our existing internalaccounting, financial and cost control systems to ensure that we can access all necessary financial information inline with the increasing demands of our business. If we fail to implement these systems, procedures and controlsor update these systems on a timely basis, we may not be able to service our clients’ needs, hire and retain newemployees, pursue new business, complete future acquisitions or operate our business effectively. Failure toeffectively transfer new client business to our delivery centers, properly budget transfer costs, accurately estimateoperational costs associated with new contracts or access financial, accounting or cost control information in atimely fashion could result in delays in executing client contracts, trigger service level penalties or cause ourprofit margins not to meet our expectations. Any inability to control such growth or update our systems couldmaterially adversely affect our business, financial condition, results of operations and prospects.
If we are unable to fund our working capital requirements and new investments, our business, financialcondition, results of operations and prospects could be adversely affected.
The CRM BPO industry is characterized by high working capital requirements and the need to make newinvestments in operating sites and employee resources to meet the requirements of our clients. Similar to ourcompetitors in this industry, we incur significant start-up costs related to investments in infrastructure to provideour services and the hiring and training of employees, such expenses being historically incurred before revenue isgenerated.
In addition, we are exposed to adverse changes in our main clients’ payment policies, which could have amaterial adverse impact on our ability to fund our working capital needs. During the years ended December 31,2012, 2013 and 2014, our average days sales outstanding (“DSO”) was approximately 65 days. If our key clientsimplement policies which extend the payment terms of our invoices, our working capital levels could beadversely affected and our finance costs may increase. As a result, under the service contracts we entered intosince that time, the provisions relating to the time by which Telefónica must satisfy its payment obligations to uswas extended. Our working capital was $385.9 million and $340.9 million as of December 31, 2013 andDecember 31, 2014, respectively. If we are unable to fund our working capital requirements, access financing atcompetitive prices or make investments to meet the expanding business of our existing and potential new clients,our business, financial condition, results of operations and prospects could be adversely affected.
20

Fluctuations in, or devaluation of, the local currencies in the countries in which we operate against theU.S. dollar could have a material adverse effect on our business, financial condition, results of operationsand prospects.
As of December 31, 2014, 97.2% of our revenue was generated in countries that use currencies other thanthe U.S. dollar, mostly the local currencies of the Latin American countries in which we operate (particularly,currencies such as the Brazilian real, the Mexican peso, the Chilean peso and the Argentinean peso). Both Braziland Mexico have experienced inflation and volatility in the past and some Latin American countries haverecently been classified as hyperinflationary economies. While inflation may not have a significant effect on theprofit and loss of a local subsidiary itself, depreciation of the local currency against the U.S. dollar would reducethe value of the dividends payable to us from our operating companies. We report our financial results in U.S.dollars and our results of operations would be adversely affected if these local currencies depreciate significantlyagainst the U.S. dollar, which may also affect the comparability of our financial results from period to period, aswe convert our subsidiaries’ statements of financial position into U.S. dollars from local currencies at theperiod-end exchange rate, and income and cash flow statements at average exchange rates for the year.Conversely, where we provide off-shore services to U.S. clients and our revenue is earned in U.S. dollars, anappreciation in the currency of the country in which the services are provided could result in an increase in ourcosts in proportion to the revenue we earn for those services. The exchange rates between these local currenciesand the U.S. dollar have changed substantially in recent years and may fluctuate substantially in the future. Forthe years ended December 31, 2012, 2013 and 2014, these fluctuations had a significant effect on our results ofoperations”.
In addition, future government action, including interest rate decreases, changes in monetary policy orintervention in the exchange markets and other government action to adjust the value of the local currency maytrigger inflationary increases. For example, governmental measures to control inflation may include maintaininga tight monetary policy with high interest rates, thereby restricting the availability of credit and reducingeconomic growth. As a result, interest rates may fluctuate significantly. Furthermore, losses incurred based onthe exchange rate used may be exacerbated if regulatory restrictions are imposed when these currencies areconverted into U.S. dollars.
The occurrence of such fluctuations, devaluations or other currency risks could have a material adverseeffect on our business, financial condition, results of operations and prospects.
The Brazilian government has exercised, and continues to exercise, significant influence over theBrazilian economy. This involvement, as well as Brazilian political and economic conditions, couldadversely impact our business, financial condition, results of operations and prospects.
For the year ended December 31, 2014 and December 31, 2013, revenue from our operations in Brazilaccounted for 51.6% and 51.5% of our total revenue, respectively, EBITDA accounted for 65.9% and 51.9% ofour total EBITDA, respectively, and Adjusted EBITDA accounted for 54.4% and 52.6% of our total AdjustedEBITDA, respectively, (in each case, before holding company level revenue and, expenses and consolidationadjustments).
Historically, the Brazilian government has frequently intervened in the Brazilian economy and occasionallymade drastic changes in policy and regulations. The Brazilian government’s actions to control inflation andimplement macroeconomic policies have in the past often involved wage and price controls, currencydevaluations, capital controls and limits on imports, among other things. Our business, financial condition,results of operations and prospects may be adversely affected by changes in policies or regulations, or by otherfactors such as:
• devaluations and other currency fluctuations;
• inflation rates;
• interest rates;
• liquidity of domestic capital and lending markets;
• energy shortages;
• exchange controls and restrictions on remittances abroad (such as those that were briefly imposed in1989 and early 1990);
• monetary policy;
21
• minimum wage policy;
• tax policy; and
• other political, diplomatic, social and economic developments in or affecting Brazil.
In addition, the President of Brazil has considerable power to determine governmental policies and actionsthat relate to the Brazilian economy and that could consequently affect our business, financial condition andresults of operations. We cannot predict what policies may be implemented by the Brazilian federal or stategovernments and whether these policies will negatively affect our business, financial condition, results ofoperations and prospects.
The Brazilian government regularly implements changes to tax regimes that may increase our and ourclients’ tax burdens. These changes include modifications in the rate of assessments, non-renewal of existing taxrelief, such as the Plano Brasil Maior and, on occasion, enactment of temporary taxes the proceeds of which areearmarked for designated governmental purposes. Because we derive a significant portion of our revenues,EBITDA and Adjusted EBITDA from our operations in Brazil, if the Plano Brasil Maior is not extended or notmade permanent, it would have a significant negative impact on our total costs. Our inability to pass throughsuch increase in costs to our customers will materially and adversely affect our results of operations.Furthermore, increases in our overall tax burden could negatively affect our overall financial performance andprofitability.
The Brazilian currency has been devalued frequently over the past four decades. Throughout this period, theBrazilian government has implemented various economic plans and used various exchange rate policies,including sudden devaluations, periodic mini-devaluations (such as daily adjustments), exchange controls, dualexchange rate markets and a floating exchange rate system. From time to time, there have been significantfluctuations in the exchange rate between the Brazilian currency and the U.S. dollar and other currencies.
In the past, Brazil’s economy has experienced balance of payment deficits and shortages in foreignexchange reserves, and the government has responded by restricting the ability of persons or entities, Brazilian orforeign, to convert Brazilian currency into any foreign currency. The government may institute a restrictiveexchange control policy in the future. Any restrictive exchange control policy could prevent or restrict our accessto other currencies to meet our financial obligations and our ability to pay dividends out of our Brazilianactivities.
On February 26, the Brazilian Government enacted a Provisory Measure PM 669/15 whereby it raised thesocial security tax on employees’ social contributions from 2% to 4.5% on gross revenue for the call centerindustry. Companies impacted by the measure will have the option to revert to the original 20% tax on payrollspending. The new rule was to come into effect as of June, and firms were allowed to change the way they paysocial security tax as at this month. On March 3, Senate President however rejected the provisional measuredeclaring it to be unconstitutional. Brazilian Government then submitted a law for Congress appreciation with thesame proposal, and if approved, the additional tax obligations that we would incur in Brazil may have a materialadverse effect on our business, financial condition, results of operations and prospects. Recent politicaldevelopments make the outcome and any potential impact of the Provisory Measure in our businessunpredictable, if it were to be approved, the Company is taking appropriate actions to address any potentialexposure to our operations.
Uncertainty over whether possible changes in policies or rules affecting these or other factors maycontribute to economic uncertainties in Brazil, which could adversely affect our business, financial condition,results of operation and prospects.
Adverse decisions of the Superior Labor Court or other labor authorities in Brazil with respect to thelegality of outsourcing of certain activities that we provide could have a material adverse impact on ourbusiness, financial condition, results of operations and prospects.
There is no legislation in Brazil regulating outsourcing activities. The judicial system has been consideringthis issue in light of the precedent “Súmula No. 331” of Brazil’s Superior Labor Court (Tribunal Superior doTrabalho), or “TST,” which prohibits outsourcing of core business activities. TST has been issuing decisions thatstipulated that call center activities are core to a telecommunications company’s business and cannot beoutsourced. In conflict with this opinion, the Brazilian Telecommunications General Act (Lei Geral deTelecomunicação), or the “Act,” explicitly allows the outsourcing of certain activities by telecommunications
22
companies. Several telecommunications companies in Brazil have filed appeals with the Brazilian FederalSupreme Court (Supremo Tribunal Federal), or “STF,” arguing that TST decisions are inconsistent with theprovisions of the Act. At issue in certain of these cases is also whether the Act is constitutional. Recently, theSTF confirmed that it has jurisdiction to consider arguments regarding the legality of service outsourcing inBrazil and, therefore, that it will hear the merit of the claim. The decision of the STF will be a binding precedentthat must be adhered to by lower courts, including TST. We cannot predict when any such decision would beissued nor what the final outcome of such cases will be. In addition, there is currently a bill under considerationat the Brazilian Congress to pass a law that would permit and regulate the outsourcing business in Brazilgenerally. We cannot assure you that such bill will eventually be approved and become law in Brazil or that, ifapproved, will not be less favorable to our operations.
It is possible that our clients in other industries could be subject to future similar adverse decisions ofBrazilian labor courts relating to the interpretation of Súmula 331 and the legality of outsourcingactivities. Further adverse decisions of these courts, whether in the telecommunications industry or otherindustries, with respect to the scope of activities that are permitted to be outsourced, or an adverse decision bythe Brazilian Federal Supreme Court in any of the appeals described above, may inhibit or prevent our existingand potential new clients from outsourcing activities. In addition, our service contracts generally require us toindemnify our clients for certain labor-related claims against them by our employees and consequently, futureadverse decisions could have a material adverse effect on our business, financial condition, results of operationsand prospects.
Argentina has undergone significant political, social and economic instability in the past several years,and if such instability continues or worsens, our Argentine operations could be materially adverselyaffected.
In 2014 our operations in Argentina accounted for 6.6% of our revenue and 5.2% of our EBITDA (in eachcase, before holding company level revenue and expenses and consolidation adjustments).
Political and Currency Risk. Over the past several years, the Argentine economy has experienced a severerecession, as well as a political and social crisis, and the abandonment of the U.S. dollar/Argentine peso parity inJanuary 2002 that led to the significant depreciation of the Argentine peso against major international currencies.Depending on the relative impact of other variables affecting our operations, including technological changes,inflation, gross domestic product (“GDP”) growth, and regulatory changes, continued the depreciation of theArgentine peso may have a negative impact on our Argentine business. For example, in 2014, the Argentine pesodepreciated approximately 24% against the U.S. dollar.
Since the abandonment of the U.S. dollar/Argentine peso parity, the Argentine government has implementedmeasures attempting to address its effects, regain access to financial markets, restore liquidity to the financialsystem, reduce unemployment and stimulate the economy. Although general political, economic and socialconditions in Argentina have improved since 2003, significant uncertainties remain regarding the country’seconomic and political future. There have been a number of negative economic and political developments since2008 that have increased the level of uncertainty. The country has been experiencing high inflation in recentyears and there can be no assurance that Argentina will not experience another recession, higher inflation,devaluation, unemployment and social unrest in the future. Argentine government measures concerning theeconomy, including measures related to inflation, interest rates, foreign exchange controls and currency exchangerates have had and may continue to have a material adverse effect on private sector entities, including ourArgentine operations. In addition, the country’s sovereign debt crisis continues to unfold and the outcomethereof, including related litigation between Argentina and certain of its debt holders, remains uncertain.
Restrictions on Transfer of Funds. Under current foreign exchange regulations, there are restrictions on thetransfer of funds into and from Argentina. In October 2011, the Argentine government introduced additionalrestrictions in connection with the transfer of funds. These measures oblige oil, gas and mining companies torepatriate 100% of their foreign currency earnings; insurance companies to sell all their foreign assets and repatriatethe proceeds, and require official approval to buy U.S. dollars, which approval is contingent on previous taxdeclarations proving the necessary income. There can be no assurance that the Argentine government will notimpose new restrictions on the transfer of funds from Argentina. Transfers of U.S. dollars out of Argentina aresubject to prior government approval and are therefore subject to the political and fiscal situation at the time suchtransfer request is made. The possibility that the government further restricts, either directly or indirectly, thetransfer of dividends from local companies to their foreign shareholders should not be ruled out. If we are unable torepatriate funds from Argentina for whatever reason, we will not be able to use the cash flow from our Argentineoperations to finance our operating requirements elsewhere or to satisfy our debt obligations.
23
In addition, there are restrictions on the transfer of funds into Argentina. Specifically, there are minimumrepayment terms and a mandatory one year deposit requirement for funds transferred into Argentina inconnection with indebtedness owed to non-Argentine residents, certain portfolio investments made by non-Argentine residents and the repatriation of funds by Argentine residents exceeding $2.0 million per month.Certain transactions are exempt from the mandatory one year deposit requirement, including foreign loans tofinance imports and exports, loans to the non-financial sector with an average term of at least two years(including principal and interest payments) if such funds are used exclusively for investments in non-financialassets, direct investments from non-residents and financing obtained to repay foreign financial debt when theproceeds of the loan are used to repay such foreign debt, in compliance with their corporate purpose, bymultilateral and bilateral credit institutions and official credit agencies. There can be no assurance that theserestrictions will not affect our ability to finance our operations in Argentina.
We may seek to acquire suitable companies in the future and if we cannot find suitable targets or cannotintegrate these companies properly into our business after acquiring them, it could have a materialadverse effect on our business, results of operations, financial condition and prospects.
While we have grown almost exclusively organically, we may in the future pursue transactions, includingacquisitions of complementary businesses, to expand our product offerings and geographic presence as part ofour business strategy. These transactions could be material to our financial condition and results of operations.We may not complete future transactions in a timely manner, on a cost-effective basis, or at all, and we may notrealize the expected benefits of any acquisition or investments. Other companies may compete with us for thesestrategic opportunities. We also could experience negative effects on our results of operations and financialcondition from Acquisition related charges, amortization of intangible assets and asset impairment charges, andother issues that could arise in connection with, or as a result of, the of the Reorganization Transaction, includingregulatory or compliance issues that could exist for an acquired company or business and potential adverseshort-term effects on results of operations through increased costs or otherwise. These effects, individually or inthe aggregate, could cause a deterioration of our credit profile and result in reduced availability of credit to us orin increased borrowing costs and interest expense in the future. Additionally, the inability to identify suitableacquisition targets or investments or the inability to complete such transactions may affect our competitiveness.Furthermore, we may not be able to integrate effectively such future acquisitions into our operations and may notobtain the profitability we expect from such acquisitions. Any such risks related to future acquisitions could havea material adverse effect on our business, results of operations, financial condition and prospects.
Our ability to provide our services depends in part upon the quality and reliability of the facilities,machinery and equipment provided by our technology and telecommunications providers, our reliance ona limited number of suppliers of such technology and the services and products of our clients.
The success of our business depends in part on our ability to provide high quality and reliable services,which in part depends upon the proper functioning of facilities, machinery and equipment (including appropriatehardware and software and technological applications) provided by third parties and our reliance on a limitednumber of suppliers of such technology, and is, therefore, beyond our control.
We also depend on the communication services provided by local communication companies in thecountries in which we operate, and any significant disruptions in these services would adversely affect ourbusiness. If these or other third party providers fail to maintain their equipment properly or fail to provide properservices in a timely or reliable manner our clients may experience service interruptions. If interruptions adverselyaffect our services or the perceived quality and reliability of our services, we may lose client relationships or beforced to make significant unplanned investments in the purchase of additional equipment from other providersto ensure that we can continue to provide high quality and reliable services to our clients. In addition, if one ormore of the limited number of suppliers of our technology could not deliver or provide us with the requisitetechnology on a timely basis, our clients could suffer further interruptions. Any such interruptions may have amaterial adverse effect on our business, financial condition, results of operations and prospects.
In addition, in some areas of our business, we depend upon the quality and reliability of the services andproducts of our clients which we help to sell to their end customers. If the services and products we provide toour clients experience technical difficulties, we may have a harder time selling these services and products toother clients, which may have an adverse effect on our business, financial condition, results of operations andprospects.
24
Our business depends in part on our capacity to invest in technology as it develops and substantialincreases in the costs of technology and telecommunications services which we rely on from third partiescould have a material adverse effect on our business, financial condition, results of operations andprospects.
The CRM BPO industry in which we operate is subject to the periodic introduction of new technologywhich often can enable us to service our clients more efficiently and cost effectively. Our business is partlylinked to our ability to recognize these new technological innovations from industry leading providers of suchtechnology and to apply these technological innovations to our business. If we do not recognize the importanceof a particular new technology to our business in a timely manner or are not committed to investing in anddeveloping such new technology and applying these technologies to our business, our current products andservices may be less attractive to existing and new clients, and we may lose market share to competitors whohave recognized these trends and invested in such technology. There can be no assurance that we will havesufficient capacity or capital to meet these challenges. Any such failure to recognize the importance of suchtechnology or a decision not to invest and develop such technology that keeps pace with evolving industrystandards and changing client demands could have a material adverse effect on our business, financial condition,results of operations and prospects.
In addition, any increases in the cost of telecommunications services and products provided by third parties,including telecommunications equipment, software, IT products and related IT services and call centerworkstations have a direct effect on our operating costs. The cost of telecommunications services is subject to anumber of factors, including changes in regulations and the telecommunications market as well as competitivefactors, for example, the concentration and bargaining power of technology and telecommunications suppliers,most of which are beyond our control or which we cannot predict. The increase in the costs of these essentialservices and products could have a material adverse effect on our business, financial condition, results ofoperations and prospects.
If our services do not comply with the quality standards required by our clients or we are in breach of ourobligations under our agreements with our clients, our clients may assert claims for reduced payments tous or substantial damages against us, which could have a material adverse effect on our business,financial condition, results of operations and prospects.
Most of our contracts with clients contain service level and performance requirements, includingrequirements relating to the quality of our services and the timing and quality of responses to the client’sinquiries. In some cases, the quality of services that we provide is measured by quality assurance indicators andsurveys which are based in part on the results of direct monitoring by our clients of interactions between ouremployees and their customers. Failure to consistently meet service requirements of a customer or errors madeby our employees in the course of delivering services to customers could disrupt our client’s business and resultin a reduction in revenue or a claim for substantial damages against us. For example, some of our agreementsstipulate standards of service that, if not met by us, would result in lower payments to us. We also enter intovariable pricing arrangements with certain clients and the quality of services provided may be a component of thecalculation of the total amounts received from such clients under these arrangements.
In addition, in connection with our service contracts, certain representations may be made, includingrepresentations relating to the quality of our services, the ability of our associates and our project managementtechniques. A failure or inability to meet these requirements or a breach of such representations could seriouslydamage our reputation and affect our ability to attract new business or result in a claim for damages against us,which could have a material adverse effect on our business, financial condition, results of operations andprospects.
Our business operations are subject to various regulations and the amendment of these regulations orenactment of new regulations could require us to make additional expenditures, restrict our businessoperations or expose us to significant fines or penalties in the case of non-compliance with such regulations.
Our business operations must be conducted in accordance with a number of sometimes conflictinggovernment regulations, including but not limited to, data protection laws and consumer laws, and laborconditions laws, as well as trade restrictions and sanctions, tariffs, taxation, data privacy and labor relations.
Under data protection laws, we are typically required to manage, utilize and store sensitive or confidentialcustomer data in connection with the services we provide. Under the terms of our client contracts, we representthat we will keep such information strictly confidential. Furthermore, we are subject to local data protection laws,
25
consumer laws and/or “do not call list” regulations in most of the countries in which we operate, all of whichmay require us to make additional expenditures to ensure compliance with these regulations. We also believe thatwe will be subject to additional laws and regulations in the future that may be stricter than those currently inforce to protect consumers and end users. We seek to implement measures to protect sensitive and confidentialcustomer data in accordance with client contracts and data protection laws and consumer laws. If any person,including any of our employees, penetrates our network security or otherwise mismanages or misappropriatessensitive or confidential customer data, we could be subject to significant fines for breaching privacy or dataprotection and consumer laws or lawsuits from our clients or their customers for breaching contractualconfidentiality provisions which could result in negative publicity, legal liability, loss of clients and damage toour reputation, each of which could have a material adverse effect on our business, financial condition, results ofoperations and prospects. In addition, our business operations may be impacted if current regulations are madestricter or more broadly applied or if new regulations are adopted. Violations of these regulations could impactour reputation and result in financial liability, criminal prosecution, unfavorable publicity, restrictions on ourability to process information and breach of our contractual commitments. Any broadening of current regulationsor the introduction of new regulations may require us to make additional expenditures, restrict our businessoperations or expose us to significant fines or penalties, even the temporary shut down our facilities. Any suchviolations or changes in regulations could, as a result, have a material adverse effect on our business, financialcondition, results of operations and prospects.
Damage or disruptions to our key technology systems and facilities either through events beyond orwithin our control that adversely affect our clients’ businesses, could have a material adverse effect onour business, financial condition, results of operations and prospects.
Our key technology systems and facilities may be damaged in natural disasters such as earthquakes or firesor subject to damage or compromise from human error, technical disruptions, power failure, computer glitchesand viruses, telecommunications failures, adverse weather conditions and other unforeseen events, all of whichare beyond our control or through bad service or poor performance which are within our control. Such eventsmay cause disruptions to information systems, electrical power and telephone service for sustained periods. Anysignificant failure, damage or destruction of our equipment or systems, or any major disruptions to basicinfrastructure such as power and telecommunications systems in the locations in which we operate, could impedeour ability to provide services to our clients and thus adversely affect their businesses, have a negative impact onour reputation and may cause us to incur substantial additional expenses to repair or replace damaged equipmentor facilities.
While we currently have property damage insurance in force, our insurance coverage may not be sufficientto guarantee costs of repairing the damage caused from such disruptive events and such events may not becovered under our policies. Prolonged disruption of our services, even if due to events beyond our control couldalso entitle our clients to terminate their contracts with us, which would have a material adverse effect on ourbusiness, financial condition, results of operations and prospects.
Tax matters, new legislation and actions by taxing authorities may have an adverse effect on ouroperations, effective tax rate and financial condition.
We may not be able to predict our future tax liabilities due to the international nature of our operations, aswe are subject to the complex and varying tax laws and rules of several foreign jurisdictions. Our results ofoperations and financial condition could be adversely affected if tax contingencies are resolved adversely or if webecome subject to increased levels of taxation.
We are also subject to income taxes in the United States and numerous other foreign jurisdictions. Our taxexpense and cash tax liability in the future could be adversely affected by numerous factors, including, but notlimited to, changes in tax laws, regulations, accounting principles or interpretations and the potential adverseoutcome of tax examinations and pending tax-related litigation. Changes in the valuation of deferred tax assetsand liabilities, which may result from a decline in our profitability or changes in tax rates or legislation, couldhave a material adverse effect on our tax expense. The governments of foreign jurisdictions from which wedeliver services may assert that certain of our clients have a “permanent establishment” in such foreignjurisdictions by reason of the activities we perform on their behalf, particularly those clients that exercise controlover or have substantial dependency on our services. Such an assertion could affect the size and scope of theservices requested by such clients in the future.
26
Transfer pricing regulations to which we are subject require that any transaction among us and oursubsidiaries be on arm’s-length terms. If the applicable tax authorities were to determine that the transactionsamong us and our subsidiaries do not meet arms’ length criteria, we may incur increased tax liability, includingaccrued interest and penalties. Such increase on our tax expenses would reduce our profitability and cash flows.
Unauthorized disclosure of sensitive or confidential client and customer data, whether through breach ofour computer systems or otherwise, could expose us to protracted and costly litigation and cause us tolose clients.
We are typically required to collect and store sensitive data in connection with our services, includingnames, addresses, social security numbers, credit card account numbers, checking and savings account numbersand payment history records, such as account closures and returned checks. As the complexity of informationinfrastructure continuous to grow, the potential risk of security breaches and cyber-attacks increases. Suchbreaches can lead to shutdowns or system interruptions, and potential unauthorized disclosure of sensitive orconfidential information. We are also subject to numerous laws and regulations designed to protect thisinformation. Laws and regulations that impact our business are increasing in complexity, change frequently, andat times conflict among the various jurisdictions where we do business.
In addition, many of our service agreements with our clients do not include any limitation on our liability toclients with respect to breaches of our obligation to keep the information we receive confidential. We takeprecautions to protect confidential client and customer data. However, if any person, including any of ouremployees, gains unauthorized access or penetrates our network security or otherwise mismanages ormisappropriates sensitive data or violates our established data and information security controls, we could besubject to significant liability to our clients or their customers for breaching contractual confidentiality provisionsor privacy laws, including legal proceedings, monitory damages, significant remediation costs and regulatoryenforcement actions. Penetration of the network security of our data centers could have a negative impact on ourreputation, which could have a material adverse effect on our business, results of operations, financial conditionand prospects.
Our results of operations could be adversely affected if we are unable to maintain effective internalcontrols.
Any internal and disclosure controls and procedures, no matter how well conceived and operated, canprovide only reasonable, not absolute, assurance that the objectives of the control system are met. The design of acontrol system must consider the benefits of controls relative to their costs. Inherent limitations within a controlsystem include the realities that judgments in decision—making can be faulty, and that breakdowns can occurbecause of simple error or mistake. Additionally, controls can be circumvented by individuals acting alone or incollusion with others to override controls. Accordingly, because of the inherent limitations in the design of a costeffective control system, misstatements due to error or fraud may occur and may not always be prevented ortimely detected. If we are unable to assert that our internal controls over financial reporting are effective now orin the future, or if our auditors are unable to express an opinion on the effectiveness of our internal controls, wecould lose investor confidence in the accuracy and completeness of our financial reports, which could have anadverse effect on our stock price.
We are a party to a number of labor disputes resulting from our operations in Brazil.
As of December 31, 2014, Atento Brasil S.A. (“Atento Brazil”) was party to approximately 10,022 labordisputes initiated by our employees or former employees for various reasons, such as dismissals or disputes overemployment conditions. The estimated amount involved in these claims total $98.4 million of which$53.9 million have been classified as probable, $39.4 million classified as possible and $5.0 million classified asremote, based on inputs from external and internal counsels as well as historical statistics. In connection withsuch disputes, Atento Brazil and its affiliates have, in accordance with local laws, deposited $35.6 million withthe Brazilian courts as security for claims made by employees or former employees (the “Judicial Deposits”). Inaddition, considering the levels of litigation in Brazil and our historical experience with these types of claims, asof December 31, 2014, we have recognized $53.9 million of provisions ($71.9 million as of December 31, 2013and $71.8 million as of December 31, 2012). We are also a party to various labor disputes and potential disputesin other jurisdictions in which we operate, including Argentina and Mexico. If our provisions for any of our laborclaims are insufficient or the claims against us rise significantly in the future, this could have a material adverseeffect on our business, financial condition, results of operations and prospects. See “Financial Information—Legal Proceedings”.
27
Our existing debt may affect our flexibility in operating and developing our business and our ability tosatisfy our obligations.
As of December 31, 2014, we had total indebtedness of $653.3 million. Our level of indebtedness may havesignificant negative effects on our future operations, including:
• impairing our ability to obtain additional financing in the future (or to obtain such financing onacceptable terms) for working capital, capital expenditures, acquisitions or other important needs;
• requiring us to dedicate a substantial portion of our cash flow to the payment of principal and intereston our indebtedness, which could impair our liquidity and reduce the availability of our cash flow tofund working capital, capital expenditures, acquisitions and other important needs;
• increasing the possibility of an event of default under the financial and operating covenants containedin our debt instruments; and
• limiting our ability to adjust to rapidly changing conditions in the industry, reducing our ability towithstand competitive pressures and making us more vulnerable to a downturn in general economicconditions or business than our competitors with less debt.
If we are unable to generate sufficient cash flow from operations to service our debt, we may be required torefinance all or a portion of our existing debt or obtain additional financing. We cannot assure you that any suchrefinancing would be possible or that any additional financing could be obtained. Our inability to obtain suchrefinancing or financing may have a material adverse effect on our business, financial condition, results ofoperations and prospects.
During the year ended December 31, 2014 we drew down BRL161.5 million (equivalent to $60.8 million)under our credit agreement with BNDES. On May 30, 2014, Midco issued PECs for an aggregate amount of€64.1 million (equivalent to $87.3 million) which proceeds were applied to make a partial prepayment of theVendor Loan Note. In addition, the MSA with Telefónica was amended and Telefónica agreed to compensate uswith a penalty fee amounting to €25.4 million (equivalent to $30.9 million for the year ended December 31,2014). We, in turn, used this amount to partially prepay the Vendor Loan Notes due to Telefónica. We prepaidBRL34.4 million, BRL45.0 million and BRL80.0 million, respectively (equivalent to $15.5 million,$20.4 million and $33.1 million, respectively) of the Brazilian Debentures. Finally, the Company, in connectionwith the IPO completed the following operations: on October 3, 2014, capitalized the Preferred EquityCertificates for a total amount of €460.1 million (approximately $575.9 million), and on October 7, 2014, repaidthe entire outstanding amount under the Vendor Loan Note for a total amount of €23.3 million (approximately$29.5 million).
For the year ended December 31, 2014, our cash flow used for debt service totaled $283,7 million, whichincluded voluntary prepayments of our Brazilian Debentures of BRL34.4 million (equivalent to $15.5 million) onMay 12, 2014, BRL45.0 million (equivalent to $20.4 million) on June 26, 2014, and BRL80.0 million (equivalentto $33.1 million) on August 28, 2014, voluntary prepayments of our Vendor Loan Note of €64.1 million(equivalent to $87.3 million) on May 30, 2014, and €23.3 million (equivalent to $29.5 million) on October 7,2014, and interest payments of $96.5 million. Also, during the year ended December 31, 2014, our net cash flowsfrom operating activities totaled $135.3 million, which includes interest paid of $96.5 million. As such, our netcash flows from operating activities (before giving effect to the payment of interest) amounted to $231.8 million.Cash flow used to service our debt represented 122.4% of our net cash flows from operating activities (beforegiving effect to the payment of interest). Excluding the voluntary prepayments of our Brazilian Debentures andVendor Loan Note mentioned above, our cash flow related to interest payment and mandatory debt repaymentrepresented 43.1% of the cash flows from operating activities (before considering the effect of the payment ofinterest).
In addition, several of our financing arrangements contain a number of covenants and restrictions includinglimits on our ability and our subsidiaries’ ability to incur additional debt, pay dividends and make certaininvestments. Complying with these covenants may cause us to take actions that make it more difficult tosuccessfully execute our business strategy and we may face competition from companies not subject to suchrestrictions. Moreover, our failure to comply with these covenants could result in an event of default or refusal byour creditors to renew certain of our loans.
28
Risks Related to Investment in a Luxembourg Company
We are a Luxembourg public limited liability company (société anonyme) and it may be difficult for youto obtain or enforce judgments against us or our executive officers and directors in the United States.
We are organized under the laws of the Grand Duchy of Luxembourg. Most of our assets are located outsidethe United States. Furthermore, some of our directors and officers named in this Annual Report reside outside theUnited States and most of their assets are located outside the United States. As a result, investors may find itdifficult to effect service of process within the United States upon us or these persons or to enforce outside theUnited States judgments obtained against us or these persons in U.S. courts, including judgments in actionspredicated upon the civil liability provisions of the U.S. federal securities laws. Likewise, it may also be difficultfor an investor to enforce in U.S. courts judgments obtained against us or these persons in courts located injurisdictions outside the United States, including actions predicated upon the civil liability provisions of theU.S. federal securities laws. It may also be difficult for an investor to bring an original action in a Luxembourgcourt predicated upon the civil liability provisions of the U.S. federal securities laws against us or these persons.Luxembourg law, furthermore, does not recognize a shareholder’s right to bring a derivative action on behalf ofthe Company.
As there is no treaty in force on the reciprocal recognition and enforcement of judgments in civil andcommercial matters between the United States and the Grand Duchy of Luxembourg, courts in Luxembourg willnot automatically recognize and enforce a final judgment rendered by a U.S. court. The enforceability inLuxembourg courts of judgments entered by U.S. courts will depend upon the conditions set forth in theLuxembourg procedural code, which may include the following:
• the judgment of the U.S. court is enforceable (exécutoire) in the United States;
• the U.S. court had jurisdiction over the subject matter leading to the judgment (that is, its jurisdictionwas in compliance both with Luxembourg private international law rules and with the applicabledomestic U.S. federal or state jurisdictional rules);
• the U.S. court has applied to the dispute the substantive law designated by the Luxembourg conflict oflaw rules (although one first instance decision rendered in Luxembourg—which had not beenappealed—no longer applies this condition);
• the judgment was granted following proceedings where the counterparty had the opportunity to appear,and if appeared, there was no violation of the rights of the defendant;
• the U.S. court has acted in accordance with its own procedural rules; and
• the judgment of the U.S. court does not contravene Luxembourg international public policy.
Our directors and officers, past and present, are entitled to indemnification from us to the fullest extentpermitted by Luxembourg law against liability and all expenses reasonably incurred or paid by him in connectionwith any losses or liabilities, claim, action, suit or proceeding in which he is involved by virtue of his being orhaving been a director or officer and against amounts paid or incurred by him in the settlement thereof, subject tolimited exceptions. To the extent allowed by law, the rights and obligations among us and any of our current orformer directors and officers will be governed exclusively by the laws of Luxembourg and subject to thejurisdiction of the Luxembourg courts, unless such rights or obligations do not relate to or arise out of theircapacities as directors or officers. Although there is doubt as to whether U.S. courts would enforce such aprovision in an action brought in the United States under U.S. securities laws, such provision could makeenforcing judgments obtained outside Luxembourg more difficult to enforce against our assets in Luxembourg orin jurisdictions that would apply Luxembourg law.
Our shareholders may have more difficulty protecting their interests than they would as shareholders of aU.S. corporation.
Our corporate affairs are governed by our articles of association and by the laws governing public limitedliability companies organized under the laws of the Grand Duchy of Luxembourg. The rights of our shareholdersand the responsibilities of our directors and officers under Luxembourg law are different from those applicable toa corporation incorporated in the United States. Luxembourg law and regulations in respect of corporategovernance matters might not be as protective of minority shareholders as state corporation laws in the UnitedStates. Therefore, our shareholders may have more difficulty in protecting their interests in connection withactions taken by our directors and officers or our principal shareholders than they would as shareholders of acorporation incorporated in the United States.
29
You may not be able to participate in equity offerings, and you may not receive any value for rights thatwe may grant.
Pursuant to Luxembourg law on commercial companies, dated August 10, 1915, as amended (the“Luxembourg Corporate Law”), existing shareholders are generally entitled to pre-emptive subscription rights inthe event of capital increases and issues of shares against cash contributions. However, our articles of associationprovide that pre-emptive subscription rights can be limited, waived or cancelled by our board of directors for aperiod ending on the fifth anniversary of the date of publication of the notarial deed recording the minutes of theextraordinary general shareholders’ meeting in the Luxembourg Legal Gazette approving an increase of the sharecapital by the board of directors within the limits of the authorized share capital, which publication has occurredon 3 December 2014. The general meeting of our shareholders may renew, expand or amend such authorization.See Item IOB “Articles of association.” for additional detail.
Luxembourg insolvency laws may offer our shareholders less protection than they would have underU.S. insolvency laws.
As a company organized under the laws of the Grand Duchy of Luxembourg and with our registered officein Luxembourg, we are subject to Luxembourg insolvency laws in the event any insolvency proceedings areinitiated against us including, amount other things, Council Regulation (EC) No. 1346/2000 of May 29, 2000 oninsolvency proceedings. Should courts in another European country determine that the insolvency laws of thatcountry apply to us in accordance with and subject to such EU regulations, the courts in that country could havejurisdiction over the insolvency proceedings initiated against us. Insolvency laws in Luxembourg or the relevantother European country, if any, may offer our shareholders less protection than they would have underU.S. insolvency laws and make it more difficult for them to recover the amount they could expect to recover in aliquidation under U.S. insolvency laws.
Risks Related to Our Ordinary Shares
Control by Bain Capital could adversely affect our other shareholders.
Bain Capital controls Topco and PikCo, and owns, directly or indirectly, approximately 85.1% of ourordinary shares, Bain Capital have a continuing ability to control our board of directors and to exercisesignificant influence over our affairs for the foreseeable future, including controlling the election of directors andsignificant corporate transactions, such as a merger or other sale of our Company or our assets.
In addition, because we are a foreign private issuer, we are not subject to the independence requirements ofthe New York Stock Exchange that require that our board of directors be comprised of a majority of independentdirectors, that we have a compensation committee comprised solely of independent directors and that we have anominating and governance committee comprised solely of independent directors.
This concentrated control by Bain Capital limits the ability of other shareholders to influence corporatematters and, as a result, we may take actions that our other shareholders do not view as beneficial. For example,this concentration of ownership could have the effect of delaying or preventing a change in control or otherwisediscouraging a potential acquirer from attempting to obtain control of us, which in turn could cause the marketprice of our ordinary shares to decline or prevent our shareholders from realizing a premium over the marketprice for their ordinary shares.
As a foreign private issuer, we are permitted to, and rely on exemptions from certain corporategovernance standards applicable to U.S. issuers, including the requirement that a majority of an issuer’sdirectors consist of independent directors. This may afford less protection to holders of our ordinaryshares.
The New York Stock Exchange listing rules requires listed companies to have, among other things, amajority of their board members be independent, and to have independent director oversight of executivecompensation, nomination of directors and corporate governance matters. As a foreign private issuer, however,while we intend to comply with these requirements within the permitted phase-in periods, we are permitted tofollow home country practice in lieu of the above requirements. Luxembourg law, the law of our home country,does not require that a majority of our board consist of independent directors or the implementation of anominating and corporate governance committee, and our board may thus in the future not include, or includefewer, independent directors than would be required if we were subject to the New York Stock Exchange listingrules, or they may decide that it is in our interest not to have a compensation committee or nominating and
30
corporate governance committee, or have such committees governed by practices that would not comply withNew York Stock Exchange listing rules. Since a majority of our board of directors may not consist ofindependent directors if we decide to rely on the foreign private issuer exemption to the New York StockExchange listing rules, our board’s approach may, therefore, be different from that of a board with a majority ofindependent directors, and as a result, the management oversight of our Company could, in the future, be morelimited than if we were subject to the New York Stock Exchange listing rules.
Moreover, we are not required to file periodic reports and financial statements with the SEC as frequently oras promptly as companies that are not foreign private issuers whose securities are registered under the ExchangeAct. In addition, we are not required to comply with Regulation FD, which restricts the selective disclosure ofmaterial information. As a result, our shareholders may not have access to information they deem important,which may result in our shares being less attractive to investors.
We may be classified as a passive foreign investment company, which could result in adverse U.S. federalincome tax consequences to U.S. Holders of our ordinary shares.
Based on the composition of our income, assets and operations, we do not expect to be treated as a passiveforeign investment company (“PFIC”) for U.S. federal income tax purposes for the current taxable year or in theforeseeable future. However, the application of the PFIC rules is subject to uncertainty in several respects, andwe cannot assure you the U.S. Internal Revenue Service will not take a contrary position. Furthermore, this is afactual determination that must be made annually after the close of each taxable year. If we are a PFIC for anytaxable year during which a “U.S. Holder” (a beneficial owner of ordinary shares that is for U.S. federal incometax purposes: (a) an individual who is a citizen or resident of the U.S.; (b) a corporation (or other entity taxable asa corporation for U.S. federal income tax purposes) created or organized in or under the laws of the U.S., anystate thereof or the District of Columbia; (c) an estate the income of which is subject to U.S. federal incometaxation regardless of its source; or (d) a trust (i) if a court within the U.S. can exercise primary supervision overits administration, and one or more U.S. persons have the authority to control all of the substantial decisions ofthat trust, or (ii) that was in existence on August 20, 1996 and validly elected under applicable TreasuryRegulations to continue to be treated as a domestic trust) holds our ordinary shares, certain adverse U.S. federalincome tax consequences could apply to such U.S. Holder.
The market price of our ordinary shares may be volatile and may trade at prices below the initial publicoffering price.
The stock market in general, and the market for equities of newly-public companies in particular, have beenhighly volatile. As a result, the market price of our ordinary shares is likely to be similarly volatile, and investorsin our ordinary shares may experience a decrease, which could be substantial, in the value of their ordinaryshares, including decreases unrelated to our operating performance or prospects, or a complete loss of theirinvestment. The price of our ordinary shares could be subject to wide fluctuations in response to a number offactors, including those listed elsewhere in this “Risk Factors” section and others such as:
• variations in our operating performance and the performance of our competitors;
• actual or anticipated fluctuations in our quarterly or annual operating results;
• changes in our revenues or earnings estimates or recommendations by securities analysts;
• publication of research reports by securities analysts about us or our competitors or our industry;
• our failure or the failure of our competitors to meet analysts’ projections or guidance that we or ourcompetitors may give to the market;
• additions or departures of key personnel;
• strategic decisions by us or our competitors, such as acquisitions, divestitures, spin-offs, joint ventures,strategic investments or changes in business strategy;
• announcement of technological innovations by us or our competitors;
• the passage of legislation, changes in interpretations of laws or other regulatory events or developmentsaffecting us;
• speculation in the press or investment community;
• changes in accounting principles;
31
• terrorist acts, acts of war or periods of widespread civil unrest;
• changes in general market and economic conditions;
• changes or trends in our industry;
• investors’ perception of our prospects; and
• adverse resolution of any new or pending litigation against us.
In the past, securities class action litigation has often been initiated against companies following periods ofvolatility in their stock price. This type of litigation could result in substantial costs and divert our management’sattention and resources, and could also require us to make substantial payments to satisfy judgments or to settleor defend litigation.
Future sales of our ordinary shares, or the perception in the public markets that these sales may occur,could depress our share price.
The market price of our ordinary shares could decline as a result of sales of a large number of our ordinaryshares in the market, and the perception that these sales could occur may also depress the market price of ourordinary shares. We have 73.6 million ordinary shares outstanding as of March 12, 2015. Of these shares,15.3 million ordinary shares were sold in our initial public offering and are freely tradable in the United States,except for any ordinary shares purchased by our “affiliates” as defined in Rule 144 under the Securities Act.
PikCo is entitled, under contracts providing for registration rights, to require us to register our ordinaryshares owned by them with the SEC. Upon effectiveness of any registration statement, subject to lock-upagreements with the representatives of the underwriters, those ordinary shares will be available for immediateresale in the United States in the open market.
Sales of our ordinary shares or pursuant to registration rights may make it more difficult for us to sell equitysecurities in the future at a time and at a price that we deem appropriate. These sales, or the perception that suchsales could occur, also could cause the market price for our ordinary shares to fall and make it more difficult foryou to sell our ordinary shares.
Any determination to pay dividends is at the discretion of our board of directors, and we may not pay anydividends. Accordingly, investors may only realize future gains on their investments if the price of theirordinary shares increases, which may never occur.
Though we currently intend to pay dividends, any such determination to pay dividends will be at thediscretion of our board of directors. The payment of cash distributions on ordinary shares is restricted under theterms of our Senior Secured Notes, Brazilian Debentures, and our CVIs. In addition, because we are a holdingcompany, our ability to make any distributions on ordinary shares may be limited by restrictions on our ability toobtain sufficient funds from subsidiaries, including restrictions under the terms of our Senior Secured Notes,Brazilian Debentures and our CVIs. Furthermore, under the laws of Luxembourg, we are able to makedistributions only to the extent that we have profits available and distributable reserves. Accordingly, investorsmay only realize future gains on their investments if the price of their ordinary shares increases, which may neveroccur. See “Financial Information—Dividend Distributions.”
If securities or industry analysts do not publish research or reports about our business, if they adverselychange their recommendations regarding our ordinary shares or if our operating results do not meettheir expectations, the price of our ordinary shares could decline.
The market price of our ordinary shares is influenced by the research and reports that industry or securitiesanalysts publish about us or our business. If one or more of these analysts cease coverage of our Company or failto publish reports on us regularly, we could lose visibility in the financial markets, which in turn could cause themarket price of our ordinary shares or its trading volume to decline. Moreover, if one or more of the analysts whocover our Company downgrade our ordinary shares or if our operating results or prospects do not meet theirexpectations, the market price of our ordinary shares could decline.
32
Future equity issuances may dilute the holdings of ordinary shareholders and could materially affect themarket price of our ordinary shares.
We may in the future decide to offer additional equity to rise capital or for other purposes. Any suchadditional offering could reduce the proportionate ownership and voting interests of holders of our ordinaryshares, as well as our earnings per ordinary share and net asset value per ordinary share. Future sales ofsubstantial amounts of our ordinary shares in the public market, whether by us or by our existing shareholders, orthe perception that sales could occur, may adversely affect the market price of our shares, which could declinesignificantly.
We have incurred higher costs as a result of becoming a public company.
As a public company, we have incurred significant legal, accounting, insurance and other expenses that wehad not incurred as a private company, including costs associated with public company reporting requirements.We also have incurred and will incur costs associated with the Sarbanes-Oxley Act of 2002 and the Dodd FrankWall Street Reform and Consumer Protection Act and related rules implemented by the SEC and the New YorkStock Exchange. The expenses incurred by public companies generally for reporting and corporate governancepurposes have been increasing in recent years. We expect that compliance with these rules and regulations willincrease our legal and financial compliance costs and make some activities more time-consuming and costly,although we are currently unable to estimate these costs with any degree of certainty. These laws and regulationscould also make it more difficult or costly for us to obtain certain types of insurance, including director andofficer liability insurance, and we may be forced to accept reduced policy limits and coverage or incursubstantially higher costs to obtain the same or similar coverage. These laws and regulations could also make itmore difficult for us to attract and retain qualified persons to serve on our board of directors, our boardcommittees or as our executive officers. Furthermore, if we are unable to satisfy our obligations as a publiccompany, we could be subject to delisting of our ordinary shares, fines, sanctions and other regulatory action andpotentially civil litigation.
Compliance with Section 404 of the Sarbanes-Oxley Act of 2002 will require significant expenditures andeffort by management, and if our independent registered public accounting firm is unable to provide anunqualified attestation report on our internal controls, the market price of our ordinary shares could beadversely affected.
Pursuant to Section 404 of the Sarbanes-Oxley Act of 2002 and related rules and regulations and beginningwith our Annual Report on Form 20-F for the year ending December 31, 2015, our management will be requiredto report on, and our independent registered public accounting firm to attest to, the effectiveness of our internalcontrols over financial reporting. The rules governing the standards that must be met for management to assessour internal controls over financial reporting are complex and require significant documentation, testing andpossible remediation. We are currently in the process of reviewing, documenting and testing our internal controlsover financial reporting. We may encounter problems or delays in completing the implementation of any changesnecessary to make a favorable assessment of our internal controls over financial reporting.
ITEM 4. INFORMATION ON THE COMPANY
A. History and Development of the Company
History and Structure
Our legal name is Atento S.A. We are a public limited liability company (“société anonyme”) organized andexisting under the laws of the Grand Duchy of Luxembourg on March 5, 2014 and have our registered office at 4rue Hemmer, L-1748 Luxembourg Findel, Grand Duchy of Luxembourg. American Stock Transfer & TrustCompany, LLC is the U.S. agent.
Our principal executive offices are located at Av. das Nações Unidas, 14.171, Rochaverá—Brooklin Novo,São Paulo, 04794-000, telephone number +55 (11) 3779-0881, Av. Yucatán 15, Col. Hipódromo Condesa.México D.F 06700, and C/ Santiago de Compostela 94, 28035 Madrid. Our agent for service of process in theUnited States is American Stock Transfer & Trust Company, LLC.
We were founded in 1999 to consolidate the Telefónica Group’s CRM services into a single company totake advantage of the expected demand in CRM services and to capture efficiencies of scale, with the start-up ofour operations in Brazil, Chile, El Salvador, Guatemala, Peru, Puerto Rico and Spain. By 2000, we had launched
33
our operations in other countries including Argentina, Colombia, and Morocco, while further growing ourBrazilian operations and in 2001 our operations in Mexico. We then began to increase our focus on consolidationand business profitability.
We continued our geographic expansion launching our Uruguay operations and our commercial offices inFrance in 2006 and Panama in 2007. From 2003 to 2007, we focused on implementing our differentiationstrategy by offering higher quality solutions, superior value-added services and developing and maintaining long-term relationships. This strategy was very successful, delivering a significant increase in revenue and operatingprofit during the years from 2003 to 2007.
In 2008, we broadened our strategic targets to include the pursuit and provision of new businessopportunities, while continuing our strategy of differentiation by offering higher quality solutions, superiorvalue-added services and continue building and maintaining long-term relationships. We also expanded ourgeographical presence in 2008 in the Czech Republic and in 2009; we began operations in the United States.
In December 2012, Bain Capital acquired the Atento Group from Telefónica. The transition from aTelefónica subsidiary to a standalone business has been very successful and with no business disruption as aresult of the carve-out. We have also continued to benefit from the loyalty from our long-standing clients andhave further increased our portfolio with new relevant customer wins. We also continued to evolve our offeringand deliver increasingly more complex end-to-end customer experience solutions to our clients. In order toaccelerate the transition as an independent company and to fully capture the favorable growth trends of theindustry, our management team structure was strengthened including appointments of a new Chief FinancialOfficer, Director of Technology, and Chief Commercial Officer, and the reinforcement of our salesforce toactively pursue telecom clients other than Telefónica and target cross-border multinational clients.
In connection with acquisition of Bain Capital, Atento further reinforced its partnership with Telefónica, andin 2012 we signed the MSA agreement with a nine year term through 2021, which includes annual minimumrevenue commitments in all jurisdictions (except for Argentina).
In October, 2014, pursuant to the Reorganization Transaction, as described in section “Basis of Presentationand Other Information” and the IPO, Atento became a publicly listed company on the New York Stock Exchange(NYSE), under the ticket “ATTO” floating a 13.6% of its share capital. See section “Bases of Presentation andOther Information”.
In December 2014, Atento S.A. entered through its indirect subsidiary, Atento Spain Holdco, into anagreement for the sale of the 100% of the share capital of ATENTO CESKÁ REPUBLIKA A.S., which owns itsoperations in the Czech Republic, with COMDATA S.P.A. allowing it to continue strengthening the focus on itscore markets encompassing the Pan-LatAm region.
As at December 30, 2014, the Company, through its wholly owned subsidiary Atento Brasil S.A. acquired100% of the share capital of Casa Bahia Contact Center Ltda. (“CBCC”), a call center services provider locatedin Brazil. At December 30, 2014, this company has been renamed as AtentoBrasil 1, Ltda.
Capital Expenditures
Our business has significant capital expenditure requirements, including for the construction and initial fit-out of our service delivery centers; improvements and refurbishment of leased facilities for our service deliverycenters; acquisition of various items of property, plant and equipment, mainly comprised of furniture, computerequipment and technology equipment; and acquisition and upgrades of our software or specific customer’ssoftware.
The funding of the majority of our capital expenditures is covered by existing cash and EBITDA generation.
34
The table below sets forth our historic capital expenditures by segment for the year ended December 31,2012, December 31, 2013 and December 31, 2014:
PredecessorNon-IFRS
Aggregated
Period fromJan 1 – Nov 30,
2012
Period fromDec 1 – Dec 31,
2012
For theyear ended
December 31,2012
For theyear ended
December 31,2013 2014
($ in millions) (unaudited)
Brazil 55.4 10.3 65.7 63.2 76.6Americas 11.4 12.3 23.7 31.8 38.0EMEA 9.7 4.0 13.7 7.2 4.2Other and eliminations 0.4 1.8 2.2 0.8 1.3
Total capital expenditures 76.9 28.4 105.3 103.0 120.1
We expect that our capital expenditures will increase in the future as our business continues to develop andexpand.
B. Business Overview
Our Company
Atento is the largest provider of CRM BPO services and solutions in Latin America and Spain and amongthe top three providers globally based on revenues. Our business was founded in 1999 as the CRM BPO providerto the Telefónica Group. Since then, we have significantly diversified our client base, and subsequent to theacquisition by funds affiliated with Bain Capital in December 2012, we became an independent company.
Latin America is one of the most attractive CRM BPO markets globally, and Atento is uniquely positionedas one of the few scale players in the region to capture this growth potential. According to Frost & Sullivan,Latin America is the fastest growing CRM BPO market in the world with a market size of $11.4 billion in 2014.
The potential for growth in the markets where we operate is significant and there are a number of trendssupporting it including (i) sustained demand growth driven by a high growth population and an emerging middleclass (ii) continued trend for further outsourcing of CRM BPO operations. During 2014, approximately 32.4% ofdomestic CRM BPO operations in Latin America were outsourced to third-party providers, based on number ofagent seats, compared to 27.1% in 2007, according to Frost & Sullivan (iii) limited number of large scaleoperators in Latin America (iv) North America’s continued off-shoring trend as U.S.-based businesses continueto off-shore call center services to other geographies.
As the largest provider of CRM BPO services in Latin America, we hold #1 market share positions in mostof the countries where we operate, based on revenues for the year ended December 31, 2013, according toFrost & Sullivan. From 2009 to 2012, we expanded our CRM BPO market leadership position in Latin Americaoverall from 19.1% to 20.1% and increased our market share in Brazil from 23.3% in 2009 to 25.5% in 2014,based on revenue. We have achieved our leadership position over our 15-year history through our dedicatedfocus on superior client service, our scaled and reliable technology and operational platform, a deepunderstanding of our clients’ diverse local needs and our highly engaged employee base. Given its growthoutlook, Latin America is one of the most attractive CRM BPO markets globally and we believe we are distinctlypositioned as one of the few scale operators in the region.
We offer a comprehensive portfolio of CRM BPO services, including customer service, sales, creditmanagement, technical support, service desk and back office services. We are evolving from offering individualCRM BPO services to combining multiple service offerings, covering both the front-end and the back-end of ourclients’ customer experience, into customized solutions adapted to our clients’ needs. We believe that thesecustomized customer solutions provide an improved experience for our clients’ customers and create strongercustomer relationships, which reinforces our clients’ brand recognition and enhances customer loyalty. Ourservices and solutions are delivered across multiple channels including digital (SMS, email, chats, social mediaand apps, among others) and voice, and are enabled by process design, technology and intelligence functions. In2014, CRM BPO solutions and individual services comprised approximately 23.2% and 76.8% of our revenues,respectively. In Brazil, the CRM BPO solutions segment grew from 16% of our revenue in 2011 to 35.3% of ourrevenue in 2014.
35
We also enjoy long-standing client relationships across a variety of industries working with market leadersin sectors such as telecommunications, financial services and multi-sector, which for us comprises the consumergoods, services, public administration, pay TV, healthcare, transportation, technology and media industries. In2014, approximately 49.1% of our revenue was derived from sales to telecommunications, 35.2% to financialservices and 15.7% to multi-sector clients. Since our founding in 1999, we have significantly diversified thesectors we serve and our client base to over 400 separate clients resulting in non-Telefónica revenue accountingfor 53.5% in 2014 compared to approximately 10% of the revenue of AIT Group in 1999.
Atento benefits from a highly engaged employee base. Our over 154,000 employees worldwide are criticalto our ability to deliver best-in-class customer service. In 2014, we were recognized by Great Place to WorkInstitute as one of the world’s top 25 multinationals globally to work for the second consecutive year.
We have a strong relationship with Telefónica underpinned by long-Term MSA expiring in 2021, currentlyserving 38 companies of the Telefónica Group under 160 arm’s-length contracts. Although the MSA is anumbrella agreement which governs our services agreements with the Telefónica Group companies, thetermination of the MSA on December 31, 2021 does not automatically result in a termination of any of the localservices agreements in force after that date.
Our revenue for the year ended December 31, 2014 was $2,298.3 million, our Adjusted EBITDA was$306.4 million and our profit/(loss) for the period was a loss of $42.1 million. For the year ended December 31,2013 and 2014, our revenue increased by 1.0% and decreased by 1.8%, respectively, and our Adjusted EBITDAincreased by 10.1% and 3.8%, respectively. For the years ended December 31, 2013 and 2014, respectively,excluding the impact of foreign exchange, our revenue increased by 7.5% and 7.7%, and our Adjusted EBITDAincreased by 16.9% and 13.7%.
The following table sets forth a breakdown of revenue based on geographical region for the year endedDecember 31, 2012, December 31, 2013 and December 31, 2014:
Predecessor
Non-IFRSAggregated(unaudited)
Year endedDecember 31
($ in millions, except percentage changes)
Period fromJan 1 – Nov 30,
2012
Period fromDec 1 – Dec 31,
2012 2012 2013 2014
(unaudited)
Brazil 1,116.8 96.3 1,213.1 1,206.1 1,184.8Americas 662.1 64.1 726.2 772.7 779.4EMEA 347.8 30.7 378.5 363.1 334.8Other and eliminations(1) (0.8) (0.2) (1.0) (0.8) (0.7)
Total 2,125.9 190.9 2,316.8 2,341.1 2,298.3
36
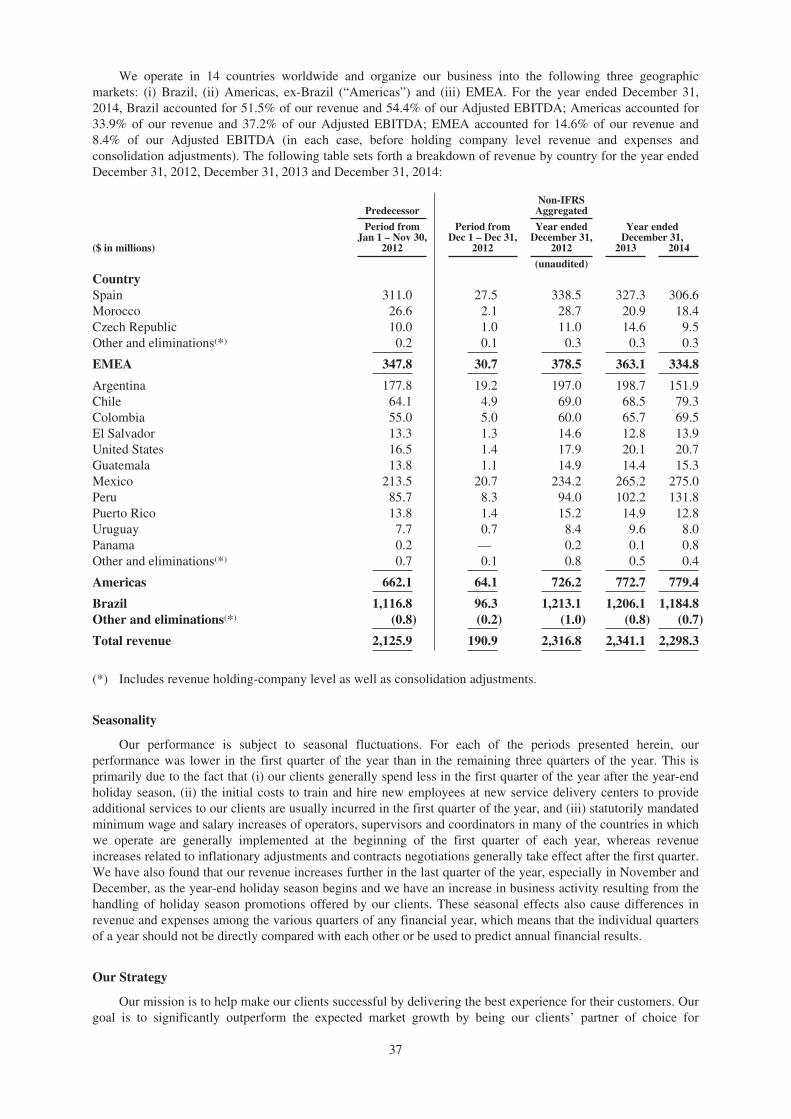
We operate in 14 countries worldwide and organize our business into the following three geographicmarkets: (i) Brazil, (ii) Americas, ex-Brazil (“Americas”) and (iii) EMEA. For the year ended December 31,2014, Brazil accounted for 51.5% of our revenue and 54.4% of our Adjusted EBITDA; Americas accounted for33.9% of our revenue and 37.2% of our Adjusted EBITDA; EMEA accounted for 14.6% of our revenue and8.4% of our Adjusted EBITDA (in each case, before holding company level revenue and expenses andconsolidation adjustments). The following table sets forth a breakdown of revenue by country for the year endedDecember 31, 2012, December 31, 2013 and December 31, 2014:
PredecessorNon-IFRS
Aggregated
Period fromJan 1 – Nov 30,
Period fromDec 1 – Dec 31,
Year endedDecember 31,
Year endedDecember 31,
($ in millions) 2012 2012 2012 2013 2014
(unaudited)
CountrySpain 311.0 27.5 338.5 327.3 306.6Morocco 26.6 2.1 28.7 20.9 18.4Czech Republic 10.0 1.0 11.0 14.6 9.5Other and eliminations(*) 0.2 0.1 0.3 0.3 0.3
EMEA 347.8 30.7 378.5 363.1 334.8
Argentina 177.8 19.2 197.0 198.7 151.9Chile 64.1 4.9 69.0 68.5 79.3Colombia 55.0 5.0 60.0 65.7 69.5El Salvador 13.3 1.3 14.6 12.8 13.9United States 16.5 1.4 17.9 20.1 20.7Guatemala 13.8 1.1 14.9 14.4 15.3Mexico 213.5 20.7 234.2 265.2 275.0Peru 85.7 8.3 94.0 102.2 131.8Puerto Rico 13.8 1.4 15.2 14.9 12.8Uruguay 7.7 0.7 8.4 9.6 8.0Panama 0.2 — 0.2 0.1 0.8Other and eliminations(*) 0.7 0.1 0.8 0.5 0.4
Americas 662.1 64.1 726.2 772.7 779.4
Brazil 1,116.8 96.3 1,213.1 1,206.1 1,184.8Other and eliminations(*) (0.8) (0.2) (1.0) (0.8) (0.7)
Total revenue 2,125.9 190.9 2,316.8 2,341.1 2,298.3
(*) Includes revenue holding-company level as well as consolidation adjustments.
Seasonality
Our performance is subject to seasonal fluctuations. For each of the periods presented herein, ourperformance was lower in the first quarter of the year than in the remaining three quarters of the year. This isprimarily due to the fact that (i) our clients generally spend less in the first quarter of the year after the year-endholiday season, (ii) the initial costs to train and hire new employees at new service delivery centers to provideadditional services to our clients are usually incurred in the first quarter of the year, and (iii) statutorily mandatedminimum wage and salary increases of operators, supervisors and coordinators in many of the countries in whichwe operate are generally implemented at the beginning of the first quarter of each year, whereas revenueincreases related to inflationary adjustments and contracts negotiations generally take effect after the first quarter.We have also found that our revenue increases further in the last quarter of the year, especially in November andDecember, as the year-end holiday season begins and we have an increase in business activity resulting from thehandling of holiday season promotions offered by our clients. These seasonal effects also cause differences inrevenue and expenses among the various quarters of any financial year, which means that the individual quartersof a year should not be directly compared with each other or be used to predict annual financial results.
Our Strategy
Our mission is to help make our clients successful by delivering the best experience for their customers. Ourgoal is to significantly outperform the expected market growth by being our clients’ partner of choice for
37

customer experience while obtaining margin efficiencies. We have laid out a clear strategy and a number ofinitiatives around 3 key pillars to bring Atento to its full potential: transformational growth, best in classoperations and inspiring people. In 2014, the focused execution of our strategy has resulted in very significantachievements in the year across these three pillars of our strategy positioning Atento for sustained growth andstrong value creation potential for our shareholders.
Above-Market Growth
We are focused on delivering increasingly complex solutions and value-added services to our clientsthrough multiple channels to address a larger portion of our clients spend, whilst building even more stickyrelationships and achieving higher profitability. Over time, we have diversified and expanded our services,increased their sophistication and complexity and developed customized solutions such as smart collections, B2B(business-to-business) efficient sales, insurance management, credit management and other CRM BPO processes.Our revenue from these solutions has grown faster than our overall revenue over the past several years. In 2014,we increased the share of our solutions penetration to over 23%, up 1.4 percentage points year-on-year.
Further, we are also aggressively growing outside of Telefónica and continue winning new clientrelationships, either from competitors or as potential clients outsource their in-house operations. In particular, wehave made this year substantial progress in the telecommunications sector, as major telcos seek partnering withus now that we are an independent company as a result of our strong sector credentials. Today, we providesolutions to most of the telecommunications companies in Brazil and have been awarded contracts with a leadingLatAm regional telecommunication company in five countries. Going forward, we are focused on growing thesenew relationships to scale.
Further, the market for providing outsourcing services to U.S. clients from Latin America is a sizable andfast-growing opportunity as (i) companies in the United States seek to balance outsourcing services acrossdifferent geographies, generally favoring locations with better cultural fit and proximity to their operations, whileminimizing time zone differences (in particular compared to jurisdictions such as India and the Philippines),(ii) Latin America becomes a more cost-competitive location and (iii) the talent pool in the region grows, withmore people who have strong English-language skills. In 2014, we continued to successfully ramp-up ournearshore operation. We have formed a dedicated business unit with its own infrastructure to exclusively servethe U.S. market which, as of December 2014, had approximately 500 workstations servicing five clientsincluding one of the leading mobile devices manufacturers, one of the leading in financial services group inMexico and one of the leading global travel companies. We believe our strong relationships with multi-nationalclients throughout Latin America positions us well to also serve their off-shoring needs in the United States asexemplified by our near-shoring relationships.
Best-In-Class Operations
We are also seeing the benefits of the acceleration of the implementation of our operational transformationalinitiatives to expand margins.
We have made significant investments in infrastructure, proprietary technologies, management anddevelopment processes that capitalize on our extensive experience managing large and globalized operations.Our operational excellence strategy is supported by the following five key global initiatives:
Enhance Operations Productivity. We are focused on a variety of initiatives to enhance agent productivity.We have established in 2014 an Operational Command Center in Sao Paulo, Brazil which is designed tostreamline the efficiency of our operations across our delivery centers and optimize corporate functionality andmanagement effectiveness via a standardized set of enhanced processes and capabilities. This center is equippedwith the technology available for our purposes and serves to enhance our ability to shift resources as needed, inreal-time, based on client requirements. Additionally, it provides our management immediate analytics andcontinuous data enabling them to streamline processes that we expect will offer the optimal customer experiencefor our clients. Our focus on productivity improvements throughout the year resulted in our billable vs. payableincreasing in the year by 2.7 percentage points for the group.
Increase HR Effectiveness. Our business model is focused on improving operations HR effectiveness,developing our people and reducing turnover, driving both performance and reduction in costs. Recruiting,selecting and training talent is a key factor in the successful delivery of our CRM BPO services and solutions.The roll-out of these initiatives helped us reduced our turnover ratios in 1 percentage point for the group.
38
Deploy One Procurement. We are strengthening our centralized procurement model in order to lower costsand streamline supplier relationships. Our “Global Deal Delivered Locally” strategy allows us to work withvendors to reach global contracts, while allowing procurement decisions to be handled locally. Theimplementation of a global centralized procurement model in the year has allowed us to reduced overall costs,allowing us to achieve over 15% of savings in key categories addressed in 2014. We are continuing to deploy thisprocurement strategy across our business, including in our procurement of infrastructure, technology,telecommunications and professional services, to reduce operating costs and improve margins.
Drive Consistent and Efficient IT Platform. Our technology strategy is focused on (i) delivering a cost-efficient and reliable IT infrastructure to meet the needs of existing clients and support margin expansion,(ii) enhancing our ability to add capacity rapidly with a highly variable cost structure for new business,(iii) developing new products and solutions that can be rapidly scaled and rolled out across geographies,(iv) providing standard operational tools and processes to enable the best experience to our clients’ customers,and (v) establishing common platforms that facilitate centralization of core IT services. Technology initiatives tocapture benefits of scale, standardization, and consolidation are managed globally, with full accountability byproject leaders to continuously optimize our operations and innovate client solutions.
Optimize Site Footprint. We continue to relocate a portion of our delivery centers from tier 1 to tier 2 cities,as we seek to optimize lease expenses and reduce employee benefit expenses by focusing on reducing turnoverand absenteeism. Additionally, the relocation of delivery centers allows us to access and attract new and largerpools of talent in locations where Atento is considered a reference employer. We have completed severalsuccessful site transfers in Brazil. In Brazil, the percentage of total workstations located in tier 2 cities increasedfrom 44% in 2011 to 53% in 2014. We have completed several successful site transfers in Brazil, Colombia andArgentina. As demand for our services and solutions grows and their complexity continues to increase, wecontinue to evaluate and adjust our site footprint to create the most competitive combination of quality of serviceand cost effectiveness.
In addition, given the size of our workforce, our operational excellence strategy is targeted at supporting thefuture growth of our business and delivering efficiency gains while mitigating costs in particular wage inflationin the markets where we operate.
Inspiring People
We believe that our people are a key enabler to our business model and a strategic pillar to our competitiveadvantage. We have created, and constantly reinforce, a culture we believe is unique in the industry. We havedeveloped processes to identify talent (both internally and externally), created individualized development plansand designed incentive plans that foster a work environment that aligns our management’s professionaldevelopment with client objectives and our goals, including efficiency objectives, financial targets and client andemployee satisfaction metrics. We have implemented a new operating model that integrates the corporateorganization globally, allowing us to capture the benefits of scale, standardization and sharing of best practices.The corporate organization is integrated globally but strategically segmented into different operating regions. Webelieve that this new organizational structure will foster agility and simplicity, while ensuring that corporateleaders are focused on coordinating, communicating and pursuing new solutions and innovation, with fullaccountability on the results. In 2014, we completed the relocation of our headquarters to be closer to ouroperations. We also continue to receive industry recognition for the strong culture and workplace environmentwe promote across our organization. For the second year in a row, we have been recognized as one of the 25 BestMultinational Workplaces by GPTW.
Our Integrated Solutions and Client Value Proposition
We work closely with our clients to optimize the front and back-end customer experience for their users byoffering solutions through a multi-channel delivery platform, tailored to each client’s needs. We have acomprehensive portfolio of scalable solutions such as smart collections, insurance management, smart creditsolutions and advanced technical support solutions that incorporates multiple services such as customer care andsales, all deliverable across multiple communication channels including digital, voice and in-person. Theflexibility of our solutions comprised of a combination of services, channels, automation and/or intelligentanalytics allows us to deliver a superior, value-added customer experience.
Our vertical industry expertise in telecommunications, financial services and multi-sector companies allowsus to adapt our services and solutions for our clients, further embedding us into their value chain while delivering
39
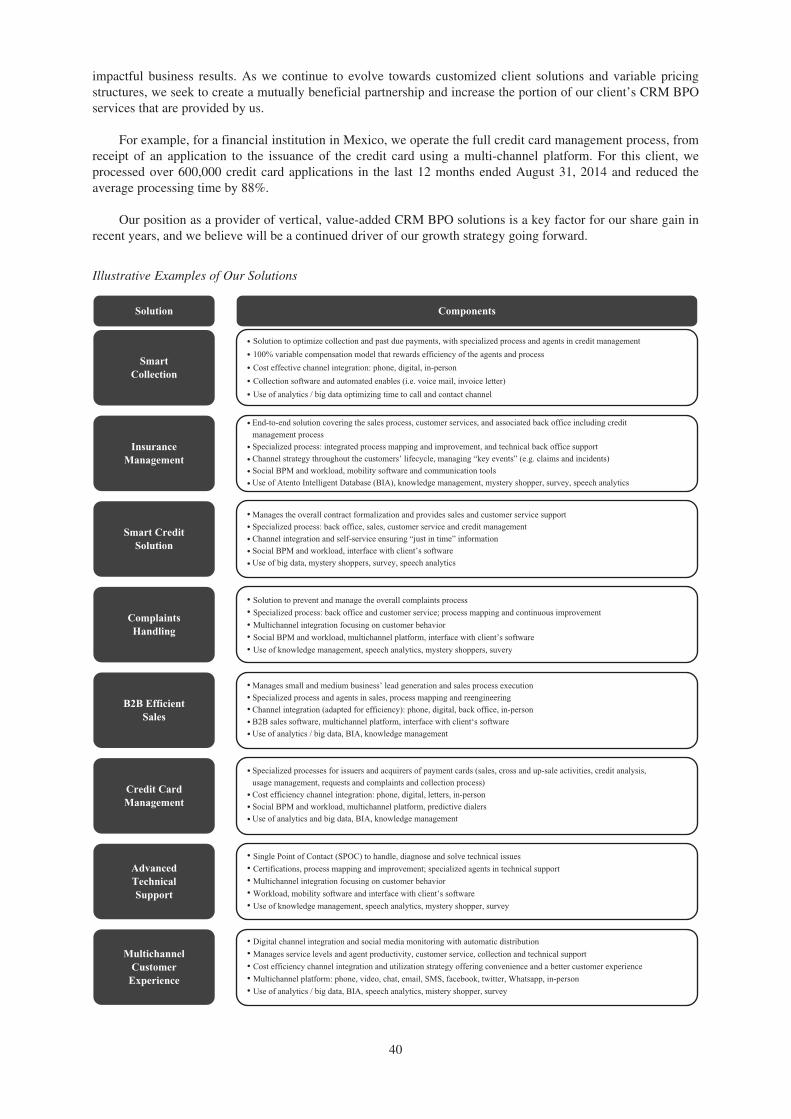
impactful business results. As we continue to evolve towards customized client solutions and variable pricingstructures, we seek to create a mutually beneficial partnership and increase the portion of our client’s CRM BPOservices that are provided by us.
For example, for a financial institution in Mexico, we operate the full credit card management process, fromreceipt of an application to the issuance of the credit card using a multi-channel platform. For this client, weprocessed over 600,000 credit card applications in the last 12 months ended August 31, 2014 and reduced theaverage processing time by 88%.
Our position as a provider of vertical, value-added CRM BPO solutions is a key factor for our share gain inrecent years, and we believe will be a continued driver of our growth strategy going forward.
Illustrative Examples of Our Solutions
Solution to optimize collection and past due payments, with specialized process and agents in credit management
100% variable compensation model that rewards efficiency of the agents and process
Cost effective channel integration: phone, digital, in-person
Collection software and automated enables (i.e. voice mail, invoice letter)
Use of analytics / big data optimizing time to call and contact channel
ComponentsSolution
SmartCollection
InsuranceManagement
Smart CreditSolution
ComplaintsHandling
B2B EfficientSales
Credit CardManagement
AdvancedTechnicalSupport
MultichannelCustomer
Experience
End-to-end solution covering the sales process, customer services, and associated back office including credit
management process
Specialized process: integrated process mapping and improvement, and technical back office support
Channel strategy throughout the customers’ lifecycle, managing “key events” (e.g. claims and incidents)
Social BPM and workload, mobility software and communication tools
Use of Atento Intelligent Database (BIA), knowledge management, mystery shopper, survey, speech analytics
Manages the overall contract formalization and provides sales and customer service support
Specialized process: back office, sales, customer service and credit management
Channel integration and self-service ensuring “just in time” information
Social BPM and workload, interface with client’s software
Use of big data, mystery shoppers, survey, speech analytics
Manages small and medium business’ lead generation and sales process execution
Specialized process and agents in sales, process mapping and reengineering
Channel integration (adapted for efficiency): phone, digital, back office, in-person
B2B sales software, multichannel platform, interface with client‘s software
Use of analytics / big data, BIA, knowledge management
Specialized processes for issuers and acquirers of payment cards (sales, cross and up-sale activities, credit analysis,
usage management, requests and complaints and collection process)
Cost efficiency channel integration: phone, digital, letters, in-person
Social BPM and workload, multichannel platform, predictive dialers
Use of analytics and big data, BIA, knowledge management
Single Point of Contact (SPOC) to handle, diagnose and solve technical issues
Certifications, process mapping and improvement; specialized agents in technical support
Multichannel integration focusing on customer behavior
Workload, mobility software and interface with client’s software
Use of knowledge management, speech analytics, mystery shopper, survey
Digital channel integration and social media monitoring with automatic distribution
Manages service levels and agent productivity, customer service, collection and technical support
Cost efficiency channel integration and utilization strategy offering convenience and a better customer experience
Multichannel platform: phone, video, chat, email, SMS, facebook, twitter, Whatsapp, in-person
Use of analytics / big data, BIA, speech analytics, mistery shopper, survey
Solution to prevent and manage the overall complaints process
Specialized process: back office and customer service; process mapping and continuous improvement
Multichannel integration focusing on customer behavior
Social BPM and workload, multichannel platform, interface with client’s software
Use of knowledge management, speech analytics, mystery shoppers, suvery
40
Our value proposition has continued to evolve toward end-to-end CRM BPO solutions, incorporating processes,technology and analytics as enablers for our services, all aimed at improving our clients’ efficiency and reducingcosts. In 2014, CRM BPO solutions and individual services comprised approximately 23.2% and 76.8% of grouprevenues, respectively. For our clients in Brazil, our largest market, approximately 64.7% of our revenue wascontributed by individual services and approximately 35.3% from solutions, for the year ended December 31,2014. This represents significant growth for the Brazilian CRM BPO services segment which accounted for16% of Brazilian revenue in 2011.
In 2014, approximately 68% of our revenues came from sales and customer service.
Our Clients
Over the years, we have experienced steady growth in our client base, gaining new clients year-on-year,resulting in what we believe is a world-class roster of clients across industry sectors. Our long-standing, blue-chip client base spans across a variety of industries and includes names such as Telefónica Group, BancoBradesco S.A., Banco Santander S.A., HSBC, Samsung, and Whirlpool, among others. Our clients are leaders intheir respective industries and demand best-in-class service from their outsourcing partners. We serve clientsprimarily in the telecommunications and financial services sectors, and in multi-sector including consumergoods, services, public administration, pay TV, healthcare, transportation, technology and media. For the yearended December 31, 2014, our revenue from sales to clients in telecommunications, financial services and multi-sector industries, corresponded to 49.1%, 35.2% and 15.7% of total revenue, respectively.
For December 31, 2014, our top 15 client groups accounted for 82.1% of our revenue and, excluding theTelefónica Group companies, our next 15 client groups accounted for 36.0% of our revenue. In calculating thesepercentages, we treated each member of the same corporate group as one client. With each of these, we haveworked closely over many years across multiple countries, building strong partnerships and commercialrelationships with these clients.
Longstanding Client Relationships
We seek to create long-term relationships with our clients where we are viewed as an integral part of theirbusiness and not just as a service provider. Because we strive to have the ability to offer products and solutionsthat cover the entire client’s value chain, we believe the solutions we are providing offer a higher value to ourclients, generally leading to a longer-term relationship which is beneficial to both parties. In 2014, 69% of ourrevenue from clients other than the Telefónica Group came from clients that had relationships with us for ten ormore years. Illustrative of our high customer satisfaction, in 2012, 2013 and 2014, our client retention rates(calculated based on prior year revenue of clients retained in current year, as a percentage of total prior yearrevenues) were 98.5%, 99.3% and 98.9%, respectively.
Development of Client Base
As of December 31, 2014, our client base consisted of over 400 separate clients (treating each company thatis a member of the same corporate group as a separate client). Since 1999, when Telefónica, our former parentcompany, and its subsidiaries contributed approximately 90% of the revenue of AIT Group, we believe that wehave achieved a high diversification of our client base by sources of revenue. For the years ended December 31,2012, 2013 and 2014, we generated 50.0%, 48.5% and 46.5%, respectively, of our revenue from TelefónicaGroup companies.
As of December 31, 2014, 38 companies within the Telefónica Group were party to 160 arm’s-lengthcontracts with Atento. Our service agreements with Telefónica Group companies remained in effect followingthe consummation of the Acquisition. Additionally, we entered into the MSA, a new framework agreement thatreplaced our prior framework agreement with Telefónica and which is intended to govern our relationship withTelefónica through 2021.
Telefónica Group Master Service Agreement
Our service agreements with Telefónica remained in effect following the consummation of the Acquisition,and we entered into the MSA, a new framework agreement that replaced the framework agreement withTelefónica that was in place prior to the Acquisition. The term of the MSA expires on December 31, 2021 andthere is no express provision for extension thereof.
41
The MSA requires the Telefónica Group companies to meet pre-agreed minimum annual revenuecommitments to us in each jurisdiction where we currently conduct business (other than Argentina). The MSAcommitment is meant to be a minimum commitment, or floor, rather than a target or budget. If the TelefónicaGroup companies fail to meet country specific revenue commitments, which are measured on an annual basis,Telefónica S.A. will be required to compensate us in cash for any shortfalls. If the Telefónica Group companiesfail to meet the annual aggregate minimum revenue commitments for all jurisdictions covered by the MSA,Telefónica, S.A. will be required to compensate us in available cleared funds. Any such compensation paymentswill be in amounts calculated as a percentage of the revenue shortfalls, ranging from 8% to 20% of the shortfalldepending on the scope of such shortfall and the relevant calendar year. In May 2014, we and Telefónicaamended the MSA to adjust the minimum revenue commitments in Spain and Morocco by an average of€46.0 million ($62.6 million, based on the May 31, 2014 month-end close foreign exchange rates) per year toreflect the lower level of activities in these geographies and a corresponding €25.4 million ($34.6 million, basedon the May 31, 2014 month-end close foreign exchange rates) payment was made by Telefónica representing thediscounted value of the reduction in minimum revenue commitments which was subsequently applied to repaythe Vendor Loan Note. See “Liquidity and Capital Resources—Financing Arrangements—Vendor Loan Note.”
The MSA expires on December 31, 2021, and although the MSA is an umbrella agreement which governsour services agreements with the Telefónica Group companies, the termination of the MSA on December 31,2021 does not automatically result in a termination of any of the local services agreements in force after that date.The MSA contemplates a right of termination prior to December 31, 2021 in the event of a change of control ofthe Company occurring as a result of a sale to a Telefónica competitor.
Competitive Landscape
Global Competitive Landscape
In 2013, we were the second largest company in the global CRM BPO market. In 2013, the market sharefigures for the top three companies were: Tele performance S.A. (“Teleperformance”) (5.3%); Atento (3.8%);and Convergys Corporation (“Convergys”) (3.3%), according to company filings, IDC and our estimates. InJanuary 2014, Convergys acquired Stream Global Services (“Stream”), making Convergys the 2nd largest marketshare on a pro forma basis. In terms of positioning in the LatAm countries Atento operates and with respect tothe BPO/CRM market share, the company holds the number one position in most of them, such as Brazil, Perú,México, Chile or Colombia.
In Gartner´s Magic Quadrant for Customer Management Contact Center BPO (TJ Singh, Brian ManusamaDecember 23, 2014), in 2 years Atento has positioned itself amongst the key global players, showing significantimprovement in ability to execute (2013) and completeness of vision (2014). The 2014 report highlights: a goodand experienced leadership team, with new talent attracted from top-tier companies; and an excellent clientrelationships and quality of service, providing: agility, flexibility, focus on results, good execution, marketknowledge, and ability to scale.
Gartner does not endorse any vendor, product or service depicted in its research publications, and does notadvise technology users to select only those vendors with the highest ratings or other designation. Gartnerresearch publications consist of the opinions of Gartner’s research organization and should not be construed asstatements of fact. Gartner disclaims all warranties, expressed or implied, with respect to this research, includingany warranties of merchantability or fitness for a particular purpose.
The Gartner Report(s) described herein, (the “Gartner Report(s)”) represent(s) data, research opinion orviewpoints published, as part of a syndicated subscription service, by Gartner, Inc. (“Gartner”), and are notrepresentations of fact. Each Gartner Report speaks as of its original publication date (and not as of the date ofthis Prospectus) and the opinions expressed in the Gartner Report(s) are subject to change without notice.
42
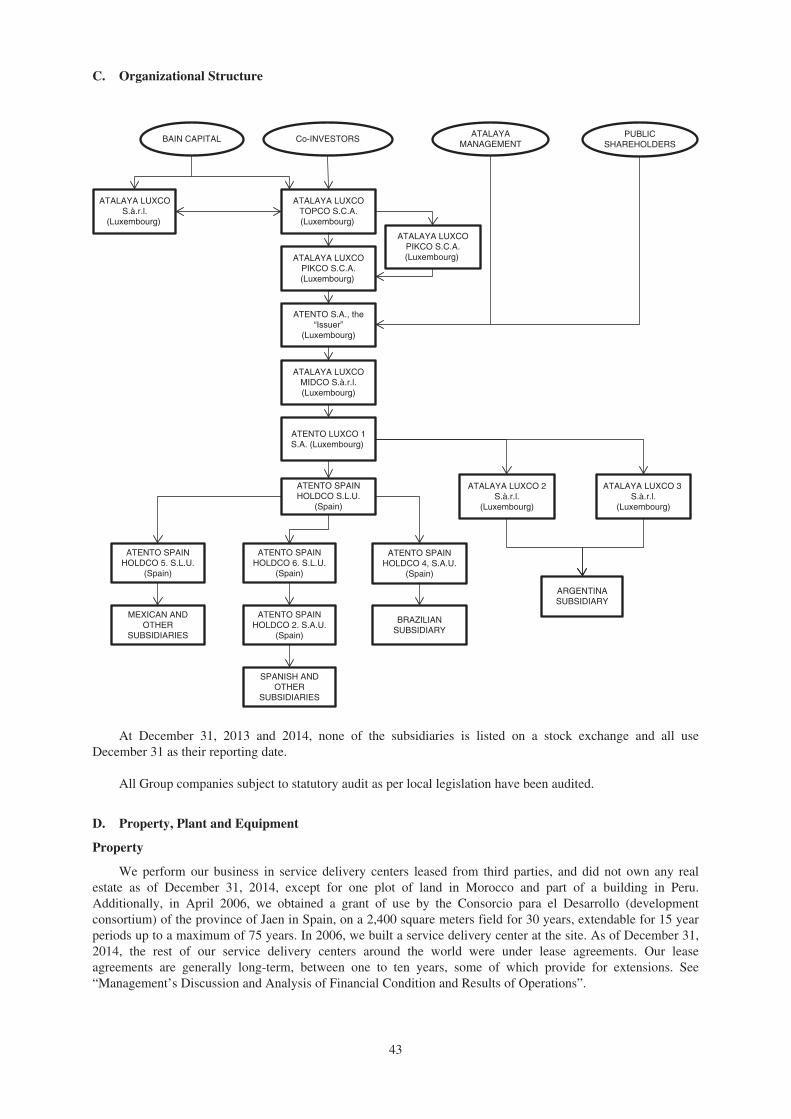
C. Organizational Structure
BAIN CAPITAL Co-INVESTORS
ATALAYA LUXCOS.à.r.l.
(Luxembourg)
ATALAYA LUXCOTOPCO S.C.A.(Luxembourg)
ATENTO SPAINHOLDCO S.L.U.
(Spain)
ATENTO SPAINHOLDCO 4, S.A.U.
(Spain)
ATENTO SPAINHOLDCO 5. S.L.U.
(Spain)
ATENTO SPAINHOLDCO 6. S.L.U.
(Spain)
ATENTO SPAINHOLDCO 2. S.A.U.
(Spain)
MEXICAN ANDOTHER
SUBSIDIARIES
ARGENTINASUBSIDIARY
BRAZILIANSUBSIDIARY
ATALAYA LUXCOMIDCO S.à.r.l.(Luxembourg)
ATENTO LUXCO 1S.A. (Luxembourg)
ATALAYAMANAGEMENT
ATENTO S.A., the“Issuer”
(Luxembourg)
PUBLICSHAREHOLDERS
ATALAYA LUXCOPIKCO S.C.A.(Luxembourg)
ATALAYA LUXCO 2S.à.r.l.
(Luxembourg)
ATALAYA LUXCO 3 S.à.r.l.
(Luxembourg)
SPANISH ANDOTHER
SUBSIDIARIES
ATALAYA LUXCOPIKCO S.C.A.(Luxembourg)
At December 31, 2013 and 2014, none of the subsidiaries is listed on a stock exchange and all useDecember 31 as their reporting date.
All Group companies subject to statutory audit as per local legislation have been audited.
D. Property, Plant and Equipment
Property
We perform our business in service delivery centers leased from third parties, and did not own any realestate as of December 31, 2014, except for one plot of land in Morocco and part of a building in Peru.Additionally, in April 2006, we obtained a grant of use by the Consorcio para el Desarrollo (developmentconsortium) of the province of Jaen in Spain, on a 2,400 square meters field for 30 years, extendable for 15 yearperiods up to a maximum of 75 years. In 2006, we built a service delivery center at the site. As of December 31,2014, the rest of our service delivery centers around the world were under lease agreements. Our leaseagreements are generally long-term, between one to ten years, some of which provide for extensions. See“Management’s Discussion and Analysis of Financial Condition and Results of Operations”.
43
Lease expenses on a consolidated basis reached $124.6 million, $118.3 million and $106.3 million in theyears ended December 31, 2012, 2013 and 2014.
Our infrastructure is designed according to our clients’ needs. Our technology systems possess theflexibility to integrate with our clients’ existing infrastructure. This approach enables us to deliver the optimalinfrastructure mix through on-shoring, off-shoring or near-shoring as required. Our deployment team is trained toachieve timely implementation so as to minimize our clients’ time-to-market. We address client capacity needsby providing solutions such as software based platforms, high level infrastructure mobility, process centralizationand high concentration of delivery centers.
During the last years, our infrastructure has grown in response to a substantial increase in demand for ourservices from our clients. As of December 31, 2014, we had 86,071 workstations globally, with 44,061 in Brazil,34,498 in the Americas (excluding Brazil) and 7,512 in EMEA. As of December 31, 2014, we had 93 deliverycenters globally, 29 in Brazil, 45 in the Americas (excluding Brazil) and 19 in EMEA.
The following table shows the number of delivery centers and workstations in each of the jurisdictions inwhich we operated as at December 31, 2012, 2013, 2014.
Number of Workstations Number of Service Delivery Centers(1)
Country 2012 2013 2014 2012 2013 2014
(unaudited)
Brazil 37,650 39,744 44,061 23 26 29Americas 30,891 31,534 34,498 44 46 45Argentina(2) 3,793 3,959 3,820 12 12 11Central America(3) 1,780 1,666 2,983 3 3 3Chile 3,638 3,467 2,398 3 3 2Colombia 4,771 4,791 5,827 4 6 6Mexico 8,648 9,143 9,812 17 17 17Peru 7,150 7,387 8,493 2 2 3United States(4) 1,111 1,121 1,165 3 3 3EMEA 7,141 7,919 7,512 21 21 19Czech Republic (5) 494 592 — 3 3 —Morocco 1,916 1,941 2,046 4 4 4Spain 4,731 5,386 5,466 14 14 15Total 75,682 79,197 86,071 88 93 93
(1) Includes service delivery centers at facilities operated by us and those owned by our clients where weprovide operations personnel and workstations.
(2) Includes Uruguay.(3) Includes Guatemala and El Salvador.(4) Includes Puerto Rico.(5) Operations in Czech Republic were divested in 2014.
The following is a list of our principal workstations as of December 31, 2013 and 2014:
Number of Workstations2013 2014
BrazilSão Paulo (Belenzinho I) 3,155 3,150São Bernardo do Campo 2,929 2,977São Paulo (Santana) 2,211 2,559São Paulo (São Bento I) 2,257 2,359São Paulo (Nova São Paulo) 1,960 2,278Rio de Janeiro (Teleporto) 2,098 2,255Salvador (Uruguay) 2,055 2,073Rio de Janeiro (Madureira) 2,141 2,061São Paulo (Santo Antonio) 1,795 1,988São José dos Campos 1,968 1,967
44
Number of Workstations2013 2014
AmericasPeru (LaMolina) 5,384 5,590Peru (Maquinarias) 2,003 2,184Chile (Vicuña Mackenna) 1,584 1,539Colombia (Bucaramanga) — 1,466El Salvador 699 1,381Colombia (Royal) 1,323 1,378
EMEASpain (Ilustración) 803 874Morocco (Casablanca) 642 730Spain (Glorias) 671 651Morocco (Tánger) 644 645
Telecommunications Infrastructure. We work with the main telephone carriers at the local and internationallevels. We have recently implemented a network to interconnect the main countries in which we operate,allowing us to offer new options of connectivity and to run new applications for videoconferencing. Since almostall our voice platform is based on IP technology, we have implemented a solid and flexible telecommunicationsinfrastructure, which provides business continuity through redundant architectures and interconnection schemesin most of our facilities.
ITEM 4A. UNRESOLVED STAFF COMMENTS
The Company has no unresolved comments from the staff of the U.S. Securities and Exchange Commissionwith respect to its periodic reports under the Securities Exchange Act.
ITEM 5. OPERATING AND FINANCIAL REVIEW AND PROSPECTS
Critical accounting estimates and assumptions
The preparation of consolidated financial statements under IFRS as issued by the IASB requires the use ofcertain assumptions and estimates that affect the recognized amount of assets, liabilities, income and expenses, aswell as the related breakdowns.
Some of the accounting policies applied in preparing the accompanying consolidated financial statementsrequired Management to apply significant judgments in order to select the most appropriate assumptions fordetermining these estimates. These assumptions and estimates are based on Management experience, the adviceof consultants and experts, forecasts and other circumstances and expectations prevailing at year end.Management’s evaluation takes into account the global economic situation in the sector in which the AtentoGroup operates, as well as the future outlook for the business. By virtue of their nature, these judgments areinherently subject to uncertainty. Consequently, actual results could differ substantially from the estimates andassumptions used. Should this occur, the values of the related assets and liabilities would be adjustedaccordingly.
At the date of preparation of these consolidated financial statements, no relevant changes are forecast in theestimates. As a result, no significant adjustments in the values of the assets and liabilities recognized atDecember 31, 2013 and 2014 are expected.
Although these estimates were made on the basis of the best information available at each reporting date onthe events analyzed, events that take place in the future might make it necessary to change these estimates incoming years. Changes in accounting estimates would be applied prospectively in accordance with therequirements of IAS 8, “Accounting Policies, Changes in Accounting Estimates and Errors”, recognizing theeffects of the changes in estimates in the related consolidated income statement.
45
An explanation of the estimates and judgments that entail a significant risk of leading to a materialadjustment in the carrying amounts of assets and liabilities in the coming financial year is as follow:
Revenue recognition
The Atento Group recognizes revenue on an accruals basis during the period in which the services arerendered, with reference to the stage of completion of the specific transaction, and assessed on the basis of theactual service provided as a proportion of the total services to be provided. Recognizing service revenue withreference to the stage of completion involves the use of estimates in relation to certain key elements of theservice contracts, such as contract costs, period of execution and allowances related to the contracts. As far as ispractical, the Atento Group applies its past experience and specific quantitative indicators in its estimates,considering the specific circumstances applicable to specific customers or contracts. If certain circumstanceshave occurred that may have an impact the initially estimated revenue, costs or percentage of completion,estimates are reviewed based on such circumstances. Such reviews may result in adjustments to costs andrevenue recognized for a period.
Useful lives of property, plant and equipment and intangible assets
The accounting treatment of items of property, plant and equipment and intangible assets entails the use ofestimates to determine their useful lives for depreciation and amortization purposes. In determining the usefullife, it is necessary to estimate the level of use of assets as well as forecast technological trends in the assets.Assumptions regarding the level of use, the technological framework and the future development require asignificant degree of judgment, bearing in mind that these aspects are rather difficult to foresee. Changes in thelevel of use of assets or in their technological development could result in a modification of their useful lives and,consequently, in the associated depreciation or amortization.
Estimated impairment of goodwill
The Atento Group tests goodwill for impairment annually. Goodwill is subject to impairment testing as partof the cash-generating unit to which it has been allocated. The recoverable amounts of cash-generating unitsdefined in order to identify potential impairment in goodwill are determined on the basis of value in use,applying five-year financial forecasts based on the Atento Group’s strategic plans, approved and reviewed byManagement. These calculations entail the use of assumptions and estimates, and require a significant degree ofjudgment. The main variables considered in the sensitivity analyses are growth rates, discount rates using theWeighted Average Cost of Capital (“WACC”) and the key business variables.
Deferred taxes
The Atento Group assesses the recoverability of deferred tax assets based on estimates of future earnings.The ability to recover these deferred amounts depends ultimately on the Atento Group’s ability to generatetaxable earnings over the period in which the deferred tax assets remain deductible. This analysis is based on theestimated timing of the reversal of deferred tax liabilities, as well as estimates of taxable earnings, which aresourced from internal projections and are continuously updated to reflect the latest trends.
The appropriate classification of tax assets and liabilities depends on a series of factors, including estimatesas to the timing and realization of deferred tax assets and the projected tax payment schedule. Actual income taxreceipts and payments could differ from the estimates made by the Atento Group as a result of changes in taxlegislation or unforeseen transactions that could affect the tax balances.
The Atento Group has recognized tax credits corresponding to losses carried forward since, based oninternal projections, it is probable there will be future taxable profits against which they may be utilized.
The carrying amount of deferred income tax assets is reviewed at each reporting date, and reduced to theextent that it is no longer probable that sufficient taxable profits will be available to allow all or part of thatdeferred tax asset to be utilized. Unrecognized deferred income tax assets are reassessed at each reporting dateand are recognized to the extent that it has become probable that future taxable profits will allow the deferred taxasset to be recovered.
46
Provisions and contingencies
Provisions are recognized when the Atento Group has a present obligation as a result of a past event, it isprobable that an outflow of resources will be required to settle the obligation and a reliable estimate can be madeof the amount of the obligation. This obligation may be legal or constructive, deriving from, inter alia,regulations, contracts, customary practice or public commitments that would lead third parties to reasonablyexpect that the Atento Group will assume certain responsibilities. The amount of the provision is determinedbased on the best estimate of the outlay required to settle the obligation, taking into account all availableinformation as at the reporting date, including the opinions of independent experts such as legal counsel orconsultants.
No provision is recognized if the amount of liability cannot be estimated reliably. In such cases, the relevantinformation would be provided in the notes to the consolidated financial statements.
Given the uncertainties inherent in the estimates used to determine the amount of provisions, actual outflowsof resources may differ from the amounts recognized originally on the basis of these estimates.
Fair value of derivatives and contingent-value instruments
The Atento Group uses derivative financial instruments to mitigate risks, primarily derived from possiblefluctuations in interest rates on loans received. Derivatives are recognized at the onset of the contract at fairvalue, subsequently re-measuring the fair value and adjusting as necessary at each reporting date.
The fair values of derivative financial instruments are calculated on the basis of observable market dataavailable, either in terms of market prices or through the application of valuation techniques. The valuationtechniques used to calculate the fair value of derivative financial instruments include the discounting of futurecash flow associated with the instruments, applying assumptions based on market conditions at the valuation dateor using prices established for similar instruments, among others. These estimates are based on available marketinformation and appropriate valuation techniques. The fair values calculated could differ significantly if othermarket assumptions and/or estimation techniques were applied.
Discounted cash flow analyses are used to analyze the fair value of the contingent-value instruments(“CVIs”). The fair value of the CVIs is based upon discounted cash flow analyses, for which the determination offair value requires significant management judgment or estimation and results in a higher degree of financialstatement volatility.
Refer to note 3u of our audited consolidated financial statements, included elsewhere in this document fordetails regarding new amendments standards and interpretations.
A. Operating Results
MANAGEMENT’S DISCUSSION AND ANALYSIS OF FINANCIAL CONDITION AND RESULTS OFOPERATIONS
The following management’s discussion and analysis of our financial condition and results of operationsshould be read in conjunction with the Predecessor financial statements as of and for the period endedNovember 30, 2012 and our audited consolidated financial statements as of and for the one-month period endedDecember 31, 2012, and as of and for the years ended December 31, 2013 and 2014 and the related notes thereto,and with the financial information presented under the section entitled “Item 3. Key Information—A. SelectedFinancial Data” included elsewhere in this Annual Report. The preparation of the consolidated financialstatements referred to in this section required the adoption of assumptions and estimates that affect the amountsrecorded as assets, liabilities, revenue and expenses in the years and periods presented and are subject to certainrisks and uncertainties. Our future results may vary substantially from those indicated as a result of variousfactors that affect our business, including, among others, those mentioned in the sections “Forward-LookingStatements” and “Item 3. Key Information—D. Risk Factors”, and other factors discussed elsewhere in thisannual report. The Predecessor financial statements as of and for the period ended November 30, 2012 and ourconsolidated financial statements as of and for the one-month period ended December 31, 2012, and as of and forthe years ended December 31, 2013 and 2014, prepared in accordance with IFRS as issued by the IASB and thereport of our independent registered public accounting firm are included in “Item 18. Financial Statements”.
47
The following discussion includes forward-looking statements. Our actual results could differ materiallyfrom those that are discussed in these forward-looking statements.
Overview
Atento is the largest provider of customer-relationship management and business-process outsourcing(“CRM BPO”) services and solutions in Latin America and Spain, and among the top three global providers, byrevenue. Atento’s tailored CRM BPO solutions are designed to enhance each client’s ability to deliver a high-quality product by creating a best-in-class experience for their customers, enabling our clients to focus onoperating their core businesses. Atento utilizes its expertise in its industry and in its customer care operations,combined with a consultative approach, to offer superior and scalable solutions across the entire value chain forcustomer care, each solution being customized for the individual client’s needs and sophistications.
Atento offers a comprehensive portfolio of customizable, and scalable, solutions comprising front-end andback-end services ranging from sales, applications-processing, customer care and credit-management. From oursuite of products and value-added services, we derive embedded and integrated industry-tailored solutions for alarge and diverse group of multi-national companies. Our solutions to our base of over 400 clients are deliveredby over 154,000 of our highly engaged customer care specialists and facilitated by our best-in-class technologyinfrastructure and multi-channel delivery platform. We believe we bring a differentiated combination of scale,capacity for processing customer transactions and industry expertise to our clients’ customer care operations,which allow us to provide higher-quality customer care services more cost-effectively than our clients coulddeliver on their own.
Our number of workstations increased from 79,197 as of December 31, 2013 to 86,071 workstations as ofDecember 31, 2014. Since we lease all of our call center facilities, which increases our operating expenses anddoes not result in a depreciation expense, our EBITDA performance has historically differed from competitorswho own their buildings and equipment, as related financings have generally resulted in higher depreciationexpenses for those competitors and have increased such competitors EBITDA.
We are continuing to relocate a portion of our delivery centers from Tier 1 to Tier 2 cities, which tend to besmaller, more affordable locations, as we seek to optimize lease expenses and reduce employee benefit expensesby focusing on reducing turnover and absenteeism. Additionally, the relocation of delivery centers allows us toaccess and attract new and larger pools of talent in locations where Atento is considered a reference employer.We have completed several successful site transfers in Brazil, Colombia and Argentina. In Brazil, the percentageof total workstations located in tier 2 cities decreased 1 percentage point, from 54% for the year endedDecember 31, 2013 to 53% for the year ended December 31, 2014, due to an specific client requirement tooperate in a Tier 1 city, and the implementation of new delivery centers in Brazil in Tier 2 cities, postponed tothe first quarter of 2015. As demand for our services and solutions grows, and their complexity continues toincrease, we continue to evaluate and adjust our site footprint to create the most competitive combination ofquality of service and cost effectiveness.
During the last years, our infrastructure has grown in response to a substantial increase in demand for ourservices from our clients. As of December 31, 2014, we had 86,071 workstations globally, with 44,061 in Brazil,34,498 in the Americas (excluding Brazil) and 7,512 in EMEA. As of December 31, 2013, we had 79,197workstations globally (75,682 in 2012), with 39,744 in Brazil (37,650 in 2102), 31,534 in the Americas(excluding Brazil) (30,891 in 2012) and 7,919 in EMEA (7,141 in 2012). As of December 31, 2014, we had 93delivery centers globally, 29 in Brazil, 45 in the Americas (excluding Brazil) and 19 in EMEA. As ofDecember 31, 2013, we had 93 delivery centers globally (88 in 2012), 26 in Brazil (23 in 2012), 46 in theAmericas (excluding Brazil) (44 in 2012) and 21 in EMEA (21 in 2012). See “Item 4. Information on theCompany—D. Property, Plant and Equipment”
For a table showing the number of delivery centers and workstations in each of the jurisdictions in which weoperated as at December 31, 2013 and 2014, see the section “D. Property, plant and equipment”.
During 2014, the revenue generated from our fifteen largest client groups (including the Telefonica Group)represented 82.1% of our revenue as compared to 84.2% and 83.9% of our revenue for the same period in 2013and 2012, respectively. Excluding revenue generated from the Telefónica Group, our next 15 largest clientgroups represented in aggregate 36.0% of our revenue for the year ended December 31, 2014 as compared to36.2% and 34.4% of our revenue in the same period for 2013 and 2012.
48
Our vertical industry expertise in telecommunications, financial services and multi-sector companies allowsus to adapt our services and solutions for our clients, further embedding us into their value chain while deliveringeffective business results and increasing the portion of our client’s services related to CRM BPO. In the yearended December 31, 2014, CRM BPO solutions and individual services comprised approximately 23.2% and76.8% of our revenues, respectively. For the same period in 2013, CRM BPO solutions and individual servicescomprised approximately 21.8% and 78.2% of our revenues, respectively. For the same period in 2013, CRMBPO solutions and individual services comprised approximately 22.1% and 77.9% of our revenues, respectively.
The percentage of solutions and individual services for the year ended December 31, 2013, representingapproximately 23% and 77% of group revenues, respectively, were misreported and should have amounted to21.8% and 78.2% as disclosed in the paragraph above.
During the year of 2014, telecommunications represented 49.1% of our revenue and financial servicesrepresented 35.2% of our revenue, compared to 52% and 35%, respectively, for the same period in 2013.Additionally, during 2014 and 2013 sales by service were represented as follow:
Year ended December 31,
2013 2014
Customer Service 50.1% 49.8%Sales 18.7% 18.2%Collection 10.3% 10.8%Back Office 8.6% 8.8%Technical Support 9.8% 9.6%Others 2.5% 2.8%
Total 100.0% 100.0%
Average headcount
The average headcount in the Atento Group in 2012, 2013 and 2014 and the breakdown by country is asfollow:
Average headcount
2012 2013 2014
Brazil 84,031 86,413 82,702Central America 3,758 4,051 4,161Chile 4,056 3,883 4,703Colombia 4,895 5,400 6,274Spain 14,491 13,830 12,121Morocco 2,032 1,544 1,367Mexico 18,861 18,823 20,033Peru 10,109 10,561 12,874Puerto Rico 797 763 706United States 377 405 419Czech Republic 791 933 673Argentina and Uruguay 9,346 9,151 8,062Corporate 94 75 81
Total 153,638 155,832 154,176
49
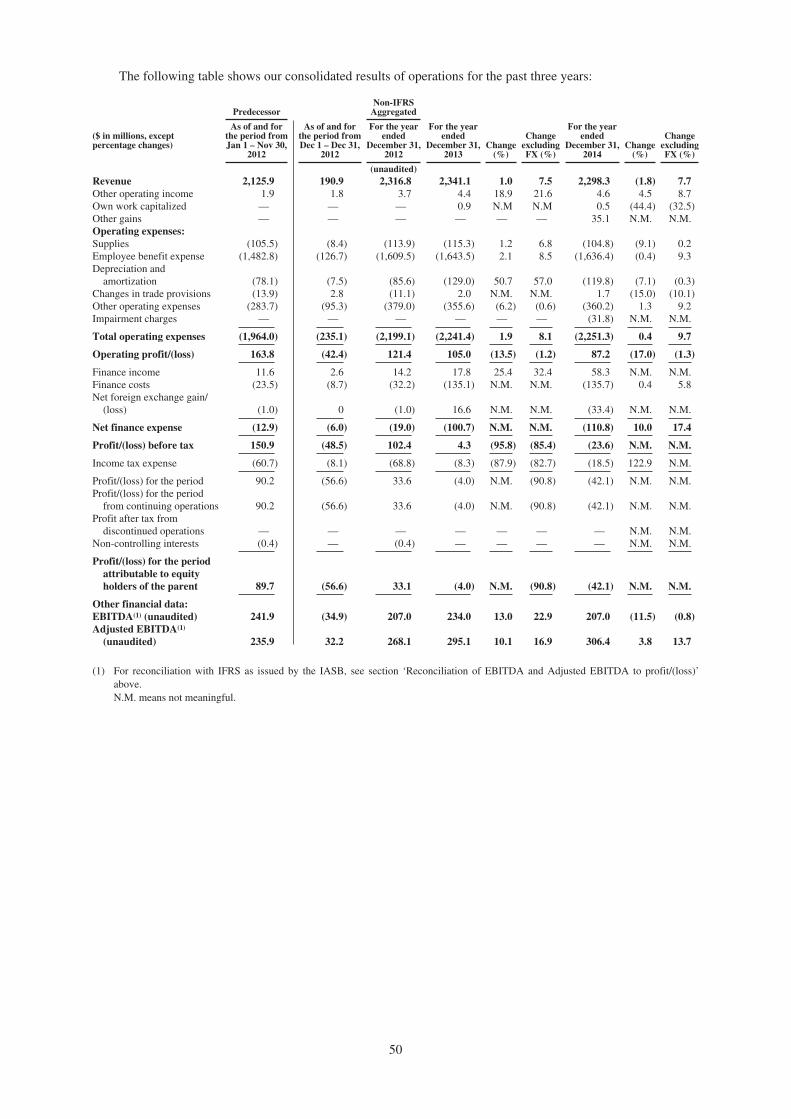
The following table shows our consolidated results of operations for the past three years:
PredecessorNon-IFRS
Aggregated
($ in millions, exceptpercentage changes)
As of and forthe period fromJan 1 – Nov 30,
As of and forthe period fromDec 1 – Dec 31,
For the yearended
December 31,
For the yearended
December 31, ChangeChange
excluding
For the yearended
December 31, ChangeChange
excluding2012 2012 2012 2013 (%) FX (%) 2014 (%) FX (%)
(unaudited)Revenue 2,125.9 190.9 2,316.8 2,341.1 1.0 7.5 2,298.3 (1.8) 7.7Other operating income 1.9 1.8 3.7 4.4 18.9 21.6 4.6 4.5 8.7Own work capitalized — — — 0.9 N.M N.M 0.5 (44.4) (32.5)Other gains — — — — — — 35.1 N.M. N.M.Operating expenses:Supplies (105.5) (8.4) (113.9) (115.3) 1.2 6.8 (104.8) (9.1) 0.2Employee benefit expense (1,482.8) (126.7) (1,609.5) (1,643.5) 2.1 8.5 (1,636.4) (0.4) 9.3Depreciation and
amortization (78.1) (7.5) (85.6) (129.0) 50.7 57.0 (119.8) (7.1) (0.3)Changes in trade provisions (13.9) 2.8 (11.1) 2.0 N.M. N.M. 1.7 (15.0) (10.1)Other operating expenses (283.7) (95.3) (379.0) (355.6) (6.2) (0.6) (360.2) 1.3 9.2Impairment charges — — — — — — (31.8) N.M. N.M.
Total operating expenses (1,964.0) (235.1) (2,199.1) (2,241.4) 1.9 8.1 (2,251.3) 0.4 9.7
Operating profit/(loss) 163.8 (42.4) 121.4 105.0 (13.5) (1.2) 87.2 (17.0) (1.3)
Finance income 11.6 2.6 14.2 17.8 25.4 32.4 58.3 N.M. N.M.Finance costs (23.5) (8.7) (32.2) (135.1) N.M. N.M. (135.7) 0.4 5.8Net foreign exchange gain/
(loss) (1.0) 0 (1.0) 16.6 N.M. N.M. (33.4) N.M. N.M.
Net finance expense (12.9) (6.0) (19.0) (100.7) N.M. N.M. (110.8) 10.0 17.4
Profit/(loss) before tax 150.9 (48.5) 102.4 4.3 (95.8) (85.4) (23.6) N.M. N.M.
Income tax expense (60.7) (8.1) (68.8) (8.3) (87.9) (82.7) (18.5) 122.9 N.M.
Profit/(loss) for the period 90.2 (56.6) 33.6 (4.0) N.M. (90.8) (42.1) N.M. N.M.Profit/(loss) for the period
from continuing operations 90.2 (56.6) 33.6 (4.0) N.M. (90.8) (42.1) N.M. N.M.Profit after tax from
discontinued operations — — — — — — — N.M. N.M.Non-controlling interests (0.4) — (0.4) — — — — N.M. N.M.
Profit/(loss) for the periodattributable to equityholders of the parent 89.7 (56.6) 33.1 (4.0) N.M. (90.8) (42.1) N.M. N.M.
Other financial data:EBITDA(1) (unaudited) 241.9 (34.9) 207.0 234.0 13.0 22.9 207.0 (11.5) (0.8)Adjusted EBITDA(1)
(unaudited) 235.9 32.2 268.1 295.1 10.1 16.9 306.4 3.8 13.7
(1) For reconciliation with IFRS as issued by the IASB, see section ‘Reconciliation of EBITDA and Adjusted EBITDA to profit/(loss)’above.N.M. means not meaningful.
50
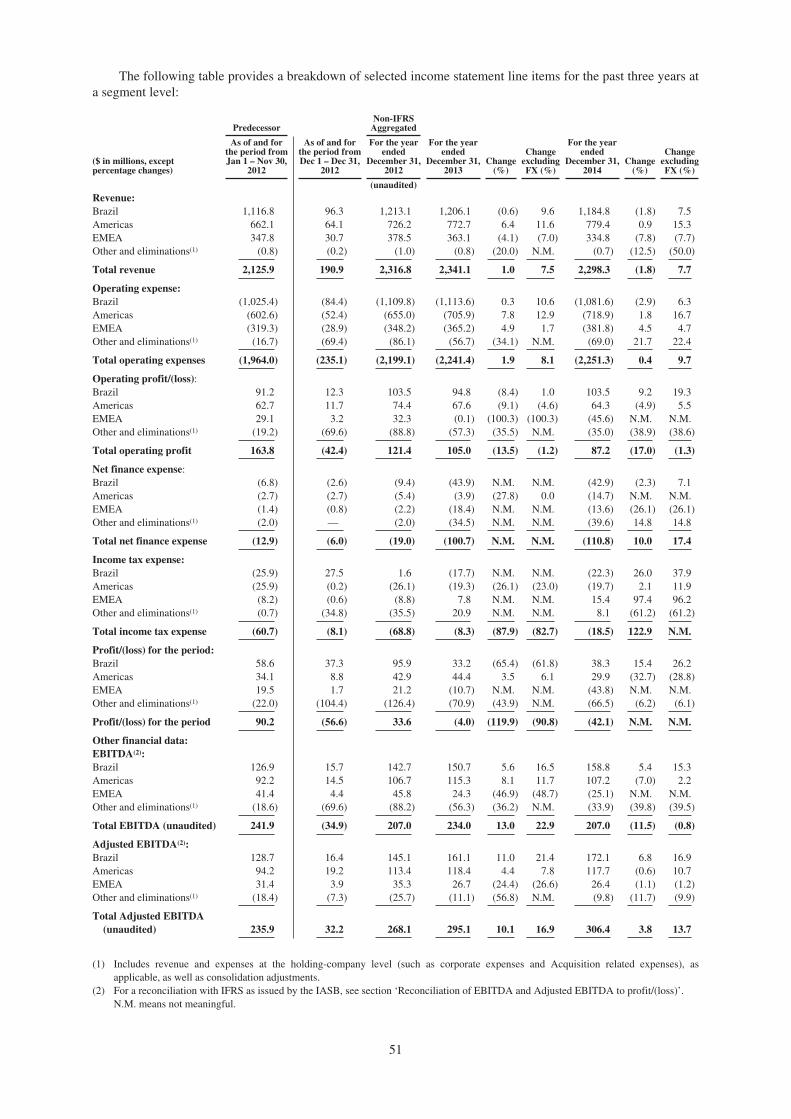
The following table provides a breakdown of selected income statement line items for the past three years ata segment level:
PredecessorNon-IFRS
Aggregated
($ in millions, exceptpercentage changes)
As of and forthe period fromJan 1 – Nov 30,
2012
As of and forthe period fromDec 1 – Dec 31,
2012
For the yearended
December 31,2012
For the yearended
December 31,2013
Change(%)
ChangeexcludingFX (%)
For the yearended
December 31,2014
Change(%)
ChangeexcludingFX (%)
(unaudited)Revenue:Brazil 1,116.8 96.3 1,213.1 1,206.1 (0.6) 9.6 1,184.8 (1.8) 7.5Americas 662.1 64.1 726.2 772.7 6.4 11.6 779.4 0.9 15.3EMEA 347.8 30.7 378.5 363.1 (4.1) (7.0) 334.8 (7.8) (7.7)Other and eliminations(1) (0.8) (0.2) (1.0) (0.8) (20.0) N.M. (0.7) (12.5) (50.0)
Total revenue 2,125.9 190.9 2,316.8 2,341.1 1.0 7.5 2,298.3 (1.8) 7.7
Operating expense:Brazil (1,025.4) (84.4) (1,109.8) (1,113.6) 0.3 10.6 (1,081.6) (2.9) 6.3Americas (602.6) (52.4) (655.0) (705.9) 7.8 12.9 (718.9) 1.8 16.7EMEA (319.3) (28.9) (348.2) (365.2) 4.9 1.7 (381.8) 4.5 4.7Other and eliminations(1) (16.7) (69.4) (86.1) (56.7) (34.1) N.M. (69.0) 21.7 22.4
Total operating expenses (1,964.0) (235.1) (2,199.1) (2,241.4) 1.9 8.1 (2,251.3) 0.4 9.7
Operating profit/(loss):Brazil 91.2 12.3 103.5 94.8 (8.4) 1.0 103.5 9.2 19.3Americas 62.7 11.7 74.4 67.6 (9.1) (4.6) 64.3 (4.9) 5.5EMEA 29.1 3.2 32.3 (0.1) (100.3) (100.3) (45.6) N.M. N.M.Other and eliminations(1) (19.2) (69.6) (88.8) (57.3) (35.5) N.M. (35.0) (38.9) (38.6)
Total operating profit 163.8 (42.4) 121.4 105.0 (13.5) (1.2) 87.2 (17.0) (1.3)
Net finance expense:Brazil (6.8) (2.6) (9.4) (43.9) N.M. N.M. (42.9) (2.3) 7.1Americas (2.7) (2.7) (5.4) (3.9) (27.8) 0.0 (14.7) N.M. N.M.EMEA (1.4) (0.8) (2.2) (18.4) N.M. N.M. (13.6) (26.1) (26.1)Other and eliminations(1) (2.0) — (2.0) (34.5) N.M. N.M. (39.6) 14.8 14.8
Total net finance expense (12.9) (6.0) (19.0) (100.7) N.M. N.M. (110.8) 10.0 17.4
Income tax expense:Brazil (25.9) 27.5 1.6 (17.7) N.M. N.M. (22.3) 26.0 37.9Americas (25.9) (0.2) (26.1) (19.3) (26.1) (23.0) (19.7) 2.1 11.9EMEA (8.2) (0.6) (8.8) 7.8 N.M. N.M. 15.4 97.4 96.2Other and eliminations(1) (0.7) (34.8) (35.5) 20.9 N.M. N.M. 8.1 (61.2) (61.2)
Total income tax expense (60.7) (8.1) (68.8) (8.3) (87.9) (82.7) (18.5) 122.9 N.M.
Profit/(loss) for the period:Brazil 58.6 37.3 95.9 33.2 (65.4) (61.8) 38.3 15.4 26.2Americas 34.1 8.8 42.9 44.4 3.5 6.1 29.9 (32.7) (28.8)EMEA 19.5 1.7 21.2 (10.7) N.M. N.M. (43.8) N.M. N.M.Other and eliminations(1) (22.0) (104.4) (126.4) (70.9) (43.9) N.M. (66.5) (6.2) (6.1)
Profit/(loss) for the period 90.2 (56.6) 33.6 (4.0) (119.9) (90.8) (42.1) N.M. N.M.
Other financial data:EBITDA(2):Brazil 126.9 15.7 142.7 150.7 5.6 16.5 158.8 5.4 15.3Americas 92.2 14.5 106.7 115.3 8.1 11.7 107.2 (7.0) 2.2EMEA 41.4 4.4 45.8 24.3 (46.9) (48.7) (25.1) N.M. N.M.Other and eliminations(1) (18.6) (69.6) (88.2) (56.3) (36.2) N.M. (33.9) (39.8) (39.5)
Total EBITDA (unaudited) 241.9 (34.9) 207.0 234.0 13.0 22.9 207.0 (11.5) (0.8)
Adjusted EBITDA(2):Brazil 128.7 16.4 145.1 161.1 11.0 21.4 172.1 6.8 16.9Americas 94.2 19.2 113.4 118.4 4.4 7.8 117.7 (0.6) 10.7EMEA 31.4 3.9 35.3 26.7 (24.4) (26.6) 26.4 (1.1) (1.2)Other and eliminations(1) (18.4) (7.3) (25.7) (11.1) (56.8) N.M. (9.8) (11.7) (9.9)
Total Adjusted EBITDA(unaudited) 235.9 32.2 268.1 295.1 10.1 16.9 306.4 3.8 13.7
(1) Includes revenue and expenses at the holding-company level (such as corporate expenses and Acquisition related expenses), asapplicable, as well as consolidation adjustments.
(2) For a reconciliation with IFRS as issued by the IASB, see section ‘Reconciliation of EBITDA and Adjusted EBITDA to profit/(loss)’.N.M. means not meaningful.
51
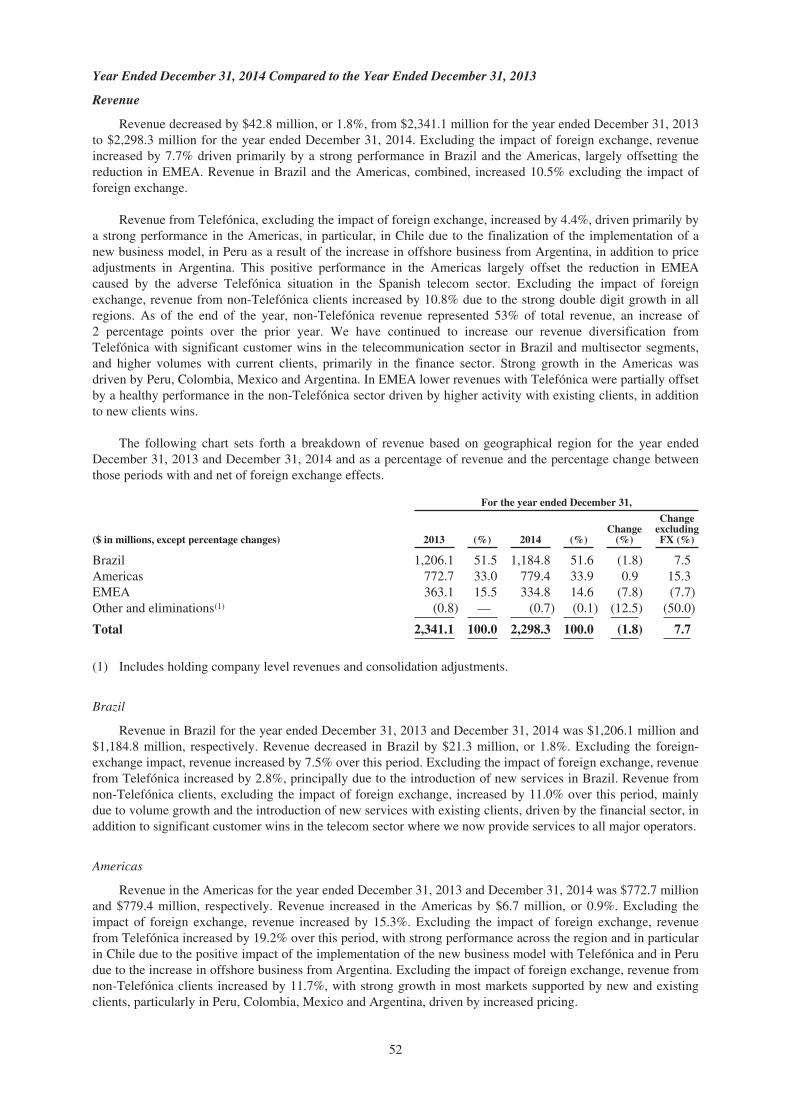
Year Ended December 31, 2014 Compared to the Year Ended December 31, 2013
Revenue
Revenue decreased by $42.8 million, or 1.8%, from $2,341.1 million for the year ended December 31, 2013to $2,298.3 million for the year ended December 31, 2014. Excluding the impact of foreign exchange, revenueincreased by 7.7% driven primarily by a strong performance in Brazil and the Americas, largely offsetting thereduction in EMEA. Revenue in Brazil and the Americas, combined, increased 10.5% excluding the impact offoreign exchange.
Revenue from Telefónica, excluding the impact of foreign exchange, increased by 4.4%, driven primarily bya strong performance in the Americas, in particular, in Chile due to the finalization of the implementation of anew business model, in Peru as a result of the increase in offshore business from Argentina, in addition to priceadjustments in Argentina. This positive performance in the Americas largely offset the reduction in EMEAcaused by the adverse Telefónica situation in the Spanish telecom sector. Excluding the impact of foreignexchange, revenue from non-Telefónica clients increased by 10.8% due to the strong double digit growth in allregions. As of the end of the year, non-Telefónica revenue represented 53% of total revenue, an increase of2 percentage points over the prior year. We have continued to increase our revenue diversification fromTelefónica with significant customer wins in the telecommunication sector in Brazil and multisector segments,and higher volumes with current clients, primarily in the finance sector. Strong growth in the Americas wasdriven by Peru, Colombia, Mexico and Argentina. In EMEA lower revenues with Telefónica were partially offsetby a healthy performance in the non-Telefónica sector driven by higher activity with existing clients, in additionto new clients wins.
The following chart sets forth a breakdown of revenue based on geographical region for the year endedDecember 31, 2013 and December 31, 2014 and as a percentage of revenue and the percentage change betweenthose periods with and net of foreign exchange effects.
For the year ended December 31,
($ in millions, except percentage changes) 2013 (%) 2014 (%)Change
(%)
ChangeexcludingFX (%)
Brazil 1,206.1 51.5 1,184.8 51.6 (1.8) 7.5Americas 772.7 33.0 779.4 33.9 0.9 15.3EMEA 363.1 15.5 334.8 14.6 (7.8) (7.7)Other and eliminations(1) (0.8) — (0.7) (0.1) (12.5) (50.0)
Total 2,341.1 100.0 2,298.3 100.0 (1.8) 7.7
(1) Includes holding company level revenues and consolidation adjustments.
Brazil
Revenue in Brazil for the year ended December 31, 2013 and December 31, 2014 was $1,206.1 million and$1,184.8 million, respectively. Revenue decreased in Brazil by $21.3 million, or 1.8%. Excluding the foreign-exchange impact, revenue increased by 7.5% over this period. Excluding the impact of foreign exchange, revenuefrom Telefónica increased by 2.8%, principally due to the introduction of new services in Brazil. Revenue fromnon-Telefónica clients, excluding the impact of foreign exchange, increased by 11.0% over this period, mainlydue to volume growth and the introduction of new services with existing clients, driven by the financial sector, inaddition to significant customer wins in the telecom sector where we now provide services to all major operators.
Americas
Revenue in the Americas for the year ended December 31, 2013 and December 31, 2014 was $772.7 millionand $779.4 million, respectively. Revenue increased in the Americas by $6.7 million, or 0.9%. Excluding theimpact of foreign exchange, revenue increased by 15.3%. Excluding the impact of foreign exchange, revenuefrom Telefónica increased by 19.2% over this period, with strong performance across the region and in particularin Chile due to the positive impact of the implementation of the new business model with Telefónica and in Perudue to the increase in offshore business from Argentina. Excluding the impact of foreign exchange, revenue fromnon-Telefónica clients increased by 11.7%, with strong growth in most markets supported by new and existingclients, particularly in Peru, Colombia, Mexico and Argentina, driven by increased pricing.
52
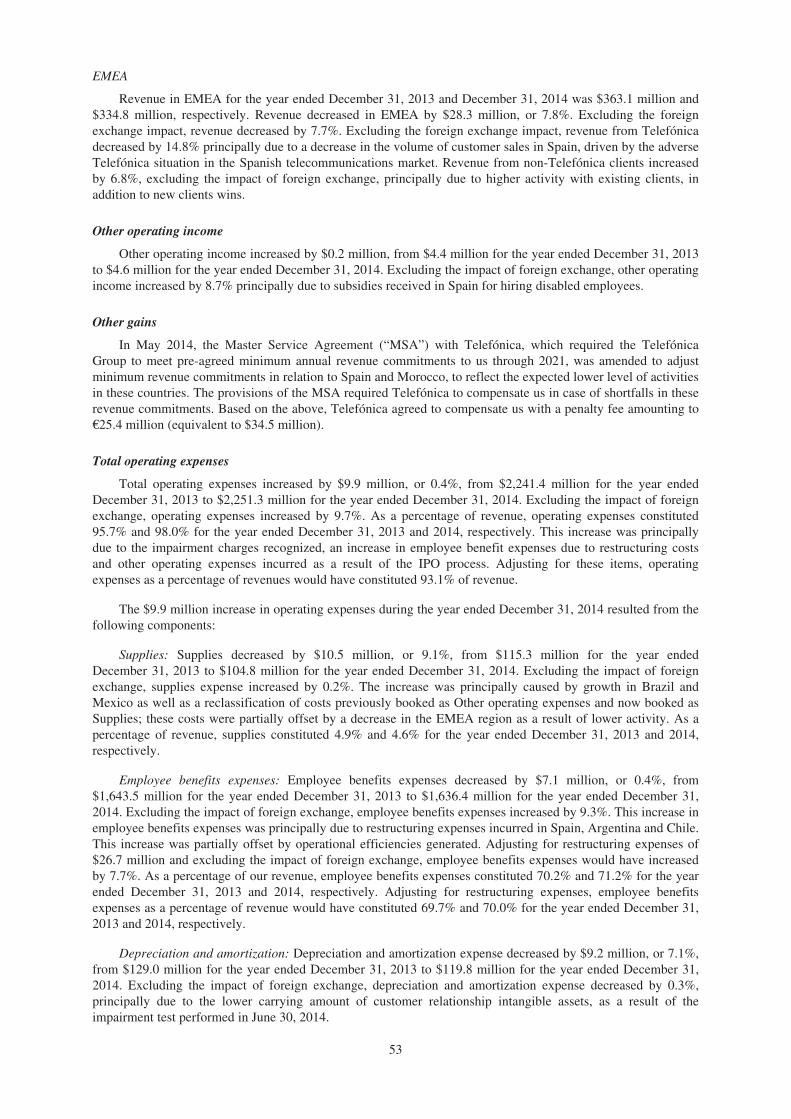
EMEA
Revenue in EMEA for the year ended December 31, 2013 and December 31, 2014 was $363.1 million and$334.8 million, respectively. Revenue decreased in EMEA by $28.3 million, or 7.8%. Excluding the foreignexchange impact, revenue decreased by 7.7%. Excluding the foreign exchange impact, revenue from Telefónicadecreased by 14.8% principally due to a decrease in the volume of customer sales in Spain, driven by the adverseTelefónica situation in the Spanish telecommunications market. Revenue from non-Telefónica clients increasedby 6.8%, excluding the impact of foreign exchange, principally due to higher activity with existing clients, inaddition to new clients wins.
Other operating income
Other operating income increased by $0.2 million, from $4.4 million for the year ended December 31, 2013to $4.6 million for the year ended December 31, 2014. Excluding the impact of foreign exchange, other operatingincome increased by 8.7% principally due to subsidies received in Spain for hiring disabled employees.
Other gains
In May 2014, the Master Service Agreement (“MSA”) with Telefónica, which required the TelefónicaGroup to meet pre-agreed minimum annual revenue commitments to us through 2021, was amended to adjustminimum revenue commitments in relation to Spain and Morocco, to reflect the expected lower level of activitiesin these countries. The provisions of the MSA required Telefónica to compensate us in case of shortfalls in theserevenue commitments. Based on the above, Telefónica agreed to compensate us with a penalty fee amounting to€25.4 million (equivalent to $34.5 million).
Total operating expenses
Total operating expenses increased by $9.9 million, or 0.4%, from $2,241.4 million for the year endedDecember 31, 2013 to $2,251.3 million for the year ended December 31, 2014. Excluding the impact of foreignexchange, operating expenses increased by 9.7%. As a percentage of revenue, operating expenses constituted95.7% and 98.0% for the year ended December 31, 2013 and 2014, respectively. This increase was principallydue to the impairment charges recognized, an increase in employee benefit expenses due to restructuring costsand other operating expenses incurred as a result of the IPO process. Adjusting for these items, operatingexpenses as a percentage of revenues would have constituted 93.1% of revenue.
The $9.9 million increase in operating expenses during the year ended December 31, 2014 resulted from thefollowing components:
Supplies: Supplies decreased by $10.5 million, or 9.1%, from $115.3 million for the year endedDecember 31, 2013 to $104.8 million for the year ended December 31, 2014. Excluding the impact of foreignexchange, supplies expense increased by 0.2%. The increase was principally caused by growth in Brazil andMexico as well as a reclassification of costs previously booked as Other operating expenses and now booked asSupplies; these costs were partially offset by a decrease in the EMEA region as a result of lower activity. As apercentage of revenue, supplies constituted 4.9% and 4.6% for the year ended December 31, 2013 and 2014,respectively.
Employee benefits expenses: Employee benefits expenses decreased by $7.1 million, or 0.4%, from$1,643.5 million for the year ended December 31, 2013 to $1,636.4 million for the year ended December 31,2014. Excluding the impact of foreign exchange, employee benefits expenses increased by 9.3%. This increase inemployee benefits expenses was principally due to restructuring expenses incurred in Spain, Argentina and Chile.This increase was partially offset by operational efficiencies generated. Adjusting for restructuring expenses of$26.7 million and excluding the impact of foreign exchange, employee benefits expenses would have increasedby 7.7%. As a percentage of our revenue, employee benefits expenses constituted 70.2% and 71.2% for the yearended December 31, 2013 and 2014, respectively. Adjusting for restructuring expenses, employee benefitsexpenses as a percentage of revenue would have constituted 69.7% and 70.0% for the year ended December 31,2013 and 2014, respectively.
Depreciation and amortization: Depreciation and amortization expense decreased by $9.2 million, or 7.1%,from $129.0 million for the year ended December 31, 2013 to $119.8 million for the year ended December 31,2014. Excluding the impact of foreign exchange, depreciation and amortization expense decreased by 0.3%,principally due to the lower carrying amount of customer relationship intangible assets, as a result of theimpairment test performed in June 30, 2014.
53
Changes in trade provisions: Changes in trade provisions totaled a positive figure of $1.7 million for theyear ended December 31, 2014, a decrease of $0.3 million over the year ended December 31, 2013. This decreasewas principally due to the collection, in 2013, of some receivables that had previously been impaired. As apercentage of revenue, changes in trade provisions constituted 0.1% and 0.1% for the year ended December 31,2013 and 2014.
Other operating expenses: Other operating expenses increased by $4.6 million, or 1.3%, from$355.6 million for the year ended December 31, 2013 to $360.2 million for the year ended December 31, 2014.Excluding the impact of foreign exchange, other operating expenses increased by 9.2%, principally due tofinancing and IPO fees incurred during the IPO process and a reclassification from suppliers to other operatingexpenses. As a percentage of revenue, other operating expenses constituted 15.2% and 15.7% for the year endedDecember 31, 2013 and 2014, respectively.
Impairment charges: Asset impairment for the year ended December 31, 2013 relates to charges associatedto projects for inventory control in Brazil which are not related to our core results of operations. For the yearended December 31, 2014, mainly relate to the goodwill and other intangible asset impairments relating to ouroperation in Czech Republic of $3.7 million and Spain of $28.8 million.
As of June 30, 2014, we performed an impairment test on the carrying amount of customer-relationshipintangible assets, goodwill and property, plant and equipment, as a result of the amendment to the MSA whichimpacted the amount of expected revenue and also in consideration of the changes in expected revenue in certaincountries. The impairment test was performed using assumptions revised in accordance with the amendments tothe MSA and with updated management expectations on cash flow generation from the different countries wherewe operate. The result of the test performed was an impairment charge of $27.7 million of the intangible assetrelated to the customer relationship with Telefónica in connection with the MSA. Impairment charges of$1.1 million of goodwill in Spain and of $3.7 million of goodwill in the Czech Republic were recognized duringthe year ended December 31, 2014, as a result of this impairment test.
Brazil
Total operating expenses in Brazil decreased by $32.0 million, or 2.9%, from $1,113.6 million for the yearended December 31, 2013 to $1,081.6 million for the year ended December 31, 2014. Excluding the impact offoreign exchange, operating expenses in Brazil increased by 6.3%, which was slightly below revenue growth.Operating expenses as a percentage of revenue decreased from 92.3% to 91.3%. The decrease in operatingexpenses in Brazil as a percentage of sales was principally due to cost efficiencies achieved from our margintransformation programs in addition to higher costs incurred in 2013 as a result of the ramp-up of new Telefónicaservices.
Americas
Total operating expenses in the Americas increased by $13.0 million, or 1.8%, from $705.9 million for theyear ended December 31, 2013 to $718.9 million for the year ended December 31, 2014. Excluding the impact offoreign exchange, operating expenses in the Americas increased by 16.7%, in line with the increase in revenues.Operating expenses as a percentage of revenue increased from 91.4% to 92.2% in the year ended December 31,2014, mainly explained by the restructuring costs incurred in 2014. Excluding this impact, operating expenses asa percentage of revenue would have been 91.2%.
EMEA
Total operating expenses in EMEA increased by $16.6 million, or 4.5%, from $365.2 million for the yearended December 31, 2013 to $381.8 million for the year ended December 31, 2014. Operating expenses as apercentage of revenue increased from 100.6% to 114.0%. Excluding the impact of foreign exchange, operatingexpenses in EMEA increased by 4.7%. The increase in operating expenses in EMEA in the year endedDecember 31, 2014 was primarily attributable to impairment charges and restructuring costs. Excluding theimpact of these two effects amounting to $49.1 million, operating expenses as a percentage of revenue wouldhave reached 99.4%.
Operating profit
Operating profit decreased by $17.8 million, or 17.0%, from $105.0 million for the year endedDecember 31, 2013 to $87.2 million for the year ended December 31, 2014. Excluding the impact of foreign
54
exchange, operating profit decreased by 1.3%. Operating profit margin decreased from 4.5% for the year endedDecember 31, 2013 to 3.8% for the year ended December 31, 2014, due to the negative impact of costs incurredin connection with the IPO ($51.9 million), recognized impairments in EMEA ($32.5 million) and restructuringcosts ($26.7 million), partially offset by the positive impact of the MSA penalty fee (equivalent to $34.5 million).Excluding these impacts, operating profit margin for the year ended December 31, 2014, would have amountedto 7.1%, driven mainly by the operational improvements in most of the markets as a result of the implementationof our strategic initiatives, growth in Chile after the implementation of the new business model with Telefónicaduring 2013 and costs related to the introduction of new services with Telefónica in Brazil incurred during thefirst half of 2013.
Brazil
Operating profit in Brazil increased by $8.7 million, or 9.2%, from $94.8 million for the year endedDecember 31, 2013 to $103.5 million for the year ended December 31, 2014. Excluding the impact of foreignexchange, operating profit increased by 19.3% in 2014. Operating profit margin in Brazil increased from 7.9%for the year ended December 31, 2013 to 8.7% for the year ended December 31, 2014. The increase in operatingprofit in Brazil for the period was principally due to cost efficiencies achieved, partially offset by the ramp-up ofservices with new clients.
Americas
Operating profit in the Americas decreased by $3.3 million, or 4.9%, from $67.6 million for the year endedDecember 31, 2013 to $64.3 million for the year ended December 31, 2014. Excluding the impact of foreignexchange, operating profit in Americas increased by 5.5% in 2014. Operating profit margin in the Americasdecreased from 8.7% for the year ended December 31, 2013 to 8.2% for the year ended December 31, 2014. Thedecrease in operating profit in the Americas was principally attributed to restructuring costs incurred inArgentina, Chile and Peru. Excluding this impact, operating profit margin would have reached 9.3%.
EMEA
Operating profit in EMEA decreased by $45.5 million, from a loss of $0.1 million for the year endedDecember 31, 2013 to a loss of $45.6 million for the year ended December 31, 2014. Excluding the impact offoreign exchange, operating profit in EMEA decreased by $45.7 million in 2014. The operating profit margin inEMEA decreased from a loss of 0.0% for the year ended December 31, 2013 to a loss of 13.6% for the yearended December 31, 2014, principally as a result of the recognized impairment charge ($32.5 million) discussedabove and the restructuring costs incurred ($16.6 million). Excluding these impacts operating profit marginwould have increased by 1.0%.
Finance income
Finance income increased by $40.5 million, from $17.8 million for the year ended December 31, 2013 to$58.3 million for the year ended December 31, 2014. Excluding the impact of foreign exchange, finance incomeincreased by $42.9 million during the year ended December 31, 2014. This increase was principally due to higherunrealized gains on cross-currency swaps associated with the 7.375% Senior Secured Notes and on interest rateswaps associated with Brazilian Debentures, and higher finance income in Brazil.
Finance costs
Finance costs increased by $0.6 million, or 0.4%, from $135.1 million for the year ended December 31,2013 to $135.7 million for the year ended December 31, 2014. Excluding the impact of foreign exchange, financecosts increased by 5.8% during the year ended December 31, 2014. This increase was principally due to a fullperiod of finance costs incurred on the 7.375% Senior Secured Notes. These impacts were partially offset bylower unrealized losses mainly related to cross-currency swaps associated with the 7.375% Senior SecuredNotes.
Net foreign exchange gain/(loss)
Net foreign exchange gain/(loss) changed by $50.0 million, from a gain of $16.6 million for the year endedDecember 31, 2013 to a loss of $33.4 million for the year ended December 31, 2014. This decrease wasprincipally due to net foreign exchange loss resulting from liabilities denominated in foreign currencies whichdepreciated against the U.S. dollar during the 2014 period.
55
Income tax expense
Income tax benefit/(expense) for the year ended December 31, 2013 and December 31, 2014 was an expenseof $8.3 million and $18.5 million, respectively, increasing by $10.2 million during the year ended December 31,2014. Excluding the impact of foreign exchange, income tax expense increased by $14.2 million. Higher taxexpenses are primarily attributed to non-deductible expenses incurred in connection with the IPO and write-off ofexisting tax credits mainly as a result of corporate tax rate changes in Spain. The aggregated effective tax rate forthe year ended December 31, 2014 is distorted because of the contribution of losses in the holding companies toour profit before tax and the tax effect of the impairment charges. Adjusting for this effect, the average effectivetax rate for the year ended December 31, 2014 would have been 39.5%, while the average effective tax rate of theyear ended December 31, 2013 would have been 30.0%.
Profit/(loss) for the period
Profit/(loss) for the year ended December 31, 2013 and December 31, 2014 was a loss of $4.0 million and$42.1 million, respectively, as a result of the factors discussed above.
EBITDA and adjusted EBITDA
EBITDA decreased by $27.0 million, or 11.5%, from $234.0 million for the year ended December 31, 2013to $207.0 million for the year ended December 31, 2014. Adjusted EBITDA increased by $11.3 million, or 3.8%,from $295.1 million for the year ended December 31, 2013 to $306.4 million for the year ended December 31,2014. The difference between EBITDA and adjusted EBITDA was due to the exclusion of items that were notrelated to our core results of operations. Our adjusted EBITDA is defined as EBITDA adjusted to exclude theacquisition and integration related costs, restructuring costs, sponsor management fees, asset impairments, siterelocation costs, financing and IPO fees and other items which are not related to our core results of operations.See “Item 3A. Selected Financial Data” for a reconciliation of EBITDA and adjusted EBITDA to profit/(loss).
Excluding the impact of foreign exchange, EBITDA decreased by 0.8% and adjusted EBITDA increased by13.7% mainly due to revenue growth and solid performance in Brazil and Americas, more than offsettingreduced activity with Telefónica in EMEA.
Brazil
EBITDA in Brazil increased by $8.1 million, or 5.4%, from $150.7 million for the year ended December 31,2013 to $158.8 million for the year ended December 31, 2014. Adjusted EBITDA in Brazil increased by $11.0million, or 6.8%, from $161.1 million for the year ended December 31, 2013 to $172.1 million for the year endedDecember 31, 2014. Excluding the impact of foreign exchange, EBITDA and adjusted EBITDA increased by15.3% and 16.9%, respectively. The increase in EBITDA and adjusted EBITDA was principally due to the stronggrowth in revenue with existing clients and the capture of new clients, as well as operating efficiencies achievedfrom our margin transformational programs.
Americas
EBITDA in the Americas decreased by $8.1 million, or 7.0%, from $115.3 million for the year endedDecember 31, 2013 to $107.2 million for the year ended December 31, 2014. Adjusted EBITDA in the Americasdecreased by $0.7 million, or 0.6%, from $118.4 million for the year ended December 31, 2013 to $117.7 millionfor the year ended December 31, 2014. Excluding the impact of foreign exchange, EBITDA and adjustedEBITDA increased during the year ended December 31, 2014 by 2.2% and 10.7%, respectively. The increase inAdjusted EBITDA was primarily attributed to strong growth achieved in the region, mainly in Argentina, Chileand Peru. Adjusted EBITDA margin grew at a slower pace than revenue, as a result of higher recruiting andtraining costs to ramp-up the offshore business from Telefónica Argentina to Peru. On the other side, Chile waspositively impacted by the finalization of the implementation of the new business model with Telefónica.
EMEA
EBITDA in EMEA decreased by $49.4 million, from a gain of $24.3 million for the year endedDecember 31, 2013 to a loss of $25.1 million for the year ended December 31, 2014. Adjusted EBITDA inEMEA decreased by $0.3 million, from $26.7 million for the year ended December 31, 2013 to $26.4 million forthe year ended December 31, 2014. The decrease in Adjusted EBITDA, during the year ended December 31,2014 was principally due to a reduction in Telefónica volumes in Spain which implied an oversized structurebefore the execution of the restructuring process in the year ended December 31, 2014.
56

Year Ended December 31, 2013 Compared to the Year Ended December 31, 2012
Revenue
Revenue increased by $24.3 million, or 1.0%, from $2,316.8 million for the year ended December 31, 2012to $2,341.1 million for the year ended December 31, 2013. Excluding the impact of foreign exchange, revenueincreased by 7.5%. Excluding the impact of foreign exchange, revenue from Telefónica Group companiesincreased by 4.7%, driven primarily by strong performance in Brazil and the Americas, which was partiallyoffset by adverse macro-economic conditions in Spain. Revenue from non-Telefónica clients increased by10.3%, excluding the impact of foreign exchange, principally due to strong market growth in Brazil and theAmericas and contract wins with existing and new customers.
The following chart sets forth a breakdown of revenue based on geographical region for the years endedDecember 31, 2012 and December 31, 2013 and as a percentage of total revenue and the percentage changebetween periods and net of foreign exchange effects.
For the year ended December 31,
Non-IFRSAggregated(unaudited)
($ in millions, except percentage changes) 2012 (%) 2013 (%)Change
(%)
ChangeexcludingFX (%)
(unaudited)
Brazil 1,213.1 52.4 1,206.1 51.5 (0.6) 9.6Americas 726.2 31.3 772.7 33.0 6.4 11.6EMEA 378.5 16.3 363.1 15.5 (4.1) (7.0)Other and eliminations(1) (1.0) — (0.8) — (20.0) N.M.
Total 2,316.8 100.0 2,341.1 100.0 1.0 7.5
(1) Includes holding company level revenues and consolidation adjustments.
Brazil
Revenue in Brazil for the years ended December 31, 2012 and December 31, 2013 was $1,213.1 million and$1,206.1 million, respectively. Revenue decreased in Brazil by $7.0 million, or 0.6%. Excluding the impact offoreign exchange, revenue increased by 9.6%. Excluding the impact of foreign exchange, revenue fromTelefónica Group companies increased by 9.9%, principally due to increases in the price of our services, volumegrowth in existing services, and the introduction of new services. Revenue from non-Telefónica clients increasedby 9.4%, excluding the impact of foreign exchange, principally attributable to price increases, volume growth inexisting services, the introduction of new services, primarily in the financial sector, and new customers in thetelecommunications and financial sectors.
Americas
Revenue in the Americas for the years ended December 31, 2012 and December 31, 2013 was$726.2 million and $772.7 million, respectively. Revenue increased in the Americas by $46.5 million, or 6.4%.Excluding the impact of foreign exchange, revenue increased by 11.6%. Excluding the impact of foreignexchange, revenue from Telefónica Group companies increased by 8.5%, with solid performance in mostmarkets, which was partially offset by a decrease in revenue in Chile as a result of the implementation of the newservice delivery model by Telefónica during 2012 and 2013. Excluding the impact of foreign exchange, revenuefrom non-Telefónica clients increased by 14.8% with a strong performance across all markets.
EMEA
Revenue in EMEA for the years ended December 31, 2012 and December 31, 2013 was $378.5 million and$363.1 million, respectively. Revenue decreased in EMEA by $15.4 million, or 4.1%. Excluding the impact offoreign exchange, revenue decreased by 7.0%. Excluding the impact of foreign exchange, revenue fromTelefónica Group companies decreased by 10.8% principally due to a decrease in volume of sales in Spain,driven by adverse macro-economic conditions. Excluding the impact of foreign exchange, revenue from non-Telefónica clients increased by 1.7% driven by the expansion of multi-sector private clients.
57
Other operating income
Other operating income increased by $0.7 million, or 18.9%, from $3.7 million for the year endedDecember 31, 2012 to $4.4 million for the year ended December 31, 2013. Excluding the impact of foreignexchange, other operating income increased by 21.6%, principally due to income derived from insurancerecovery in Brazil.
Total operating expenses
Total operating expenses increased by $42.3 million, or 1.9%, from $2,199.1 million for the year endedDecember 31, 2012 to $2,241.4 million for the year ended December 31, 2013. Excluding the impact of foreignexchange, operating expenses increased by 8.1%, principally due to increases in employee benefit expenses andto greater depreciation and amortization expense. As a percentage of revenue, operating expenses constituted94.9% and 95.7% for the years ended December 31, 2012 and 2013, respectively. The $42.3 million increase inoperating expenses resulted from the following components:
Supplies: Supplies increased by $1.4 million, or 1.2%, from $113.9 million for the year ended December 31,2012 to $115.3 million for the year ended December 31, 2013. Excluding the impact of foreign exchange,supplies expense increased by 6.8%, principally as a result of general growth in our business. As a percentage ofrevenue, supplies constituted 4.9% for each of the years ended December 31, 2012 and 2013.
Employee benefits expenses: Employee benefits expenses increased by $34.0 million, or 2.1%, from$1,609.5 million for the year ended December 31, 2012 to $1,643.5 million for the year ended December 31,2013. As a percentage of our revenue, employee benefits expenses constituted 69.5% and 70.2% for the yearsended December 31, 2012 and December 31, 2013, respectively. Excluding the impact of foreign exchange,employee benefits expenses increased by 8.5%. Adjusting for restructuring expenses between 2013 and 2012 of$12.8 million and $8.6 million, respectively, and the positive impact in 2012 of the release of an employeebenefit accrual of $11.3 million following the better-than-expected outcome of the collective bargainingagreement negotiation in Spain, employee benefits expenses increased by 7.5% in constant currency, which wasbroadly in line with the increase in revenue. This increase in employee benefits expenses was principally due tothe growth of our business, as we increased the average number of employees from 150,248 in 2012 to 155,832in 2013, an increase of 3.7%, as well as the cost of higher wages.
Depreciation and amortization: Depreciation and amortization expense increased by $43.4 million, or50.7%, from $85.6 million for the year ended December 31, 2012 to $129.0 million for the year endedDecember 31, 2013. Excluding the impact of foreign exchange, depreciation and amortization expense increasedby 57.0%, principally due to a $40.7 million increase in amortization charges derived from the recognition ofcustomer-relationship intangible assets in connection with the Acquisition.
Changes in trade provisions: Changes in trade provisions improved by $13.1 million, from a negativechange of $11.1 million for the year ended December 31, 2012 to positive change of $2.0 million for the yearended December 31, 2013, principally due to improved collections on receivables we had previously impaired.As a percentage of revenue, changes in trade provisions constituted 0.5% and (0.1)% for the years endedDecember 31, 2012 and 2013, respectively.
Other operating expenses: Other operating expenses decreased by $23.4 million, or 6.2%, from$379.0 million for the year ended December 31, 2012 to $355.6 million for the year ended December 31, 2013.Excluding the impact of foreign exchange, other operating expenses decreased by 0.6%, principally due to(i) expenses recorded in 2012 related to the Acquisition, which amounted to $62.6 million and did not recur in2013; (ii) general cost efficiencies and savings in most of the countries in which we operate; and (iii) their beingoffset by integration-related costs, including consultancy and professional fees, associated with the change ofownership of the Atento Group, amounting to $27.9 million. We had $124.6 million in expenses for operatingleases for the year ended December 31, 2012 as compared to $118.3 million in expenses for operating leases forthe year ended December 31, 2013. As a percentage of revenue, other operating expenses constituted 16.4% and15.2% for the years ended December 31, 2012 and 2013, respectively.
Brazil
Total operating expenses in Brazil increased by $3.8 million, or 0.3%, from $1,109.8 million for the yearended December 31, 2012 to $1,113.6 million for the year ended December 31, 2013. Excluding the impact offoreign exchange, operating expenses in Brazil increased by 10.6%. Operating expenses as a percentage of
58
revenue in Brazil increased from 91.5% to 92.3%. This increase was principally due to increased amortizationcharges derived from the recognition of customer relationship intangible assets in connection with theAcquisition by approximately $18.9 million or 1.6% of revenues.
Americas
Total operating expenses in the Americas increased $50.9 million, or 7.8%, from $655.0 million for the yearended December 31, 2012 to $705.9 million for the year ended December 31, 2013. Excluding the impact offoreign exchange, operating expenses in the Americas increased by 12.9%. Operating expenses as a percentageof revenue increased in the Americas from 90.2% to 91.4%. The increase in operating expenses as a percentageof revenue in the Americas was principally due to an increase in the amortization charges of $12.2 millionderived from the recognition of customer relationship intangible assets in connection with the Acquisition. Thisincrease in 2013 was partially offset by the severance payments of senior management in Mexico incurred, whichamounted to $2.2 million in 2012 and did not recur during 2013.
EMEA
Total operating expenses in EMEA increased by $17.0 million, or 4.9%, from $348.2 million for the yearended December 31, 2012 to $365.2 million for the year ended December 31, 2013. Excluding the impact offoreign exchange, operating expenses in EMEA increased by 1.7%. Operating expenses as a percentage ofrevenue in EMEA increased from 92.0% to 100.6% as a result of declining revenues mainly in Spain withTelefónica and increase in amortization of intangibles of $9.5 million. Excluding this impact, operating expensesas a percentage of revenue in EMEA represented 98.0%.
Operating profit
Operating profit decreased by $16.4 million, or 13.5%, from $121.4 million for the year endedDecember 31, 2012 to $105.0 million for the year ended December 31, 2013. Excluding the impact of foreignexchange, operating profit decreased by 1.2%. As a percentage of revenue, the operating profit margin decreasedfrom 5.2% for the year ended December 31, 2012 to 4.5% for the year ended December 31, 2013; this wasprimarily driven by increased amortization charges of $40.7 million which were derived from the recognition ofcustomer-relationship intangible assets in connection with the Acquisition. Excluding this impact, operatingprofit margin would have increased to 6.2%, driven mainly by a continued focus on reducing fixed costs andexpenses which were recorded in 2012 in relation to the Acquisition and which did not recur in 2013; althoughthese were partially offset by our integration costs in 2013.
Brazil
Operating profit in Brazil decreased by $8.7 million, or 8.4%, from $103.5 million for the year endedDecember 31, 2012 to $94.8 million for the year ended December 31, 2013. Excluding the impact of foreignexchange, operating profit increased by 1.0%. Operating profit margin in Brazil decreased from 8.5% for the yearended December 31, 2012 to 7.9% for the year ended December 31, 2013. The decrease in operating profitmargin in Brazil was principally due to increased amortization charges associated with the customer portfoliointangible assets recognized in connection with the Acquisition. Excluding this impact, operating profit marginwould have increased to 9.4% in 2013.
Americas
Operating profit in the Americas decreased by $6.8 million, or 9.1%, from $74.4 million for the year endedDecember 31, 2012 to $67.6 million for the year ended December 31, 2013. Excluding the impact of foreignexchange, operating profit in the Americas decreased by 4.6%. Operating profit margin in the Americasdecreased from 10.2% for the year ended December 31, 2012 to 8.7% for the year ended December 31, 2013.The decrease in operating profit margin in Americas was principally attributable to increased amortizationcharges associated with the customer portfolio intangible assets recognized in connection with the Acquisition.Excluding this impact, the operating profit margin would have increased to 10.3% in 2013, in line with 2012’soperating profit margin.
EMEA
Operating profit in EMEA decreased by $32.4 million, or 100.3%, from $32.3 million for the year endedDecember 31, 2012 to $0.1 million for the year ended December 31, 2013. Excluding the impact of foreign
59
exchange, operating profit decreased by 100.3%. Operating profit margin in EMEA decreased from 8.5% for theyear ended December 31, 2012 to no margin for the year ended December 31, 2013. The decrease in operatingprofit in EMEA was principally due to the decrease in the volume of sales to Telefónica due to adversemacroeconomic conditions in Spain and the increased amortization charges associated with the client-portfoliointangible assets recognized in connection with the Acquisition. Excluding this impact, the operating profitmargin in 2013 would have decreased to 2.6%.
Finance income
Finance income increased by $3.6 million, or 25.4%, from $14.2 million for the year ended December 31,2012 to $17.8 million for the year ended December 31, 2013. Excluding the impact of foreign exchange, financeincome increased by 32.4%. This increase is principally due to an increase in cash, deposits and short termfinancial investments.
Finance costs
Finance costs increased by $102.9 million, from $32.2 million for the year ended December 31, 2012 to$135.1 million for the year ended December 31, 2013. This increase was principally due to higher interest costsin connection with the Acquisition related financings and changes in the fair value of hedge instruments.
Net foreign exchange gain/(loss)
Net foreign exchange gain/(loss) increased by $17.6 million, from a loss of $1.0 million for the year endedDecember 31, 2012 to a gain of $16.6 million for the year ended December 31, 2013. This increase wasprincipally due to exchange gains from liabilities denominated in foreign currency held by certain intermediateholding companies as a result of the depreciation of these currencies against the U.S. dollar.
Income tax expense
Income tax expense for the years ended December 31, 2012 and December 31, 2013 was $68.8 million and$8.3 million, respectively, decreasing by $60.5 million, or 87.9%. Excluding the impact of foreign exchange,income tax expense decreased by 82.7% primarily as a result of the tax deductibility of goodwill amortization inBrazil and interest expenses. The aggregate effective tax rate in both 2013 and 2012 is distorted because of thecontribution of losses in the holding companies to our profit before tax. Adjusting for this effect, the aggregaterate excluding the Group’s holding companies in 2013 was 30% compared to 33% for the year endedDecember 31, 2012.
Profit/(loss) for the period
Profit/(loss) for the years ended December 31, 2012 and December 31, 2013 was $33.6 million and$(4.0) million, respectively. Excluding the impact of foreign exchange, the profit margin decreased from 1.5% in2012 to 0.1% in 2013 as a result of the factors discussed above.
EBITDA and adjusted EBITDA
EBITDA increased by $27.0 million, or 13.0%, from $207.0 million for the year ended December 31, 2012to $234.0 million for the year ended December 31, 2013. Adjusted EBITDA increased by $27.0 million, or10.1%, from $268.1 million for the year ended December 31, 2012 to $295.1 million for the year endedDecember 31, 2013. Additionally, the increase in EBITDA in 2013 was higher than in 2012, as a result of adecrease in Acquisition and integration related costs from $62.6 million in 2012 to $29.3 million in 2013. Thedifference between EBITDA and adjusted EBITDA is due to the exclusion of items that are not related to ourcore results of operations. The Company’s adjusted EBITDA is defined as EBITDA adjusted to excludeAcquisition and integration related costs, restructuring costs, sponsor management fees, asset impairments, siterelocation costs, financing fees, and other items which are not related to our core results of operations. See the“Item 3A. Selected Financial Data” section for reconciliation of EBITDA and adjusted EBITDA to profit/(loss).Excluding the impact of foreign exchange, EBITDA and adjusted EBITDA increased by 22.9% and 16.9%,respectively. The increase in EBITDA and adjusted EBITDA was principally due to the growth in revenue andcost efficiencies in many of the countries in which we operate.
60
Brazil
EBITDA in Brazil increased by $8.0 million, or 5.6%, from $142.7 million for the year ended December 31,2012 to $150.7 million for the year ended December 31, 2013. Adjusted EBITDA in Brazil increased by$16.0 million, or 11.0%, from $145.1 million for the year ended December 31, 2012 to $161.1 million for theyear ended December 31, 2013. Excluding the impact of foreign exchange, EBITDA and adjusted EBITDAincreased by 16.5% and 21.4%, respectively. The increase in EBITDA was principally due to the growth inrevenue.
Americas
EBITDA in Americas increased by $8.6 million, or 8.1%, from $106.7 million for the year endedDecember 31, 2012 to $115.3 million for the year ended December 31, 2013. Adjusted EBITDA in Americasincreased by $5.0 million, or 4.4%, from $113.4 million for the year ended December 31, 2012 to $118.4 millionfor the year ended December 31, 2013. Excluding the impact of foreign exchange, EBITDA and adjustedEBITDA increased by 11.7% and 7.8%, respectively. The increase in EBITDA and adjusted EBITDA wasprincipally due to the growth in revenue and cost efficiencies. Additionally, the growth in EBITDA in 2013 waspositively influenced by the decrease in costs related to the Acquisition.
EMEA
EBITDA in EMEA decreased by $21.5 million, or 46.9%, from $45.8 million for the year endedDecember 31, 2012 to $24.3 million for the year ended December 31, 2013. Adjusted EBITDA in EMEAdecreased by $8.6 million, or 24.4%, from $35.3 million for the year ended December 31, 2012 to $26.7 millionfor the year ended December 31, 2013. Excluding the impact of foreign exchange, EBITDA and adjustedEBITDA decreased by 48.7% and 26.6%, respectively. The decrease in EBITDA is principally due to thepositive impact in 2012 of the release of an employee benefit accrual of $11.3 million following thebetter-than-expected outcome of the negotiation over the collective bargaining agreement in Spain, which did notrecur in 2013, as well as a reduced work volume with Telefónica.
B. Liquidity and Capital Resources
We fund our ongoing capital and working capital requirements through a combination of cash flows fromour operating and financing activities. Based on our current and anticipated levels of operations and conditions inour markets and industry, we believe that our cash on hand and cash flows from our operating, investing andfinancing activities, including funds available under the Revolving Credit Facility, will enable us to meet ourworking capital, capital expenditures, debt service and other funding requirements for the foreseeable future. Wehave ample liquidity: (i) as at December 31, 2013, the total amount of credit available to us was €50 million($69 million) under our Revolving Credit Facility, which remains undrawn as at December 31, 2014. In addition,we had cash and cash equivalents (net of any outstanding bank overdrafts) of approximately $213.5 million, ofwhich $13.7 million is located in Argentina and subject to restrictions on our ability to transfer them out of thecountry; (ii) as at December 31, 2014, the total amount of credit available to us was €50 million ($60.7 million)under our Revolving Credit Facility, which remains undrawn as at December 31, 2014. In addition, we had cashand cash equivalents (net of any outstanding bank overdrafts) and short-term financial investments ofapproximately $238.3 million as of December 31, 2014, of which $8.0 million (approximately than 3% of thetotal) is located in Argentina and subject to restrictions on our ability to transfer them out of the country.
However, our ability to fund our working capital needs, debt payments and other obligations, and to complywith the financial covenants under our debt agreements, depends on our future operating performance and cashflow, which are in turn subject to prevailing economic conditions, and other factors, many of which are beyondour control. Any future acquisitions, joint ventures or other similar transactions will likely require additionalcapital and such capital may not be available to us on acceptable terms, if at all.
As of December 31, 2014, our outstanding debt amounted to $653.3 million, which includes $300.3 millionof our 7.375% Senior Secured Notes due 2020, $245.9 million equivalent amount of Brazilian Debentures,$36.4 million of CVIs, $9.0 million of finance lease payables, $61.3 million of financing provided by BNDES,and $0.4 million of other bank borrowings.
During the year ended December 31, 2014 we drew down BRL161.5 million (equivalent to $60.8 million)under our credit agreement with BNDES. On May 30, 2014, Midco issued PECs for an aggregate amount of€64.1 million (equivalent to $87.3 million) which proceeds were applied to make a partial prepayment of theVendor Loan Note. In addition, the MSA with Telefónica was amended and Telefónica agreed to compensate us
61
with a penalty fee amounting to €25.4 million (equivalent to $30.9 million for the year ended December 31,2014). We, in turn, used this amount to partially prepay the Vendor Loan Notes due to Telefónica. We prepaidBRL34.4 million, BRL45.0 million and BRL80.0 million, respectively (equivalent to $15.5 million,$20.4 million and $33.1 million, respectively) of the Brazilian Debentures. Finally, the Company, in connectionwith the IPO completed the following operations: on October 3, 2014, capitalized the Preferred EquityCertificates for a total amount of €460.1 million (approximately $575.9 million), and on October 7, 2014, repaidthe entire outstanding amount under the Vendor Loan Note for a total amount of €23.3 million (approximately$29.5 million).
For the year ended December 31, 2014, our cash flow used for debt service totaled $283.7 million, whichincluded voluntary prepayments of our Brazilian Debentures of BRL34.4 million (equivalent to $15.5 million) onMay 12, 2014, BRL45.0 million (equivalent to $20.4 million) on June 26, 2014, and BRL80.0 million (equivalentto $33.1 million) on August 28, 2014, voluntary prepayments of our Vendor Loan Note of €64.1 million(equivalent to $87.3 million) on May 30, 2014, and €23.3 million (equivalent to $29.5 million) on October 7,2014, and interest payments of $96.5 million. Also, during the year ended December 31, 2014, our net cash flowsfrom operating activities totaled $135.3 million, which includes interest paid of $96.5 million. As such, our netcash flows from operating activities (before giving effect to the payment of interest) amounted to $231.8 million.Cash flow used to service our debt represented 122.4% of our net cash flows from operating activities (beforegiving effect to the payment of interest). Excluding the voluntary prepayments of our Brazilian Debentures andVendor Loan Note mentioned above, our cash flow related to interest payment and mandatory debt repaymentrepresented 43.1% of the cash flows from operating activities (before considering the effect of the payment ofinterest).
Cash Flow
As of December 31, 2014, we had cash and cash equivalents (net of any outstanding bank overdrafts) andshort-term financial investments of approximately $238.3 million. We believe that our current cash flow fromoperating activities and financing arrangements will provide us with sufficient liquidity to meet our workingcapital needs.
PredecessorNon-IFRS
Aggregated
($ in millions)
As of and forthe period fromJan 1 – Nov 30,
As of and forthe period fromDec 1 – Dec 31,
For the yearended
December 31,For the year ended
December 31,2012 2012 2012 2013 2014
(unaudited)
Cash provided by/(used in) operating activities 163.6 (68.3) 95.3 99.6 135.3Cash used in investing activities (118.7) (846.1) (964.8) (123.4) (149.8)Cash provided by/(used in) financing activities (75.0) 1,109.6 1,034.6 31.2 38.8Effect of changes in exchanges rates (2.2) 5.1 2.9 5.8 (26.4)Net increase (decrease) in cash and cash
equivalents (32.3) 200.3 168.0 13.2 (2.1)
Cash Provided by Operating Activities
Year Ended December 31, 2014 Compared to Year Ended December 31, 2013
Net cash provided by operating activities was $135.3 million for the year ended December 31, 2014compared to $99.6 million for the year ended December 31, 2013. The increase in net cash provided by operatingactivities resulted from an overall improvement in working capital performance and also due to lower taxes paid.
Year Ended December 31, 2013 Compared to Year Ended December 31, 2012
Net cash provided by operating activities was $99.6 million for the year ended December 31, 2013compared to $95.3 million for the year ended December 31, 2012. Net cash provided by operating activities wasstable, as growth in the business was offset by higher interest payments in connection with certain debt facilitieswe entered into in 2012 in connection with the Acquisition of Atento by funds associated with Bain CapitalPartners L.L.C.
62

Cash Used in Investing Activities
Year Ended December 31, 2014 Compared to Year Ended December 31, 2013
Net cash used in investing activities was $149.8 million for the year ended December 31, 2014 compared to$123.4 million for the year ended December 31, 2013. Net cash used in investing activities for the year endedDecember 31, 2014 mainly include payments for capital expenditure of $117.9 million, acquisition ofsubsidiaries of $7.5 million, net payments for financial instruments of $26.6 million, which include of$26.6 million of net short-term financial investments in Brazil. The increase for the year ended December 31,2014 was primarily driven by the net short-term financial investments in Brazil to protect our cash holdings inU.S. dollars.
Year Ended December 31, 2013 Compared to Year Ended December 31, 2012
Net cash used in investing activities was $123.4 million for the year ended December 31, 2013 compared to$964.8 million for the year ended December 31, 2012. The decrease in 2013 was principally attributable to theimpact in 2012 of the consideration of $795.4 million paid to Telefónica in relation to the Acquisition.
Cash Provided by/(Used in) Financing Activities
Year Ended December 31, 2014 Compared to Year Ended December 31, 2013
Net cash provided by financing activities was $38.8 million for the year ended December 31, 2014compared to $31.2 million for the year ended December 31, 2013. The increase in net cash provided by financingactivities was primarily attributable to the impact of IPO proceeds received by Atento S.A., partially offset byprepayment to Telefónica of the entire amount outstanding under the Vendor Loan Note, and the net amortizationof debentures and amounts drawdown under the BNDES facility.
Year Ended December 31, 2013 Compared to Year Ended December 31, 2012
Net cash provided by financing activities was $31.2 million for the year ended December 31, 2013compared to $1,034.6 million for the year ended December 31, 2012. The decrease in net cash provided byfinancing activities was primarily attributable to the impact of new debt facilities entered into in 2012 in relationto the Acquisition equaling $1,107.0 million.
Free Cash Flow
Our management uses free cash flow to assess our liquidity and the cash flow generation of our operatingsubsidiaries. We define free cash flow as net cash flows from operating activities less capital expenditures(addition to property, plant and equipment, and intangible assets) for the period. We believe that free cash flow isuseful to investors because it adjusts our operating cash flow by the capital that is invested to continue andimprove business operations.
Free cash flow has limitations as an analytical tool. Free cash flow is not a measure defined by IFRS andshould not be considered in isolation from, or as an alternative to, cash flow from operating activities or othermeasures as determined in accordance with IFRS. Additionally, free cash flow does not represent the residualcash flow available for discretionary expenditures as it does not incorporate certain cash payments, includingpayments made on finance lease obligations or cash payments for business acquisitions. Free cash flow is notnecessarily comparable to similarly titled measures used by other companies.
PredecessorNon-IFRS
Aggregated
($ in millions)
As of and forthe period fromJan 1 – Nov 30,
As of and forthe period fromDec 1 – Dec 31,
For the yearended
December 31,For the year ended
December 31,2012 2012 2012 2013 2014
(unaudited)
Net cash flow from operating activities 163.6 (68.3) 95.3 99.6 135.3Capital expenditures(1) (76.9) (28.4) (105.3) (103.0) (120.1)
Free cash flow (non-GAAP) (unaudited) 86.7 (96.7) (10.0) (3.4) 15.2
(1) We define capital expenditures as the sum of additions to property, plant and equipment and the additions tointangible assets during the period presented.
63

Year Ended December 31, 2014 Compared to Year Ended December 31, 2013
Free cash flow improved by $18.6 million from negative $3.4 million for the year ended December 31, 2013to positive $15.2 million for the year ended December 31, 2014. The improvement in free cash flow for the yearended December 31, 2014 was principally due to the increase in net cash flow from operating activities.
Free cash flow for the year ended December 31, 2014 was negatively impacted by cash outflows of$39.4 million related to financing fees and IPO costs, $15.7 million related to restructuring costs, which includeSpanish headcount reduction plan cash outlay, $7.8 million related to Acquisition and integration related costs,$7.0 million related to Sponsor management fee, $1.2 million related to site relocation costs, and $1.5 millionrelated to other costs.
Free cash flow for the year ended December 31, 2013 was (i) negatively impacted by cash outflows of$28.2 million related to Acquisition and integration related costs, $0.7 million related to restructuring costs,$8.9 million related to Sponsor management fee, and $3.9 million related to financing fees, and (ii) positivelyimpacted by $1.1 million related to other costs.
Year Ended December 31, 2013 Compared to Year Ended December 31, 2012
Free cash flow improved by $6.6 million from a loss of $10.0 million for the year ended December 31, 2012to a loss of $3.4 million for the year ended December 31, 2013. The improvement in free cash flow in 2013 wasprincipally due to the increase in net cash flow from operating activities. Free cash flow for the year endedDecember 31, 2013, was negatively impacted by cash outflows of $28.2 million related to Acquisition andintegration related costs, $0.7 million related to restructuring costs, $8.9 million related to sponsor managementfees and $3.9 million related to financing fees. Free cash flow for the year ended December 31, 2012, wasnegatively impacted by cash outflows of $59.7 million related to Acquisition and integration related costs and$2.2 million related to restructuring costs.
Financing Arrangements
Description Currency Maturity Interest rate
As ofDecember 31, 2014
($ in millions)
Senior Secured Notes(1) . . . . . . . . . . . . . . . . . . . . . . USD 2020 7.375% 300.3Brazilian Debentures(2) . . . . . . . . . . . . . . . . . . . . . . BRL 2019 CDI+3.7% 245.9BNDES . . . . . . . . . . . . . . . . . . . . . . . . . . . . . . . . . . BRL 2020 7.72%* 61.3Other bank borrowings . . . . . . . . . . . . . . . . . . . . . . MAD 2016 6% 0.4CVIs(3) . . . . . . . . . . . . . . . . . . . . . . . . . . . . . . . . . . . ARS 2022 N/A 36.4Finance lease payables . . . . . . . . . . . . . . . . . . . . . . BRL, COP, USD 2019 6.32%-9.89% 9.0
Total Debt . . . . . . . . . . . . . . . . . . . . . . . . . . . . . . . 653.3
* Average cost of debt across tranches.(1) Represents the principal amount of $300 million minus $9.1 million of capitalized transaction costs plus
$9.4 million of accrued interest. It does not include the fair value of derivative financial liabilities related tothe Senior Secured Notes, which was $1.2 million as of December 31, 2014.
(2) Represents the principal amount of BRL915 million minus net capitalized transaction costs ofBRL9.3 million, minus early prepayments of BRL 257.4 million, plus accrued interest of BRL5.0 million,which results in an outstanding amount of BRL653.2 million as of December 31, 2014, at an exchange rateof BRL2.6562 to $1.00.
(3) Represents the fair value registered amount of ARS666.8 million CVIs at the exchange rate ofARS8.5510 to $1.00.
7.375% Senior Secured Notes Due 2020 (the “Senior Secured Notes”)
On January 29, 2013, a subsidiary of the company, Atento Luxco, issued $300.0 million aggregate principalamount of Senior Secured Notes that mature on January 29, 2020. The Senior Secured Notes are senior securedobligations of Atento Luxco and are guaranteed on a senior secured first-priority basis by Atento Luxco andcertain of its subsidiaries. The Senior Secured Notes are also guaranteed on an unsecured senior basis by AtentoS.A. and Midco.
64
The indenture governing the Senior Secured Notes contains covenants that, among other things, restrict theability of Atento Luxco and certain of its subsidiaries to: incur or guarantee additional indebtedness; paydividends or make other distributions or redeem or repurchase capital stock; issue, redeem or repurchase certaindebt; issue certain preferred stock or similar equity securities; make loans and investments; sell assets; incurliens; enter into transactions with affiliates; enter into agreements restricting certain subsidiaries’ ability to paydividends; and consolidate, merge or sell all or substantially all of our assets. These covenants are subject to anumber of important exceptions and qualifications. In addition, in certain circumstances, if Atento Luxco sellsassets or experiences certain changes of control, it must offer to purchase the Senior Secured Notes. As ofDecember 31, 2014, we were in compliance with these covenants. There are no other financial maintenancecovenants under the indenture governing the Senior Secured Notes.
Revolving Credit Facility
On January 28, 2013, Atento Luxco entered into a Super Senior Revolving Credit Facility (the “RevolvingCredit Facility”), which provides for borrowings of up to €50 million ($61 million as of December 31, 2014).The Revolving Credit Facility allows for borrowings in Euros, Mexican Pesos and U.S. dollars and includesborrowing capacity for letters of credit and ancillary facilities (including an overdraft, guarantee, bonding,documentary or stand-by letter of credit facility, a short term loan facility, a derivatives facility, and a foreignexchange facility). As at December 31, 2014, the Revolving Credit Facility remains undrawn.
The rate of interest under the Revolving Credit Facility is the percentage rate per annum which is theaggregate of (i) the applicable margin, (ii) EURIBOR or, in relation to any loan in a currency other than Euro,LIBOR or the applicable floating rate for Mexican Pesos and (iii) the mandatory cost (if any). The applicablemargin is initially 4.50% per annum and is subject to a step-down based on a secured leverage ratio. In additionto paying interest on the outstanding principal amounts under the Revolving Credit Facility, we are required topay a commitment fee of 40% of the applicable margin per annum in respect of the lenders unutilizedcommitments. The Revolving Credit Facility matures in July 2019.
The Revolving Credit Facility contains covenants similar to the Senior Secured Notes, which restrict(subject to the same exceptions as those in respect of the covenants relating to the Senior Secured Notes) our andour restricted subsidiaries’ ability to: incur or guarantee additional indebtedness; pay dividends or make otherdistributions or redeem or repurchase capital stock; issue, redeem or repurchase certain debt; issue certainpreferred stock or similar equity securities; make loans and investments; sell assets; incur liens; enter intotransactions with affiliates; enter into agreements restricting certain subsidiaries’ ability to pay dividends; andconsolidate, merge or sell all or substantially all of our assets. As of December 31, 2014, we were in compliancewith these covenants.
There are no other financial maintenance covenants under the Revolving Credit Facility.
Brazilian Debentures
On November 22, 2012, BC Brazilco Participações, S.A. (now merged into Atento Brasil S.A.) (the“Brazilian Issuer”) entered into an indenture for the issuance of BRL915 million (equivalent to approximately$365 million) of Brazilian Debentures due December 12, 2019. The Brazilian Debentures bear interest at a rateper annum equal to the average daily rate of the One Day “over extra-group”—DI—Interfinancial Deposits (assuch rate is disclosed by CETIP S.A. —Mercados Organizados (“CETIP”) in the daily release available on itsweb page (http://cetip.com.br)), plus a spread of 3.70%.
On March 25, 2013 and June 11, 2013, Atento Brasil, S.A. repaid, in advance of the schedule date,BRL72 million and BRL 26 million, respectively (equivalent to approximately $35.5 million and $12.3 million,respectively).
On May 12, 2014 and June 26, 2014, Atento Brasil, S.A. repaid, in advance of the schedule date,BRL34.4 million and BRL45.0 million, respectively (equivalent to $15.5 million and $20.4 million,respectively), of the Brazilian Debentures.
On August 28, 2014 Atento Brasil S.A, repaid, in advance of the schedule date, BRL80.0 million(equivalent to $33.1 million).
The outstanding balance at amortized cost after the early repayments as of December 31, 2014 wasBRL653.2 million ($245.9 million), including accrued interest.
65
As of December 31, 2014, the Brazilian Debentures, after 2014 early payments, contain the followingamortization schedule over the BRL915 million of Brazilian Debentures due December 12, 2019: December 11,2016—4.9%; December 11, 2017—18.0%; December 11, 2018—21.0%; and December 11, 2019—28.0%.
Under the terms of the Brazilian Debentures, we and our subsidiaries are required to be in compliance on aconsolidated basis with a net leverage covenant which is tested on a quarterly basis subject to certain cure rights.
The Brazilian Issuer must comply with the quarterly net financial debt/EBITDA ratio set out in the contractterms. The contract also sets out additional restrictions, including limitations on dividends, payments anddistributions to shareholders and capacity to incur additional debt. We were in compliance with all covenantsunder the Brazilian Debentures as of December 31, 2014.
Vendor Loan Note
On December 12, 2012, Midco issued the Vendor Loan Note for an aggregate principal amount of€110.0 million (equivalent of approximately $143 million) to an affiliate of Telefónica. The Vendor Loan Notehad a scheduled maturity of December 12, 2022. Interest on the Vendor Loan Note accrued at a fixed rate of5.00% per annum, and was payable annually in arrears. Interest on the Vendor Loan Note was payable in cash, if(i) no default (or similar event) is continuing or would arise under any financing documents of the Company, asdefined in the agreement governing the Vendor Loan Note, as a result of such interest payment or anydistribution or payment by a subsidiary to Midco to enable Midco to make the interest payment and (ii) theCompany is able to lawfully upstream funds to Midco. Any interest that was not payable in cash was capitalizedand added to the principal amount outstanding under the Vendor Loan Note. Interest was payable in cash only tothe extent that the borrower has received upstream payments from its subsidiaries in excess of the lesser of(A) the expenses incurred during such interest period in connection with the operation of the Company plusmanagement and advisory fees paid to Bain Capital Partners, LLC or (B) €35.0 million (increased by 3% foreach subsequent interest period on a compounding basis). Additionally, following the sale of at least 66.66% ofthe business and assets of the Company, Midco shall be required to use the proceeds of such sale to repay theVendor Loan Note, subject to items (i) and (ii) above. The Vendor Loan Note did not contain any other financialmaintenance covenants.
On May 16, 2014, Midco entered into an amendment letter and certain other related documentation with theVLN Lender which provided for certain amendments to be made to the Vendor Loan Note including, amongstothers, changes reducing the principal amount of the Vendor Loan Note by €25.4 million (equivalent to$30.9 million for the period ended December 31, 2014). In addition, a portion of the total principal amountoutstanding under the Vendor Loan Note was also reduced during the period ended December 31, 2014 with theproceeds of the issuance of the PIK Notes due 2020.
In addition, in May 30, 2014 Atalaya Luxco Midco issued €64 million of PECs (equivalent to $87 million)which proceeds were applied to make a partial prepayment of the Vendor Loan Note.
On October 7, 2014, Midco prepaid to Telefónica the entire amount outstanding under the Vendor LoanNote for a total amount of €23.3 million (approximately $29.5 million). As of December 31, 2014, there is nofurther outstanding balance.
Contingent Value Instruments
In relation to the Acquisition, two of our indirect subsidiaries, Atalaya Luxco 2, S.à.r.l., (formerlyBC Luxco 2, S.à.r.l.) and Atalaya Luxco 3, S.à.r.l., (formerly BC Luxco 3, S.à.r.l.), which own the AtentoGroup’s Argentinian subsidiaries, issued the Contingent Value Instruments to Atento Inversiones y Teleservicios,S.A. and Venturini S.A., which are Telefónica subsidiaries. The CVIs together have an aggregate par value ofARS666.8 million (equivalent to approximately $102.3 million). The CVIs are the senior obligations of AtalayaLuxco 2, S.à.r.l. and Atalaya Luxco 3, S.à.r.l. only (and not any other members of the Company group) and aresubject to mandatory (partial) repayment in the following scenarios: if in any financial year an Argentiniansubsidiary has excess cash, being an amount equal to 90% of its cash in such financial year that is available to belawfully distributed by such Argentinian subsidiary and can be settled without restriction, less: (1) the greater of:(A) a specified cash amount in respect of such Argentinian subsidiary as set out in each CVI; and (B) the amountthat such Argentinian subsidiary needs in order to meet its financial obligations; and (2) an amount equal to(i) expenses incurred in distributing such excess cash (e.g. taxes and reasonable third party costs); (ii) a sale of allor substantially all of the shares or the assets of the Argentinian subsidiaries to a non-affiliated party; (iii) a sale,
66
directly or indirectly, of all or substantially all of the shares or the assets of Atento Luxco by Bain Capital to anon-affiliated party; and (iv) a distribution, payment or repayment made by any Argentinian subsidiary toAtalaya Luxco 2, S.à.r.l. or Atalaya Luxco 3, S.à.r.l., in respect of the securities of such Argentinian subsidiary.The CVI does not contain any other financial maintenance convents. As of December 31, 2014, we were incompliance with the terms of the CVI.
The CVIs do not accrue interest and are recognized at fair value. As of December 31, 2014, the fair value ofthe CVIs was $36.4 million. See Note 3s “Fair value of derivatives and contingent-value instruments” to theSuccessor financial statements for additional information. Under the terms of each CVI, Atalaya Luxco 2, S.à.r.l.and Atalaya Luxco 3, S.à.r.l. have the right to off-set certain amounts specified in the SPA (in the circumstancesspecified in the SPA) against the outstanding balance under such CVI.
The obligations of Atalaya Luxco 2, S.à.r.l. and Atalaya Luxco 3, S.à.r.l. under each CVI will beextinguished on the earlier of: (i) the date on which the outstanding balance under such CVI is reduced to zero (inrespect of repayment of outstanding debt or reduction of the outstanding balance pursuant to the terms andconditions of the CVIs); and (ii) December 12, 2022. During the term of the CVIs, the CVI holders havepreferential purchase rights in the event the Argentinian subsidiaries are sold.
The obligations under the CVIs are not guaranteed by any subsidiary other than Atalaya Luxco 2, AtalayaLuxco 3 and its Argentinian subsidiaries.
Preferred Equity Certificates
On December 3, 2012, in connection with the Acquisition, Midco authorized the issuance of three series ofPreferred Equity Certificates (the “Original Luxco PECs”), which were subscribed by Topco, totaling$494.2 million as at capitalization date on October 3 ($519.6 million as of December 31, 2013). As part of theinsertion of PikCo into our corporate structure (see section “Presentation of financial and other information”), onMay 30, 2014, Midco authorized the issuance of, and PikCo subscribed for, a fourth series of Preferred EquityCertificates (together with the Original Luxco PECs, the “Luxco PECs”) which were subscribed by PikCo,totaling $81.7 million as at capitalization date on October 3. The terms of the Luxco PECs are as follows:
• Series 1: Midco authorized the issuance of 50,000,000,000 Series 1 PECs with a par value of€0.01 each. These Luxco PECs mature after 30 years, but may be withdrawn prior to this date in certainscenarios, and accrue interest at an annual rate of 8.0309%, which capitalizes annually if not paid incash. As of December 31, 2013 and 2012, Midco has issued 23,580,000,000 Series 1 PECs for anaggregate amount of $325.2 million and $311.1 million, respectively. The resulting interest wascapitalized on December 3, 2013 totaling approximately $26.1 million. The interest accrued atDecember 31, 2013 totaled approximately $2.2 million. The aggregate amount of Series 1 PECs as atcapitalization date of October 3, 2014, was $319.2 million. The interest accrued as at capitalization datetotaled approximately $21.6 million.
• Series 2: Midco authorized the issuance of up to 200,000 Series 2 PECs with a par value of €0.01 each.These Luxco PECs mature after 30 years, but may be withdrawn prior to this in certain scenarios. Theyield is equal to the profit recognized for Luxembourg generally accepted accounting practice inconnection with the “Specified Assets” (meaning the investment of the Company in theLuxco 1 Series 2 PECs, as defined), less any loss recognized in connection with the Specified Assetsless a proportional amount of any direct expense borne by the Company during the Accrual Period inrelation to the Specified Assets and less the losses of the Company in relation to the Specified Assetsduring the Accrual Period, including any such losses carried forward from previous Accrual Periods,such amount then divided by the number of Series 2 PECs outstanding at that time. As at capitalizationdate of October 3, 2014, and December 31, 2013, Midco had issued 200,000 Series 2 PECs for anaggregate amount of $3.0 thousand. The interest accrued at capitalization date totaled approximately$3.0 million.
• Series 3: Midco authorized the issuance of up to 25,000,000,000 Series 3 PECs with a par value of€0.01 each. These Luxco PECs mature after 60 years, but may be withdrawn prior to this in certainscenarios. The yield is equal to the “Specified Income” (meaning the sum of all income and capitalgains derived by the Company from the Eligible Assets (investment by the Company in the shares ofAtento Luxco) less losses of the Company carried forward less all other expenses of the Companyconnected to the investment in the Eligible Assets (as defined in the terms and conditions of the Series3 PECs) for each accounting period comprised in such “Accrual Period” (as defined in the terms and
67
conditions of the Series 3 PECs) divided by 365 (or if a leap year, 366) and, respectively in the case ofeach such number so ascertained, multiplied by the number of days of each such accounting period thatcomprised that Accrual Period, then divided by the number of Series 3 PECs outstanding at that time.As at capitalization date of October 3, 2014 Midco had issued 12,017,800,000 Series 3 PECs for anaggregate amount of $150.4 million ($165.7 million as of December 31, 2013).
• Series 4: Midco authorized the issuance of up to 50,000,000,000 Series 4 PECs with a par value of€0.01 each. These Luxco PECs mature after 30 years, but may be withdrawn prior to this date in certainscenarios, and accrue interest at an annual rate of 5%, which capitalizes annually if not paid in cash. Atcapitalization date of October 3, 2014, the Company had issued 6,414,652,564 Series 4 PECs for anaggregate amount of €64.2 million, equivalent of $80.3 million. The interest accrued at capitalizationdate totaled approximately $1.4 million.
In October 2014, in connection with the completion of Atento S.A.’s initial public offering (the “IPO”),Topco transferred its entire interest in the Company (being €31,000 of share capital) to PikCo, the considerationfor which was an allocation to PikCo’s Reserve Account equal to €31,000. PikCo then contributed (the“Contribution”) all of the Luxco PECs to Midco, the consideration for which was an allocation to Midco’sReserve Account equal to the value of the Luxco PECs immediately prior to the Contribution. The Luxco PECsamounted to €460.1 million or equivalent to $575.9 million as at capitalization date on October 3. Uponcompletion of the Contribution, the Luxco PECs were cancelled by Midco. PikCo then transferred the remainderof its interest in Midco (being €12,500 of share capital) to Atento S.A., in consideration for which Atento S.A.issued two new shares of its capital stock to PikCo. The difference between the nominal value of these shares andthe value of Midco’s net equity was allocated to Atento S.A.’s share premium account. As a result of suchtransfer, Midco became a direct subsidiary of Atento S.A. It was also completed a share split whereby theCompany issued approximately 2,219.212 for each 1 ordinary share outstanding as of September 3, 2014. Theforegoing is collectively referred as the “Reorganization Transaction.”
The Luxco PECs were classified as subordinated debt with respect to our other present and futureobligations. The table below provides a summary of Luxco PECs principal balance and their movements in 2013:
($ in millions)PECs Maturity
December 31,2012
Interestcapitalized
Translationdifferences
Interestaccrued
December 31,2013
Series 1 PECs . . . . . . . . . . . . . . . . . . . . . . 2042 311.1 26.1 14.5 2.2 353.9Series 2 PECs . . . . . . . . . . . . . . . . . . . . . . 2042 — — — — —Series 3 PECs . . . . . . . . . . . . . . . . . . . . . . 2072 158.6 — 7.2 — 165.7
Total . . . . . . . . . . . . . . . . . . . . . . . . . . . . . 469.7 26.1 21.6 2.2 519.6
The table below provides a summary of Luxco PECs principal balance and their movements during 2014:
($ in millions)PECs Maturity
December 31,2013 Issuance
Interestcapitalized
Translationdifferences Capitalization
December 31,2014
Series 1 PECs . . . . . . . . . . 2042 353.9 — 20.7 (33.9) (340.7) —Series 2 PECs . . . . . . . . . . 2042 0.0 — 3.2 (0.2) (3.0) —Series 3 PECs . . . . . . . . . . 2072 165.7 — — (15.3) (150.4) —Series 4 PECs . . . . . . . . . . 2044 — 87.3 1.5 (7.1) (81.7) —
Total . . . . . . . . . . . . . . . . 519.6 87.3 25.4 (56.5) (575.9) —
Brazil BNDES Credit Facility
On February 3, 2014, Atento Brasil S.A. entered into a credit agreement with Banco Nacional deDesenvolvimento Econômico e Social—BNDES (“BNDES”) in an aggregate principal amount ofBRL300 million (the “BNDES Credit Facility”), equivalent to $124 million. Once the debtor met certainrequirements in the signed contract, the loan automatically became available for the debtor. On March 27, 2014,BNDES disbursed BRL56.6 million (equivalent to $21.3 million as of December 31, 2014) of the total facility.On April 16, 2014, BNDES disbursed BRL23.7 million (equivalent to $8.9 million as of December 31, 2014) ofthe total facility. On July 16, 2014, BNDES disbursed BRL0.6 million (equivalent to $0.2 million as ofDecember 31, 2014) of the facility. On August 13, 2014, BNDES disbursed BRL80.6 million (equivalent to$30.3 million as of December 31, 2014) of the facility. As of December 31, 2014, accrued interests amounted toBRL1.6 million (equivalent to $0.6 million).
68
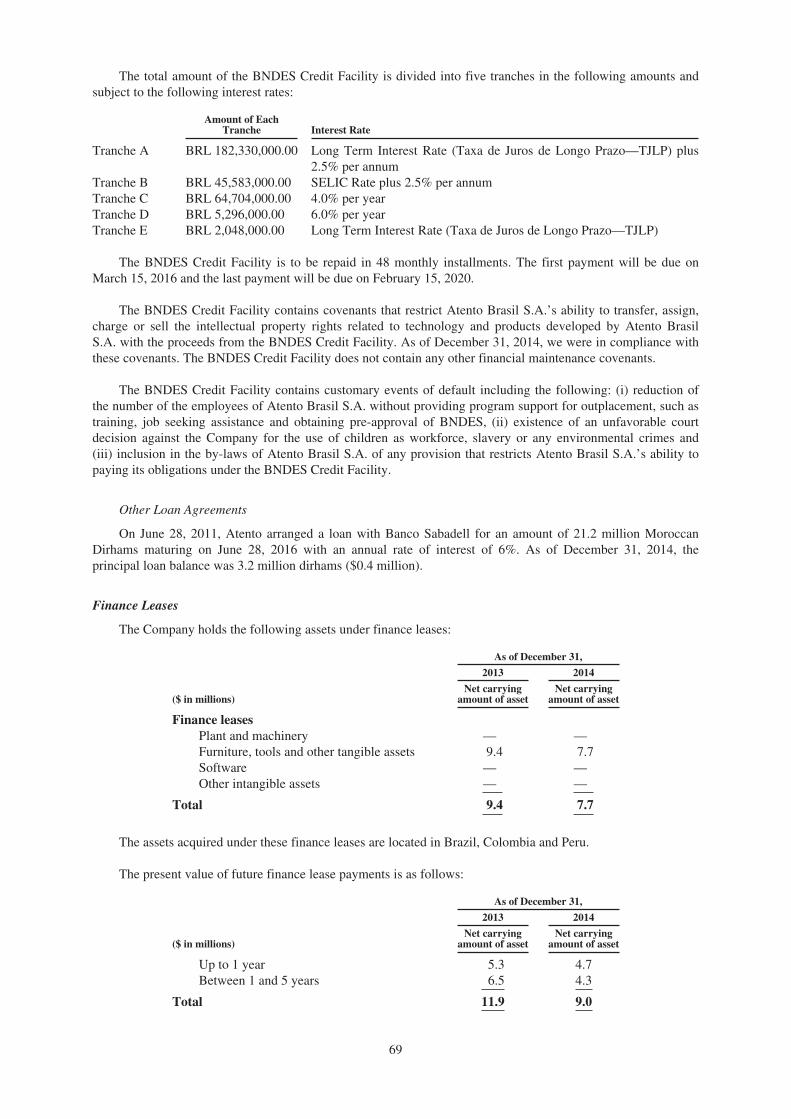
The total amount of the BNDES Credit Facility is divided into five tranches in the following amounts andsubject to the following interest rates:
Amount of EachTranche Interest Rate
Tranche A BRL 182,330,000.00 Long Term Interest Rate (Taxa de Juros de Longo Prazo—TJLP) plus2.5% per annum
Tranche B BRL 45,583,000.00 SELIC Rate plus 2.5% per annumTranche C BRL 64,704,000.00 4.0% per yearTranche D BRL 5,296,000.00 6.0% per yearTranche E BRL 2,048,000.00 Long Term Interest Rate (Taxa de Juros de Longo Prazo—TJLP)
The BNDES Credit Facility is to be repaid in 48 monthly installments. The first payment will be due onMarch 15, 2016 and the last payment will be due on February 15, 2020.
The BNDES Credit Facility contains covenants that restrict Atento Brasil S.A.’s ability to transfer, assign,charge or sell the intellectual property rights related to technology and products developed by Atento BrasilS.A. with the proceeds from the BNDES Credit Facility. As of December 31, 2014, we were in compliance withthese covenants. The BNDES Credit Facility does not contain any other financial maintenance covenants.
The BNDES Credit Facility contains customary events of default including the following: (i) reduction ofthe number of the employees of Atento Brasil S.A. without providing program support for outplacement, such astraining, job seeking assistance and obtaining pre-approval of BNDES, (ii) existence of an unfavorable courtdecision against the Company for the use of children as workforce, slavery or any environmental crimes and(iii) inclusion in the by-laws of Atento Brasil S.A. of any provision that restricts Atento Brasil S.A.’s ability topaying its obligations under the BNDES Credit Facility.
Other Loan Agreements
On June 28, 2011, Atento arranged a loan with Banco Sabadell for an amount of 21.2 million MoroccanDirhams maturing on June 28, 2016 with an annual rate of interest of 6%. As of December 31, 2014, theprincipal loan balance was 3.2 million dirhams ($0.4 million).
Finance Leases
The Company holds the following assets under finance leases:
As of December 31,
2013 2014
($ in millions)Net carrying
amount of assetNet carrying
amount of asset
Finance leasesPlant and machinery — —Furniture, tools and other tangible assets 9.4 7.7Software — —Other intangible assets — —
Total 9.4 7.7
The assets acquired under these finance leases are located in Brazil, Colombia and Peru.
The present value of future finance lease payments is as follows:
As of December 31,
2013 2014
($ in millions)Net carrying
amount of assetNet carrying
amount of asset
Up to 1 year 5.3 4.7Between 1 and 5 years 6.5 4.3
Total 11.9 9.0
69
For a description of our derivative financial instruments as of December 31, 2013 and 2014, see Note 14 tothe Consolidated Financial Statements. See also “—Quantitative and Qualitative Disclosures About MarketRisks—Interest Rate Risk” and “—Quantitative and Qualitative Disclosures About Market Risks—ForeignCurrency Risk” for additional information on fair market value of certain of our derivative financial instruments.
Regarding Comment on material commitments for capital expenditures see the Note “Subsequent Events” tothe Consolidated Financial Statements.
As of December 31, 2014 we were in compliance with the terms of all our covenants.
C. Research and Development, Patents and Licenses, etc.
We believe the “Atento” trademark is a recognized and trusted brand in the CRM BPO services industry ineach of the markets where we operate. We believe we have a strong corporate brand that gives credibility to ourproducts and may offer and facilitate our entrance and growth into future market. This also allows us to attractand retain the best talent, to generate a sense of pride in our staff and to develop a relationship of commitment,confidence and trust with our clients. In December 2012 Atento Spain Holdco S.L.U. purchased all trademarksand domain names relevant for its business. Under the Berne Convention for the Protection of Literary andArtistic Works, the trademarks and copyrights noted are recognized in all countries that are signatories to theconvention and no other registration or license is required for its use. As of December 2014, all the countries inwhich we operate have signed the Berne Convention. We do not have any other material intellectual propertysuch as patents or licenses.
D. Trend Information
We believe that the following significant market trends are the most important trends affecting our results ofoperations, and we believe these will continue to have a material impact on our results of operations in the future.
Continuing Trend for Further Outsourcing for CRM Services
In recent years, companies have increasingly sought to outsource certain non-core business activities, suchas customer care services and sales functions, especially in the regions in which we have significant businessoperations, including Latin America. This trend towards outsourcing non-core business activities has, in ourview, principally been driven by rising costs, competitive pressures and increased operational complexity,resulting in the need to outsource these non-core business activities to enable companies to focus on their corecompetencies. The penetration within individual clients in the market for CRM BPO services has increasedsignificantly in recent years. We believe there are two main drivers of this increase in penetration: first, existingusers of CRM BPO are outsourcing more of their CRM operations to specialist third party BPO providers;secondly, new clients are adopting third party solutions for these services as opposed to using in-house solutions,to take advantage of the labor arbitrage, specialist knowledge and cost efficiencies.
Growth in Our Business Directly Linked to Growth in the Businesses of Key Clients
We structure our contracts with our clients such that, while the price of our services is agreed, the volume ofCRM BPO services we deliver during a particular period depends upon the performance of our clients’ business.As our current business is significantly exposed to the telecommunications and financial services sectors, ourbusiness is particularly dependent upon the continued growth of our clients’ business in those sectors. As a result,if the business of one of our key clients increases, resulting in the generation of more customer activity, ourbusiness also increases as that customer activity is outsourced to us. On the other hand, if the business of one ofour key clients decreases resulting in a reduction of customer activity, our business also decreases, as lesscustomer activity will be outsourced to us.
Development of CRM BPO Solutions
The industry is experiencing a transition towards outsourcing more complex multi-channel solutions, thuscreating an opportunity for CRM BPO providers, including us, to up-sell and cross-sell our services. Our verticalindustry expertise in telecommunications, financial services and multi-sector, allows us to develop tailoredsolutions for our clients, further embedding us into their value chain while delivering impactful business resultsand increasing the portion of our client’s CRM BPO services we provide. We have proactively diversified andexpanded our solutions offering, increasing their sophistication and developing customized solutions such as our
70
smart collections, B2B Efficient sales, Insurance Management, Credit Management and other BPO processes.We expect the share of revenue from CRM BPO solutions to increase going forward.
New Pricing Models for Our CRM BPO Services
We operate in a competitive industry which from time to time exhibits pressure on pricing for CRM BPOservices. We believe that we have a strong track record in successful pricing negotiations with our clients byoffering flexible pricing models with fixed pricing, variable pricing, and outcome-based pricing if certainperformance indicators are achieved, depending on the type of CRM BPO services our clients purchase from usand their business objectives. We also believe that new contracts will increasingly be based on more outcomebased pricing and hybrid pricing models as means of making services more transparent and further drivingdemand for CRM BPO services. In addition, our service contracts with most of our key clients include inflationbased adjustments to offset adverse inflationary effects which (depending on the movements in the applicableconsumer price indices (“CPIs”) of the countries in which our clients operate) will have the effect of increasing,if the CPI of an applicable jurisdiction increases, or decreasing, if the CPI decreases, the employee benefitsexpenses which we can pass onto our clients. We believe that our flexible pricing models allow us to maximizeour revenue in a price competitive environment while maintaining the high quality of our CRM BPO services.
Potential Customers May be Reluctant to Change Their CRM BPO Service Provider
As companies begin to use the services of CRM BPO services providers more extensively as theirbusinesses grow, they become more reliant on the CRM BPO services provider because the companies oftenexpand the range and scope of the CRM BPO services which they use. For example, for the year endedDecember 31, 2014, 69% of our revenue from client groups other than the Telefónica Group came from clientsthat had relationships with us for ten or more years. Furthermore, for the years ended December 31, 2012, 2013and 2014, our retention rates (calculated based on prior year revenue of clients retained in current year, as apercentage of total prior year revenues) were 98.5%, 99.3% and 98.9%, respectively. We believe it is difficult forclients to switch a large number of workstations to competitors principally because of the following factors:(i) the extensive training required for the service provider’s employees; (ii) the level of process integration withthe provider which can be time consuming and costly; and (iii) the potential disruption caused to the client’susers by introducing a new end-service provider. As a result, absent a compelling reason to change CRM BPOservice provider, such as significant differences in quality or price, companies generally tend to stay with theirCRM BPO services provider, making it difficult for another CRM BPO services provider to acquire the client’swork.
E. Off-Balance Sheet Arrangements
We do not have any off-balance sheet arrangements other than operating leases and guarantees.
The following table shows the increase in the number of the customer performance guarantees we haveprovided to third parties for the indicated periods, in connection with agreements under which we provide ourservices and as part of our ordinary course of business. The change in guarantees breakdown for December 2014was principally due to guarantees granted in connection with BNDES financing, and the cancelation of a specificguarantee in Colombia in process of being renewed after client awarding. Of these guarantees, as of December2014 the majority relate to commercial purposes, financial and rental activities, the bulk of the remainingguarantees relates to tax and labor-related procedures.
The Company’s directors consider that no contingencies will arise from these guarantees in addition to thosealready recognized.
There has not been any material instance of a guarantee, outside of the ordinary course of the business,being drawn upon for the periods indicated, nor does management anticipate any liability as a result of a drawupon a guarantee in the future.
As of December 31,
($ in millions) 2012 2013 2014
GuaranteesFinancial, labor-related, tax and rental transactions 94.8 97.4 158.5Contractual obligations 55.9 135.8 76.5Other 0.1 0.2 0.0
Total 150.8 233.4 235.0
71
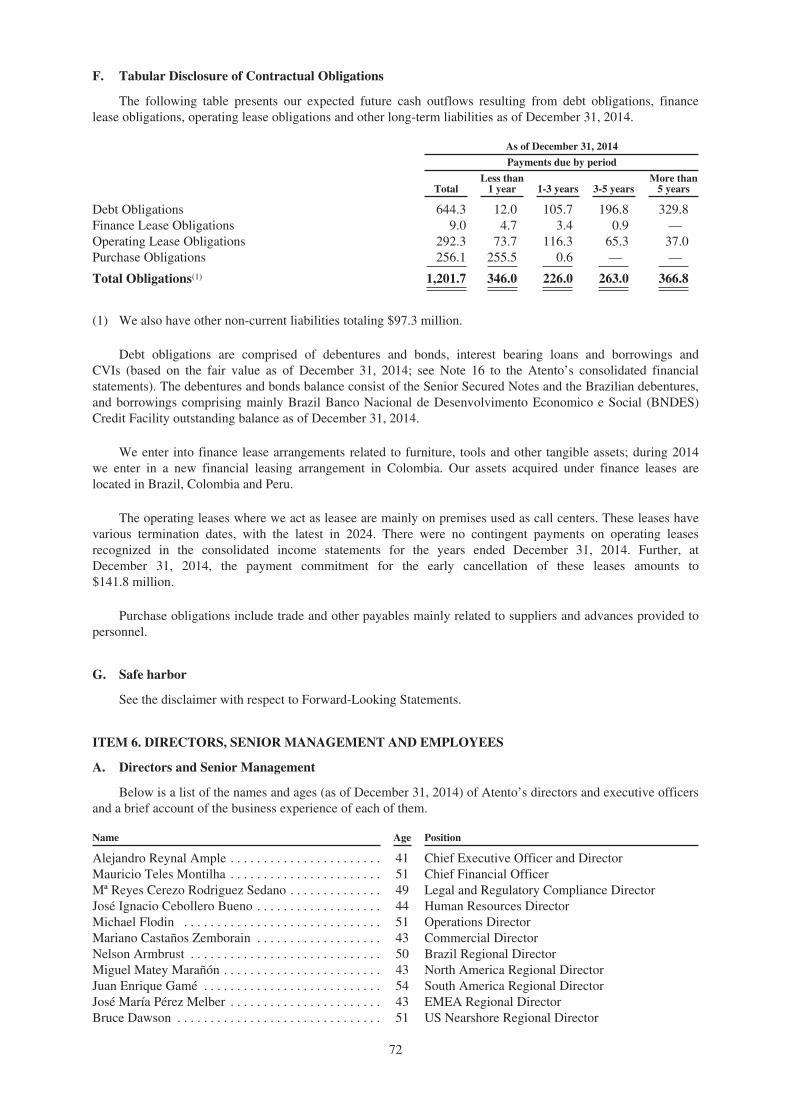
F. Tabular Disclosure of Contractual Obligations
The following table presents our expected future cash outflows resulting from debt obligations, financelease obligations, operating lease obligations and other long-term liabilities as of December 31, 2014.
As of December 31, 2014
Payments due by period
TotalLess than
1 year 1-3 years 3-5 yearsMore than
5 years
Debt Obligations 644.3 12.0 105.7 196.8 329.8Finance Lease Obligations 9.0 4.7 3.4 0.9 —Operating Lease Obligations 292.3 73.7 116.3 65.3 37.0Purchase Obligations 256.1 255.5 0.6 — —
Total Obligations(1) 1,201.7 346.0 226.0 263.0 366.8
(1) We also have other non-current liabilities totaling $97.3 million.
Debt obligations are comprised of debentures and bonds, interest bearing loans and borrowings andCVIs (based on the fair value as of December 31, 2014; see Note 16 to the Atento’s consolidated financialstatements). The debentures and bonds balance consist of the Senior Secured Notes and the Brazilian debentures,and borrowings comprising mainly Brazil Banco Nacional de Desenvolvimento Economico e Social (BNDES)Credit Facility outstanding balance as of December 31, 2014.
We enter into finance lease arrangements related to furniture, tools and other tangible assets; during 2014we enter in a new financial leasing arrangement in Colombia. Our assets acquired under finance leases arelocated in Brazil, Colombia and Peru.
The operating leases where we act as leasee are mainly on premises used as call centers. These leases havevarious termination dates, with the latest in 2024. There were no contingent payments on operating leasesrecognized in the consolidated income statements for the years ended December 31, 2014. Further, atDecember 31, 2014, the payment commitment for the early cancellation of these leases amounts to$141.8 million.
Purchase obligations include trade and other payables mainly related to suppliers and advances provided topersonnel.
G. Safe harbor
See the disclaimer with respect to Forward-Looking Statements.
ITEM 6. DIRECTORS, SENIOR MANAGEMENT AND EMPLOYEES
A. Directors and Senior Management
Below is a list of the names and ages (as of December 31, 2014) of Atento’s directors and executive officersand a brief account of the business experience of each of them.
Name Age Position
Alejandro Reynal Ample . . . . . . . . . . . . . . . . . . . . . . . 41 Chief Executive Officer and DirectorMauricio Teles Montilha . . . . . . . . . . . . . . . . . . . . . . . 51 Chief Financial OfficerMª Reyes Cerezo Rodriguez Sedano . . . . . . . . . . . . . . 49 Legal and Regulatory Compliance DirectorJosé Ignacio Cebollero Bueno . . . . . . . . . . . . . . . . . . . 44 Human Resources DirectorMichael Flodin . . . . . . . . . . . . . . . . . . . . . . . . . . . . . . 51 Operations DirectorMariano Castaños Zemborain . . . . . . . . . . . . . . . . . . . 43 Commercial DirectorNelson Armbrust . . . . . . . . . . . . . . . . . . . . . . . . . . . . . 50 Brazil Regional DirectorMiguel Matey Marañón . . . . . . . . . . . . . . . . . . . . . . . . 43 North America Regional DirectorJuan Enrique Gamé . . . . . . . . . . . . . . . . . . . . . . . . . . . 54 South America Regional DirectorJosé María Pérez Melber . . . . . . . . . . . . . . . . . . . . . . . 43 EMEA Regional DirectorBruce Dawson . . . . . . . . . . . . . . . . . . . . . . . . . . . . . . . 51 US Nearshore Regional Director
72
Name Age Position
Francisco Tosta Valim Filho . . . . . . . . . . . . . . . . . . . . 51 DirectorMelissa Bethell . . . . . . . . . . . . . . . . . . . . . . . . . . . . . . 40 DirectorAurelien Vasseur . . . . . . . . . . . . . . . . . . . . . . . . . . . . . 38 DirectorThomas Iannotti . . . . . . . . . . . . . . . . . . . . . . . . . . . . . . 58 DirectorLuis Javier Castro . . . . . . . . . . . . . . . . . . . . . . . . . . . . 48 DirectorStuart Gent . . . . . . . . . . . . . . . . . . . . . . . . . . . . . . . . . . 43 DirectorDevin O’Reilly . . . . . . . . . . . . . . . . . . . . . . . . . . . . . . 40 Director
Our Executive Officers
Alejandro Reynal Ample, Chief Executive Officer and Director. Mr. Reynal has served as our ChiefExecutive Officer since October 2011. Mr. Reynal has served as a member of our board of directors sinceSeptember 2014. Prior to this appointment, he worked at Telefónica’s Headquarters as Corporate StrategyDirector for the Telefónica Group and from 2008 until 2011 he served as our EMEA Regional Director. Since hejoined Telefónica Group in 2000, Mr. Reynal held various executive positions within Atento. Before his time atTelefónica, he was a Director at The Coca-Cola Company and Business Development Manager for theInternational Division of The Gap, Inc. He holds an MBA from Harvard Business School and a Bachelor andMaster of Engineering degrees from the Georgia Institute of Technology. We believe Mr. Reynal is qualified toserve on our board of directors due to his extensive experience in the CRM BPO and telecommunicationsindustries, corporate strategic development, financial reporting and his knowledge gained from his service on theboards of various other companies.
Mauricio Teles Montilha, Chief Financial Officer. Mr. Montilha has served as our Chief Financial Officerand as a member of the Group’s Management Committee since September 2013. Prior to joining Atento, heserved as the Chief Financial Officer for the satellite television company, a subsidiary of DirecTV, SKY Brazilfrom April 2009. Prior to joining SKY Brazil, he served as the Chief Financial Officer of the Brazilian subsidiaryof the pharmaceutical company Astra Zeneca, a multinational company with operations in 45 countries.Mr. Montilha also served in leadership positions with various companies, including as Vice President ofFinancial Planning at Wal-Mart International and Vice President and Chief Financial Officer of Philips LatinAmerica. Furthermore, he has held important management positions at companies including Pillsbury, ElmaChips (Pepsico Brazil), Unilever Brazil and Arthur Andersen. Mr. Montilha has a degree in accounting fromFaculdade Paranaense-FACCAR and an MBA from the Armando Alvares Penteado Foundation (FAAP).
Mª Reyes Cerezo Rodriguez Sedano, Legal and Regulatory Compliance Director. Ms. Cerezo has served asour Legal and Regulatory Compliance Director since January 2008, as well as serving as the Secretary of ourBoard of Directors. From 2008 to 2011, Ms. Cerezo served as a member of our Board of Directors. From 2002 to2007, Ms. Cerezo served as our General Secretary. From 1991 to 2002, Ms. Cerezo worked at Banco SantanderCentral Hispano. From 1999 to 2002, she was Secretary of the Board of Directors of Sistemas 4B,S.A. Ms. Cerezo has a law degree from the University of Córdoba and holds a General Management degree fromIESE.
José Ignacio Cebollero Bueno, Human Resources Director. Mr. Cebollero has served as our HumanResources Director since November 2011. Prior to assuming his current post, from July 2011 to November 2011served as our Director of Organization and Development, joining Atento as People Director, initially in Spainand then going on to head the People Area for the EMEA Region. Prior to joining Atento, Mr. Cebollero’sexperience encompassed posts such as Head of Human Resources at Sedesa Construcciones and later atConstrucciones CMS, Head of Human Resources for Iberia at Ahold, and Director of Human Resources at LeroyMerlín Spain. He holds a degree in Politics and Sociology from Madrid’s Universidad Complutense, a masterdegree in HR Management from the University of California and attended the Management DevelopmentProgram at IESE.
Michael Flodin, Operations Director. Mr. Flodin has served as our Operations Director since April 2014.Mr. Flodin is a senior executive with more than 25 years of experience, having spent the 16 years prior to joiningAtento as partner at Accenture’s Customer Relationship Management Practice. He has a patent pending for aBusiness-to-Business Customer Experience Framework and Implementation Plan, has been published inCRM Magazine, and has been keynote speaker at several major CRM conferences in North America and Brazil.He holds a Bachelor of Arts degree in psychology and a philosophy from Flagler College.
73

Mariano Castaños Zemborain, Commercial Director. Mr. Castaños has served as our Commercial Directorsince December 2013. Mr. Castaños began his professional career in Argentina in legal services. Prior to joiningthe Management Committee as EMEA Regional Director in September 2012, he was Country Director forAtento Spain (including three operations in Morocco, Peru and Colombia). Mr. Castaños joined Atento Argentinain 2004, initially as Sales Manager, going on to the position of Marketing and Sales Director. In 2008 he waspromoted to Telefónica Account Director for Atento Spain. In 2000, he joined the Clarín Group as BusinessDevelopment Manager and then became Americas Strategic Alliance Manager. Mr. Castaños holds a law degreefrom Universidad Católica Argentina, a master degree in Company Law from Ucema and a PDD (ManagementDevelopment Programme) from IESE, Spain.
Nelson Armbrust, Brazil Regional Director. Mr. Armbrust has served as our Brazil Regional Director sinceMay 2010. Mr. Armbrust joined Atento in 1999. From 2000 until 2009, Mr. Armbrust served in variousexecutive posts encompassing Argentina and Uruguay, USA and Central America. In 2009, he returned to Brazilas Multisector Executive Director. Mr. Armbrust began his career in 1987 at Siemens Brazil. Mr. Armbrust holdsa degree in Electronic Engineering from the Universidad Católica de Rio de Janeiro and a master degree inbusiness administration from the University of São Paulo.
Miguel Matey Marañón, North America Regional Director. Mr. Matey has served as our North AmericaRegional Director since September 2012 and previously served as Mexico Country Director since January 2012.Prior to this, in 2011, he served as Regional Director for Morocco, France and the Czech Republic. Mr. Mateyjoined Atento Spain in 2000 and in 2003 he went on to Atento’s Mexican and Central American operations asbusiness manager. From 2004 to 2006, he headed the Business Unit in Central America and the TelefónicaBusiness Unit in Mexico. From 2007 to 2010 he served as Business Director at Atento Spain. Mr. Matey holds adegree in Business and Economics from Madrid’s Universidad Complutense and a master degree in businessadministration from the IE Business School.
Juan Enrique Gamé, South America Regional Director. Mr. Gamé has served as our South AmericaRegional Director since November 2011. He began working at Atento in 2002 as Multisector Business Director.From 2004 to 2008 Mr. Gamé was General Manager of Atento Peru and in 2010 he became Regional Manager ofAtento Chile. Mr. Gamé holds a degree in Civil Industrial Engineering from the Universidad Católica deValparaíso and an MBA and Diploma in Distribution and Logistics Management from Universidad AdolfoIbáñez.
José María Pérez Melber, EMEA Regional Director. Mr. Melber has served as our EMEA RegionalDirector since March 2014. He has worked in the industry for over ten years. Prior to joining Atento, Mr. PérezMelber served as Operations Director at Orange Spain, with direct responsibility over customer care, loyalty,retention, billing and credit management from July 2011 until February 2014. Before that, Mr. Pérez Melberworked at Transcom in 2004 as Global Manager of Tele2. In 2006, he was appointed General Director ofTranscom Iberia & Latam and to the company’s Executive Committee, a position he held until 2009 when he wasnamed General Director for Southern Europe, Latam and North Africa. Prior to his arrival at Transcom,Mr. Pérez Melber worked in marketing and customer relations within the insurance sector. Mr. Pérez Melberholds a degree in Business Administration and Insurance Sciences from Universidad Pontificia de Salamanca.
Bruce Dawson, US Nearshore Regional Director. Mr. Dawson has served as our US Nearshore RegionalDirector since April 2014. Mr. Dawson is a senior executive—Global BPO & Captive Operations professionalwith 22 years of experience leading companies with global footprints (onshore, offshore, nearshore,North America, Latin America, Europe, Asia-Pacific). Prior to joining us, Mr. Dawson served at Sitel fromOctober 2012 to March 2014 and Stream from October 2008 to August 2012. Mr. Dawson has held managementpositions at various companies in the BPO industry bringing as well experience from the software andtelecommunications sector. He holds a BA in Psychology from Denison University.
Our Directors
We believe that our board of directors is, and we intend that it continue to be, composed of individuals withsophistication and experience in many substantive areas that impact our business. We believe that all of ourcurrent board members possess the professional and personal qualifications necessary for board service, and havehighlighted the specific experience, qualifications, attributes, and skills that led to the conclusion that each boardmember should serve as a director in the individual biographies below (information with respect to Mr. Reynal,our Chief Executive Officer and a member of our board of directors, is set forth above).
74
Francisco Tosta Valim Filho, Director. Mr. Valim has served as a member of our board of directors sinceApril 2014. Mr. Valim served as Chief Executive Officer of Via Varejo from August 2013 until April 2014 andof Oi S.A. from August 2011 until January 2013. From January 2008 to July 2011, Mr. Valim was the ChiefExecutive Officer of Experian for Latin America, Europe and the Middle East. Prior to working at Experian, heserved as Chief Executive Officer of NET Serviços de Comunicação S.A. from February 2003 to January 2008,Chief Financial Officer of Oi from January 2002 to February 2003; and Vice-President and Chief FinancialOfficer of RBS Participações S.A. from September 1989 to December 2001. Mr. Valim holds an MBA from theMarshall School of Business—University of Southern California and a Bachelor of Arts degree in BusinessAdministration from Universidade Federal do Rio Grande do Sul (UFRGS) with advanced studies degrees inFinance from Fundação Getulio Vargas and Planning and Organization from UFRGS. We believe Mr. Valim’squalifications to serve on our board of directors include his extensive experience in the telecommunicationsindustry, strategic development, financial reporting and his knowledge gained from service on the boards ofvarious other companies.
Melissa Bethell, Director. Ms. Bethell has served as a member of Topco’s board of directors since theconsummation of the Acquisition in December 2012 and a member of our board of directors since March 2014.Ms. Bethell is a Managing Director of Bain Capital, which she joined in 1999 and relocated from Boston toLondon in 2000 as a member of Bain Capital’s European investment team. Prior to joining Bain Capital,Ms. Bethell worked in the Capital Markets group at Goldman, Sachs & Co., with a focus on media andtechnology fundraising. She received her master in business administration with distinction from HarvardBusiness School and a bachelor of arts degree with honors in Economics and Political Science from StanfordUniversity. We believe Ms. Bethell’s qualifications to serve on our board of directors include her extensiveexperience in the telecom, media and technology industries, strategic development, financial reporting and herknowledge gained from service on the boards of various other companies.
Aurelien Vasseur, Director. Mr. Vasseur has served as a member of our board of directors since March2014. Mr. Vasseur joined Bain Capital Luxembourg S.à.r.l. in June 2011 and is a corporate manager of the firm.Before joining Bain Capital, Mr. Vasseur was a finance auditor at Ernst & Young, Luxembourg from 2004 untilMay 2011. Mr. Vasseur received a master degree in management from the Ecole des Hautes EtudesCommerciales (EDHEC Business School). We believe Mr. Vasseur’s qualifications to serve on our board ofdirectors include his extensive experience in the business and financial services industry, knowledge of ourbusiness, financial reporting and his knowledge gained from service on the boards of various other companies.
Thomas Iannotti, Director. Mr. Iannotti has served as a member of our board of directors since November2014. Mr. Iannotti has extensive international experience, including direct leadership of HP’s services business inLatin America. Prior to his retirement in 2011, Mr. Iannotti served as Senior Vice President and GeneralManager of HP Enterprise Services which provides applications, business process and infrastructure technologyoutsourcing services, consulting and support to business and government clients around the world. During his lasttwo roles at HP, he was directly responsible for, and had significant exposure to, Latin America, focused onBrazil, Argentina, Chile, Columbia and Costa Rica. Earlier in his career, Mr. Iannotti served as the VicePresident and General Manager of Customer Service for the EMEA region at Compaq Computers. Mr. Iannottiholds a BA from Rhode Island College. He also pursued a management development program from HarvardBusiness School in 1993. We believe Mr. Ianotti´s qualifications to serve on our board of directors include hisextensive experience in the information technology industry and his deep knowledge of Latin America´senvironment.
Luis Javier Castro, Director. Mr. Castro has served as a member of our board of directors since September2014. He began his career as an associate at Bain & Company, working on strategic cases for several of thelargest companies in Central America. In 1996, he was one of the founding partners of Central America’s firstprivate equity fund, Mesoamerica Fund I, L.P. From 1998 to 2003, he was the CEO for Mesoamerica TelecomLtd., organizing and supervising this fund—the largest private equity fund at the time in Central America. In1998, along with three other partners, he founded Mesoamerica Investments where he continues to serve as aManaging Partner. Mr. Castro is a director of several companies, including Café OMA, Presto, GlobeleqMesoamerica Energy, among others. Mr. Castro is a member of the G-50, a select group of business leaders ofthe Americas, a member of the United Way Latin American Regional Committee, a member of the CentralAmerica Leadership Initiative’s board and an Aspen Institute fellow. He received an MBA from GeorgetownUniversity and a degree in science and agricultural economics from Texas A&M University. We believeMr. Castro’s qualifications to serve on our board of directors include his extensive experience in the business andfinancial services industry, strategic development, financial reporting and his knowledge gained from service onthe boards of various other companies.
75
Stuart Gent, Director. Mr. Gent has served as a member of our board of directors since September 2014.Mr. Gent joined Bain Capital in 2007 and is a Managing Director in the London office. Prior to joining BainCapital, Mr. Gent was a Managing Director of Avis UK and a member of the Avis Europe Executive Board.Previously, Mr. Gent was a Partner at Bain & Company where he worked in a variety of industries. Mr. Gentreceived a BSc from Bristol University in England. Mr. Gent is currently on the Board of Directors of WorldPay,Brakes Bros and EWOS. We believe Mr. Gent’s qualifications to serve on our board of directors include hisextensive experience in the business and financial services industry, strategic development, financial reportingand his knowledge gained from service on the boards of various other companies.
Devin O’Reilly, Director. Mr. O’Reilly has served as a member of our board of directors since September2014. Mr. O’Reilly joined Bain Capital in 2005 and is a Managing Director in the London office. Prior to joiningBain Capital, Mr. O’Reilly was a consultant at Bain & Company where he consulted for private equity andhealthcare industry clients. Previously, he spent several years in the software industry in corporate developmentand general management roles. Mr. O’Reilly received an MBA from The Wharton School at the University ofPennsylvania, and graduated with a BA from Princeton University. Mr. O’Reilly is currently on the Board ofDirectors of Bio Products Laboratory, Intermedica and Brakes Bros. We believe Mr. O’Reilly’s qualifications toserve on our board of directors include his extensive experience in the business and financial services industry,strategic development, financial reporting and his knowledge gained from service on the boards of various othercompanies.
We have no knowledge of any arrangement or understanding with major shareholders, customers, suppliersor any other person pursuant to which any person was selected as a director or executive officer.
B. Compensation
Long-Term Incentive Plan
Effective as of October 2014, Atento adopted the 2014 Omnibus Incentive Plan (the “2014 Incentive Plan”or “the Plan”). Such incentive plan provides grants of stock options, stock appreciation rights, restricted stock,other stock-based awards and other cash-based awards. Directors, officers and other employees of Atento and itssubsidiaries, are eligible for grants under the Plan.
On December 3, 2014 Atento granted the following:
• A Time Restricted Stock Unit Award (“TRSU”) and;
• A Performance Restricted Stock Unit Award (“PRSU”).
Atento’s Time Restricted Stock Unit Award (“TRSU”) is a one-time award with a two year vesting periodintended to recognize the executive’s contribution in the value creation since the separation from Telefonica.
In addition, Atento has a Performance Restricted Stock Unit Award with a three years vesting period. Thisvesting is subject to the Company’s performance based on adjusted EBITDA growth and Total ShareholderReturn. Atento’s Performance Restricted Stock Unit Award seeks to retain, attract and engage key executivesaligning them with shareholders through the provision of equity and setting of strategically aligned performancemeasures.
In 2014, Atento distributed 1,187,323 Restricted Shared Units among their Board Directors, Chief Executiveand other Executive Officers considering both awards.
Compensation of Atento’s Board Directors, Chief Executive and Other Executive Officers
Atento has established a Compensation Committee that is responsible for the administration of thecompensation policies, plans and programs in alignment with the Company’s compensation strategy.
This committee is also responsible for reviewing and approving: the compensation package for Atento’sBoard Directors, Chief Executive and Other Executive Officers; any employment agreements and other similararrangements between Atento and the executive officers; and the administration of stock option plans and otherincentive compensation plans.
76
Atento’s Compensation Committee consists of Melissa Bethell, Alejandro Reynal and Stuart Gent. Ourboard of directors adopted a written charter for the Compensation Committee, which is available on ourcorporate website at www.atento.com.
The approximate aggregated annual total cash received by all non-executive Board Director and ExecutiveOfficers for the year ended December 31, 2014 was $5.1 million.
C. Board practices
Board of Directors Composition
Our board of directors is divided into three classes of directors, with the classes as nearly equal in number aspossible. As a result, approximately one-third of our board of directors will be elected each year. Theclassification of directors will have the effect of making it more difficult for stockholders to change thecomposition of our board.
Our board of directors consists of eight members and it is composed by Thomas Iannotti and Luis Javier deCastro as class I directors; Stuart Gent, Alejandro Reynal and Aurélien Vasseur as class II directors andFrancisco Tosta Valim Filho, Devin O´Reilly and Melissa Bethell as class III directors.
Unless revoked in accordance with the Articles of Association, the term of office of the class I directorsshall expire at the first annual meeting of shareholders occurring after the date of publication of the generalmeeting of shareholders taken on September 29, 2014 (the “Filing Date”); the term of office of the class IIdirectors shall expire at the second annual meeting of shareholders occurring after the Filing Date; and the termof office of the class III directors shall expire at the third annual meeting of shareholders occurring after theFiling Date.
Controlled Company and Foreign Private Issuer
Bain Capital controls a majority of the voting power of our outstanding ordinary shares. As a result, we are a“controlled company” under the New York Stock Exchange corporate governance standards. As a controlledcompany, exemptions under the New York Stock Exchange standards free us from the obligation to comply withcertain corporate governance requirements, including the requirements:
• that a majority of our board of directors consists of “independent directors,” as defined under the rulesof the New York Stock Exchange;
• that we have a corporate governance and nominating committee that is composed entirely ofindependent directors with a written charter addressing the committee’s purpose and responsibilities;
• that we have a compensation committee that is composed entirely of independent directors with awritten charter addressing the committee’s purpose and responsibilities; and
• for an annual performance evaluation of the nominating and governance committees and compensationcommittee.
These exemptions do not modify the independence requirements for our audit committee requiring it to becomprised exclusively of independent directors, and we comply with the applicable requirements of theSarbanes-Oxley Act and rules with respect to our audit committee within the applicable time frames. These rulesrequire that our Audit Committee be composed of at least three members.
In addition to the controlled company exemptions, as a foreign private issuer, under the corporategovernance standards of the New York Stock Exchange, foreign private issuers are permitted to follow homecountry corporate governance practices instead of the corporate governance practices of the New York StockExchange. Accordingly, we follow certain corporate governance practices of our home country, Luxembourg inlieu of certain of the corporate governance requirements of the New York Stock Exchange. Specifically, we donot have a board of directors composed of a majority of independent directors or a Compensation Committee orNominating and Corporate Governance Committee composed entirely of independent directors.
As a foreign private issuer, we are exempt from the rules and regulations under the Exchange Act, related tothe furnishing and content of proxy statements, and our officers, directors and principal shareholders are exemptfrom the reporting and short swing profit recovery provisions contained in Section 16 of the Exchange Act. In
77
addition, we are not required under the Exchange Act to file annual, quarterly and current reports and financialstatements with the Securities and Exchange Commission as frequently or as promptly as domestic companieswhose securities are registered under the Exchange Act.
Board Committees
Our board of directors established an Audit Committee and a Compensation Committee. The composition,duties and responsibilities of these committees is as set forth below. In the future, our board may establish othercommittees, as it deems appropriate, to assist it with its responsibilities.
Audit Committee. The Audit Committee is responsible for, among other matters: (1) appointing,compensating, retaining, evaluating, terminating and overseeing our independent registered public accountingfirm; (2) discussing with our independent registered public accounting firm their independence frommanagement; (3) reviewing with our independent registered public accounting firm the scope and results of theiraudit; (4) approving all audit and permissible non-audit services to be performed by our independent registeredpublic accounting firm; (5) overseeing the financial reporting process and discussing with management and ourindependent registered public accounting firm the interim and annual financial statements that we file with theSEC; (6) reviewing and monitoring our accounting principles, accounting policies, financial and accountingcontrols and compliance with legal and regulatory requirements; (7) overseeing our legal compliance process;(8) establishing procedures for the confidential anonymous submission of concerns regarding questionableaccounting, internal controls or auditing matters; and (9) reviewing and approving related party transactions.
Our Audit Committee consists of Francisco Tosta Valim Filho, Devin O’Reilly, Thomas Ianotti and MelissaBethell. Our board of directors has determined that Francisco Tosta Valim Filho qualifies as an “audit committeefinancial expert,” as such term is defined in Item 407(d)(5)(ii) of Regulation S-K. Our board of directors adopteda new written charter for the Audit Committee, which is available on our corporate website at www.atento.com.
Compensation Committee. The Compensation Committee is responsible for, among other matters:(1) reviewing key associate compensation goals, policies, plans and programs; (2) reviewing and approving thecompensation of our directors, chief executive officer and other executive officers; (3) reviewing and approvingemployment agreements and other similar arrangements between us and our executive officers; and (4) theadministration of stock plans and other incentive compensation plans.
Our Compensation Committee consists of Alejandro Reynal, Melissa Bethell and Stuart Gent. Our board ofdirectors adopted a new written charter for the Compensation Committee, which is available on our corporatewebsite at www.atento.com.
Compensation Committee Interlocks and Insider Participation
No interlocking relationships exist between the members of our board of directors and the board of directorsor compensation committee of any other company.
Code of Ethic
We have adopted a Code of Ethic (the “Code”) applicable to all of our directors, officers and employees,including our principal executive officer, principal financial officer and accounting officers, and all personsperforming similar functions. A copy of the Code is available on our corporate website at www.atento.com. Wewill provide any person, without charge, upon request, a copy of our Code. Such requests should be made inwriting to the attention of our Legal and Regulatory Compliance Director at the following address: C/Santiago deCompostela, n. 94-9 Floor, 28035, Madrid, Spain.
78
D. Employees
For the year ended December 31, 2014, our average and period end numbers of employees, excludinginternships, was 154,176 and 159,681, respectively. The following table sets forth the average number ofemployees, excluding internships, we had on a geographical basis for 2012, 2013 (excluding Venezuela) and2014 (excluding Czech Republic and Peru branch for EMEA).
Yearly Average
2012 2013 2014
Brazil 82,973 86,413 82,702Americas 49,870 53,037 57,232EMEA 17,316 16,307 14,161Corporate 89 75 81
Total 150,248 155,832 154,176
For the year ended December 31, 2012, an average of 69.0% of our staff had permanent employmentcontracts as compared to an average of 74.9% as at December 31, 2013 and 74.7% as at December 31, 2014.
We believe that our people are key enablers to our business model and a strategic pillar to our competitiveadvantage. We focus on reinforcing a culture that emphasizes teamwork, improvement of our processes and,most importantly, total dedication to the client. We believe that our distinctive culture is incorporated within allrelationships and processes of our organization and fits within our values and goals.
Our culture is sustained by four core values (i) commitment, (ii) trust, (iii) passion and (iv) integrity. Weaim to deliver growth by inspiring our people and believe that our values help us deliver on our mission to “makecompanies successful by guaranteeing the best customer experience for their clients.” The critical success factoris to ensure that our entire leadership is aligned with the drivers of our culture that best fit into our businessstrategy and vision. To that end, we have developed key guiding principles that reinforce and exemplify our corevalues:
• we work as a team, understanding our clients’ needs locally but leveraging our global capabilities andscale;
• we encourage the spirit of entrepreneurship and innovation;
• we strive to be efficient, agile and streamlined to create value for our clients;
• we put passion into everything we do, motivated by the desire to be better, with the ambition to achieveour goals;
• we are disciplined financially and operationally; and
• we are proud to build a great place to work.
As a result of that, we were named in 2014 one of the top 25 multinational companies globally to work forby Great Place to Work Institute, putting us alongside companies. Furthermore, we have received the mostcountry-level Great Place to Work prizes in the CRM BPO industry. Because our solutions are delivered throughover 154,000 of our employees, we believe that our high levels of demonstrated employee satisfaction enable usto deliver a differentiated customer experience compared to our competitors and clients in-house.
Incentive Model
Atento has established an incentive model in alignment with the Company’s strategy using as the keydrivers (i) the creation of shareholder value, (ii) increased growth in our business (especially with new clients),(iii) business profitability.
To pursue the delivery of our strategic goals, we periodically evaluate the contribution and development ofour employees. The evaluation of our employees is performed in our annual management review, which impactsmany performance management processes, including compensation reviews, training and development initiativesand mobility moves. The management review process is based on reviewing an employee’s performance,competencies and potential assessment (i.e., director, managers and leaders).
79
Our compensation model is principally driven by our vision and mission, organizational culture, externaland internal environment, business strategy and our organizational model. These considerations are translatedinto a “Total Compensation Model,” under which we consider compensation, benefits, work/life balance,performance and recognition, development and career opportunities to attract, retain, engage and motivate ourcurrent and future employees. The main pillars of the model, particularly in relation to structure personnel, arejob grading methodology, base salary, bonus scheme, long-term incentives, international mobility and otherbenefits.
Employee Training and Motivation
We focus on attracting and retaining talents. Our methodology consists in a global selection process withcommon phases for each profile and a consistent methodology, as well as integrated selection tools and systemswith well-defined criteria in identifying desired employee profiles. This integrated approach allows us to create aconsistent selection process across geographies, promoting adherence of new employees to our core values, withthe ultimate goal of improving business performance.
We also developed over time motivational initiatives (Rally program) designed for the operational staff toimprove results and strengthen the sense of belonging. This initiative was originally set up as an instrument forgenerating points of contact and relations between staff and our brand and values. The program includes a seriesof quarterly events involving cultural, recreational, sports and social activities that are open to all employees.
Employee Satisfaction
The level of employee satisfaction within the work environment is important to us. We participate in the“Great Place to Work” survey, held locally by the Great Place to Work Institute. The survey measuresperceptions of employees about the work environment and allows for comparison against other participatingcompanies at certain local and regional levels. In 2013, we were recognized as one of the top 25 companies towork for according to Great Place to Work Institute’s ranking of the World’s Best Multinational Workplaces,putting it alongside companies. Additionally, we have won numerous Great Place to Work recognitionsregionally, in both South and Central America, and in the countries where we operate. In 2013, we were listedamong the “Great Place to Work” companies in eleven of the fifteen countries where we operate (Brazil,Argentina, Colombia, Chile, El Salvador, Guatemala, Mexico, Peru, Puerto Rico, Spain and Uruguay). Notably,we also received the #1 Great Place to Work in Colombia for two consecutive years.
Labor/Collective Negotiation
We closely monitor the management of labor relations and it is an important element for the success of ourbusiness and results of operations.
As of December 31, 2014, we had in place collective bargaining agreements in seven countries, includingArgentina, Brazil, Chile, Mexico, Peru and Spain, which govern our relationships with most of the employees inthose countries. As of December 31, 2014, 83.0% of our employees were under collective bargainingagreements. See “Risk Factors—Risks Related to Our Business—If we experience challenges with respect tolabor relations, our overall operating costs and profitability could be adversely affected and our reputation couldbe harmed”. Our collective bargaining agreements are generally renegotiated every one to three years with theprincipal labor unions in the countries where we have such agreements. In general, the collective bargainingagreements include terms that regulate remuneration, minimum salary, salary complements, extra time, benefits,bonuses and partial disability.
In Brazil, our most important collective bargaining agreement is in São Paulo, and it is re-negotiated everyyear. In January 2015 we agreed for all employees based in São Paulo and Rio de Janeiro a salary increase of8.8% increase for those with minimum wage and, a 6.23% increase for all other salaried employee. We arecurrently negotiating salary increases in the other cities.
In Mexico, our most significant collective bargaining agreement, in terms of number of employees, is inMexico DF and it is re-negotiated every year. In 2014, a 4% salary increase was agreed for all employees underthe collective bargaining agreement, compared to a 3.8% increase in the consumer price index in 2013.
80
In Spain, there is a collective bargaining agreement for all of the contact center companies in the country,which is negotiated through the “Asociación de Contact Center Española,” a committee comprised ofrepresentatives from five of the six largest contact center companies in Spain, of which we are one. The currentcollective bargaining agreement is automatically renew unless a union opposes it, requesting a change in any ofthe current terms.
Pension obligations
The Atento Group has arranged defined contribution pension plans for employees in Mexico and Brazil.Under defined contribution plans, the Atento Group makes a set of contributions to a pension fund and bears nolegal or implicit obligation to make additional contributions if the fund fails to hold sufficient assets to pay allemployees the benefits corresponding to the services rendered in the present year and in prior years.
As part of its defined contribution plans, the Atento Group makes contributions to pension insurance plansmanaged publically or privately, on an obligatory, contractual or voluntary basis. Once the contributions havebeen made, the Atento Group has no additional payment obligations. The contributions are recognized asemployee benefits when accrued. Benefits paid in advance are recognized as an asset insofar as they entail a cashreimbursement or a reduction in future payments.
Termination benefits
Termination benefits are paid to employees when the Atento Group decides to terminate their employmentcontracts prior to the usual retirement age or when the employee agrees to voluntarily resign in exchange forthese benefits. The Atento Group recognizes these benefits as an expense for the year, at the earliest of thefollowing dates: (a) when the Atento Group is no longer able to withdraw the offer for these benefits; or (b) whenthe Atento Group company recognizes the costs of a restructuring effort as per IAS 37, Provisions, ContingentLiabilities and Contingent Assets, and when this restructuring entails the payment of termination benefits. Whenbenefits are offered in order to encourage the voluntary resignation of employees, termination benefits aremeasured on the basis of the number of employees expected to accept the offer. Benefits to be paid in more thantwelve months from the reporting date are discounted to their present value.
E. Share Ownership
In July 2013, the Shareholders of Atento Group implemented a Management Incentive Plan (the “MIP”)pursuant to which certain of the Group’s senior management are granted the opportunity to invest in the Group.The eligibility of managers to participate is determined by the remuneration committee of the company.
Managers who participate in the MIP are required to subscribe for various classes of shares in aLuxembourg special purpose vehicle that is indirectly invested in Atalaya Luxco Topco S.C.A (“Topco”), theultimate parent company of the Group. The shares held by each MIP participant fall into two categories:‘co-investment shares’ and ‘performance shares’. The co-investment shares effectively allow managers toparticipate in dividends and other distributions on a pro rata and pari passu basis with Topco’s othershareholders. The performance shares only participate in dividends and other distributions if Topco’s majorityshareholder achieves certain specified returns on its investment in Topco, with the performance shares beingentitled to receive a progressively larger share of all dividends and other distributions (up to a pre-determinedmaximum percentage) as the total proceeds received by Topco’s majority shareholder reach certain pre-agreedhurdles.
MIP participants are only entitled to hold shares for so long as they are employed by a member of theGroup. In the event that a MIP participant’s employment is terminated, his/her shares can be bought back at apre-specified price that is linked to the circumstances surrounding the termination of the relevant manager’semployment and the length of time that such manager has held his/her shares.
On July 18, 2013, Atento Spain Holdco 2, S.A.U., an indirect subsidiary, entered into a revolving facilityagreement with Atalaya Management Luxco Investment pursuant to which Atento Spain Holdco 2, S.A.U.provided a Euro revolving loan facility in an aggregate amount equal to €3.0 million ($4.1 million) to AtalayaManagement Luxco Investment for the purpose of acquiring an immaterial ownership interest in a related party.The management loan was capitalized in full in April 2014.
81
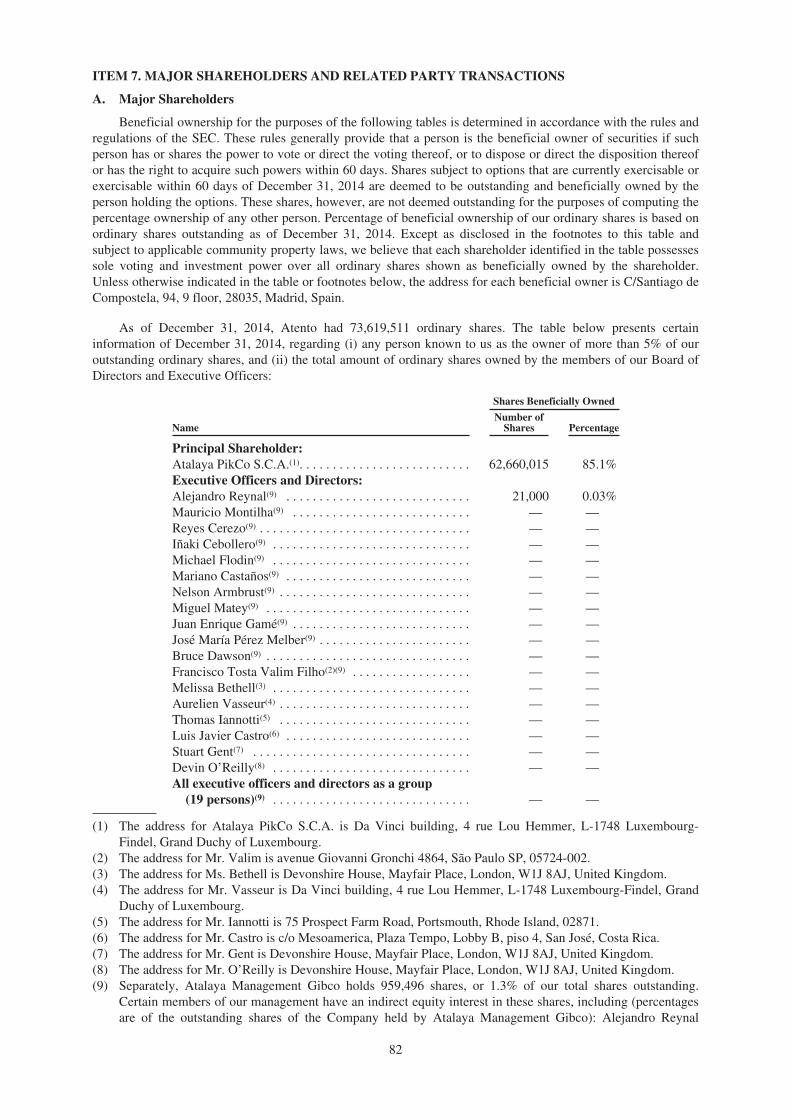
ITEM 7. MAJOR SHAREHOLDERS AND RELATED PARTY TRANSACTIONS
A. Major Shareholders
Beneficial ownership for the purposes of the following tables is determined in accordance with the rules andregulations of the SEC. These rules generally provide that a person is the beneficial owner of securities if suchperson has or shares the power to vote or direct the voting thereof, or to dispose or direct the disposition thereofor has the right to acquire such powers within 60 days. Shares subject to options that are currently exercisable orexercisable within 60 days of December 31, 2014 are deemed to be outstanding and beneficially owned by theperson holding the options. These shares, however, are not deemed outstanding for the purposes of computing thepercentage ownership of any other person. Percentage of beneficial ownership of our ordinary shares is based onordinary shares outstanding as of December 31, 2014. Except as disclosed in the footnotes to this table andsubject to applicable community property laws, we believe that each shareholder identified in the table possessessole voting and investment power over all ordinary shares shown as beneficially owned by the shareholder.Unless otherwise indicated in the table or footnotes below, the address for each beneficial owner is C/Santiago deCompostela, 94, 9 floor, 28035, Madrid, Spain.
As of December 31, 2014, Atento had 73,619,511 ordinary shares. The table below presents certaininformation of December 31, 2014, regarding (i) any person known to us as the owner of more than 5% of ouroutstanding ordinary shares, and (ii) the total amount of ordinary shares owned by the members of our Board ofDirectors and Executive Officers:
Shares Beneficially Owned
NameNumber of
Shares Percentage
Principal Shareholder:Atalaya PikCo S.C.A.(1). . . . . . . . . . . . . . . . . . . . . . . . . . 62,660,015 85.1%Executive Officers and Directors:Alejandro Reynal(9) . . . . . . . . . . . . . . . . . . . . . . . . . . . . 21,000 0.03%Mauricio Montilha(9) . . . . . . . . . . . . . . . . . . . . . . . . . . . — —Reyes Cerezo(9) . . . . . . . . . . . . . . . . . . . . . . . . . . . . . . . . — —Iñaki Cebollero(9) . . . . . . . . . . . . . . . . . . . . . . . . . . . . . . — —Michael Flodin(9) . . . . . . . . . . . . . . . . . . . . . . . . . . . . . . — —Mariano Castaños(9) . . . . . . . . . . . . . . . . . . . . . . . . . . . . — —Nelson Armbrust(9) . . . . . . . . . . . . . . . . . . . . . . . . . . . . . — —Miguel Matey(9) . . . . . . . . . . . . . . . . . . . . . . . . . . . . . . . — —Juan Enrique Gamé(9) . . . . . . . . . . . . . . . . . . . . . . . . . . . — —José María Pérez Melber(9) . . . . . . . . . . . . . . . . . . . . . . . — —Bruce Dawson(9) . . . . . . . . . . . . . . . . . . . . . . . . . . . . . . . — —Francisco Tosta Valim Filho(2)(9) . . . . . . . . . . . . . . . . . . — —Melissa Bethell(3) . . . . . . . . . . . . . . . . . . . . . . . . . . . . . . — —Aurelien Vasseur(4) . . . . . . . . . . . . . . . . . . . . . . . . . . . . . — —Thomas Iannotti(5) . . . . . . . . . . . . . . . . . . . . . . . . . . . . . — —Luis Javier Castro(6) . . . . . . . . . . . . . . . . . . . . . . . . . . . . — —Stuart Gent(7) . . . . . . . . . . . . . . . . . . . . . . . . . . . . . . . . . — —Devin O’Reilly(8) . . . . . . . . . . . . . . . . . . . . . . . . . . . . . . — —All executive officers and directors as a group
(19 persons)(9) . . . . . . . . . . . . . . . . . . . . . . . . . . . . . . — —
(1) The address for Atalaya PikCo S.C.A. is Da Vinci building, 4 rue Lou Hemmer, L-1748 Luxembourg-Findel, Grand Duchy of Luxembourg.
(2) The address for Mr. Valim is avenue Giovanni Gronchi 4864, São Paulo SP, 05724-002.(3) The address for Ms. Bethell is Devonshire House, Mayfair Place, London, W1J 8AJ, United Kingdom.(4) The address for Mr. Vasseur is Da Vinci building, 4 rue Lou Hemmer, L-1748 Luxembourg-Findel, Grand
Duchy of Luxembourg.(5) The address for Mr. Iannotti is 75 Prospect Farm Road, Portsmouth, Rhode Island, 02871.(6) The address for Mr. Castro is c/o Mesoamerica, Plaza Tempo, Lobby B, piso 4, San José, Costa Rica.(7) The address for Mr. Gent is Devonshire House, Mayfair Place, London, W1J 8AJ, United Kingdom.(8) The address for Mr. O’Reilly is Devonshire House, Mayfair Place, London, W1J 8AJ, United Kingdom.(9) Separately, Atalaya Management Gibco holds 959,496 shares, or 1.3% of our total shares outstanding.
Certain members of our management have an indirect equity interest in these shares, including (percentagesare of the outstanding shares of the Company held by Atalaya Management Gibco): Alejandro Reynal
82
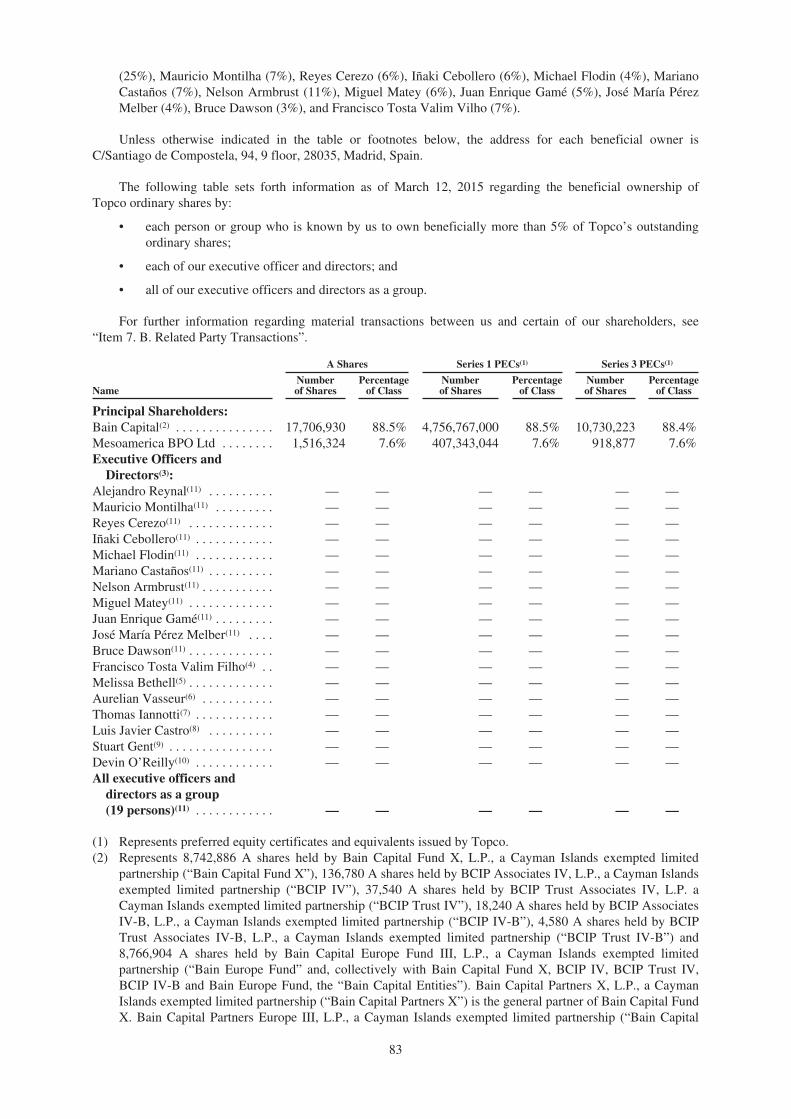
(25%), Mauricio Montilha (7%), Reyes Cerezo (6%), Iñaki Cebollero (6%), Michael Flodin (4%), MarianoCastaños (7%), Nelson Armbrust (11%), Miguel Matey (6%), Juan Enrique Gamé (5%), José María PérezMelber (4%), Bruce Dawson (3%), and Francisco Tosta Valim Vilho (7%).
Unless otherwise indicated in the table or footnotes below, the address for each beneficial owner isC/Santiago de Compostela, 94, 9 floor, 28035, Madrid, Spain.
The following table sets forth information as of March 12, 2015 regarding the beneficial ownership ofTopco ordinary shares by:
• each person or group who is known by us to own beneficially more than 5% of Topco’s outstandingordinary shares;
• each of our executive officer and directors; and
• all of our executive officers and directors as a group.
For further information regarding material transactions between us and certain of our shareholders, see“Item 7. B. Related Party Transactions”.
A Shares Series 1 PECs(1) Series 3 PECs(1)
NameNumberof Shares
Percentageof Class
Numberof Shares
Percentageof Class
Numberof Shares
Percentageof Class
Principal Shareholders:Bain Capital(2) . . . . . . . . . . . . . . . 17,706,930 88.5% 4,756,767,000 88.5% 10,730,223 88.4%Mesoamerica BPO Ltd . . . . . . . . 1,516,324 7.6% 407,343,044 7.6% 918,877 7.6%Executive Officers and
Directors(3):Alejandro Reynal(11) . . . . . . . . . . — — — — — —Mauricio Montilha(11) . . . . . . . . . — — — — — —Reyes Cerezo(11) . . . . . . . . . . . . . — — — — — —Iñaki Cebollero(11) . . . . . . . . . . . . — — — — — —Michael Flodin(11) . . . . . . . . . . . . — — — — — —Mariano Castaños(11) . . . . . . . . . . — — — — — —Nelson Armbrust(11) . . . . . . . . . . . — — — — — —Miguel Matey(11) . . . . . . . . . . . . . — — — — — —Juan Enrique Gamé(11) . . . . . . . . . — — — — — —José María Pérez Melber(11) . . . . — — — — — —Bruce Dawson(11) . . . . . . . . . . . . . — — — — — —Francisco Tosta Valim Filho(4) . . — — — — — —Melissa Bethell(5) . . . . . . . . . . . . . — — — — — —Aurelian Vasseur(6) . . . . . . . . . . . — — — — — —Thomas Iannotti(7) . . . . . . . . . . . . — — — — — —Luis Javier Castro(8) . . . . . . . . . . — — — — — —Stuart Gent(9) . . . . . . . . . . . . . . . . — — — — — —Devin O’Reilly(10) . . . . . . . . . . . . — — — — — —All executive officers and
directors as a group(19 persons)(11) . . . . . . . . . . . . — — — — — —
(1) Represents preferred equity certificates and equivalents issued by Topco.(2) Represents 8,742,886 A shares held by Bain Capital Fund X, L.P., a Cayman Islands exempted limited
partnership (“Bain Capital Fund X”), 136,780 A shares held by BCIP Associates IV, L.P., a Cayman Islandsexempted limited partnership (“BCIP IV”), 37,540 A shares held by BCIP Trust Associates IV, L.P. aCayman Islands exempted limited partnership (“BCIP Trust IV”), 18,240 A shares held by BCIP AssociatesIV-B, L.P., a Cayman Islands exempted limited partnership (“BCIP IV-B”), 4,580 A shares held by BCIPTrust Associates IV-B, L.P., a Cayman Islands exempted limited partnership (“BCIP Trust IV-B”) and8,766,904 A shares held by Bain Capital Europe Fund III, L.P., a Cayman Islands exempted limitedpartnership (“Bain Europe Fund” and, collectively with Bain Capital Fund X, BCIP IV, BCIP Trust IV,BCIP IV-B and Bain Europe Fund, the “Bain Capital Entities”). Bain Capital Partners X, L.P., a CaymanIslands exempted limited partnership (“Bain Capital Partners X”) is the general partner of Bain Capital FundX. Bain Capital Partners Europe III, L.P., a Cayman Islands exempted limited partnership (“Bain Capital
83
Partners Europe”) is the general partner of Bain Europe Fund. Bain Capital Investors, LLC, a Delawarelimited liability company (“BCI”) is the general partner of each of Bain Capital Partners X, Bain CapitalPartners Europe, BCIP IV, BCIP Trust IV, BCIP IV-B and BCIP. As a result, BCI may be deemed to sharebeneficial ownership of the shares held by each of the Bain Capital Entities. The governance, investmentstrategy and decision-making process with respect to investments held by the Bain Capital Entities isdirected by BCI’s Global Private Equity Board (“GPEB”), which is comprised of the following individuals:Steven Barnes, Joshua Bekenstein, John Connaughton, Paul Edgerley, Stephen Pagliuca, Michel Plantevin,Dwight Poler, Jonathan Zhu and Stephen Zide. By virtue of the relationships described in this footnote,GPEB may be deemed to exercise voting and dispositive power with respect to the shares held by the BainCapital Entities. Each of the members of GPEB disclaims beneficial ownership of such shares to the extentattributed to such member solely by virtue of serving on GPEB. Each of the Bain Capital Entities has anaddress c/o Bain Capital Partners, LLC, John Hancock Tower, 200 Clarendon Street, Boston, Massachusetts02116.
(3) Certain executive officers and directors own equity interests in Atalaya Management Luxco InvestmentSCA, an indirect shareholder of Topco, and the PEC and A Share ownership shown is equivalent ownershipbased on their investment in Atalaya Management Luxco Investment SCA.
(4) The address for Mr. Valim is avenue Giovanni Gronchi 4864, São Paulo SP, 05724-002.(5) Does not include shares held by the Bain Capital Entities. Ms. Bethell is a managing director of Bain Capital
and as a result may be deemed to share beneficial ownership of the shares held by the Bain Capital Entities.The address for Ms. Bethell is Devonshire House, Mayfair Place, London, W1J 8AJ, United Kingdom.
(6) Does not include shares held by the Bain Capital Entities. Mr. Vasseur is a corporate manager of BainCapital and as a result may be deemed to share beneficial ownership of the shares held by the Bain CapitalEntities. The address for Mr. Vasseur is Da Vinci building, 4 rue Lou Hemmer, L-1748 Luxembourg-Findel,Grand Duchy of Luxembourg.
(7) The address for Mr. Iannotti is 75 Prospect Farm Road, Portsmouth, Rhode Island, 02871.(8) Does not include shares held by Mesoamerica. Mr. Castro is a managing director of Mesoamerica and as a
result may be deemed to share in beneficial ownership of the shares held by Mesoamerica. The address forMr. Castro is c/o Mesoamerica, Plaza Tempo, Lobby B, piso 4, San José, Costa Rica.
(9) Does not include shares held by the Bain Capital Entities. Mr. Gent is a managing director of Bain Capitaland as a result may be deemed to share in beneficial ownership of the shares held by the Bain CapitalEntities. The address for Mr. Gent is Devonshire House, Mayfair Place, London, W1J8AJ, United Kingdom.
(10) Does not include shares held by the Bain Capital Entities. Mr. O’Reilly is a managing director of BainCapital and as a result may be deemed to share beneficial ownership of the shares held by the Bain CapitalEntities. The address for Mr. O’Reilly is Devonshire House, Mayfair Place, London, W1J 8AJ, UnitedKingdom.
(11) Separately, Atalaya Management Gibco also holds 481,590 C shares in Topco. Certain members of ourmanagement have an indirect equity interest in these shares including (percentages are of the C shares inTopco held by Atalaya Management Gibco): Alejandro Reynal (29%), Mauricio Montilha (9%), ReyesCerezo (4%), Iñaki Cebollero (4%), Michael Flodin (4%), Mariano Castaños (6%), Nelson Armbrust (9%),Miguel Matey (6%), Juan Enrique Gamé (6%), José María Pérez Melber (6%), and Bruce Dawson (4%).
B. Related Party Transactions
Bain Capital Consulting Services Agreement and Transaction Services Agreement
On December 12, 2012, Atento Spain Holdco, S.L.U., an indirect subsidiary of the Company, entered into aconsulting services agreement with Bain Capital Partners, LLC, an investment adviser to certain of the BainCapital funds, pursuant to which it agreed to provide general executive, business development and other financialadvisory services to us. Pursuant to the consulting services agreement, Bain Capital Partners, LLC received anannual fee equal to the greater of €5.0 million and 3.00% of the Company’s annual EBITDA, plus reimbursementfor reasonable out-of-pocket expenses.
Additionally, pursuant to a transaction services agreement between Atento Spain Holdco S.L.U. and BainCapital Partners, LLC, dated as of December 12, 2012, it provides certain transaction-specific advisory services.Pursuant to this agreement, Atento Spain Holdco, S.L.U. paid Bain Capital Partners, LLC a transaction fee of$20.3 million in December 2012 principally related to the Acquisition, and it has agreed to pay transaction feesfor advice and support relating to future transactions by us (including, without limitation, any share, asset or debtpurchase, capital expenditures and refinancing of existing indebtedness) equal to 1.00% of the aggregatetransaction value of each such future transaction plus any reasonable out-of-pocket expenses (including fees ofany accountants, attorneys or other advisors retained by Bain Capital Partners, LLC and its affiliates) incurred inconnection with the investigation, negotiation and consummation of such future transaction.
84
The transaction services agreement and consulting services agreements each have a one-year initial term andare thereafter subject to automatic one-year extensions unless Bain Capital Partners, LLC provides written noticeof termination at least 90 days prior to the expiration of the initial term or any extension thereof. Bain CapitalPartners, LLC may also terminate the agreements at any time by delivering to us written notice of termination.The agreements include customary indemnities in favor of Bain Capital Partners, LLC. The transaction servicesagreement and the consulting services agreement were amended on May 17, 2013.
On October 7, 2014, the parties thereof entered into a deed of termination in relation to the consultingservices agreement and the transaction services agreement. In connection with such termination, Atento paid toBain Capital Partners, LLC a termination fee of $23.0 million and a transaction fee of $1.5 million.
Our payment of fees to Bain Capital Partners, LLC in 2014 in connection with these agreements amountedto $31.5 million.
Subscription and Security holder’s Agreements
Topco, our indirect parent company, Atalaya Luxco S.à.r.l. and certain investors, including Bain Capital andcertain members of our management team, entered into certain Subscription and Security holder’s Agreements. TheSubscription and Security holder’s Agreements provide for each investor therein to subscribe for certain securitiesof Topco or its affiliates, and sets forth rights and restrictions related to the securities. Among other things, theSubscription and Security holder’s Agreements restrict the transfer of the securities by investors, other than BainCapital, without the prior written consent of Atalaya Luxco S.à.r.l. The Subscription and Securityholder’sAgreements further provide the investors with tag along rights in the event Bain Capital transfers any of itssecurities. The Subscription and Securityholder’s Agreements also provide Bain Capital with a drag along right thatcan be imposed upon the investors in the event Bain Capital proposes to transfer its securities.
In addition, the Subscription and Securityholder’s Agreements require the investors to vote for and consentto a public offering and sale of the securities approved by Atalaya Luxco S.à.r.l.
Registration Rights Agreement
Prior to the consummation of the IPO, we entered into a registration rights agreement whereby we grantedcertain registration rights to PikCo, and its affiliates and certain of their transferees, including the right, undercertain circumstances and subject to certain restrictions, to require us to register under the Securities Act ourordinary shares held by them. In addition, we committed to file as promptly as possible after receiving a requestfrom PikCo, a shelf registration statement registering secondary sales of our ordinary shares held by PikCo.PikCo also will have the ability to exercise certain piggyback registration rights in respect of ordinary shares heldby them in connection with registered offerings requested by other registration rights holders or initiated by us.
2014 Incentive Plan
In connection with this offering, we intend to adopt the 2014 Omnibus Incentive Plan (the “2014 IncentivePlan”). The 2014 Incentive Plan will provide for grants of stock options, stock appreciation rights, restrictedstock, other stock-based awards and other cash-based awards. Directors, officers and other employees of us andour subsidiaries, as well as others performing consulting or advisory services for us, will be eligible for grantsunder the 2014 Incentive Plan. The purpose of the 2014 Incentive Plan is to provide incentives that will attract,retain and motivate high performing officers, directors, employees and consultants by providing them withappropriate incentives and rewards either through a proprietary interest in our long-term success or compensationbased on their performance in fulfilling their personal responsibilities.
Management Loan
On July 18, 2013, Atento Spain Holdco 2, S.A.U., an indirect subsidiary, entered into a revolving facilityagreement with Atalaya Management Luxco Investment pursuant to which Atento Spain Holdco 2, S.A.U.provided a Euro revolving loan facility in an aggregate amount equal to €3.0 million ($4.1 million) to AtalayaManagement Luxco Investment for the purpose of acquiring an interest in Topco. As of December 31, 2013, themanagement loan had an outstanding balance of $2.4 million. The loan was converted in April 2014 into apreference share, held by Atento Spain Holdco 2, S.A.U. This preference share was redeemed in full in May2014, the redemption price was funded by the issuance of a series of preferred equity certificates by AtalayaManagement Luxco Investment to certain entities controlled by Bain Capital. The IPO proceeds received by theselling shareholder were used to redeem these preferred equity certificates.
85
Consulting Services and Information Rights Agreement
On October 7, 2014, Atento, S.A., Bain Capital, Ltd. and Portfolio Company Advisors Ltd. entered into anew Consulting Services and Information Rights Agreement which deems to take effect as from the terminationof the consulting services agreement dated as of December 12, 2012. Among other things, the ConsultingAgreement provides for the Consultants to perform certain consulting services for the benefit of the Company,including business development services, financing-related services and marketing, operations and humanresources services, among others. The Consultants are entitled to reimbursement of all reasonable out-of-pocketexpenses incurred by them in connection with the Consulting Agreement, including irrecoverable VAT thereon.In addition, the Consultants shall be entitled to receive from the Company such financial information regardingthe Company and its affiliates as the Consultants may reasonably request, including monthly management reportsand annual budgets. The Consulting Agreement includes customary indemnification provisions in favor of theConsultants and has an initial term of three years, subject to automatic annual extensions unless the partiesmutually agree otherwise.
PIK Notes due 2020
On May 30, 2014, PikCo, our parent company, issued €137.5 million and $191.5 million aggregate principalamount of PIK Notes pursuant to an indenture, dated May 30, 2014, among PikCo, as issuer, Topco, the directholding company of PikCo, as security provider, Citibank, N.A., London Branch, as trustee, security agent andpaying agent, and Citigroup Global Markets Deutschland AG, as registrar, governing the Senior PIK ToggleNotes. The PIK Notes are senior secured obligations of PikCo and are not guaranteed by any party.
The PIK Notes will mature on May 30, 2020. PikCo may decide in its sole discretion to pay all or a portionof the interest payable for any interest period in cash or in kind.
The indenture governing the Senior PIK Toggle Notes contains covenants that, among other things, restrictthe ability of PikCo and certain of its subsidiaries, including us, to: incur or guarantee additional indebtedness;issue, redeem or repurchase certain debt; issue certain preferred stock or similar equity securities; make loans andinvestments; sell assets; incur liens; enter into transactions with affiliates; enter into agreements restrictingcertain subsidiaries’ ability to pay dividends; and consolidate, merge or sell all or substantially all of its assets.These covenants are subject to a number of important exceptions and qualifications. In addition, in certaincircumstances, if PikCo sells assets (including a sale of capital stock to third parties pursuant to a public equityoffering or otherwise), or experiences certain changes of control, it must offer to purchase all or a portion of theSenior PIK Toggle Notes at a price equal to par plus a premium.
A proportion of the PIK Notes were redeemed at the time of the IPO, amounting to 24,368,574.97 of theEUR tranche and 33,747,581.60 of the USD tranche.
Limitations of Liability and Indemnification Matters
We intend to enter into indemnification agreements with each of our current directors and executiveofficers. These agreements will require us to indemnify these individuals to the fullest extent permitted underLuxembourg law against liabilities that may arise by reason of their service to us, and to advance expensesincurred as a result of any proceeding against them as to which they could be indemnified. We also intend toenter into indemnification agreements with our future directors and executive officers.
Policies and Procedures With Respect to Related Party Transactions
We have adopted policies and procedures whereby our Audit Committee and Compliance Committee isresponsible for reviewing and approving related party transactions. In addition, our Code of Ethics requires thatall of our employees and directors inform the Company of any material transaction or relationship that comes totheir attention that could reasonably be expected to create a conflict of interest. Further, at least annually, eachdirector and executive officer is required to report any business relationship that may give rise to a conflict ofinterest and all transactions in which we are involved and in which the executive officer, a director or a relatedperson has a direct or indirect material interest.
86
The table below sets out balances and transactions with ATALAYA Luxco TOPCO, S.C.A, in 2013 and2014 (in thousand U.S. dollars):
12/31/2013 12/31/2014
Non-current payables to Group companies . . . . . . . . . . . . . . . . . . . . . . . . . . . . . . . . . . . . 519,607 —Atalaya Luxco Topco, S.C.A. . . . . . . . . . . . . . . . . . . . . . . . . . . . . . . . . . . . . . . . . . . . . 519,607 —
Atalaya Luxco Topco, S.C.A payables are composed of the following: (i) four series of Preferred EquityCertificates (PECs, ALPECs and PPPECs) issued by the Atalaya Luxco Topco Company and subscribed by theCompany, totaling $550.2 million at October 3, 2014 ($517.4 million in 2013); (ii) interest accruing pendingpayment amounting to $26.0 million at October 3, 2014 ($2.2 million in 2013). The Preferred Equity Certificateswhich were capitalized on October 3, 2014 in connection with the IPO, for a total amount of €460.1 million(approximately $575.9 million).
The outlay for interest on these debts in 2013 was $25.4 million ($25.7 million in 2013 and $1.9 million in2012).
C. Interests of Experts and Counsel
Not applicable.
ITEM 8. FINANCIAL INFORMATION
A. Consolidated Statements and Other Financial Information
Consolidated Financial Statements
See “Item 18. Financial Statements”, which contains our audited consolidated financial statements preparedin accordance with IFRS as issued by IASB.
Legal Proceedings
We are subject to claims and lawsuits arising in the ordinary course of our business. We make provision forsuch claims and lawsuits in our annual financial statements to the extent that losses are deemed both probableand quantifiable. We do not believe that the outcome of any pending claims will have a material adverse effecton our business, results of operations, liquidity or financial condition.
Tax Litigation
At December 31, 2014 Atento Brasil, S.A. has 29 contentious proceedings ongoing with the tax authoritiesand social security authorities, for various reasons relating to infraction proceedings filed (33 in 2013). The totalamount of these claims is approximately $33.8 million ($47.5 million at December 31, 2013). According to theCompany’s external attorneys, materialization of the risk event is possible.
At December 31, 2014 Teleatento del Perú, S.A.C. has a lawsuit underway with the Peruvian tax authoritiesin the amount of $8.5 million ($9.5 million in 2013). According to the Company’s external attorneys,materialization of the risk event is possible.
Labor Litigation
Notwithstanding the foregoing, as of December 31, 2014, Atento Brazil was party to approximately 10,022labor disputes initiated by our employees or former employees for various reasons, such as dismissals or disputesover employment conditions in general. Atento Brazil estimates that the amount involved in these claims totals$100.9 million, of which $53.9 million have been classified as probable, $39.4 million classified as possible and$5.0 million classified as remote, based on inputs from external and internal counsels as well as historicalstatistics. Considering the levels of litigation in Brazil and our historical experience with these types of claims, asof December 31, 2014, we have recognized $53.9 million of provisions ($71.9 million as of December 31, 2013and $71.8 million as of December 31, 2012), which corresponds to the total amount of the claims whose chancesof loss have been classified as probable, and that according to our directors and in consideration of theassessment performed by our legal advisors, is a sufficient amount to cover the risk of payments likely to bemade with respect to these claims. Nevertheless, there is a risk that the provisioned amount may not be sufficient
87
to cover the actual contingency to which Atento Brazil is exposed, which could have a material adverse effect onour business, financial condition, results of operations and prospects. In connection with these claims, AtentoBrazil and its affiliates have, in accordance with local laws, deposited $35.6 million with the Brazilian courts assecurity for claims made by employees or former employees (the “Judicial Deposits”). These deposits areaccounted for in Other Financial Assets. The yearly net cash contributed to the courts as judicial depositsamounted to $11.0 million in 2014, $11.7 million in 2013 and $16.0 million in 2012.
At December 31, 2014 Atento Teleservicios España S.A.U. and the rest of Spanish companies was party tolabor-related disputes filed by Atento employees or former employees for different reasons, such as dismissalsand disagreements regarding employment conditions, totaling $4.4 million ($2.3 million in 2013). According tothe Company’s external lawyers, materialization of the risk event is possible.
At December 31, 2014 Atento México S.A. de C.V. was party to labor-related disputes filed by Atentoemployees or former employees for different reasons, such as dismissals and disagreements regardingemployment conditions, totaling $5.9 million ($4.8 million in 2013). According to the Company’s externallawyers, materialization of the risk event is possible.
Provision for restructuring in Spain
On June 26, 2014, the Company communicated to the Spanish Labor Unions a headcount reduction plan inSpain (“Expediente de Regulación de Empleo”) which took into consideration a maximum number ofterminations amounting to 9% (up to 672 employees) of the total headcount of Atento Teleservicios España,S.A.U. The estimated costs incurred in the personnel restructuring and other costs directly attributable to therestructuring at an amount equivalent to $13.9 million as at September 30, 2014 were accrued and recognized in“Other provisions”. As at September 30, 2014, the vast majority of total costs incurred in connection with thisrestructuring process ($11.5 million) had already been paid.
An appeal against this agreement was filed by a minority of the unions before the Spanish National Court,claiming that the restructuring was null and void on a number of grounds. On November 12, 2014, the courtissued its decision, and rejected each of the minority unions’ claims, except with respect to the claim that therewas a defect in the referendum procedure conducted by the majority unions. The court ruled that there was adefect in the majority unions’ referendum procedure, and as a result, declared the Company’s headcountreduction plan to be null and void.
The court, based on that nullity, declared that the Company must reinstate all dismissed employees and paytheir salaries in full for the period from when they were dismissed until reinstatement. The employees would berequired to pay back the severance payments received upon termination. On November 19, 2014, the Companyappealed this decision before the Spanish Supreme Court.
On December 12, 2014, the Spanish National Court approved a settlement agreement reached between theCompany’s subsidiary in Spain and all seven trade unions with representation in the legal proceedings, whichprovides a headcount reduction of 476 employees of the total initially proposed headcount in the collectivedismissal program.
According to the agreement reached, 179 employees will be readmitted to their prior positions with theCompany on the terms they had before the process began, including receiving the same salary.
This unanimous agreement and its approval by the Spanish National Court bring to an end the process andreflect the efforts of all parties involved to reach a beneficial solution for all stakeholders.
Civil Litigation
Atento Brasil, S.A. has 26 civil lawsuits ongoing for various reasons (17 in 2013). The total amount of theseclaims is approximately $3.2 million ($1.1 million at December 31, 2013). According to the Company’s externalattorneys, materialization of the risk event is possible.
Other Litigation
There are other contingencies which are classified as possible by the Company amounting to $11.1 million.
88
Dividend Distributions
Although we are well capitalized and we have sufficient liquidity, our ability to pay dividends on ourordinary shares is limited in the near-term by the indenture governing our Senior Secured Notes, the BrazilianDebentures and our CVIs, and may be further restricted by the terms of any of our future debt or preferredsecurities. In addition, under Luxembourg law, at least 5% of our net profits per year must be allocated to thecreation of a legal reserve until such reserve has reached an amount equal to 10% of our issued share capital. Ifthe legal reserve subsequently falls below the 10% threshold, 5% of net profits again must be allocated towardthe reserve until such reserve returns to the 10% threshold. If the legal reserve exceeds 10% of our issued sharecapital, the legal reserve may be reduced. The legal reserve is not available for distribution. Additionally, becausewe are a holding company, our ability to pay dividends on our ordinary shares is limited by restrictions on theability of our subsidiaries to pay dividends or make distributions to us, including restrictions under the terms ofthe agreements governing our indebtedness.
Pursuant to our articles of incorporation, our board of directors has the power to distribute interim dividendsin accordance with applicable Luxembourg law. The amount to be distributed by the board of directors may notexceed the total profits made since the end of the last financial year for which the accounts have been approved,plus any profits carried forward and sums drawn from reserves available for this purpose, less losses carriedforward and any sums to be placed to reserve pursuant to the requirements of Luxembourg law or of our articlesof incorporation. Notwithstanding the foregoing, dividends may also be declared by a simple majority vote of ourshareholders at an annual general shareholders meeting, typically but not necessarily, based on therecommendation of our board of directors. All shares of our capital stock grant pari passu rights with respect tothe payment of dividends. Any future determination to pay dividends will be subject to compliance withcovenants in current and future agreements governing our indebtedness, and will depend upon our results ofoperations, financial condition, capital requirements and other factors that our board of directors deems relevant.
B. Significant Changes
Except as otherwise disclosed in our audited consolidated financial statements and in this Annual Report,there have been no significant changes in our business, financial conditions or results since December 31, 2014.
ITEM 9. THE OFFER AND LISTING
A. Offering and Listing Details
Price Information
Ordinary Stock
The following table presents high and low market prices in U.S. dollars for Atento S.A. ordinary stock(ATTO) listed on the Security Exchange Commission (SEC) for the periods shown below.
Closing Price ATTO—Annual Basis
U.S. dollars per Share
Year High Low Closing
2014 . . . . . . . . . . . . . . . . . . . . . . . . . . . . . . . . . . . . . . . . . . . . . . . . 12.96 9.43 10.45
Closing Price ATTO—Monthly Basis
U.S. dollars per Share
2014 High Low Closing
October . . . . . . . . . . . . . . . . . . . . . . . . . . . . . . . . . . . . . . . . . . . . . 12.96 9.43 11.74November . . . . . . . . . . . . . . . . . . . . . . . . . . . . . . . . . . . . . . . . . . . 12.42 10.80 11.03December . . . . . . . . . . . . . . . . . . . . . . . . . . . . . . . . . . . . . . . . . . . 11.50 9.65 10.45
B. Plan of Distribution
Not applicable.
89
C. Markets
Trading in New York Stock Exchange
On October 1, 2014, Atento S.A. obtained registration for its ordinary shares, which began trading on theNew York Stock Exchange on October 2, 2014. Under the ATTO symbol, these ordinary shares have been tradedin virtually every session since the first trading day. In 2014, 19.5 million of ordinary shares were traded,representing a trading volume of $234.6 million, equivalent to a daily average of $3.7 million.
D. Selling Shareholders
Not applicable.
E. Dilution
Not applicable.
F. Expenses of the Issue
Not applicable.
ITEM 10. ADDITIONAL INFORMATION
A. Share Capital
Not applicable.
B. Memorandum and Articles of Association
The following is a summary of some of the terms of our ordinary shares, based on our articles of associationand the Luxembourg Corporate Law. In this section and the section entitled “Comparison of Shareholder Rights”we refer to our articles of association as amended and in effect as our “articles of association.”
The following summary is subject to, and is qualified in its entirety by reference to, the provisions of ourarticles of association, the form of which has been filed as an exhibit to the registration statement of which thisAnnual Report is a part. You may obtain copies of our articles of association as described under “Where YouCan Find More Information” in this Annual Report.
General
Atento is a Luxembourg public limited liability company (société anonyme). The company’s legal name is“Atento S.A.” and was incorporated on March 5, 2014 as a Luxembourg public limited liability company (sociétéanonyme).
Atento is registered with the Luxembourg Registry of Trade and Companies under number B.185.761.Atento has its registered office at 4 rue Lou Hemmer, L-1748 Luxembourg Findel, Grand Duchy of Luxembourg.
The corporate purpose of Atento, as stated in Article 2 of our articles of association (Purpose), may besummarized as follows:
The object of Atento, is the holding of participations, in any form whatsoever, in Luxembourg and foreigncompanies and in any other form of investment, the acquisition by purchase, subscription, or in any other manneras well as the transfer by sale, exchange or otherwise of securities of any kind and the administration,management, control and development of its portfolio.
Atento may further guarantee, grant security, grant loans or otherwise assist the companies in which it holdsa direct or indirect participation or right of any kind or which form part of the same group of companies asAtento.
Atento may raise funds especially through borrowing in any form or by issuing any kind of notes, securitiesor debt instruments, bonds and debentures and generally issue any debt, equity and/or hybrid or other securitiesof any type in accordance with Luxembourg law.
90
Finally, Atento may carry out any commercial, industrial, financial, real estate or intellectual property orother activities which it considers useful for the accomplishment of these purposes.
Share Capital
As of December 31, 2014, our issued share capital amounts to €33,173.72, represented by 73,619,511shares. All issued shares were fully paid. A shareholder in a Luxembourg société anonyme holding fully paidshares is not liable, solely because of his or her or its shareholder status, for additional payments to the Companyor the Company’s creditors.
Our articles of association authorize our board of directors to issue ordinary shares within the limits of theauthorized share capital at such times and on such terms as our board or its delegates may decide for a periodending five years after the date on which the minutes of the shareholders’ meeting approving such authorizationare published in the Luxembourg official gazette Mémorial C, Recueil des Sociétés et Associations (unless suchperiod is extended, amended or renewed). Accordingly, our board is authorized to issue ordinary shares up to theauthorized share capital until such date. We currently intend to seek renewals and/or extensions as required fromtime to time.
Our authorized share capital is determined by our articles of association and is set at € 999,997,828.28, asamended from time to time, and may be increased, reduced or extended by amending the articles of associationby approval of the extraordinary general shareholders’ meeting subject to the necessary quorum and majorityrequirements (see “—General Meeting of Shareholders” and “—Amendment to the Articles of Association”).
Under Luxembourg law, existing shareholders benefit from a pre-emptive subscription right on the issuanceof shares for cash consideration. However, our shareholders have, in accordance with Luxembourg law,authorized the board of directors to suppress, waive or limit any pre-emptive subscription rights of shareholdersprovided by law to the extent the board deems such suppression, waiver or limitation advisable for any issuanceor issuances of shares within the scope of our authorized share capital. Such shares may be issued above, at orbelow market value but in any event not below the accounting par value per ordinary share as well as by way ofincorporation of available reserves (including premium).
Form and Transfer of Shares
Our ordinary shares are issued in registered form only and are freely transferable under Luxembourg lawand our articles of association. Our board of directors may however impose transfer restrictions for shares thatare registered, listed, quoted, dealt in, or that have been placed in certain jurisdictions in compliance with therequirements applicable therein. Luxembourg law does not impose any limitations on the rights of Luxembourgor non-Luxembourg residents to hold or vote our ordinary shares.
Under Luxembourg law, the ownership of registered shares is prima facie established by the inscription ofthe name of the shareholder and the number of shares held by him or her in the shareholders register. Withoutprejudice to the conditions for transfer by book entry where shares are recorded in the shareholder register onbehalf of one or more persons in the name of a depository, each transfer of shares shall be effected by writtendeclaration of transfer to be recorded in the shareholder register, such declaration to be dated and signed by thetransferor and the transferee or by their duly appointed agents. We may accept and enter into the shareholderregister any transfer affected pursuant to an agreement or agreements between the transferor and the transferee,true and complete copies of which have been delivered to us.
Our articles of association provide that we may appoint registrars in different jurisdictions, each of whommay maintain a separate register for the shares entered in such register and the holders of shares shall be enteredinto one of the registers. Shareholders may elect to be entered into one of these registers and to transfer theirshares to another register so maintained. Entries in these registers are reflected in the shareholders’ registermaintained at our registered office.
In addition, our articles of association also provide that our ordinary shares may be held through a securitiessettlement system or a professional depository of securities. Ordinary shares held in such manner have the samerights and obligations as ordinary shares recorded in our shareholders’ register. Furthermore, ordinary shares heldthrough a securities settlement system or a professional depository of securities may be transferred in accordancewith customary procedures for the transfer of securities in book-entry form.
91
Issuance of Shares
Pursuant to the Luxembourg Corporate Law, the issuance of ordinary shares requires the approval by thegeneral meeting of shareholders at the quorum and majority provided for the amendment of articles (see “—General Meeting of Shareholders” and “—Amendment to the Articles of Association”). The general meeting mayapprove an authorized share capital and authorize the board of directors to issue ordinary shares up to themaximum amount of such authorized share capital for a maximum period of five years as from the date ofpublication in the Luxembourg official gazette (Mémorial, Recueil des Sociétés et Associations) of the minutes ofthe relevant general meeting. The general meeting may amend, renew or extend such authorized share capital andsuch authorization to the board of directors to issue shares.
Our articles of association provide that no fractional shares shall be issued.
Our ordinary shares have no conversion rights and there are no redemption or sinking fund provisionsapplicable to our ordinary shares.
Pre-Emptive Rights
Unless limited, waived or cancelled by our board of directors (see “—Share Capital”), holders of ourordinary shares have a pro rata pre-emptive right to subscribe for any new shares issued for cash consideration.Our articles of association provide that pre-emptive rights can be limited, waived or cancelled by our board ofdirectors for a period ending on the fifth anniversary of the date of publication of the notarial deed recording theminutes of the extraordinary general shareholders’ meeting in the Luxembourg Legal Gazette in the event of anincrease of the share capital by the board of directors within the limits of the authorized share capital. Thegeneral meeting of shareholders duly convened to consider an amendment to the articles of association may bymajority vote also limit, waive or cancel such pre-emptive rights or to renew, amend or extend them, each timefor a period not to exceed five years.
Repurchase of Shares
We cannot subscribe for our own ordinary shares.
We may, however, repurchase issued ordinary shares or have another person repurchase issued ordinaryshares for our account, subject to the following conditions:
• prior authorization by a simple majority vote at an ordinary general meeting of shareholders, whichauthorization sets forth the terms and conditions of the proposed repurchase and in particular themaximum number of ordinary shares to be repurchased, the duration of the period for which theauthorization is given (which may not exceed five years) and, in the case of repurchase forconsideration, the minimum and maximum consideration per share;
• the repurchase may not reduce our net assets on a non-consolidated basis to a level below the aggregateof the issued and subscribed share capital and the reserves that we must maintain pursuant toLuxembourg law or our articles of association; and
• only fully paid-up shares may be repurchased.
The general meeting of shareholders authorized on September 29, 2014 the board of directors to repurchaseshares representing up to 20% of the issued share capital immediately after the closing of this IPO. Theauthorization is valid for a period ending on the earlier of five years from the date of such shareholderauthorization and the date of its renewal by a subsequent general meeting of shareholders. Pursuant to suchauthorization, the board of directors is authorized to acquire and sell ordinary shares in the Company under theconditions set forth in Article 49-2 of the Luxembourg Corporate Law. Such purchases and sales may be carriedout for any authorized purpose or any purpose that is authorized by the laws and regulations in force. Thepurchase price per ordinary share to be paid shall represent (i) not less than 50% of the lowest closing price pershare and (ii) not more than 50% above the highest closing price per share, in each case as reported by the NewYork City edition of the Wall Street Journal, or, if not reported therein, any other authoritative sources to beselected by the board of directors, over the ten trading days preceding the date of the purchase (or the date of thecommitment to the transaction).
92
In addition, pursuant to Luxembourg law, Atento, may directly or indirectly repurchase ordinary shares bydecision of our board of directors without the prior approval of the general meeting of shareholders if suchrepurchase is deemed by the board of directors to be necessary to prevent serious and imminent harm to us or ifthe acquisition of shares has been made in view of the distribution thereof to employees.
Capital Reduction
Our articles of association provide that our issued share capital may be reduced, subject to the approval bythe general meeting of shareholders at the quorum and majority provided for the amendment of the articles ofassociation (See “—Voting Rights—Extraordinary General Meeting”).
General Meeting of Shareholders
Any regularly constituted general meeting of shareholders of Atento represents the entire body ofshareholders of the Company.
Each of our ordinary shares entitles the holder thereof to attend our general meeting of shareholders, eitherin person or by proxy, to address the general meeting of shareholders and to exercise voting rights, subject to theprovisions of our articles of association. Each ordinary share entitles the holder to one vote at a general meetingof shareholders. Our articles of association provide that our board of directors shall adopt all other regulationsand rules concerning the attendance to the general meeting, availability of access cards and proxy forms in orderto enable shareholders to exercise their right to vote as it deems fit.
When convening a general meeting of shareholders, we will publish two notices (which must be publishedat least eight days apart and, in the case of the second notice, at least eight days before the meeting) in theLuxembourg official gazette Mémorial C, Recueil des Sociétés et Associations, and in a Luxembourg newspaper.Our articles of association provide that if our shares are listed on a regulated market, the general meeting willalso be convened in accordance with the publicity requirements of such regulated market applicable to us.
A shareholder may participate in general meetings of shareholders by appointing another person as hisproxy, the appointment of which shall be in writing. Our articles of association also provide that, in the case ofshares held through the operator of a securities settlement system or depository, a holder of such shares wishingto attend a general meeting of shareholders should receive from such operator or depository a certificatecertifying the number of shares recorded in the relevant account on the record date. Such certificates as well asany proxy forms should be submitted to us no later than three (3) business days before the date of the generalmeeting unless our board of directors fixes a different period.
The annual ordinary general meeting of shareholders of Atento, is held at 10:00 a.m. (Central EuropeanTime) on May 31 of each year at the registered office of the Company or in any other place in Luxembourg asnotified to the shareholders. If that day is a legal or banking holiday in Luxembourg, the meeting will be held onthe next following business day.
Luxembourg law provides that the board of directors is obliged to convene a general meeting ofshareholders if shareholders representing, in the aggregate, 10% of the issued share capital so request in writingwith an indication of the meeting agenda. In such case, the general meeting of shareholders must be held withinone-month of the request. If the requested general meeting of shareholders is not held within one-month,shareholders representing, in the aggregate, 10% of the issued share capital may petition the competent presidentof the district court in Luxembourg to have a court appointee convene the meeting. Luxembourg law providesthat shareholders representing, in the aggregate, 10% of the issued share capital may request that additional itemsbe added to the agenda of a general meeting of shareholders. That request must be made by registered mail sentto the registered office of the Company at least five days before the general meeting of shareholders.
Voting Rights
Each share entitles the holder thereof to one vote at a general meeting of shareholders. Luxembourg lawdistinguishes general meetings of shareholders and extraordinary general meetings of shareholders. Extraordinarygeneral meetings of shareholders relate to proposed amendments to the articles of association and certain otherlimited matters.
93
Ordinary General Meeting
At an ordinary general meeting there is no quorum requirement and resolutions are adopted by a simplemajority of votes validly cast on such resolution is sufficient. Abstentions are not considered “votes”.
Extraordinary General Meeting
Extraordinary resolutions are required for any of the following matters, among others: (a) an increase ordecrease of the authorized or issued capital, (b) a limitation or exclusion of preemptive rights, (c) approval of astatutory merger or de-merger (scission), (d) dissolution and liquidation of Atento, and (e) any and allamendments to our articles of association. Pursuant to our articles of association, for any resolutions to beconsidered at an extraordinary general meeting of shareholders the quorum shall be at least one half (50%) of theissued share capital of the Company unless otherwise mandatorily required by law. If the said quorum is notpresent, a second meeting may be convened at which Luxembourg Corporate Law does not prescribe a quorum.Any extraordinary resolution shall be adopted at a quorate general meeting (save as otherwise provided bymandatory law) by at least a two thirds (2/3) majority of the votes validly cast on such resolution. Abstentions arenot considered “votes”.
Appointment and Removal of Directors
Members of our board of directors may be elected by simple majority of the votes cast at a general meetingof shareholders. Our articles of association provide that the directors shall be elected on a staggered basis, withone third (1/3) of the directors being elected each year, and each director elected for a period of three years. Anydirector may be removed with or without cause by resolution at a general meeting of shareholders adopted by asimple majority of votes validly cast at the meeting.
Our articles of association provide that in case of a vacancy the board of directors may fill such vacancy.The directors shall be eligible for re-election indefinitely.
Neither Luxembourg law nor our articles of association contain any restrictions as to the voting of ourshares by non-Luxembourg residents.
Amendment to the Articles of Association
Shareholder Approval Requirements
Luxembourg law requires an extraordinary general meeting of shareholders to resolve upon an amendmentof the articles of association to be made by extraordinary resolution. The agenda of the extraordinary generalmeeting of shareholders must indicate the proposed amendments to the articles of association. An extraordinarygeneral meeting of shareholders convened for the purposes of amending the articles of association must have aquorum of at least 50% of our issued share capital. If the said quorum is not present, a second meeting may beconvened at which Luxembourg Corporate Law does not prescribe a quorum. Irrespective of whether theproposed amendments will be subject to a vote at any duly convened extraordinary general shareholders’meeting, the amendment is subject to the approval of at least two-thirds (2/3) of the votes cast at suchextraordinary general meeting of shareholders.
Formalities
Any resolutions to amend our articles of association must be taken before a Luxembourg notary and suchamendments must be published in accordance with Luxembourg law.
Merger and De-Merger
A merger by absorption whereby one Luxembourg company after its dissolution without liquidationtransfers to another company all of its assets and liabilities in exchange for the issuance of shares in the acquiringcompany to the shareholders of the company being acquired, or a merger effected by transfer of assets to a newlyincorporated company, must, in principle, be approved at a general meeting by an extraordinary resolution of theLuxembourg company, and the general meeting must be held before a notary. Similarly a de-merger of aLuxembourg company is generally subject to the approval by an extraordinary general meeting of shareholders.
94
Dissolution and Liquidation
In the event of our dissolution, liquidation, or winding-up of the Company the assets remaining afterallowing for the payment of all liabilities of the Company will be paid out to the shareholders pro rata accordingto their respective shareholdings. The decisions to dissolve, liquidate, or wind-up require the approval by anextraordinary general meeting of shareholders of the Company to be held before a notary.
No Appraisal Rights
Neither Luxembourg law nor our articles of association provide for any appraisal rights of dissentingshareholders.
Dividend Distributions
Subject to Luxembourg law, if and when a dividend distribution is declared by the general meeting ofshareholders or the board of directors in the case of interim dividend distributions, each ordinary share is entitledto participate equally in such distribution of funds legally available for such purposes. Pursuant to our articles ofassociation, the general meeting of shareholders may approve a dividend distribution and the board of directorsmay declare an interim dividend distribution, to the extent permitted by Luxembourg law.
Declared and unpaid dividend distributions held by us for the account of the shareholders shall not bearinterest. Under Luxembourg law, claims for unpaid dividend distributions will lapse in our favor five years afterthe date such dividend distribution were declared.
Annual Accounts
Under Luxembourg law, the board of directors must prepare each year annual accounts, i.e., an inventory ofthe assets and liabilities of Atento together with a balance sheet and a profit and loss account each year. Ourboard of directors must also annually prepare consolidated accounts and management reports on the annualaccounts and consolidated accounts. The annual accounts, the consolidated accounts, the management report andthe auditor’s reports must be available for inspection by shareholders at our registered office at least 15 calendardays prior to the date of the annual ordinary general meeting of shareholders.
The annual accounts and the consolidated accounts, after approval by the annual ordinary general meetingof shareholders, will need to be filed with the Luxembourg Registry of Trade and Companies within sevenmonths of the close of the financial year.
Information Rights
Luxembourg law gives shareholders limited rights to inspect certain corporate records 15 calendar daysprior to the date of the annual ordinary general meeting of shareholders, including the annual accounts with thelist of directors and auditors, the consolidated accounts, the notes to the annual accounts and the consolidatedaccounts, a list of shareholders whose shares are not fully paid-up, the management reports and the auditor’sreport.
The annual accounts, the consolidated accounts, the auditor’s report and the management report are sent toregistered shareholders at the same time as the convening notice for the annual general meeting. In addition, anyregistered shareholder is entitled to receive a copy of such documents free of charge prior to the date of theannual ordinary general meeting of shareholders.
Under Luxembourg law, it is generally accepted that a shareholder has the right to receive responses at theshareholders’ general meeting to questions concerning items on the agenda of that general meeting ofshareholders, if such responses are necessary or useful for a shareholder to make an informed decisionconcerning such agenda item, unless a response to such questions could be detrimental to our interests.
Board of Directors
The management of Atento is vested in a board of directors. Our articles of association will provide that theboard must comprise at least three members.
The board meets as often as Company interests require.
95
A majority of the members of the board present or represented at a board meeting constitutes a quorum, andresolutions are adopted by the simple majority vote of the board members present or represented. The board mayalso take decisions by means of resolutions in writing signed by all directors. Each director has one vote.
The general shareholders’ meeting elects directors and decides their respective terms. Under Luxembourglaw, directors may be re-elected but the term of their office may not exceed 6 years. Our articles of associationwill provide that the directors shall be elected on a staggered basis, with one third (1/3) of the directors beingelected each year. The general shareholders’ meeting may dismiss one or more directors at any time, with orwithout cause by a simple majority of votes cast at a general meeting of shareholders. If the board has a vacancy,the remaining directors have the right to fill such vacancy on a temporary basis pursuant to the affirmative voteof a majority of the remaining directors. The term of a temporary director elected to fill a vacancy expires at theend of the term of office of the replaced director, provided, however, that the next general shareholders’ meetingshall be requested definitively to elect any temporary director.
Within the limits provided for by law, our board may delegate to one or more persons the daily managementof the Company and the authority to represent the Company.
No director shall, solely as a result of being a director, be prevented from contracting with us, either withregard to his tenure in any office or place of profit or as vendor, purchaser or in any other manner whatsoever,nor shall any contract in which any director is in any way interested be liable to be voided merely on account ofhis position as director, nor shall any director who is so interested be liable to account to us or the shareholdersfor any remuneration, profit or other benefit realized by the contract by reason of the director holding that officeor of the fiduciary relationship thereby established.
Any director having an interest in a transaction submitted for approval to the board may not participate inthe deliberations and vote thereon, unless the transaction is not in the ordinary course of the Company’s businessand that conflicts with the Company’s interest, in which case the director shall be obliged to advise the boardthereof and to cause a record of his statement to be included in the minutes of the meeting. He may not take partin these deliberations nor vote on such a transaction. At the next general meeting, before any other resolution isput to a vote, a special report shall be made on any transactions in which any of the directors may have had aninterest that conflicts with our interest.
No shareholding qualification for directors is required.
Our articles of association provide that directors and officers, past and present, are entitled toindemnification from us to the fullest extent permitted by Luxemburg law against liability and all expensesreasonably incurred or paid by him in connection with any claim, action, suit or proceeding in which he isinvolved by virtue of his being or having been a director or officer and against amounts paid or incurred by himin the settlement thereof. We may purchase and maintain insurance for any director or other officer against anysuch liability.
No indemnification is provided against any liability to us or our shareholders (i) by reason of willfulmisfeasance, bad faith, gross negligence or reckless disregard of the duties of a director or officer; (ii) withrespect to any matter as to which any director or officer shall have been finally adjudicated to have acted in badfaith and not in the interest of the Company; or (iii) in the event of a settlement, unless approved by a court or theboard of directors.
Transfer Agent and Registrar
The transfer agent and registrar for our ordinary shares is American Stock Transfer & Trust Company, LLC.Its address is 6201 15th Avenue, Brooklyn, New York 11219.
C. Material Contracts
We are party to a Master Service Agreement with Telefónica. For a description of the MSA see Item 4“Information on the Company—Business Overview—Our Clients—Telefónica Group Master ServiceAgreement” as well as the full text of the agreement, a copy of which is attached hereto as Exhibit 4.5.
96
D. Exchange Controls
There are no legislative or other legal provisions currently in force in Luxembourg or arising under Atento’sArticles of Association that restrict the payment of dividends to holders of Atento shares by reason of suchholders not being resident in Luxembourg, except for regulations restricting the remittance of dividends and otherpayments in compliance with United Nations and EU sanctions. There are no limitations, either under the laws ofLuxembourg or in the Articles of Association, on the right of non-Luxembourg nationals to hold or vote Atentoshares.
E. Taxation
Luxembourg Tax Considerations
The following is a summary discussion of the material Luxembourg tax considerations of the acquisition,ownership and disposition of your ordinary shares that may be applicable to you if you acquire our ordinaryshares.
It is not intended to be, nor should it be construed to be, legal or tax advice. This discussion is based onLuxembourg laws and regulations as they stand on the date of this Annual Report and is subject to any change inlaw or regulations or changes in interpretation or application thereof (and which may possibly have a retroactiveeffect). Prospective investors should therefore consult their own professional advisers as to the effects of state,local or foreign laws and regulations, including Luxembourg tax law and regulations, to which they may besubject.
As used herein, a “Luxembourg individual” means an individual resident in Luxembourg who is subject topersonal income tax (impôt sur le revenu) on his or her worldwide income from Luxembourg or foreign sources,and a “Luxembourg corporate holder” means a company (that is, a fully taxable collectivity within the meaningof Article 159 of the Luxembourg Income Tax Law) resident in Luxembourg subject to corporate income tax(impôt sur le revenu des collectivités) on its worldwide income from Luxembourg or foreign sources. Forpurposes of this summary, Luxembourg individuals and Luxembourg corporate holders are collectively referredto as “Luxembourg Holders.” A “non-Luxembourg Holder” means any investor in shares of the Company otherthan a Luxembourg Holder.
Tax Regime Applicable to Capital Gains Realized Upon Disposal of Shares
Luxembourg Holders
Luxembourg individual holders. For Luxembourg individuals holding (together, directly or indirectly, withhis or her spouse or civil partner or underage children) 10% or less of the share capital of the Company, capitalgains will only be taxable if they are realized on a sale of shares, which takes place before their acquisition orwithin the first six months following their acquisition. The capital gain or liquidation proceeds will be taxed atprogressive income tax rates (ranging from 0 to 43.6% in 2015 plus a 0.5% temporary tax on the gains).
For Luxembourg individuals holding (together with his/her spouse or civil partner and underage children)directly or indirectly more than 10% of the capital of the Company, capital gains will be taxable as follows:
• within six months from the acquisition, the capital gain or liquidation proceeds will be taxed atprogressive income tax rates (currently ranging from 0 to 43.6% plus a 0.5% temporary tax on thegains);
• after six months the capital gain or the liquidation proceeds will be taxed at a reduced tax rate (i.e. halfof the investor’s global tax rate). An allowance of €50,000 (doubled for taxpayers filing jointly),available during a ten-year period, is applicable.
Luxembourg corporate holders. Capital gains realized upon the disposal of shares by a Luxembourgcorporate holder will in principle be subject to corporate income tax and municipal business tax. The combinedapplicable rate (including an unemployment fund contribution) is 29.22% for the fiscal year ending 2015 for aLuxembourg corporate holder established in Luxembourg-City. An exemption from such taxes may be availableto the Luxembourg corporate holder pursuant to article 166 of the Luxembourg Income Tax law subject to thefulfillment of the conditions set forth therein. The scope of the capital gains exemption may be limited in thecases provided by the Grand Ducal Decree of December 21, 2001.
97
Non-Luxembourg Holders
Subject to any applicable tax treaty, an individual non-Luxembourg Holder of shares (who has nopermanent establishment or permanent representative in Luxembourg to which the shares would be attributable)will only be subject to Luxembourg taxation on capital gains arising upon disposal of such shares if such holderhas (together with his or her spouse or civil partner and underage children) directly or indirectly held more than10% of the capital of the Company, at any time during the five years preceding the disposal, and either (i) suchholder has been a resident of Luxembourg for tax purposes for at least 15 years and has become a non-residentwithin the five years preceding the realization of the gain, subject to any applicable tax treaty, or (ii) the disposalof shares occurs within six months from their acquisition (or prior to their actual acquisition). If we and a U.S.relevant holder are eligible for the benefits of the Convention between the Government of the Grand Duchy ofLuxembourg and the Government of the United States for the Avoidance of Double Taxation and the Preventionof Fiscal Evasion with Respect to Taxes on Income and Capital (the “Luxembourg-U.S. Treaty”), such U.S.relevant holder generally should not be subject to Luxembourg tax on the gain from the disposal of such sharesunless such gain is attributable to a permanent establishment or permanent representative of such U.S. relevantholder in Luxembourg. Subject to any restrictions imposed by the substantially and regularly traded clause in thelimitation on benefits article of the Luxembourg-U.S. treaty, we expect to be eligible for the benefits of theLuxembourg-U.S. Treaty.
A corporate non-Luxembourg Holder (that is, a collectivité within the meaning of Article 159 of theLuxembourg Income Tax Law), which has a permanent establishment or a permanent representative inLuxembourg to which shares would be attributable, will bear corporate income tax and municipal business tax ona gain realized on a disposal of such shares as set forth above for a Luxembourg corporate holder. In the sameway, gains realized on the sale of the shares through a permanent establishment or a permanent representativemay benefit from the full exemption provided for by Article 166 of the Luxembourg Income Tax Law and by theGrand Ducal Decree of December 21, 2001 subject in each case to fulfillment of the conditions set out therein.
A corporate non-Luxembourg Holder, which has no permanent establishment or permanent representative inLuxembourg to which the shares would be attributable will not be subject to any Luxembourg tax on a gainrealized on a disposal of such shares unless such holder holds, directly or through tax transparent entities, morethan 10% of the share capital of the Company, and the disposal of shares occurs within six months from theiracquisition (or prior to their actual acquisition), subject to any applicable tax treaty. If we and a U.S. corporateholder without a permanent establishment in Luxembourg are eligible for the benefits of the Luxembourg-U.S.Treaty, such U.S. corporate holder generally should not be subject to Luxembourg tax on the gain from thedisposal of such shares.
Tax Regime Applicable to Distributions
Withholding Tax. Dividend distributions by the Company are subject to a withholding tax of 15%.Distributions by the Company sourced from a reduction of capital as defined in Article 97 (3) of the LuxembourgIncome Tax Law including, among others, share premium should not be subject to withholding tax provided nonewly accumulated fiscal profits, or profit reserves carried forward are recognized by the Company on astandalone basis. We or the applicable paying agent will withhold on a distribution if required by applicable law.
Where a withholding needs to be applied, the rate of the withholding tax may be reduced pursuant to thedouble tax treaty existing between Luxembourg and the country of residence of the relevant holder, subject to thefulfillment of the conditions set forth therein. If we and a U.S. relevant holder are eligible for the benefits of theLuxembourg-U.S. Treaty, the rate of withholding on distributions generally is 15%, or 5% if the U.S. relevantholder is a beneficial owner that owns at least 10% of our voting stock.
No withholding tax applies if the distribution is made to (i) a Luxembourg resident corporate holder (that is,a fully taxable collectivité within the meaning of Article 159 of the Luxembourg Income Tax Law), (ii) acorporation which is resident of a Member State of the European Union and is referred to by article 2 of theCouncil Directive 2011/96/EU of November 30, 2011 on the common system of taxation applicable in the caseof parent companies and subsidiaries of different member states, (iii) a corporation or a cooperative resident inNorway, Iceland or Liechtenstein and subject to a tax comparable to corporate income tax as provided byLuxembourg Income Tax Law, (iv) a corporation resident in Switzerland which is subject to corporate incometax in Switzerland without benefiting from an exemption, (v) a corporation subject to a tax comparable tocorporate income tax as provided by Luxembourg Income Tax Law which is resident in a country that hasconcluded a tax treaty with Luxembourg and (vi) a Luxembourg permanent establishment of one of the above-mentioned categories, provided each time that at the date of payment, the holder has held or commits itself to
98
continue to hold directly or through a tax transparent vehicle, during an uninterrupted period of at least twelvemonths, shares representing at least 10% of the share capital of the Company or which had an acquisition price ofat least €1,200,000.
Non-Luxembourg Holders
Non-Luxembourg holders of the shares who have neither a permanent establishment nor a permanentrepresentative in Luxembourg to which the shares would be attributable are not liable for any Luxembourg tax ondividends paid on the shares, other than a potential withholding tax as described above.
Net Wealth Tax
Luxembourg Holders. Luxembourg net wealth tax will not be levied on a Luxembourg Holder with respectto the shares held unless the Luxembourg Holder is an entity subject to net wealth tax in Luxembourg.
Net wealth tax is levied annually at the rate of 0.5% on the net wealth of enterprises resident inLuxembourg, as determined for net wealth tax purposes. The shares may be exempt from net wealth tax subjectto the conditions set forth by Article 60 of the Law of October 16, 1934 on the valuation of assets(Bewertungsgesetz), as amended.
Non-Luxembourg Holders
Luxembourg net wealth tax will not be levied on a non-Luxembourg Holder with respect to the shares heldunless the shares are attributable to an enterprise or part thereof which is carried on through a permanentestablishment or a permanent representative in Luxembourg.
Stamp and Registration Taxes
No registration tax or stamp duty will be payable by a holder of shares in Luxembourg solely upon thedisposal of shares or by sale or exchange.
F. Dividends and Paying Agents
Not applicable.
G. Statement by Experts
Not applicable.
H. Documents on Display
The Company makes its filings in electronic form under the EDGAR filing system of the U.S. Securities andExchange Commission. Its filings are available through the EDGAR system at www.sec.gov. The Company’sfilings are also available to the public through the Internet at Atento’s website at www.atento.com. Such filingsand other information on its website are not incorporated by reference in this Annual Report. Interested partiesmay request a copy of this filing, and any other report, at no cost, by writing to the Company at the followingaddress: C/ Santiago de Compostela, 94 28035 Madrid—Spain or calling +34 917 407 440 or by e-mail [email protected]. In compliance with New York Stock Exchange Corporate GovernanceRule 303A.11, the Company provides on its website a summary of the differences between its corporategovernance practices and those of U.S. domestic companies under the New York Stock Exchange listingstandards.
I. Subsidiary Information
Refer to Note 3 to the Consolidated Financial Statements.
99

ITEM 11. QUANTITATIVE AND QUALITATIVE DISCLOSURES ABOUT MARKET RISK
Financial risk factors
The Atento Group’s activities expose it to various types of financial risk: market risk (including interest raterisk, currency risk and country risk), credit risk and liquidity risk. The Atento Group’s global risk managementpolicy aims to minimize the potential adverse effects of these risks on the Atento Group’s financial returns. TheAtento Group also uses derivative financial instruments to hedge certain risk exposures.
a) Market risk
Interest rate risk in respect of cash flow and fair value
Interest rate risk arises mainly as a result of changes in interest rates which affect: (i) finance costs of debt,bearing interest at variable rates (or debt with short term maturity which is expected to be renewed), as a result offluctuations in interest rates, and (ii) the value of non-current liabilities that bear interest at fixed rates.
At December 31, 2014 48.0% of financial debt with third parties (excluding CVIs and the effect of financialderivative instruments) bore interests at variable rates, while at December 31, 2013 this amount was 43.2%.
The Atento Group’s finance costs are exposed to fluctuations in interest rates. In 2013 and 2014, the rate towhich the Atento Group had the greatest exposure was the Brazilian CDI rate.
As of December 31, 2014, the estimated fair value of the interest rate hedging instruments related to theBrazilian Debentures totaled $10.9 million, which was recorded as a financial asset. Based on our totalindebtedness of $653.3 million as of December 31, 2014 and not taking into account the impact of our interestrate hedging instruments referred to above, a 1% change in interest rates would impact our net interest expenseby $3.2 million.
As of December 31, 2013, the estimated fair value of the interest rate hedging instruments related to theBrazilian Debentures totaled $15.6 million, which was recorded as a financial asset. Based on our totalindebtedness of $1,370.8 million as of December 31, 2013 and not taking into account the impact of our interestrate hedging instruments referred to above, a 1% change in interest rates would impact our net interest expenseby $3.8 million.
The Atento Group’s policy is to monitor exposure to this risk. In that regard, as described in Note 14, theAtento Group has arranged interest rate swaps that have the economic effect of converting floating-rateborrowing into loans at fixed interest rates.
The table below shows the impact on these value of derivatives of a +/-10 basis points variation in the CDIinterest rate curves.
Thousands ofU.S. dollars
Thousands ofU.S. dollars
INTEREST RATE 12/31/2013 12/31/2014
FAIR VALUE . . . . . . . . . . . . . . . . . . . . . . . . . . . . . . 15,611 10,9160.10% . . . . . . . . . . . . . . . . . . . . . . . . . . . . . . . . . . . . . 14,817 10,434-0.10% . . . . . . . . . . . . . . . . . . . . . . . . . . . . . . . . . . . . 16,407 11,399
Also, as described in Note 14, the Atento Group has cross-currency swap hedging instruments with theeconomic effect of covering cash flow related to the Senior Secured Notes issued in U.S. dollars.
Additionally, the Atento Group holds derivatives which are not considered as hedging instruments related tothe cash flow generated in Mexican Pesos, Colombian Pesos and Peruvian Nuevos Soles.
The table below shows the impact on the value of the rest of derivatives of a +/-10 basis points variation inthe interest rate curve.
Thousands ofU.S. dollars
Thousands ofU.S. dollars
CROSS CURRENCY 12/31/2013 12/31/2014
FAIR VALUE . . . . . . . . . . . . . . . . . . . . . . . . . . . . . . (13,277) 20,1550.10% . . . . . . . . . . . . . . . . . . . . . . . . . . . . . . . . . . . . . (14,719) 18,939-0.10% . . . . . . . . . . . . . . . . . . . . . . . . . . . . . . . . . . . . (11,658) 21,487
100
Foreign currency risk
As at December 31, 2013 and 2014, the Atento Group entities held several borrowing and cash equivalentsin currencies other than their functional currency.
The most significant exposure to foreign currency risk is derived from the U.S. dollar denominated SeniorSecured Notes issued by the subsidiary Atento Luxco 1, S.A. in 2013 whose functional currency is the Euro. Asindicated above, the Atento Group has cross-currency swap hedging instruments with the economic effect ofcovering cash flow related to the Senior Secured Notes issued in U.S. dollars.
Sensitivity analysis of foreign currency risk
The Atento Group has reasonable control over its foreign currency risks, as its financial assets (cash andcash equivalents) and financial liabilities (Senior Secured Notes, Finance Leases and CVIs) denominated incurrencies other than their functional are adequately matched. We performed a sensitivity analysis based on theoutstanding volume of financial assets and liabilities and we applied a 10% appreciation of each asset/liabilitycurrency versus the functional currency which highlights the limited impact that such event would have on theincome statement is U.S. dollars. A sensitivity analysis of foreign currency risk for the Atento Group’s isprovided in Note 4.
Country risk
To manage or mitigate country risk, the Atento Group repatriates the funds generated in the Americas andBrazil that are not required to pursue new, profitable business opportunities in the region. The capital structure ofthe Atento Group comprises two separate ring-fenced financings: (i) the Brazilian Debentures denominated inBrazilian Reais and (ii) the USD 300 million 7.375% Senior Secured Notes due 2020, together with the€50 million ($60.7 million) Revolving Credit Facility. The objective of combining a Brazilian term loan with aUSD bond is to create a natural hedge for the interest payments on the Brazilian loan, which are serviced withcash flow from Atento Brazil, denominated in Brazilian Reais.
Argentinian subsidiary sit outside of these two separate ring-fenced financings, and as a result, we do notrely on cash flow from these operations to serve our Company’s debt commitments.
b) Credit risk
The Atento Group seeks to conduct all of its business with reputable national and international companiesand institutions of established solvency in their countries of origin, so as to minimize credit risk. As a result ofthis policy, the Atento Group has no material adjustments to make to its trade accounts.
Accordingly, the Atento Group’s commercial credit risk management approach is based on continuousmonitoring of the risks assumed and the financial resources necessary to manage the Group’s various units, inorder to optimize the risk-reward relationship in the development and implementation of business plans in thecourse of their regular business.
Credit risk arising from cash and cash equivalents is managed by placing cash surpluses in high quality andhighly liquid money market assets. These placements are regulated by a master agreement revised annually onthe basis of the conditions prevailing in the markets and the countries where Atento operates. The masteragreement establishes: (i) the maximum amounts to be invested per counterparty, based on their ratings (long andshort term debt ratings); (ii) the maximum period of the investment; and (iii) the instruments in which thesurpluses may be invested.
The Atento Group’s maximum exposure to credit risk is primarily limited to the carrying amounts of itsfinancial assets. The Atento Group holds no guarantees as collection insurance. The Atento Group carries outsignificant transactions with the Telefónica Group. At December 31, 2014 the balance of accounts receivablewith Telefónica Group amounted to $237.0 million ($302.2 million in 2013).
c) Liquidity risk
The Atento Group seeks to match its debt maturity schedule to its capacity to generate cash flow to meet thepayments falling due, factoring in a comfortable cushion. In practice, this has meant that the Atento Group’saverage debt maturity must be longer than the length of time required paying its debt (assuming that internalprojections are met). A maturity schedule for the Atento Group’s financial liabilities is provided in Note 16.
101
Capital Management
The Atento Group’s Finance Department, which is in charge of the capital management, takes variousfactors into consideration when determining the Group’s capital structure.
The Atento Group’s capital management goal is to determine the financial resources necessary both tocontinue its recurring activities and to maintain a capital structure that optimizes own and borrowed funds.
The Atento Group sets an optimal debt level in order to maintain a flexible and comfortable medium termborrowing structure, in order to be able to carry out its routine activities under normal conditions and alsoaddress new opportunities for growth. Debt levels are kept in line with forecast future cash flows and withquantitative restrictions imposed under financing contracts.
In addition to these general guidelines, other considerations and specifics are taken into account whendetermining the Atento Group’s financial structure, such as country risk in the broadest sense, tax efficiency andvolatility in cash flow generation.
Among the restrictions imposed under financing arrangements, the debentures contract lays out certaingeneral obligations and disclosures in respect of the lending institutions. Specifically, the borrower (BC BrazilcoParticipações, S.A., which has now merged with Atento Brasil, S.A.) must comply with the quarterly netfinancial debt/EBITDA ratio set out in the contract terms.
The contract also sets out additional restrictions, including limitations on dividends, payments anddistributions to shareholders and capacity to incur additional debt.
The Super Senior Revolving Credit Facility carries no financial covenant obligations regarding debt levels.However, the credit facility does impose limitations on the use of the funds, linked to compliance with a debt ratio.The contract also includes other restrictions, including: limitations on the distribution of dividends, payments ordistributions to shareholders, the capacity to incur additional debt, and on investments and disposal of assets.
The Senior Secured Notes issued in 2013 carry no limitation covenant obligations regarding debt levels.However, the Notes do impose limitations on the distributions on dividends, payments or distributions to theshareholders, the incurring of additional debt, and on investments and disposals of assets.
As at the date of these consolidated financial statements, the Atento Group was in compliance with allrestrictions established in the aforementioned financing contracts, and does not foresee any future non-compliance.To that end, the Atento Group regularly monitors figures for net financial debt with third parties and EBITDA.
Net debt with third parties at December 31, 2013 and 2014 is as follow:
As of December 31,
($ in millions) 2012 2013 2014
Debt:7.375% Senior Secured Notes due 2020 — 297.7 300.3Brazilian Debentures 443.0 345.9 245.9Vendor Loan Note(1) 145.1 151.7 —Contingent Value Instrument 52.3 43.4 36.4Preferred Equity Certificates 471.6 519.6 —Finance lease payables 8.7 11.9 9.0Other borrowings 200.1 0.6 61.7
Total Debt 1,320.8 1,370.8 653.3
Preferred Equity Certificates (471.6) (519.6) —
Total Debt excluding PECs 849.2 851.2 653.3
Cash and cash equivalents (200.3) (213.5) (211.4)Short term financial investments (28.7) — (26.9)
Net Debt with third parties (non-GAAP) (unaudited)(2) 620.2 637.7 415.0
Adjusted EBITDA (non-GAAP) for the period(unaudited) 268.1 295.1 306.4
Net Debt with third parties/Adjusted EBITDA(non-GAAP) (unaudited) 2.3x 2.2x 1.4x
102
(1) Reflects the prepayment to Telefónica of the entire indebtedness under the Vendor Loan Note.(2) In considering our financial condition, our management analyzes net debt with third parties, which is
defined as total debt less cash, cash equivalents, and short-term financial investments. Net debt is not ameasure defined by IFRS and it has limitations as an analytical tool. Net debt is neither a measure definedby or presented in accordance with IFRS nor a measure of financial performance, and should not beconsidered in isolation or as an alternative financial measure determined in accordance with IFRS. Net debtis not necessarily comparable to similarly titled measures used by other companies.
Risk Oversight
Our board of directors is currently responsible for overseeing our risk management process. The board ofdirectors focuses on our general risk management strategy and the most significant risks facing us, and ensuresthat appropriate risk mitigation strategies are implemented by management. The board of directors is alsoapprised of particular risk management matters in connection with its general oversight and approval of corporatematters and significant transactions.
Following the completion of the IPO, our board of directors delegated to the Audit Committee oversight ofour risk management process. Our other board committees also consider and address the risks as they performtheir respective committee responsibilities. All committees report to the full board of directors as appropriate,including when a matter rises to the level of a material or enterprise level risk.
Our management is responsible for day-to-day risk management. This oversight includes identifying,evaluating, and addressing potential risks that may exist at the enterprise, strategic, financial, operational,compliance and reporting levels.
ITEM 12. DESCRIPTION OF SECURITIES OTHER THAN EQUITY SECURITIES
A. Debt Securities
Not applicable.
B. Warrants and Rights
Not applicable.
C. Other Securities
Not applicable.
D. American Depositary Shares
Not applicable.
103

PART II
ITEM 13. DEFAULTS, DIVIDEND ARREARAGES AND DELINQUENCIES
Not applicable.
ITEM 14. MATERIAL MODIFICATIONS TO THE RIGHTS OF SECURITY HOLDERS AND USE OFPROCEEDS
Not applicable.
ITEM 15. CONTROLS AND PROCEDURES
A. Disclosure Controls and Procedures
The Company has established disclosure controls and procedures to ensure that the information required tobe disclosed by the Company in the reports that it files or submits under the Securities Exchange Act of 1934 isrecorded, processed, summarized and reported within the time periods specified in SEC rules and forms. Andsuch information is accumulated and made known to the officers who certify the Company’s financial reportsand to other members of senior management and the Board of Directors as appropriate to allow timely decisionsregarding required disclosure.
Accordingly, our Chief Executive Officer and our Chief Financial Officer believe that the financialstatements included in this report fairly present in all material respects our financial condition, results ofoperations and cash flows for the periods presented.
B. Management’s Annual Report on Internal Control over Financial Reporting
This annual report does not include a report of management’s assessment regarding internal control overfinancial reporting due to a transition period established by rules of the SEC for newly public companies.
C. Attestation Report of the Registered Public Accounting Firm
This annual report does not include an attestation report of the Company’s registered public accounting firmdue to a transition period established by rules of the SEC for newly public companies.
D. Changes in Internal Control over Financial Reporting
There have been no changes in our internal control over financial reporting that occurred during the periodcovered by this annual report that has materially affected, or is reasonably likely to materially affect, our internalcontrol over financial reporting.
ITEM 15T. CONTROLS AND PROCEDURES
Not applicable.
ITEM 16. [RESERVED]
ITEM 16A. AUDIT COMMITTEE FINANCIAL EXPERT
Our Audit Committee consists of Francisco Tosta Valim Filho, Devin O’Reilly, Thomas Ianotti and MelissaBethell. Our board of directors has determined that Francisco Tosta Valim Filho qualifies as an “audit committeefinancial expert,” as such term is defined in Item 407(d)(5)(ii) of Regulation S-K. Our board of directors hasadopted a written charter for the Audit Committee, which is available on our corporate website atwww.atento.com. Our website is not part of this Annual Report.
ITEM 16B. CODE OF ETHICS
We have adopted a Code of Ethic applicable to all of our directors, officers and employees, including ourprincipal executive officer, principal financial officer and accounting officers, and all persons performing similarfunctions. A copy of the Code is available on our corporate website at www.atento.com. The Code of Ethic as ofDecember 31, 2014 is set forth in Exhibit 11.1 to this Annual Report.
104
ITEM 16C. PRINCIPAL ACCOUNTANT FEES AND SERVICES
The fees to the various member firms of the Ernst & Young international organization, of which Ernst &Young, S.L., auditors of the Atento Group in 2012, 2013 and 2014, amounted to $1.3 million, $1.8 million and3.5 million, respectively.
Details of these amounts are as follows:
Thousands of U.S. dollars
2012 2013 2014
Audit fees(*)
Audit services 1,320 1,836 3,534
Total 1,320 1,836 3,534
(*) Audit services: services included in this heading are mainly the audit of the annual and interim financialstatements and the review of the 20-F report to be filed with the Security and Exchange Commission (SEC)and the audit services related to the IPO. These fees include amounts in respect of fully consolidated AtentoGroup companies.
ITEM 16D. EXEMPTIONS FROM THE LISTING STANDARDS FOR AUDIT COMMITTEE
Not applicable.
ITEM 16E. PURCHASES OF EQUITY SECURITIES BY THE ISSUER AND AFFILIATEDPURCHASERS
Not applicable.
ITEM 16F. CHANGE IN REGISTRANT’S CERTIFYING ACCOUNTANT
Not applicable.
ITEM 16G. CORPORATE GOVERNANCE
Our ordinary shares are listed on the NYSE. For purposes of NYSE rules, so long as we are a foreign privateissuer, we are eligible to take advantage of certain exemptions from NYSE corporate governance requirementsprovided in the NYSE rules. We are required to disclose the significant ways in which our corporate governancepractices differ from those that apply to U.S. companies under NYSE listing standards. Set forth below is asummary of these differences:
Director Independence—The NYSE rules require domestic companies to have a majority of independentdirectors, but as a foreign private issuer we are exempt from this requirement. Our board of directors consists ofeight members and we believe that two of our board members satisfy the “independence” requirements of theNYSE rules.
Board Committees—The NYSE rules require domestic companies to have a compensation committee and anominating and corporate governance committee composed entirely of independent directors, but as a foreignprivate issuer we are exempt from these requirements. We have a compensation committee comprised of threemembers and we do not believe that any of the compensation committee members satisfy the “independence”requirements of the NYSE rules. We do not have a nominating and corporate governance committee. In addition,we are availing ourselves of certain exemptions from audit committee independence requirements for newlypublic companies.
ITEM 16H. MINE SAFETY DISCLOSURE
Not applicable.
105
PART III
ITEM 17. FINANCIAL STATEMENTS
The company has responded to Item 18 in lieu of this item.
ITEM 18. FINANCIAL STATEMENTS
Consolidated Financial Statements of Atento S.A. are filed as part of this annual report; see pages F-1 toF-81.
Combined Carve-Out Statements Financial Statements of Atalaya Luxco Midco (Predecessor) are filed aspart of this annual report; see pages F-82 to F-135.
ITEM 19. EXHIBITS
(a) Index to Consolidated Financial Statements
Page
Financial Statements of Atento S.A.Report of Independent Registered Public Accounting Firm . . . . . . . . . . . . . . . . . . . . . . . . . . . . . . . . . . . . . . F-1Consolidated Statements of Financial Position as at December 31, 2013 and 2014 . . . . . . . . . . . . . . . . . . . . F-2Consolidated Income Statements for the one month period ended December 31, 2012 and the years ended
December 31, 2013 and 2014 . . . . . . . . . . . . . . . . . . . . . . . . . . . . . . . . . . . . . . . . . . . . . . . . . . . . . . . . . . . F-4Consolidated Statements of Comprehensive Income for the one month period ended December 31, 2012
and the years ended December 31, 2013 and 2014 . . . . . . . . . . . . . . . . . . . . . . . . . . . . . . . . . . . . . . . . . . . F-5Consolidated Statements of Changes in Equity as at December 31, 2012, 2013 and 2014 . . . . . . . . . . . . . . F-6Consolidated Statements of Cash Flow for the one month period ended December 31, 2012 and the years
ended December 31, 2013 and 2014 . . . . . . . . . . . . . . . . . . . . . . . . . . . . . . . . . . . . . . . . . . . . . . . . . . . . . . F-7Notes to the Consolidated Financial Statements for the one month period ended December 31, 2012 and
the years ended December 31, 2013 and 2014 . . . . . . . . . . . . . . . . . . . . . . . . . . . . . . . . . . . . . . . . . . . . . . F-8
Financial Statements of Atalaya Luxco Midco (Predecessor)Report of Independent Registered Public Accounting Firm . . . . . . . . . . . . . . . . . . . . . . . . . . . . . . . . . . . . . . F-88Combined Carve-Out Statements of Financial Position as of January 1, 2011, December 31, 2011 and
November 30, 2012 . . . . . . . . . . . . . . . . . . . . . . . . . . . . . . . . . . . . . . . . . . . . . . . . . . . . . . . . . . . . . . . . . . . F-89Combined Carve-Out Income Statements for the year ended December 31, 2011 and January 1, 2012 to
November 30, 2012 . . . . . . . . . . . . . . . . . . . . . . . . . . . . . . . . . . . . . . . . . . . . . . . . . . . . . . . . . . . . . . . . . . . F-90Combined Carve-Out Statements of Comprehensive Income for the year ended December 31, 2011 and
January 1, 2012 to November 30, 2012 . . . . . . . . . . . . . . . . . . . . . . . . . . . . . . . . . . . . . . . . . . . . . . . . . . . . F-91Combined Carve-Out Statements of Changes in Invested Equity as of December 31, 2010, December 31,
2011 and November 30, 2012 . . . . . . . . . . . . . . . . . . . . . . . . . . . . . . . . . . . . . . . . . . . . . . . . . . . . . . . . . . . F-92Combined Carve-Out Statements of Cash Flows as of December 31, 2011 and November 30, 2012 . . . . . . F-93Notes to the Combined Carve-Out Financial Statements . . . . . . . . . . . . . . . . . . . . . . . . . . . . . . . . . . . . . . . . F-94
106
(b) List of Exhibits
ExhibitNumber Description
1.1 Amended and Restated Articles of Association of Atento S.A., incorporated by reference toExhibit 4.1 to Atento S.A.’s Registration Statement on Form S-8 (File No. 333-203101), filed onMarch 30, 2015.
2.1 Indenture, dated as of January 29, 2013, by and among BC Luxco 1 S.A., the guarantors partythereto, Citibank, N.A., London Branch as Trustee and Principal Paying Agent, Citibank GlobalMarkets Deutschland AG, as Registrar and Citibank, N.A., London Branch, as collateral agent,incorporated by reference to Exhibit 4.1 to Atento S.A.’s Registration Statement on Form F-1 (FileNo. 333-195611), initially filed on May 1, 2014.
2.2 Form of Senior Secured Note (included in Exhibit 2.1 hereto).
2.3 Supplemental Indenture, dated as of March 2, 2015, to Indenture dated as of January 29, 2013.*
4.1 Transaction Services Agreement between Spain Holdco and Bain Capital Partners, LLC, datedDecember 12, 2012, incorporated by reference to Exhibit 10.1 to Atento S.A.’s RegistrationStatement on Form F-1 (File No. 333-195611), initially filed on May 1, 2014.
4.2 Management Services Agreement between Spain Holdco, Mexico Holdco, Spain Holdco 2, SpainHoldco 5 and Spain Holdco 6, dated December 12, 2012, incorporated by reference to Exhibit 10.3 toAtento S.A.’s Registration Statement on Form F-1 (File No. 333-195611), initially filed on May 1,2014.
4.3 Subscription and Securityholder’s Agreement, dated as of December 4, 2012, by and among BCLuxco Topco, BC Luxco and each of the investors party thereto, incorporated by reference toExhibit 10.4 to Atento S.A.’s Registration Statement on Form F-1 (File No. 333-195611), initiallyfiled on May 1, 2014.
4.4 Subscription and Securityholder’s Agreement, dated as of December 4, 2012, by and among BCLuxco Topco, BC Luxco and each of the investors party thereto, incorporated by reference toExhibit 10.5 to Atento S.A.’s Registration Statement on Form F-1 (File No. 333-195611), initiallyfiled on May 1, 2014.
4.5 Master Services Agreement between BC Luxco 1 and Telefónica S.A., dated as of December 11,2012, as amended by Amendment Agreement No. 1 thereto dated as of May 16, 2014, incorporatedby reference to Exhibit 10.6 to Atento S.A.’s Registration Statement on Form F-1 (FileNo. 333-195611), initially filed on May 1, 2014.**
4.6 Super Senior Revolving Credit Facilities Agreement, dated as of January 28, 2013, among BC Luxco1 S.A., the entities and guarantors named therein and the arrangers and lenders party thereto,incorporated by reference to Exhibit 10.8 to Atento S.A.’s Registration Statement on Form F-1 (FileNo. 333-195611), initially filed on May 1, 2014.
4.7 Accession Deed, dated as of February 23, 2015, among Atento S.A., Atalaya Luxco Midco S.à.r.l.and Atento Luxco 1 S.A, relating to that Super Senior Revolving Credit Agreement, dated as ofJanuary 28, 2013.*
4.8 Instrumento Particular de Escritura (Brazilian debentures), incorporated by reference to Exhibit 10.9to Atento S.A.’s Registration Statement on Form F-1 (File No. 333-195611), initially filed on May 1,2014.
4.9 2014 Omnibus Incentive Plan, incorporated by reference to Exhibit 4.2 to Atento S.A.’s RegistrationStatement on Form S-8 (File No. 333-203101), filed on March 30, 2015.
4.10 Form of Performance Restricted Stock Unit Agreement. , incorporated by reference to Exhibit 4.1 toAtento S.A.’s Registration Statement on Form F-1 (File No. 333-195611), initially filed on May 1,2014, incorporated by reference to Exhibit 10.11 to Atento S.A.’s Registration Statement onForm F-1 (File No. 333-195611), initially filed on May 1, 2014.
4.11 Form of Time Restricted Stock Unit Agreement, incorporated by reference to Exhibit 10.12 to AtentoS.A.’s Registration Statement on Form F-1 (File No. 333-195611), initially filed on May 1, 2014.
4.12 Registration Rights Agreement.*
4.13 Consulting Services and Information Rights Agreement.*
107
ExhibitNumber Description
4.14 Form of Directors and Officers Indemnification Agreement, incorporated by reference toExhibit 10.15 to Atento S.A.’s Registration Statement on Form F-1 (File No. 333-195611), initiallyfiled on May 1, 2014.
8.1 List of subsidiaries of Atento S.A.*
11.1 Code of ethics*
12.1 Rule 13a-14(a)/15d-14(a) Certification of Chief Executive Officer.*
12.2 Rule 13a-14(a)/15d-14(a) Certification of Chief Financial Officer.*
13.1 Certification of Chief Executive Officer pursuant to 18 U.S.C. Section 1350, as adopted pursuant toSection 906 of the Sarbanes-Oxley Act of 2002.*
13.2 Certification of Chief Financial Officer pursuant to 18 U.S.C. Section 1350, as adopted pursuant toSection 906 of the Sarbanes-Oxley Act of 2002.*
15.1 Consent of Ernst & Young, S.L., independent registered public accounting firm.*
* Filed herewith.** Application has been made to the Securities and Exchange Commission for confidential treatment of certain
provisions of these exhibits. Omitted material for which confidential treatment has been requested has beenfiled separately with the Securities and Exchange Commission.
108

SIGNATURES
Pursuant to the requirements of the Securities Exchange Act of 1934, the registrant has duly caused thisreport to be signed on its behalf by the undersigned, thereunto duly authorized.
ATENTO S.A.Date: March 31, 2015
By: /s/ Alejandro ReynalName: Alejandro Reynal
Title: Chief Executive Officer
By: /s/ Mauricio MontilhaName: Mauricio Montilha
Title: Chief Financial Officer
109
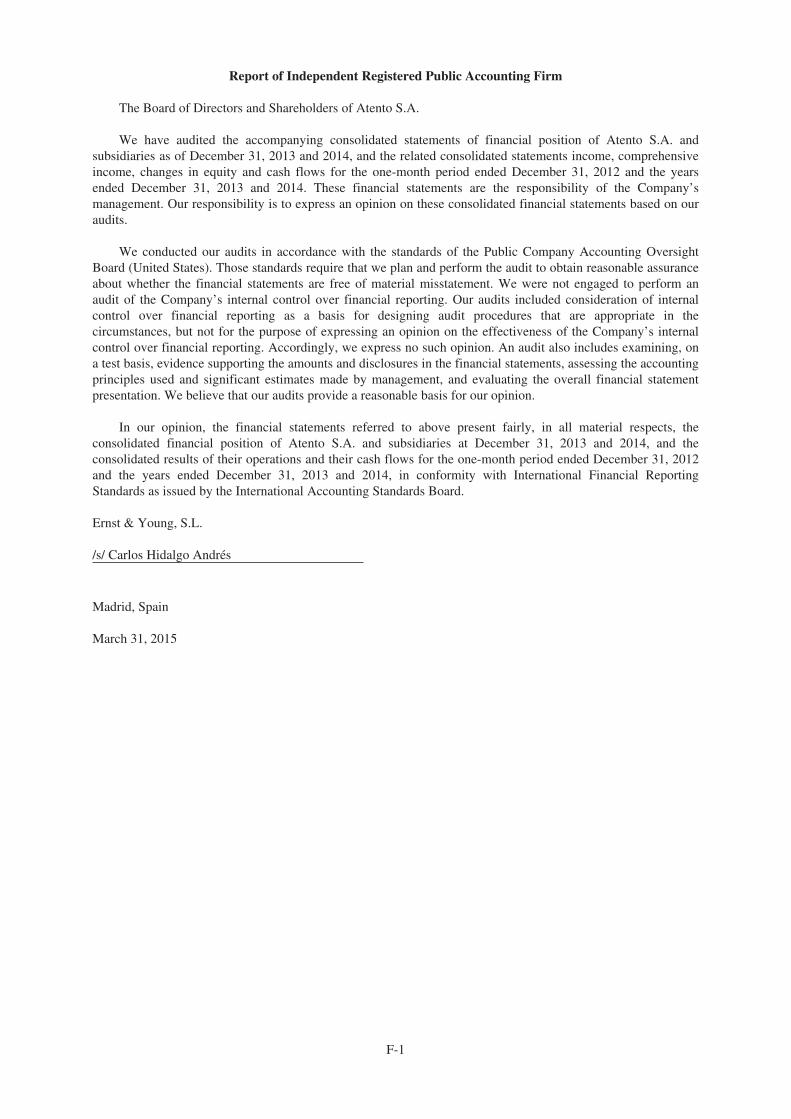
Report of Independent Registered Public Accounting Firm
The Board of Directors and Shareholders of Atento S.A.
We have audited the accompanying consolidated statements of financial position of Atento S.A. andsubsidiaries as of December 31, 2013 and 2014, and the related consolidated statements income, comprehensiveincome, changes in equity and cash flows for the one-month period ended December 31, 2012 and the yearsended December 31, 2013 and 2014. These financial statements are the responsibility of the Company’smanagement. Our responsibility is to express an opinion on these consolidated financial statements based on ouraudits.
We conducted our audits in accordance with the standards of the Public Company Accounting OversightBoard (United States). Those standards require that we plan and perform the audit to obtain reasonable assuranceabout whether the financial statements are free of material misstatement. We were not engaged to perform anaudit of the Company’s internal control over financial reporting. Our audits included consideration of internalcontrol over financial reporting as a basis for designing audit procedures that are appropriate in thecircumstances, but not for the purpose of expressing an opinion on the effectiveness of the Company’s internalcontrol over financial reporting. Accordingly, we express no such opinion. An audit also includes examining, ona test basis, evidence supporting the amounts and disclosures in the financial statements, assessing the accountingprinciples used and significant estimates made by management, and evaluating the overall financial statementpresentation. We believe that our audits provide a reasonable basis for our opinion.
In our opinion, the financial statements referred to above present fairly, in all material respects, theconsolidated financial position of Atento S.A. and subsidiaries at December 31, 2013 and 2014, and theconsolidated results of their operations and their cash flows for the one-month period ended December 31, 2012and the years ended December 31, 2013 and 2014, in conformity with International Financial ReportingStandards as issued by the International Accounting Standards Board.
Ernst & Young, S.L.
/s/ Carlos Hidalgo Andrés
Madrid, Spain
March 31, 2015
F-1
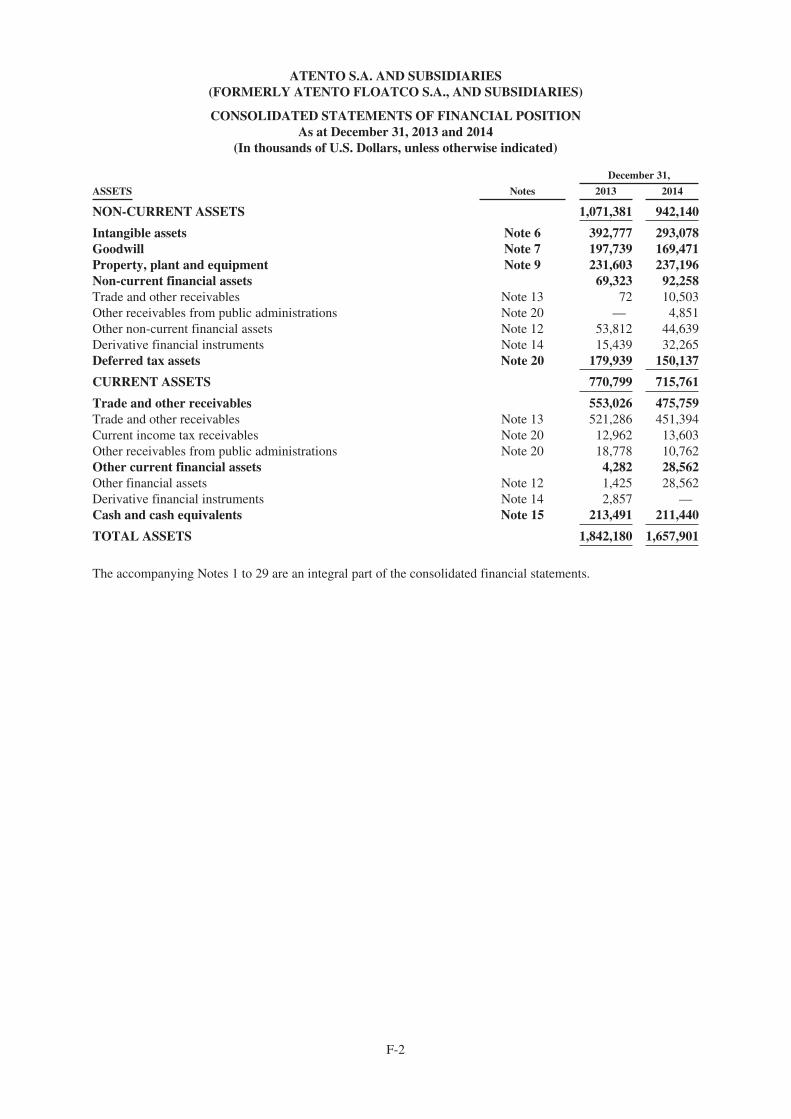
ATENTO S.A. AND SUBSIDIARIES(FORMERLY ATENTO FLOATCO S.A., AND SUBSIDIARIES)
CONSOLIDATED STATEMENTS OF FINANCIAL POSITIONAs at December 31, 2013 and 2014
(In thousands of U.S. Dollars, unless otherwise indicated)
December 31,
ASSETS Notes 2013 2014
NON-CURRENT ASSETS 1,071,381 942,140
Intangible assets Note 6 392,777 293,078Goodwill Note 7 197,739 169,471Property, plant and equipment Note 9 231,603 237,196Non-current financial assets 69,323 92,258Trade and other receivables Note 13 72 10,503Other receivables from public administrations Note 20 — 4,851Other non-current financial assets Note 12 53,812 44,639Derivative financial instruments Note 14 15,439 32,265Deferred tax assets Note 20 179,939 150,137
CURRENT ASSETS 770,799 715,761
Trade and other receivables 553,026 475,759Trade and other receivables Note 13 521,286 451,394Current income tax receivables Note 20 12,962 13,603Other receivables from public administrations Note 20 18,778 10,762Other current financial assets 4,282 28,562Other financial assets Note 12 1,425 28,562Derivative financial instruments Note 14 2,857 —Cash and cash equivalents Note 15 213,491 211,440
TOTAL ASSETS 1,842,180 1,657,901
The accompanying Notes 1 to 29 are an integral part of the consolidated financial statements.
F-2
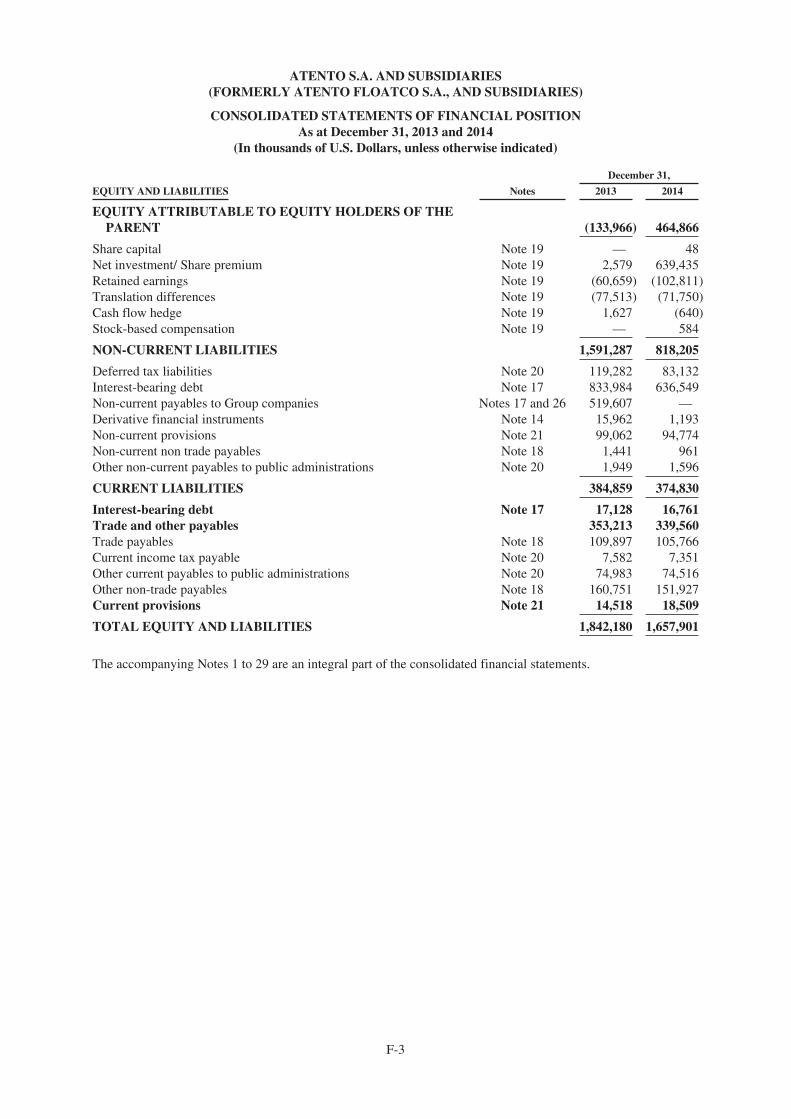
ATENTO S.A. AND SUBSIDIARIES(FORMERLY ATENTO FLOATCO S.A., AND SUBSIDIARIES)
CONSOLIDATED STATEMENTS OF FINANCIAL POSITIONAs at December 31, 2013 and 2014
(In thousands of U.S. Dollars, unless otherwise indicated)
December 31,
EQUITY AND LIABILITIES Notes 2013 2014
EQUITY ATTRIBUTABLE TO EQUITY HOLDERS OF THEPARENT (133,966) 464,866
Share capital Note 19 — 48Net investment/ Share premium Note 19 2,579 639,435Retained earnings Note 19 (60,659) (102,811)Translation differences Note 19 (77,513) (71,750)Cash flow hedge Note 19 1,627 (640)Stock-based compensation Note 19 — 584
NON-CURRENT LIABILITIES 1,591,287 818,205
Deferred tax liabilities Note 20 119,282 83,132Interest-bearing debt Note 17 833,984 636,549Non-current payables to Group companies Notes 17 and 26 519,607 —Derivative financial instruments Note 14 15,962 1,193Non-current provisions Note 21 99,062 94,774Non-current non trade payables Note 18 1,441 961Other non-current payables to public administrations Note 20 1,949 1,596
CURRENT LIABILITIES 384,859 374,830
Interest-bearing debt Note 17 17,128 16,761Trade and other payables 353,213 339,560Trade payables Note 18 109,897 105,766Current income tax payable Note 20 7,582 7,351Other current payables to public administrations Note 20 74,983 74,516Other non-trade payables Note 18 160,751 151,927Current provisions Note 21 14,518 18,509
TOTAL EQUITY AND LIABILITIES 1,842,180 1,657,901
The accompanying Notes 1 to 29 are an integral part of the consolidated financial statements.
F-3
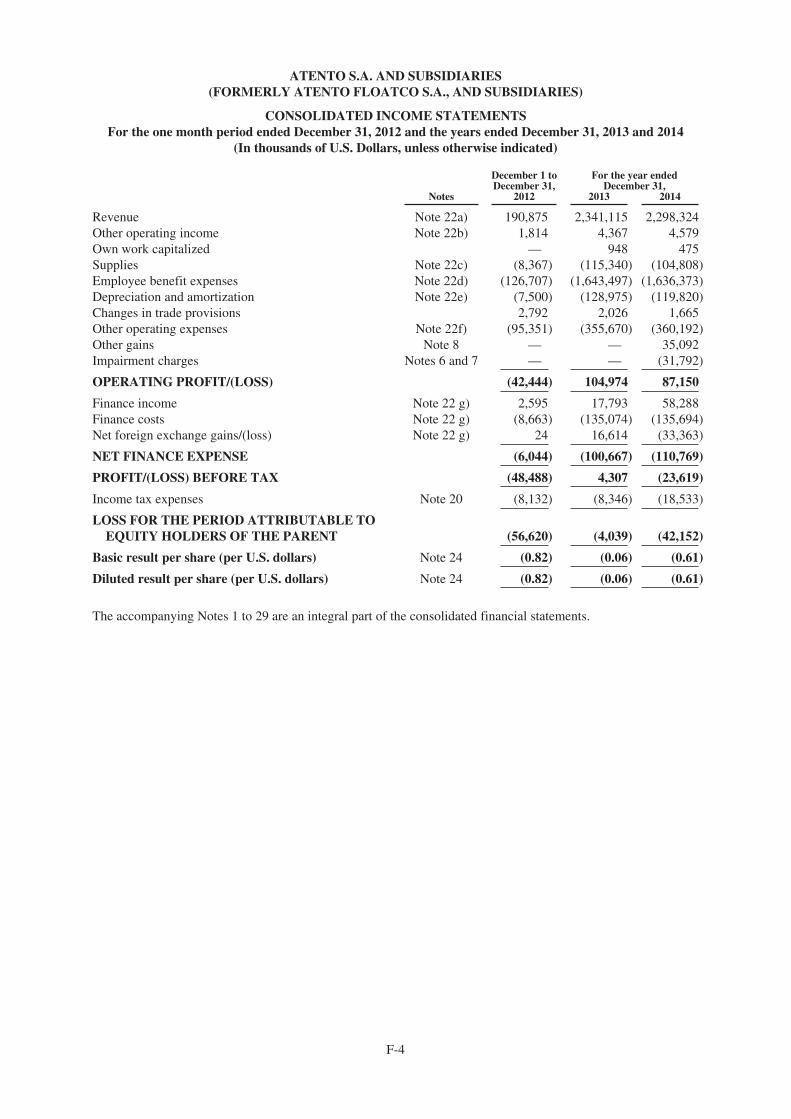
ATENTO S.A. AND SUBSIDIARIES(FORMERLY ATENTO FLOATCO S.A., AND SUBSIDIARIES)
CONSOLIDATED INCOME STATEMENTSFor the one month period ended December 31, 2012 and the years ended December 31, 2013 and 2014
(In thousands of U.S. Dollars, unless otherwise indicated)
Notes
December 1 toDecember 31,
2012
For the year endedDecember 31,
2013 2014
Revenue Note 22a) 190,875 2,341,115 2,298,324Other operating income Note 22b) 1,814 4,367 4,579Own work capitalized — 948 475Supplies Note 22c) (8,367) (115,340) (104,808)Employee benefit expenses Note 22d) (126,707) (1,643,497) (1,636,373)Depreciation and amortization Note 22e) (7,500) (128,975) (119,820)Changes in trade provisions 2,792 2,026 1,665Other operating expenses Note 22f) (95,351) (355,670) (360,192)Other gains Note 8 — — 35,092Impairment charges Notes 6 and 7 — — (31,792)
OPERATING PROFIT/(LOSS) (42,444) 104,974 87,150
Finance income Note 22 g) 2,595 17,793 58,288Finance costs Note 22 g) (8,663) (135,074) (135,694)Net foreign exchange gains/(loss) Note 22 g) 24 16,614 (33,363)
NET FINANCE EXPENSE (6,044) (100,667) (110,769)
PROFIT/(LOSS) BEFORE TAX (48,488) 4,307 (23,619)
Income tax expenses Note 20 (8,132) (8,346) (18,533)
LOSS FOR THE PERIOD ATTRIBUTABLE TOEQUITY HOLDERS OF THE PARENT (56,620) (4,039) (42,152)
Basic result per share (per U.S. dollars) Note 24 (0.82) (0.06) (0.61)
Diluted result per share (per U.S. dollars) Note 24 (0.82) (0.06) (0.61)
The accompanying Notes 1 to 29 are an integral part of the consolidated financial statements.
F-4
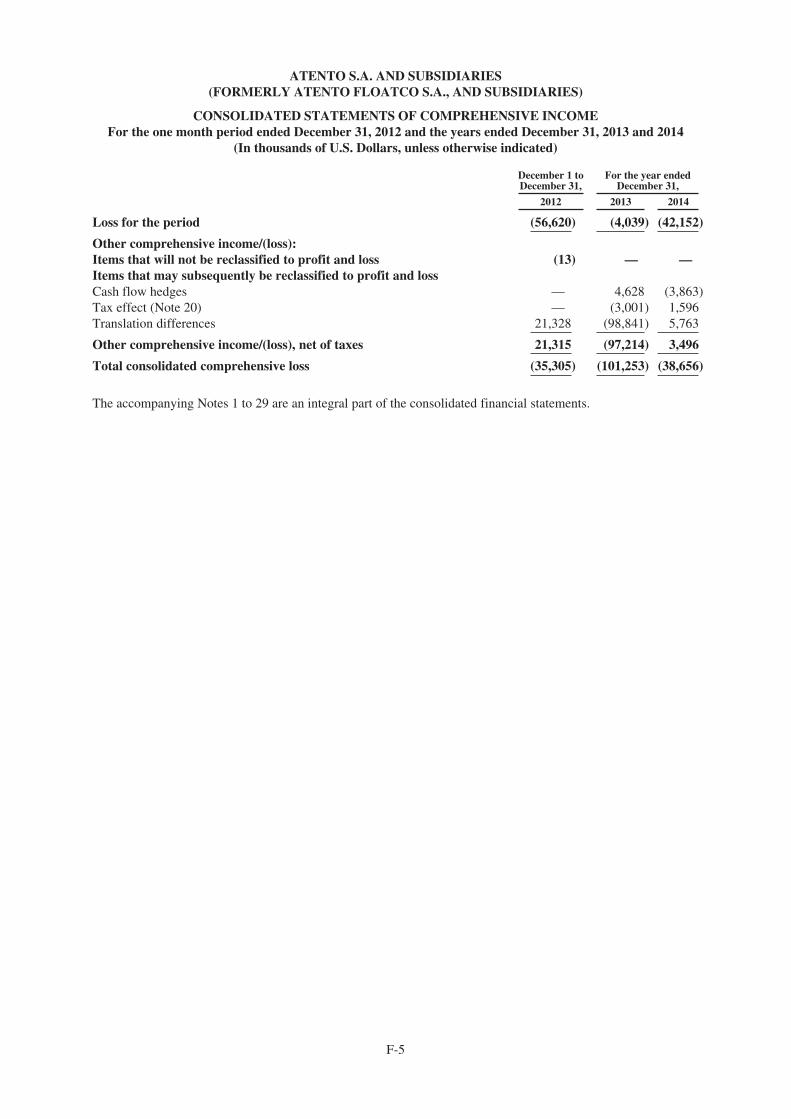
ATENTO S.A. AND SUBSIDIARIES(FORMERLY ATENTO FLOATCO S.A., AND SUBSIDIARIES)
CONSOLIDATED STATEMENTS OF COMPREHENSIVE INCOMEFor the one month period ended December 31, 2012 and the years ended December 31, 2013 and 2014
(In thousands of U.S. Dollars, unless otherwise indicated)
December 1 toDecember 31,
For the year endedDecember 31,
2012 2013 2014
Loss for the period (56,620) (4,039) (42,152)
Other comprehensive income/(loss):Items that will not be reclassified to profit and loss (13) — —Items that may subsequently be reclassified to profit and lossCash flow hedges — 4,628 (3,863)Tax effect (Note 20) — (3,001) 1,596Translation differences 21,328 (98,841) 5,763
Other comprehensive income/(loss), net of taxes 21,315 (97,214) 3,496
Total consolidated comprehensive loss (35,305) (101,253) (38,656)
The accompanying Notes 1 to 29 are an integral part of the consolidated financial statements.
F-5
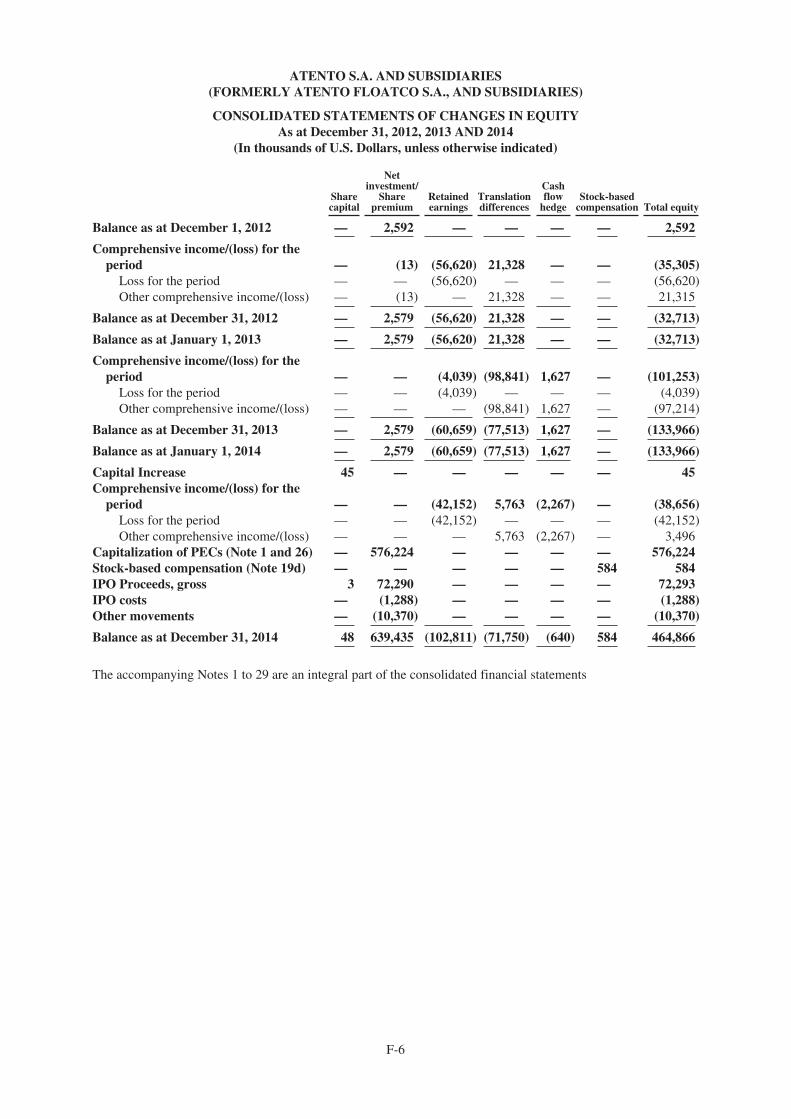
ATENTO S.A. AND SUBSIDIARIES(FORMERLY ATENTO FLOATCO S.A., AND SUBSIDIARIES)
CONSOLIDATED STATEMENTS OF CHANGES IN EQUITYAs at December 31, 2012, 2013 AND 2014
(In thousands of U.S. Dollars, unless otherwise indicated)
Sharecapital
Netinvestment/
Sharepremium
Retainedearnings
Translationdifferences
Cashflow
hedgeStock-based
compensation Total equity
Balance as at December 1, 2012 — 2,592 — — — — 2,592
Comprehensive income/(loss) for theperiod — (13) (56,620) 21,328 — — (35,305)
Loss for the period — — (56,620) — — — (56,620)Other comprehensive income/(loss) — (13) — 21,328 — — 21,315
Balance as at December 31, 2012 — 2,579 (56,620) 21,328 — — (32,713)
Balance as at January 1, 2013 — 2,579 (56,620) 21,328 — — (32,713)
Comprehensive income/(loss) for theperiod — — (4,039) (98,841) 1,627 — (101,253)
Loss for the period — — (4,039) — — — (4,039)Other comprehensive income/(loss) — — — (98,841) 1,627 — (97,214)
Balance as at December 31, 2013 — 2,579 (60,659) (77,513) 1,627 — (133,966)
Balance as at January 1, 2014 — 2,579 (60,659) (77,513) 1,627 — (133,966)
Capital Increase 45 — — — — — 45Comprehensive income/(loss) for the
period — — (42,152) 5,763 (2,267) — (38,656)Loss for the period — — (42,152) — — — (42,152)Other comprehensive income/(loss) — — — 5,763 (2,267) — 3,496
Capitalization of PECs (Note 1 and 26) — 576,224 — — — — 576,224Stock-based compensation (Note 19d) — — — — — 584 584IPO Proceeds, gross 3 72,290 — — — — 72,293IPO costs — (1,288) — — — — (1,288)Other movements — (10,370) — — — — (10,370)
Balance as at December 31, 2014 48 639,435 (102,811) (71,750) (640) 584 464,866
The accompanying Notes 1 to 29 are an integral part of the consolidated financial statements
F-6
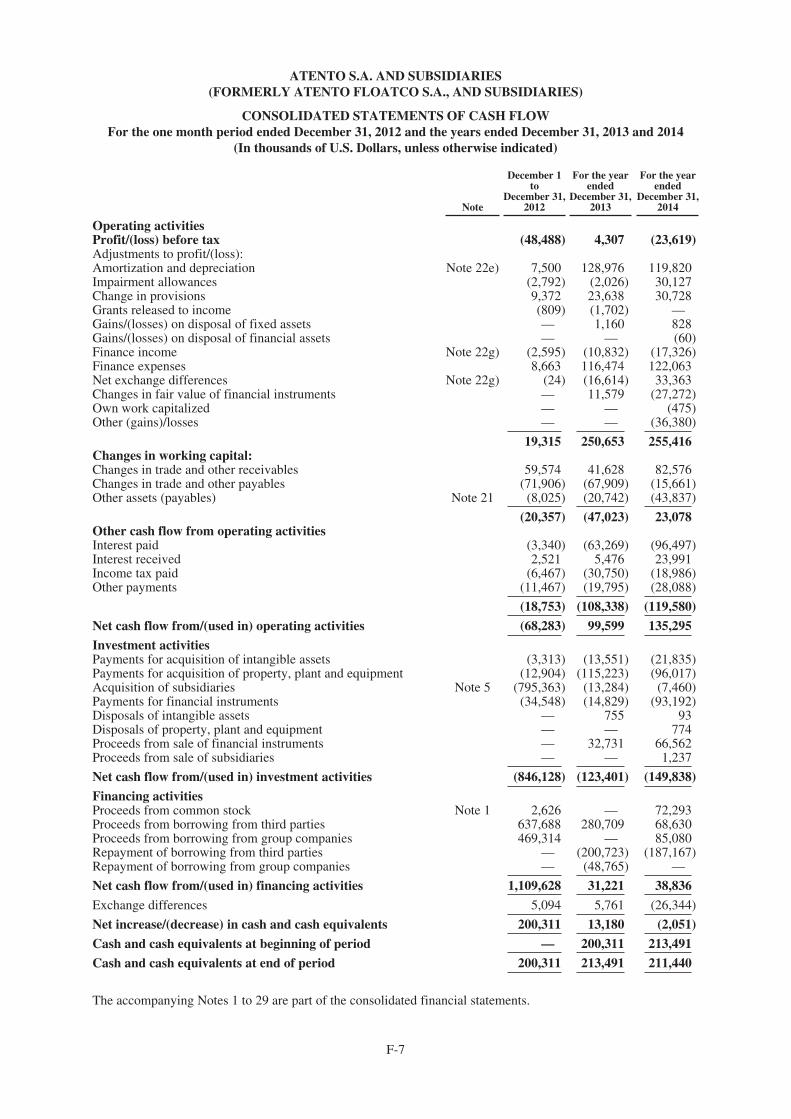
ATENTO S.A. AND SUBSIDIARIES(FORMERLY ATENTO FLOATCO S.A., AND SUBSIDIARIES)
CONSOLIDATED STATEMENTS OF CASH FLOWFor the one month period ended December 31, 2012 and the years ended December 31, 2013 and 2014
(In thousands of U.S. Dollars, unless otherwise indicated)
Note
December 1to
December 31,2012
For the yearended
December 31,2013
For the yearended
December 31,2014
Operating activitiesProfit/(loss) before tax (48,488) 4,307 (23,619)Adjustments to profit/(loss):Amortization and depreciation Note 22e) 7,500 128,976 119,820Impairment allowances (2,792) (2,026) 30,127Change in provisions 9,372 23,638 30,728Grants released to income (809) (1,702) —Gains/(losses) on disposal of fixed assets — 1,160 828Gains/(losses) on disposal of financial assets — — (60)Finance income Note 22g) (2,595) (10,832) (17,326)Finance expenses 8,663 116,474 122,063Net exchange differences Note 22g) (24) (16,614) 33,363Changes in fair value of financial instruments — 11,579 (27,272)Own work capitalized — — (475)Other (gains)/losses — — (36,380)
19,315 250,653 255,416Changes in working capital:Changes in trade and other receivables 59,574 41,628 82,576Changes in trade and other payables (71,906) (67,909) (15,661)Other assets (payables) Note 21 (8,025) (20,742) (43,837)
(20,357) (47,023) 23,078Other cash flow from operating activitiesInterest paid (3,340) (63,269) (96,497)Interest received 2,521 5,476 23,991Income tax paid (6,467) (30,750) (18,986)Other payments (11,467) (19,795) (28,088)
(18,753) (108,338) (119,580)
Net cash flow from/(used in) operating activities (68,283) 99,599 135,295
Investment activitiesPayments for acquisition of intangible assets (3,313) (13,551) (21,835)Payments for acquisition of property, plant and equipment (12,904) (115,223) (96,017)Acquisition of subsidiaries Note 5 (795,363) (13,284) (7,460)Payments for financial instruments (34,548) (14,829) (93,192)Disposals of intangible assets — 755 93Disposals of property, plant and equipment — — 774Proceeds from sale of financial instruments — 32,731 66,562Proceeds from sale of subsidiaries — — 1,237
Net cash flow from/(used in) investment activities (846,128) (123,401) (149,838)
Financing activitiesProceeds from common stock Note 1 2,626 — 72,293Proceeds from borrowing from third parties 637,688 280,709 68,630Proceeds from borrowing from group companies 469,314 — 85,080Repayment of borrowing from third parties — (200,723) (187,167)Repayment of borrowing from group companies — (48,765) —
Net cash flow from/(used in) financing activities 1,109,628 31,221 38,836
Exchange differences 5,094 5,761 (26,344)
Net increase/(decrease) in cash and cash equivalents 200,311 13,180 (2,051)
Cash and cash equivalents at beginning of period — 200,311 213,491
Cash and cash equivalents at end of period 200,311 213,491 211,440
The accompanying Notes 1 to 29 are part of the consolidated financial statements.
F-7
ATENTO S.A. AND SUBSIDIARIES(FORMERLY ATENTO FLOATCO S.A., AND SUBSIDIARIES)
NOTES TO THE CONSOLIDATED FINANCIAL STATEMENTSFor the one month period ended December 31, 2012 and the years ended December 31, 2013 and 2014
(In thousands of U.S. Dollars, unless otherwise indicated)
1) ACTIVITY OF ATENTO S.A. AND CORPORATE INFORMATION
(a) Description of business
Atento S.A., formerly Atento Floatco S.A. (hereinafter the “Company”), and its subsidiaries (hereinafter“Atento Group”) are a group of companies that offer contact management services to their clients throughout theentire contract life cycle, through contact centers or multichannel platforms.
The Company was incorporated on March 5, 2014 under the laws of the Grand-Duchy of Luxembourg, withits registered office in Luxembourg at 4, Rue Lou Hemmer.
The Atento Group was acquired in 2012 by Bain Capital Partners, LLC (hereinafter “Bain Capital”). BainCapital is a private investment fund that invests in companies with a high growth potential. Notable among itsinvestments in the Customer Relationship Management (hereinafter “CRM”) sector is its holding in Bellsystem24, a leader in customer service in Japan, and Genpact, the largest business management services company in theworld.
In December 2012, Bain Capital reached a definitive agreement with Telefónica, S.A. for the transfer ofnearly 100% of the CRM business carried out by Atento Group companies (hereinafter the “Acquisition”), theparent company of which was Atento Inversiones y Teleservicios, S.A. (hereinafter “AIT”). The Venezuelabased subsidiaries of the group headed by AIT, and AIT, except for some specific assets and liabilities, were notincluded in the Acquisition. Control was transferred for the purposes of creating the consolidated Atento Groupon December 1, 2012. Until that time, the Company had been idle and the consolidated Atento Group did notexist. For this reason, these consolidated financial statements are presented since December 1, 2012, date theAtento Group was incorporated.
Note 3t contains a list of the companies which make up the Atento Group, as well as pertinent informationthereon.
The mayority direct shareholder of the Company is a firm incorporated under the laws of the Grand-Duchyof Luxembourg, ATALAYA Luxco PIKCo, S.C.A. (Luxembourg).
The Company’s corporate purpose is to hold business stakes of any kind in companies in Luxembourg andabroad, purchase and sell, subscribe or any other format, and transfer through sale, swap or otherwise ofsecurities of any kind, and administration, management, control and development of the investment portfolio.
The Company may also act as the guarantor of loans and securities, as well as assisting companies in whichit holds direct or indirect interests or that form part of its group. The Company may secure funds, with theexception of public offerings, through any kind of lending, or through the issuance of bonds, securities or debtinstruments in general.
The Company may also carry on any commercial, industrial, financial, real estate business or intellectualproperty related activity that it deems necessary to meet the aforementioned corporate purposes.
The corporate purpose of its subsidiaries, with the exception of the intermediate holding companies, is toestablish, manage and operate Customer Relationship Management (“CRM”) centers through multichannelplatforms; provide telemarketing, marketing and “call center” services through service agencies or in any otherformat currently existing or which may be developed in the future by the Atento Group; providetelecommunications, logistics, telecommunications system management, data transmission, processing andinternet services and to promote new technologies in these areas; offer consultancy and advisory services tocustomers in all areas in connection with telecommunications, processing, integration systems and newtechnologies, and other services related to the above. Atento S.A. trades (under “ATTO”) on NYSE sinceOctober 3, 2014
F-8
(b) Atento S.A. reorganization transaction
Atento S.A. was formed as a direct subsidiary of Atalaya Luxco Topco S.C.A. (“Topco”). In April 2014,Topco also incorporated Atalaya Luxco PIKCo S.C.A. (“PikCo”) and on May 15, 2014 Topco contributed toPikCo: (i) all of its equity interests in its then direct subsidiary, Atalaya Luxco Midco S.à r.l. (“Midco”), theconsideration for which was an allocation to PikCo’s account “capital contributions not remunerated by shares”(the “Reserve Account”) equal to €2 million, resulting in Midco becoming a direct subsidiary of PikCo; and(ii) all of its debt interests in Midco (comprising three series of Preferred Equity Certificates (the “OriginalLuxco PECs”)), the consideration for which was the issuance by PikCo to Topco of Preferred Equity Certificateshaving an equivalent value. On May 30, 2014, Midco authorized the issuance of, and PikCo subscribed for, afourth series of Preferred Equity Certificates (referred to, together with the Original Luxco PECs, as the “LuxcoPECs”.
In October 2014, in connection with the completion of Atento S.A.’s initial public offering (the “IPO”),Topco transferred its entire interest in Midco (being €31,000 of share capital) to PikCo, the consideration forwhich was an allocation to PikCo’s Reserve Account equal to €31,000. PikCo then contributed (the“Contribution”) all of the Luxco PECs to Midco, the consideration for which was an allocation to Midco’sReserve Account equal to the value of the Luxco PECs immediately prior to the Contribution. The Luxco PECsamounted to €460.0 million (approx. 576.2 million of U.S. dollars as at the capitalization date on October 3).Upon completion of the Contribution, the Luxco PECs were capitalized by Midco. PikCo then transferred theremainder of its interest in Midco (being €12,500 of share capital) to Atento S.A., in consideration for whichAtento S.A. issued two new shares of its capital stock to PikCo. The difference between the nominal value ofthese shares and the value of Midco’s net equity was allocated to Atento S.A.’s share premium account. As aresult of this transfer, Midco became a direct subsidiary of Atento S.A. A share split was also carried out,whereby Atento S.A. issued 2,219.212 ordinary shares for each 1 ordinary share outstanding. This entire processis collectively referred to as the “Reorganization Transaction”.
On October 7, 2014, upon the closing of the IPO, Atento S.A. issued 4,819,511 new ordinary shares withoutnominal value at a price to the public of $15.00 per share, representing proceeds of 72,293 thousand U.S. dollars.Giving effect to the completion of the IPO, Atento S.A. has 73,619,511 ordinary shares outstanding and owns100% of the issued and outstanding share capital of Midco.
Pursuant to the Reorganization Transaction, Midco became a wholly-owned subsidiary of Atento S.A., anewly-formed company incorporated under the laws of Luxembourg with assets and liabilities for the purpose offacilitating the IPO, and which did not conduct any operations prior to the completion of the IPO. Following theReorganization Transaction and the IPO, the financial statements present the consolidated results of Midco’soperations. The consolidated financial statements of Midco are substantially the same as the consolidatedfinancial statements of the Atento S.A. prior to the IPO, adjusted to reflect the Reorganization Transaction. Uponconsummation, the Reorganization Transaction was retroactively reflected in Atento’s earnings per sharecalculations.
The net proceeds of the IPO, together with cash on hand, were used to repay the entire outstanding amountdue under the Vendor Loan Note issued to an affiliate of Telefónica in connection with the Acquisition, of which€23.3 million (29.5 million U.S. dollars at the exchange rate prevailing as at October 7, 2014) and to pay fees andexpenses incurred in connection with the IPO, including fees payable to Bain Capital Partners, LLC (“Bain”),totaling 24.5 million U.S. dollars.
(c) Divestment transaction
On December 9, 2014, Atento S.A. through its indirect subsidiary, Atento Spain Holdco, S.L.U., asole-shareholder subsidiary of Atento Luxco 1, S.A. has entered into an agreement for the sale of the 100% of theshare capital of ATENTO CESKÁ REPUBLIKA A.S., which owns its operations in the Czech Republic, with theItalian company COMDATA S.P.A., the impacts of the transaction were immaterials. This divestment was notconsidered as a discontinued operation under the IFRS 5 because it is not a relevant geographical area. Theconsolidation of this operation was until November 30, 2014.
2) BASIS OF PRESENTATION OF THE CONSOLIDATED FINANCIAL STATEMENTS
a) True and fair view
As described in Note 1, Atento S.A. was incorporated as legal entity and as Group (Atento S.A. andsubsidiaries) in 2014 due to the Reorganization Transaction and the IPO described in Note 1. Pursuant to the
F-9
Reorganization Transaction, Midco became a wholly-owned subsidiary of Atento S.A., a newly-formed companyincorporated under the laws of Luxembourg with nominal assets and liabilities for the purpose of facilitating theIPO, and which did not conduct any operations prior to the completion of the IPO. Following the ReorganizationTransaction and the IPO, the financial statements present the consolidated results of Midco’s operations as ifAtento S.A. always would have been operating. The consolidated financial statements of Midco weresubstantially the same as the consolidated financial statements of the Atento S.A. prior to the IPO, adjusted toreflect the Reorganization Transaction. Incorporation of Atento S.A. (Floatco) has been considered a commoncontrol transaction, applying the pooling of interest method and therefore:
a) Assets and liabilities of the combining entities (Atento S.A. and the Consolidated FS of Midco) havebeen reflected at their carrying amounts.
b) No adjustments are made to reflect fair values, or recognize any new assets or liabilities, at the date ofthe combination.
c) No new goodwill has been recognized as a result of the combination.
d) The income statement reflects the results of the combining entities for the full year (Atento S.A. andMidco Consolidated financials), irrespective of when the combination took place.
e) Impacts equity as long as the share capital of Atento S.A. shall be reflected.
Upon consummation, the Reorganization Transaction was retroactively reflected in Atento’s earnings pershare calculations.
The consolidated financial statements have been prepared by Management on the basis of the accountingrecords of Atento S.A. and its Group companies.
The consolidated financial statements were prepared in accordance with the International FinancialReporting Standards (“IFRS”) issued by the International Accounting Standard Board (“IASB”) and IFRICinterpretations prevailing at December 31, 2014. The consolidated financial statements have been prepared on ahistorical costs basis, with the exception of derivative financial instruments and Contingent Value Instruments,which have been measured at fair value.
The consolidated financial statements have been issued by the Board and Audit Committee of the Company,Atento S.A. in Luxembourg on March 24, 2015. These consolidated financial statements have not been yetapproved by the General Shareholders Meeting of the Parent Company. However, the Board of Directors expectsthem to be approved without amendments.
The preparation of financial statements under IFRS as issued by the IASB requires the use of certain keyaccounting estimates. IFRS also requires Management to exercise judgment throughout the process of applyingthe Atento Group’s accounting policies. Note 3s discloses the areas requiring a more significant degree ofjudgment or complexity and the areas where assumptions and estimates are more relevant to the consolidatedfinancial statements.
Note 3 contains a detailed description of the most significant accounting policies used to prepare theseconsolidated financial statements.
The figures in these consolidated financial statements, comprising the consolidated statements of financialposition, the consolidated income statement, the consolidated statements of comprehensive income, theconsolidated statements of changes in equity, the consolidated statements of cash flow, and the notes thereto areexpressed in thousands of U.S. dollars, unless otherwise indicated.
These consolidated financial statements reflect the classification of companies in the TOPCO andsubsidiaries group as Group companies, while separately identifying the pertinent balances and transactions ofthese companies from the remaining receivables, payables, income, expenses, proceeds and payments.
b) Comparative information
Although the figures for the years ended December 31, 2013 and 2014 correspond to a full year of activityfor the Atento Group, the figures for 2012, shown for comparative purposes, represent the period in which theAtento Group began its activity, from December 1 to December 31, 2012. Accordingly, the figures for 2013 and2014 are not fully comparable with those for 2012.
F-10
c) Consolidated statement of cash flow
The consolidated statement of cash flow has been prepared using the indirect method pursuant to IAS 7“Statement of Cash Flow”. Foreign currency transactions are translated at the average exchange rate for theperiod, in those cases where the currency differs from the presentation currency of Atento Group (U.S. dollar), asindicated in Note 3 b. The effect of exchange rate fluctuations on cash and cash equivalents, maintained or owed,in foreign currency, is presented in the statement of cash flow to reconcile cash and cash equivalents at thebeginning of the period and at period-end.
3) ACCOUNTING POLICIES
The main accounting policies used to prepare the accompanying consolidated financial statements are setout below. Except where otherwise indicated, these policies have been applied on a consistent basis for allperiods shown in the statements.
a) Subsidiaries, business combinations and goodwill
Subsidiaries include all companies in which Atento Group is able to control financial and operating policies,a position which is generally accompanied by an ownership interest entitling it to more than half of the votingrights. To determine whether Atento Group controls another company, the existence and effect of potentialvoting rights that are currently exercisable or convertible are taken into account. In cases where Atento Groupdoes not hold more than 50% of the voting rights, but is able to guide the financial and operating policies of agiven investee, an assessment is carried out to determine whether control exists.
Subsidiaries are consolidated from the date in which their control is transferred to Atento Group, and theyare desconsolidated from the date in that control ceases.
Atento Group applies the acquisition method when recognizing business combinations. The considerationgiven for the acquisition of a subsidiary is understood to correspond to the fair value of the assets transferred, theliabilities assumed vis-à-vis the former owners of the acquiree, and any equity instruments therein issued byAtento Group. The consideration given includes the fair value of any asset or liability resulting from anycontingent consideration agreement.
Any contingent consideration to be transferred by Atento Group is recognized at its fair value as at theacquisition date. Subsequent changes in the fair value of any contingent consideration deemed an asset or aliability are recognized in the income statement or as a change in other comprehensive income, in accordancewith IAS 39, “Financial Instruments: Recognition and Measurement”. Contingent consideration classified asequity is not remeasured, and any subsequent settlement thereof is also recognized in equity. Costs related to theacquisition are recognized as expenses in the year in which they are incurred.
Identifiable assets acquired and identifiable liabilities and contingent liabilities assumed in a businesscombination are initially measured at fair value as at the acquisition date.
Goodwill is initially measured as any excess of the total consideration received over the net identifiableassets acquired and liabilities assumed. If the fair value of the net assets acquired is greater than the aggregateconsideration transferred, the difference is recognized in the income statement.
Goodwill is tested for impairment annually or more frequently if there are certain events or changes incircumstances indicating potential impairment.
As part of this impairment testing, the goodwill acquired in a business combination is assigned to each cash-generating unit, or group of cash-generating units, that is expected to benefit from the synergies arising in thebusiness combination.
The carrying amount of the assets allocated to each cash generating unit is then compared with itsrecoverable amount, which is the greater of its value in use or fair value less costs to sell. Any impairment loss isimmediately taken to the income statement, and may not be reversed (see Section h).
b) Functional and presentation currency
Items included in the financial statements of each of the group’s entities are measured using the currency ofthe primary economic environment in which the entities operate (‘the functional currency’). The consolidatedfinancial statements are presented in thousands of U.S. dollars, which is the presentation currency of the AtentoGroup.
F-11
c) Foreign currency translation
The results and financial position of all Atento Group entities (none of which uses the currency of aninflationary economy) whose functional currency is different from the presentation currency are translated intothe presentation currency as follow:
• Statement of financial position assets and liabilities are translated at the exchange rate prevailing at thereporting date
• Income statement items are translated at average exchange rates for the year (unless this average is nota reasonable approximation of the cumulative effect of the rates prevailing on the transaction dates, inwhich case income and expenses are translated at the rate on the dates of the transactions)
• Proceeds and payments shown on the statement of cash flow are translated at the average exchangerates for the period (unless this average is not a reasonable approximation of the cumulative effect ofthe rates prevailing on the transaction dates, in which case income and expenses are translated at therate on the dates of the transactions)
• Retained earnings are translated at historical exchange rates
• All resulting exchange differences are recognized in other comprehensive income
Goodwill and fair value adjustments to net assets arising from the acquisition of a foreign company areconsidered to be assets and liabilities of the foreign company and are translated at year-end exchange rates.Exchange differences arising are recognized in other comprehensive income.
d) Foreign currency transactions
Transactions in foreign currency are translated into the functional currency using the exchange ratesprevailing at the date of the transactions or valuation date, in the case of items being re-measured. Foreignexchange gains and losses resulting from the settlement of these transactions and from the translation at reportingdate exchange rates of monetary assets and liabilities denominated in foreign currencies are recognized in theincome statement, except when deferred in other comprehensive income, such as qualifying as cash flow hedges.
e) Segment information
Segment information is presented in accordance with the internal information provided to the chiefoperating decision maker. The chief operating decision maker, responsible for allocating resources and assessingperformance of operational segments, has been identified as the Chief Executive Officer (“CEO”) responsible forstrategic decisions.
The chief operating decision maker considers the business from a geographical perspective and analyzes itacross three operational segments—EMEA, Americas and Brazil. Note 23 shows detailed information bysegment.
f) Intangible assets
Intangible assets are stated at acquisition cost, less any accumulated amortization and any accumulatedimpairment losses.
The intangible assets acquired in a business combination are initially measured at their fair value as at theacquisition date.
The acquisition cost comprises the purchase price, import duties and non-refundable taxes, after deductingtrade discounts and rebates, and directly attributable costs of readying the asset for its intended use.
The useful lives of intangible assets are assessed on a case-by-case basis to be either finite or indefinite.Intangible assets with finite lives are amortized on a straight line basis over their estimated useful life andassessed for impairment whenever events or changes indicate that their carrying amount may not be recoverable.Intangible assets that have an indefinite useful life are not subject to amortization and are tested annually forimpairment.
The amortization charge on intangible assets is recognized in the consolidated income statement under“Depreciation and amortization”.
F-12
Amortization methods and schedules are revised annually at the end of each reporting period and, whereappropriate, adjusted prospectively.
Customer base
The customer base is stated at cost and amortized on a straight line basis over its useful life, which has beenestimated to be between seven and twelve years. The customer base relates to all agreements, tacit or explicit,entered into between the Atento Group and the former owner of the Atento Group and between the Atento Groupand other customers, in relation to the provision of services, and that were acquired as part of the businesscombinations indicated in Note 5.
Software
Software is measured at cost and amortized on a straight line basis over its useful life, generally estimated tobe between three and five years. The cost of maintaining software is expensed as incurred.
Development costs directly attributable to the design and creation of software trails that are identifiable andunique, and that may be controlled by the Group, are recognized as an intangible asset providing the followingconditions are met:
• It is technically feasible for the intangible asset to be completed so that it will be available for use orsale.
• Management intends to complete the asset for use or sale.
• The Group has the capacity to use or sell the asset.
• It is possible to show evidence of how the intangible asset will generate probable future economicbenefits.
• Adequate technical, financial and other resources are available to complete the development and to useor sell the intangible asset.
• The outlay attributable to the intangible asset during its development can be reliably determined.
Directly attributable costs capitalized in the value of the software include the cost of personnel developingthe programs and an appropriate percentage of overheads.
Costs that do not meet the criteria listed above are recognized as an expense as incurred. Expenditure for anintangible asset that is initially recognized within expenses for the period may not be subsequently recognized asintangible assets.
Capitalized software development costs are amortized over their estimated useful lives, which normallydoes not exceed three years.
Intellectual property
Amounts paid to acquire or use intellectual property are recognized under “Intellectual property”.Intellectual property is amortized on a straight line basis over its useful life, estimated at ten years.
Other intangible assets
Other intangible assets are amortized on a straight line basis over their useful lives, which range from fourto ten years.
g) Property, plant and equipment
Property, plant and equipment are measured at cost, less accumulated depreciation and any impairmentlosses. Land is not depreciated.
Property, plant and equipment acquired in a business combination are initially measured at their fair valueas at the acquisition date.
The acquisition costs comprise the purchase price, import duties and non-refundable taxes, after deductingtrade discounts and rebates, and directly attributable costs of readying the asset for its intended use.
F-13
Acquisition costs also include, where appropriate, the initial estimates of decommissioning, withdrawal andsite reconditioning costs when the Atento Group is obliged to bear this expenditure as a condition of using theassets. Repairs that do not prolong the useful life of the assets and maintenance costs are recognized directly inthe income statement. Costs that prolong or improve the life of the asset are capitalized as an increase in the costof the asset.
The Atento Group assesses the need to write down, if appropriate, the carrying amount of each item ofproperty, plant and equipment to its period-end recoverable amount whenever there are indications that theassets’ carrying amount may not be fully recoverable through the generation of sufficient future revenue. Theimpairment allowance is reversed if the factors giving rise to the impairment cease to exist (see Section h).
The depreciation charge for items of property, plant and equipment is recognized in the consolidated incomestatement under “Depreciation and amortization”.
Depreciation is calculated on a straight line basis over the useful life of the asset applying individual rates toeach asset, which are reviewed at the end of each reporting period. For assets acquired through a businesscombination, the Atento Group decided to maintain their previous useful lives.
The useful lives generally used by the Atento Group are as follow:
Years of useful life
Owned buildings and leasehold improvements . . . . . . 5 – 40Plant and equipment . . . . . . . . . . . . . . . . . . . . . . . . . . . 3 – 6Furniture . . . . . . . . . . . . . . . . . . . . . . . . . . . . . . . . . . . . 4 – 10Data processing equipment . . . . . . . . . . . . . . . . . . . . . 1 – 5Vehicles . . . . . . . . . . . . . . . . . . . . . . . . . . . . . . . . . . . . 7Other property, plant and equipment . . . . . . . . . . . . . . 5 – 8
h) Impairment of non-current assets
The Atento Group assesses as at each reporting date whether there is an indicator that a non-current assetmay be impaired. If any such indicator exists, or when annual impairment testing for an asset is required(e.g. goodwill), the Atento Group estimates the asset’s recoverable amount. An asset’s recoverable amount is thehigher of its fair value less costs to sell or its value in use. In assessing the value in use, the estimated future cashflow is discounted to its present value using a pre-tax discount rate that reflects current market assessments of thetime value of money and the risks specific to the asset. Where the carrying amount of an asset exceeds itsrecoverable amount, the asset is considered to be impaired. In this case, the carrying amount is written down toits recoverable amount, and the resulting loss is recognized in the income statement. Future depreciation/amortization charges are adjusted to reflect the asset’s new carrying amount over its remaining useful life.Management analyzes the impairment of each asset individually, except in the case of assets that generate cashflow which are interdependent on those generated by other assets (cash generating units).
The Atento Group bases the calculation of impairment on the business plans of the various cash generatingunits to which the assets are allocated. These business plans cover five years, and the projections in year five andbeyond are modeled based on an estimated constant or decreasing growth rate.
When there are new events or changes in circumstances that indicate that a previously recognizedimpairment loss no longer exists or has been decreased, a new estimate of the asset’s recoverable amount ismade. A previously recognized impairment loss is reversed only if there has been a change in the estimates usedto determine the asset’s recoverable amount since the last impairment loss was recognized. If that is the case, thecarrying amount of the asset is increased to its recoverable amount. The reversal is limited to the carrying amountthat would have been determined had no impairment loss been recognized for the asset in prior years. Thisreversal is recognized in the income statement and the depreciation charge is adjusted in future periods to reflectthe asset’s revised carrying amount. Impairment losses relating to goodwill cannot be reversed in future periods.
i) Financial assets and liabilities
Financial assets
Upon initial recognition, the Atento Group classifies its financial assets into one of four categories: financialassets at fair value through profit or loss, loans and receivables, held-to-maturity investments and available-for-sale financial assets. These classifications are reviewed at the end of each reporting period and modified whereapplicable.
F-14
The Atento Group has classified all of its financial assets as loans and receivables, except for derivativefinancial instruments.
All purchases and sales of financial assets are recognized on the statement of financial position on thetransaction date, i.e. when the commitment is made to purchase or sell the asset.
A financial asset is fully or partially derecognized from the statement of financial position only when:
1. The rights to receive cash flow from the asset have expired.
2. The Atento Group has assumed an obligation to pay the cash flow received from the asset to a thirdparty or
3. The Atento Group has transferred its rights to receive cash flow from the asset to a third party,thereby substantially transferring all of the risks and rewards of the asset.
Financial assets and financial liabilities are offset and presented on a net basis in the statement of financialposition when a legally enforceable right exists to offset the amounts recognized and the Atento Group intends tosettle the assets and liabilities net or to simultaneously realize the asset and cancel the liability.
Loans and receivables include fixed-maturity financial assets not listed in active markets and which are notderivatives. They are classified as current assets, except for those maturing more than twelve months after thereporting date, which are classified as non-current assets. Loans and receivables are initially recognized at fairvalue plus any transaction costs, and are subsequently measured at amortized cost, using the effective interestmethod. Interest calculated using the effective interest method is recognized under finance income in the incomestatement.
The Atento Group assesses at each reporting date whether a financial asset is impaired. Where there isobjective evidence of impairment of a financial asset valued at amortized cost, the amount of the loss to be takento the income statement is measured as the difference between the carrying amount and the present value ofestimated future cash flow (without taking into account future losses), discounted at the asset’s original effectiveinterest rate. The carrying amount of the asset is reduced and the amount of the impairment loss is expensed inthe consolidated income statement.
Trade receivables
Trade receivables are amounts due from customers for the sale of goods or services in the normal course ofbusiness. Receivables slated for collection in twelve months or less are classified as current assets; otherwise, thebalances are considered non-current assets.
Trade receivables are recognized at the original invoice amount. An impairment provision is recorded whenthere is objective evidence of collection risk. The amount of the impairment provision is calculated as thedifference between the carrying amount of the doubtful trade receivables and their recoverable amount. Ingeneral, cash flow relating to short term receivables is not discounted.
Cash and cash equivalents
Cash and cash equivalents in the consolidated statement of financial position comprise cash on hand and inbanks, demand deposits and other highly liquid investments with an original maturity of three months or less.
For the purpose of the consolidated statement of cash flow, cash and cash equivalents are shown net of anyoutstanding bank overdrafts.
Financial liabilities
Interest-bearing debt (Borrowing)
Interest-bearing debt is initially recorded at the fair value of the consideration received, less any directlyattributable transaction costs. After initial recognition, these financial liabilities are measured at amortized costusing the effective interest method. Any difference between the cash received (net of transaction costs) and therepayment value is recognized in the income statement over the life of the debt. Interest-bearing debt isconsidered to be non-current when the maturity date is longer than twelve months from the reporting date, orwhen the Atento Group has full discretion to defer settlement for at least another twelve months from that date.
F-15
Financial liabilities are derecognized in the statement of financial position when the respective obligation issettled, cancelled or matures.
When the conditions agreed for a financial liability or part thereof are substantially modified, thismodification is treated as a derecognition of the original liability and the recognition of a new liability.Conditions are considered substantially different when there is more than a 10% difference between the presentvalue of cash flows discounted under the new terms using the original effective interest rate, including anycommission paid net of any commission received, and the present discounted value of the cash flows remainingon the original financial liability. When an exchange of debt instruments or a modification of the conditionsthereof is recorded as an extinction, the costs or commission incurred are recognized as part of the gains or losseson the extinction. When an exchange of debt instruments or a modification of conditions thereof is not recordedas an extinction, the costs and commission will adjust the carrying amount of the liability and be amortizedthroughout the remaining life of the modified liability.
Trade payables
Trade payables are payment obligations in respect of goods or services received from suppliers in theordinary course of business. Trade payables falling due in twelve months or less are classified as currentliabilities; otherwise, the balances are considered as non-current liabilities.
Trade payables are initially recognized at fair value and subsequently measured at amortized cost using theeffective interest method.
j) Derivative financial instruments and hedging
Derivative financial instruments are initially recognized at their fair values as at the date on which they arecontractually arranged. The fair value is reassessed at each reporting date.
The accounting treatment of any gains or losses resulting from changes in the fair value of a derivativeinstrument qualifies as a hedge and, where applicable, the nature of the hedge relationship.
The Atento Group designates certain derivatives as cash flow hedges.
At the inception of the hedge, the Atento Group documents the relationship between the hedginginstruments and the hedged items, as well as the risk management objectives and the strategy for groups ofhedges. The Atento Group also documents its assessment, both at the inception of the hedge and throughout theterm thereof, of whether the derivatives used are highly effective at offsetting changes in the fair value or cashflow of the hedged items.
The fair value of a hedging derivative is classified as a non-current asset or liability, as applicable, if theremaining maturity of the hedged item exceeds twelve months, otherwise it is classified as a current asset orliability.
Cash flow hedges
The effective portion of the fair value of derivatives designated and classified as cash flow hedges isrecognized in equity. Gains or losses in respect of the ineffective portion are taken to the income statement asincurred.
Amounts accumulated in equity are reclassified to the income statement in the periods in which the hedgeditem affects profit or loss.
When a hedging instrument matures or is sold, or when the requirements for hedge accounting are no longermet, any gain or loss accumulated in equity up until that moment remains in equity until the forecast transactionis definitively recognized in the income statement.
Derivatives which are not considered as hedging instruments
Variations in the fair value of derivative financial instruments that are not considered as hedging derivativesare recorded in the income statement.
F-16
k) Share capital
The ordinary shares of the Company are classified in equity (Note 19).
Incremental costs directly attributable to the issuance of new shares or options are deducted from theproceeds raised in equity, net of the tax effect.
Whenever any Group company acquires shares in the Company (treasury shares), the consideration paid,including any directly attributable incremental costs (net of income taxes) is deducted from the equityattributable to the equity holders of the Company until the shares are cancelled, newly issued or sold. When theseshares are subsequently reissued, all amounts received, net of any directly attributable incremental transactioncosts and the corresponding income tax effects, are included in the equity attributable to the equity holders of theCompany.
l) Grants received
Government grants are recognized as “Deferred income” under “Other non-trade payables” within thestatement of financial position when there is reasonable assurance that the grant will be received and all attachingconditions will be complied with. The grants are released to income as “Operating grants”, classified under“Other operating income,” in the income statement in equal amounts over the useful life of the assets financed.When the grant relates to an expense item, it is recognized as income over the period necessary to match thegrant to the costs that it is intended to compensate.
m) Provisions
Provisions are recognized when the Atento Group has a present obligation (legal or constructive) as a resultof a past event, it is probable that an outflow of resources embodying economic benefits will be required to settlethe obligation, and a reliable estimate can be made of the amount of the obligation. Provisions for restructuringinclude penalties for the cancellation of leases and other contracts, as well as employee termination payments.Provisions are not recognized for future operating losses.
When the Atento Group is virtually certain that some or all of a provision is to be reimbursed, for exampleunder an insurance contract, a separate asset is recognized in the statement of financial position, and the expenserelating to the provision is taken to the income statement, net of the expected reimbursement.
Provisions are measured at the present value of expenditure expected to be required to settle the obligation,using a pre-tax rate that reflects current market assessments of the time value of money and the specific risksinherent to the obligation. Any increase in the provision due to the passage of time is recognized as a financecost.
Contingent liabilities represent possible obligations to third parties, and existing obligations that are notrecognized, given that it is not likely that an outflow of economic resources will be required in order to settle theobligation or because the amount cannot be reliably estimated. Contingent liabilities are not recognized on theconsolidated statement of financial position unless they are acquired for consideration as part of a businesscombination.
n) Employee benefits
Pension obligations
The Atento Group has arranged defined contribution pension plans for employees in Mexico and Brazil.Under defined contribution plans, the Atento Group pays fixed contributions to pension insurance plans managedpublically or privately, on an obligatory, contractual or voluntary basis. The Atento Group has no legal orimplicit obligation to make further contributions if the fund fails to hold sufficient assets to pay all employees thebenefits corresponding to the services rendered in the present year and in prior years. The contributions arerecognized as employee benefits when accrued. Benefits paid in advance are recognized as an asset insofar asthey entail a cash reimbursement or a reduction in future payments.
Management Incentive Plan
In 2013, the shareholders of the Atento Group have established a management incentive plan as described inNote 26.
F-17
Share-based payments
Atento S.A. operates a share-based compensation plan, under which the subsidiaries of Atento S.A. receiveservices from employees as consideration for the equity instruments of Atento S.A. The subsidiaries themselvesare not party to any of the contracts; Atento S.A. will settle these agreements. The plan offers various instruments(award agreements, stock options, restricted stock units, etc.), but so far only two types of restricted stock units(“RSUs”) have been granted to selected employees on December 3, 2014.
The fair value of the employee services received in exchange for the grant of the RSUs is recognized as anexpense in the consolidated financial statements of Atento S.A. The total amount to be expensed is determinedwith reference to the fair value of the RSUs granted:
• Including any market performance conditions (for example, an entity’s share price)
• Excluding the impact of any service and non-market performance vesting conditions (for example,profitability, sales growth targets and remaining an employee of the entity over a specified time period)and
• Including the impact of any non-vesting conditions (for example, the requirement for employees tosave or hold shares for a specific period of time).
At the end of each reporting period, the group revises its estimates of the number of RSUs that are expectedto vest based on the non-market vesting conditions and service conditions. It recognizes the impact of therevisions to original estimates, if any, in the income statement, with a corresponding adjustment to equity.
When the RSUs vest, Atento S.A. will issue new shares or buy them back in the market. The proceedsreceived, net of any directly attributable transaction costs, are credited to share capital (nominal value) and sharepremium.
The social security contributions payable in connection with the granting of the share options is consideredan integral part of the grant itself, and the charge will be treated as a cash-settled transaction.
Termination benefits
Termination benefits are paid to employees when the Atento Group decides to terminate their employmentcontracts prior to the usual retirement age or when the employee agrees to resign voluntarily in exchange forthese benefits. The Atento Group recognizes these benefits as an expense for the year, at the earliest of thefollowing dates: (a) when the Atento Group is no longer able to withdraw the offer for these benefits; or (b) whenthe Atento Group company recognizes the costs of a restructuring effort as per IAS 37, “Provisions, ContingentLiabilities and Contingent Assets”, and when this restructuring entails the payment of termination benefits. Whenbenefits are offered in order to encourage the voluntary resignation of employees, termination benefits aremeasured on the basis of the number of employees expected to accept the offer. Benefits to be paid in more thantwelve months from the reporting date are discounted to their present value.
o) Income tax
The income tax expense includes all the expenses and credits arising from the corporate income tax leviedon all the Atento Group companies.
Income tax expenses for each period represent the aggregate amounts of current and deferred taxes, ifapplicable.
Current tax assets and liabilities for the current and prior periods are measured at the amount expected to berecovered from or paid to the taxation authorities. The tax rates and tax laws used to compute the amounts arethose that are enacted at the reporting date in each country in which the Atento Group operates.
Deferred taxes are calculated based on an analysis of the statement of financial position, in consideration oftemporary differences generated from differences between the tax bases of assets and liabilities and their carryingamounts for financial reporting purposes.
The main temporary differences arise due to differences between the tax bases and carrying amounts ofplant, property and equipment, intangible assets, goodwill and non-deductible provisions, as well as differencesbetween the fair value and tax bases of net assets acquired from a business combination.
Furthermore, deferred tax assets arise from unused tax credits and tax loss carryforwards.
F-18
The Atento Group determines deferred tax assets and liabilities by applying the tax rates that will beeffective when the corresponding asset is received or the liability settled, based on tax rates and tax laws that areenacted (or substantively enacted) at the reporting date.
The carrying amounts of deferred income tax assets are reviewed at each reporting date and reduced to theextent that it is no longer probable that sufficient taxable profits will be available to allow all or part of thatdeferred tax asset to be utilized. Unrecognized deferred income tax assets are reassessed at each reporting dateand are recognized to the extent that it has become probable that future taxable profits will allow the deferred taxasset to be recovered.
Deferred tax liabilities associated with investments in subsidiaries and branches are not recognized when thetiming of the reversal can be controlled by the parent company, and it is probable that the temporary differenceswill not reverse in the foreseeable future.
Deferred income tax relating to items directly recognized in equity is also recognized in equity. Deferred taxassets and liabilities resulting from business combinations are added to or deducted from goodwill.
Deferred tax assets and liabilities are offset only if a legally enforceable right exists to set off current taxassets against current income tax liabilities and the deferred taxes relate to the same taxable entity and the sametaxation authority.
p) Revenue and expenses
Revenue and expenses are recognized on the income statement on an accruals basis, i.e. when the goods orservices represented by them take place, regardless of when actual payment or collection occurs.
Revenue is measured at the fair value of the consideration received or to be received, and represents theamounts to be collected for goods or services sold, net of discounts, returns and value added tax. Revenue isrecognized when the income can be reliably measured, when it is probable that the Group will receive a futureeconomic benefit, and when certain conditions are met for each Group activity carried out.
Sales of services are recognized in the accounting period in which the services are rendered, with referenceto the percentage completion, when the revenue and costs of the services contract, as well as the stage ofcompletion thereof, can be reliably estimated, and it is probable that the related receivables will be recovered.When one or more of these service contract elements cannot be reliably estimated, revenue from the sale ofservices are recognized only up to the amount of contract costs incurred the recovery of which is deemed to beprobable.
The Atento Group obtains revenue mainly from the provision of customer services, recognizing the revenuewhen the teleoperation occurs (based on the stage of completion of the service provided) or when certain contactcenter consulting work is carried out.
Expenses are recognized in the income statement on an accruals basis, i.e. when the goods or servicesrepresented by them take place, regardless of when actual payment or collection occurs.
The Atento Group’s incorporation, start-up and research expenses, as well as expenses that do not qualifyfor capitalization under IFRS, are recognized in the consolidated income statement when incurred and classifiedin accordance with their nature.
q) Interest income and expenses
Interest expenses incurred in the construction of any qualified asset is capitalized during the time necessaryto complete the asset and prepare it for the intended use. All other interest expenditure is expensed in the year inwhich it is incurred.
Interest income is recognized using the effective interest method. When a loan or a receivable has beenimpaired, the carrying amount is reduced to the recoverable amount, discounting the estimated future cash flowat the instrument’s original effective interest rate and recognizing the discount as a decrease in interest income.Interest income on impaired loans is recognized when the cash is collected or on the basis of the recovery of thecosts when the loan is secured.
F-19
r) Leases (as lessee)
Leases where the lessor does not transfer substantially all of the risks and benefits of ownership of the assetare classified as operating leases. Operating lease payments are recognized as an expense in the income statementon a straight line basis over the lease term.
The Atento Group rents certain properties. Those lease arrangements under which the Atento Group holdsthe significant risks and benefits inherent in owning the leased item are treated as finance leases. Finance leasesare capitalized as an asset at the inception of the lease period and classified according to their nature. The relateddebt is recorded at the lower of the present value of the minimum lease payments agreed, and the fair value of theleased asset. Lease payments are proportionally allocated to the principal of the lease liability and to financecharges. Finance charges are reflected in the income statement over the lease term so as to achieve a constant rateof interest on the balance pending repayment in each period.
s) Critical accounting estimates and assumptions
The preparation of consolidated financial statements under IFRS requires the use of certain assumptions andestimates that affect the recognized amount of assets, liabilities, income and expenses, as well as the relatedbreakdowns.
Some of the accounting policies applied in preparing the accompanying consolidated financial statementsrequired Management to apply significant judgments in order to select the most appropriate assumptions fordetermining these estimates. These assumptions and estimates are based on Management experience, the adviceof consultants and experts, forecasts and other circumstances and expectations prevailing at year end.Management’s evaluation takes into account the global economic situation in the sector in which the AtentoGroup operates, as well as the future outlook for the business. By virtue of their nature, these judgments areinherently subject to uncertainty. Consequently, actual results could differ substantially from the estimates andassumptions used. Should this occur, the values of the related assets and liabilities would be adjustedaccordingly.
At the date of preparation of these consolidated financial statements, no relevant changes are forecast in theestimates. As a result, no significant adjustments in the values of the assets and liabilities recognized atDecember 31, 2013 and 2014 are expected.
Although these estimates were made on the basis of the best information available at each reporting date onthe events analyzed, events that take place in the future might make it necessary to change these estimates incoming years. Changes in accounting estimates would be applied prospectively in accordance with therequirements of IAS 8, “Accounting Policies, Changes in Accounting Estimates and Errors”, recognizing theeffects of the changes in estimates in the related consolidated income statement.
An explanation of the estimates and judgments that entail a significant risk of leading to a materialadjustment in the carrying amounts of assets and liabilities in the coming financial year is as follow:
Revenue recognition
The Atento Group recognizes revenue on an accruals basis during the period in which the services arerendered, with reference to the stage of completion of the specific transaction, and assessed on the basis of theactual service provided as a proportion of the total services to be provided, as described in Note 3p above.Recognizing service revenue with reference to the stage of completion involves the use of estimates in relation tocertain key elements of the service contracts, such as contract costs, period of execution and allowances relatedto the contracts. As far as is practical, the Atento Group applies its past experience and specific quantitativeindicators in its estimates, considering the specific circumstances applicable to specific customers or contracts. Ifcertain circumstances have occurred that may have an impact the initially estimated revenue, costs or percentageof completion, estimates are reviewed based on such circumstances. Such reviews may result in adjustments tocosts and revenue recognized for a period.
Useful lives of property, plant and equipment and intangible assets
The accounting treatment of items of property, plant and equipment and intangible assets entails the use ofestimates to determine their useful lives for depreciation and amortization purposes. In determining the useful
F-20
life, it is necessary to estimate the level of use of assets as well as forecast technological trends in the assets.Assumptions regarding the level of use, the technological framework and the future development require asignificant degree of judgment, bearing in mind that these aspects are rather difficult to foresee. Changes in thelevel of use of assets or in their technological development could result in a modification of their useful lives and,consequently, in the associated depreciation or amortization.
Estimated impairment of goodwill
The Atento Group tests goodwill for impairment annually, in accordance with the accounting principledescribed in Note 3h. Goodwill is subject to impairment testing as part of the cash-generating unit to which it hasbeen allocated. The recoverable amounts of cash-generating units defined in order to identify potentialimpairment in goodwill are determined on the basis of value in use, applying five-year financial forecasts basedon the Atento Group’s strategic plans, approved and reviewed by Management. These calculations entail the useof assumptions and estimates, and require a significant degree of judgment. The main variables considered in thesensitivity analyses are growth rates, discount rates using the Weighted Average Cost of Capital (“WACC”) andthe key business variables.
Deferred taxes
The Atento Group assesses the recoverability of deferred tax assets based on estimates of future earnings.The ability to recover these deferred amounts depends ultimately on the Atento Group’s ability to generatetaxable earnings over the period in which the deferred tax assets remain deductible. This analysis is based on theestimated timing of the reversal of deferred tax liabilities, as well as estimates of taxable earnings, which aresourced from internal projections and are continuously updated to reflect the latest trends.
The appropriate classification of tax assets and liabilities depends on a series of factors, including estimatesas to the timing and realization of deferred tax assets and the projected tax payment schedule. Actual income taxreceipts and payments could differ from the estimates made by the Atento Group as a result of changes in taxlegislation or unforeseen transactions that could affect the tax balances (see Note 20).
The Atento Group has recognized tax credits corresponding to losses carried forward since, based oninternal projections, it is probable there will be future taxable profits against which they may be utilized.
The carrying amount of deferred income tax assets is reviewed at each reporting date, and reduced to theextent that it is no longer probable that sufficient taxable profits will be available to allow all or part of thatdeferred tax asset to be utilized. Unrecognized deferred income tax assets are reassessed at each reporting dateand are recognized to the extent that it has become probable that future taxable profits will allow the deferred taxasset to be recovered.
Provisions and contingencies
Provisions are recognized when the Atento Group has a present obligation as a result of a past event, it isprobable that an outflow of resources will be required to settle the obligation and a reliable estimate can be madeof the amount of the obligation. This obligation may be legal or constructive, deriving from, inter alia,regulations, contracts, customary practice or public commitments that would lead third parties to reasonablyexpect that the Atento Group will assume certain responsibilities. The amount of the provision is determinedbased on the best estimate of the outlay required to settle the obligation, taking into account all availableinformation as at the reporting date, including the opinions of independent experts such as legal counsel orconsultants.
No provision is recognized if the amount of liability cannot be estimated reliably. In such cases, the relevantinformation would be provided in the notes to the consolidated financial statements.
Given the uncertainties inherent in the estimates used to determine the amount of provisions, actual outflowsof resources may differ from the amounts recognized originally on the basis of these estimates (see Note 21).
Fair value of derivatives and contingent-value instruments
The Atento Group uses derivative financial instruments to mitigate risks, primarily derived from possiblefluctuations in interest rates on loans received. Derivatives are recognized at the onset of the contract at fairvalue, subsequently re-measuring the fair value and adjusting as necessary at each reporting date.
F-21
The fair values of derivative financial instruments are calculated on the basis of observable market dataavailable, either in terms of market prices or through the application of valuation techniques. The valuationtechniques used to calculate the fair value of derivative financial instruments include the discounting of futurecash flow associated with the instruments, applying assumptions based on market conditions at the valuation dateor using prices established for similar instruments, among others. These estimates are based on available marketinformation and appropriate valuation techniques. The fair values calculated could differ significantly if othermarket assumptions and/or estimation techniques were applied.
Discounted cash flow analyses are used to analyze the fair value of the contingent-value instruments(“CVIs”). The fair value of the CVIs is based upon discounted cash flow analyses, for which the determination offair value requires significant management judgment or estimation and results in a higher degree of financialstatement volatility.
t) Consolidation method
All subsidiaries are fully consolidated. Intra-group income and expenses are eliminated on consolidation, asare all receivables and payables between Group companies. Gains and losses arising on intra-group transactionsare also eliminated. Where necessary, the accounting policies of subsidiaries have been brought into line withthose adopted in the Atento Group.
The details of Atento Group subsidiaries at December 31, 2012, 2013 and 2014 are as follow:
NameRegistered
address Line of businessFunctionalcurrency % interest Holding company
Atalaya Luxco Midco, S.à.r.l . . . . . . . Luxembourg Holding company EUR 100 Atento S.A.
Atento Luxco 1 S.A . . . . . . . . . . . . . . . Luxembourg Holding company EUR 100 Atalaya Luxco Midco, S.à.r.l
Atalaya Luxco 2. S.à.r.l . . . . . . . . . . . Luxembourg Holding company EUR 100 Atento Luxco 1. S.A.
Atalaya Luxco 3. S.à.r.l . . . . . . . . . . . Luxembourg Holding company EUR 100 Atento Luxco 1. S.A.
Atento Argentina. S.A(1) . . . . . . . . . . .Buenos Aires(Argentina)
Operation of callcenters ARS
9010
Atalaya Luxco 2. S.à.r.l.Atalaya Luxco 3. S.à.r.l.
Global Rossolimo. S.L.U . . . . . . . . . . . Madrid (Spain) Holding company EUR 100 Atento Spain Holdco. S.L.U.
Atento Spain Holdco. S.L.U . . . . . . . . Madrid (Spain) Holding company EUR 100 Atento Luxco 1. S.A.
Atento Spain Holdco 6. S.L.U . . . . . . Madrid (Spain) Holding company EUR 100 Atento Spain Holdco. S.L.U.
Atento Spain Holdco 2. S.A.U(2) . . . . . Madrid (Spain) Holding company EUR 100Atento Spain Holdco 6.S.L.U.
Atento Teleservicios España.S.A.U . . . . . . . . . . . . . . . . . . . . . . . . . Madrid (Spain)
Operation of callcenters EUR 100
Atento Spain Holdco 2.S.A.U.
Atento Servicios Técnicos yConsultoría S.A.U . . . . . . . . . . . . . . Madrid (Spain)
Execution oftechnological projectsand services, andconsultancy services EUR 100
Atento Teleservicios EspañaS.A.U.
Atento Impulsa. S.A.U . . . . . . . . . . . . Barcelona (Spain)
Management ofspecializedemployment centersfor disabled workers EUR 100
Atento Teleservicios EspañaS.A.U.
Atento Servicios Auxiliares deContact Center. S.A.U . . . . . . . . . . Madrid (Spain)
Execution oftechnological projectsand services, andconsultancy services EUR 100
Atento Teleservicios España.S.A.U.
Atento Maroc. S.A . . . . . . . . . . . . . . . .Casablanca(Morocco)
Operation of callcenters MAD 99.9991
Atento Teleservicios EspañaS.A.U.
Atento B V . . . . . . . . . . . . . . . . . . . . . .Amsterdam(Netherlands) Holding company EUR 100
Atento Spain Holdco 2.S.A.U.
Teleatento del Perú. S.A.C(3) . . . . . . . Lima (Peru)Operation of callcenters PEN
83.3333(Class A)16.6667(Class B)
Atento B.V.
Atento Holding Chile. S.A.
F-22
NameRegistered
address Line of businessFunctionalcurrency % interest Holding company
Woknal. S.A . . . . . . . . . . . . . . . . . . . . .Montevideo(Uruguay)
Operation of callcenters UYU 100 Atento B.V.
Atento Colombia. S.A . . . . . . . . . . . . .Bogotá DC(Colombia)
Operation of callcenters COP
94.97871 Atento B.V.
0.00424Atento Servicios Auxiliaresde Contact Center. S.L.U.
0.00854Atento Servicios Técnicos yConsultoría. S.L.U.
5.004270Atento Teleservicios España.S.A.U.
0.00424Atento Teleservicios España.S.A.U.
Atento Holding Chile. S.A . . . . . . . . .Santiago de Chile(Chile) Holding company CLP 99.9999 Atento B.V.
Atento Chile. S.A . . . . . . . . . . . . . . . . .Santiago de Chile(Chile)
Operation of callcenters CLP 99.99 Atento Holding Chile. S.A.
Atento Educación Limitada . . . . . . . .Santiago de Chile(Chile)
Operation of callcenters CLP
991
Atento Chile. S.A.Atento Holding Chile. S.A.
Atento Centro de Formación TécnicaLimitada . . . . . . . . . . . . . . . . . . . . . .
Santiago de Chile(Chile)
Operation of callcenters CLP
991
Atento Chile. S.A.Atento Holding Chile. S.A.
Atento Spain Holdco 4. S.A.U . . . . . . Madrid (Spain) Holding company EUR 100 Atento Spain Holdco. S.L.U.
Atento Brasil. S.A . . . . . . . . . . . . . . . . São Paulo (Brazil)Operation of callcenters BRL
99.999Atento Spain Holdco 4.S.A.U.
0.01 Atento Luxco 1, S.A.
Atento Brasil 1 Ltda(4) . . . . . . . . . . . . . São Paulo (Brazil)Operation of callcenters BRL 100 Atento Brasil. S.A.
Atento Spain Holdco 5. S.L.U . . . . . . Madrid (Spain) Holding company EUR 100 Atento Spain Holdco. S.L.U.
Atento Ceská Republika, a.s.(5) . . . . .Praga (CzeckRepublic)
Operation of callcenters EUR 100 Atento Spain Holdco, S.L.U.
Atento Mexico Holdco S. de R.L. deC.V . . . . . . . . . . . . . . . . . . . . . . . . . . Mexico Holding company MXN
99.9667Atento Spain Holdco 5.S.L.U.
0.0333 Atento Spain Holdco. S.L.U.
Atento Puerto Rico. Inc . . . . . . . . . . .Guaynabo(Puerto Rico)
Operation of callcenters USD 100
Atento Mexico Holdco S. deR.L. de C.V..
Contact US Teleservices Inc . . . . . . . .Houston, Texas(USA)
Operation of callcenters USD 100
Atento Mexicana. S.A. deC.V.
Atento Panamá. S.A . . . . . . . . . . . . . . Panama CityOperation of callcenters USD
99Atento Mexico Holdco S. deR.L. de C.V.
1Atento Mexicana. S.A. deC.V.
Atento Atención y Servicios. S.A. deC.V . . . . . . . . . . . . . . . . . . . . . . . . . .
Mexico City(Mexico)
Administrative,professional andconsultancy services MXN
99.998Deutsche Bank México,S.A., IBM, DivisiónFiduciaria Atento Servicios.S.A. de C.V.0.002
Atento Servicios. S.A. de C.V . . . . . . .Mexico City(Mexico)
Sale of goods andservices MXN
99.9995Deutsche Bank México,S.A., IBM, DivisiónFiduciaria Atento Atención yServicios. S.A. de C.V.0.0005
Atento Centroamérica. S.A . . . . . . . .Guatemala(Guatemala) Holding company GTQ
99.9999Atento Mexicana. S.A. deC.V.
0.0001Atento El Salvador S.A. deC.V.
Atento de Guatemala. S.A . . . . . . . . .Guatemala(Guatemala)
Operation of callcenters GTQ
99.99999 Atento Centroamérica. S.A.
0.00001Atento El Salvador S.A. deC.V.
F-23

NameRegistered
address Line of businessFunctionalcurrency % interest Holding company
Atento El Salvador. S.A. de C.V . . . .
City of SanSalvador (ElSalvador)
Operation of callcenters USD
7.4054 Atento Centroamerica. S.A.92.5946 Atento de Guatemala. S.A.
Atento Nicaragua S.A(6) . . . . . . . . . . . NicaraguaOperation of callcenters
1 Atento Centroamerica. S.A.
99Atento Mexico Holdco S. deR.L. de C.V.
Atento Costa Rica S.A(7) . . . . . . . . . . . Costa RicaOperation of callcenters
1 Atento Centroamerica. S.A.
99Atento Mexico Holdco S. deR.L. de C.V.
(1) At December 31, 2013, this company’s corporate name was Centros de Contacto Salta, S.A.(2) On April 9th, 2013, this company was transformed into a Public Limited Company.(3) Teleatento del Peru S.A.C. (Voting power held by each shareholder)
The distribution of profits will be made in the amount and at the time resolved by the Annual General Meeting, and dividends will bepaid in different proportions. The dividends will be distributed among the shareholders, following the agreed proportion, depending onthe class of shares, in the following manner:
(i) Holders of Class “A” shares will have the right to receive 99% of the overall of distributable profits produced by the Companyin each opportunity.
(ii) Holders of Class “B” shares will have the right to receive one (1) per cent from the overall distributable profits produced by theCompany in each opportunity.
(4) Incorporated to Atento Group on December 30, 2014.(5) Sold on December 9th, 2014.(6) Incorporated to Atento Group on the last quarter of 2014.(7) Please refer to footnote n. 5.
At December 31, 2013 and 2014, none of the Group’s subsidiaries is listed on a stock exchange and all useDecember 31 as their reporting date, except for Atento Luxco 1 S.A. which has debt securities listed in theGlobal Exchange Market in Ireland.
All Group companies subject to statutory audit as per local legislation have been audited.
u) New and amended standards and interpretations
The new and amended standards and interpretations issued by the IASB that have entered into force andbeen applied during the year are as follow:
Amendment to IAS 32, “Offsetting Financial Assets and Financial Liabilities”—effective for annual periodsbeginning on or after January 1, 2014.
Amendment to IFRS 10, IFRS 12 and IAS 27, “Investment Entities’—effective for annual periodsbeginning on or after January 1, 2014.
IFRIC 21, “Levies”—effective for annual periods beginning on or after January 1, 2014.
Amendments to IAS 39, “Novation of Derivatives and Continuation of Hedge Accounting”—effective forannual periods beginning on or after January 1, 2014.
These standards have not had a significant effect on the Atento Group’s consolidated financial statements,with the exception of modifications in presentation and disclosures that have been included in the Atento Group’sconsolidated financial statements.
New and amended standards and interpretations that have yet to enter into force and that have not beenadopted early by the Atento Group.
At the date of publication of these consolidation financial statements, the IASB has issued the followingnew and amended standards and interpretations, which enter into force for accounting periods beginning on orafter January 1, 2015 and that the Atento Group has not adopted early.
F-24
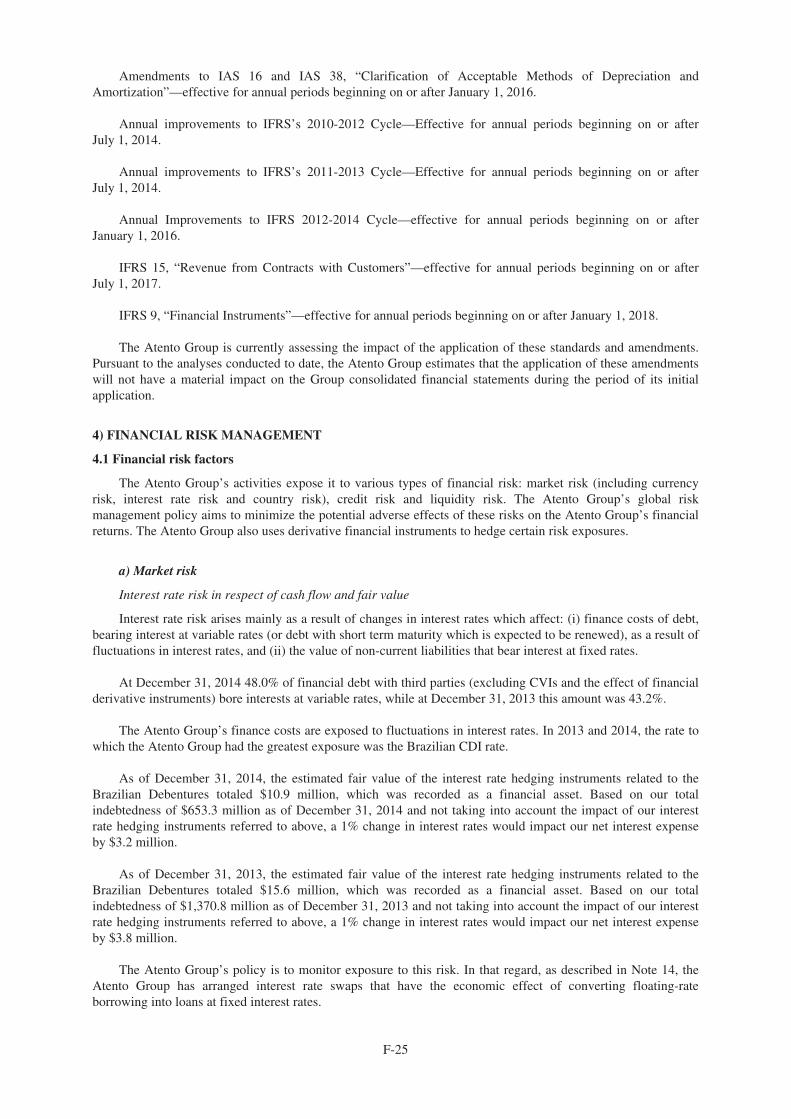
Amendments to IAS 16 and IAS 38, “Clarification of Acceptable Methods of Depreciation andAmortization”—effective for annual periods beginning on or after January 1, 2016.
Annual improvements to IFRS’s 2010-2012 Cycle—Effective for annual periods beginning on or afterJuly 1, 2014.
Annual improvements to IFRS’s 2011-2013 Cycle—Effective for annual periods beginning on or afterJuly 1, 2014.
Annual Improvements to IFRS 2012-2014 Cycle—effective for annual periods beginning on or afterJanuary 1, 2016.
IFRS 15, “Revenue from Contracts with Customers”—effective for annual periods beginning on or afterJuly 1, 2017.
IFRS 9, “Financial Instruments”—effective for annual periods beginning on or after January 1, 2018.
The Atento Group is currently assessing the impact of the application of these standards and amendments.Pursuant to the analyses conducted to date, the Atento Group estimates that the application of these amendmentswill not have a material impact on the Group consolidated financial statements during the period of its initialapplication.
4) FINANCIAL RISK MANAGEMENT
4.1 Financial risk factors
The Atento Group’s activities expose it to various types of financial risk: market risk (including currencyrisk, interest rate risk and country risk), credit risk and liquidity risk. The Atento Group’s global riskmanagement policy aims to minimize the potential adverse effects of these risks on the Atento Group’s financialreturns. The Atento Group also uses derivative financial instruments to hedge certain risk exposures.
a) Market risk
Interest rate risk in respect of cash flow and fair value
Interest rate risk arises mainly as a result of changes in interest rates which affect: (i) finance costs of debt,bearing interest at variable rates (or debt with short term maturity which is expected to be renewed), as a result offluctuations in interest rates, and (ii) the value of non-current liabilities that bear interest at fixed rates.
At December 31, 2014 48.0% of financial debt with third parties (excluding CVIs and the effect of financialderivative instruments) bore interests at variable rates, while at December 31, 2013 this amount was 43.2%.
The Atento Group’s finance costs are exposed to fluctuations in interest rates. In 2013 and 2014, the rate towhich the Atento Group had the greatest exposure was the Brazilian CDI rate.
As of December 31, 2014, the estimated fair value of the interest rate hedging instruments related to theBrazilian Debentures totaled $10.9 million, which was recorded as a financial asset. Based on our totalindebtedness of $653.3 million as of December 31, 2014 and not taking into account the impact of our interestrate hedging instruments referred to above, a 1% change in interest rates would impact our net interest expenseby $3.2 million.
As of December 31, 2013, the estimated fair value of the interest rate hedging instruments related to theBrazilian Debentures totaled $15.6 million, which was recorded as a financial asset. Based on our totalindebtedness of $1,370.8 million as of December 31, 2013 and not taking into account the impact of our interestrate hedging instruments referred to above, a 1% change in interest rates would impact our net interest expenseby $3.8 million.
The Atento Group’s policy is to monitor exposure to this risk. In that regard, as described in Note 14, theAtento Group has arranged interest rate swaps that have the economic effect of converting floating-rateborrowing into loans at fixed interest rates.
F-25
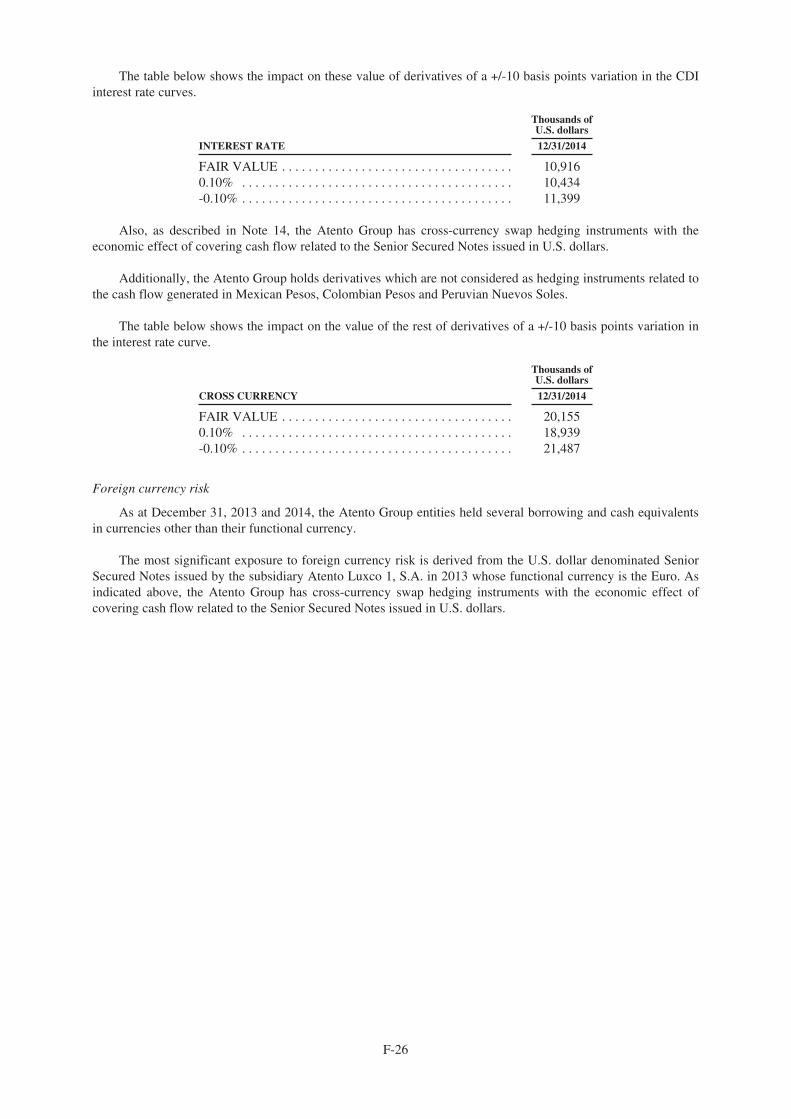
The table below shows the impact on these value of derivatives of a +/-10 basis points variation in the CDIinterest rate curves.
Thousands ofU.S. dollars
INTEREST RATE 12/31/2014
FAIR VALUE . . . . . . . . . . . . . . . . . . . . . . . . . . . . . . . . . . . 10,9160.10% . . . . . . . . . . . . . . . . . . . . . . . . . . . . . . . . . . . . . . . . . 10,434-0.10% . . . . . . . . . . . . . . . . . . . . . . . . . . . . . . . . . . . . . . . . . 11,399
Also, as described in Note 14, the Atento Group has cross-currency swap hedging instruments with theeconomic effect of covering cash flow related to the Senior Secured Notes issued in U.S. dollars.
Additionally, the Atento Group holds derivatives which are not considered as hedging instruments related tothe cash flow generated in Mexican Pesos, Colombian Pesos and Peruvian Nuevos Soles.
The table below shows the impact on the value of the rest of derivatives of a +/-10 basis points variation inthe interest rate curve.
Thousands ofU.S. dollars
CROSS CURRENCY 12/31/2014
FAIR VALUE . . . . . . . . . . . . . . . . . . . . . . . . . . . . . . . . . . . 20,1550.10% . . . . . . . . . . . . . . . . . . . . . . . . . . . . . . . . . . . . . . . . . 18,939-0.10% . . . . . . . . . . . . . . . . . . . . . . . . . . . . . . . . . . . . . . . . . 21,487
Foreign currency risk
As at December 31, 2013 and 2014, the Atento Group entities held several borrowing and cash equivalentsin currencies other than their functional currency.
The most significant exposure to foreign currency risk is derived from the U.S. dollar denominated SeniorSecured Notes issued by the subsidiary Atento Luxco 1, S.A. in 2013 whose functional currency is the Euro. Asindicated above, the Atento Group has cross-currency swap hedging instruments with the economic effect ofcovering cash flow related to the Senior Secured Notes issued in U.S. dollars.
F-26
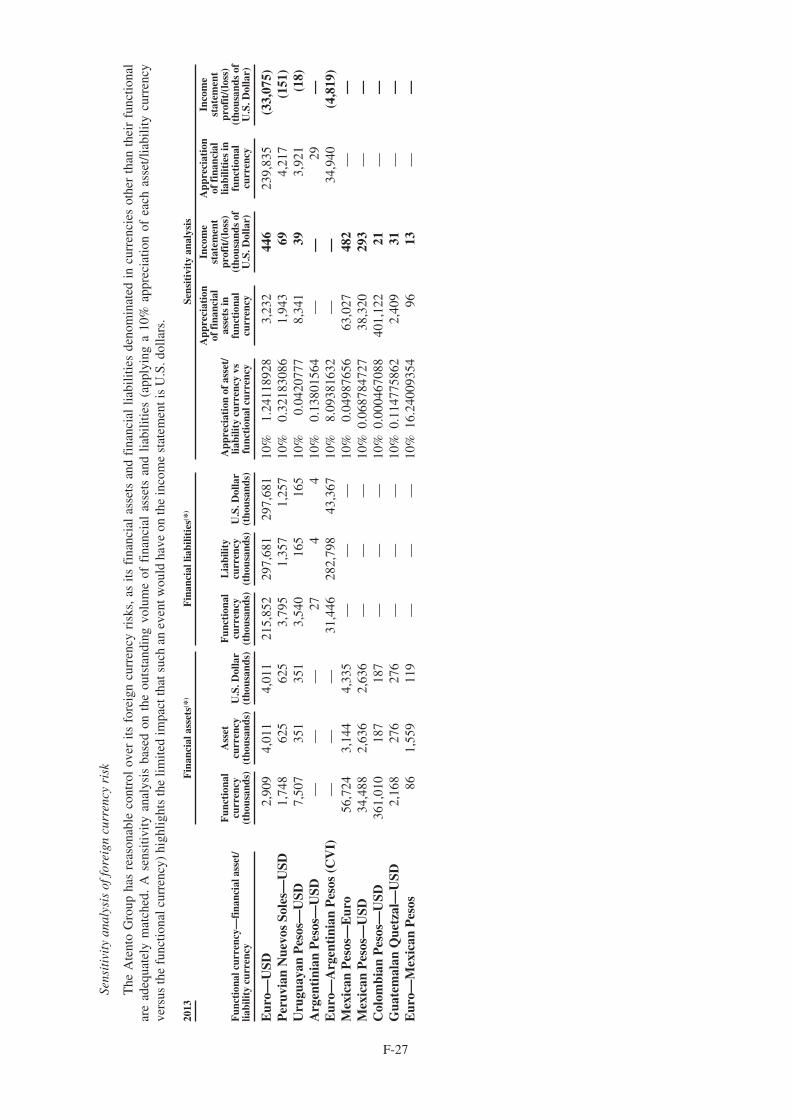
Sens
itiv
ity
anal
ysis
offo
reig
ncu
rren
cyri
sk
The
Ate
nto
Gro
upha
sre
ason
able
cont
rol
over
itsfo
reig
ncu
rren
cyri
sks,
asits
fina
ncia
las
sets
and
fina
ncia
llia
bilit
ies
deno
min
ated
incu
rren
cies
othe
rth
anth
eir
func
tiona
lar
ead
equa
tely
mat
ched
.A
sens
itivi
tyan
alys
isba
sed
onth
eou
tsta
ndin
gvo
lum
eof
fina
ncia
las
sets
and
liabi
litie
s(a
pply
ing
a10
%ap
prec
iatio
nof
each
asse
t/lia
bilit
ycu
rren
cyve
rsus
the
func
tiona
lcur
renc
y)hi
ghlig
hts
the
limite
dim
pact
that
such
anev
entw
ould
have
onth
ein
com
est
atem
enti
sU
.S.d
olla
rs.
2013
Fin
anci
alas
sets
( *)
Fin
anci
allia
bilit
ies(
*)Se
nsit
ivit
yan
alys
is
Fun
ctio
nalc
urre
ncy—
fina
ncia
lass
et/
liabi
lity
curr
ency
Fun
ctio
nal
curr
ency
(tho
usan
ds)
Ass
etcu
rren
cy(t
hous
ands
)U
.S.D
olla
r(t
hous
ands
)
Fun
ctio
nal
curr
ency
(tho
usan
ds)
Lia
bilit
ycu
rren
cy(t
hous
ands
)U
.S.D
olla
r(t
hous
ands
)
App
reci
atio
nof
asse
t/lia
bilit
ycu
rren
cyvs
func
tion
alcu
rren
cy
App
reci
atio
nof
fina
ncia
las
sets
infu
ncti
onal
curr
ency
Inco
me
stat
emen
tpr
ofit
/(lo
ss)
(tho
usan
dsof
U.S
.Dol
lar)
App
reci
atio
nof
fina
ncia
llia
bilit
ies
infu
ncti
onal
curr
ency
Inco
me
stat
emen
tpr
ofit
/(lo
ss)
(tho
usan
dsof
U.S
.Dol
lar)
Eur
o—U
SD2,
909
4,01
14,
011
215,
852
297,
681
297,
681
10%
1.24
1189
283,
232
446
239,
835
(33,
075)
Per
uvia
nN
uevo
sSo
les—
USD
1,74
862
562
53,
795
1,35
71,
257
10%
0.32
1830
861,
943
694,
217
(151
)U
rugu
ayan
Pes
os—
USD
7,50
735
135
13,
540
165
165
10%
0.04
2077
78,
341
393,
921
(18)
Arg
enti
nian
Pes
os—
USD
——
—27
44
10%
0.13
8015
64—
—29
—E
uro—
Arg
enti
nian
Pes
os(C
VI)
——
—31
,446
282,
798
43,3
6710
%8.
0938
1632
——
34,9
40(4
,819
)M
exic
anP
esos
—E
uro
56,7
243,
144
4,33
5—
——
10%
0.04
9876
5663
,027
482
——
Mex
ican
Pes
os—
USD
34,4
882,
636
2,63
6—
——
10%
0.06
8784
727
38,3
2029
3—
—C
olom
bian
Pes
os—
USD
361,
010
187
187
——
—10
%0.
0004
6708
840
1,12
221
——
Gua
tem
alan
Que
tzal
—U
SD2,
168
276
276
——
—10
%0.
1147
7586
22,
409
31—
—E
uro—
Mex
ican
Pes
os86
1,55
911
9—
——
10%
16.2
4009
354
9613
——
F-27
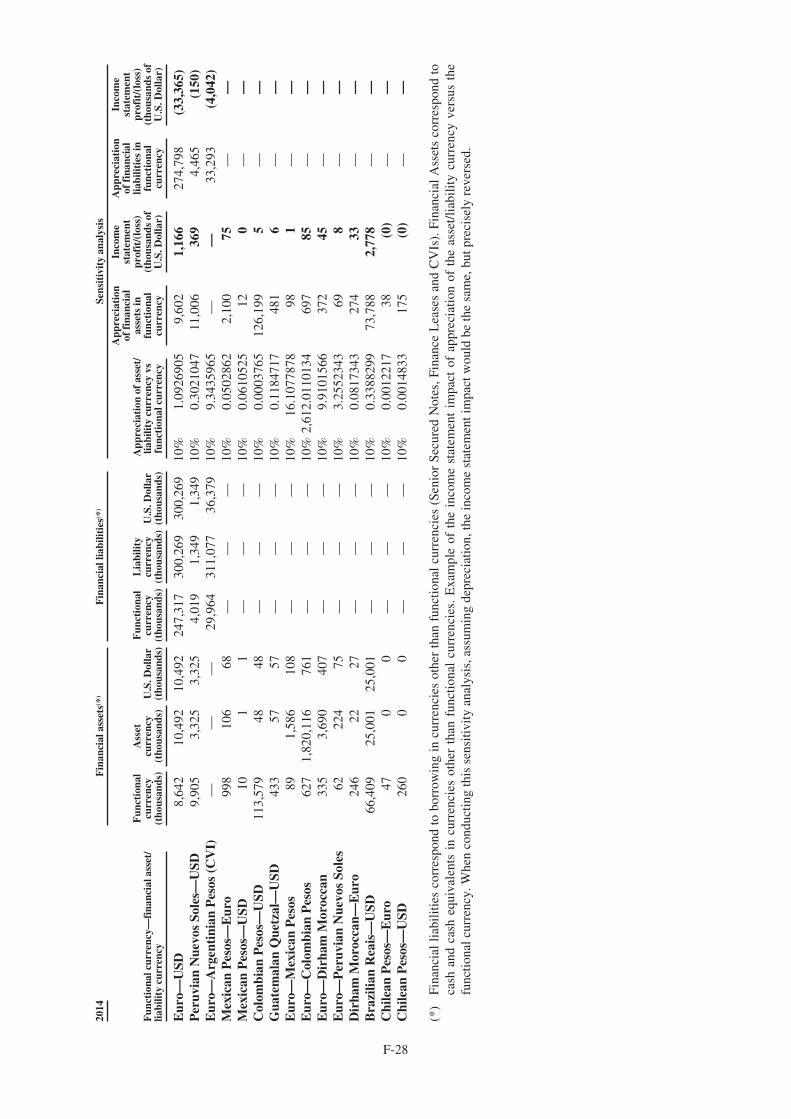
2014
Fin
anci
alas
sets
( *)
Fin
anci
allia
bilit
ies(
*)Se
nsit
ivit
yan
alys
is
Fun
ctio
nalc
urre
ncy—
fina
ncia
lass
et/
liabi
lity
curr
ency
Fun
ctio
nal
curr
ency
(tho
usan
ds)
Ass
etcu
rren
cy(t
hous
ands
)U
.S.D
olla
r(t
hous
ands
)
Fun
ctio
nal
curr
ency
(tho
usan
ds)
Lia
bilit
ycu
rren
cy(t
hous
ands
)U
.S.D
olla
r(t
hous
ands
)
App
reci
atio
nof
asse
t/lia
bilit
ycu
rren
cyvs
func
tion
alcu
rren
cy
App
reci
atio
nof
fina
ncia
las
sets
infu
ncti
onal
curr
ency
Inco
me
stat
emen
tpr
ofit
/(lo
ss)
(tho
usan
dsof
U.S
.Dol
lar)
App
reci
atio
nof
fina
ncia
llia
bilit
ies
infu
ncti
onal
curr
ency
Inco
me
stat
emen
tpr
ofit
/(lo
ss)
(tho
usan
dsof
U.S
.Dol
lar)
Eur
o—U
SD8,
642
10,4
9210
,492
247,
317
300,
269
300,
269
10%
1.09
2690
59,
602
1,16
627
4,79
8(3
3,36
5)P
eruv
ian
Nue
vos
Sole
s—U
SD9,
905
3,32
53,
325
4,01
91,
349
1,34
910
%0.
3021
047
11,0
0636
94,
465
(150
)E
uro—
Arg
enti
nian
Pes
os(C
VI)
——
—29
,964
311,
077
36,3
7910
%9.
3435
965
——
33,2
93(4
,042
)M
exic
anP
esos
—E
uro
998
106
68—
——
10%
0.05
0286
22,
100
75—
—M
exic
anP
esos
—U
SD10
11
——
—10
%0.
0610
525
120
——
Col
ombi
anP
esos
—U
SD11
3,57
948
48—
——
10%
0.00
0376
512
6,19
95
——
Gua
tem
alan
Que
tzal
—U
SD43
357
57—
——
10%
0.11
8471
748
16
——
Eur
o—M
exic
anP
esos
891,
586
108
——
—10
%16
.107
7878
981
——
Eur
o—C
olom
bian
Pes
os62
71,
820,
116
761
——
—10
%2,
612.
0110
134
697
85—
—E
uro—
Dir
ham
Mor
occa
n33
53,
690
407
——
—10
%9.
9101
566
372
45—
—E
uro—
Per
uvia
nN
uevo
sSo
les
6222
475
——
—10
%3.
2552
343
698
——
Dir
ham
Mor
occa
n—E
uro
246
2227
——
—10
%0.
0817
343
274
33—
—B
razi
lian
Rea
is—
USD
66,4
0925
,001
25,0
01—
——
10%
0.33
8829
973
,788
2,77
8—
—C
hile
anP
esos
—E
uro
470
0—
——
10%
0.00
1221
738
(0)
——
Chi
lean
Pes
os—
USD
260
00
——
—10
%0.
0014
833
175
(0)
——
(*)
Fina
ncia
llia
bilit
ies
corr
espo
ndto
borr
owin
gin
curr
enci
esot
her
than
func
tiona
lcu
rren
cies
(Sen
ior
Secu
red
Not
es,F
inan
ceL
ease
san
dC
VIs
).Fi
nanc
ial
Ass
ets
corr
espo
ndto
cash
and
cash
equi
vale
nts
incu
rren
cies
othe
rth
anfu
nctio
nal
curr
enci
es.
Exa
mpl
eof
the
inco
me
stat
emen
tim
pact
ofap
prec
iatio
nof
the
asse
t/lia
bilit
ycu
rren
cyve
rsus
the
func
tiona
lcur
renc
y.W
hen
cond
uctin
gth
isse
nsiti
vity
anal
ysis
,ass
umin
gde
prec
iatio
n,th
ein
com
est
atem
enti
mpa
ctw
ould
beth
esa
me,
butp
reci
sely
reve
rsed
.
F-28
Country risk
To manage or mitigate country risk, the Atento Group repatriates the funds generated in the Americas andBrazil that are not required to pursue new, profitable business opportunities in the region. The capital structure ofthe Atento Group comprises two separate ring-fenced financings: (i) the Brazilian Debentures denominated inBrazilian Reais and (ii) the USD 300 million 7.375% Senior Secured Notes due 2020, together with the€50 million ($60.7 million) Revolving Credit Facility. The objective of combining a Brazilian term loan with aUSD bond is to create a natural hedge for the interest payments on the Brazilian loan, which are serviced withcash flow from Atento Brazil denominated in Brazilian Reais.
Argentinian subsidiary sit outside of these two separate ring-fenced financings, and as a result, we do notrely on cash flow from these operations to serve our Company’s debt commitments.
b) Credit risk
The Atento Group seeks to conduct all of its business with reputable national and international companiesand institutions of established solvency in their countries of origin, so as to minimize credit risk. As a result ofthis policy, the Atento Group has no material adjustments to make to its trade accounts (see Note 13 onimpairment allowances).
Accordingly, the Atento Group’s commercial credit risk management approach is based on continuousmonitoring of the risks assumed and the financial resources necessary to manage the Group’s various units, inorder to optimize the risk-reward relationship in the development and implementation of business plans in thecourse of their regular business.
Credit risk arising from cash and cash equivalents is managed by placing cash surpluses in high quality andhighly liquid money market assets. These placements are regulated by a master agreement revised annually onthe basis of the conditions prevailing in the markets and the countries where Atento operates. The masteragreement establishes: (i) the maximum amounts to be invested per counterparty, based on their ratings (long andshort term debt ratings); (ii) the maximum period of the investment; and (iii) the instruments in which thesurpluses may be invested.
The Atento Group’s maximum exposure to credit risk is primarily limited to the carrying amounts of itsfinancial assets (see Notes 11, 12, 13, 14 and 15). The Atento Group holds no guarantees as collection insurance.As disclosed in Note 23, the Atento Group carries out significant transactions with the Telefónica Group. AtDecember 31, 2014 the balance of accounts receivable with Telefónica Group amounted to 236,950 thousandU.S. dollars (302,234 the thousand U.S. dollars in 2013).
c) Liquidity risk
The Atento Group seeks to match its debt maturity schedule to its capacity to generate cash flow to meet thepayments falling due, factoring in a comfortable cushion. In practice, this has meant that the Atento Group’saverage debt maturity must be longer than the length of time required to pay its debt (assuming that internalprojections are met). A maturity schedule for the Atento Group’s financial liabilities is provided in Note 16.
4.2 Capital Management
The Atento Group’s Finance Department, which is in charge of the capital management, takes variousfactors into consideration when determining the Group’s capital structure.
The Atento Group’s capital management goal is to determine the financial resources necessary both tocontinue its recurring activities and to maintain a capital structure that optimizes own and borrowed funds.
The Atento Group sets an optimal debt level in order to maintain a flexible and comfortable medium termborrowing structure, in order to be able to carry out its routine activities under normal conditions and alsoaddress new opportunities for growth. Debt levels are kept in line with forecast future cash flows and withquantitative restrictions imposed under financing contracts.
In addition to these general guidelines, other considerations and specifics are taken into account whendetermining the Atento Group’s financial structure, such as country risk in the broadest sense, tax efficiency andvolatility in cash flow generation.
F-29
As indicated in Note 17, among the restrictions imposed under financing arrangements, the debenturescontract lays out certain general obligations and disclosures in respect of the lending institutions. Specifically, theborrower (BC Brazilco Participações, S.A., which has now merged with Atento Brasil, S.A.) must comply withthe quarterly net financial debt/EBITDA ratio set out in the contract terms.
The contract also sets out additional restrictions, including limitations on dividends, payments anddistributions to shareholders and capacity to incur additional debt.
The Super Senior Revolving Credit Facility, also described in Note 17, carries no financial covenantobligations regarding debt levels. However, the credit facility does impose limitations on the use of the funds,linked to compliance with a debt ratio. The contract also includes other restrictions, including: limitations on thedistribution of dividends, payments or distributions to shareholders, the capacity to incur additional debt, and oninvestments and disposal of assets.
The Senior Secured Notes issued in 2013 carry no limitation covenant obligations regarding debt levels.However, the Notes do impose limitations on the distributions on dividends, payments or distributions to theshareholders, the incurring of additional debt, and on investments and disposals of assets.
As at the date of these consolidated financial statements, the Atento Group was in compliance with allrestrictions established in the aforementioned financing contracts, and does not foresee any future non-compliance. To that end, the Atento Group regularly monitors figures for net financial debt with third parties andEBITDA.
The reconciliation between EBITDA and the consolidated income statement is as follow:
Thousands of U.S. dollars
December 1 toDecember 31,
For the year endedDecember 31,
2012 2013 2014
Loss for the period from continuing operations (56,620) (4,039) (42,152)Income tax expense 8,132 8,346 18,533Net finance expense 6,044 100,667 110,769Depreciation and Amortization 7,500 128,975 119,820
EBITDA (34,944) 233,949 206,970
Net financial debt with third parties at December 31, 2013 and 2014 is as follow:
Thousands of U.S. dollars
12/31/2013 12/31/2014
Senior Secured Notes (Note 17) 297,681 300,269Brazilian bonds—Debentures (Note 17) 345,854 245,932Bank borrowing (Note 17) 632 61,720Finance lease payables (Note 17) 11,877 9,010CVIs (Note 17) 43,367 36,379Vendor Loans (Note 17) 151,701 —Derivative financial liabilities (Note 14) 15,962 1,193Less: Cash and cash equivalents (Note 15) (213,491) (211,440)
Net financial debt with third parties 653,583 443,063
4.3 Fair value estimation
The table below shows an analysis of the financial instruments measured at fair value, classified accordingto the valuation method used. The following valuation levels are used:
Prices (unadjusted) quoted in active markets for identical assets and liabilities (Level 1).
Data other than the Level 1 quoted price that are observable for the asset or liability, either directly (i.e.prices) or indirectly (i.e. price derivatives) (Level 2).
Data for the asset or liability that are not based on observable market data (Level 3).
F-30
The Atento Group’s assets and liabilities measured at fair value at December 31, 2013 and 2014 are asfollow:
Thousands of U.S. dollars
2013 Level 1 Level 2 Level 3 Total balance
AssetsDerivatives (Note 14) — 18,296 — 18,296
Total assets — 18,296 — 18,296
LiabilitiesDerivatives (Note 14) — (15,962) — (15,962)CVIs (Note 17) — — (43,367) (43,367)
Total liabilities — (15,962) (43,367) (59,329)
Thousands of U.S. dollars
2014 Level 1 Level 2 Level 3 Total balance
AssetsDerivatives (Note 14) — 32,265 — 32,265
Total assets — 32,265 — 32,265
LiabilitiesDerivatives (Note 14) — (1,193) — (1,193)CVIs (Note 17) — — (36,379) (36,379)
Total liabilities — (1,193) (36,379) (37,572)
No transfers were carried out between the different levels during the year.
The following table reflects the movements of the Atento Group’s Contingent Value Instruments (“CVIs”)described in Note 17 measured at fair value using significant unobservable inputs as at December 31, 2013 and2014:
December 31,
2013 2014
Fair value at the beginning of the period (52,275) (43,367)Change in fair value (5,630) (6,187)Translation differences 14,538 13,175
Fair value at December 31 (Note 17) (43,367) (36,379)
a) Level 1 financial instruments:
The fair value of financial instruments traded on active markets is based on the quoted market price at thereporting date. A market is considered active when trading prices are easily and regularly available through astock exchange, financial intermediary, industry institution, price service or regulatory body, and when theseprices reflect actual routine arm’s length market transactions. The quoted market price used for the AtentoGroup’s financial assets is the current bid price. These instruments are classified in Level 1, although as at thedates in question, the Atento Group had no Level 1 financial instruments.
b) Level 2 financial instruments:
The fair value of financial instruments not traded in an active market (i.e. OTC derivatives) is determinedusing valuation techniques. Valuation techniques maximize the use of available observable market data, andplace as little reliance as possible on specific company estimates. If all of the significant inputs required tocalculate the fair value of a financial instrument are observable, the instrument is classified in Level 2. TheAtento Group’s Level 2 financial instruments comprise interest rate swaps used to hedge floating rate loans andcross currency swaps.
c) Level 3 financial instruments:
If one or more significant inputs are not based on observable market data, the instrument is classified inLevel 3.
F-31
The specific financial instrument valuation techniques used by the Atento Group include the following:
• Quoted market prices or prices established by financial intermediaries for similar instruments.
• The fair value of interest rate swaps is calculated as the present value of the future estimated cash flowbased on estimated interest rate curves.
• The present value of foreign currency futures is determined using forward exchange rates at thereporting date, discounting the resulting amount from the present value.
• Discounted cash flow analyses are used to determine the fair value of the CVIs, as discussed in Note17. The fair values of the CVIs are based upon discounted cash flow analyses for which thedetermination of fair value requires significant management judgment or estimation and result in ahigher degree of financial statement volatility. As observable market activity is often unavailable whenestimating the fair value of the CVIs, we estimate the fair value using a modeling technique whichincludes the use of a variety of inputs/assumptions including interest rates or other relevant inputs.Changes in the significant underlying factors or assumptions (either an increase or a decrease) in any ofthese areas underlying our estimates may not result in a significant increase/decrease in the fair valuemeasurement of the CVIs. For example, an increase of 100 basis points in the discount rate would notresult in a significant decrease in the fair value of the CVIs.
5) BUSINESS COMBINATIONS
a) Acquisition of the Atento Group by Bain Capital
In 2012 Bain Capital entered into an agreement with Telefónica, S.A. through Atento Luxco 1, S.A. andcertain subsidiaries, to acquire the capital of the core companies forming the Atento Group, the parent of whichwas Atento Inversiones y Teleservicios S.A. (“AIT”), owned by the Telefónica Group and which was nottransferred. These companies are located in Spain, Brazil, Mexico, Argentina, Colombia, Peru, Chile, Morocco,the Netherlands, the Czech Republic, Uruguay, Central America, the United States and Puerto Rico. Theagreement did not extend to AIT’s operations in Venezuela or to shares in AIT itself, although certain AITspecific assets and liabilities did fall under the acquisition.
After obtaining the requisite business concentration approvals from the European Union authorities inOctober and November 2012, the formal agreement was signed on December 12, 2012 for a total acquisitionprice of 1,352,967 thousand U.S. dollars. According to the final contract, Bain Capital and Telefónica, S.A.undertook to establish a price adjustment mechanism based on the combined financial statements at November2012. The parties agreed to a period of 45 business days following the closing date for those statements, as wellas an additional 40 business days for the related audit.
The final amount of the consideration to be paid to the former owner of the Atento Group was determinedduring August 2013 and set at 993,789 thousand U.S. dollars for the equity of Atento after deducting the value ofthe debt to be refinanced and other adjustments, including a deferred consideration of 142,846 thousand U.S.dollars and a contingent consideration of 51,451 thousand U.S. dollars (CVIs).
The costs relating to the acquisition were recognized under other operating expenses in the consolidatedincome statement for the one month period ended December 31, 2012 and the year ended December 31, 2013(62,395 thousand U.S. dollars and 1,381 thousand U.S. dollars respectively).
Although the acquisition documents were formally signed on December 12, 2012, control of the companieswas actually acquired on December 1, 2012. Accordingly, the Company reflected the operations acquired in its2012 income statement of that date.
F-32
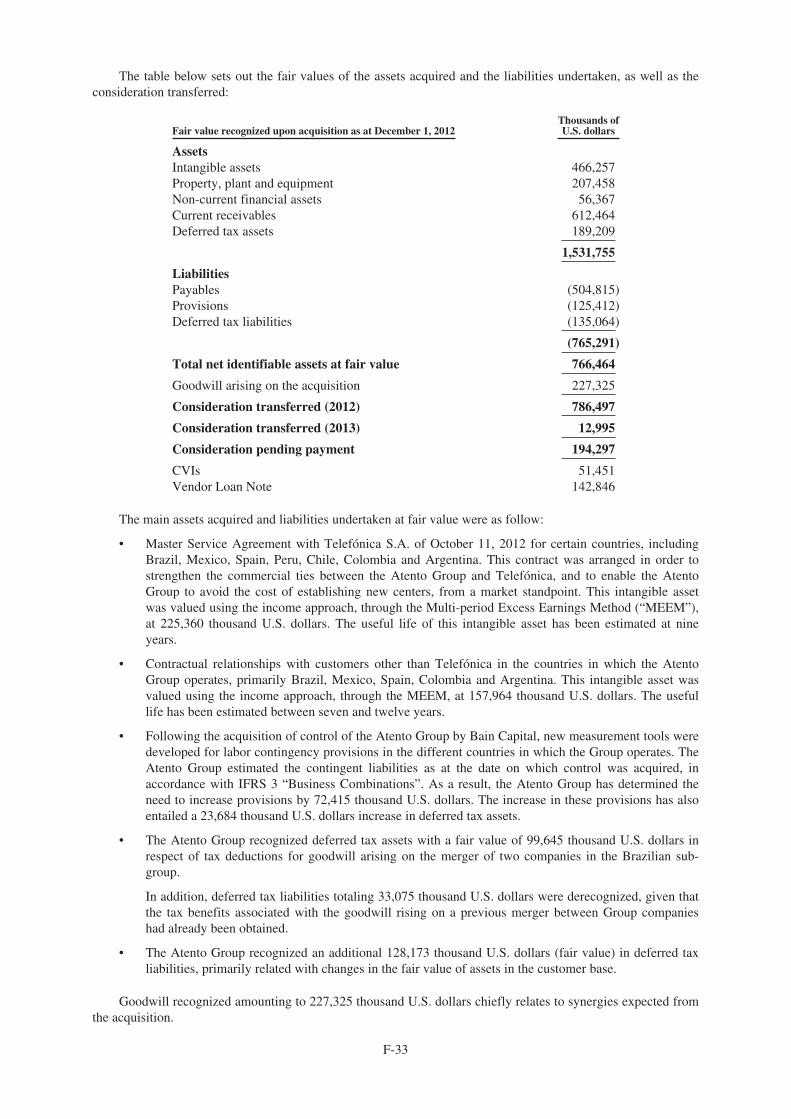
The table below sets out the fair values of the assets acquired and the liabilities undertaken, as well as theconsideration transferred:
Fair value recognized upon acquisition as at December 1, 2012Thousands ofU.S. dollars
AssetsIntangible assets 466,257Property, plant and equipment 207,458Non-current financial assets 56,367Current receivables 612,464Deferred tax assets 189,209
1,531,755
LiabilitiesPayables (504,815)Provisions (125,412)Deferred tax liabilities (135,064)
(765,291)
Total net identifiable assets at fair value 766,464
Goodwill arising on the acquisition 227,325
Consideration transferred (2012) 786,497
Consideration transferred (2013) 12,995
Consideration pending payment 194,297
CVIs 51,451Vendor Loan Note 142,846
The main assets acquired and liabilities undertaken at fair value were as follow:
• Master Service Agreement with Telefónica S.A. of October 11, 2012 for certain countries, includingBrazil, Mexico, Spain, Peru, Chile, Colombia and Argentina. This contract was arranged in order tostrengthen the commercial ties between the Atento Group and Telefónica, and to enable the AtentoGroup to avoid the cost of establishing new centers, from a market standpoint. This intangible assetwas valued using the income approach, through the Multi-period Excess Earnings Method (“MEEM”),at 225,360 thousand U.S. dollars. The useful life of this intangible asset has been estimated at nineyears.
• Contractual relationships with customers other than Telefónica in the countries in which the AtentoGroup operates, primarily Brazil, Mexico, Spain, Colombia and Argentina. This intangible asset wasvalued using the income approach, through the MEEM, at 157,964 thousand U.S. dollars. The usefullife has been estimated between seven and twelve years.
• Following the acquisition of control of the Atento Group by Bain Capital, new measurement tools weredeveloped for labor contingency provisions in the different countries in which the Group operates. TheAtento Group estimated the contingent liabilities as at the date on which control was acquired, inaccordance with IFRS 3 “Business Combinations”. As a result, the Atento Group has determined theneed to increase provisions by 72,415 thousand U.S. dollars. The increase in these provisions has alsoentailed a 23,684 thousand U.S. dollars increase in deferred tax assets.
• The Atento Group recognized deferred tax assets with a fair value of 99,645 thousand U.S. dollars inrespect of tax deductions for goodwill arising on the merger of two companies in the Brazilian sub-group.
In addition, deferred tax liabilities totaling 33,075 thousand U.S. dollars were derecognized, given thatthe tax benefits associated with the goodwill rising on a previous merger between Group companieshad already been obtained.
• The Atento Group recognized an additional 128,173 thousand U.S. dollars (fair value) in deferred taxliabilities, primarily related with changes in the fair value of assets in the customer base.
Goodwill recognized amounting to 227,325 thousand U.S. dollars chiefly relates to synergies expected fromthe acquisition.
F-33
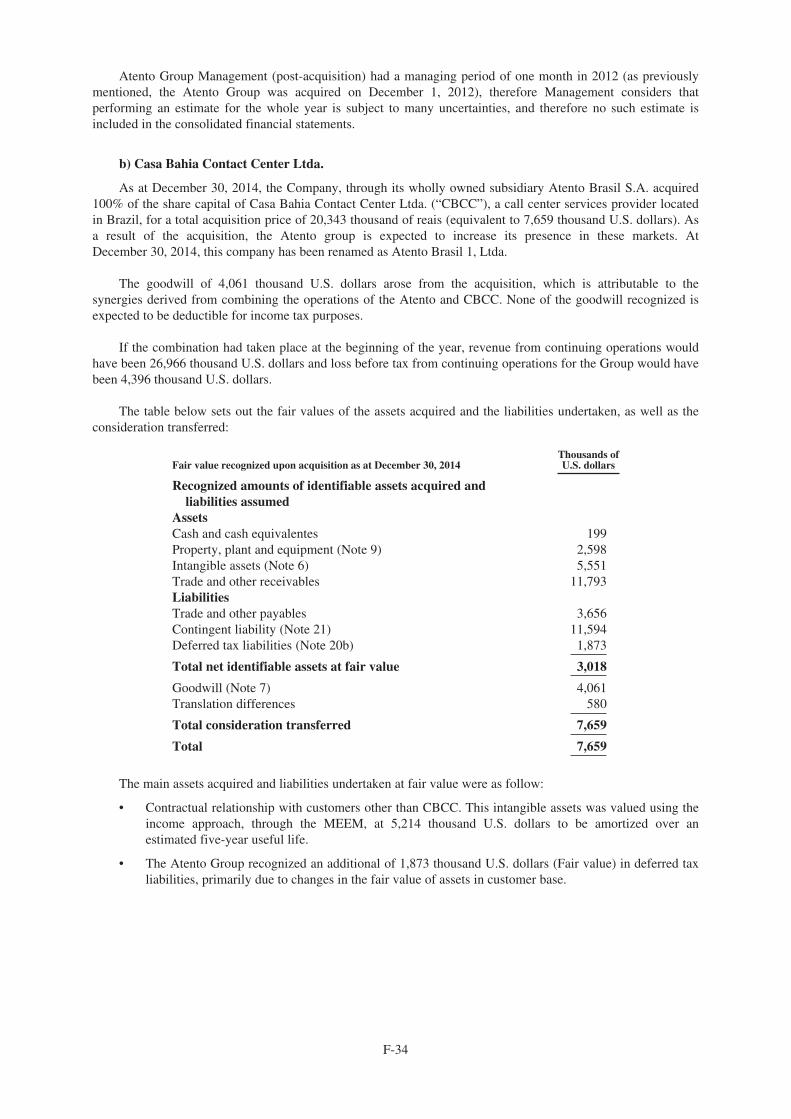
Atento Group Management (post-acquisition) had a managing period of one month in 2012 (as previouslymentioned, the Atento Group was acquired on December 1, 2012), therefore Management considers thatperforming an estimate for the whole year is subject to many uncertainties, and therefore no such estimate isincluded in the consolidated financial statements.
b) Casa Bahia Contact Center Ltda.
As at December 30, 2014, the Company, through its wholly owned subsidiary Atento Brasil S.A. acquired100% of the share capital of Casa Bahia Contact Center Ltda. (“CBCC”), a call center services provider locatedin Brazil, for a total acquisition price of 20,343 thousand of reais (equivalent to 7,659 thousand U.S. dollars). Asa result of the acquisition, the Atento group is expected to increase its presence in these markets. AtDecember 30, 2014, this company has been renamed as Atento Brasil 1, Ltda.
The goodwill of 4,061 thousand U.S. dollars arose from the acquisition, which is attributable to thesynergies derived from combining the operations of the Atento and CBCC. None of the goodwill recognized isexpected to be deductible for income tax purposes.
If the combination had taken place at the beginning of the year, revenue from continuing operations wouldhave been 26,966 thousand U.S. dollars and loss before tax from continuing operations for the Group would havebeen 4,396 thousand U.S. dollars.
The table below sets out the fair values of the assets acquired and the liabilities undertaken, as well as theconsideration transferred:
Fair value recognized upon acquisition as at December 30, 2014Thousands ofU.S. dollars
Recognized amounts of identifiable assets acquired andliabilities assumed
AssetsCash and cash equivalentes 199Property, plant and equipment (Note 9) 2,598Intangible assets (Note 6) 5,551Trade and other receivables 11,793LiabilitiesTrade and other payables 3,656Contingent liability (Note 21) 11,594Deferred tax liabilities (Note 20b) 1,873
Total net identifiable assets at fair value 3,018
Goodwill (Note 7) 4,061Translation differences 580
Total consideration transferred 7,659
Total 7,659
The main assets acquired and liabilities undertaken at fair value were as follow:
• Contractual relationship with customers other than CBCC. This intangible assets was valued using theincome approach, through the MEEM, at 5,214 thousand U.S. dollars to be amortized over anestimated five-year useful life.
• The Atento Group recognized an additional of 1,873 thousand U.S. dollars (Fair value) in deferred taxliabilities, primarily due to changes in the fair value of assets in customer base.
F-34
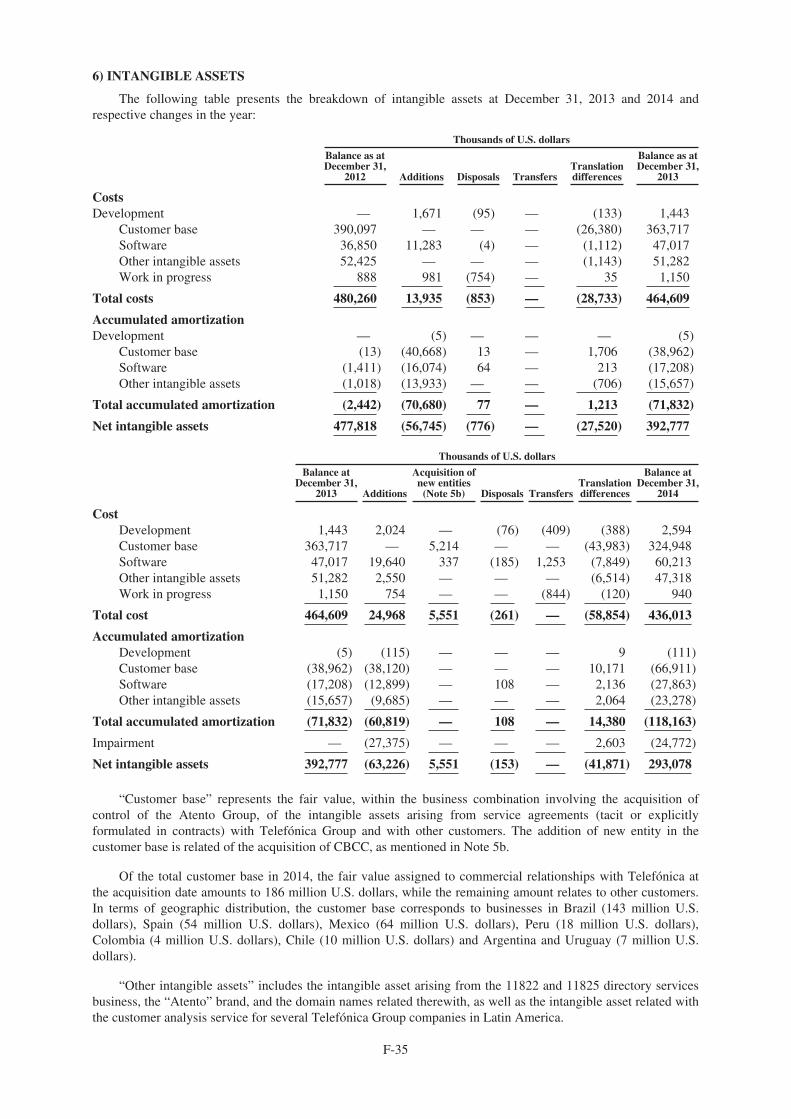
6) INTANGIBLE ASSETS
The following table presents the breakdown of intangible assets at December 31, 2013 and 2014 andrespective changes in the year:
Thousands of U.S. dollars
Balance as atDecember 31,
2012 Additions Disposals TransfersTranslationdifferences
Balance as atDecember 31,
2013
CostsDevelopment — 1,671 (95) — (133) 1,443
Customer base 390,097 — — — (26,380) 363,717Software 36,850 11,283 (4) — (1,112) 47,017Other intangible assets 52,425 — — — (1,143) 51,282Work in progress 888 981 (754) — 35 1,150
Total costs 480,260 13,935 (853) — (28,733) 464,609
Accumulated amortizationDevelopment — (5) — — — (5)
Customer base (13) (40,668) 13 — 1,706 (38,962)Software (1,411) (16,074) 64 — 213 (17,208)Other intangible assets (1,018) (13,933) — — (706) (15,657)
Total accumulated amortization (2,442) (70,680) 77 — 1,213 (71,832)
Net intangible assets 477,818 (56,745) (776) — (27,520) 392,777
Thousands of U.S. dollars
Balance atDecember 31,
2013 Additions
Acquisition ofnew entities
(Note 5b) Disposals TransfersTranslationdifferences
Balance atDecember 31,
2014
CostDevelopment 1,443 2,024 — (76) (409) (388) 2,594Customer base 363,717 — 5,214 — — (43,983) 324,948Software 47,017 19,640 337 (185) 1,253 (7,849) 60,213Other intangible assets 51,282 2,550 — — — (6,514) 47,318Work in progress 1,150 754 — — (844) (120) 940
Total cost 464,609 24,968 5,551 (261) — (58,854) 436,013
Accumulated amortizationDevelopment (5) (115) — — — 9 (111)Customer base (38,962) (38,120) — — — 10,171 (66,911)Software (17,208) (12,899) — 108 — 2,136 (27,863)Other intangible assets (15,657) (9,685) — — — 2,064 (23,278)
Total accumulated amortization (71,832) (60,819) — 108 — 14,380 (118,163)
Impairment — (27,375) — — — 2,603 (24,772)
Net intangible assets 392,777 (63,226) 5,551 (153) — (41,871) 293,078
“Customer base” represents the fair value, within the business combination involving the acquisition ofcontrol of the Atento Group, of the intangible assets arising from service agreements (tacit or explicitlyformulated in contracts) with Telefónica Group and with other customers. The addition of new entity in thecustomer base is related of the acquisition of CBCC, as mentioned in Note 5b.
Of the total customer base in 2014, the fair value assigned to commercial relationships with Telefónica atthe acquisition date amounts to 186 million U.S. dollars, while the remaining amount relates to other customers.In terms of geographic distribution, the customer base corresponds to businesses in Brazil (143 million U.S.dollars), Spain (54 million U.S. dollars), Mexico (64 million U.S. dollars), Peru (18 million U.S. dollars),Colombia (4 million U.S. dollars), Chile (10 million U.S. dollars) and Argentina and Uruguay (7 million U.S.dollars).
“Other intangible assets” includes the intangible asset arising from the 11822 and 11825 directory servicesbusiness, the “Atento” brand, and the domain names related therewith, as well as the intangible asset related withthe customer analysis service for several Telefónica Group companies in Latin America.
F-35
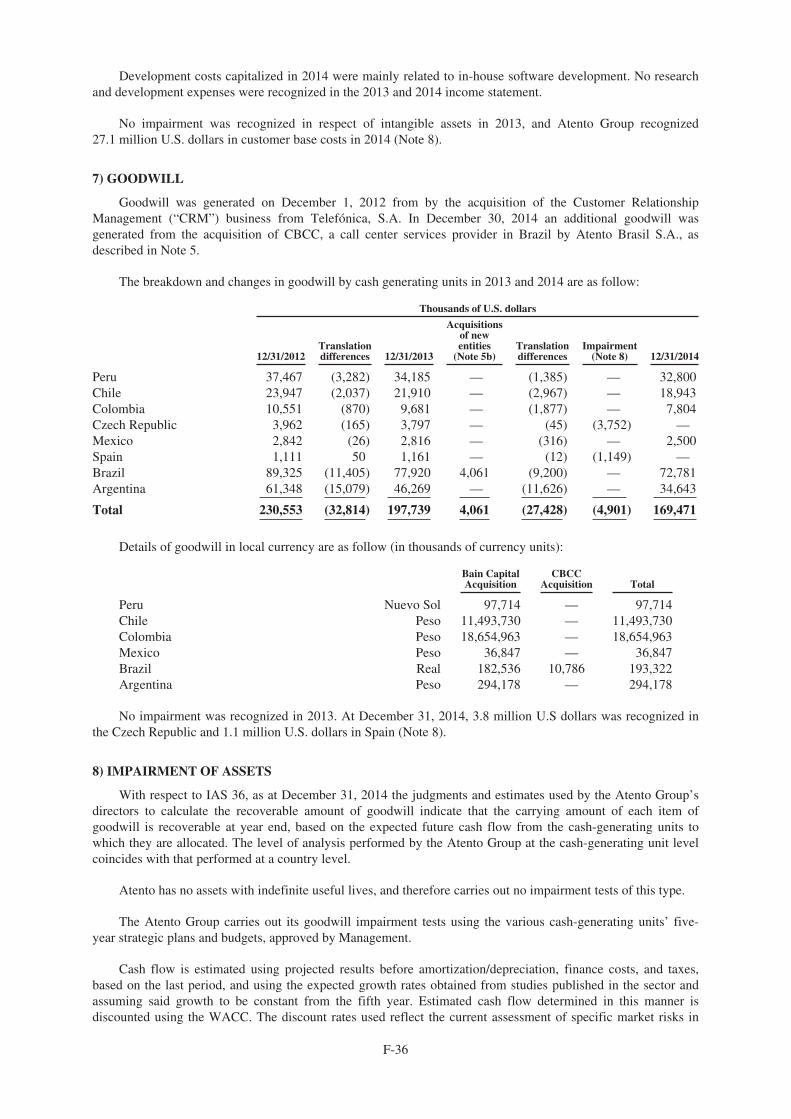
Development costs capitalized in 2014 were mainly related to in-house software development. No researchand development expenses were recognized in the 2013 and 2014 income statement.
No impairment was recognized in respect of intangible assets in 2013, and Atento Group recognized27.1 million U.S. dollars in customer base costs in 2014 (Note 8).
7) GOODWILL
Goodwill was generated on December 1, 2012 from by the acquisition of the Customer RelationshipManagement (“CRM”) business from Telefónica, S.A. In December 30, 2014 an additional goodwill wasgenerated from the acquisition of CBCC, a call center services provider in Brazil by Atento Brasil S.A., asdescribed in Note 5.
The breakdown and changes in goodwill by cash generating units in 2013 and 2014 are as follow:
Thousands of U.S. dollars
12/31/2012Translationdifferences 12/31/2013
Acquisitionsof newentities
(Note 5b)Translationdifferences
Impairment(Note 8) 12/31/2014
Peru 37,467 (3,282) 34,185 — (1,385) — 32,800Chile 23,947 (2,037) 21,910 — (2,967) — 18,943Colombia 10,551 (870) 9,681 — (1,877) — 7,804Czech Republic 3,962 (165) 3,797 — (45) (3,752) —Mexico 2,842 (26) 2,816 — (316) — 2,500Spain 1,111 50 1,161 — (12) (1,149) —Brazil 89,325 (11,405) 77,920 4,061 (9,200) — 72,781Argentina 61,348 (15,079) 46,269 — (11,626) — 34,643
Total 230,553 (32,814) 197,739 4,061 (27,428) (4,901) 169,471
Details of goodwill in local currency are as follow (in thousands of currency units):
Bain CapitalAcquisition
CBCCAcquisition Total
Peru Nuevo Sol 97,714 — 97,714Chile Peso 11,493,730 — 11,493,730Colombia Peso 18,654,963 — 18,654,963Mexico Peso 36,847 — 36,847Brazil Real 182,536 10,786 193,322Argentina Peso 294,178 — 294,178
No impairment was recognized in 2013. At December 31, 2014, 3.8 million U.S dollars was recognized inthe Czech Republic and 1.1 million U.S. dollars in Spain (Note 8).
8) IMPAIRMENT OF ASSETS
With respect to IAS 36, as at December 31, 2014 the judgments and estimates used by the Atento Group’sdirectors to calculate the recoverable amount of goodwill indicate that the carrying amount of each item ofgoodwill is recoverable at year end, based on the expected future cash flow from the cash-generating units towhich they are allocated. The level of analysis performed by the Atento Group at the cash-generating unit levelcoincides with that performed at a country level.
Atento has no assets with indefinite useful lives, and therefore carries out no impairment tests of this type.
The Atento Group carries out its goodwill impairment tests using the various cash-generating units’ five-year strategic plans and budgets, approved by Management.
Cash flow is estimated using projected results before amortization/depreciation, finance costs, and taxes,based on the last period, and using the expected growth rates obtained from studies published in the sector andassuming said growth to be constant from the fifth year. Estimated cash flow determined in this manner isdiscounted using the WACC. The discount rates used reflect the current assessment of specific market risks in
F-36

each of the cash-generating units, considering the time value of money and individual country risks not includedin the cash flow estimates. WACC takes both the cost of debt and capital into account. The latter is obtainedbased on the profit expected by the shareholders of the Atento Group, while the former is obtained based on theAtento Group’s financing costs. In addition, the risks specific to each country were included in the WACC usingcorrective factors.
These tests are performed annually and whenever it is considered that the recoverable amount of goodwillmay be impaired.
In May 2014, the Master Service Agreement (“MSA”) with Telefónica, which required the TelefónicaGroup companies to meet pre-agreed minimum annual revenue commitments to us through 2021, was amendedto adjust these minimum revenue commitments in relation to Spain and Morocco, to reflect the expected lowerlevel of activities in these territories. The provisions of the MSA required Telefónica to compensate theCompany in case of shortfalls in these revenue commitments. As such, Telefónica agreed to compensate theCompany with a non-cash penalty fee amounting to €25.4 million (equivalent to 35.1 million U.S. Dollars for theyear ended December 31, 2014). This non-cash compensation was recorded in the consolidated income statementfor the year ended December 31, 2014 as other gains. The Company, in turn, used this amount to partially reduceand compensate the Vendor Loan Note to Telefónica which was paid off in 2014 (see Note 16).
Since the amendment to the MSA significantly affected the amount of expected revenue, this wasconsidered as a triggering event for the purpose of evaluating the recoverable amount of the intangible assetsrecorded in relation to the MSA (as described in Note 5). Therefore, also considering the changes in expectedrevenue in other geographies, as at June 30, 2014 (second quarter) management performed an impairment test onthe carrying amounts of customer relationship intangible assets, goodwill and property, plant and equipmentusing assumptions revised in accordance with the amendments to the MSA and with updated managementexpectations on cash flow generation from the different territories in which the company operates. The result ofthe testing performed was an impairment charge of 27,965 thousand U.S. dollars as at June 30, 2014 (27,375thousand U.S. dollars as at December 31, 2014) of the intangible assets related to the customer relationships withTelefónica in connection with the MSA, an impairment charge of 3,752 thousand U.S. dollars of goodwill in theCzech Republic and of 1,149 thousand U.S. dollars of goodwill in Spain, which have been recorded in theconsolidated income statement as impairment charges.
At December 31, 2013 and 2014, the tests conducted did not reveal any impairment in the value of goodwill,since the related cash flows were in all cases higher than the carrying amount of the related cash-generating units,even after sensitivities were applied to the variables used, except for 3.8 million U.S. dollars in Czech Republicand 1,1 million U.S. dollars in Spain.
The pre-tax discount rates, which factor in country and business risks, and the projected growth rates wereas follow:
Discount rate
Brazil Mexico Spain Colombia Peru Chile Argentina
December 2013 16.53% 12.21% 10.38% 12.50% 11.37% 11.27% 31.77%December 2014 17.96% 12.04% 9.20% 12.50% 11.71% 11.08% 42.25%
Growth rate
Brazil Mexico Spain Colombia Peru Chile Argentina
December 2013 5.50% 3.10% 1.85% 3.00% 2.50% 3.00% 16.83%December 2014 5.80% 3.50% 0.95% 3.00% 2.70% 3.00% 23.35%
In the event of a 10% increase in the discount rate used to calculate the recoverable amount of the CGUs ineach country, with the other variables remaining unchanged, the recoverable amount would still be higher thanthe corresponding carrying amount. Management also considers that the appearance of potential competitors inthe market in which the Atento Group operates could negatively affect the growth of its CGUs. In the event of a10% decrease in the growth rate used to calculate the recoverable amount of the CGUs in each country, with allother variables remaining unchanged, the recoverable amount would also be higher than the correspondingcarrying amount. In addition, if as a result of a fall in demand or an increase in costs, results before amortization/depreciation, finance cost and taxes margin (EBITDA margin) used for estimating cash flow were to decrease by1% in each country, with all other variables remaining unchanged, the recoverable amount from each cash-generating unit would continue to be higher than its corresponding carrying amount.
F-37
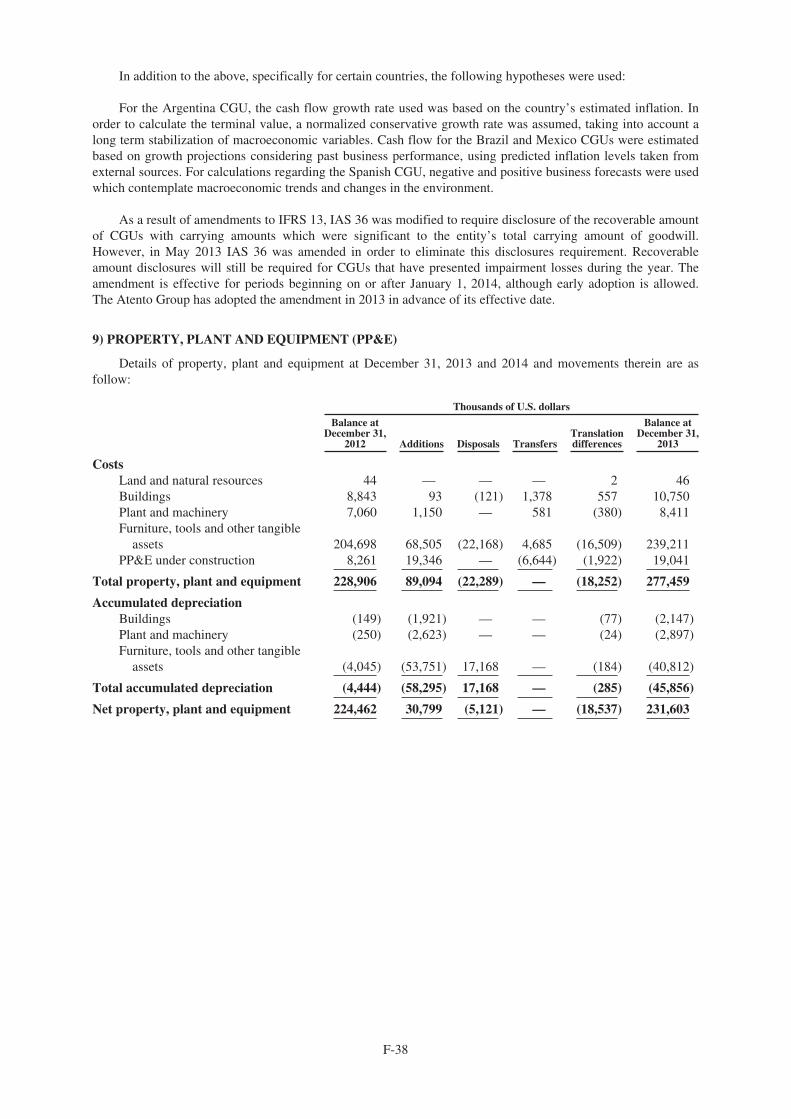
In addition to the above, specifically for certain countries, the following hypotheses were used:
For the Argentina CGU, the cash flow growth rate used was based on the country’s estimated inflation. Inorder to calculate the terminal value, a normalized conservative growth rate was assumed, taking into account along term stabilization of macroeconomic variables. Cash flow for the Brazil and Mexico CGUs were estimatedbased on growth projections considering past business performance, using predicted inflation levels taken fromexternal sources. For calculations regarding the Spanish CGU, negative and positive business forecasts were usedwhich contemplate macroeconomic trends and changes in the environment.
As a result of amendments to IFRS 13, IAS 36 was modified to require disclosure of the recoverable amountof CGUs with carrying amounts which were significant to the entity’s total carrying amount of goodwill.However, in May 2013 IAS 36 was amended in order to eliminate this disclosures requirement. Recoverableamount disclosures will still be required for CGUs that have presented impairment losses during the year. Theamendment is effective for periods beginning on or after January 1, 2014, although early adoption is allowed.The Atento Group has adopted the amendment in 2013 in advance of its effective date.
9) PROPERTY, PLANT AND EQUIPMENT (PP&E)
Details of property, plant and equipment at December 31, 2013 and 2014 and movements therein are asfollow:
Thousands of U.S. dollars
Balance atDecember 31,
2012 Additions Disposals TransfersTranslationdifferences
Balance atDecember 31,
2013
CostsLand and natural resources 44 — — — 2 46Buildings 8,843 93 (121) 1,378 557 10,750Plant and machinery 7,060 1,150 — 581 (380) 8,411Furniture, tools and other tangible
assets 204,698 68,505 (22,168) 4,685 (16,509) 239,211PP&E under construction 8,261 19,346 — (6,644) (1,922) 19,041
Total property, plant and equipment 228,906 89,094 (22,289) — (18,252) 277,459
Accumulated depreciationBuildings (149) (1,921) — — (77) (2,147)Plant and machinery (250) (2,623) — — (24) (2,897)Furniture, tools and other tangible
assets (4,045) (53,751) 17,168 — (184) (40,812)
Total accumulated depreciation (4,444) (58,295) 17,168 — (285) (45,856)
Net property, plant and equipment 224,462 30,799 (5,121) — (18,537) 231,603
F-38
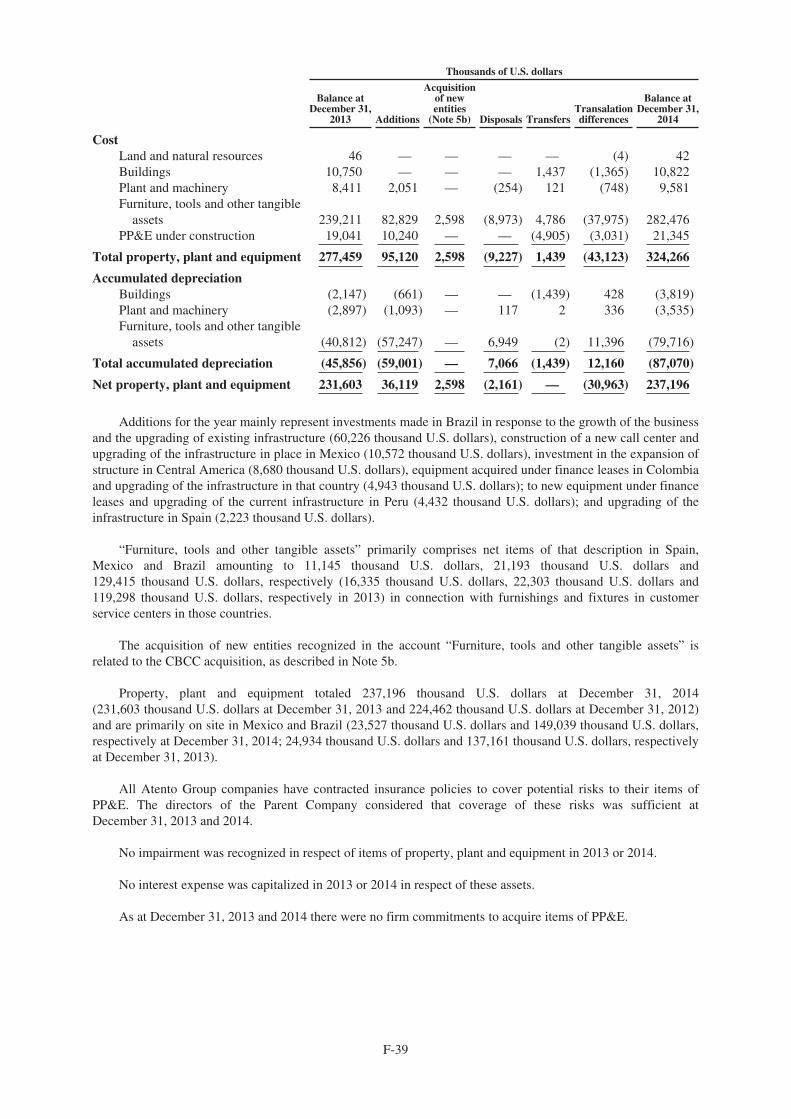
Thousands of U.S. dollars
Balance atDecember 31,
2013 Additions
Acquisitionof newentities
(Note 5b) Disposals TransfersTransalationdifferences
Balance atDecember 31,
2014
CostLand and natural resources 46 — — — — (4) 42Buildings 10,750 — — — 1,437 (1,365) 10,822Plant and machinery 8,411 2,051 — (254) 121 (748) 9,581Furniture, tools and other tangible
assets 239,211 82,829 2,598 (8,973) 4,786 (37,975) 282,476PP&E under construction 19,041 10,240 — — (4,905) (3,031) 21,345
Total property, plant and equipment 277,459 95,120 2,598 (9,227) 1,439 (43,123) 324,266
Accumulated depreciationBuildings (2,147) (661) — — (1,439) 428 (3,819)Plant and machinery (2,897) (1,093) — 117 2 336 (3,535)Furniture, tools and other tangible
assets (40,812) (57,247) — 6,949 (2) 11,396 (79,716)
Total accumulated depreciation (45,856) (59,001) — 7,066 (1,439) 12,160 (87,070)
Net property, plant and equipment 231,603 36,119 2,598 (2,161) — (30,963) 237,196
Additions for the year mainly represent investments made in Brazil in response to the growth of the businessand the upgrading of existing infrastructure (60,226 thousand U.S. dollars), construction of a new call center andupgrading of the infrastructure in place in Mexico (10,572 thousand U.S. dollars), investment in the expansion ofstructure in Central America (8,680 thousand U.S. dollars), equipment acquired under finance leases in Colombiaand upgrading of the infrastructure in that country (4,943 thousand U.S. dollars); to new equipment under financeleases and upgrading of the current infrastructure in Peru (4,432 thousand U.S. dollars); and upgrading of theinfrastructure in Spain (2,223 thousand U.S. dollars).
“Furniture, tools and other tangible assets” primarily comprises net items of that description in Spain,Mexico and Brazil amounting to 11,145 thousand U.S. dollars, 21,193 thousand U.S. dollars and129,415 thousand U.S. dollars, respectively (16,335 thousand U.S. dollars, 22,303 thousand U.S. dollars and119,298 thousand U.S. dollars, respectively in 2013) in connection with furnishings and fixtures in customerservice centers in those countries.
The acquisition of new entities recognized in the account “Furniture, tools and other tangible assets” isrelated to the CBCC acquisition, as described in Note 5b.
Property, plant and equipment totaled 237,196 thousand U.S. dollars at December 31, 2014(231,603 thousand U.S. dollars at December 31, 2013 and 224,462 thousand U.S. dollars at December 31, 2012)and are primarily on site in Mexico and Brazil (23,527 thousand U.S. dollars and 149,039 thousand U.S. dollars,respectively at December 31, 2014; 24,934 thousand U.S. dollars and 137,161 thousand U.S. dollars, respectivelyat December 31, 2013).
All Atento Group companies have contracted insurance policies to cover potential risks to their items ofPP&E. The directors of the Parent Company considered that coverage of these risks was sufficient atDecember 31, 2013 and 2014.
No impairment was recognized in respect of items of property, plant and equipment in 2013 or 2014.
No interest expense was capitalized in 2013 or 2014 in respect of these assets.
As at December 31, 2013 and 2014 there were no firm commitments to acquire items of PP&E.
F-39
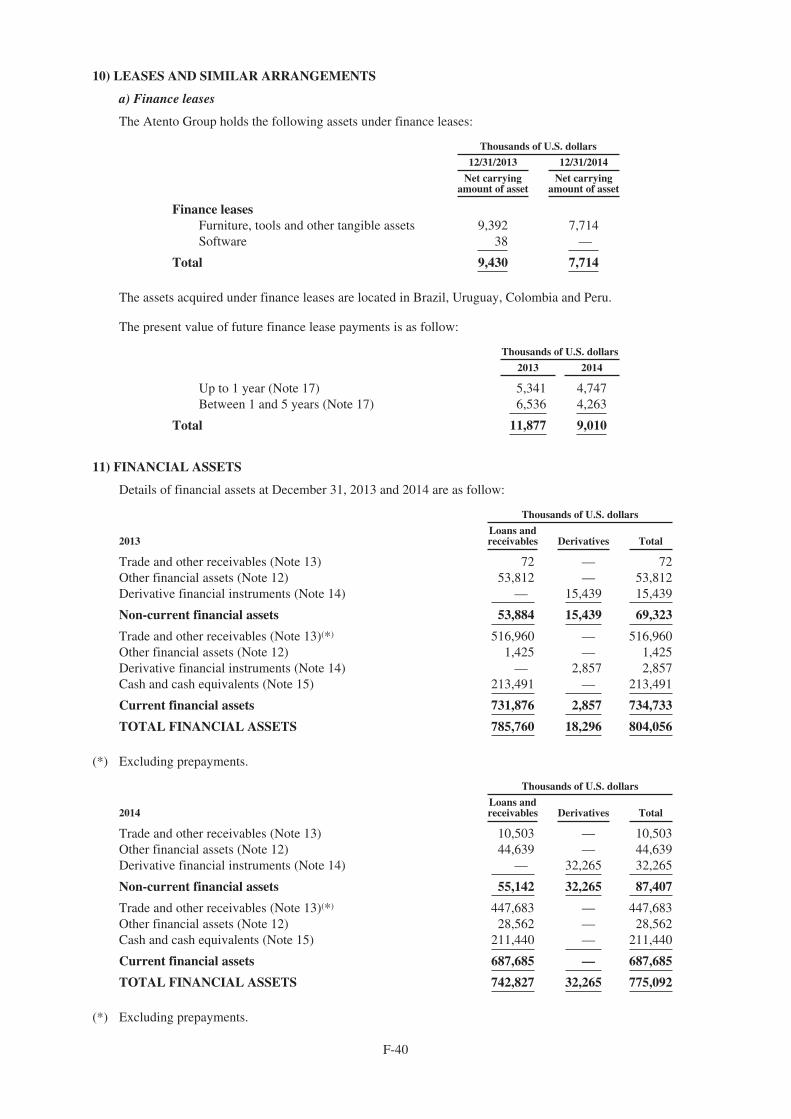
10) LEASES AND SIMILAR ARRANGEMENTS
a) Finance leases
The Atento Group holds the following assets under finance leases:
Thousands of U.S. dollars
12/31/2013 12/31/2014
Net carryingamount of asset
Net carryingamount of asset
Finance leasesFurniture, tools and other tangible assets 9,392 7,714Software 38 —
Total 9,430 7,714
The assets acquired under finance leases are located in Brazil, Uruguay, Colombia and Peru.
The present value of future finance lease payments is as follow:
Thousands of U.S. dollars
2013 2014
Up to 1 year (Note 17) 5,341 4,747Between 1 and 5 years (Note 17) 6,536 4,263
Total 11,877 9,010
11) FINANCIAL ASSETS
Details of financial assets at December 31, 2013 and 2014 are as follow:
Thousands of U.S. dollars
2013Loans andreceivables Derivatives Total
Trade and other receivables (Note 13) 72 — 72Other financial assets (Note 12) 53,812 — 53,812Derivative financial instruments (Note 14) — 15,439 15,439
Non-current financial assets 53,884 15,439 69,323
Trade and other receivables (Note 13)(*) 516,960 — 516,960Other financial assets (Note 12) 1,425 — 1,425Derivative financial instruments (Note 14) — 2,857 2,857Cash and cash equivalents (Note 15) 213,491 — 213,491
Current financial assets 731,876 2,857 734,733
TOTAL FINANCIAL ASSETS 785,760 18,296 804,056
(*) Excluding prepayments.
Thousands of U.S. dollars
2014Loans andreceivables Derivatives Total
Trade and other receivables (Note 13) 10,503 — 10,503Other financial assets (Note 12) 44,639 — 44,639Derivative financial instruments (Note 14) — 32,265 32,265
Non-current financial assets 55,142 32,265 87,407
Trade and other receivables (Note 13)(*) 447,683 — 447,683Other financial assets (Note 12) 28,562 — 28,562Cash and cash equivalents (Note 15) 211,440 — 211,440
Current financial assets 687,685 — 687,685
TOTAL FINANCIAL ASSETS 742,827 32,265 775,092
(*) Excluding prepayments.
F-40
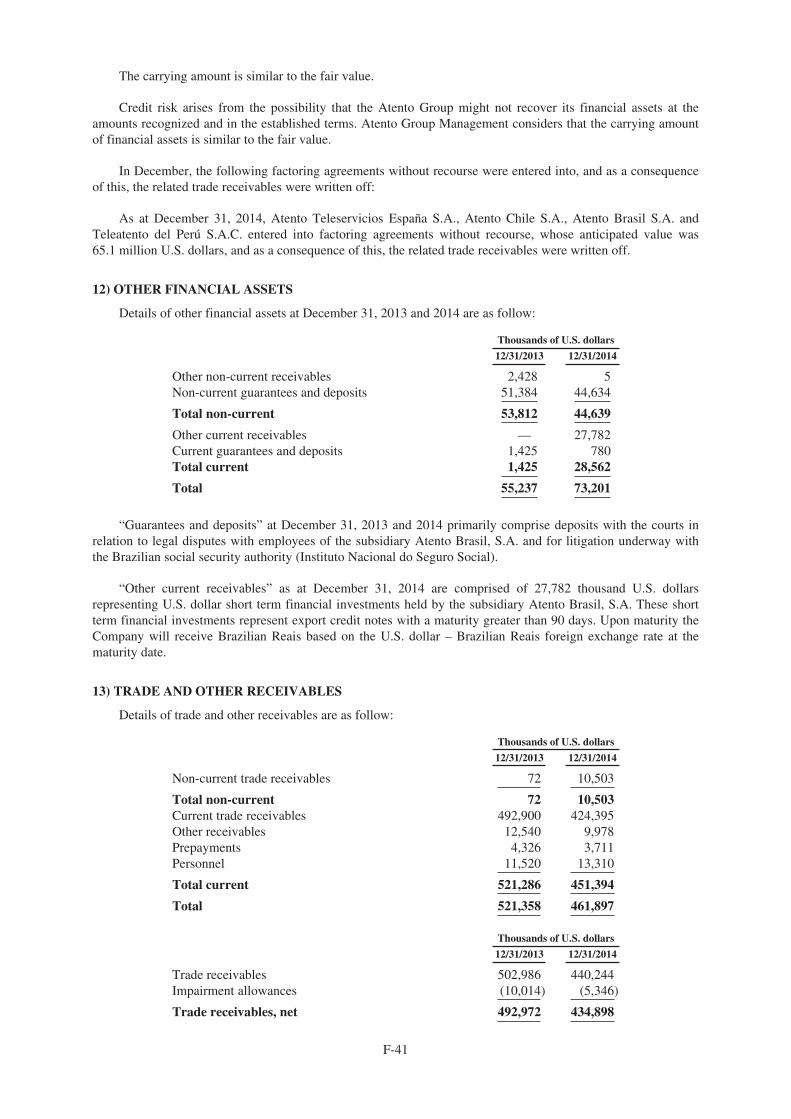
The carrying amount is similar to the fair value.
Credit risk arises from the possibility that the Atento Group might not recover its financial assets at theamounts recognized and in the established terms. Atento Group Management considers that the carrying amountof financial assets is similar to the fair value.
In December, the following factoring agreements without recourse were entered into, and as a consequenceof this, the related trade receivables were written off:
As at December 31, 2014, Atento Teleservicios España S.A., Atento Chile S.A., Atento Brasil S.A. andTeleatento del Perú S.A.C. entered into factoring agreements without recourse, whose anticipated value was65.1 million U.S. dollars, and as a consequence of this, the related trade receivables were written off.
12) OTHER FINANCIAL ASSETS
Details of other financial assets at December 31, 2013 and 2014 are as follow:
Thousands of U.S. dollars
12/31/2013 12/31/2014
Other non-current receivables 2,428 5Non-current guarantees and deposits 51,384 44,634
Total non-current 53,812 44,639
Other current receivables — 27,782Current guarantees and deposits 1,425 780Total current 1,425 28,562
Total 55,237 73,201
“Guarantees and deposits” at December 31, 2013 and 2014 primarily comprise deposits with the courts inrelation to legal disputes with employees of the subsidiary Atento Brasil, S.A. and for litigation underway withthe Brazilian social security authority (Instituto Nacional do Seguro Social).
“Other current receivables” as at December 31, 2014 are comprised of 27,782 thousand U.S. dollarsrepresenting U.S. dollar short term financial investments held by the subsidiary Atento Brasil, S.A. These shortterm financial investments represent export credit notes with a maturity greater than 90 days. Upon maturity theCompany will receive Brazilian Reais based on the U.S. dollar – Brazilian Reais foreign exchange rate at thematurity date.
13) TRADE AND OTHER RECEIVABLES
Details of trade and other receivables are as follow:
Thousands of U.S. dollars
12/31/2013 12/31/2014
Non-current trade receivables 72 10,503
Total non-current 72 10,503Current trade receivables 492,900 424,395Other receivables 12,540 9,978Prepayments 4,326 3,711Personnel 11,520 13,310
Total current 521,286 451,394
Total 521,358 461,897
Thousands of U.S. dollars
12/31/2013 12/31/2014
Trade receivables 502,986 440,244Impairment allowances (10,014) (5,346)
Trade receivables, net 492,972 434,898
F-41
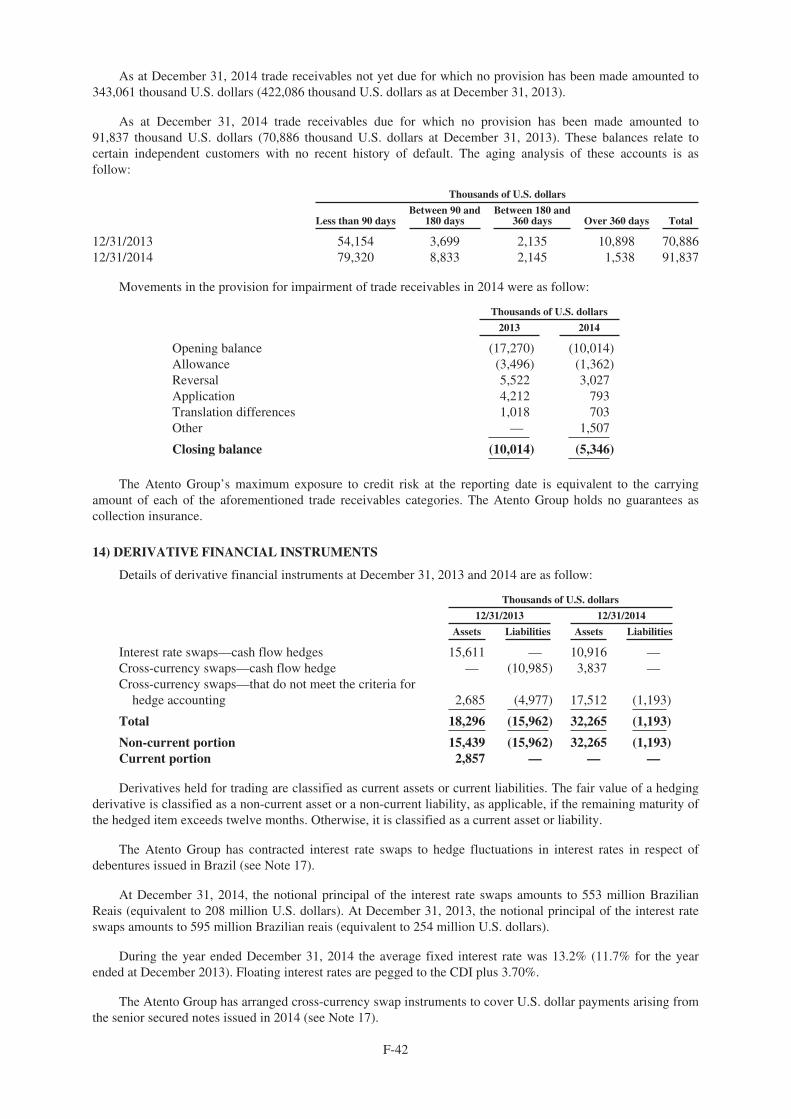
As at December 31, 2014 trade receivables not yet due for which no provision has been made amounted to343,061 thousand U.S. dollars (422,086 thousand U.S. dollars as at December 31, 2013).
As at December 31, 2014 trade receivables due for which no provision has been made amounted to91,837 thousand U.S. dollars (70,886 thousand U.S. dollars at December 31, 2013). These balances relate tocertain independent customers with no recent history of default. The aging analysis of these accounts is asfollow:
Thousands of U.S. dollars
Less than 90 daysBetween 90 and
180 daysBetween 180 and
360 days Over 360 days Total
12/31/2013 54,154 3,699 2,135 10,898 70,88612/31/2014 79,320 8,833 2,145 1,538 91,837
Movements in the provision for impairment of trade receivables in 2014 were as follow:
Thousands of U.S. dollars
2013 2014
Opening balance (17,270) (10,014)Allowance (3,496) (1,362)Reversal 5,522 3,027Application 4,212 793Translation differences 1,018 703Other — 1,507
Closing balance (10,014) (5,346)
The Atento Group’s maximum exposure to credit risk at the reporting date is equivalent to the carryingamount of each of the aforementioned trade receivables categories. The Atento Group holds no guarantees ascollection insurance.
14) DERIVATIVE FINANCIAL INSTRUMENTS
Details of derivative financial instruments at December 31, 2013 and 2014 are as follow:
Thousands of U.S. dollars
12/31/2013 12/31/2014
Assets Liabilities Assets Liabilities
Interest rate swaps—cash flow hedges 15,611 — 10,916 —Cross-currency swaps—cash flow hedge — (10,985) 3,837 —Cross-currency swaps—that do not meet the criteria for
hedge accounting 2,685 (4,977) 17,512 (1,193)
Total 18,296 (15,962) 32,265 (1,193)
Non-current portion 15,439 (15,962) 32,265 (1,193)Current portion 2,857 — — —
Derivatives held for trading are classified as current assets or current liabilities. The fair value of a hedgingderivative is classified as a non-current asset or a non-current liability, as applicable, if the remaining maturity ofthe hedged item exceeds twelve months. Otherwise, it is classified as a current asset or liability.
The Atento Group has contracted interest rate swaps to hedge fluctuations in interest rates in respect ofdebentures issued in Brazil (see Note 17).
At December 31, 2014, the notional principal of the interest rate swaps amounts to 553 million BrazilianReais (equivalent to 208 million U.S. dollars). At December 31, 2013, the notional principal of the interest rateswaps amounts to 595 million Brazilian reais (equivalent to 254 million U.S. dollars).
During the year ended December 31, 2014 the average fixed interest rate was 13.2% (11.7% for the yearended at December 2013). Floating interest rates are pegged to the CDI plus 3.70%.
The Atento Group has arranged cross-currency swap instruments to cover U.S. dollar payments arising fromthe senior secured notes issued in 2014 (see Note 17).
F-42
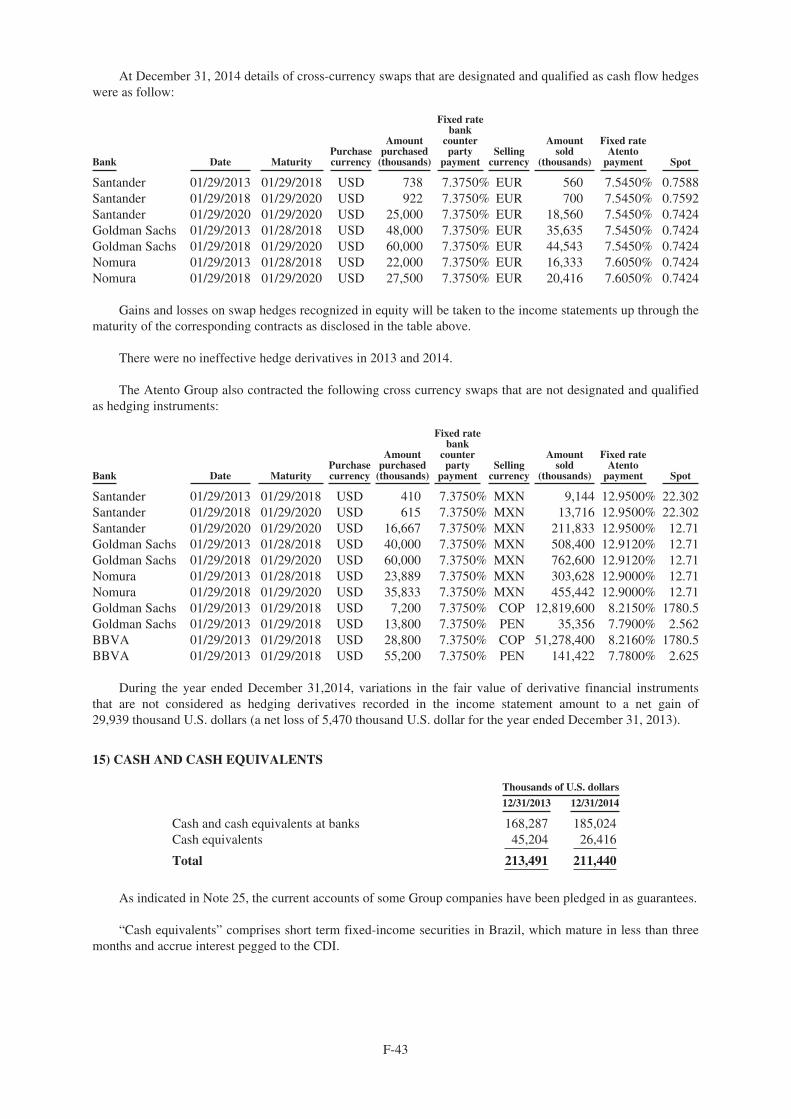
At December 31, 2014 details of cross-currency swaps that are designated and qualified as cash flow hedgeswere as follow:
Bank Date MaturityPurchasecurrency
Amountpurchased
(thousands)
Fixed ratebank
counterparty
paymentSelling
currency
Amountsold
(thousands)
Fixed rateAtento
payment Spot
Santander 01/29/2013 01/29/2018 USD 738 7.3750% EUR 560 7.5450% 0.7588Santander 01/29/2018 01/29/2020 USD 922 7.3750% EUR 700 7.5450% 0.7592Santander 01/29/2020 01/29/2020 USD 25,000 7.3750% EUR 18,560 7.5450% 0.7424Goldman Sachs 01/29/2013 01/28/2018 USD 48,000 7.3750% EUR 35,635 7.5450% 0.7424Goldman Sachs 01/29/2018 01/29/2020 USD 60,000 7.3750% EUR 44,543 7.5450% 0.7424Nomura 01/29/2013 01/28/2018 USD 22,000 7.3750% EUR 16,333 7.6050% 0.7424Nomura 01/29/2018 01/29/2020 USD 27,500 7.3750% EUR 20,416 7.6050% 0.7424
Gains and losses on swap hedges recognized in equity will be taken to the income statements up through thematurity of the corresponding contracts as disclosed in the table above.
There were no ineffective hedge derivatives in 2013 and 2014.
The Atento Group also contracted the following cross currency swaps that are not designated and qualifiedas hedging instruments:
Bank Date MaturityPurchasecurrency
Amountpurchased
(thousands)
Fixed ratebank
counterparty
paymentSelling
currency
Amountsold
(thousands)
Fixed rateAtento
payment Spot
Santander 01/29/2013 01/29/2018 USD 410 7.3750% MXN 9,144 12.9500% 22.302Santander 01/29/2018 01/29/2020 USD 615 7.3750% MXN 13,716 12.9500% 22.302Santander 01/29/2020 01/29/2020 USD 16,667 7.3750% MXN 211,833 12.9500% 12.71Goldman Sachs 01/29/2013 01/28/2018 USD 40,000 7.3750% MXN 508,400 12.9120% 12.71Goldman Sachs 01/29/2018 01/29/2020 USD 60,000 7.3750% MXN 762,600 12.9120% 12.71Nomura 01/29/2013 01/28/2018 USD 23,889 7.3750% MXN 303,628 12.9000% 12.71Nomura 01/29/2018 01/29/2020 USD 35,833 7.3750% MXN 455,442 12.9000% 12.71Goldman Sachs 01/29/2013 01/29/2018 USD 7,200 7.3750% COP 12,819,600 8.2150% 1780.5Goldman Sachs 01/29/2013 01/29/2018 USD 13,800 7.3750% PEN 35,356 7.7900% 2.562BBVA 01/29/2013 01/29/2018 USD 28,800 7.3750% COP 51,278,400 8.2160% 1780.5BBVA 01/29/2013 01/29/2018 USD 55,200 7.3750% PEN 141,422 7.7800% 2.625
During the year ended December 31,2014, variations in the fair value of derivative financial instrumentsthat are not considered as hedging derivatives recorded in the income statement amount to a net gain of29,939 thousand U.S. dollars (a net loss of 5,470 thousand U.S. dollar for the year ended December 31, 2013).
15) CASH AND CASH EQUIVALENTS
Thousands of U.S. dollars
12/31/2013 12/31/2014
Cash and cash equivalents at banks 168,287 185,024Cash equivalents 45,204 26,416
Total 213,491 211,440
As indicated in Note 25, the current accounts of some Group companies have been pledged in as guarantees.
“Cash equivalents” comprises short term fixed-income securities in Brazil, which mature in less than threemonths and accrue interest pegged to the CDI.
F-43
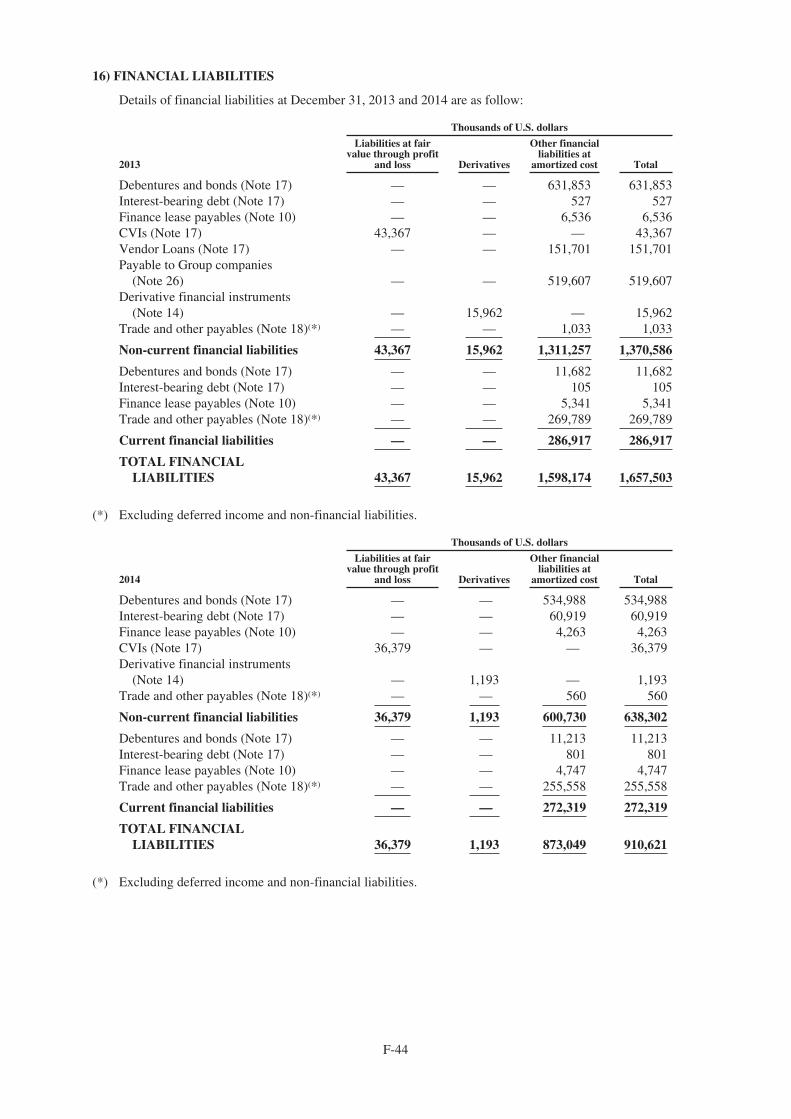
16) FINANCIAL LIABILITIES
Details of financial liabilities at December 31, 2013 and 2014 are as follow:
Thousands of U.S. dollars
2013
Liabilities at fairvalue through profit
and loss Derivatives
Other financialliabilities at
amortized cost Total
Debentures and bonds (Note 17) — — 631,853 631,853Interest-bearing debt (Note 17) — — 527 527Finance lease payables (Note 10) — — 6,536 6,536CVIs (Note 17) 43,367 — — 43,367Vendor Loans (Note 17) — — 151,701 151,701Payable to Group companies
(Note 26) — — 519,607 519,607Derivative financial instruments
(Note 14) — 15,962 — 15,962Trade and other payables (Note 18)(*) — — 1,033 1,033
Non-current financial liabilities 43,367 15,962 1,311,257 1,370,586
Debentures and bonds (Note 17) — — 11,682 11,682Interest-bearing debt (Note 17) — — 105 105Finance lease payables (Note 10) — — 5,341 5,341Trade and other payables (Note 18)(*) — — 269,789 269,789
Current financial liabilities — — 286,917 286,917
TOTAL FINANCIALLIABILITIES 43,367 15,962 1,598,174 1,657,503
(*) Excluding deferred income and non-financial liabilities.
Thousands of U.S. dollars
2014
Liabilities at fairvalue through profit
and loss Derivatives
Other financialliabilities at
amortized cost Total
Debentures and bonds (Note 17) — — 534,988 534,988Interest-bearing debt (Note 17) — — 60,919 60,919Finance lease payables (Note 10) — — 4,263 4,263CVIs (Note 17) 36,379 — — 36,379Derivative financial instruments
(Note 14) — 1,193 — 1,193Trade and other payables (Note 18)(*) — — 560 560
Non-current financial liabilities 36,379 1,193 600,730 638,302
Debentures and bonds (Note 17) — — 11,213 11,213Interest-bearing debt (Note 17) — — 801 801Finance lease payables (Note 10) — — 4,747 4,747Trade and other payables (Note 18)(*) — — 255,558 255,558
Current financial liabilities — — 272,319 272,319
TOTAL FINANCIALLIABILITIES 36,379 1,193 873,049 910,621
(*) Excluding deferred income and non-financial liabilities.
F-44
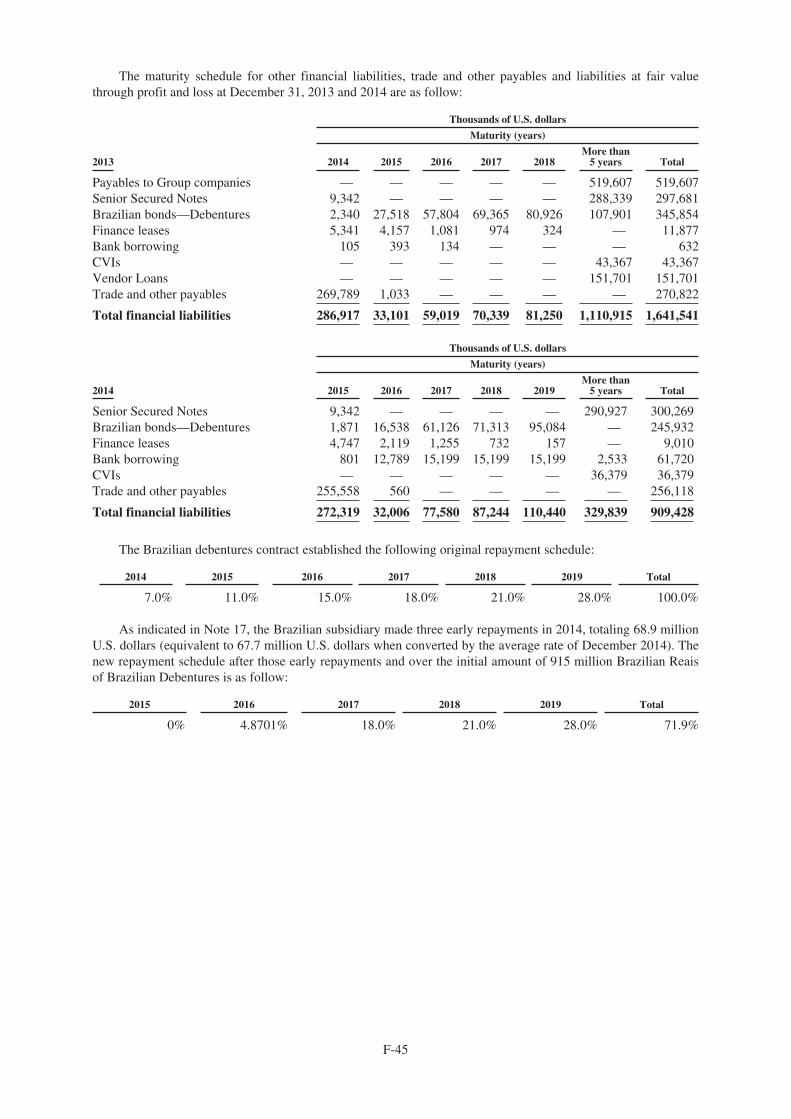
The maturity schedule for other financial liabilities, trade and other payables and liabilities at fair valuethrough profit and loss at December 31, 2013 and 2014 are as follow:
Thousands of U.S. dollars
Maturity (years)
2013 2014 2015 2016 2017 2018More than
5 years Total
Payables to Group companies — — — — — 519,607 519,607Senior Secured Notes 9,342 — — — — 288,339 297,681Brazilian bonds—Debentures 2,340 27,518 57,804 69,365 80,926 107,901 345,854Finance leases 5,341 4,157 1,081 974 324 — 11,877Bank borrowing 105 393 134 — — — 632CVIs — — — — — 43,367 43,367Vendor Loans — — — — — 151,701 151,701Trade and other payables 269,789 1,033 — — — — 270,822
Total financial liabilities 286,917 33,101 59,019 70,339 81,250 1,110,915 1,641,541
Thousands of U.S. dollars
Maturity (years)
2014 2015 2016 2017 2018 2019More than
5 years Total
Senior Secured Notes 9,342 — — — — 290,927 300,269Brazilian bonds—Debentures 1,871 16,538 61,126 71,313 95,084 — 245,932Finance leases 4,747 2,119 1,255 732 157 — 9,010Bank borrowing 801 12,789 15,199 15,199 15,199 2,533 61,720CVIs — — — — — 36,379 36,379Trade and other payables 255,558 560 — — — — 256,118
Total financial liabilities 272,319 32,006 77,580 87,244 110,440 329,839 909,428
The Brazilian debentures contract established the following original repayment schedule:
2014 2015 2016 2017 2018 2019 Total
7.0% 11.0% 15.0% 18.0% 21.0% 28.0% 100.0%
As indicated in Note 17, the Brazilian subsidiary made three early repayments in 2014, totaling 68.9 millionU.S. dollars (equivalent to 67.7 million U.S. dollars when converted by the average rate of December 2014). Thenew repayment schedule after those early repayments and over the initial amount of 915 million Brazilian Reaisof Brazilian Debentures is as follow:
2015 2016 2017 2018 2019 Total
0% 4.8701% 18.0% 21.0% 28.0% 71.9%
F-45
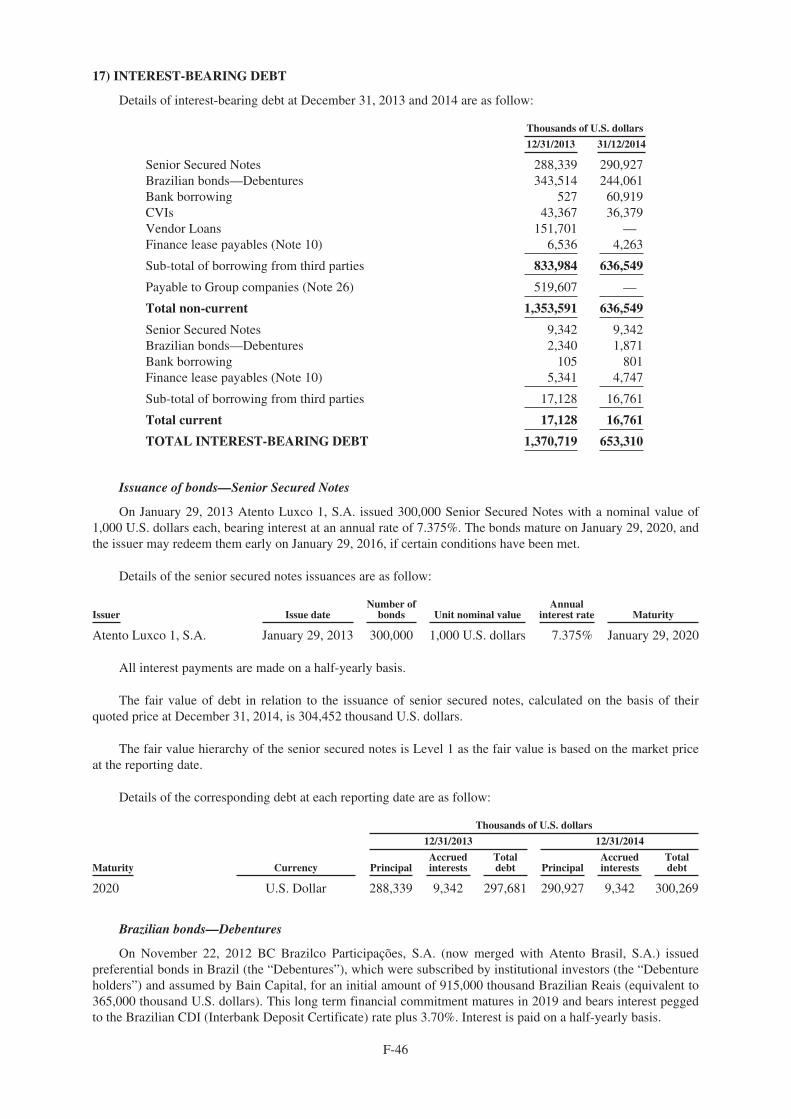
17) INTEREST-BEARING DEBT
Details of interest-bearing debt at December 31, 2013 and 2014 are as follow:
Thousands of U.S. dollars
12/31/2013 31/12/2014
Senior Secured Notes 288,339 290,927Brazilian bonds—Debentures 343,514 244,061Bank borrowing 527 60,919CVIs 43,367 36,379Vendor Loans 151,701 —Finance lease payables (Note 10) 6,536 4,263
Sub-total of borrowing from third parties 833,984 636,549
Payable to Group companies (Note 26) 519,607 —
Total non-current 1,353,591 636,549
Senior Secured Notes 9,342 9,342Brazilian bonds—Debentures 2,340 1,871Bank borrowing 105 801Finance lease payables (Note 10) 5,341 4,747
Sub-total of borrowing from third parties 17,128 16,761
Total current 17,128 16,761
TOTAL INTEREST-BEARING DEBT 1,370,719 653,310
Issuance of bonds—Senior Secured Notes
On January 29, 2013 Atento Luxco 1, S.A. issued 300,000 Senior Secured Notes with a nominal value of1,000 U.S. dollars each, bearing interest at an annual rate of 7.375%. The bonds mature on January 29, 2020, andthe issuer may redeem them early on January 29, 2016, if certain conditions have been met.
Details of the senior secured notes issuances are as follow:
Issuer Issue dateNumber of
bonds Unit nominal valueAnnual
interest rate Maturity
Atento Luxco 1, S.A. January 29, 2013 300,000 1,000 U.S. dollars 7.375% January 29, 2020
All interest payments are made on a half-yearly basis.
The fair value of debt in relation to the issuance of senior secured notes, calculated on the basis of theirquoted price at December 31, 2014, is 304,452 thousand U.S. dollars.
The fair value hierarchy of the senior secured notes is Level 1 as the fair value is based on the market priceat the reporting date.
Details of the corresponding debt at each reporting date are as follow:
Thousands of U.S. dollars
12/31/2013 12/31/2014
Maturity Currency PrincipalAccruedinterests
Totaldebt Principal
Accruedinterests
Totaldebt
2020 U.S. Dollar 288,339 9,342 297,681 290,927 9,342 300,269
Brazilian bonds—Debentures
On November 22, 2012 BC Brazilco Participações, S.A. (now merged with Atento Brasil, S.A.) issuedpreferential bonds in Brazil (the “Debentures”), which were subscribed by institutional investors (the “Debentureholders”) and assumed by Bain Capital, for an initial amount of 915,000 thousand Brazilian Reais (equivalent to365,000 thousand U.S. dollars). This long term financial commitment matures in 2019 and bears interest peggedto the Brazilian CDI (Interbank Deposit Certificate) rate plus 3.70%. Interest is paid on a half-yearly basis.
F-46
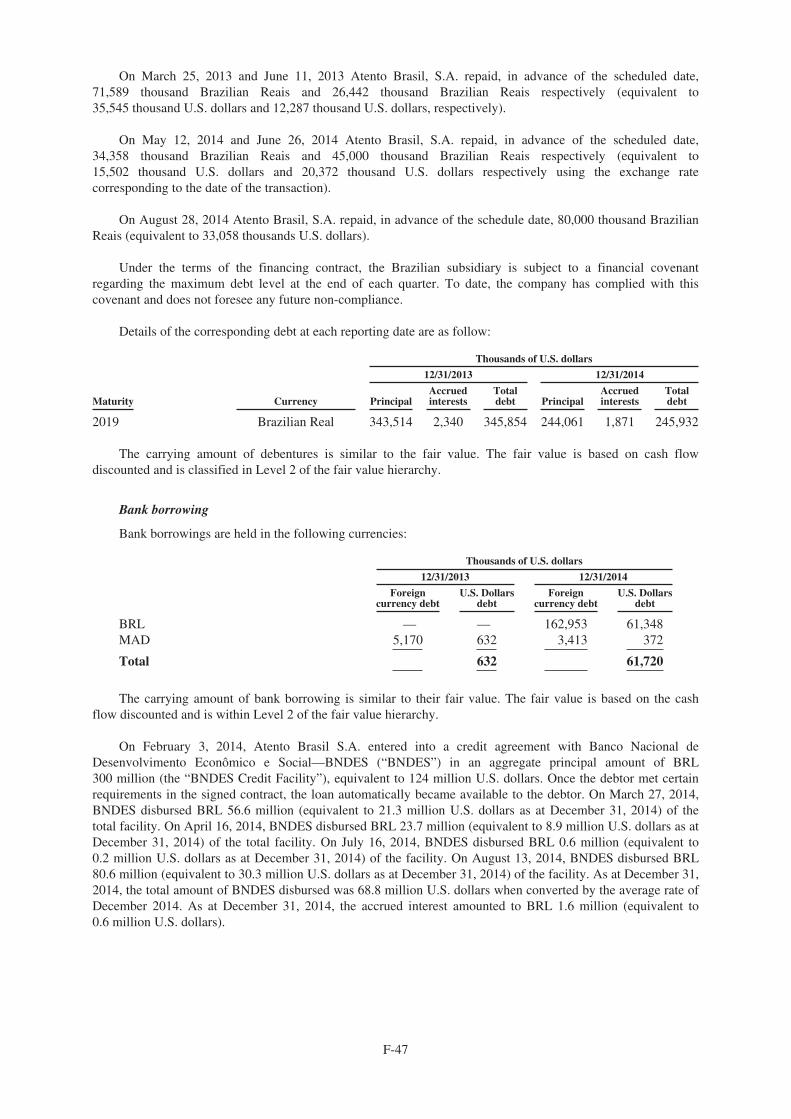
On March 25, 2013 and June 11, 2013 Atento Brasil, S.A. repaid, in advance of the scheduled date,71,589 thousand Brazilian Reais and 26,442 thousand Brazilian Reais respectively (equivalent to35,545 thousand U.S. dollars and 12,287 thousand U.S. dollars, respectively).
On May 12, 2014 and June 26, 2014 Atento Brasil, S.A. repaid, in advance of the scheduled date,34,358 thousand Brazilian Reais and 45,000 thousand Brazilian Reais respectively (equivalent to15,502 thousand U.S. dollars and 20,372 thousand U.S. dollars respectively using the exchange ratecorresponding to the date of the transaction).
On August 28, 2014 Atento Brasil, S.A. repaid, in advance of the schedule date, 80,000 thousand BrazilianReais (equivalent to 33,058 thousands U.S. dollars).
Under the terms of the financing contract, the Brazilian subsidiary is subject to a financial covenantregarding the maximum debt level at the end of each quarter. To date, the company has complied with thiscovenant and does not foresee any future non-compliance.
Details of the corresponding debt at each reporting date are as follow:
Thousands of U.S. dollars
12/31/2013 12/31/2014
Maturity Currency PrincipalAccruedinterests
Totaldebt Principal
Accruedinterests
Totaldebt
2019 Brazilian Real 343,514 2,340 345,854 244,061 1,871 245,932
The carrying amount of debentures is similar to the fair value. The fair value is based on cash flowdiscounted and is classified in Level 2 of the fair value hierarchy.
Bank borrowing
Bank borrowings are held in the following currencies:
Thousands of U.S. dollars
12/31/2013 12/31/2014
Foreigncurrency debt
U.S. Dollarsdebt
Foreigncurrency debt
U.S. Dollarsdebt
BRL — — 162,953 61,348MAD 5,170 632 3,413 372
Total 632 61,720
The carrying amount of bank borrowing is similar to their fair value. The fair value is based on the cashflow discounted and is within Level 2 of the fair value hierarchy.
On February 3, 2014, Atento Brasil S.A. entered into a credit agreement with Banco Nacional deDesenvolvimento Econômico e Social—BNDES (“BNDES”) in an aggregate principal amount of BRL300 million (the “BNDES Credit Facility”), equivalent to 124 million U.S. dollars. Once the debtor met certainrequirements in the signed contract, the loan automatically became available to the debtor. On March 27, 2014,BNDES disbursed BRL 56.6 million (equivalent to 21.3 million U.S. dollars as at December 31, 2014) of thetotal facility. On April 16, 2014, BNDES disbursed BRL 23.7 million (equivalent to 8.9 million U.S. dollars as atDecember 31, 2014) of the total facility. On July 16, 2014, BNDES disbursed BRL 0.6 million (equivalent to0.2 million U.S. dollars as at December 31, 2014) of the facility. On August 13, 2014, BNDES disbursed BRL80.6 million (equivalent to 30.3 million U.S. dollars as at December 31, 2014) of the facility. As at December 31,2014, the total amount of BNDES disbursed was 68.8 million U.S. dollars when converted by the average rate ofDecember 2014. As at December 31, 2014, the accrued interest amounted to BRL 1.6 million (equivalent to0.6 million U.S. dollars).
F-47

The total amount of the BNDES Credit Facility is divided into five tranches in the following amounts andsubject to the following interest rates:
Amount of EachTranche Interest Rate
Tranche A BRL 182,330,000.00 Long Term Interest Rate (Taxa de Juros de Longo Prazo—TJLP) plus2.5% per annum
Tranche B BRL 45,583,000.00 SELIC Rate plus 2.5% per annumTranche C BRL 64,704,000.00 4.0% per yearTranche D BRL 5,296,000.00 6.0% per yearTranche E BRL 2,048,000.00 Long Term Interest Rate (Taxa de Juros de Longo Prazo—TJLP)
The BNDES Credit Facility is to be repaid in 48 monthly installments. The first payment will be due onMarch 15, 2016 and the last payment will be due on February 15, 2020.
The BNDES Credit Facility contains covenants that restrict Atento Brasil S.A.’s ability to transfer, assign,charge or sell the intellectual property rights related to technology and products developed by Atento Brasil S.A.with the proceeds from the BNDES Credit Facility. As at December 31, 2014, we were in compliance with thesecovenants. The BNDES Credit Facility does not contain any other financial maintenance covenants.
The BNDES Credit Facility contains customary events of default including the following: (i) reduction ofthe number of the employees of Atento Brasil S.A. without providing a program support for outplacement, suchas training, job seeking assistance and obtaining pre-approval of BNDES, (ii) existence of unfavorable courtdecision against the Company for the use of children as workforce, slavery or for any environmental crimes, and(iii) inclusion in the by-laws of Atento Brasil S.A. of any provision that restricts Atento Brasil S.A.’s ability topay its obligations under the BNDES Credit Facility.
On January 28, 2013 Atento Luxco 1, S.A., Atento Teleservicios España, S.A.U. and Atento Mexicana, S.A.de C.V. (now merged within Atento Mexico Holdco, S. de R.L. de C.V. and as from July 21st, 2014) contracted amulti-currency revolving facility (“Super Senior Revolving Credit Facility”) at an amount of 50 million euros(equivalent to 60.7 million U.S. dollars as at December 31, 2014).
The new revolving facility allows for drawdowns in Euros, Mexican pesos and U.S. dollars. The interestrates for Euro drawdowns and Mexican Pesos drawdowns are the EURIBOR and the TIIE, respectively, and theLIBOR for drawdowns in any other currency, plus a 4.5% spread per year. This spread is subject to a step-downbased on the debt ratio calculations.
The revolving facility matures on July 28, 2019. As at December 31, 2014 and December 31, 2013 noamounts had been draw down on the revolving facility.
As at June 28, 2011, Atento Maroc, S.A. arranged a loan with Banco Sabadell for an amount of 21.2 millionMoroccan Dirhams maturing on June 28, 2016 with an annual rate of interest of 6%. As at December 31, 2014,the principal loan balance was 3.4 million Dirhams (0.4 million U.S. dollars) (5.2 million Dirhams and0.6 million U.S. dollars as at December 31, 2013).
Contingent Value Instruments
In relation to the acquisition described in Notes 1 and 5, two of the Company’s subholdings, AtalayaLuxco 2, S.à.r.l. (formerly BC Luxco 2, S.à.r.l.) and Atalaya Luxco 3, S.à.r.l. (formerly BC Luxco 3, S.à.r.l.),which held stakes in the Atento Group’s Argentinian subsidiaries, issued a CVI with the counterparties AtentoInversiones y Teleservicios, S.A. and Venturini S.A., a Telefónica subsidiary. The CVIs together have anaggregated nominal value of 666.8 million Argentinian Pesos.
The CVIs represent preferential debt of Atalaya Luxco 2 and Atalaya Luxco 3, and are subject to mandatory(partial) repayment in the following scenarios: (i) if the Argentinian subsidiaries maintain an excess-distributablecash balance, calculated as the greater of the sum of 30.3 million Argentinian Pesos (adjusted for inflation) or thesum that must be maintained by the subsidiaries to honor their financial obligations in each year, pursuant to theirbusiness plans; (ii) sale of all or substantially all of the shares of the Argentinian subsidiaries in respect of whichthe cash proceeds are distributed to Atalaya Luxco 2 and Atalaya Luxco 3; (iii) sale of the Atento Group wherebya portion of the price is allocated to the Argentinian subsidiaries, and (iv) payment of dividends by theArgentinian subsidiaries.
F-48
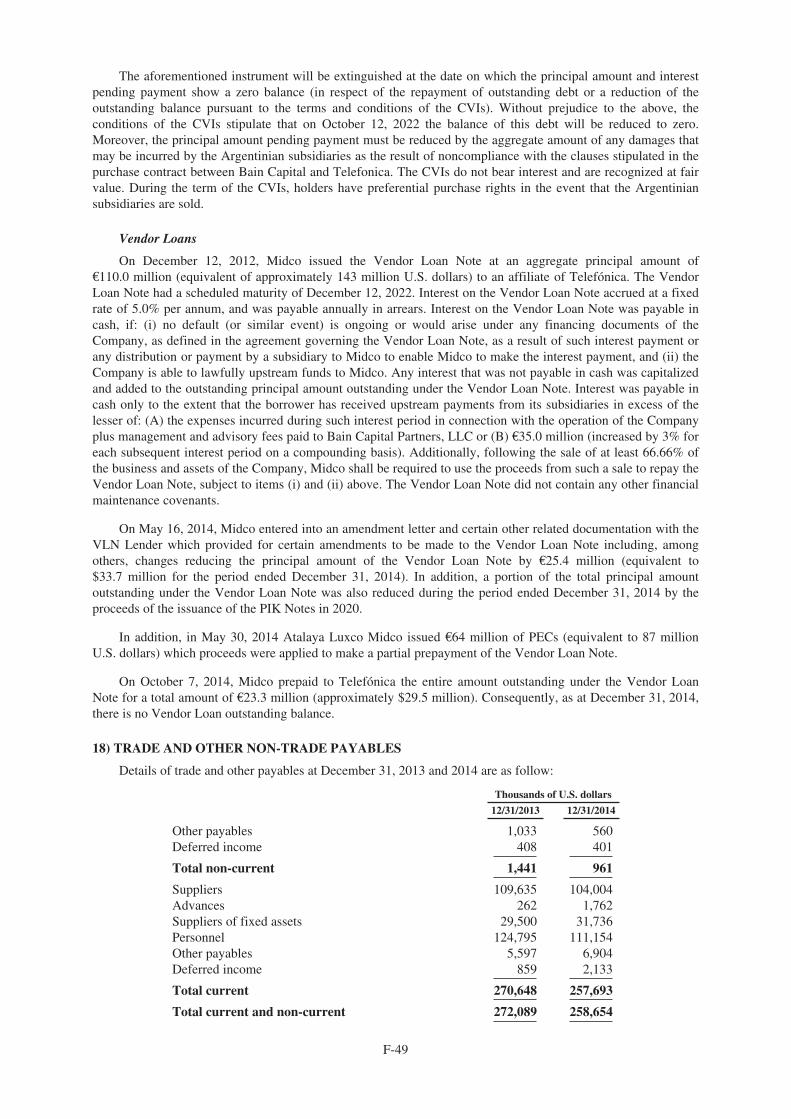
The aforementioned instrument will be extinguished at the date on which the principal amount and interestpending payment show a zero balance (in respect of the repayment of outstanding debt or a reduction of theoutstanding balance pursuant to the terms and conditions of the CVIs). Without prejudice to the above, theconditions of the CVIs stipulate that on October 12, 2022 the balance of this debt will be reduced to zero.Moreover, the principal amount pending payment must be reduced by the aggregate amount of any damages thatmay be incurred by the Argentinian subsidiaries as the result of noncompliance with the clauses stipulated in thepurchase contract between Bain Capital and Telefonica. The CVIs do not bear interest and are recognized at fairvalue. During the term of the CVIs, holders have preferential purchase rights in the event that the Argentiniansubsidiaries are sold.
Vendor Loans
On December 12, 2012, Midco issued the Vendor Loan Note at an aggregate principal amount of€110.0 million (equivalent of approximately 143 million U.S. dollars) to an affiliate of Telefónica. The VendorLoan Note had a scheduled maturity of December 12, 2022. Interest on the Vendor Loan Note accrued at a fixedrate of 5.0% per annum, and was payable annually in arrears. Interest on the Vendor Loan Note was payable incash, if: (i) no default (or similar event) is ongoing or would arise under any financing documents of theCompany, as defined in the agreement governing the Vendor Loan Note, as a result of such interest payment orany distribution or payment by a subsidiary to Midco to enable Midco to make the interest payment, and (ii) theCompany is able to lawfully upstream funds to Midco. Any interest that was not payable in cash was capitalizedand added to the outstanding principal amount outstanding under the Vendor Loan Note. Interest was payable incash only to the extent that the borrower has received upstream payments from its subsidiaries in excess of thelesser of: (A) the expenses incurred during such interest period in connection with the operation of the Companyplus management and advisory fees paid to Bain Capital Partners, LLC or (B) €35.0 million (increased by 3% foreach subsequent interest period on a compounding basis). Additionally, following the sale of at least 66.66% ofthe business and assets of the Company, Midco shall be required to use the proceeds from such a sale to repay theVendor Loan Note, subject to items (i) and (ii) above. The Vendor Loan Note did not contain any other financialmaintenance covenants.
On May 16, 2014, Midco entered into an amendment letter and certain other related documentation with theVLN Lender which provided for certain amendments to be made to the Vendor Loan Note including, amongothers, changes reducing the principal amount of the Vendor Loan Note by €25.4 million (equivalent to$33.7 million for the period ended December 31, 2014). In addition, a portion of the total principal amountoutstanding under the Vendor Loan Note was also reduced during the period ended December 31, 2014 by theproceeds of the issuance of the PIK Notes in 2020.
In addition, in May 30, 2014 Atalaya Luxco Midco issued €64 million of PECs (equivalent to 87 millionU.S. dollars) which proceeds were applied to make a partial prepayment of the Vendor Loan Note.
On October 7, 2014, Midco prepaid to Telefónica the entire amount outstanding under the Vendor LoanNote for a total amount of €23.3 million (approximately $29.5 million). Consequently, as at December 31, 2014,there is no Vendor Loan outstanding balance.
18) TRADE AND OTHER NON-TRADE PAYABLES
Details of trade and other payables at December 31, 2013 and 2014 are as follow:
Thousands of U.S. dollars
12/31/2013 12/31/2014
Other payables 1,033 560Deferred income 408 401
Total non-current 1,441 961
Suppliers 109,635 104,004Advances 262 1,762Suppliers of fixed assets 29,500 31,736Personnel 124,795 111,154Other payables 5,597 6,904Deferred income 859 2,133
Total current 270,648 257,693
Total current and non-current 272,089 258,654
F-49
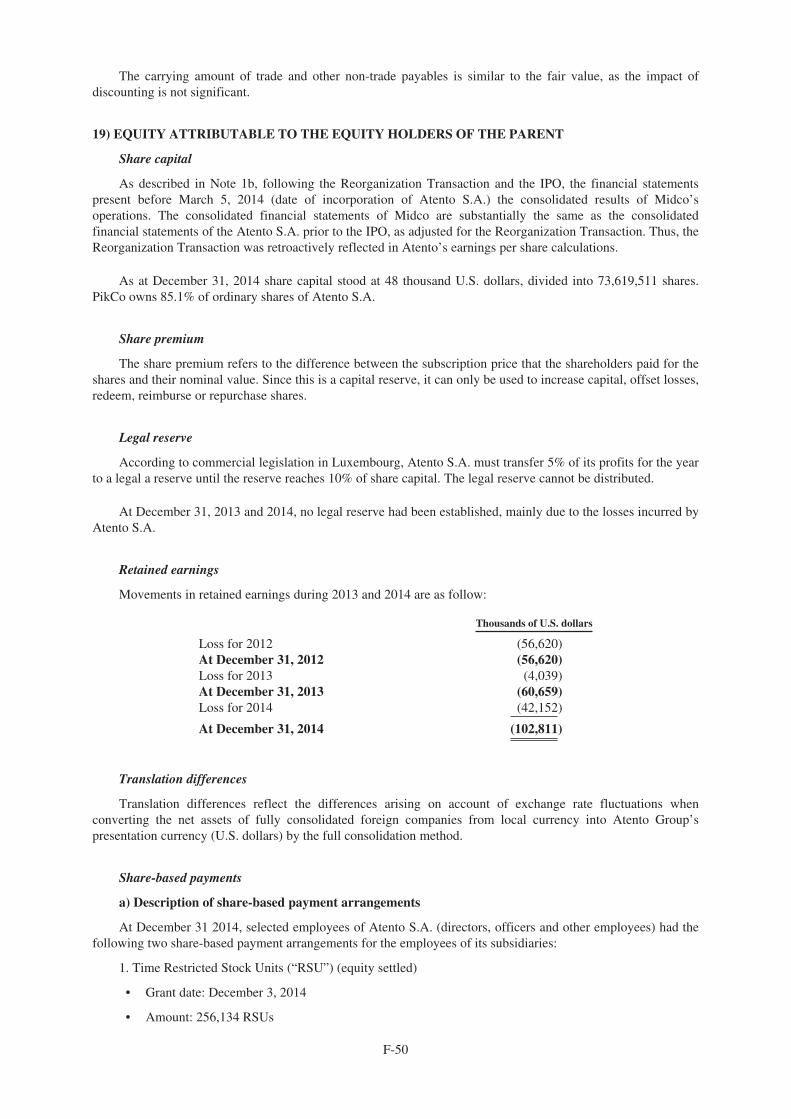
The carrying amount of trade and other non-trade payables is similar to the fair value, as the impact ofdiscounting is not significant.
19) EQUITY ATTRIBUTABLE TO THE EQUITY HOLDERS OF THE PARENT
Share capital
As described in Note 1b, following the Reorganization Transaction and the IPO, the financial statementspresent before March 5, 2014 (date of incorporation of Atento S.A.) the consolidated results of Midco’soperations. The consolidated financial statements of Midco are substantially the same as the consolidatedfinancial statements of the Atento S.A. prior to the IPO, as adjusted for the Reorganization Transaction. Thus, theReorganization Transaction was retroactively reflected in Atento’s earnings per share calculations.
As at December 31, 2014 share capital stood at 48 thousand U.S. dollars, divided into 73,619,511 shares.PikCo owns 85.1% of ordinary shares of Atento S.A.
Share premium
The share premium refers to the difference between the subscription price that the shareholders paid for theshares and their nominal value. Since this is a capital reserve, it can only be used to increase capital, offset losses,redeem, reimburse or repurchase shares.
Legal reserve
According to commercial legislation in Luxembourg, Atento S.A. must transfer 5% of its profits for the yearto a legal a reserve until the reserve reaches 10% of share capital. The legal reserve cannot be distributed.
At December 31, 2013 and 2014, no legal reserve had been established, mainly due to the losses incurred byAtento S.A.
Retained earnings
Movements in retained earnings during 2013 and 2014 are as follow:
Thousands of U.S. dollars
Loss for 2012 (56,620)At December 31, 2012 (56,620)Loss for 2013 (4,039)At December 31, 2013 (60,659)Loss for 2014 (42,152)
At December 31, 2014 (102,811)
Translation differences
Translation differences reflect the differences arising on account of exchange rate fluctuations whenconverting the net assets of fully consolidated foreign companies from local currency into Atento Group’spresentation currency (U.S. dollars) by the full consolidation method.
Share-based payments
a) Description of share-based payment arrangements
At December 31 2014, selected employees of Atento S.A. (directors, officers and other employees) had thefollowing two share-based payment arrangements for the employees of its subsidiaries:
1. Time Restricted Stock Units (“RSU”) (equity settled)
• Grant date: December 3, 2014
• Amount: 256,134 RSUs
F-50
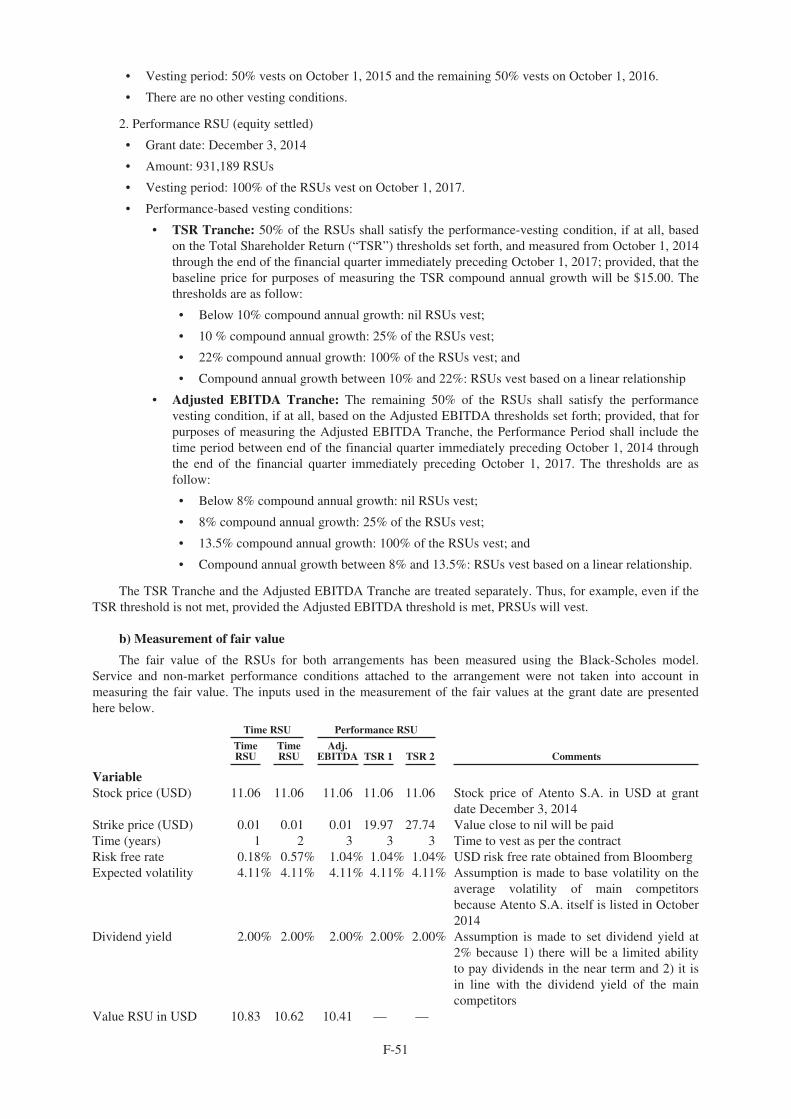
• Vesting period: 50% vests on October 1, 2015 and the remaining 50% vests on October 1, 2016.
• There are no other vesting conditions.
2. Performance RSU (equity settled)
• Grant date: December 3, 2014
• Amount: 931,189 RSUs
• Vesting period: 100% of the RSUs vest on October 1, 2017.
• Performance-based vesting conditions:
• TSR Tranche: 50% of the RSUs shall satisfy the performance-vesting condition, if at all, basedon the Total Shareholder Return (“TSR”) thresholds set forth, and measured from October 1, 2014through the end of the financial quarter immediately preceding October 1, 2017; provided, that thebaseline price for purposes of measuring the TSR compound annual growth will be $15.00. Thethresholds are as follow:
• Below 10% compound annual growth: nil RSUs vest;
• 10 % compound annual growth: 25% of the RSUs vest;
• 22% compound annual growth: 100% of the RSUs vest; and
• Compound annual growth between 10% and 22%: RSUs vest based on a linear relationship
• Adjusted EBITDA Tranche: The remaining 50% of the RSUs shall satisfy the performancevesting condition, if at all, based on the Adjusted EBITDA thresholds set forth; provided, that forpurposes of measuring the Adjusted EBITDA Tranche, the Performance Period shall include thetime period between end of the financial quarter immediately preceding October 1, 2014 throughthe end of the financial quarter immediately preceding October 1, 2017. The thresholds are asfollow:
• Below 8% compound annual growth: nil RSUs vest;
• 8% compound annual growth: 25% of the RSUs vest;
• 13.5% compound annual growth: 100% of the RSUs vest; and
• Compound annual growth between 8% and 13.5%: RSUs vest based on a linear relationship.
The TSR Tranche and the Adjusted EBITDA Tranche are treated separately. Thus, for example, even if theTSR threshold is not met, provided the Adjusted EBITDA threshold is met, PRSUs will vest.
b) Measurement of fair value
The fair value of the RSUs for both arrangements has been measured using the Black-Scholes model.Service and non-market performance conditions attached to the arrangement were not taken into account inmeasuring the fair value. The inputs used in the measurement of the fair values at the grant date are presentedhere below.
Time RSU Performance RSU
TimeRSU
TimeRSU
Adj.EBITDA TSR 1 TSR 2 Comments
VariableStock price (USD) 11.06 11.06 11.06 11.06 11.06 Stock price of Atento S.A. in USD at grant
date December 3, 2014Strike price (USD) 0.01 0.01 0.01 19.97 27.74 Value close to nil will be paidTime (years) 1 2 3 3 3 Time to vest as per the contractRisk free rate 0.18% 0.57% 1.04% 1.04% 1.04% USD risk free rate obtained from BloombergExpected volatility 4.11% 4.11% 4.11% 4.11% 4.11% Assumption is made to base volatility on the
average volatility of main competitorsbecause Atento S.A. itself is listed in October2014
Dividend yield 2.00% 2.00% 2.00% 2.00% 2.00% Assumption is made to set dividend yield at2% because 1) there will be a limited abilityto pay dividends in the near term and 2) it isin line with the dividend yield of the maincompetitors
Value RSU in USD 10.83 10.62 10.41 — —
F-51
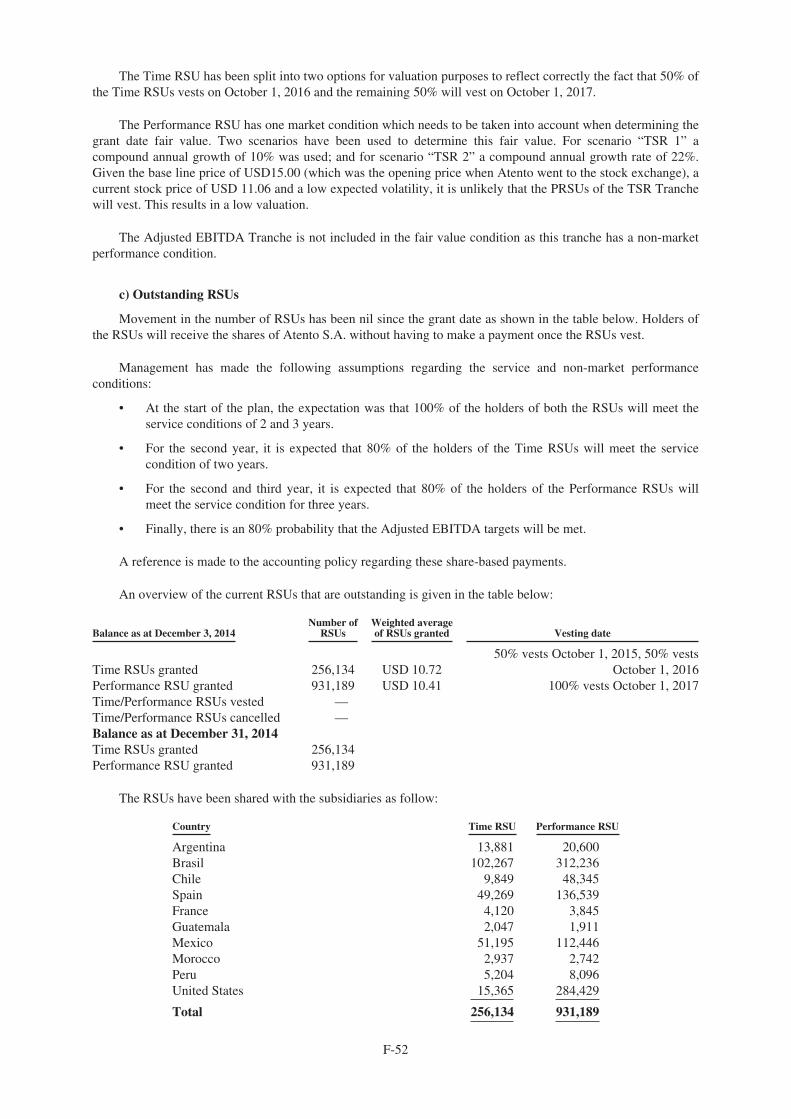
The Time RSU has been split into two options for valuation purposes to reflect correctly the fact that 50% ofthe Time RSUs vests on October 1, 2016 and the remaining 50% will vest on October 1, 2017.
The Performance RSU has one market condition which needs to be taken into account when determining thegrant date fair value. Two scenarios have been used to determine this fair value. For scenario “TSR 1” acompound annual growth of 10% was used; and for scenario “TSR 2” a compound annual growth rate of 22%.Given the base line price of USD15.00 (which was the opening price when Atento went to the stock exchange), acurrent stock price of USD 11.06 and a low expected volatility, it is unlikely that the PRSUs of the TSR Tranchewill vest. This results in a low valuation.
The Adjusted EBITDA Tranche is not included in the fair value condition as this tranche has a non-marketperformance condition.
c) Outstanding RSUs
Movement in the number of RSUs has been nil since the grant date as shown in the table below. Holders ofthe RSUs will receive the shares of Atento S.A. without having to make a payment once the RSUs vest.
Management has made the following assumptions regarding the service and non-market performanceconditions:
• At the start of the plan, the expectation was that 100% of the holders of both the RSUs will meet theservice conditions of 2 and 3 years.
• For the second year, it is expected that 80% of the holders of the Time RSUs will meet the servicecondition of two years.
• For the second and third year, it is expected that 80% of the holders of the Performance RSUs willmeet the service condition for three years.
• Finally, there is an 80% probability that the Adjusted EBITDA targets will be met.
A reference is made to the accounting policy regarding these share-based payments.
An overview of the current RSUs that are outstanding is given in the table below:
Balance as at December 3, 2014Number of
RSUsWeighted averageof RSUs granted Vesting date
Time RSUs granted 256,134 USD 10.7250% vests October 1, 2015, 50% vests
October 1, 2016Performance RSU granted 931,189 USD 10.41 100% vests October 1, 2017Time/Performance RSUs vested —Time/Performance RSUs cancelled —Balance as at December 31, 2014Time RSUs granted 256,134Performance RSU granted 931,189
The RSUs have been shared with the subsidiaries as follow:
Country Time RSU Performance RSU
Argentina 13,881 20,600Brasil 102,267 312,236Chile 9,849 48,345Spain 49,269 136,539France 4,120 3,845Guatemala 2,047 1,911Mexico 51,195 112,446Morocco 2,937 2,742Peru 5,204 8,096United States 15,365 284,429
Total 256,134 931,189
F-52
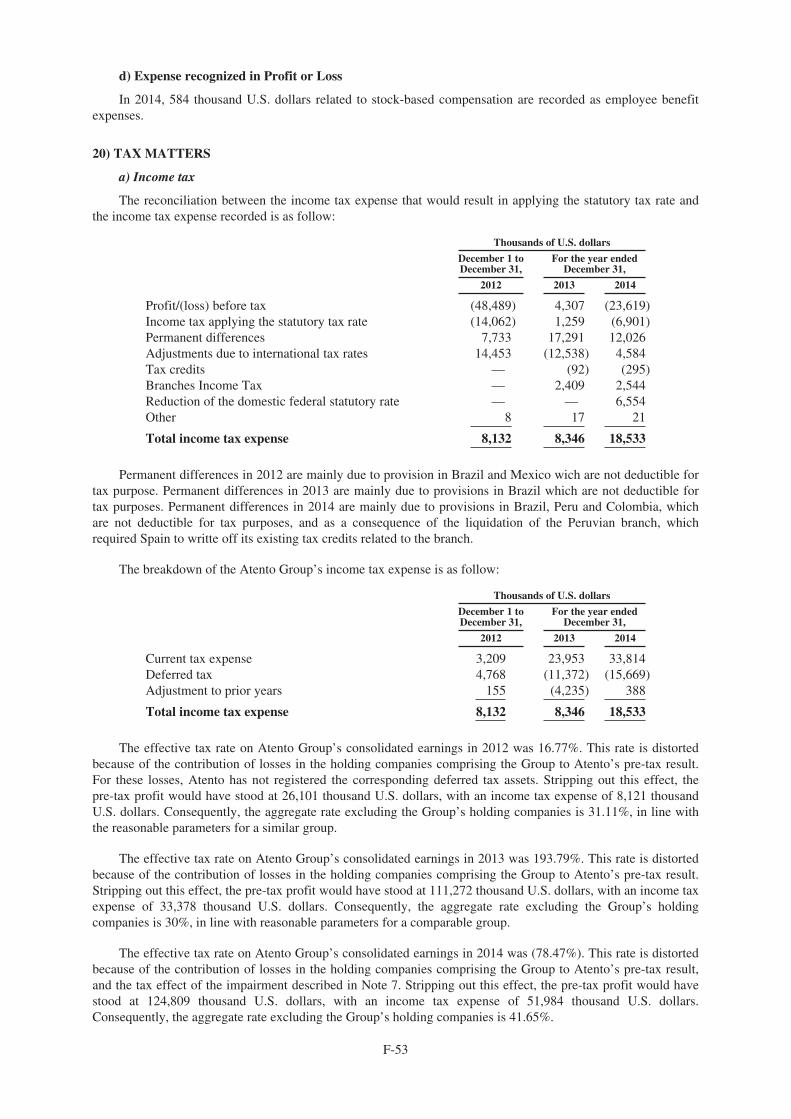
d) Expense recognized in Profit or Loss
In 2014, 584 thousand U.S. dollars related to stock-based compensation are recorded as employee benefitexpenses.
20) TAX MATTERS
a) Income tax
The reconciliation between the income tax expense that would result in applying the statutory tax rate andthe income tax expense recorded is as follow:
Thousands of U.S. dollars
December 1 toDecember 31,
For the year endedDecember 31,
2012 2013 2014
Profit/(loss) before tax (48,489) 4,307 (23,619)Income tax applying the statutory tax rate (14,062) 1,259 (6,901)Permanent differences 7,733 17,291 12,026Adjustments due to international tax rates 14,453 (12,538) 4,584Tax credits — (92) (295)Branches Income Tax — 2,409 2,544Reduction of the domestic federal statutory rate — — 6,554Other 8 17 21
Total income tax expense 8,132 8,346 18,533
Permanent differences in 2012 are mainly due to provision in Brazil and Mexico wich are not deductible fortax purpose. Permanent differences in 2013 are mainly due to provisions in Brazil which are not deductible fortax purposes. Permanent differences in 2014 are mainly due to provisions in Brazil, Peru and Colombia, whichare not deductible for tax purposes, and as a consequence of the liquidation of the Peruvian branch, whichrequired Spain to writte off its existing tax credits related to the branch.
The breakdown of the Atento Group’s income tax expense is as follow:
Thousands of U.S. dollars
December 1 toDecember 31,
For the year endedDecember 31,
2012 2013 2014
Current tax expense 3,209 23,953 33,814Deferred tax 4,768 (11,372) (15,669)Adjustment to prior years 155 (4,235) 388
Total income tax expense 8,132 8,346 18,533
The effective tax rate on Atento Group’s consolidated earnings in 2012 was 16.77%. This rate is distortedbecause of the contribution of losses in the holding companies comprising the Group to Atento’s pre-tax result.For these losses, Atento has not registered the corresponding deferred tax assets. Stripping out this effect, thepre-tax profit would have stood at 26,101 thousand U.S. dollars, with an income tax expense of 8,121 thousandU.S. dollars. Consequently, the aggregate rate excluding the Group’s holding companies is 31.11%, in line withthe reasonable parameters for a similar group.
The effective tax rate on Atento Group’s consolidated earnings in 2013 was 193.79%. This rate is distortedbecause of the contribution of losses in the holding companies comprising the Group to Atento’s pre-tax result.Stripping out this effect, the pre-tax profit would have stood at 111,272 thousand U.S. dollars, with an income taxexpense of 33,378 thousand U.S. dollars. Consequently, the aggregate rate excluding the Group’s holdingcompanies is 30%, in line with reasonable parameters for a comparable group.
The effective tax rate on Atento Group’s consolidated earnings in 2014 was (78.47%). This rate is distortedbecause of the contribution of losses in the holding companies comprising the Group to Atento’s pre-tax result,and the tax effect of the impairment described in Note 7. Stripping out this effect, the pre-tax profit would havestood at 124,809 thousand U.S. dollars, with an income tax expense of 51,984 thousand U.S. dollars.Consequently, the aggregate rate excluding the Group’s holding companies is 41.65%.
F-53
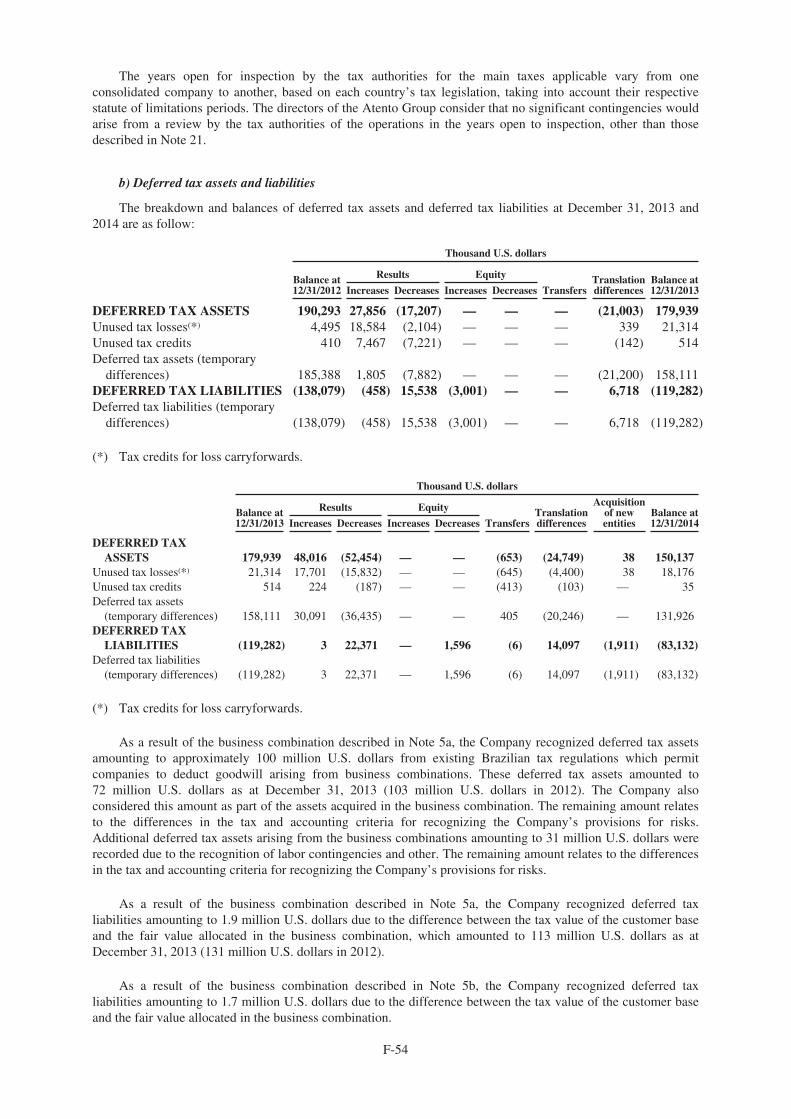
The years open for inspection by the tax authorities for the main taxes applicable vary from oneconsolidated company to another, based on each country’s tax legislation, taking into account their respectivestatute of limitations periods. The directors of the Atento Group consider that no significant contingencies wouldarise from a review by the tax authorities of the operations in the years open to inspection, other than thosedescribed in Note 21.
b) Deferred tax assets and liabilities
The breakdown and balances of deferred tax assets and deferred tax liabilities at December 31, 2013 and2014 are as follow:
Thousand U.S. dollars
Balance at12/31/2012
Results Equity
TransfersTranslationdifferences
Balance at12/31/2013Increases Decreases Increases Decreases
DEFERRED TAX ASSETS 190,293 27,856 (17,207) — — — (21,003) 179,939Unused tax losses(*) 4,495 18,584 (2,104) — — — 339 21,314Unused tax credits 410 7,467 (7,221) — — — (142) 514Deferred tax assets (temporary
differences) 185,388 1,805 (7,882) — — — (21,200) 158,111DEFERRED TAX LIABILITIES (138,079) (458) 15,538 (3,001) — — 6,718 (119,282)Deferred tax liabilities (temporary
differences) (138,079) (458) 15,538 (3,001) — — 6,718 (119,282)
(*) Tax credits for loss carryforwards.
Thousand U.S. dollars
Balance at12/31/2013
Results Equity
TransfersTranslationdifferences
Acquisitionof newentities
Balance at12/31/2014Increases Decreases Increases Decreases
DEFERRED TAXASSETS 179,939 48,016 (52,454) — — (653) (24,749) 38 150,137
Unused tax losses(*) 21,314 17,701 (15,832) — — (645) (4,400) 38 18,176Unused tax credits 514 224 (187) — — (413) (103) — 35Deferred tax assets
(temporary differences) 158,111 30,091 (36,435) — — 405 (20,246) — 131,926DEFERRED TAX
LIABILITIES (119,282) 3 22,371 — 1,596 (6) 14,097 (1,911) (83,132)Deferred tax liabilities
(temporary differences) (119,282) 3 22,371 — 1,596 (6) 14,097 (1,911) (83,132)
(*) Tax credits for loss carryforwards.
As a result of the business combination described in Note 5a, the Company recognized deferred tax assetsamounting to approximately 100 million U.S. dollars from existing Brazilian tax regulations which permitcompanies to deduct goodwill arising from business combinations. These deferred tax assets amounted to72 million U.S. dollars as at December 31, 2013 (103 million U.S. dollars in 2012). The Company alsoconsidered this amount as part of the assets acquired in the business combination. The remaining amount relatesto the differences in the tax and accounting criteria for recognizing the Company’s provisions for risks.Additional deferred tax assets arising from the business combinations amounting to 31 million U.S. dollars wererecorded due to the recognition of labor contingencies and other. The remaining amount relates to the differencesin the tax and accounting criteria for recognizing the Company’s provisions for risks.
As a result of the business combination described in Note 5a, the Company recognized deferred taxliabilities amounting to 1.9 million U.S. dollars due to the difference between the tax value of the customer baseand the fair value allocated in the business combination, which amounted to 113 million U.S. dollars as atDecember 31, 2013 (131 million U.S. dollars in 2012).
As a result of the business combination described in Note 5b, the Company recognized deferred taxliabilities amounting to 1.7 million U.S. dollars due to the difference between the tax value of the customer baseand the fair value allocated in the business combination.
F-54
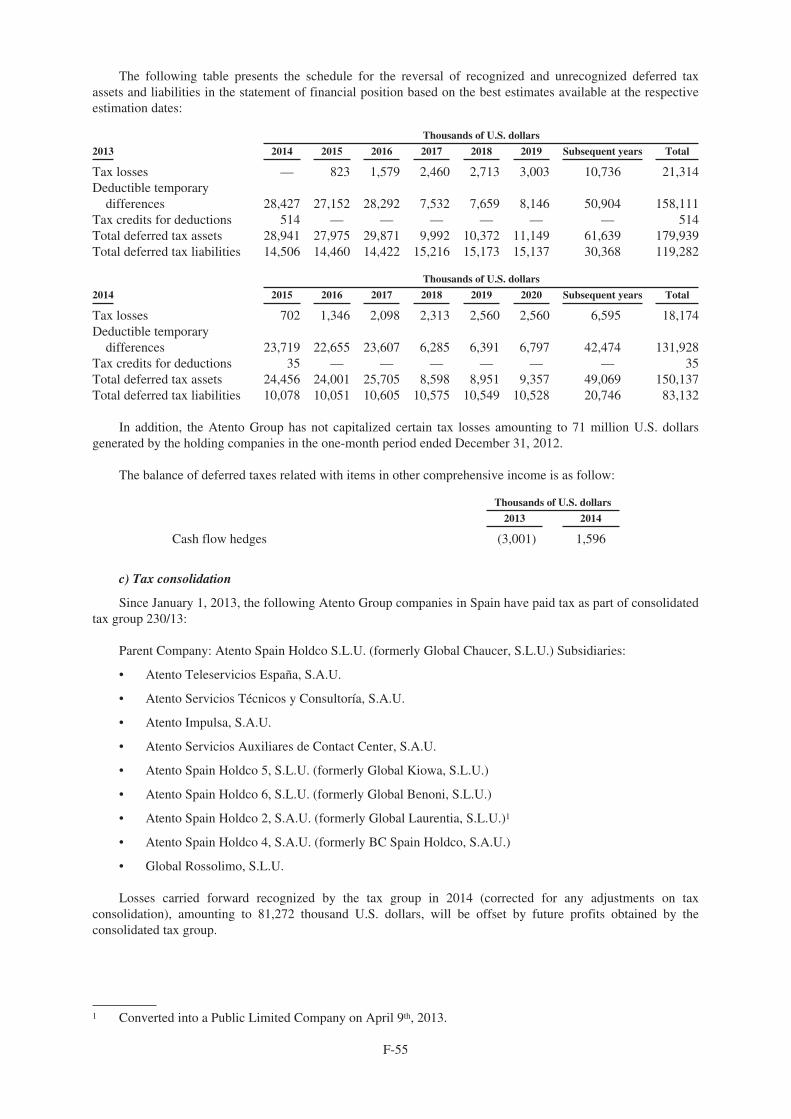
The following table presents the schedule for the reversal of recognized and unrecognized deferred taxassets and liabilities in the statement of financial position based on the best estimates available at the respectiveestimation dates:
Thousands of U.S. dollars
2013 2014 2015 2016 2017 2018 2019 Subsequent years Total
Tax losses — 823 1,579 2,460 2,713 3,003 10,736 21,314Deductible temporary
differences 28,427 27,152 28,292 7,532 7,659 8,146 50,904 158,111Tax credits for deductions 514 — — — — — — 514Total deferred tax assets 28,941 27,975 29,871 9,992 10,372 11,149 61,639 179,939Total deferred tax liabilities 14,506 14,460 14,422 15,216 15,173 15,137 30,368 119,282
Thousands of U.S. dollars
2014 2015 2016 2017 2018 2019 2020 Subsequent years Total
Tax losses 702 1,346 2,098 2,313 2,560 2,560 6,595 18,174Deductible temporary
differences 23,719 22,655 23,607 6,285 6,391 6,797 42,474 131,928Tax credits for deductions 35 — — — — — — 35Total deferred tax assets 24,456 24,001 25,705 8,598 8,951 9,357 49,069 150,137Total deferred tax liabilities 10,078 10,051 10,605 10,575 10,549 10,528 20,746 83,132
In addition, the Atento Group has not capitalized certain tax losses amounting to 71 million U.S. dollarsgenerated by the holding companies in the one-month period ended December 31, 2012.
The balance of deferred taxes related with items in other comprehensive income is as follow:
Thousands of U.S. dollars
2013 2014
Cash flow hedges (3,001) 1,596
c) Tax consolidation
Since January 1, 2013, the following Atento Group companies in Spain have paid tax as part of consolidatedtax group 230/13:
Parent Company: Atento Spain Holdco S.L.U. (formerly Global Chaucer, S.L.U.) Subsidiaries:
• Atento Teleservicios España, S.A.U.
• Atento Servicios Técnicos y Consultoría, S.A.U.
• Atento Impulsa, S.A.U.
• Atento Servicios Auxiliares de Contact Center, S.A.U.
• Atento Spain Holdco 5, S.L.U. (formerly Global Kiowa, S.L.U.)
• Atento Spain Holdco 6, S.L.U. (formerly Global Benoni, S.L.U.)
• Atento Spain Holdco 2, S.A.U. (formerly Global Laurentia, S.L.U.)1
• Atento Spain Holdco 4, S.A.U. (formerly BC Spain Holdco, S.A.U.)
• Global Rossolimo, S.L.U.
Losses carried forward recognized by the tax group in 2014 (corrected for any adjustments on taxconsolidation), amounting to 81,272 thousand U.S. dollars, will be offset by future profits obtained by theconsolidated tax group.
1 Converted into a Public Limited Company on April 9th, 2013.
F-55
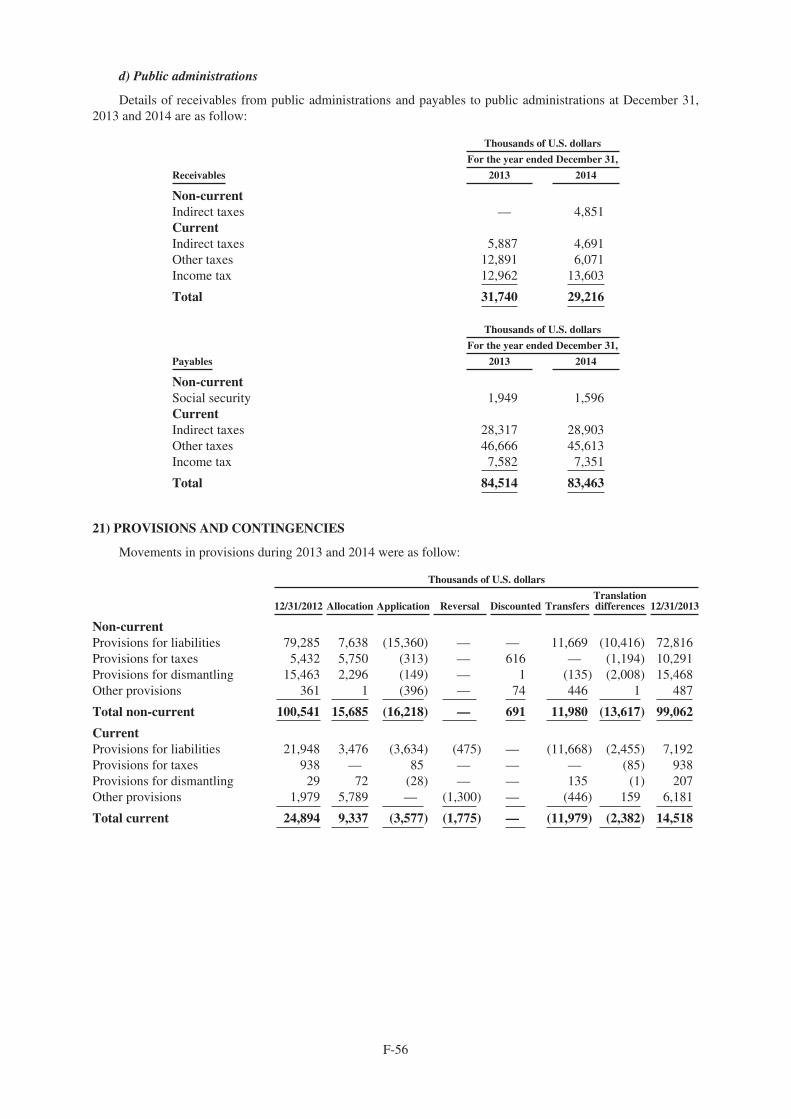
d) Public administrations
Details of receivables from public administrations and payables to public administrations at December 31,2013 and 2014 are as follow:
Thousands of U.S. dollars
For the year ended December 31,
Receivables 2013 2014
Non-currentIndirect taxes — 4,851CurrentIndirect taxes 5,887 4,691Other taxes 12,891 6,071Income tax 12,962 13,603
Total 31,740 29,216
Thousands of U.S. dollars
For the year ended December 31,
Payables 2013 2014
Non-currentSocial security 1,949 1,596CurrentIndirect taxes 28,317 28,903Other taxes 46,666 45,613Income tax 7,582 7,351
Total 84,514 83,463
21) PROVISIONS AND CONTINGENCIES
Movements in provisions during 2013 and 2014 were as follow:
Thousands of U.S. dollars
12/31/2012 Allocation Application Reversal Discounted TransfersTranslationdifferences 12/31/2013
Non-currentProvisions for liabilities 79,285 7,638 (15,360) — — 11,669 (10,416) 72,816Provisions for taxes 5,432 5,750 (313) — 616 — (1,194) 10,291Provisions for dismantling 15,463 2,296 (149) — 1 (135) (2,008) 15,468Other provisions 361 1 (396) — 74 446 1 487
Total non-current 100,541 15,685 (16,218) — 691 11,980 (13,617) 99,062
CurrentProvisions for liabilities 21,948 3,476 (3,634) (475) — (11,668) (2,455) 7,192Provisions for taxes 938 — 85 — — — (85) 938Provisions for dismantling 29 72 (28) — — 135 (1) 207Other provisions 1,979 5,789 — (1,300) — (446) 159 6,181
Total current 24,894 9,337 (3,577) (1,775) — (11,979) (2,382) 14,518
F-56
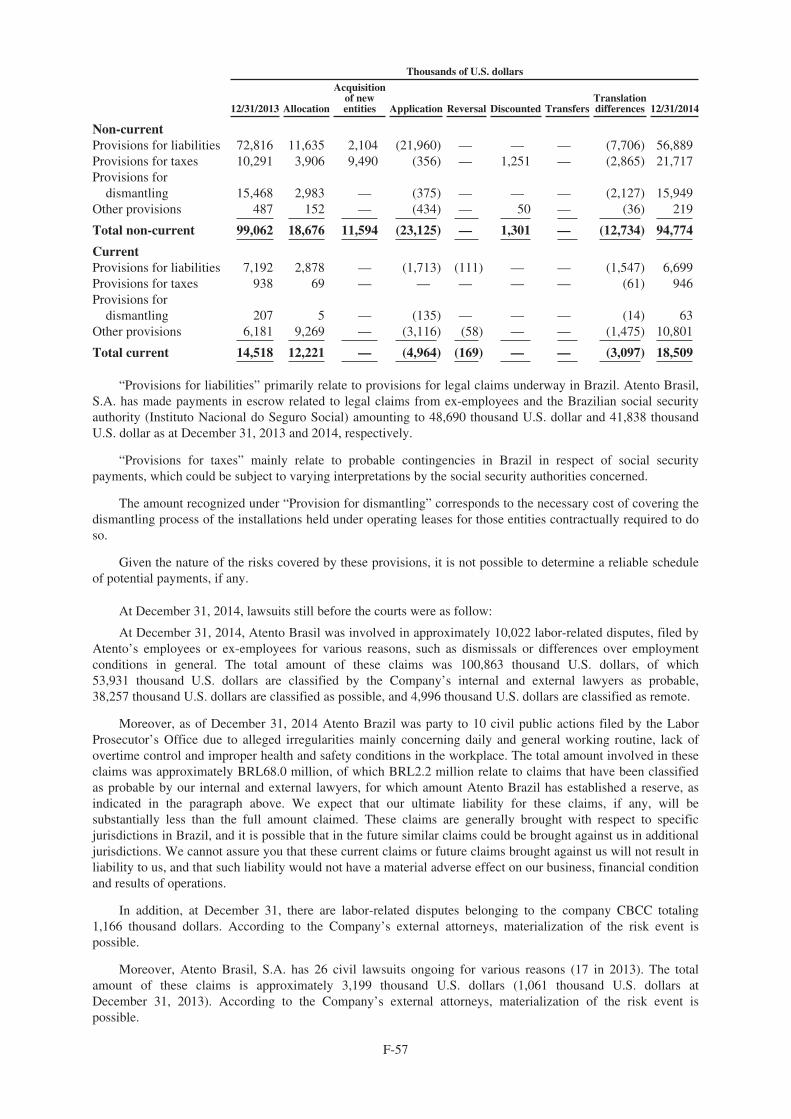
Thousands of U.S. dollars
12/31/2013 Allocation
Acquisitionof newentities Application Reversal Discounted Transfers
Translationdifferences 12/31/2014
Non-currentProvisions for liabilities 72,816 11,635 2,104 (21,960) — — — (7,706) 56,889Provisions for taxes 10,291 3,906 9,490 (356) — 1,251 — (2,865) 21,717Provisions for
dismantling 15,468 2,983 — (375) — — — (2,127) 15,949Other provisions 487 152 — (434) — 50 — (36) 219
Total non-current 99,062 18,676 11,594 (23,125) — 1,301 — (12,734) 94,774
CurrentProvisions for liabilities 7,192 2,878 — (1,713) (111) — — (1,547) 6,699Provisions for taxes 938 69 — — — — — (61) 946Provisions for
dismantling 207 5 — (135) — — — (14) 63Other provisions 6,181 9,269 — (3,116) (58) — — (1,475) 10,801
Total current 14,518 12,221 — (4,964) (169) — — (3,097) 18,509
“Provisions for liabilities” primarily relate to provisions for legal claims underway in Brazil. Atento Brasil,S.A. has made payments in escrow related to legal claims from ex-employees and the Brazilian social securityauthority (Instituto Nacional do Seguro Social) amounting to 48,690 thousand U.S. dollar and 41,838 thousandU.S. dollar as at December 31, 2013 and 2014, respectively.
“Provisions for taxes” mainly relate to probable contingencies in Brazil in respect of social securitypayments, which could be subject to varying interpretations by the social security authorities concerned.
The amount recognized under “Provision for dismantling” corresponds to the necessary cost of covering thedismantling process of the installations held under operating leases for those entities contractually required to doso.
Given the nature of the risks covered by these provisions, it is not possible to determine a reliable scheduleof potential payments, if any.
At December 31, 2014, lawsuits still before the courts were as follow:
At December 31, 2014, Atento Brasil was involved in approximately 10,022 labor-related disputes, filed byAtento’s employees or ex-employees for various reasons, such as dismissals or differences over employmentconditions in general. The total amount of these claims was 100,863 thousand U.S. dollars, of which53,931 thousand U.S. dollars are classified by the Company’s internal and external lawyers as probable,38,257 thousand U.S. dollars are classified as possible, and 4,996 thousand U.S. dollars are classified as remote.
Moreover, as of December 31, 2014 Atento Brazil was party to 10 civil public actions filed by the LaborProsecutor’s Office due to alleged irregularities mainly concerning daily and general working routine, lack ofovertime control and improper health and safety conditions in the workplace. The total amount involved in theseclaims was approximately BRL68.0 million, of which BRL2.2 million relate to claims that have been classifiedas probable by our internal and external lawyers, for which amount Atento Brazil has established a reserve, asindicated in the paragraph above. We expect that our ultimate liability for these claims, if any, will besubstantially less than the full amount claimed. These claims are generally brought with respect to specificjurisdictions in Brazil, and it is possible that in the future similar claims could be brought against us in additionaljurisdictions. We cannot assure you that these current claims or future claims brought against us will not result inliability to us, and that such liability would not have a material adverse effect on our business, financial conditionand results of operations.
In addition, at December 31, there are labor-related disputes belonging to the company CBCC totaling1,166 thousand dollars. According to the Company’s external attorneys, materialization of the risk event ispossible.
Moreover, Atento Brasil, S.A. has 26 civil lawsuits ongoing for various reasons (17 in 2013). The totalamount of these claims is approximately 3,199 thousand U.S. dollars (1,061 thousand U.S. dollars atDecember 31, 2013). According to the Company’s external attorneys, materialization of the risk event ispossible.
F-57
In addition, at December 31, 2014 Atento Brasil, S.A. has 29 disputes ongoing with the tax authorities andsocial security authorities, for various reasons relating to infraction proceedings filed (33 in 2013). The totalamount of these claims is approximately 33,796 thousand U.S. dollars (47,532 thousand U.S. dollars atDecember 31, 2013). According to the Company’s external attorneys, materialization of the risk event ispossible.
Lastly, there are other contingencies which are classified as possible by the Company amounting to11,120 thousand U.S. dollars.
At December 31, 2014 Teleatento del Perú, S.A.C. has a lawsuit underway with the Peruvian tax authoritiesamounting to 8,509 thousand U.S. dollars (9,473 thousand U.S. dollars in 2013). According to the Company’sexternal attorneys, materialization of the risk event is possible.
At December 31, 2014 Atento Teleservicios España S.A.U. and the rest of Spanish companies was party tolabor-related disputes filed by Atento employees or former employees for different reasons, such as dismissalsand disagreements regarding employment conditions, totaling 4,401 thousand U.S. dollars (2,251 thousand U.S.dollars in 2013). According to the Company’s external lawyers, materialization of the risk event is possible.
At December 31, 2014 Atento México S.A. de CV was a party to labor-related disputes filed by Atentoemployees or former employees for different reasons, such as dismissals and disagreements regardingemployment conditions, totaling 5,897 thousand U.S. dollars (4,823 thousand U.S. dollars in 2013). According tothe Company’s external lawyers, materialization of the risk event is possible.
Provision for restructuring in Spain
On June 26, 2014, the Company communicated to the Spanish Labor Unions a headcount reduction plan inSpain (“Expediente de Regulación de Empleo”) which took into consideration a maximum number ofterminations amounting to 9% (up to 672 employees) of the total headcount of Atento Teleservicios España,S.A.U. The estimated costs incurred in the personnel restructuring and other costs directly attributable to therestructuring at an amount equivalent to 13,918 thousand U.S. dollars as at September 30, 2014 were accrued andrecognized in “Other provisions”. As at September 30, 2014, the vast majority of total costs incurred inconnection with this restructuring process (11,484 thousand U.S. dollars) had already been paid.
An appeal against this agreement was filed by a minority of the unions before the Spanish National Court,claiming that the restructuring was null and void on a number of grounds. On November 12, 2014, the courtissued its decision, and rejected each of the minority unions’ claims, except with respect to the claim that therewas a defect in the referendum procedure conducted by the majority unions. The court ruled that there was adefect in the majority unions’ referendum procedure, and as a result, declared the Company’s headcountreduction plan to be null and void.
The court, based on that nullity, declared that the Company must reinstate all dismissed employees and paytheir salaries in full for the period from when they were dismissed until reinstatement. The employees would berequired to pay back the severance payments received upon termination. On November 19, 2014, the Companyappealed this decision before the Spanish Supreme Court.
On December 12, 2014, the Spanish National Court approved a settlement agreement reached between theCompany’s subsidiary in Spain and all seven trade unions with representation in the legal proceedings, whichprovides a headcount reduction of 476 employees of the total initially proposed headcount in the collectivedismissal program.
According to the agreement reached, 179 employees will be readmitted to their prior positions with theCompany on the terms they had before the process began, including receiving the same salary.
This unanimous agreement and its approval by the Spanish National Court bring to an end the process andreflect the efforts of all parties involved to reach a beneficial solution for all stakeholders.
F-58
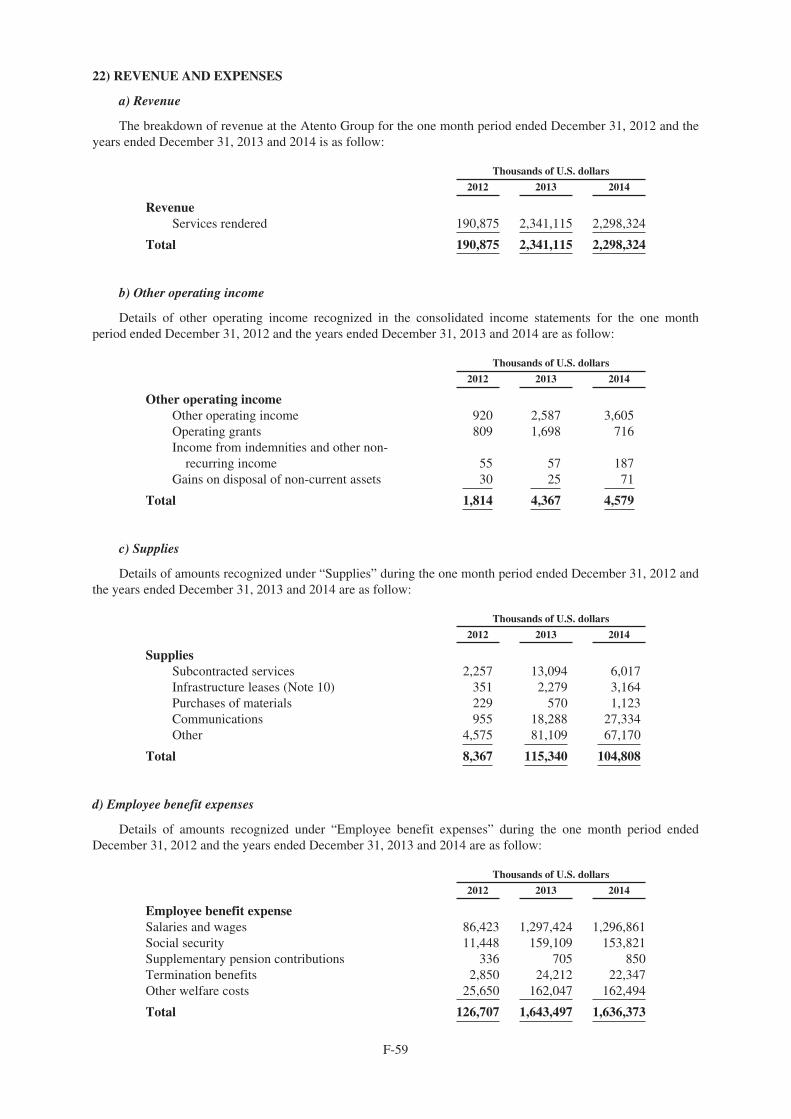
22) REVENUE AND EXPENSES
a) Revenue
The breakdown of revenue at the Atento Group for the one month period ended December 31, 2012 and theyears ended December 31, 2013 and 2014 is as follow:
Thousands of U.S. dollars
2012 2013 2014
RevenueServices rendered 190,875 2,341,115 2,298,324
Total 190,875 2,341,115 2,298,324
b) Other operating income
Details of other operating income recognized in the consolidated income statements for the one monthperiod ended December 31, 2012 and the years ended December 31, 2013 and 2014 are as follow:
Thousands of U.S. dollars
2012 2013 2014
Other operating incomeOther operating income 920 2,587 3,605Operating grants 809 1,698 716Income from indemnities and other non-
recurring income 55 57 187Gains on disposal of non-current assets 30 25 71
Total 1,814 4,367 4,579
c) Supplies
Details of amounts recognized under “Supplies” during the one month period ended December 31, 2012 andthe years ended December 31, 2013 and 2014 are as follow:
Thousands of U.S. dollars
2012 2013 2014
SuppliesSubcontracted services 2,257 13,094 6,017Infrastructure leases (Note 10) 351 2,279 3,164Purchases of materials 229 570 1,123Communications 955 18,288 27,334Other 4,575 81,109 67,170
Total 8,367 115,340 104,808
d) Employee benefit expenses
Details of amounts recognized under “Employee benefit expenses” during the one month period endedDecember 31, 2012 and the years ended December 31, 2013 and 2014 are as follow:
Thousands of U.S. dollars
2012 2013 2014
Employee benefit expenseSalaries and wages 86,423 1,297,424 1,296,861Social security 11,448 159,109 153,821Supplementary pension contributions 336 705 850Termination benefits 2,850 24,212 22,347Other welfare costs 25,650 162,047 162,494
Total 126,707 1,643,497 1,636,373
F-59
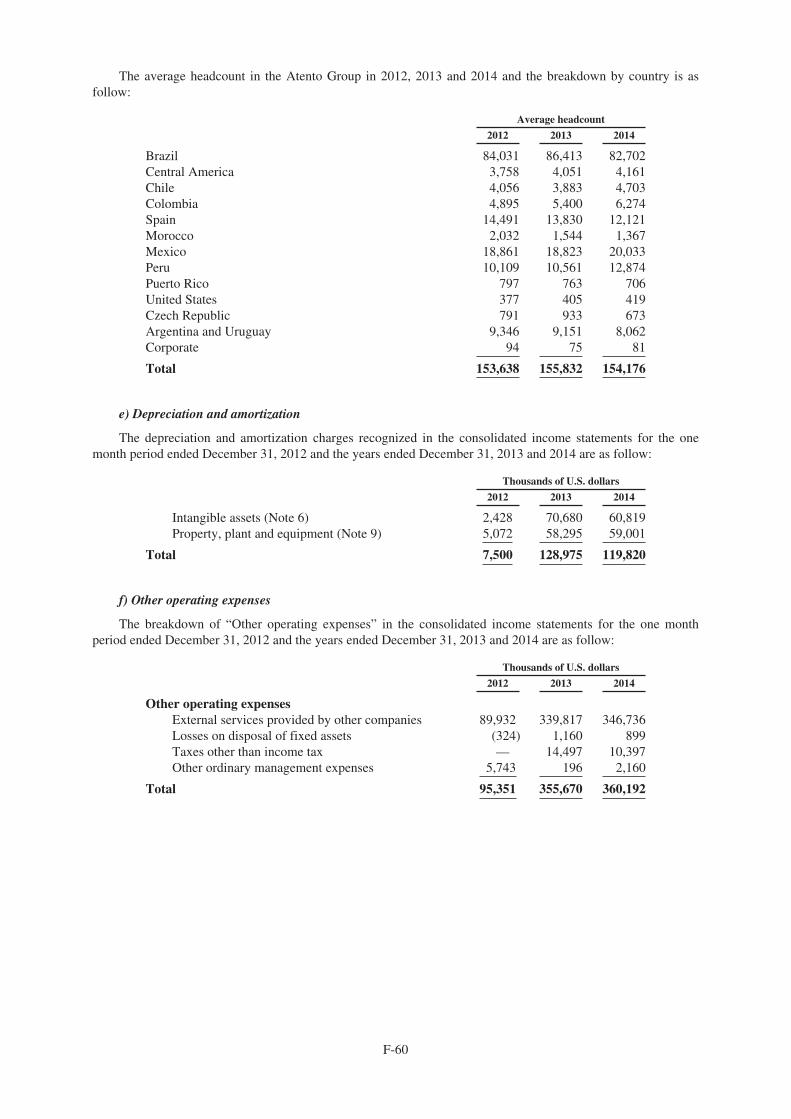
The average headcount in the Atento Group in 2012, 2013 and 2014 and the breakdown by country is asfollow:
Average headcount
2012 2013 2014
Brazil 84,031 86,413 82,702Central America 3,758 4,051 4,161Chile 4,056 3,883 4,703Colombia 4,895 5,400 6,274Spain 14,491 13,830 12,121Morocco 2,032 1,544 1,367Mexico 18,861 18,823 20,033Peru 10,109 10,561 12,874Puerto Rico 797 763 706United States 377 405 419Czech Republic 791 933 673Argentina and Uruguay 9,346 9,151 8,062Corporate 94 75 81
Total 153,638 155,832 154,176
e) Depreciation and amortization
The depreciation and amortization charges recognized in the consolidated income statements for the onemonth period ended December 31, 2012 and the years ended December 31, 2013 and 2014 are as follow:
Thousands of U.S. dollars
2012 2013 2014
Intangible assets (Note 6) 2,428 70,680 60,819Property, plant and equipment (Note 9) 5,072 58,295 59,001
Total 7,500 128,975 119,820
f) Other operating expenses
The breakdown of “Other operating expenses” in the consolidated income statements for the one monthperiod ended December 31, 2012 and the years ended December 31, 2013 and 2014 are as follow:
Thousands of U.S. dollars
2012 2013 2014
Other operating expensesExternal services provided by other companies 89,932 339,817 346,736Losses on disposal of fixed assets (324) 1,160 899Taxes other than income tax — 14,497 10,397Other ordinary management expenses 5,743 196 2,160
Total 95,351 355,670 360,192
F-60

Details of “External services provided by other companies” under “Other operating expenses” are as follow:
Thousands of U.S. dollars
2012 2013 2014
External services provided by other companiesLeases (Note 25c) 11,231 118,335 106,345Installation and maintenance 4,791 44,688 35,997Lawyers and law firms 2,055 12,264 13,159Tax advisory services 263 329 240Consultants 11,780 36,255 30,436Audits and other related services 4,106 2,740 6,911Studies and work performed 106 1,497 724Other external professional services 43,878 45,044 76,923Publicity, advertising and public relations 299 7,753 9,327Insurance premiums 175 1,998 1,987Travel expenses 1,539 13,984 14,666Utilities 3,548 35,627 31,701Banking and similar services 352 625 8,734Other 5,809 18,678 9,586
TOTAL 89,932 339,817 346,736
The amounts recognized under “Consultants” and “Other external professional services” in the one monthperiod ended December 31, 2012 and the years ended December 31, 2013 and 2014 primarily relate to expensesincurred on the acquisition of the Atento Group from Telefónica, S.A. and other integration related costs.
As at December 31, 2014, the total amount paid related to IPO costs was 43.8 million U.S. dollars, of which1.3 million U.S. dollars were capitalized.
g) Finance income and costs
The breakdown of “Finance income” and “Finance costs” in the consolidated income statements for the onemonth period ended December 31, 2012 and the years ended December 31, 2013 and 2014 are as follow:
Thousands of U.S. dollars
2012 2013 2014
Finance incomeInterest received from third parties 2,595 10,832 17,326Gains on the fair value of financial instruments — 6,934 40,902Gains on the disposal of financial assets — 27 60
Total finance income 2,595 17,793 58,288
Finance costsInterest paid to Group companies (Note 26) (1,934) (25,652) (25,435)Interest paid to third parties (6,728) (90,820) (95,243)Discounts to the present value of provisions and other
liabilities (1) (1,215) (1,385)Losses on the disposal of financial assets — (161) —Loss in the fair value of financial instruments — (17,226) (13,631)
Total finance cost (8,663) (135,074) (135,694)
The breakdown of “Foreign Exchange gains” and “Foreign Exchange losses” is shown in the table below:
2012
Thousands of U.S. dollars Exchange gains Exchange losses Net
Foreign Exchange gains/(losses)Loans and receivables 19 (940)Other financial transactions 2,926 (2,892)Current transactions 2,303 (1,392)
Total 5,248 (5,224) 24
F-61
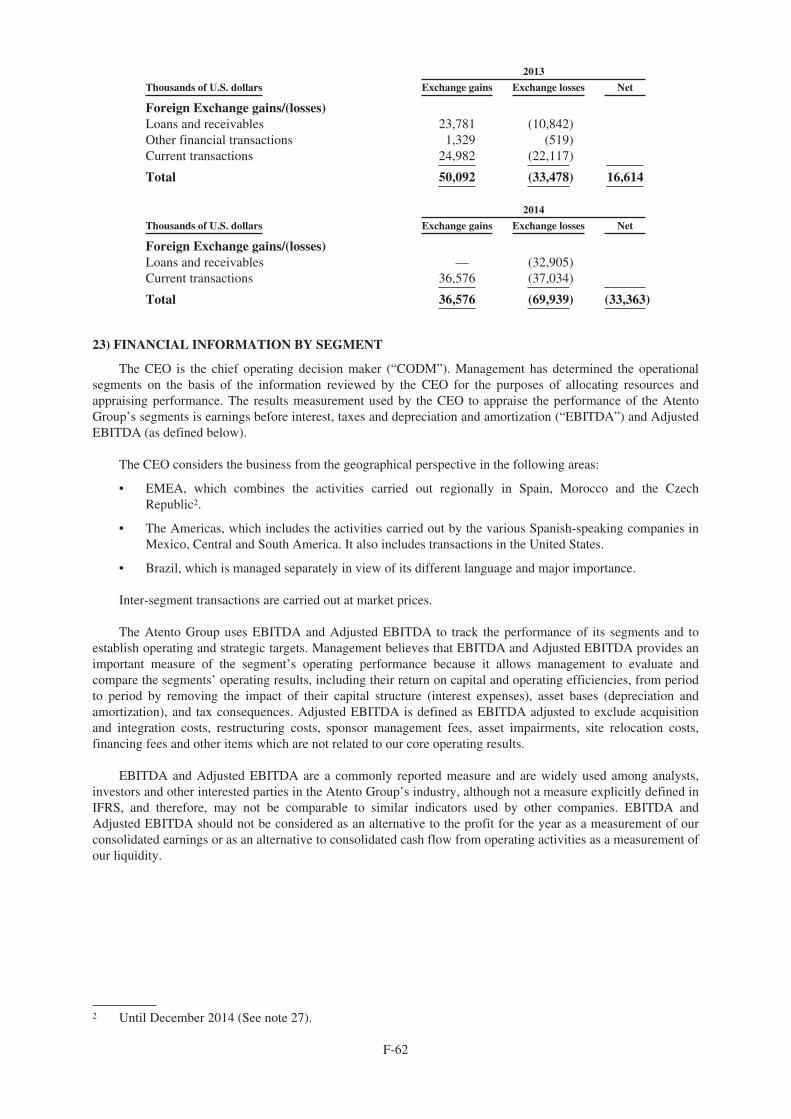
2013
Thousands of U.S. dollars Exchange gains Exchange losses Net
Foreign Exchange gains/(losses)Loans and receivables 23,781 (10,842)Other financial transactions 1,329 (519)Current transactions 24,982 (22,117)
Total 50,092 (33,478) 16,614
2014
Thousands of U.S. dollars Exchange gains Exchange losses Net
Foreign Exchange gains/(losses)Loans and receivables — (32,905)Current transactions 36,576 (37,034)
Total 36,576 (69,939) (33,363)
23) FINANCIAL INFORMATION BY SEGMENT
The CEO is the chief operating decision maker (“CODM”). Management has determined the operationalsegments on the basis of the information reviewed by the CEO for the purposes of allocating resources andappraising performance. The results measurement used by the CEO to appraise the performance of the AtentoGroup’s segments is earnings before interest, taxes and depreciation and amortization (“EBITDA”) and AdjustedEBITDA (as defined below).
The CEO considers the business from the geographical perspective in the following areas:
• EMEA, which combines the activities carried out regionally in Spain, Morocco and the CzechRepublic2.
• The Americas, which includes the activities carried out by the various Spanish-speaking companies inMexico, Central and South America. It also includes transactions in the United States.
• Brazil, which is managed separately in view of its different language and major importance.
Inter-segment transactions are carried out at market prices.
The Atento Group uses EBITDA and Adjusted EBITDA to track the performance of its segments and toestablish operating and strategic targets. Management believes that EBITDA and Adjusted EBITDA provides animportant measure of the segment’s operating performance because it allows management to evaluate andcompare the segments’ operating results, including their return on capital and operating efficiencies, from periodto period by removing the impact of their capital structure (interest expenses), asset bases (depreciation andamortization), and tax consequences. Adjusted EBITDA is defined as EBITDA adjusted to exclude acquisitionand integration costs, restructuring costs, sponsor management fees, asset impairments, site relocation costs,financing fees and other items which are not related to our core operating results.
EBITDA and Adjusted EBITDA are a commonly reported measure and are widely used among analysts,investors and other interested parties in the Atento Group’s industry, although not a measure explicitly defined inIFRS, and therefore, may not be comparable to similar indicators used by other companies. EBITDA andAdjusted EBITDA should not be considered as an alternative to the profit for the year as a measurement of ourconsolidated earnings or as an alternative to consolidated cash flow from operating activities as a measurement ofour liquidity.
2 Until December 2014 (See note 27).
F-62
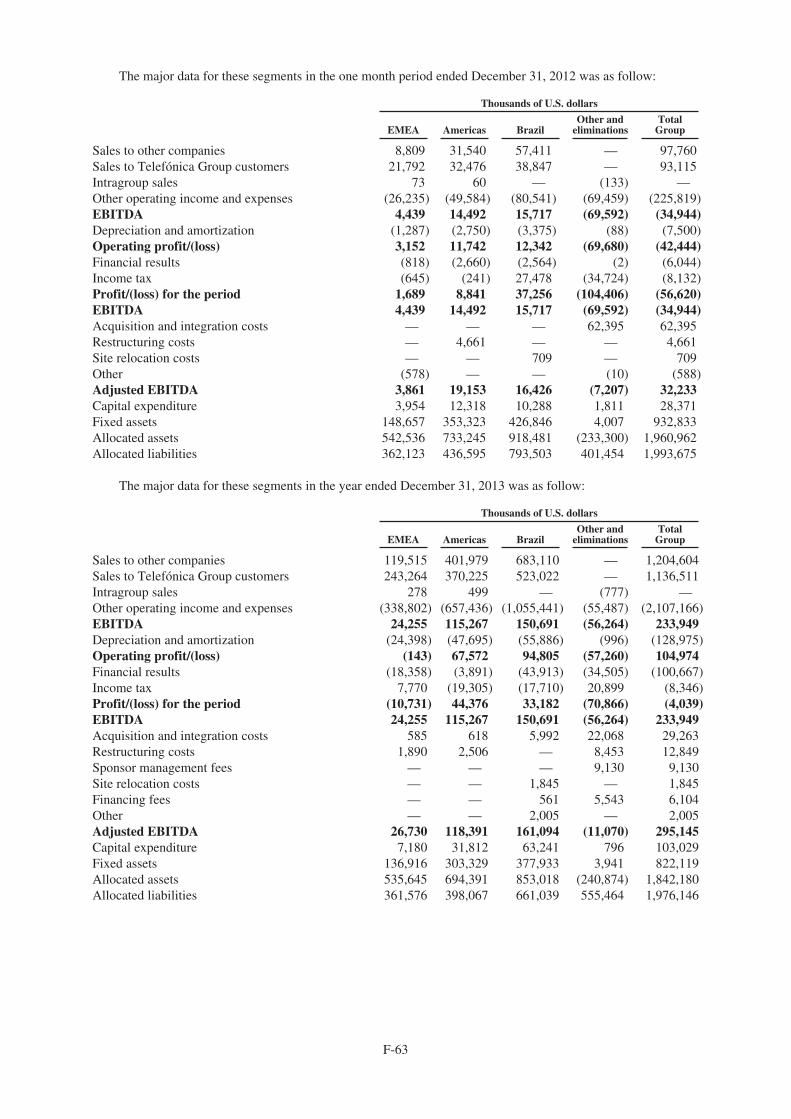
The major data for these segments in the one month period ended December 31, 2012 was as follow:
Thousands of U.S. dollars
EMEA Americas BrazilOther and
eliminationsTotal
Group
Sales to other companies 8,809 31,540 57,411 — 97,760Sales to Telefónica Group customers 21,792 32,476 38,847 — 93,115Intragroup sales 73 60 — (133) —Other operating income and expenses (26,235) (49,584) (80,541) (69,459) (225,819)EBITDA 4,439 14,492 15,717 (69,592) (34,944)Depreciation and amortization (1,287) (2,750) (3,375) (88) (7,500)Operating profit/(loss) 3,152 11,742 12,342 (69,680) (42,444)Financial results (818) (2,660) (2,564) (2) (6,044)Income tax (645) (241) 27,478 (34,724) (8,132)Profit/(loss) for the period 1,689 8,841 37,256 (104,406) (56,620)EBITDA 4,439 14,492 15,717 (69,592) (34,944)Acquisition and integration costs — — — 62,395 62,395Restructuring costs — 4,661 — — 4,661Site relocation costs — — 709 — 709Other (578) — — (10) (588)Adjusted EBITDA 3,861 19,153 16,426 (7,207) 32,233Capital expenditure 3,954 12,318 10,288 1,811 28,371Fixed assets 148,657 353,323 426,846 4,007 932,833Allocated assets 542,536 733,245 918,481 (233,300) 1,960,962Allocated liabilities 362,123 436,595 793,503 401,454 1,993,675
The major data for these segments in the year ended December 31, 2013 was as follow:
Thousands of U.S. dollars
EMEA Americas BrazilOther and
eliminationsTotal
Group
Sales to other companies 119,515 401,979 683,110 — 1,204,604Sales to Telefónica Group customers 243,264 370,225 523,022 — 1,136,511Intragroup sales 278 499 — (777) —Other operating income and expenses (338,802) (657,436) (1,055,441) (55,487) (2,107,166)EBITDA 24,255 115,267 150,691 (56,264) 233,949Depreciation and amortization (24,398) (47,695) (55,886) (996) (128,975)Operating profit/(loss) (143) 67,572 94,805 (57,260) 104,974Financial results (18,358) (3,891) (43,913) (34,505) (100,667)Income tax 7,770 (19,305) (17,710) 20,899 (8,346)Profit/(loss) for the period (10,731) 44,376 33,182 (70,866) (4,039)EBITDA 24,255 115,267 150,691 (56,264) 233,949Acquisition and integration costs 585 618 5,992 22,068 29,263Restructuring costs 1,890 2,506 — 8,453 12,849Sponsor management fees — — — 9,130 9,130Site relocation costs — — 1,845 — 1,845Financing fees — — 561 5,543 6,104Other — — 2,005 — 2,005Adjusted EBITDA 26,730 118,391 161,094 (11,070) 295,145Capital expenditure 7,180 31,812 63,241 796 103,029Fixed assets 136,916 303,329 377,933 3,941 822,119Allocated assets 535,645 694,391 853,018 (240,874) 1,842,180Allocated liabilities 361,576 398,067 661,039 555,464 1,976,146
F-63
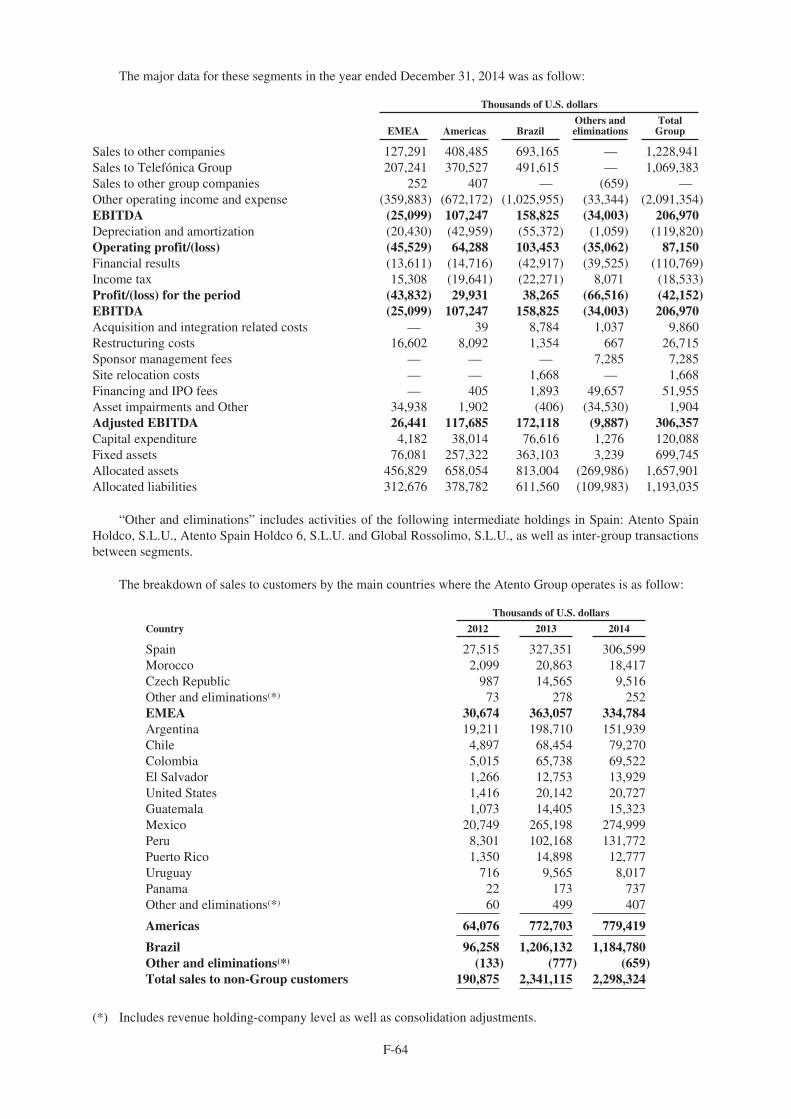
The major data for these segments in the year ended December 31, 2014 was as follow:
Thousands of U.S. dollars
EMEA Americas BrazilOthers andeliminations
TotalGroup
Sales to other companies 127,291 408,485 693,165 — 1,228,941Sales to Telefónica Group 207,241 370,527 491,615 — 1,069,383Sales to other group companies 252 407 — (659) —Other operating income and expense (359,883) (672,172) (1,025,955) (33,344) (2,091,354)EBITDA (25,099) 107,247 158,825 (34,003) 206,970Depreciation and amortization (20,430) (42,959) (55,372) (1,059) (119,820)Operating profit/(loss) (45,529) 64,288 103,453 (35,062) 87,150Financial results (13,611) (14,716) (42,917) (39,525) (110,769)Income tax 15,308 (19,641) (22,271) 8,071 (18,533)Profit/(loss) for the period (43,832) 29,931 38,265 (66,516) (42,152)EBITDA (25,099) 107,247 158,825 (34,003) 206,970Acquisition and integration related costs — 39 8,784 1,037 9,860Restructuring costs 16,602 8,092 1,354 667 26,715Sponsor management fees — — — 7,285 7,285Site relocation costs — — 1,668 — 1,668Financing and IPO fees — 405 1,893 49,657 51,955Asset impairments and Other 34,938 1,902 (406) (34,530) 1,904Adjusted EBITDA 26,441 117,685 172,118 (9,887) 306,357Capital expenditure 4,182 38,014 76,616 1,276 120,088Fixed assets 76,081 257,322 363,103 3,239 699,745Allocated assets 456,829 658,054 813,004 (269,986) 1,657,901Allocated liabilities 312,676 378,782 611,560 (109,983) 1,193,035
“Other and eliminations” includes activities of the following intermediate holdings in Spain: Atento SpainHoldco, S.L.U., Atento Spain Holdco 6, S.L.U. and Global Rossolimo, S.L.U., as well as inter-group transactionsbetween segments.
The breakdown of sales to customers by the main countries where the Atento Group operates is as follow:
Thousands of U.S. dollars
Country 2012 2013 2014
Spain 27,515 327,351 306,599Morocco 2,099 20,863 18,417Czech Republic 987 14,565 9,516Other and eliminations(*) 73 278 252EMEA 30,674 363,057 334,784Argentina 19,211 198,710 151,939Chile 4,897 68,454 79,270Colombia 5,015 65,738 69,522El Salvador 1,266 12,753 13,929United States 1,416 20,142 20,727Guatemala 1,073 14,405 15,323Mexico 20,749 265,198 274,999Peru 8,301 102,168 131,772Puerto Rico 1,350 14,898 12,777Uruguay 716 9,565 8,017Panama 22 173 737Other and eliminations(*) 60 499 407
Americas 64,076 772,703 779,419
Brazil 96,258 1,206,132 1,184,780Other and eliminations(*) (133) (777) (659)Total sales to non-Group customers 190,875 2,341,115 2,298,324
(*) Includes revenue holding-company level as well as consolidation adjustments.
F-64
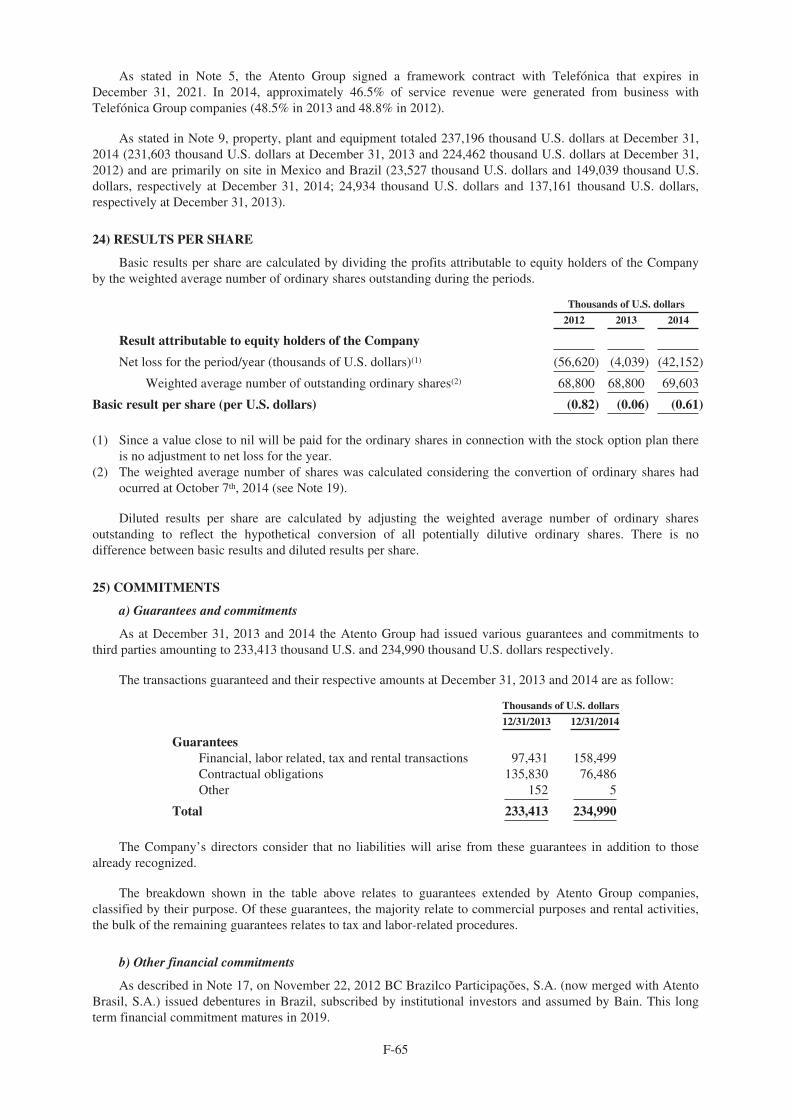
As stated in Note 5, the Atento Group signed a framework contract with Telefónica that expires inDecember 31, 2021. In 2014, approximately 46.5% of service revenue were generated from business withTelefónica Group companies (48.5% in 2013 and 48.8% in 2012).
As stated in Note 9, property, plant and equipment totaled 237,196 thousand U.S. dollars at December 31,2014 (231,603 thousand U.S. dollars at December 31, 2013 and 224,462 thousand U.S. dollars at December 31,2012) and are primarily on site in Mexico and Brazil (23,527 thousand U.S. dollars and 149,039 thousand U.S.dollars, respectively at December 31, 2014; 24,934 thousand U.S. dollars and 137,161 thousand U.S. dollars,respectively at December 31, 2013).
24) RESULTS PER SHARE
Basic results per share are calculated by dividing the profits attributable to equity holders of the Companyby the weighted average number of ordinary shares outstanding during the periods.
Thousands of U.S. dollars
2012 2013 2014
Result attributable to equity holders of the Company
Net loss for the period/year (thousands of U.S. dollars)(1) (56,620) (4,039) (42,152)
Weighted average number of outstanding ordinary shares(2) 68,800 68,800 69,603
Basic result per share (per U.S. dollars) (0.82) (0.06) (0.61)
(1) Since a value close to nil will be paid for the ordinary shares in connection with the stock option plan thereis no adjustment to net loss for the year.
(2) The weighted average number of shares was calculated considering the convertion of ordinary shares hadocurred at October 7th, 2014 (see Note 19).
Diluted results per share are calculated by adjusting the weighted average number of ordinary sharesoutstanding to reflect the hypothetical conversion of all potentially dilutive ordinary shares. There is nodifference between basic results and diluted results per share.
25) COMMITMENTS
a) Guarantees and commitments
As at December 31, 2013 and 2014 the Atento Group had issued various guarantees and commitments tothird parties amounting to 233,413 thousand U.S. and 234,990 thousand U.S. dollars respectively.
The transactions guaranteed and their respective amounts at December 31, 2013 and 2014 are as follow:
Thousands of U.S. dollars
12/31/2013 12/31/2014
GuaranteesFinancial, labor related, tax and rental transactions 97,431 158,499Contractual obligations 135,830 76,486Other 152 5
Total 233,413 234,990
The Company’s directors consider that no liabilities will arise from these guarantees in addition to thosealready recognized.
The breakdown shown in the table above relates to guarantees extended by Atento Group companies,classified by their purpose. Of these guarantees, the majority relate to commercial purposes and rental activities,the bulk of the remaining guarantees relates to tax and labor-related procedures.
b) Other financial commitments
As described in Note 17, on November 22, 2012 BC Brazilco Participações, S.A. (now merged with AtentoBrasil, S.A.) issued debentures in Brazil, subscribed by institutional investors and assumed by Bain. This longterm financial commitment matures in 2019.
F-65
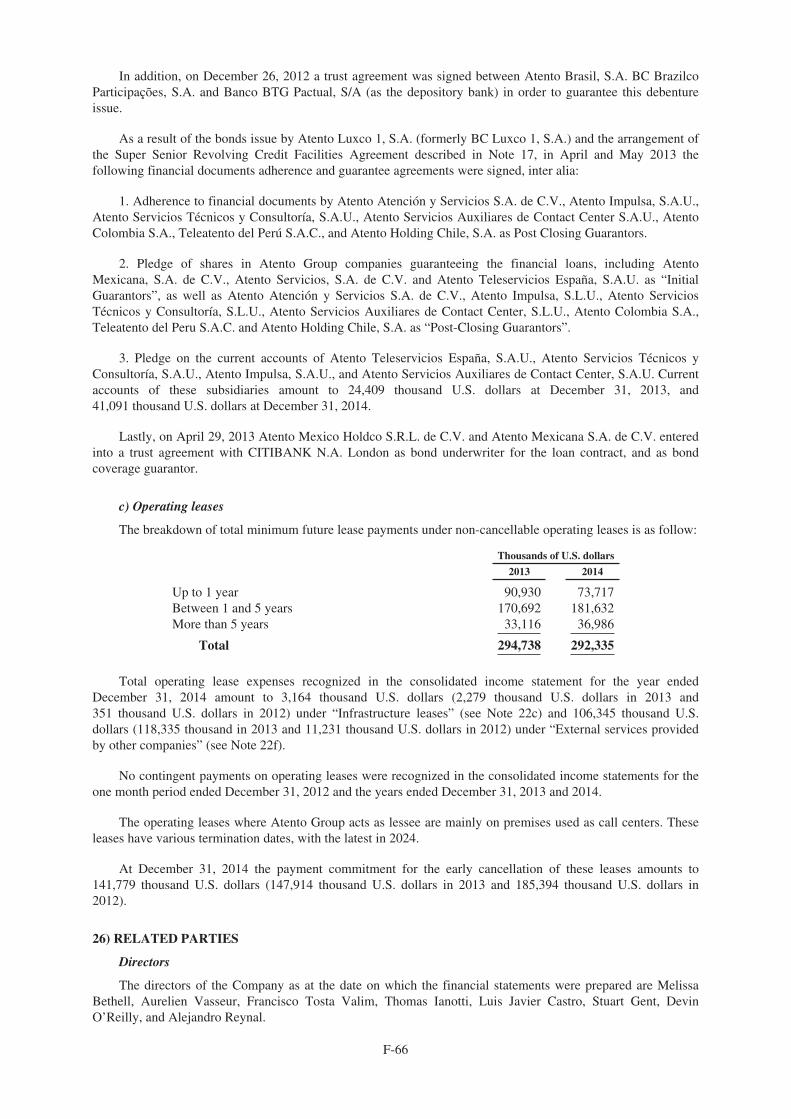
In addition, on December 26, 2012 a trust agreement was signed between Atento Brasil, S.A. BC BrazilcoParticipações, S.A. and Banco BTG Pactual, S/A (as the depository bank) in order to guarantee this debentureissue.
As a result of the bonds issue by Atento Luxco 1, S.A. (formerly BC Luxco 1, S.A.) and the arrangement ofthe Super Senior Revolving Credit Facilities Agreement described in Note 17, in April and May 2013 thefollowing financial documents adherence and guarantee agreements were signed, inter alia:
1. Adherence to financial documents by Atento Atención y Servicios S.A. de C.V., Atento Impulsa, S.A.U.,Atento Servicios Técnicos y Consultoría, S.A.U., Atento Servicios Auxiliares de Contact Center S.A.U., AtentoColombia S.A., Teleatento del Perú S.A.C., and Atento Holding Chile, S.A. as Post Closing Guarantors.
2. Pledge of shares in Atento Group companies guaranteeing the financial loans, including AtentoMexicana, S.A. de C.V., Atento Servicios, S.A. de C.V. and Atento Teleservicios España, S.A.U. as “InitialGuarantors”, as well as Atento Atención y Servicios S.A. de C.V., Atento Impulsa, S.L.U., Atento ServiciosTécnicos y Consultoría, S.L.U., Atento Servicios Auxiliares de Contact Center, S.L.U., Atento Colombia S.A.,Teleatento del Peru S.A.C. and Atento Holding Chile, S.A. as “Post-Closing Guarantors”.
3. Pledge on the current accounts of Atento Teleservicios España, S.A.U., Atento Servicios Técnicos yConsultoría, S.A.U., Atento Impulsa, S.A.U., and Atento Servicios Auxiliares de Contact Center, S.A.U. Currentaccounts of these subsidiaries amount to 24,409 thousand U.S. dollars at December 31, 2013, and41,091 thousand U.S. dollars at December 31, 2014.
Lastly, on April 29, 2013 Atento Mexico Holdco S.R.L. de C.V. and Atento Mexicana S.A. de C.V. enteredinto a trust agreement with CITIBANK N.A. London as bond underwriter for the loan contract, and as bondcoverage guarantor.
c) Operating leases
The breakdown of total minimum future lease payments under non-cancellable operating leases is as follow:
Thousands of U.S. dollars
2013 2014
Up to 1 year 90,930 73,717Between 1 and 5 years 170,692 181,632More than 5 years 33,116 36,986
Total 294,738 292,335
Total operating lease expenses recognized in the consolidated income statement for the year endedDecember 31, 2014 amount to 3,164 thousand U.S. dollars (2,279 thousand U.S. dollars in 2013 and351 thousand U.S. dollars in 2012) under “Infrastructure leases” (see Note 22c) and 106,345 thousand U.S.dollars (118,335 thousand in 2013 and 11,231 thousand U.S. dollars in 2012) under “External services providedby other companies” (see Note 22f).
No contingent payments on operating leases were recognized in the consolidated income statements for theone month period ended December 31, 2012 and the years ended December 31, 2013 and 2014.
The operating leases where Atento Group acts as lessee are mainly on premises used as call centers. Theseleases have various termination dates, with the latest in 2024.
At December 31, 2014 the payment commitment for the early cancellation of these leases amounts to141,779 thousand U.S. dollars (147,914 thousand U.S. dollars in 2013 and 185,394 thousand U.S. dollars in2012).
26) RELATED PARTIES
Directors
The directors of the Company as at the date on which the financial statements were prepared are MelissaBethell, Aurelien Vasseur, Francisco Tosta Valim, Thomas Ianotti, Luis Javier Castro, Stuart Gent, DevinO’Reilly, and Alejandro Reynal.
F-66
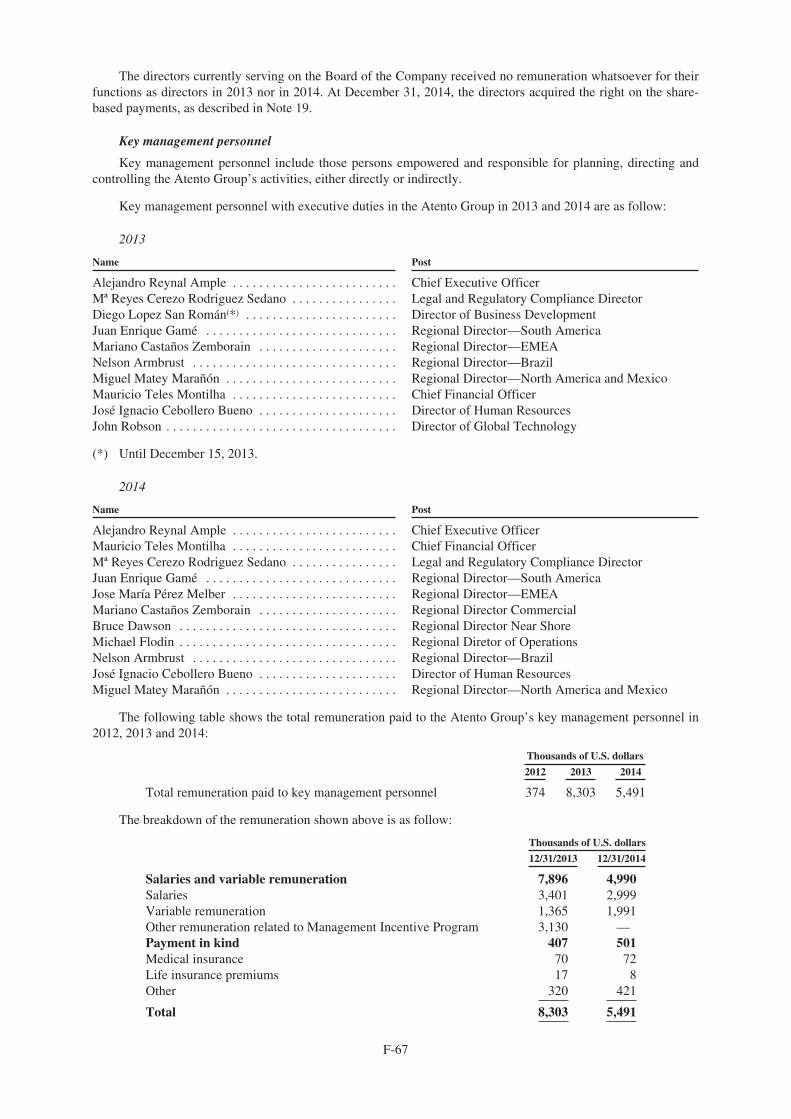
The directors currently serving on the Board of the Company received no remuneration whatsoever for theirfunctions as directors in 2013 nor in 2014. At December 31, 2014, the directors acquired the right on the share-based payments, as described in Note 19.
Key management personnel
Key management personnel include those persons empowered and responsible for planning, directing andcontrolling the Atento Group’s activities, either directly or indirectly.
Key management personnel with executive duties in the Atento Group in 2013 and 2014 are as follow:
2013
Name Post
Alejandro Reynal Ample . . . . . . . . . . . . . . . . . . . . . . . . . Chief Executive OfficerMª Reyes Cerezo Rodriguez Sedano . . . . . . . . . . . . . . . . Legal and Regulatory Compliance DirectorDiego Lopez San Román(*) . . . . . . . . . . . . . . . . . . . . . . . Director of Business DevelopmentJuan Enrique Gamé . . . . . . . . . . . . . . . . . . . . . . . . . . . . . Regional Director—South AmericaMariano Castaños Zemborain . . . . . . . . . . . . . . . . . . . . . Regional Director—EMEANelson Armbrust . . . . . . . . . . . . . . . . . . . . . . . . . . . . . . . Regional Director—BrazilMiguel Matey Marañón . . . . . . . . . . . . . . . . . . . . . . . . . . Regional Director—North America and MexicoMauricio Teles Montilha . . . . . . . . . . . . . . . . . . . . . . . . . Chief Financial OfficerJosé Ignacio Cebollero Bueno . . . . . . . . . . . . . . . . . . . . . Director of Human ResourcesJohn Robson . . . . . . . . . . . . . . . . . . . . . . . . . . . . . . . . . . . Director of Global Technology
(*) Until December 15, 2013.
2014
Name Post
Alejandro Reynal Ample . . . . . . . . . . . . . . . . . . . . . . . . . Chief Executive OfficerMauricio Teles Montilha . . . . . . . . . . . . . . . . . . . . . . . . . Chief Financial OfficerMª Reyes Cerezo Rodriguez Sedano . . . . . . . . . . . . . . . . Legal and Regulatory Compliance DirectorJuan Enrique Gamé . . . . . . . . . . . . . . . . . . . . . . . . . . . . . Regional Director—South AmericaJose María Pérez Melber . . . . . . . . . . . . . . . . . . . . . . . . . Regional Director—EMEAMariano Castaños Zemborain . . . . . . . . . . . . . . . . . . . . . Regional Director CommercialBruce Dawson . . . . . . . . . . . . . . . . . . . . . . . . . . . . . . . . . Regional Director Near ShoreMichael Flodin . . . . . . . . . . . . . . . . . . . . . . . . . . . . . . . . . Regional Diretor of OperationsNelson Armbrust . . . . . . . . . . . . . . . . . . . . . . . . . . . . . . . Regional Director—BrazilJosé Ignacio Cebollero Bueno . . . . . . . . . . . . . . . . . . . . . Director of Human ResourcesMiguel Matey Marañón . . . . . . . . . . . . . . . . . . . . . . . . . . Regional Director—North America and Mexico
The following table shows the total remuneration paid to the Atento Group’s key management personnel in2012, 2013 and 2014:
Thousands of U.S. dollars
2012 2013 2014
Total remuneration paid to key management personnel 374 8,303 5,491
The breakdown of the remuneration shown above is as follow:
Thousands of U.S. dollars
12/31/2013 12/31/2014
Salaries and variable remuneration 7,896 4,990Salaries 3,401 2,999Variable remuneration 1,365 1,991Other remuneration related to Management Incentive Program 3,130 —Payment in kind 407 501Medical insurance 70 72Life insurance premiums 17 8Other 320 421
Total 8,303 5,491
F-67
In July 2013, the Shareholders of Atento Group implemented a Management Incentive Plan ( “MIP”)pursuant to which certain of the Group’s senior management are granted the opportunity to invest in the Group.The eligibility of managers to participate is determined by the remuneration committee of the company.
Managers who participate in the MIP are required to subscribe to various classes of shares in a Luxembourgspecial purpose vehicle that is indirectly invested in Atalaya Luxco Topco S.C.A (“Topco”), the ultimate parentcompany of the Group. The shares held by each MIP participant fall into two categories: co-investment sharesand performance shares.
The co-investment shares effectively allow managers to participate in dividends and other distributions on apro rata and pari passu basis with Topco’s other shareholders. The performance shares only participate individends and other distributions if Topco’s majority shareholder achieves certain specified returns on itsinvestment in Topco, with the performance shares being entitled to receive a progressively larger share of alldividends and other distributions (up to a pre-determined maximum percentage) as the total proceeds received byTopco’s majority shareholder reach certain pre-agreed hurdles.
MIP participants are only entitled to hold shares for so long as they are employed by a member of theGroup. In the event that a MIP participant’s employment is terminated, his/her shares can be bought back at apre-specified price that is linked to the circumstances surrounding the termination of the relevant manager’semployment and the length of time that such manager has held his/her shares.
In connection with the MIP, the participants were granted an amount in cash exclusively for the purpose ofacquiring the shares described above which has been accounted for as a compensation expense in 2014. TheBoard of Directors does not expect any significant future impact in the financial statements as a consequence ofthis Program.
On July 18, 2013, Atento Spain Holdco 2, S.A.U., an indirect subsidiary, entered into a revolving facilityagreement with Atalaya Management Luxco Investment pursuant to which Atento Spain Holdco 2, S.A.U.provided a Euro revolving loan facility in an aggregate amount equal to €3.0 million (4.1 million U.S. dollars) toAtalaya Management Luxco Investment for the purpose of acquiring an immaterial ownership interest in arelated party. As at December 31, 2013, the management loan had an outstanding balance of 2,423 thousandU.S. dollars which is included in other non-current receivables (See Note 12) on the statement of financialposition. The loan accrues interest at a rate of 6% per annum, matures on July 18, 2023 and was capitalized infull in April 2014.
On April 25, 2014, Atento Spain Holdco 2, S.A.U. contributed its receivable for the outstanding amountunder the Facility (2,494 thousand euros equivalent to 3,449 U.S. dollars) to Atalaya Management LuxcoInvestment in exchange for the issuance by Atalaya Management Luxco Investment of a Class 4 PreferenceShare, fully subscribed by Atento Spain Holdco 2, S.A.U. On May 30, 2014, the Class 4 Preference Share wasredeemed for a total consideration of 2,508 thousand euros (equivalent to 3,413 thousand U.S. dollars). Theredemption price was fully paid in cash.
Balances and transactions with the Sole Shareholder and other related parties
The table below sets out balances and transactions with ATALAYA Luxco TOPCO, S.C.A, in 2013 and2014 (in thousand U.S. dollars):
12/31/2013 12/31/2014
Non-current payables to Group companies 519,607 —Atalaya Luxco Topco, S.C.A. 519,607 —
Atalaya Luxco Topco, S.C.A payables are composed of the following: (i) four series of Preferred EquityCertificates (PECs, ALPECs and PPPECs) issued by the Atalaya Luxco Topco Company and subscribed by theCompany, totaling 550.2 million U.S. dollars at October 3, 2014 (517.4 million U.S. dollars in 2013); (ii) interestaccruing pending payment amounting to 26.0 million U.S. dollars at October 3, 2014 (2.2 million U.S. dollars in2013).
The outlay for interest on these debts in 2014 was 25.4 million U.S. dollars (25.7 million U.S. dollars in2013).
F-68
Preferred Equity Certificates
On December 3, 2012 the Company authorized the issuance of the following Preferred Equity Certificates(“PECs”):
• Series 1: 50,000,000,000 PECs with a par value of 0.01 Euros each. These PECs mature after 30 years,but may be withdrawn prior to this date in certain scenarios, and accrue interest of 8.0309%. As atDecember 31, 2012 and 2013 the Company had issued 23,580,000,000 Series 1 PECs for an aggregateamount of 311,114 and 325,192 thousand U.S. dollars, respectively. The interest capitalized in 2013totaled 26,100 thousand U.S. dollars (equivalent to 26,479 thousand U.S. dollars at December 31,2013). The interest accruing at December 31, 2013 totaled 2,197 thousand U.S. dollars.
• Series 2: 200,000 PECs with a par value of 0.01 Euros each. These PECs mature after 30 years, butmay be withdrawn prior to this in certain scenarios.
The yield is equal to the profit recognized for Luxembourg generally accepted accounting practices inconnection with the “Specified Assets” (meaning the investment of the Company in the Luxco 1 Series2 PECs, as defined in the terms and conditions of the Series 2 PECs) and not previously taken intoaccount, less any loss recognized under the Luxembourg generally accepted accounting practices inconnection with the Specified Assets for a previous “Accrual Period” (as defined in the terms andconditions of the Series 2 PECs), less a proportional amount of any direct expense (including overheadexpenses) borne by the Company during the Accrual Period in relation to the Specified Assets and lessthe losses of the Company in relation to the Specified Assets during the Accrual Period, including anysuch losses carried forward from previous Accrual Periods, this amount is then divided by the numberof Series 2 PECs in issue at any time in that period.
At December 31, 2012 and 2013 the Company had issued 200,000 Series 2 PECs for an aggregateamount of 3 thousand U.S. dollar.
• Series 3: 25,000,000,000 PECs with a par value of 0.01 Euros each. These PECs mature after 60 years,but may be withdrawn prior to this in certain scenarios. The yield equals to the “Specified Income”(meaning the sum of all income and capital gains derived by the Company from the Eligible Assets lesslosses of the Company carried forward less all other expenses of the Company connected to theinvestment in the Eligible Assets, as defined in the terms and conditions of the Series 3 PECs) for eachaccounting period comprised in this “Accrual Period” (as defined in the terms and conditions of theSeries 3 PECs) divided by 365 (or if a leap year, 366) and, respectively in the case of each such numberso ascertained, multiplied by the number of days of each such accounting period that comprised thatAccrual Period, then divided by the number of Series 3 PECs in issue. At December 31, 2013 theCompany had issued 12,017,800,000 Series 3 PECs for an aggregate amount of 165,737 thousand U.S.dollars.
• Series 4: 50,000,000,000 PECs with a par value of 0.01 euro each. These PECs mature after 30 years,but may be withdrawn prior to this date in certain scenarios, and accrued interest of 5%. At June 30,2014 the Company had issued 6,414,652,564 Series 4 PECs for an aggregate amount of64,147 thousand euros, equivalent to 87,285 thousand U.S. dollars.
The PECs were classified as subordinated debt with respect to the Company’s other present and futureobligations.
The table below provides a summary of PECs and respective movements in 2014:
Thousands of U.S. dollars
PEC Maturity 12/31/2013 IssuanceInterest
capitalizedTranslationdifferences Capitalizations 12/31/2014
Series 1 PECs 2042 353,867 — 20,749 (33,885) (340,731) —Series 2 PECs 2042 3 — 3,197 (181) (3,019) —Series 3 PECs 2072 165,737 — — (15,322) (150,415) —Series 4 PECs 2044 — 87,285 1,489 (7,083) (81,691) —
Total 519,607 87,285 25,435 (56,471) (575,856) —
Given the specific features and conditions of these instruments and their recent date of issuance, the PECs’sbook values approximate their fair value, and they are at Level 3 of the fair value hierarchy.
F-69
Transactions with Bain Capital
On December 12, 2012, Atento Spain Holdco, S.L.U., an indirect subsidiary of the Company, entered into aconsulting services agreement with Bain Capital Partners, LLC, an investment adviser to certain of the BainCapital funds, pursuant to which it agreed to provide general executive, business development and other financialadvisory services to us. Pursuant to the consulting services agreement, Bain Capital Partners, LLC received anannual fee equal to the greater of €5.0 million and 3.00% of the Company’s annual EBITDA, plus reimbursementfor reasonable out-of-pocket expenses.
Additionally, pursuant to a transaction services agreement between Atento Spain Holdco S.L.U. and BainCapital Partners, LLC, dated as of December 12, 2012, it provides certain transaction-specific advisory services.Pursuant to this agreement, Atento Spain Holdco, S.L.U. paid Bain Capital Partners, LLC a transaction fee of$20.3 million in December 2012 principally related to the Acquisition, and it has agreed to pay transaction feesfor advice and support relating to future transactions by us (including, without limitation, any share, asset or debtpurchase, capital expenditures and refinancing of existing indebtedness) equal to 1.00% of the aggregatetransaction value of each such future transaction plus any reasonable out-of-pocket expenses (including fees ofany accountants, attorneys or other advisors retained by Bain Capital Partners, LLC and its affiliates) incurred inconnection with the investigation, negotiation and consummation of such future transaction.
The transaction services agreement and consulting services agreements each have a one-year initial term andare thereafter subject to automatic one-year extensions unless Bain Capital Partners, LLC provides written noticeof termination at least 90 days prior to the expiration of the initial term or any extension thereof. Bain CapitalPartners, LLC may also terminate the agreements at any time by delivering to us written notice of termination.The agreements include customary indemnities in favor of Bain Capital Partners, LLC. The transaction servicesagreement and the consulting services agreement were amended on May 17, 2013.
On October 7, 2014, the parties thereof entered into a deed of termination in relation to the consultingservices agreement and the transaction services agreement. In connection with such termination, Atento paid toBain Capital Partners, LLC a termination fee of $23.0 million and a transaction fee of $1.5 million.
Our payment of fees to Bain Capital Partners, LLC in 2014 in connection with these agreements amountedto $31.5 million.
27) OTHER INFORMATION
a) Auditors’ fees
The fees to the various member firms of the Ernst & Young international organization, of which Ernst &Young, S.L., auditors of the Atento Group in 2012, 2013 and 2014, amounted to a 1,320 thousand U.S. dollars,1,836 thousand U.S. dollars and 3,534 thousand U.S. dollars, respectively.
Details of these amounts are as follows:
Thousands of U.S. dollars
2012 2013 2014
Audit fees(*)
Audit services 1,320 1,836 3,534
Total 1,320 1,836 3,534
(*) Audit services: services included in this heading are mainly the audit of the annual and interim financialstatements and the review of the 20-F report to be filed with the Security and Exchange Commission (SEC)and the audit services related to the IPO. These fees include amounts in respect of fully consolidated AtentoGroup companies.
b) Restricted net assets
Certain of our consolidated subsidiaries are restricted from remitting certain funds to us including payingcertain dividends, purchasing or redeeming capital stock, making certain payments on subordinated debt fromour current indenture agreements and as a result of a variety of regulations, contractual or statutory requirements.
F-70
Our ability to distribute funds is limited by the indenture governing, our Senior Secure Notes, the BrazilianDebentures, the VLN and our CVIs and may be further restricted by the terms of any of our future debt orpreferred equity. Restricted payments are generally limited by compliance with leverage ratios, fixed chargecoverage ratios and permitted payment baskets. The Company may in the future require additional cash resourcesfrom the subsidiaries due to changes in business conditions or merely to declare and pay dividends to makedistributions to shareholders.
As described in Note 1, Atento S.A. was incorporated as legal entity and as Group (Atento S.A. andsubsidiaries) in 2014 due to the Reorganization Transaction and the IPO described in Note 1. Pursuant to theReorganization Transaction, Midco became a wholly-owned subsidiary of Atento S.A., a newly-formed companyincorporated under the laws of Luxembourg with nominal assets and liabilities for the purpose of facilitating theIPO, and which did not conduct any operations prior to the completion of the IPO. Following the ReorganizationTransaction and the IPO, the financial statements present the consolidated results of MidCo’s operations as ifAtento S.A. always would have been operating. The consolidated financial statements of Midco weresubstantially the same as the consolidated financial statements of the Atento S.A. prior to the IPO, adjusted toreflect the Reorganization Transaction. Incorporation of Atento S.A. (Floatco) has been considered a commoncontrol transaction, applying the pooling of interest method.
F-71
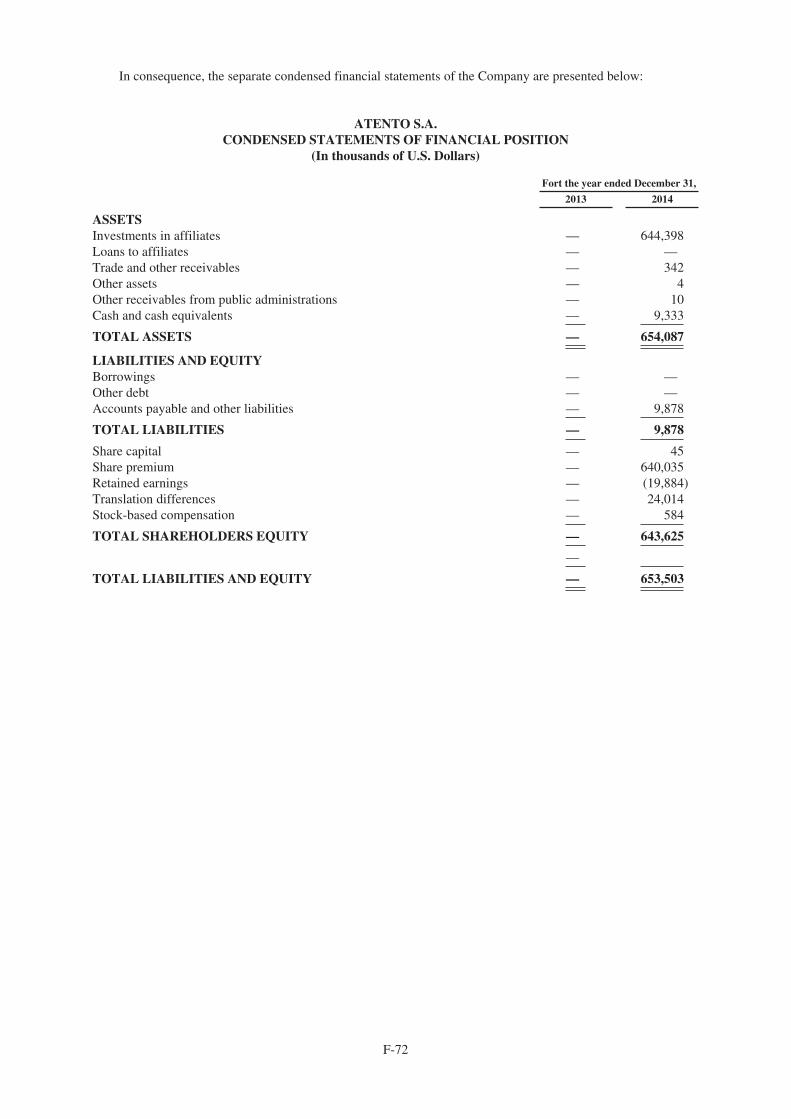
In consequence, the separate condensed financial statements of the Company are presented below:
ATENTO S.A.CONDENSED STATEMENTS OF FINANCIAL POSITION
(In thousands of U.S. Dollars)
Fort the year ended December 31,
2013 2014
ASSETSInvestments in affiliates — 644,398Loans to affiliates — —Trade and other receivables — 342Other assets — 4Other receivables from public administrations — 10Cash and cash equivalents — 9,333
TOTAL ASSETS — 654,087
LIABILITIES AND EQUITYBorrowings — —Other debt — —Accounts payable and other liabilities — 9,878
TOTAL LIABILITIES — 9,878
Share capital — 45Share premium — 640,035Retained earnings — (19,884)Translation differences — 24,014Stock-based compensation — 584
TOTAL SHAREHOLDERS EQUITY — 643,625
—
TOTAL LIABILITIES AND EQUITY — 653,503
F-72

ATENTO S.A.CONDENSED INCOME STATEMENTS
(In thousands of U.S. Dollars)
Fort the year ended December 31,
2013 2014
Revenue — —Other operating expenses — (19,971)Finance income — 4Finance expense — —Net finance expense — 92(LOSS) BEFORE TAX — (19,879)Income tax expense — (4)
LOSS FOR THE PERIOD — (19,883)
F-73

ATENTO S.A.CONDENSED STATEMENTS OF COMPREHENSIVE INCOME
(Thousands of US Dollars)
For the year ended December 31,
2013 2014
Loss for the period/year — (19,883)Other comprehensive income/(loss)Translation differences — 24,014Other comprehensive income/(loss), net of taxes — 24,014
Total consolidated comprehensive loss — 4,131
F-74
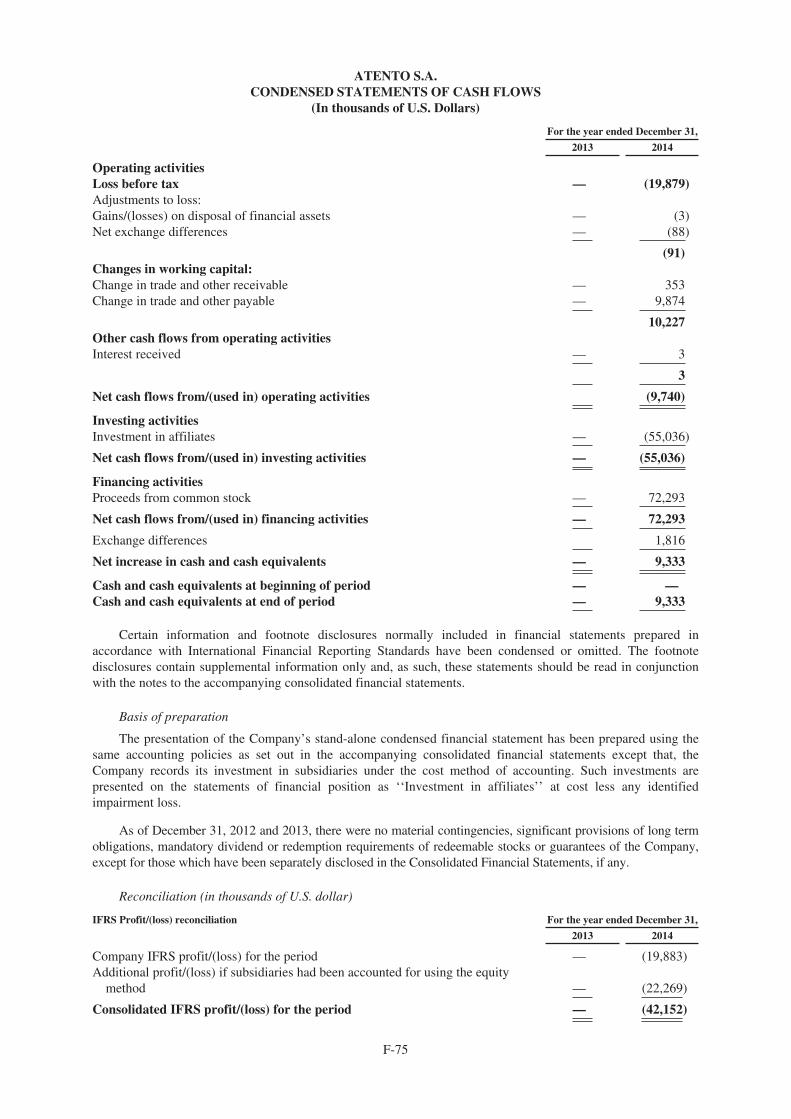
ATENTO S.A.CONDENSED STATEMENTS OF CASH FLOWS
(In thousands of U.S. Dollars)
For the year ended December 31,
2013 2014
Operating activitiesLoss before tax — (19,879)Adjustments to loss:Gains/(losses) on disposal of financial assets — (3)Net exchange differences — (88)
(91)Changes in working capital:Change in trade and other receivable — 353Change in trade and other payable — 9,874
10,227Other cash flows from operating activitiesInterest received — 3
3
Net cash flows from/(used in) operating activities (9,740)
Investing activitiesInvestment in affiliates — (55,036)
Net cash flows from/(used in) investing activities — (55,036)
Financing activitiesProceeds from common stock — 72,293
Net cash flows from/(used in) financing activities — 72,293
Exchange differences 1,816
Net increase in cash and cash equivalents — 9,333
Cash and cash equivalents at beginning of period — —Cash and cash equivalents at end of period — 9,333
Certain information and footnote disclosures normally included in financial statements prepared inaccordance with International Financial Reporting Standards have been condensed or omitted. The footnotedisclosures contain supplemental information only and, as such, these statements should be read in conjunctionwith the notes to the accompanying consolidated financial statements.
Basis of preparation
The presentation of the Company’s stand-alone condensed financial statement has been prepared using thesame accounting policies as set out in the accompanying consolidated financial statements except that, theCompany records its investment in subsidiaries under the cost method of accounting. Such investments arepresented on the statements of financial position as ‘‘Investment in affiliates’’ at cost less any identifiedimpairment loss.
As of December 31, 2012 and 2013, there were no material contingencies, significant provisions of long termobligations, mandatory dividend or redemption requirements of redeemable stocks or guarantees of the Company,except for those which have been separately disclosed in the Consolidated Financial Statements, if any.
Reconciliation (in thousands of U.S. dollar)
IFRS Profit/(loss) reconciliation For the year ended December 31,
2013 2014
Company IFRS profit/(loss) for the period — (19,883)Additional profit/(loss) if subsidiaries had been accounted for using the equity
method — (22,269)
Consolidated IFRS profit/(loss) for the period — (42,152)
F-75

IFRS Equity reconciliation For the year ended December 31,
2013 2014
Parent shareholders’ equity — 643,625Additional equity if subsidiaries had been accounted for using the equity method — (178,759)
Consolidated IFRS shareholders’ equity — 464,866
F-76
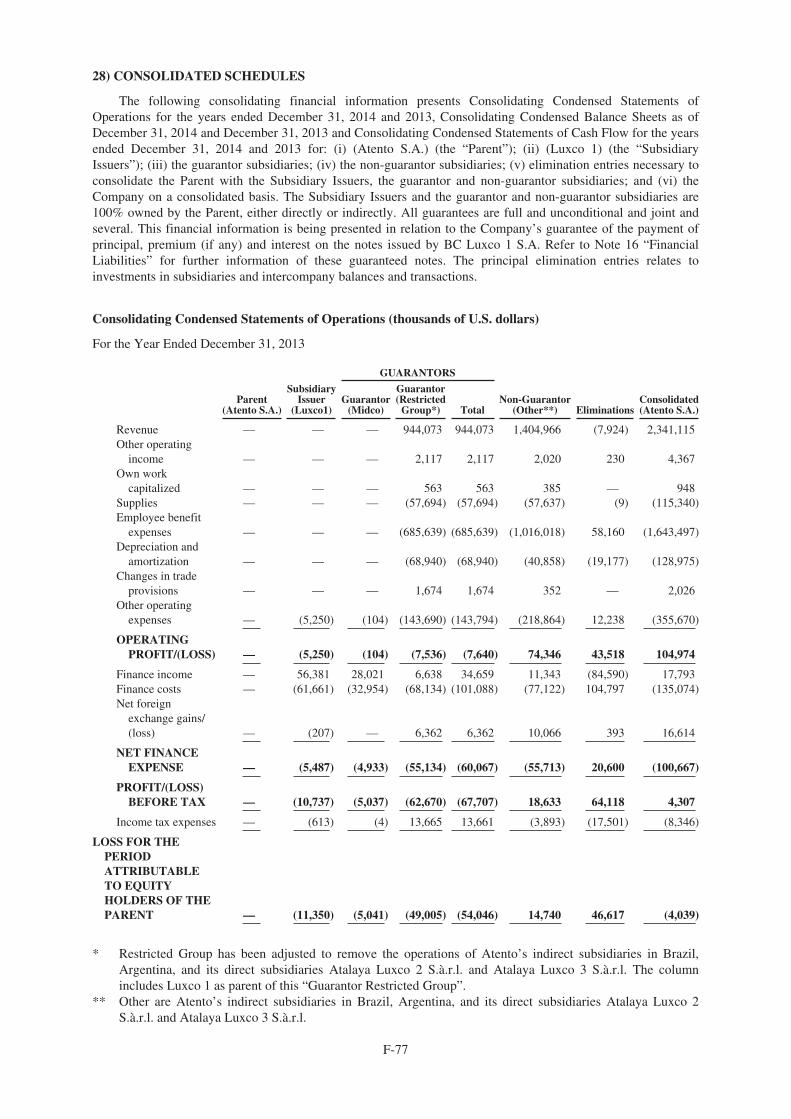
28) CONSOLIDATED SCHEDULES
The following consolidating financial information presents Consolidating Condensed Statements ofOperations for the years ended December 31, 2014 and 2013, Consolidating Condensed Balance Sheets as ofDecember 31, 2014 and December 31, 2013 and Consolidating Condensed Statements of Cash Flow for the yearsended December 31, 2014 and 2013 for: (i) (Atento S.A.) (the “Parent”); (ii) (Luxco 1) (the “SubsidiaryIssuers”); (iii) the guarantor subsidiaries; (iv) the non-guarantor subsidiaries; (v) elimination entries necessary toconsolidate the Parent with the Subsidiary Issuers, the guarantor and non-guarantor subsidiaries; and (vi) theCompany on a consolidated basis. The Subsidiary Issuers and the guarantor and non-guarantor subsidiaries are100% owned by the Parent, either directly or indirectly. All guarantees are full and unconditional and joint andseveral. This financial information is being presented in relation to the Company’s guarantee of the payment ofprincipal, premium (if any) and interest on the notes issued by BC Luxco 1 S.A. Refer to Note 16 “FinancialLiabilities” for further information of these guaranteed notes. The principal elimination entries relates toinvestments in subsidiaries and intercompany balances and transactions.
Consolidating Condensed Statements of Operations (thousands of U.S. dollars)
For the Year Ended December 31, 2013
GUARANTORS
Parent(Atento S.A.)
SubsidiaryIssuer
(Luxco1)Guarantor
(Midco)
Guarantor(Restricted
Group*) TotalNon-Guarantor
(Other**) EliminationsConsolidated(Atento S.A.)
Revenue — — — 944,073 944,073 1,404,966 (7,924) 2,341,115Other operating
income — — — 2,117 2,117 2,020 230 4,367Own work
capitalized — — — 563 563 385 — 948Supplies — — — (57,694) (57,694) (57,637) (9) (115,340)Employee benefit
expenses — — — (685,639) (685,639) (1,016,018) 58,160 (1,643,497)Depreciation and
amortization — — — (68,940) (68,940) (40,858) (19,177) (128,975)Changes in trade
provisions — — — 1,674 1,674 352 — 2,026Other operating
expenses — (5,250) (104) (143,690) (143,794) (218,864) 12,238 (355,670)
OPERATINGPROFIT/(LOSS) — (5,250) (104) (7,536) (7,640) 74,346 43,518 104,974
Finance income — 56,381 28,021 6,638 34,659 11,343 (84,590) 17,793Finance costs — (61,661) (32,954) (68,134) (101,088) (77,122) 104,797 (135,074)Net foreign
exchange gains/(loss) — (207) — 6,362 6,362 10,066 393 16,614
NET FINANCEEXPENSE — (5,487) (4,933) (55,134) (60,067) (55,713) 20,600 (100,667)
PROFIT/(LOSS)BEFORE TAX — (10,737) (5,037) (62,670) (67,707) 18,633 64,118 4,307
Income tax expenses — (613) (4) 13,665 13,661 (3,893) (17,501) (8,346)
LOSS FOR THEPERIODATTRIBUTABLETO EQUITYHOLDERS OF THEPARENT — (11,350) (5,041) (49,005) (54,046) 14,740 46,617 (4,039)
* Restricted Group has been adjusted to remove the operations of Atento’s indirect subsidiaries in Brazil,Argentina, and its direct subsidiaries Atalaya Luxco 2 S.à.r.l. and Atalaya Luxco 3 S.à.r.l. The columnincludes Luxco 1 as parent of this “Guarantor Restricted Group”.
** Other are Atento’s indirect subsidiaries in Brazil, Argentina, and its direct subsidiaries Atalaya Luxco 2S.à.r.l. and Atalaya Luxco 3 S.à.r.l.
F-77
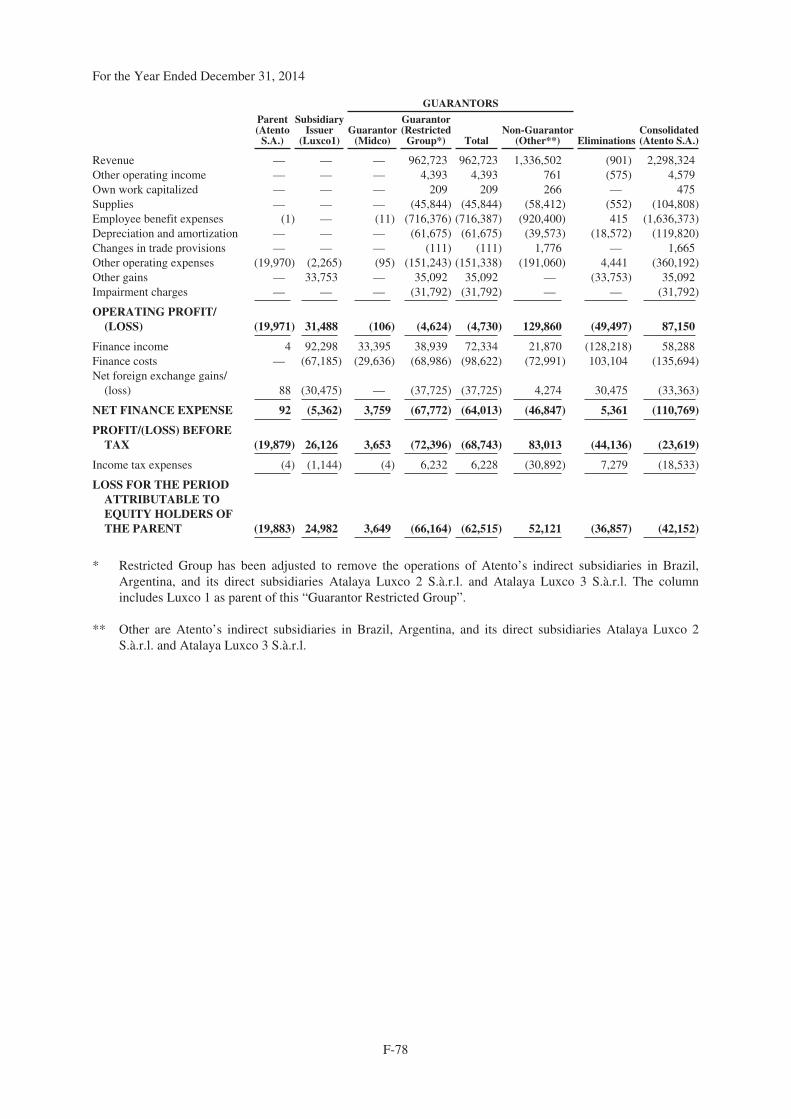
For the Year Ended December 31, 2014
GUARANTORS
Parent(Atento
S.A.)
SubsidiaryIssuer
(Luxco1)Guarantor
(Midco)
Guarantor(Restricted
Group*) TotalNon-Guarantor
(Other**) EliminationsConsolidated(Atento S.A.)
Revenue — — — 962,723 962,723 1,336,502 (901) 2,298,324Other operating income — — — 4,393 4,393 761 (575) 4,579Own work capitalized — — — 209 209 266 — 475Supplies — — — (45,844) (45,844) (58,412) (552) (104,808)Employee benefit expenses (1) — (11) (716,376) (716,387) (920,400) 415 (1,636,373)Depreciation and amortization — — — (61,675) (61,675) (39,573) (18,572) (119,820)Changes in trade provisions — — — (111) (111) 1,776 — 1,665Other operating expenses (19,970) (2,265) (95) (151,243) (151,338) (191,060) 4,441 (360,192)Other gains — 33,753 — 35,092 35,092 — (33,753) 35,092Impairment charges — — — (31,792) (31,792) — — (31,792)
OPERATING PROFIT/(LOSS) (19,971) 31,488 (106) (4,624) (4,730) 129,860 (49,497) 87,150
Finance income 4 92,298 33,395 38,939 72,334 21,870 (128,218) 58,288Finance costs — (67,185) (29,636) (68,986) (98,622) (72,991) 103,104 (135,694)Net foreign exchange gains/
(loss) 88 (30,475) — (37,725) (37,725) 4,274 30,475 (33,363)
NET FINANCE EXPENSE 92 (5,362) 3,759 (67,772) (64,013) (46,847) 5,361 (110,769)
PROFIT/(LOSS) BEFORETAX (19,879) 26,126 3,653 (72,396) (68,743) 83,013 (44,136) (23,619)
Income tax expenses (4) (1,144) (4) 6,232 6,228 (30,892) 7,279 (18,533)
LOSS FOR THE PERIODATTRIBUTABLE TOEQUITY HOLDERS OFTHE PARENT (19,883) 24,982 3,649 (66,164) (62,515) 52,121 (36,857) (42,152)
* Restricted Group has been adjusted to remove the operations of Atento’s indirect subsidiaries in Brazil,Argentina, and its direct subsidiaries Atalaya Luxco 2 S.à.r.l. and Atalaya Luxco 3 S.à.r.l. The columnincludes Luxco 1 as parent of this “Guarantor Restricted Group”.
** Other are Atento’s indirect subsidiaries in Brazil, Argentina, and its direct subsidiaries Atalaya Luxco 2S.à.r.l. and Atalaya Luxco 3 S.à.r.l.
F-78
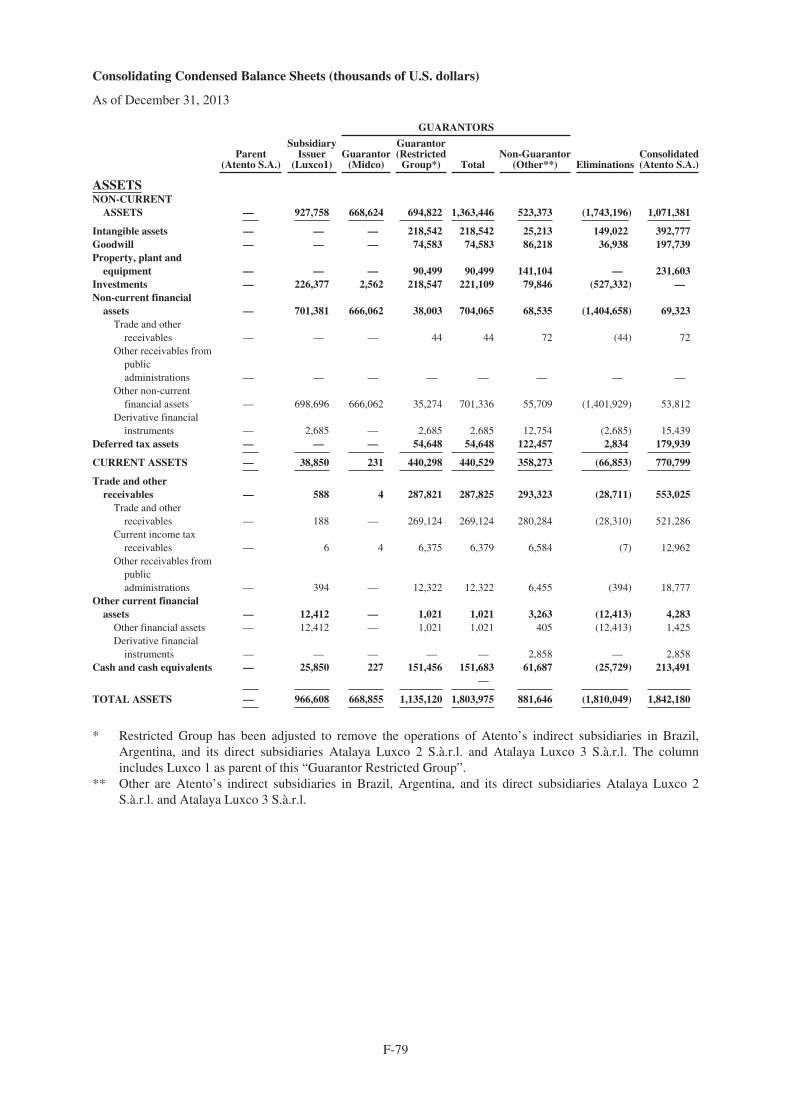
Consolidating Condensed Balance Sheets (thousands of U.S. dollars)
As of December 31, 2013
GUARANTORS
Parent(Atento S.A.)
SubsidiaryIssuer
(Luxco1)Guarantor
(Midco)
Guarantor(Restricted
Group*) TotalNon-Guarantor
(Other**) EliminationsConsolidated(Atento S.A.)
ASSETSNON-CURRENT
ASSETS — 927,758 668,624 694,822 1,363,446 523,373 (1,743,196) 1,071,381
Intangible assets — — — 218,542 218,542 25,213 149,022 392,777Goodwill — — — 74,583 74,583 86,218 36,938 197,739Property, plant and
equipment — — — 90,499 90,499 141,104 — 231,603Investments — 226,377 2,562 218,547 221,109 79,846 (527,332) —Non-current financial
assets — 701,381 666,062 38,003 704,065 68,535 (1,404,658) 69,323Trade and other
receivables — — — 44 44 72 (44) 72Other receivables from
publicadministrations — — — — — — — —
Other non-currentfinancial assets — 698,696 666,062 35,274 701,336 55,709 (1,401,929) 53,812
Derivative financialinstruments — 2,685 — 2,685 2,685 12,754 (2,685) 15,439
Deferred tax assets — — — 54,648 54,648 122,457 2,834 179,939
CURRENT ASSETS — 38,850 231 440,298 440,529 358,273 (66,853) 770,799
Trade and otherreceivables — 588 4 287,821 287,825 293,323 (28,711) 553,025
Trade and otherreceivables — 188 — 269,124 269,124 280,284 (28,310) 521,286
Current income taxreceivables — 6 4 6,375 6,379 6,584 (7) 12,962
Other receivables frompublicadministrations — 394 — 12,322 12,322 6,455 (394) 18,777
Other current financialassets — 12,412 — 1,021 1,021 3,263 (12,413) 4,283
Other financial assets — 12,412 — 1,021 1,021 405 (12,413) 1,425Derivative financial
instruments — — — — — 2,858 — 2,858Cash and cash equivalents — 25,850 227 151,456 151,683 61,687 (25,729) 213,491
—
TOTAL ASSETS — 966,608 668,855 1,135,120 1,803,975 881,646 (1,810,049) 1,842,180
* Restricted Group has been adjusted to remove the operations of Atento’s indirect subsidiaries in Brazil,Argentina, and its direct subsidiaries Atalaya Luxco 2 S.à.r.l. and Atalaya Luxco 3 S.à.r.l. The columnincludes Luxco 1 as parent of this “Guarantor Restricted Group”.
** Other are Atento’s indirect subsidiaries in Brazil, Argentina, and its direct subsidiaries Atalaya Luxco 2S.à.r.l. and Atalaya Luxco 3 S.à.r.l.
F-79
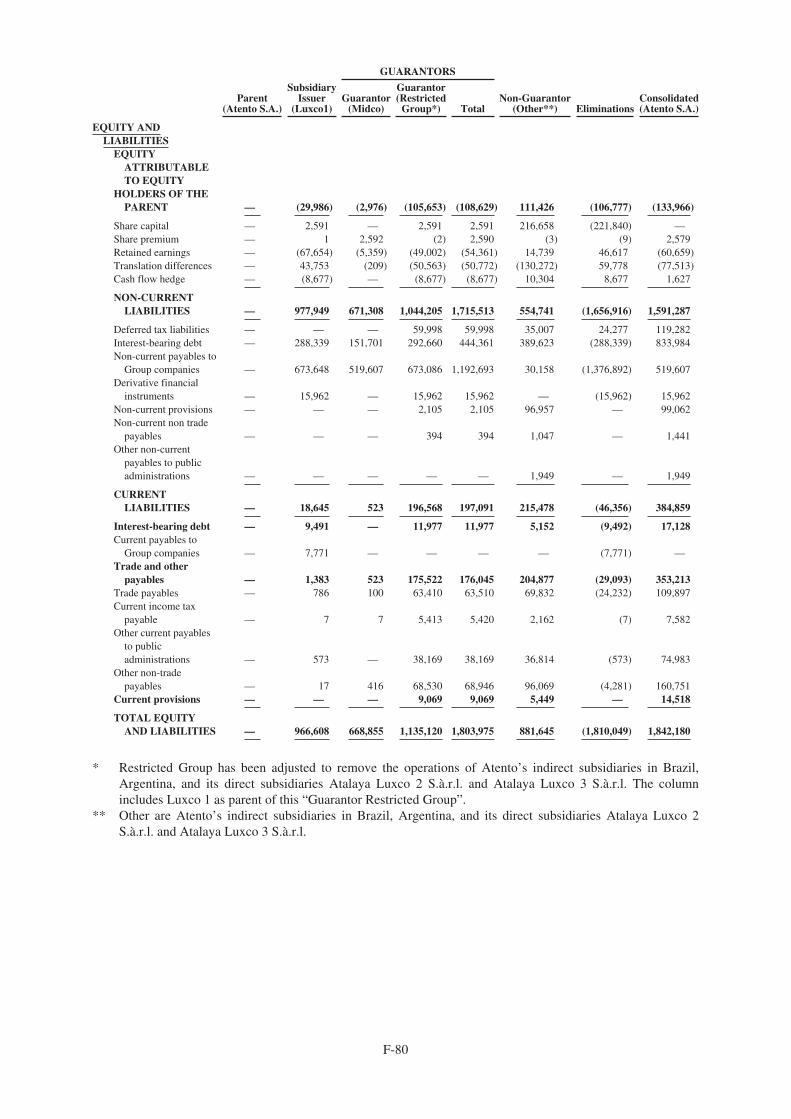
GUARANTORS
Parent(Atento S.A.)
SubsidiaryIssuer
(Luxco1)Guarantor
(Midco)
Guarantor(Restricted
Group*) TotalNon-Guarantor
(Other**) EliminationsConsolidated(Atento S.A.)
EQUITY ANDLIABILITIES
EQUITYATTRIBUTABLETO EQUITY
HOLDERS OF THEPARENT — (29,986) (2,976) (105,653) (108,629) 111,426 (106,777) (133,966)
Share capital — 2,591 — 2,591 2,591 216,658 (221,840) —Share premium — 1 2,592 (2) 2,590 (3) (9) 2,579Retained earnings — (67,654) (5,359) (49,002) (54,361) 14,739 46,617 (60,659)Translation differences — 43,753 (209) (50,563) (50,772) (130,272) 59,778 (77,513)Cash flow hedge — (8,677) — (8,677) (8,677) 10,304 8,677 1,627
NON-CURRENTLIABILITIES — 977,949 671,308 1,044,205 1,715,513 554,741 (1,656,916) 1,591,287
Deferred tax liabilities — — — 59,998 59,998 35,007 24,277 119,282Interest-bearing debt — 288,339 151,701 292,660 444,361 389,623 (288,339) 833,984Non-current payables to
Group companies — 673,648 519,607 673,086 1,192,693 30,158 (1,376,892) 519,607Derivative financial
instruments — 15,962 — 15,962 15,962 — (15,962) 15,962Non-current provisions — — — 2,105 2,105 96,957 — 99,062Non-current non trade
payables — — — 394 394 1,047 — 1,441Other non-current
payables to publicadministrations — — — — — 1,949 — 1,949
CURRENTLIABILITIES — 18,645 523 196,568 197,091 215,478 (46,356) 384,859
Interest-bearing debt — 9,491 — 11,977 11,977 5,152 (9,492) 17,128Current payables to
Group companies — 7,771 — — — — (7,771) —Trade and other
payables — 1,383 523 175,522 176,045 204,877 (29,093) 353,213Trade payables — 786 100 63,410 63,510 69,832 (24,232) 109,897Current income tax
payable — 7 7 5,413 5,420 2,162 (7) 7,582Other current payables
to publicadministrations — 573 — 38,169 38,169 36,814 (573) 74,983
Other non-tradepayables — 17 416 68,530 68,946 96,069 (4,281) 160,751
Current provisions — — — 9,069 9,069 5,449 — 14,518
TOTAL EQUITYAND LIABILITIES — 966,608 668,855 1,135,120 1,803,975 881,645 (1,810,049) 1,842,180
* Restricted Group has been adjusted to remove the operations of Atento’s indirect subsidiaries in Brazil,Argentina, and its direct subsidiaries Atalaya Luxco 2 S.à.r.l. and Atalaya Luxco 3 S.à.r.l. The columnincludes Luxco 1 as parent of this “Guarantor Restricted Group”.
** Other are Atento’s indirect subsidiaries in Brazil, Argentina, and its direct subsidiaries Atalaya Luxco 2S.à.r.l. and Atalaya Luxco 3 S.à.r.l.
F-80

As of December 31, 2014
GUARANTORS
Parent(Atento S.A.)
SubsidiaryIssuer
(Luxco1)Guarantor
(Midco)
Guarantor(Restricted
Group*) TotalNon-Guarantor
(Other**) EliminationsConsolidated(Atento S.A.)
ASSETSNON-CURRENT
ASSETS 644,398 945,359 643,112 651,622 1,294,734 523,375 (2,465,726) 942,140
Intangible assets — — — 143,946 143,946 34,559 114,573 293,078Goodwill — — — 62,316 62,316 80,099 27,056 169,471Property, plant and
equipment — — — 85,237 85,237 151,959 — 237,196Investments 644,398 249,986 26,170 218,547 244,717 79,846 (1,218,947) —Non-current financial
assets — 695,373 616,942 82,186 699,128 88,181 (1,390,424) 92,258Trade and other
receivables — — — 39 39 10,507 (43) 10,503Other receivables from
publicadministrations — — — 29 29 4,851 (29) 4,851
Other non-currentfinancial assets — 674,024 616,942 60,769 677,711 61,907 (1,369,003) 44,639
Derivative financialinstruments — 21,349 — 21,349 21,349 10,916 (21,349) 32,265
Deferred tax assets — — — 59,390 59,390 88,731 2,016 150,137
CURRENT ASSETS 9,689 40,856 1,600 402,350 403,950 340,826 (79,560) 715,761
Trade and otherreceivables 356 7,886 1,535 256,563 258,098 256,098 (46,679) 475,759
Trade and otherreceivables 342 6,734 1,527 240,055 241,582 248,263 (45,527) 451,394
Current income taxreceivables 4 10 8 8,469 8,477 5,122 (10) 13,603
Other receivables frompublicadministrations 10 1,142 — 8,039 8,039 2,713 (1,142) 10,762
Other currentfinancial assets — 3,643 — 643 643 27,919 (3,643) 28,562
Other financial assets — 3,643 — 643 643 27,919 (3,643) 28,562Derivative financial
instruments — — — — — — — —Cash and cash
equivalents 9,333 29,327 65 145,144 145,209 56,809 (29,238) 211,440
TOTAL ASSETS 654,087 986,215 644,712 1,053,972 1,698,684 864,201 (2,545,286) 1,657,901
* Restricted Group has been adjusted to remove the operations of Atento’s indirect subsidiaries in Brazil,Argentina, and its direct subsidiaries Atalaya Luxco 2 S.à.r.l. and Atalaya Luxco 3 S.à.r.l. The columnincludes Luxco 1 as parent of this “Guarantor Restricted Group”.
** Other are Atento’s indirect subsidiaries in Brazil, Argentina, and its direct subsidiaries Atalaya Luxco 2S.à.r.l. and Atalaya Luxco 3 S.à.r.l.
F-81

GUARANTORS
Parent(Atento S.A.)
SubsidiaryIssuer
(Luxco1)Guarantor
(Midco)
Guarantor(Restricted
Group*) Total
Non-Guarantor(Other**) Eliminations
Consolidated(Atento S.A.)
EQUITY AND LIABILITIESEQUITY ATTRIBUTABLE
TO EQUITY HOLDERSOF THE PARENT 644,210 46,956 611,541 (99,256) 512,285 149,230 (887,815) 464,866
Share capital 45 119 96 119 215 216,709 (217,040) 48Net investment / Share
premium 639,451 22,770 630,687 22,770 653,457 (3) (676,240) 639,435Retained earnings (19,884) (42,673) (1,712) (115,166) (116,878) 66,860 9,764 (102,811)Translation differences 24,014 74,585 (17,530) 866 (16,664) (141,541) (12,144) (71,750)Cash flow hedge — (7,845) — (7,845) (7,845) 7,205 7,845 (640)Stock-based compensation 584 — — — — — — 584
NON-CURRENTLIABILITIES — 916,374 31,578 970,711 1,002,289 498,274 (1,598,732) 818,205
Deferred tax liabilities — — — 36,367 36,367 31,647 15,118 83,132Interest-bearing debt — 290,927 — 295,255 295,255 341,294 (290,927) 636,549Non-current payables to Group
companies — 624,254 31,578 635,565 667,143 26,550 (1,317,947) —Derivative financial instruments — 1,193 — 1,193 1,193 — (1,193) 1,193Non-current provisions — — — 1,940 1,940 92,834 — 94,774Non-current non trade payables — — — 391 391 4,353 (3,783) 961Other non-current payables to
public administrations — — — — — 1,596 — 1,596
CURRENT LIABILITIES 9,877 22,885 1,594 182,518 184,112 216,694 (58,738) 374,830
Interest-bearing debt — 10,385 — 13,294 13,294 4,808 (11,726) 16,761Current payables to Group
companies — 10,459 — — — — (10,459) —Trade and other payables 9,877 2,041 1,594 156,202 157,796 206,399 (36,553) 339,560Trade payables 1,443 906 59 62,172 62,231 66,596 (25,410) 105,766Current income tax payable 3 8 8 4,797 4,805 2,543 (8) 7,351Other current payables to
public administrations 289 747 — 37,131 37,131 37,096 (747) 74,516Other non-trade payables 8,142 380 1,527 52,102 53,629 100,164 (10,388) 151,927Current provisions — — — 13,022 13,022 5,487 — 18,509
TOTAL EQUITY ANDLIABILITIES 654,087 986,215 644,713 1,053,973 1,698,686 864,198 (2,545,285) 1,657,901
* Restricted Group has been adjusted to remove the operations of Atento’s indirect subsidiaries in Brazil,Argentina, and its direct subsidiaries Atalaya Luxco 2 S.à.r.l. and Atalaya Luxco 3 S.à.r.l. The columnincludes Luxco 1 as parent of this “Guarantor Restricted Group”.
** Other are Atento’s indirect subsidiaries in Brazil, Argentina, and its direct subsidiaries Atalaya Luxco 2S.à.r.l. and Atalaya Luxco 3 S.à.r.l.
F-82
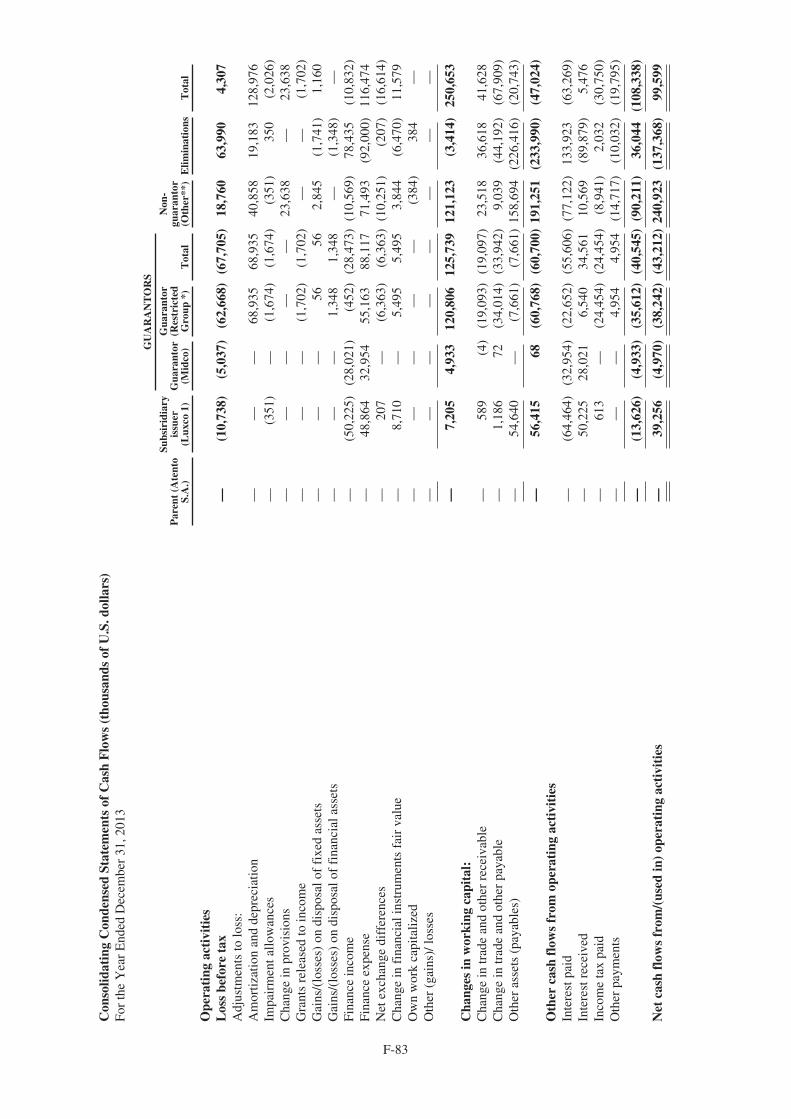
Con
solid
atin
gC
onde
nsed
Stat
emen
tsof
Cas
hF
low
s(t
hous
ands
ofU
.S.d
olla
rs)
For
the
Yea
rE
nded
Dec
embe
r31
,201
3
GU
AR
AN
TO
RS
Par
ent
(Ate
nto
S.A
.)
Subs
irid
iary
issu
er(L
uxco
1)G
uara
ntor
(Mid
co)
Gua
rant
or(R
estr
icte
dG
roup
*)T
otal
Non
-gu
aran
tor
(Oth
er**
)E
limin
atio
nsT
otal
Ope
rati
ngac
tivi
ties
Los
sbe
fore
tax
—(1
0,73
8)(5
,037
)(6
2,66
8)(6
7,70
5)18
,760
63,9
904,
307
Adj
ustm
ents
tolo
ss:
Am
ortiz
atio
nan
dde
prec
iatio
n—
——
68,9
3568
,935
40,8
5819
,183
128,
976
Impa
irm
enta
llow
ance
s—
(351
)—
(1,6
74)
(1,6
74)
(351
)35
0(2
,026
)C
hang
ein
prov
isio
ns—
——
——
23,6
38—
23,6
38G
rant
sre
leas
edto
inco
me
——
—(1
,702
)(1
,702
)—
—(1
,702
)G
ains
/(lo
sses
)on
disp
osal
offi
xed
asse
ts—
——
5656
2,84
5(1
,741
)1,
160
Gai
ns/(
loss
es)
ondi
spos
alof
fina
ncia
lass
ets
——
—1,
348
1,34
8—
(1,3
48)
—Fi
nanc
ein
com
e—
(50,
225)
(28,
021)
(452
)(2
8,47
3)(1
0,56
9)78
,435
(10,
832)
Fina
nce
expe
nse
—48
,864
32,9
5455
,163
88,1
1771
,493
(92,
000)
116,
474
Net
exch
ange
diff
eren
ces
—20
7—
(6,3
63)
(6,3
63)
(10,
251)
(207
)(1
6,61
4)C
hang
ein
fina
ncia
lins
trum
ents
fair
valu
e—
8,71
0—
5,49
55,
495
3,84
4(6
,470
)11
,579
Ow
nw
ork
capi
taliz
ed—
——
——
(384
)38
4—
Oth
er(g
ains
)/lo
sses
——
——
——
——
—7,
205
4,93
312
0,80
612
5,73
912
1,12
3(3
,414
)25
0,65
3C
hang
esin
wor
king
capi
tal:
Cha
nge
intr
ade
and
othe
rre
ceiv
able
—58
9(4
)(1
9,09
3)(1
9,09
7)23
,518
36,6
1841
,628
Cha
nge
intr
ade
and
othe
rpa
yabl
e—
1,18
672
(34,
014)
(33,
942)
9,03
9(4
4,19
2)(6
7,90
9)O
ther
asse
ts(p
ayab
les)
—54
,640
—(7
,661
)(7
,661
)15
8,69
4(2
26,4
16)
(20,
743)
—56
,415
68(6
0,76
8)(6
0,70
0)19
1,25
1(2
33,9
90)
(47,
024)
Oth
erca
shfl
ows
from
oper
atin
gac
tivi
ties
Inte
rest
paid
—(6
4,46
4)(3
2,95
4)(2
2,65
2)(5
5,60
6)(7
7,12
2)13
3,92
3(6
3,26
9)In
tere
stre
ceiv
ed—
50,2
2528
,021
6,54
034
,561
10,5
69(8
9,87
9)5,
476
Inco
me
tax
paid
—61
3—
(24,
454)
(24,
454)
(8,9
41)
2,03
2(3
0,75
0)O
ther
paym
ents
——
—4,
954
4,95
4(1
4,71
7)(1
0,03
2)(1
9,79
5)
—(1
3,62
6)(4
,933
)(3
5,61
2)(4
0,54
5)(9
0,21
1)36
,044
(108
,338
)
Net
cash
flow
sfr
om/(
used
in)
oper
atin
gac
tivi
ties
—39
,256
(4,9
70)
(38,
242)
(43,
212)
240,
923
(137
,368
)99
,599
F-83
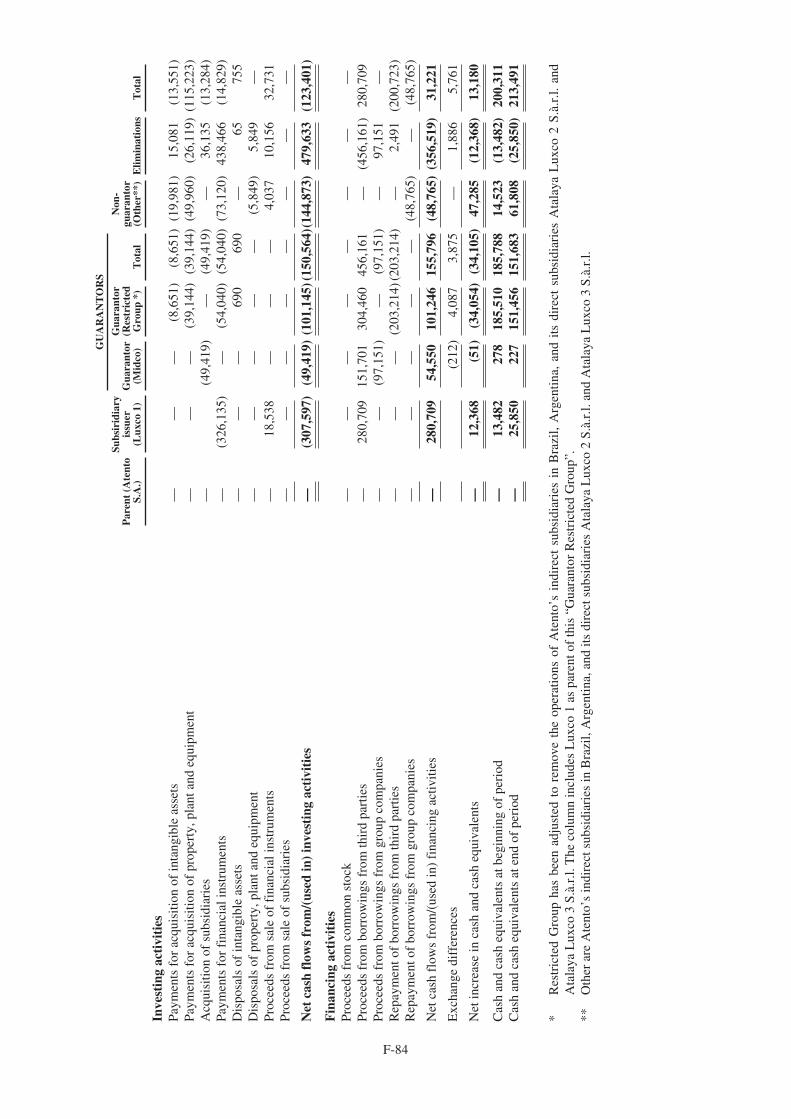
GU
AR
AN
TO
RS
Par
ent
(Ate
nto
S.A
.)
Subs
irid
iary
issu
er(L
uxco
1)G
uara
ntor
(Mid
co)
Gua
rant
or(R
estr
icte
dG
roup
*)T
otal
Non
-gu
aran
tor
(Oth
er**
)E
limin
atio
nsT
otal
Inve
stin
gac
tivi
ties
Paym
ents
for
acqu
isiti
onof
inta
ngib
leas
sets
——
—(8
,651
)(8
,651
)(1
9,98
1)15
,081
(13,
551)
Paym
ents
for
acqu
isiti
onof
prop
erty
,pla
ntan
deq
uipm
ent
——
—(3
9,14
4)(3
9,14
4)(4
9,96
0)(2
6,11
9)(1
15,2
23)
Acq
uisi
tion
ofsu
bsid
iari
es—
(49,
419)
—(4
9,41
9)—
36,1
35(1
3,28
4)Pa
ymen
tsfo
rfi
nanc
iali
nstr
umen
ts—
(326
,135
)—
(54,
040)
(54,
040)
(73,
120)
438,
466
(14,
829)
Dis
posa
lsof
inta
ngib
leas
sets
——
—69
069
0—
6575
5D
ispo
sals
ofpr
oper
ty,p
lant
and
equi
pmen
t—
——
——
(5,8
49)
5,84
9—
Proc
eeds
from
sale
offi
nanc
iali
nstr
umen
ts—
18,5
38—
——
4,03
710
,156
32,7
31Pr
ocee
dsfr
omsa
leof
subs
idia
ries
——
——
——
——
Net
cash
flow
sfr
om/(
used
in)
inve
stin
gac
tivi
ties
—(3
07,5
97)
(49,
419)
(101
,145
)(15
0,56
4)(1
44,8
73)
479,
633
(123
,401
)
Fin
anci
ngac
tivi
ties
Proc
eeds
from
com
mon
stoc
k—
——
——
——
—Pr
ocee
dsfr
ombo
rrow
ings
from
thir
dpa
rtie
s—
280,
709
151,
701
304,
460
456,
161
—(4
56,1
61)
280,
709
Proc
eeds
from
borr
owin
gsfr
omgr
oup
com
pani
es—
—(9
7,15
1)—
(97,
151)
—97
,151
—R
epay
men
tof
borr
owin
gsfr
omth
ird
part
ies
——
—(2
03,2
14)(
203,
214)
—2,
491
(200
,723
)R
epay
men
tof
borr
owin
gsfr
omgr
oup
com
pani
es—
——
——
(48,
765)
—(4
8,76
5)
Net
cash
flow
sfr
om/(
used
in)
fina
ncin
gac
tiviti
es—
280,
709
54,5
5010
1,24
615
5,79
6(4
8,76
5)(3
56,5
19)
31,2
21
Exc
hang
edi
ffer
ence
s(2
12)
4,08
73,
875
—1,
886
5,76
1
Net
incr
ease
inca
shan
dca
sheq
uiva
lent
s—
12,3
68(5
1)(3
4,05
4)(3
4,10
5)47
,285
(12,
368)
13,1
80
Cas
han
dca
sheq
uiva
lent
sat
begi
nnin
gof
peri
od—
13,4
8227
818
5,51
018
5,78
814
,523
(13,
482)
200,
311
Cas
han
dca
sheq
uiva
lent
sat
end
ofpe
riod
—25
,850
227
151,
456
151,
683
61,8
08(2
5,85
0)21
3,49
1
*R
estr
icte
dG
roup
has
been
adju
sted
tore
mov
eth
eop
erat
ions
ofA
tent
o’s
indi
rect
subs
idia
ries
inB
razi
l,A
rgen
tina,
and
itsdi
rect
subs
idia
ries
Ata
laya
Lux
co2
S.à.
r.l.
and
Ata
laya
Lux
co3
S.à.
r.l.
The
colu
mn
incl
udes
Lux
co1
aspa
rent
ofth
is“G
uara
ntor
Res
tric
ted
Gro
up”.
**O
ther
are
Ate
nto’
sin
dire
ctsu
bsid
iari
esin
Bra
zil,
Arg
entin
a,an
dits
dire
ctsu
bsid
iari
esA
tala
yaL
uxco
2S.
à.r.
l.an
dA
tala
yaL
uxco
3S.
à.r.
l.
F-84
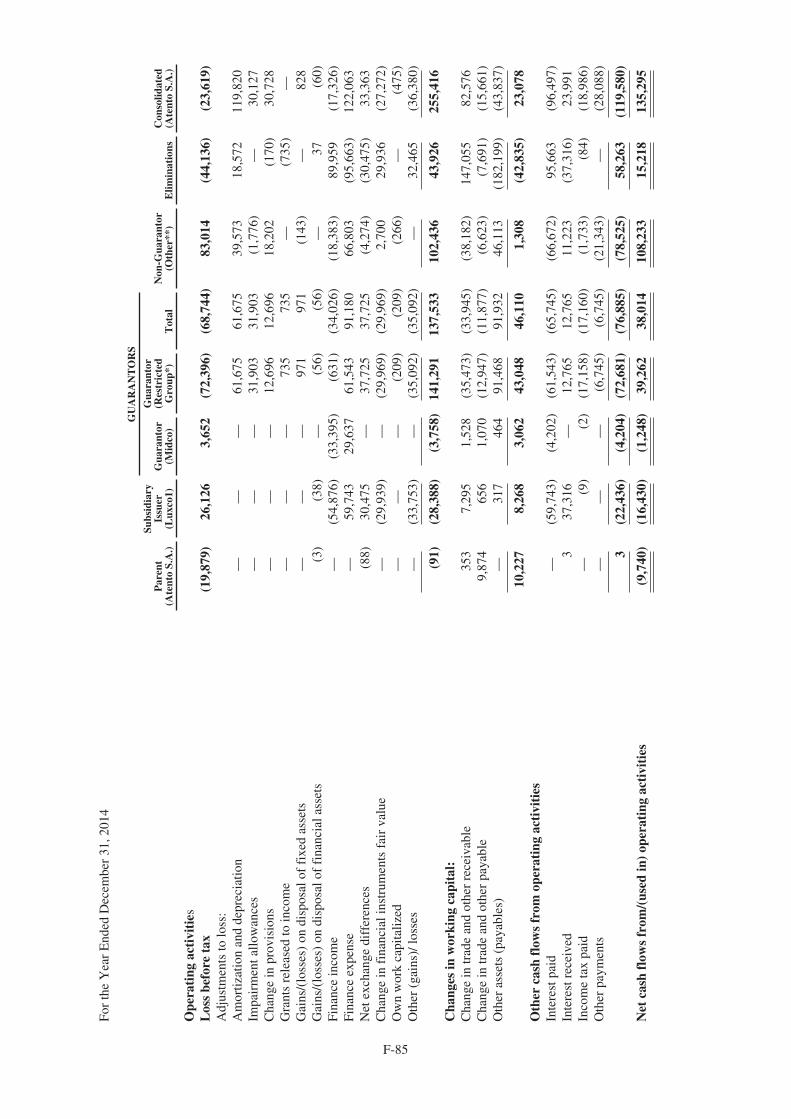
For
the
Yea
rE
nded
Dec
embe
r31
,201
4
GU
AR
AN
TO
RS
Par
ent
(Ate
nto
S.A
.)
Subs
idia
ryIs
suer
(Lux
co1)
Gua
rant
or(M
idco
)
Gua
rant
or(R
estr
icte
dG
roup
*)T
otal
Non
-Gua
rant
or(O
ther
**)
Elim
inat
ions
Con
solid
ated
(Ate
nto
S.A
.)
Ope
rati
ngac
tivi
ties
Los
sbe
fore
tax
(19,
879)
26,1
263,
652
(72,
396)
(68,
744)
83,0
14(4
4,13
6)(2
3,61
9)A
djus
tmen
tsto
loss
:A
mor
tizat
ion
and
depr
ecia
tion
——
—61
,675
61,6
7539
,573
18,5
7211
9,82
0Im
pair
men
tallo
wan
ces
——
—31
,903
31,9
03(1
,776
)—
30,1
27C
hang
ein
prov
isio
ns—
——
12,6
9612
,696
18,2
02(1
70)
30,7
28G
rant
sre
leas
edto
inco
me
——
—73
573
5—
(735
)—
Gai
ns/(
loss
es)
ondi
spos
alof
fixe
das
sets
——
—97
197
1(1
43)
—82
8G
ains
/(lo
sses
)on
disp
osal
offi
nanc
iala
sset
s(3
)(3
8)—
(56)
(56)
—37
(60)
Fina
nce
inco
me
—(5
4,87
6)(3
3,39
5)(6
31)
(34,
026)
(18,
383)
89,9
59(1
7,32
6)Fi
nanc
eex
pens
e—
59,7
4329
,637
61,5
4391
,180
66,8
03(9
5,66
3)12
2,06
3N
etex
chan
gedi
ffer
ence
s(8
8)30
,475
—37
,725
37,7
25(4
,274
)(3
0,47
5)33
,363
Cha
nge
infi
nanc
iali
nstr
umen
tsfa
irva
lue
—(2
9,93
9)—
(29,
969)
(29,
969)
2,70
029
,936
(27,
272)
Ow
nw
ork
capi
taliz
ed—
——
(209
)(2
09)
(266
)—
(475
)O
ther
(gai
ns)/
loss
es—
(33,
753)
—(3
5,09
2)(3
5,09
2)—
32,4
65(3
6,38
0)
(91)
(28,
388)
(3,7
58)
141,
291
137,
533
102,
436
43,9
2625
5,41
6C
hang
esin
wor
king
capi
tal:
Cha
nge
intr
ade
and
othe
rre
ceiv
able
353
7,29
51,
528
(35,
473)
(33,
945)
(38,
182)
147,
055
82,5
76C
hang
ein
trad
ean
dot
her
paya
ble
9,87
465
61,
070
(12,
947)
(11,
877)
(6,6
23)
(7,6
91)
(15,
661)
Oth
eras
sets
(pay
able
s)—
317
464
91,4
6891
,932
46,1
13(1
82,1
99)
(43,
837)
10,2
278,
268
3,06
243
,048
46,1
101,
308
(42,
835)
23,0
78O
ther
cash
flow
sfr
omop
erat
ing
acti
viti
esIn
tere
stpa
id—
(59,
743)
(4,2
02)
(61,
543)
(65,
745)
(66,
672)
95,6
63(9
6,49
7)In
tere
stre
ceiv
ed3
37,3
16—
12,7
6512
,765
11,2
23(3
7,31
6)23
,991
Inco
me
tax
paid
—(9
)(2
)(1
7,15
8)(1
7,16
0)(1
,733
)(8
4)(1
8,98
6)O
ther
paym
ents
——
—(6
,745
)(6
,745
)(2
1,34
3)—
(28,
088)
3(2
2,43
6)(4
,204
)(7
2,68
1)(7
6,88
5)(7
8,52
5)58
,263
(119
,580
)
Net
cash
flow
sfr
om/(
used
in)
oper
atin
gac
tivi
ties
(9,7
40)
(16,
430)
(1,2
48)
39,2
6238
,014
108,
233
15,2
1813
5,29
5
F-85
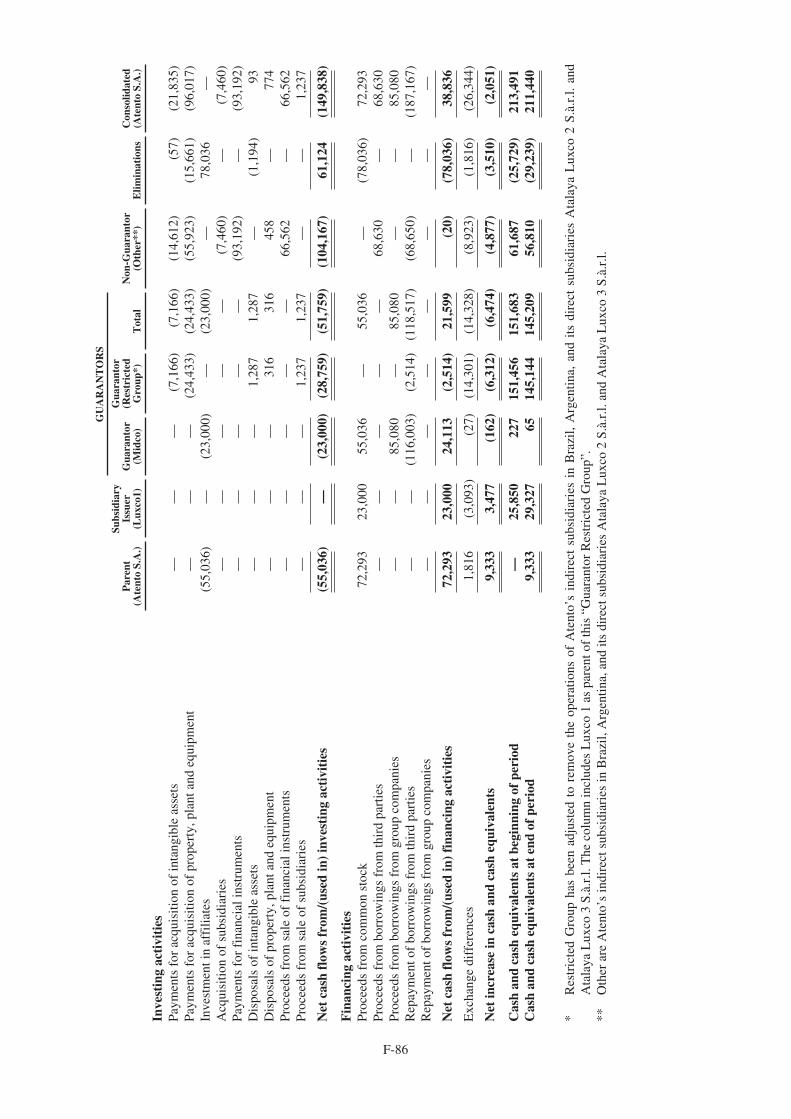
GU
AR
AN
TO
RS
Par
ent
(Ate
nto
S.A
.)
Subs
idia
ryIs
suer
(Lux
co1)
Gua
rant
or(M
idco
)
Gua
rant
or(R
estr
icte
dG
roup
*)T
otal
Non
-Gua
rant
or(O
ther
**)
Elim
inat
ions
Con
solid
ated
(Ate
nto
S.A
.)
Inve
stin
gac
tivi
ties
Paym
ents
for
acqu
isiti
onof
inta
ngib
leas
sets
——
—(7
,166
)(7
,166
)(1
4,61
2)(5
7)(2
1,83
5)Pa
ymen
tsfo
rac
quis
ition
ofpr
oper
ty,p
lant
and
equi
pmen
t—
——
(24,
433)
(24,
433)
(55,
923)
(15,
661)
(96,
017)
Inve
stm
enti
naf
filia
tes
(55,
036)
—(2
3,00
0)—
(23,
000)
—78
,036
—A
cqui
sitio
nof
subs
idia
ries
——
——
—(7
,460
)—
(7,4
60)
Paym
ents
for
fina
ncia
lins
trum
ents
——
——
—(9
3,19
2)—
(93,
192)
Dis
posa
lsof
inta
ngib
leas
sets
——
—1,
287
1,28
7—
(1,1
94)
93D
ispo
sals
ofpr
oper
ty,p
lant
and
equi
pmen
t—
——
316
316
458
—77
4Pr
ocee
dsfr
omsa
leof
fina
ncia
lins
trum
ents
——
——
—66
,562
—66
,562
Proc
eeds
from
sale
ofsu
bsid
iari
es—
——
1,23
71,
237
——
1,23
7
Net
cash
flow
sfr
om/(
used
in)
inve
stin
gac
tivi
ties
(55,
036)
—(2
3,00
0)(2
8,75
9)(5
1,75
9)(1
04,1
67)
61,1
24(1
49,8
38)
Fin
anci
ngac
tivi
ties
Proc
eeds
from
com
mon
stoc
k72
,293
23,0
0055
,036
—55
,036
—(7
8,03
6)72
,293
Proc
eeds
from
borr
owin
gsfr
omth
ird
part
ies
——
——
—68
,630
—68
,630
Proc
eeds
from
borr
owin
gsfr
omgr
oup
com
pani
es—
—85
,080
—85
,080
——
85,0
80R
epay
men
tof
borr
owin
gsfr
omth
ird
part
ies
——
(116
,003
)(2
,514
)(1
18,5
17)
(68,
650)
—(1
87,1
67)
Rep
aym
ento
fbo
rrow
ings
from
grou
pco
mpa
nies
——
——
——
——
Net
cash
flow
sfr
om/(
used
in)
fina
ncin
gac
tivi
ties
72,2
9323
,000
24,1
13(2
,514
)21
,599
(20)
(78,
036)
38,8
36
Exc
hang
edi
ffer
ence
s1,
816
(3,0
93)
(27)
(14,
301)
(14,
328)
(8,9
23)
(1,8
16)
(26,
344)
Net
incr
ease
inca
shan
dca
sheq
uiva
lent
s9,
333
3,47
7(1
62)
(6,3
12)
(6,4
74)
(4,8
77)
(3,5
10)
(2,0
51)
Cas
han
dca
sheq
uiva
lent
sat
begi
nnin
gof
peri
od—
25,8
5022
715
1,45
615
1,68
361
,687
(25,
729)
213,
491
Cas
han
dca
sheq
uiva
lent
sat
end
ofpe
riod
9,33
329
,327
6514
5,14
414
5,20
956
,810
(29,
239)
211,
440
*R
estr
icte
dG
roup
has
been
adju
sted
tore
mov
eth
eop
erat
ions
ofA
tent
o’s
indi
rect
subs
idia
ries
inB
razi
l,A
rgen
tina,
and
itsdi
rect
subs
idia
ries
Ata
laya
Lux
co2
S.à.
r.l.
and
Ata
laya
Lux
co3
S.à.
r.l.
The
colu
mn
incl
udes
Lux
co1
aspa
rent
ofth
is“G
uara
ntor
Res
tric
ted
Gro
up”.
**O
ther
are
Ate
nto’
sin
dire
ctsu
bsid
iari
esin
Bra
zil,
Arg
entin
a,an
dits
dire
ctsu
bsid
iari
esA
tala
yaL
uxco
2S.
à.r.
l.an
dA
tala
yaL
uxco
3S.
à.r.
l.
F-86
29) EVENTS AFTER THE REPORTING PERIOD
The Company has evaluated events through March 24, 2015, which is the date on which the consolidatedfinancial statements authorized for issued by the Board of Directors, and has determined that there were noadditional subsequent events after December 31, 2014 requiring adjustment or disclosure in the consolidatedfinancial statements.
a) Microsoft licenses
At January 2, 2015, Atento Brazil S.A. entered into a master agreement regarding the acquisition of rights touse Microsoft’ software from SofwareONE Commerce and Computer Services Ltda. (“Contractor”), in which theContractor provides Microsoft’ software licenses Atento and its affiliates in Brazil, Colombia, Corporation, ElSalvador, Peru, Guatemala, Mexico, and United States of America (“USA”).
Acquisition prices stated in the agreements, which will be paid in 3 (three) annual payments due onJanuary 2, 2015, 2016 and 2017, are summarized below:
Description Thousands of US dollars
SoftwareONE agreement 37,440Microsoft agreements (not received for analysis
in this memorandum) 7,920
45,360
The agreement expires in three years from the date of the agreement and it is non-cancellable.
F-87
Report of Independent Registered Public Accounting Firm
The Board of Directors and Sole Shareholder of Atalaya Luxco Midco S.à.r.l.
We have audited the accompanying combined carve-out statements of financial position of Atalaya LuxcoMidco Predecessor (the “Predecessor”), as defined in Notes 1 and 2 of the accompanying combined carve-outfinancial statements, as of December 31, 2011 and November 30, 2012, and the related combined carve-outstatements of income, comprehensive income, invested equity, and cash flows for the year ended December 31,2011 and the eleven-month period ended November 30, 2012. These combined carve-out financial statements arethe responsibility of Atalaya Luxco Midco S.à.r.l.’s management. Our responsibility is to express an opinion onthese combined carve-out financial statements based on our audits.
We conducted our audits in accordance with the standards of the Public Company Accounting OversightBoard (United States). Those standards require that we plan and perform the audit to obtain reasonable assuranceabout whether the combined carve-out financial statements are free of material misstatement. We were notengaged to perform an audit of the Predecessor’s internal control over financial reporting. Our audits includedconsideration of internal control over financial reporting as a basis for designing audit procedures that areappropriate in the circumstances, but not for the purpose of expressing an opinion on the effectiveness of thePredecessor’s internal control over financial reporting. Accordingly, we express no such opinion. An audit alsoincludes examining, on a test basis, evidence supporting the amounts and disclosures in the combined carve-outfinancial statements, assessing the accounting principles used and significant estimates made by management,and evaluating the overall financial statement presentation. We believe that our audits provide a reasonable basisfor our opinion.
In our opinion, the combined carve-out financial statements referred to above present fairly, in all materialrespects, the combined carve-out financial position of the Predecessor at December 31, 2011 and November 30,2012, and the combined carve-out results of their operations and their cash flows for the year endedDecember 31, 2011 and the eleven-month period ended November 30, 2012, in conformity with InternationalFinancial Reporting Standards as issued by the International Accounting Standards Board.
We draw attention to the fact that, as described in Note 2 (Basis of preparation), the Predecessor has notoperated as a separate legal entity. These combined carve-out financial statements are, therefore, not necessarilyindicative of results that would have occurred if the Predecessor had been a separate standalone entity during theyears presented or of the future results of the Predecessor.
Ernst & Young, S.L.
/s/ Carlos Hidalgo Andres
Carlos Hidalgo Andrés
Madrid, SpainApril 30, 2014
F-88
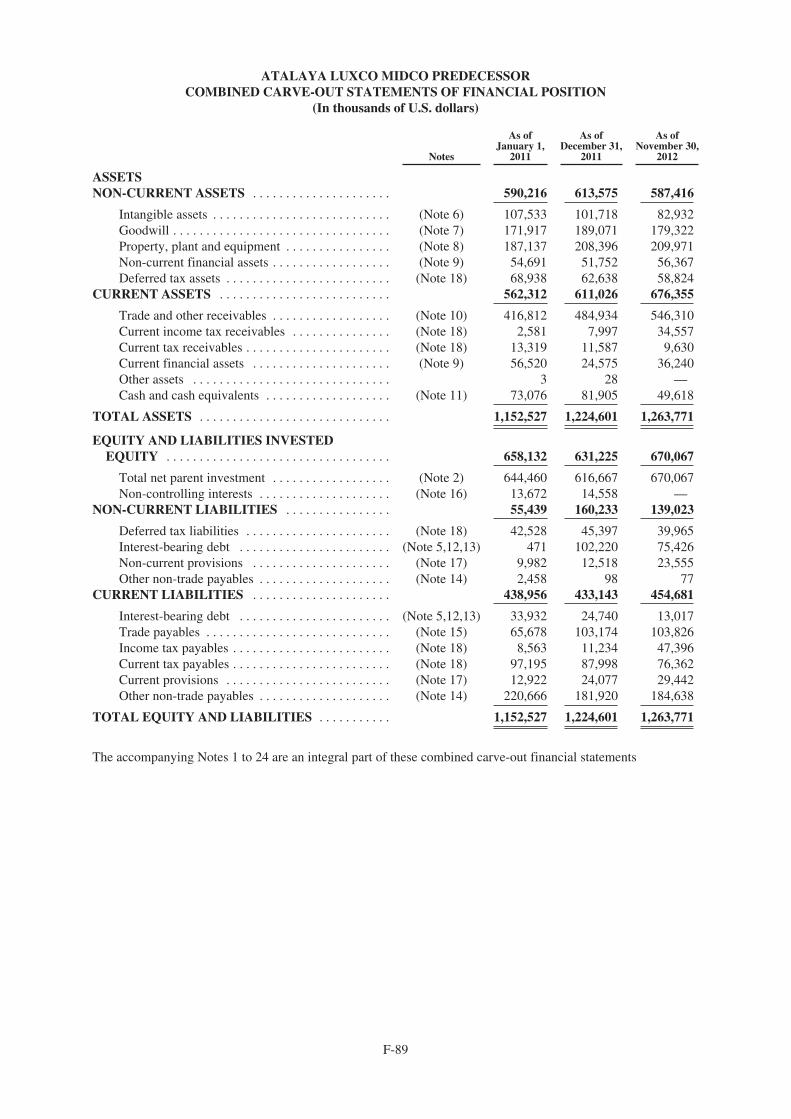
ATALAYA LUXCO MIDCO PREDECESSORCOMBINED CARVE-OUT STATEMENTS OF FINANCIAL POSITION
(In thousands of U.S. dollars)
Notes
As ofJanuary 1,
2011
As ofDecember 31,
2011
As ofNovember 30,
2012
ASSETSNON-CURRENT ASSETS . . . . . . . . . . . . . . . . . . . . . 590,216 613,575 587,416
Intangible assets . . . . . . . . . . . . . . . . . . . . . . . . . . . (Note 6) 107,533 101,718 82,932Goodwill . . . . . . . . . . . . . . . . . . . . . . . . . . . . . . . . . (Note 7) 171,917 189,071 179,322Property, plant and equipment . . . . . . . . . . . . . . . . (Note 8) 187,137 208,396 209,971Non-current financial assets . . . . . . . . . . . . . . . . . . (Note 9) 54,691 51,752 56,367Deferred tax assets . . . . . . . . . . . . . . . . . . . . . . . . . (Note 18) 68,938 62,638 58,824
CURRENT ASSETS . . . . . . . . . . . . . . . . . . . . . . . . . . 562,312 611,026 676,355
Trade and other receivables . . . . . . . . . . . . . . . . . . (Note 10) 416,812 484,934 546,310Current income tax receivables . . . . . . . . . . . . . . . (Note 18) 2,581 7,997 34,557Current tax receivables . . . . . . . . . . . . . . . . . . . . . . (Note 18) 13,319 11,587 9,630Current financial assets . . . . . . . . . . . . . . . . . . . . . (Note 9) 56,520 24,575 36,240Other assets . . . . . . . . . . . . . . . . . . . . . . . . . . . . . . 3 28 —Cash and cash equivalents . . . . . . . . . . . . . . . . . . . (Note 11) 73,076 81,905 49,618
TOTAL ASSETS . . . . . . . . . . . . . . . . . . . . . . . . . . . . . 1,152,527 1,224,601 1,263,771
EQUITY AND LIABILITIES INVESTEDEQUITY . . . . . . . . . . . . . . . . . . . . . . . . . . . . . . . . . . 658,132 631,225 670,067
Total net parent investment . . . . . . . . . . . . . . . . . . (Note 2) 644,460 616,667 670,067Non-controlling interests . . . . . . . . . . . . . . . . . . . . (Note 16) 13,672 14,558 —
NON-CURRENT LIABILITIES . . . . . . . . . . . . . . . . 55,439 160,233 139,023
Deferred tax liabilities . . . . . . . . . . . . . . . . . . . . . . (Note 18) 42,528 45,397 39,965Interest-bearing debt . . . . . . . . . . . . . . . . . . . . . . . (Note 5,12,13) 471 102,220 75,426Non-current provisions . . . . . . . . . . . . . . . . . . . . . (Note 17) 9,982 12,518 23,555Other non-trade payables . . . . . . . . . . . . . . . . . . . . (Note 14) 2,458 98 77
CURRENT LIABILITIES . . . . . . . . . . . . . . . . . . . . . 438,956 433,143 454,681
Interest-bearing debt . . . . . . . . . . . . . . . . . . . . . . . (Note 5,12,13) 33,932 24,740 13,017Trade payables . . . . . . . . . . . . . . . . . . . . . . . . . . . . (Note 15) 65,678 103,174 103,826Income tax payables . . . . . . . . . . . . . . . . . . . . . . . . (Note 18) 8,563 11,234 47,396Current tax payables . . . . . . . . . . . . . . . . . . . . . . . . (Note 18) 97,195 87,998 76,362Current provisions . . . . . . . . . . . . . . . . . . . . . . . . . (Note 17) 12,922 24,077 29,442Other non-trade payables . . . . . . . . . . . . . . . . . . . . (Note 14) 220,666 181,920 184,638
TOTAL EQUITY AND LIABILITIES . . . . . . . . . . . 1,152,527 1,224,601 1,263,771
The accompanying Notes 1 to 24 are an integral part of these combined carve-out financial statements
F-89
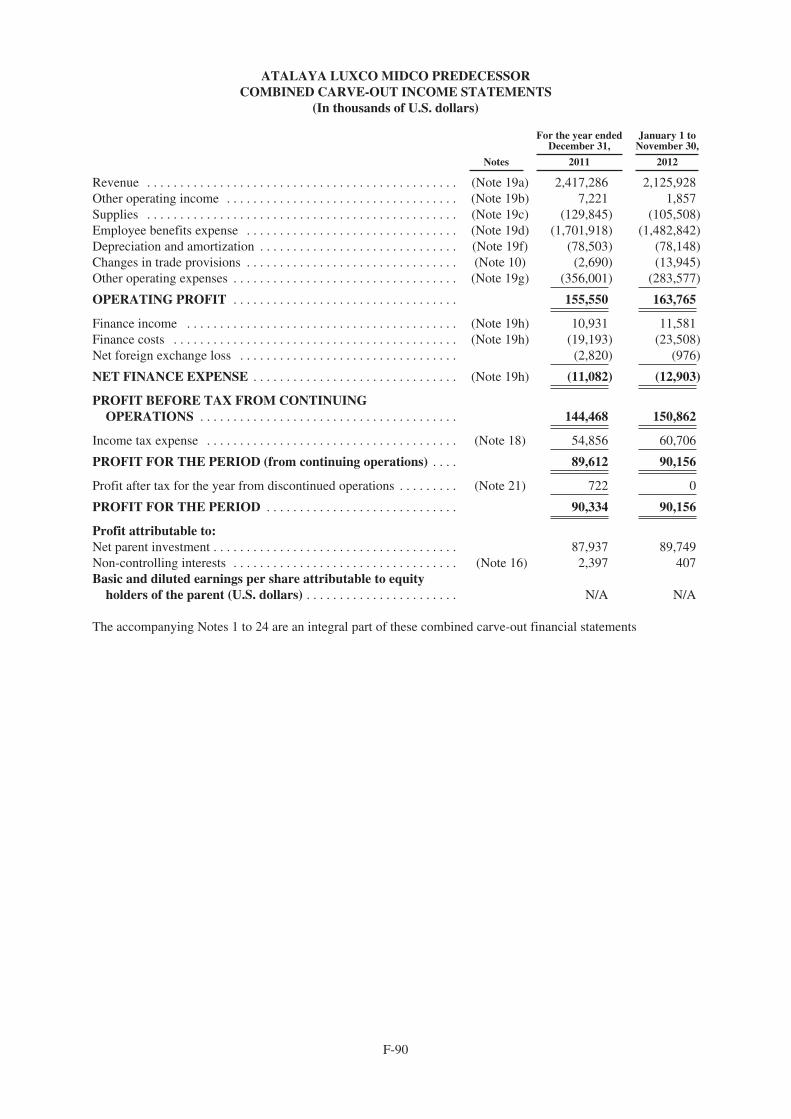
ATALAYA LUXCO MIDCO PREDECESSORCOMBINED CARVE-OUT INCOME STATEMENTS
(In thousands of U.S. dollars)
Notes
For the year endedDecember 31,
January 1 toNovember 30,
2011 2012
Revenue . . . . . . . . . . . . . . . . . . . . . . . . . . . . . . . . . . . . . . . . . . . . . . . (Note 19a) 2,417,286 2,125,928Other operating income . . . . . . . . . . . . . . . . . . . . . . . . . . . . . . . . . . . (Note 19b) 7,221 1,857Supplies . . . . . . . . . . . . . . . . . . . . . . . . . . . . . . . . . . . . . . . . . . . . . . . (Note 19c) (129,845) (105,508)Employee benefits expense . . . . . . . . . . . . . . . . . . . . . . . . . . . . . . . . (Note 19d) (1,701,918) (1,482,842)Depreciation and amortization . . . . . . . . . . . . . . . . . . . . . . . . . . . . . . (Note 19f) (78,503) (78,148)Changes in trade provisions . . . . . . . . . . . . . . . . . . . . . . . . . . . . . . . . (Note 10) (2,690) (13,945)Other operating expenses . . . . . . . . . . . . . . . . . . . . . . . . . . . . . . . . . . (Note 19g) (356,001) (283,577)
OPERATING PROFIT . . . . . . . . . . . . . . . . . . . . . . . . . . . . . . . . . . 155,550 163,765
Finance income . . . . . . . . . . . . . . . . . . . . . . . . . . . . . . . . . . . . . . . . . (Note 19h) 10,931 11,581Finance costs . . . . . . . . . . . . . . . . . . . . . . . . . . . . . . . . . . . . . . . . . . . (Note 19h) (19,193) (23,508)Net foreign exchange loss . . . . . . . . . . . . . . . . . . . . . . . . . . . . . . . . . (2,820) (976)
NET FINANCE EXPENSE . . . . . . . . . . . . . . . . . . . . . . . . . . . . . . . (Note 19h) (11,082) (12,903)
PROFIT BEFORE TAX FROM CONTINUINGOPERATIONS . . . . . . . . . . . . . . . . . . . . . . . . . . . . . . . . . . . . . . . 144,468 150,862
Income tax expense . . . . . . . . . . . . . . . . . . . . . . . . . . . . . . . . . . . . . . (Note 18) 54,856 60,706
PROFIT FOR THE PERIOD (from continuing operations) . . . . 89,612 90,156
Profit after tax for the year from discontinued operations . . . . . . . . . (Note 21) 722 0
PROFIT FOR THE PERIOD . . . . . . . . . . . . . . . . . . . . . . . . . . . . . 90,334 90,156
Profit attributable to:Net parent investment . . . . . . . . . . . . . . . . . . . . . . . . . . . . . . . . . . . . . 87,937 89,749Non-controlling interests . . . . . . . . . . . . . . . . . . . . . . . . . . . . . . . . . . (Note 16) 2,397 407Basic and diluted earnings per share attributable to equity
holders of the parent (U.S. dollars) . . . . . . . . . . . . . . . . . . . . . . . N/A N/A
The accompanying Notes 1 to 24 are an integral part of these combined carve-out financial statements
F-90

ATALAYA LUXCO MIDCO PREDECESSORCOMBINED CARVE-OUT STATEMENTS OF COMPREHENSIVE INCOME
(In thousands of U.S. dollars)
Year endedDecember 31,
January 1 toNovember 30,
2011 2012
Profit for the period . . . . . . . . . . . . . . . . . . . . . . . . . . . . . . . . . . . . . . . . . . . . . . . . . . . . 90,334 90,156Other comprehensive incomeItems that will not be reclassified to profit or loss . . . . . . . . . . . . . . . . . . . . . . . . . . — —
Items that may be subsequently reclassified to profit or loss(Losses)/ gains on cash flow hedges . . . . . . . . . . . . . . . . . . . . . . . . . . . . . . . . . . . . . . . (418) (2,560)Tax effect . . . . . . . . . . . . . . . . . . . . . . . . . . . . . . . . . . . . . . . . . . . . . . . . . . . . . . . . . . . . 125 768Currency translation differences . . . . . . . . . . . . . . . . . . . . . . . . . . . . . . . . . . . . . . . . . . (47,638) (4,629)
(47,931) (6,421)
Total comprehensive income for the period . . . . . . . . . . . . . . . . . . . . . . . . . . . . . . . 42,403 83,735
Attributable to:Net parent investment . . . . . . . . . . . . . . . . . . . . . . . . . . . . . . . . . . . . . . . . . . . . . . . . . . 41,517 82,251Non-controlling interests . . . . . . . . . . . . . . . . . . . . . . . . . . . . . . . . . . . . . . . . . . . . . . . . 886 1,484
Total comprehensive income for the period . . . . . . . . . . . . . . . . . . . . . . . . . . . . . . . . . 42,403 83,735
The accompanying Notes 1 to 24 are an integral part of these combined carve-out financial statements
F-91

ATALAYA LUXCO MIDCO PREDECESSORCOMBINED CARVE-OUT STATEMENTS OF CHANGES IN INVESTED EQUITY
(In thousands of U.S. dollars)
Net parentinvestment Hedges
Currencytranslationdifferences
Total netparent
investment
Non-controllinginterests(Note 16)
Totalinvestedequity
Balance at December 31, 2010 (Note 2) . . . 587,383 1,483 55,594 644,460 13,672 658,132
Profit for the period . . . . . . . . . . . . . . . . . . . . 87,937 — — 87,937 2,397 90,334Other comprehensive income for the
period . . . . . . . . . . . . . . . . . . . . . . . . . . . . . — (293) — (293) — (293)Translation differences . . . . . . . . . . . . . . . . . . — — (46,127) (46,127) (1,511) (47,638)
Total comprehensive income for theperiod . . . . . . . . . . . . . . . . . . . . . . . . . . . . . 87,937 (293) (46,127) 41,517 886 42,403
Movements in net parent investment(Note 2) . . . . . . . . . . . . . . . . . . . . . . . . . . . . (69,310) — — (69,310) — (69,310)
Balance at December 31, 2011 . . . . . . . . . . . 606,010 1,190 9,467 616,667 14,558 631,225
Profit for the period . . . . . . . . . . . . . . . . . . . . 89,749 — — 89,749 407 90,156Other comprehensive income for the year . . . — (1,792) — (1,792) — (1,792)Translation differences . . . . . . . . . . . . . . . . . . — — (5,706) (5,706) 1,077 (4,629)
Total comprehensive income for theyear . . . . . . . . . . . . . . . . . . . . . . . . . . . . . . 89,749 (1,792) (5,706) 82,251 1,484 83,735
Dividends paid . . . . . . . . . . . . . . . . . . . . . . . . — — — — (5,790) (5,790)Acquisition of non-controlling interests . . . . . 10,252 — — 10,252 (10,252) —Movements in net parent investment
(Note 2) . . . . . . . . . . . . . . . . . . . . . . . . . . . . (39,103) — — (39,103) — (39,103)
Balance at November 30, 2012 . . . . . . . . . . 666,908 (602) 3,761 670,067 — 670,067
The accompanying Notes 1 to 24 are an integral part of these combined carve-out financial statements
F-92
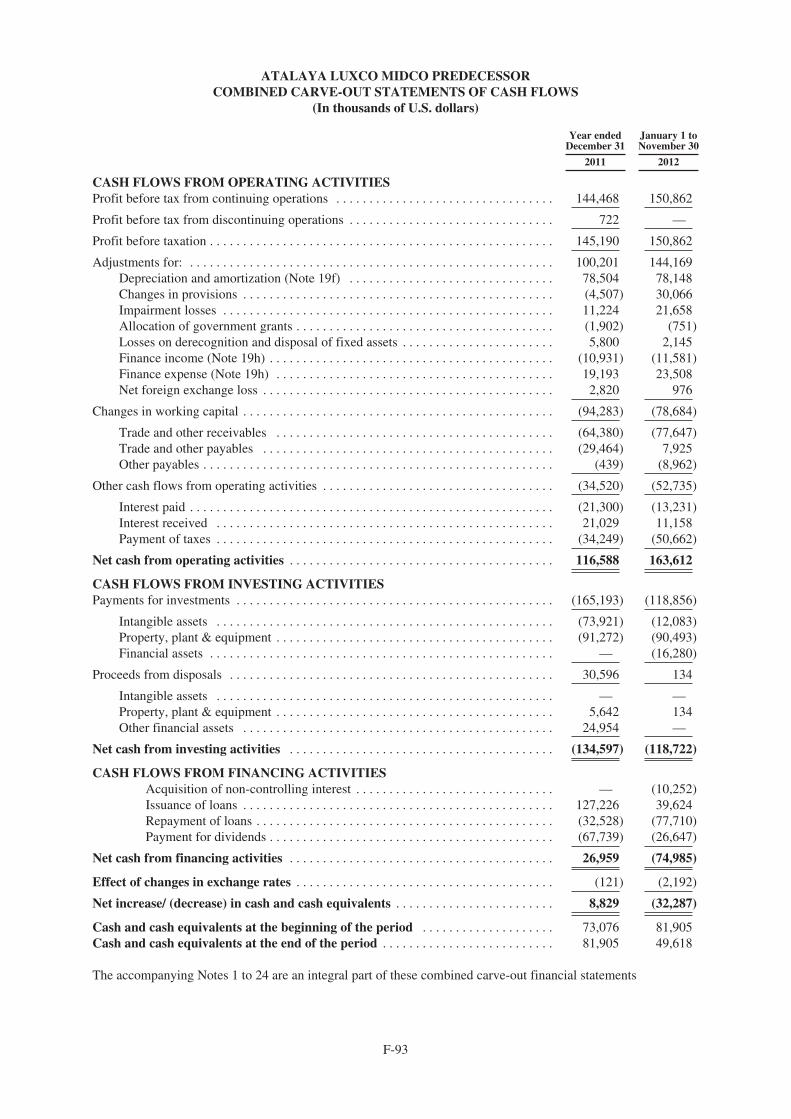
ATALAYA LUXCO MIDCO PREDECESSORCOMBINED CARVE-OUT STATEMENTS OF CASH FLOWS
(In thousands of U.S. dollars)
Year endedDecember 31
January 1 toNovember 30
2011 2012
CASH FLOWS FROM OPERATING ACTIVITIESProfit before tax from continuing operations . . . . . . . . . . . . . . . . . . . . . . . . . . . . . . . . . 144,468 150,862
Profit before tax from discontinuing operations . . . . . . . . . . . . . . . . . . . . . . . . . . . . . . . 722 —
Profit before taxation . . . . . . . . . . . . . . . . . . . . . . . . . . . . . . . . . . . . . . . . . . . . . . . . . . . . 145,190 150,862
Adjustments for: . . . . . . . . . . . . . . . . . . . . . . . . . . . . . . . . . . . . . . . . . . . . . . . . . . . . . . . 100,201 144,169Depreciation and amortization (Note 19f) . . . . . . . . . . . . . . . . . . . . . . . . . . . . . . . 78,504 78,148Changes in provisions . . . . . . . . . . . . . . . . . . . . . . . . . . . . . . . . . . . . . . . . . . . . . . . (4,507) 30,066Impairment losses . . . . . . . . . . . . . . . . . . . . . . . . . . . . . . . . . . . . . . . . . . . . . . . . . . 11,224 21,658Allocation of government grants . . . . . . . . . . . . . . . . . . . . . . . . . . . . . . . . . . . . . . . (1,902) (751)Losses on derecognition and disposal of fixed assets . . . . . . . . . . . . . . . . . . . . . . . 5,800 2,145Finance income (Note 19h) . . . . . . . . . . . . . . . . . . . . . . . . . . . . . . . . . . . . . . . . . . . (10,931) (11,581)Finance expense (Note 19h) . . . . . . . . . . . . . . . . . . . . . . . . . . . . . . . . . . . . . . . . . . 19,193 23,508Net foreign exchange loss . . . . . . . . . . . . . . . . . . . . . . . . . . . . . . . . . . . . . . . . . . . . 2,820 976
Changes in working capital . . . . . . . . . . . . . . . . . . . . . . . . . . . . . . . . . . . . . . . . . . . . . . . (94,283) (78,684)
Trade and other receivables . . . . . . . . . . . . . . . . . . . . . . . . . . . . . . . . . . . . . . . . . . (64,380) (77,647)Trade and other payables . . . . . . . . . . . . . . . . . . . . . . . . . . . . . . . . . . . . . . . . . . . . (29,464) 7,925Other payables . . . . . . . . . . . . . . . . . . . . . . . . . . . . . . . . . . . . . . . . . . . . . . . . . . . . . (439) (8,962)
Other cash flows from operating activities . . . . . . . . . . . . . . . . . . . . . . . . . . . . . . . . . . . (34,520) (52,735)
Interest paid . . . . . . . . . . . . . . . . . . . . . . . . . . . . . . . . . . . . . . . . . . . . . . . . . . . . . . . (21,300) (13,231)Interest received . . . . . . . . . . . . . . . . . . . . . . . . . . . . . . . . . . . . . . . . . . . . . . . . . . . 21,029 11,158Payment of taxes . . . . . . . . . . . . . . . . . . . . . . . . . . . . . . . . . . . . . . . . . . . . . . . . . . . (34,249) (50,662)
Net cash from operating activities . . . . . . . . . . . . . . . . . . . . . . . . . . . . . . . . . . . . . . . . 116,588 163,612
CASH FLOWS FROM INVESTING ACTIVITIESPayments for investments . . . . . . . . . . . . . . . . . . . . . . . . . . . . . . . . . . . . . . . . . . . . . . . . (165,193) (118,856)
Intangible assets . . . . . . . . . . . . . . . . . . . . . . . . . . . . . . . . . . . . . . . . . . . . . . . . . . . (73,921) (12,083)Property, plant & equipment . . . . . . . . . . . . . . . . . . . . . . . . . . . . . . . . . . . . . . . . . . (91,272) (90,493)Financial assets . . . . . . . . . . . . . . . . . . . . . . . . . . . . . . . . . . . . . . . . . . . . . . . . . . . . — (16,280)
Proceeds from disposals . . . . . . . . . . . . . . . . . . . . . . . . . . . . . . . . . . . . . . . . . . . . . . . . . 30,596 134
Intangible assets . . . . . . . . . . . . . . . . . . . . . . . . . . . . . . . . . . . . . . . . . . . . . . . . . . . — —Property, plant & equipment . . . . . . . . . . . . . . . . . . . . . . . . . . . . . . . . . . . . . . . . . . 5,642 134Other financial assets . . . . . . . . . . . . . . . . . . . . . . . . . . . . . . . . . . . . . . . . . . . . . . . 24,954 —
Net cash from investing activities . . . . . . . . . . . . . . . . . . . . . . . . . . . . . . . . . . . . . . . . (134,597) (118,722)
CASH FLOWS FROM FINANCING ACTIVITIESAcquisition of non-controlling interest . . . . . . . . . . . . . . . . . . . . . . . . . . . . . . — (10,252)Issuance of loans . . . . . . . . . . . . . . . . . . . . . . . . . . . . . . . . . . . . . . . . . . . . . . . 127,226 39,624Repayment of loans . . . . . . . . . . . . . . . . . . . . . . . . . . . . . . . . . . . . . . . . . . . . . (32,528) (77,710)Payment for dividends . . . . . . . . . . . . . . . . . . . . . . . . . . . . . . . . . . . . . . . . . . . (67,739) (26,647)
Net cash from financing activities . . . . . . . . . . . . . . . . . . . . . . . . . . . . . . . . . . . . . . . . 26,959 (74,985)
Effect of changes in exchange rates . . . . . . . . . . . . . . . . . . . . . . . . . . . . . . . . . . . . . . . (121) (2,192)
Net increase/ (decrease) in cash and cash equivalents . . . . . . . . . . . . . . . . . . . . . . . . 8,829 (32,287)
Cash and cash equivalents at the beginning of the period . . . . . . . . . . . . . . . . . . . . 73,076 81,905Cash and cash equivalents at the end of the period . . . . . . . . . . . . . . . . . . . . . . . . . . 81,905 49,618
The accompanying Notes 1 to 24 are an integral part of these combined carve-out financial statements
F-93
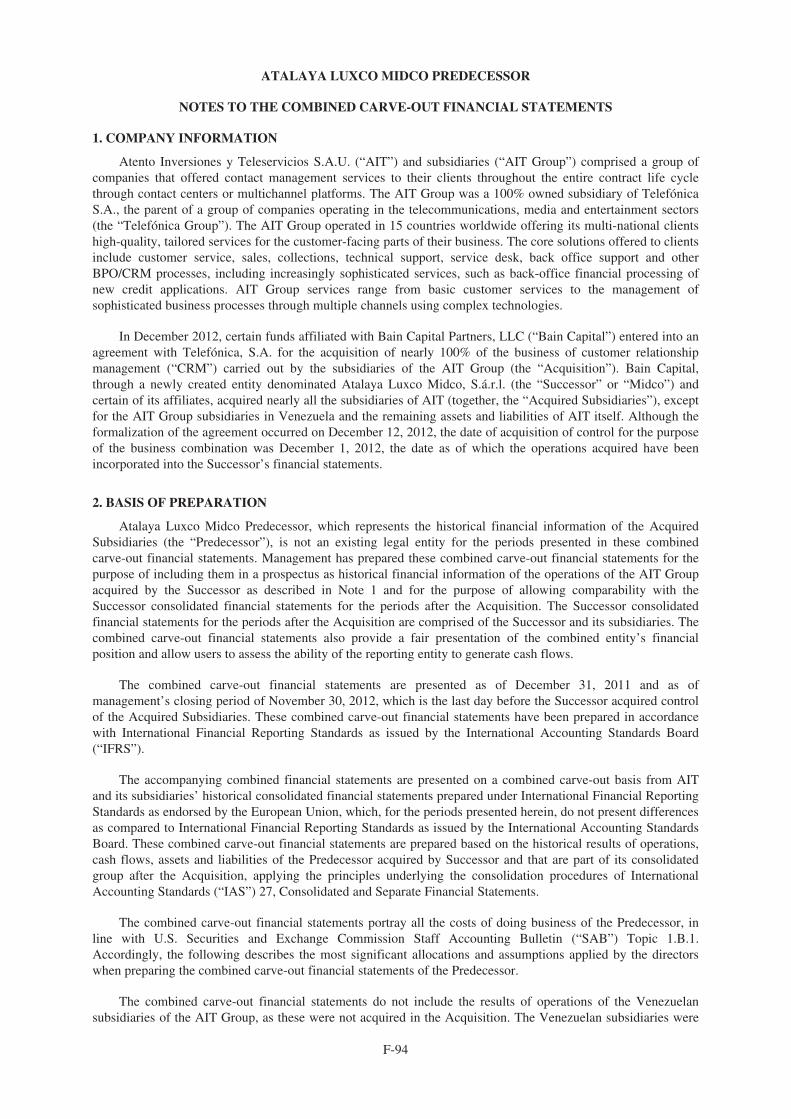
ATALAYA LUXCO MIDCO PREDECESSOR
NOTES TO THE COMBINED CARVE-OUT FINANCIAL STATEMENTS
1. COMPANY INFORMATION
Atento Inversiones y Teleservicios S.A.U. (“AIT”) and subsidiaries (“AIT Group”) comprised a group ofcompanies that offered contact management services to their clients throughout the entire contract life cyclethrough contact centers or multichannel platforms. The AIT Group was a 100% owned subsidiary of TelefónicaS.A., the parent of a group of companies operating in the telecommunications, media and entertainment sectors(the “Telefónica Group”). The AIT Group operated in 15 countries worldwide offering its multi-national clientshigh-quality, tailored services for the customer-facing parts of their business. The core solutions offered to clientsinclude customer service, sales, collections, technical support, service desk, back office support and otherBPO/CRM processes, including increasingly sophisticated services, such as back-office financial processing ofnew credit applications. AIT Group services range from basic customer services to the management ofsophisticated business processes through multiple channels using complex technologies.
In December 2012, certain funds affiliated with Bain Capital Partners, LLC (“Bain Capital”) entered into anagreement with Telefónica, S.A. for the acquisition of nearly 100% of the business of customer relationshipmanagement (“CRM”) carried out by the subsidiaries of the AIT Group (the “Acquisition”). Bain Capital,through a newly created entity denominated Atalaya Luxco Midco, S.á.r.l. (the “Successor” or “Midco”) andcertain of its affiliates, acquired nearly all the subsidiaries of AIT (together, the “Acquired Subsidiaries”), exceptfor the AIT Group subsidiaries in Venezuela and the remaining assets and liabilities of AIT itself. Although theformalization of the agreement occurred on December 12, 2012, the date of acquisition of control for the purposeof the business combination was December 1, 2012, the date as of which the operations acquired have beenincorporated into the Successor’s financial statements.
2. BASIS OF PREPARATION
Atalaya Luxco Midco Predecessor, which represents the historical financial information of the AcquiredSubsidiaries (the “Predecessor”), is not an existing legal entity for the periods presented in these combinedcarve-out financial statements. Management has prepared these combined carve-out financial statements for thepurpose of including them in a prospectus as historical financial information of the operations of the AIT Groupacquired by the Successor as described in Note 1 and for the purpose of allowing comparability with theSuccessor consolidated financial statements for the periods after the Acquisition. The Successor consolidatedfinancial statements for the periods after the Acquisition are comprised of the Successor and its subsidiaries. Thecombined carve-out financial statements also provide a fair presentation of the combined entity’s financialposition and allow users to assess the ability of the reporting entity to generate cash flows.
The combined carve-out financial statements are presented as of December 31, 2011 and as ofmanagement’s closing period of November 30, 2012, which is the last day before the Successor acquired controlof the Acquired Subsidiaries. These combined carve-out financial statements have been prepared in accordancewith International Financial Reporting Standards as issued by the International Accounting Standards Board(“IFRS”).
The accompanying combined financial statements are presented on a combined carve-out basis from AITand its subsidiaries’ historical consolidated financial statements prepared under International Financial ReportingStandards as endorsed by the European Union, which, for the periods presented herein, do not present differencesas compared to International Financial Reporting Standards as issued by the International Accounting StandardsBoard. These combined carve-out financial statements are prepared based on the historical results of operations,cash flows, assets and liabilities of the Predecessor acquired by Successor and that are part of its consolidatedgroup after the Acquisition, applying the principles underlying the consolidation procedures of InternationalAccounting Standards (“IAS”) 27, Consolidated and Separate Financial Statements.
The combined carve-out financial statements portray all the costs of doing business of the Predecessor, inline with U.S. Securities and Exchange Commission Staff Accounting Bulletin (“SAB”) Topic 1.B.1.Accordingly, the following describes the most significant allocations and assumptions applied by the directorswhen preparing the combined carve-out financial statements of the Predecessor.
The combined carve-out financial statements do not include the results of operations of the Venezuelansubsidiaries of the AIT Group, as these were not acquired in the Acquisition. The Venezuelan subsidiaries were
F-94
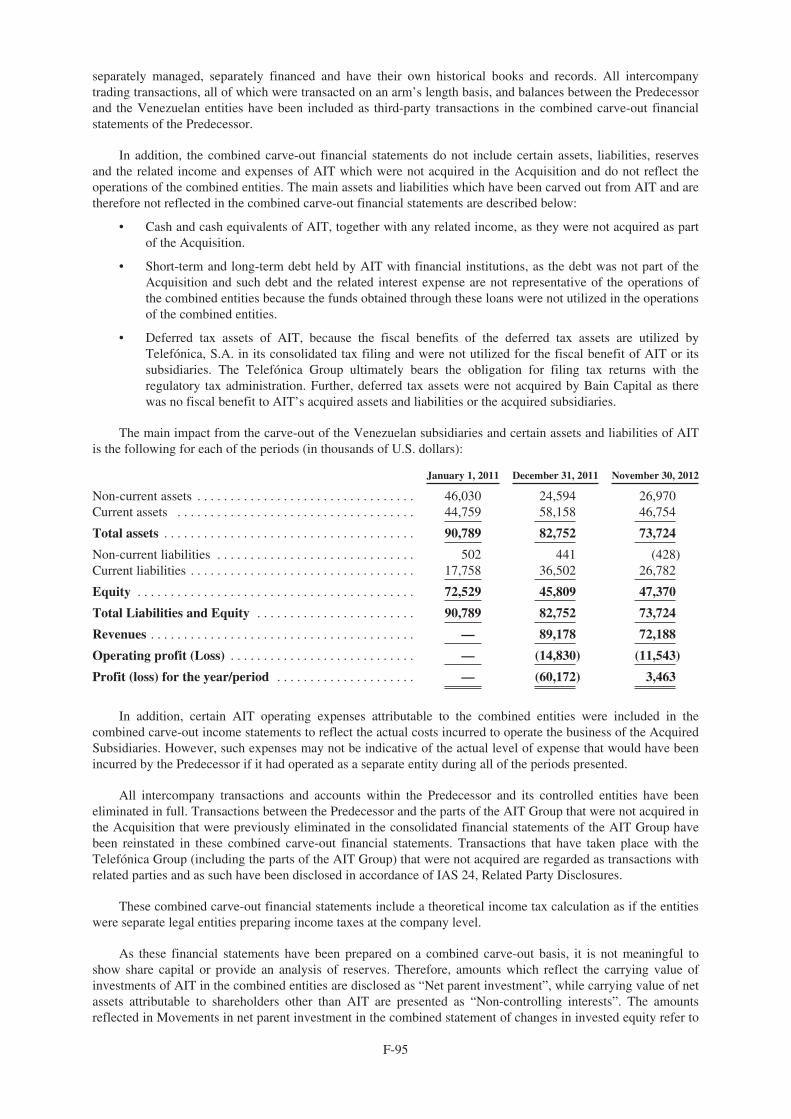
separately managed, separately financed and have their own historical books and records. All intercompanytrading transactions, all of which were transacted on an arm’s length basis, and balances between the Predecessorand the Venezuelan entities have been included as third-party transactions in the combined carve-out financialstatements of the Predecessor.
In addition, the combined carve-out financial statements do not include certain assets, liabilities, reservesand the related income and expenses of AIT which were not acquired in the Acquisition and do not reflect theoperations of the combined entities. The main assets and liabilities which have been carved out from AIT and aretherefore not reflected in the combined carve-out financial statements are described below:
• Cash and cash equivalents of AIT, together with any related income, as they were not acquired as partof the Acquisition.
• Short-term and long-term debt held by AIT with financial institutions, as the debt was not part of theAcquisition and such debt and the related interest expense are not representative of the operations ofthe combined entities because the funds obtained through these loans were not utilized in the operationsof the combined entities.
• Deferred tax assets of AIT, because the fiscal benefits of the deferred tax assets are utilized byTelefónica, S.A. in its consolidated tax filing and were not utilized for the fiscal benefit of AIT or itssubsidiaries. The Telefónica Group ultimately bears the obligation for filing tax returns with theregulatory tax administration. Further, deferred tax assets were not acquired by Bain Capital as therewas no fiscal benefit to AIT’s acquired assets and liabilities or the acquired subsidiaries.
The main impact from the carve-out of the Venezuelan subsidiaries and certain assets and liabilities of AITis the following for each of the periods (in thousands of U.S. dollars):
January 1, 2011 December 31, 2011 November 30, 2012
Non-current assets . . . . . . . . . . . . . . . . . . . . . . . . . . . . . . . . . 46,030 24,594 26,970Current assets . . . . . . . . . . . . . . . . . . . . . . . . . . . . . . . . . . . . 44,759 58,158 46,754
Total assets . . . . . . . . . . . . . . . . . . . . . . . . . . . . . . . . . . . . . . 90,789 82,752 73,724
Non-current liabilities . . . . . . . . . . . . . . . . . . . . . . . . . . . . . . 502 441 (428)Current liabilities . . . . . . . . . . . . . . . . . . . . . . . . . . . . . . . . . . 17,758 36,502 26,782
Equity . . . . . . . . . . . . . . . . . . . . . . . . . . . . . . . . . . . . . . . . . . 72,529 45,809 47,370
Total Liabilities and Equity . . . . . . . . . . . . . . . . . . . . . . . . 90,789 82,752 73,724
Revenues . . . . . . . . . . . . . . . . . . . . . . . . . . . . . . . . . . . . . . . . — 89,178 72,188
Operating profit (Loss) . . . . . . . . . . . . . . . . . . . . . . . . . . . . — (14,830) (11,543)
Profit (loss) for the year/period . . . . . . . . . . . . . . . . . . . . . — (60,172) 3,463
In addition, certain AIT operating expenses attributable to the combined entities were included in thecombined carve-out income statements to reflect the actual costs incurred to operate the business of the AcquiredSubsidiaries. However, such expenses may not be indicative of the actual level of expense that would have beenincurred by the Predecessor if it had operated as a separate entity during all of the periods presented.
All intercompany transactions and accounts within the Predecessor and its controlled entities have beeneliminated in full. Transactions between the Predecessor and the parts of the AIT Group that were not acquired inthe Acquisition that were previously eliminated in the consolidated financial statements of the AIT Group havebeen reinstated in these combined carve-out financial statements. Transactions that have taken place with theTelefónica Group (including the parts of the AIT Group) that were not acquired are regarded as transactions withrelated parties and as such have been disclosed in accordance of IAS 24, Related Party Disclosures.
These combined carve-out financial statements include a theoretical income tax calculation as if the entitieswere separate legal entities preparing income taxes at the company level.
As these financial statements have been prepared on a combined carve-out basis, it is not meaningful toshow share capital or provide an analysis of reserves. Therefore, amounts which reflect the carrying value ofinvestments of AIT in the combined entities are disclosed as “Net parent investment”, while carrying value of netassets attributable to shareholders other than AIT are presented as “Non-controlling interests”. The amountsreflected in Movements in net parent investment in the combined statement of changes in invested equity refer to
F-95
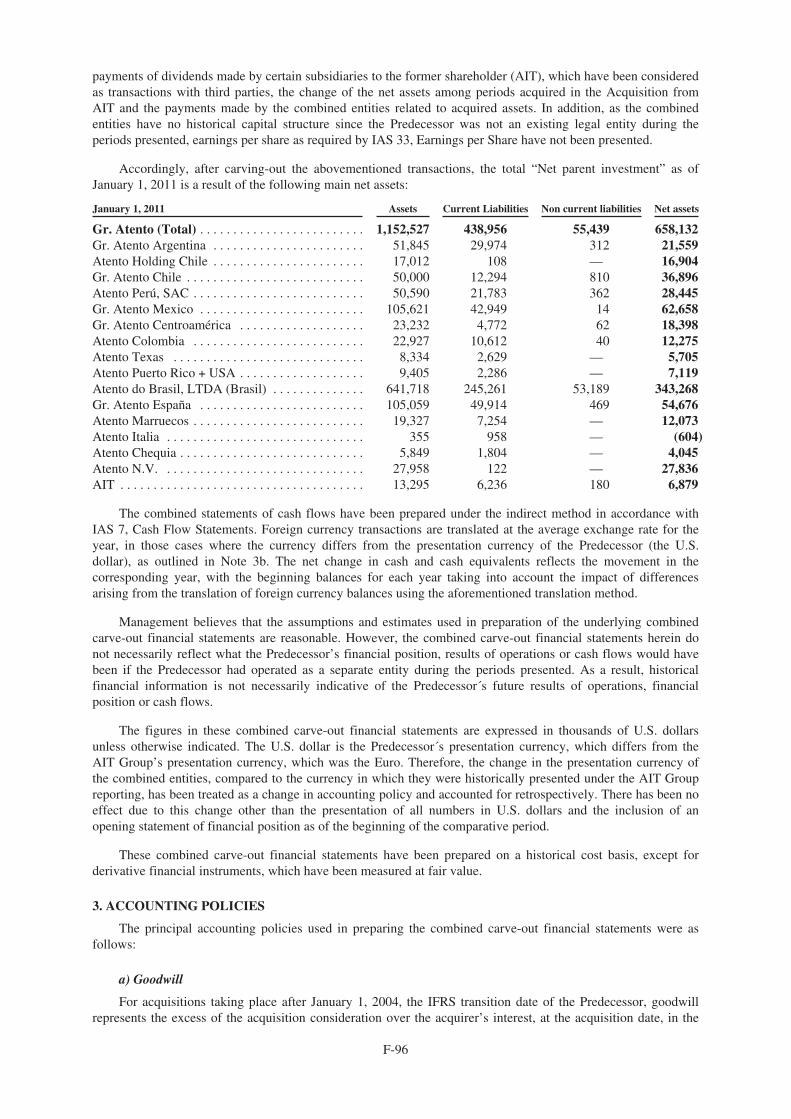
payments of dividends made by certain subsidiaries to the former shareholder (AIT), which have been consideredas transactions with third parties, the change of the net assets among periods acquired in the Acquisition fromAIT and the payments made by the combined entities related to acquired assets. In addition, as the combinedentities have no historical capital structure since the Predecessor was not an existing legal entity during theperiods presented, earnings per share as required by IAS 33, Earnings per Share have not been presented.
Accordingly, after carving-out the abovementioned transactions, the total “Net parent investment” as ofJanuary 1, 2011 is a result of the following main net assets:
January 1, 2011 Assets Current Liabilities Non current liabilities Net assets
Gr. Atento (Total) . . . . . . . . . . . . . . . . . . . . . . . . . 1,152,527 438,956 55,439 658,132Gr. Atento Argentina . . . . . . . . . . . . . . . . . . . . . . . 51,845 29,974 312 21,559Atento Holding Chile . . . . . . . . . . . . . . . . . . . . . . . 17,012 108 — 16,904Gr. Atento Chile . . . . . . . . . . . . . . . . . . . . . . . . . . . 50,000 12,294 810 36,896Atento Perú, SAC . . . . . . . . . . . . . . . . . . . . . . . . . . 50,590 21,783 362 28,445Gr. Atento Mexico . . . . . . . . . . . . . . . . . . . . . . . . . 105,621 42,949 14 62,658Gr. Atento Centroamérica . . . . . . . . . . . . . . . . . . . 23,232 4,772 62 18,398Atento Colombia . . . . . . . . . . . . . . . . . . . . . . . . . . 22,927 10,612 40 12,275Atento Texas . . . . . . . . . . . . . . . . . . . . . . . . . . . . . 8,334 2,629 — 5,705Atento Puerto Rico + USA . . . . . . . . . . . . . . . . . . . 9,405 2,286 — 7,119Atento do Brasil, LTDA (Brasil) . . . . . . . . . . . . . . 641,718 245,261 53,189 343,268Gr. Atento España . . . . . . . . . . . . . . . . . . . . . . . . . 105,059 49,914 469 54,676Atento Marruecos . . . . . . . . . . . . . . . . . . . . . . . . . . 19,327 7,254 — 12,073Atento Italia . . . . . . . . . . . . . . . . . . . . . . . . . . . . . . 355 958 — (604)Atento Chequia . . . . . . . . . . . . . . . . . . . . . . . . . . . . 5,849 1,804 — 4,045Atento N.V. . . . . . . . . . . . . . . . . . . . . . . . . . . . . . . 27,958 122 — 27,836AIT . . . . . . . . . . . . . . . . . . . . . . . . . . . . . . . . . . . . . 13,295 6,236 180 6,879
The combined statements of cash flows have been prepared under the indirect method in accordance withIAS 7, Cash Flow Statements. Foreign currency transactions are translated at the average exchange rate for theyear, in those cases where the currency differs from the presentation currency of the Predecessor (the U.S.dollar), as outlined in Note 3b. The net change in cash and cash equivalents reflects the movement in thecorresponding year, with the beginning balances for each year taking into account the impact of differencesarising from the translation of foreign currency balances using the aforementioned translation method.
Management believes that the assumptions and estimates used in preparation of the underlying combinedcarve-out financial statements are reasonable. However, the combined carve-out financial statements herein donot necessarily reflect what the Predecessor’s financial position, results of operations or cash flows would havebeen if the Predecessor had operated as a separate entity during the periods presented. As a result, historicalfinancial information is not necessarily indicative of the Predecessor´s future results of operations, financialposition or cash flows.
The figures in these combined carve-out financial statements are expressed in thousands of U.S. dollarsunless otherwise indicated. The U.S. dollar is the Predecessor´s presentation currency, which differs from theAIT Group’s presentation currency, which was the Euro. Therefore, the change in the presentation currency ofthe combined entities, compared to the currency in which they were historically presented under the AIT Groupreporting, has been treated as a change in accounting policy and accounted for retrospectively. There has been noeffect due to this change other than the presentation of all numbers in U.S. dollars and the inclusion of anopening statement of financial position as of the beginning of the comparative period.
These combined carve-out financial statements have been prepared on a historical cost basis, except forderivative financial instruments, which have been measured at fair value.
3. ACCOUNTING POLICIES
The principal accounting policies used in preparing the combined carve-out financial statements were asfollows:
a) Goodwill
For acquisitions taking place after January 1, 2004, the IFRS transition date of the Predecessor, goodwillrepresents the excess of the acquisition consideration over the acquirer’s interest, at the acquisition date, in the
F-96
fair values of the identifiable assets and liabilities acquired from a subsidiary. After initial measurement,goodwill is carried at cost, less any accumulated impairment losses.
In the transition to IFRS, the Predecessor availed itself of the exemption allowing it not to restate businesscombinations taking place before January 1, 2004. As a result, the accompanying combined carve-out statementsof financial position include goodwill as of the opening balance sheet date of January 1, 2011 as previouslycarried in the financial statements of AIT and translated into the new presentation currency, U.S. dollars.Deferred tax liabilities due to temporary differences related to goodwill arise due to the amortization of goodwillfor tax purposes, as goodwill is not amortized for accounting purposes.
In all cases, goodwill is recognized as an asset denominated in the currency of the company acquired.
Goodwill is tested for impairment annually or more frequently if there are certain events or changes incircumstances indicating the possibility that the carrying amount may not be fully recoverable.
The potential impairment loss is determined by assessing the recoverable amount of the cash-generating unit(“CGU”) or group of CGUs to which the goodwill is allocated based on the identified synergies that will benefitthe CGU or group of CGUs. Where the recoverable amount is less than the carrying amount, the CGU isconsidered impaired and a provision is recognized to reflect the loss. The impairment then obtained is allocatedto goodwill first and the remainder provision (if any) proportionally to the rest of the assets of the CGU. Thegoodwill impairment is irreversible impairment.
b) Translation methodology
The combined carve-out financial statements of the Predecessor´s foreign subsidiaries were translated toU.S. dollars at period-end exchange rates, except for:
1. Net parent investment, which was translated at historical exchange rates.
2. Income statements, which were translated at the average exchange rates for the period.
3. Cash flow statements, which were translated at the average exchange rates for the period.
Goodwill and fair value adjustments of statement of financial position items arising on the acquisition of aninterest in a foreign operation are treated as part of the assets and liabilities of the acquired company and,therefore, translated at its closing rate at period end.
The exchange rate differences arising from the application of this method are included in “Translationdifferences” under “Total Net parent investment” in the accompanying combined statements of financialposition, net of the portion of said differences attributable to non-controlling interests, which is shown under“Non-controlling interests”.
c) Foreign currency transactions
Monetary assets and liabilities denominated in a different currency than the functional currency of thecombined entities are initially recorded at the functional currency rate at the date of the transaction andretranslated at the rate of exchange at the close of the period, recognizing the difference between both amounts inprofit or loss for the period.
d) Intangible assets
“Intangible assets” are stated at acquisition cost, less any accumulated amortization and any accumulatedimpairment losses. Intangible assets acquired in a business combination are initially measured at fair value at thedate of acquisition.
Acquisition cost comprises the purchase price, including import duties and non-refundable taxes, afterdeducting trade discounts and rebates, and directly attributable costs of readying the asset for its intended use.
The useful lives of intangible assets are assessed on a case-by-case basis to be either finite or indefinite.Intangible assets with finite lives are amortized on a straight line basis over their estimated useful life and
F-97
assessed for impairment whenever events or changes indicate that their carrying amount may not be recoverable.At December 31, 2011 and November 30, 2012 there were no intangible assets with an indefinite useful life.
The amortization charge is recognized in the consolidated income statement under “Depreciation andamortization.”
Amortization methods and schedules are revised annually at each financial year-end and, where appropriate,adjusted prospectively.
Computer software
Software is measured at cost and amortized on a straight-line basis over its useful life, generally estimated atbetween three and five years.
Intellectual property
Amounts paid to acquire or use intellectual property are recognized under “Intellectual property”.Intellectual property is amortized on a straight-line basis over its useful life, estimated at 10 years.
Other intangible assets and development costs
Development costs are recognized when specific criteria are satisfied, being these criteria mainly relatedwith the probability of generating future revenue because the project developed is viable, the availability ofresources and the intention to finalize the project, being the costs associated to it reliably estimated.
These assets are amortized on a straight-line basis over their useful life, which ranges from 4 to 10 years.
e) Property, plant and equipment
Property, plant and equipment is measured at cost, less any accumulated depreciation and any impairmentlosses. Land is not depreciated. Property, plant and equipment acquired in a business combination are initiallymeasured at fair value at the date of acquisition.
Acquisition cost comprises the purchase price, including import duties and non-refundable taxes, afterdeducting trade discounts and rebates, and directly attributable costs of readying the asset for its intended use.
Cost also includes, where appropriate, the initial estimate of decommissioning, withdrawal and sitereconditioning costs when the Predecessor is obliged to bear the expenditures because of the use of the assets.
Repairs which do not prolong the useful life of the assets and maintenance costs are recognized directly inthe income statement. Costs which prolong or improve the life of the asset are capitalized as an increase in thecost of the asset.
The Predecessor assesses the need to write down, if appropriate, the carrying amount of each item ofproperty, plant and equipment to its recoverable amount at each financial year-end, whenever there areindications that the assets’ carrying amount may not be fully recoverable through the generation of sufficientfuture revenue. The impairment provision is reversed if the factors giving rise to the impairment cease to exist(see Note 3f).
The depreciation charge for property, plant and equipment is recognized in the consolidated incomestatement under “Depreciation and amortization.”
Depreciation is calculated on a straight-line basis over the useful life of the asset applying individual rates toeach asset, which are reviewed at each financial year-end. For those assets acquired through a businesscombination, the Group decided to maintain its useful lives.
The useful lives generally used by the Predecessor are as follows:
Years of useful life
Owned buildings and Leasehold improvements . . . . . 5 – 40Plant and equipment . . . . . . . . . . . . . . . . . . . . . . . . . . . 5 – 6Furniture . . . . . . . . . . . . . . . . . . . . . . . . . . . . . . . . . . . . 10Data processing equipment . . . . . . . . . . . . . . . . . . . . . 4 – 5Transport equipment . . . . . . . . . . . . . . . . . . . . . . . . . . 7Other property, plant and equipment . . . . . . . . . . . . . . 5 – 8
F-98
f) Impairment of non-current assets
The Predecessor assesses at each reporting date whether there is an indication that a non-current asset maybe impaired. If any such indication exists, or when annual impairment testing for an asset is required (e.g.goodwill), the Predecessor estimates the asset’s recoverable amount. An asset’s recoverable amount is the higherof fair value less costs to sell or its value in use. In assessing value in use, the estimated future cash flows arediscounted to their present value using an after-tax discount rate that reflects current market assessments of thetime value of money and the risks specific to the asset. Where the carrying amount of an asset exceeds itsrecoverable amount, the asset is considered to be impaired. In this case, the carrying amount is written down toits recoverable amount and the resulting loss is recognized in the income statement. Future depreciation/amortization charges are adjusted for the asset’s new carrying amount over its remaining useful life. Managementanalyzes the impairment of each asset individually, except in the case of assets that generate cash flows whichare interdependent on those generated by other assets (cash-generating units).
The Predecessor bases the calculation of impairment on the business plans of the various cash generatingunits to which the assets are allocated. These business plans cover five years. The projections in year five andbeyond are modeled based on an estimated constant or decreasing growth rate.
When there are new events or changes in circumstances that indicate that a previously recognizedimpairment loss no longer exists or has been decreased, a new estimate of the asset’s recoverable amount ismade. A previously recognized impairment loss is reversed only if there has been a change in the estimates usedto determine the asset’s recoverable amount since the last impairment loss was recognized. If that is the case, thecarrying amount of the asset is increased to its recoverable amount. The reversal is limited to the carrying amountthat would have been determined had no impairment loss been recognized for the asset in prior years. Suchreversal is recognized in the income statement and the depreciation charge is adjusted in future periods to reflectthe asset’s revised carrying amount. Impairment losses relating to goodwill cannot be reversed in future periods.
g) Leases (as lessee)
Leases where the lessor does not transfer substantially all the risks and benefits of ownership of the asset areclassified as operating leases. Operating lease payments are recognized as an expense in the income statement ona straight-line basis over the lease term.
Those lease arrangements that transfer to the Predecessor the significant risks and benefits inherent inholding the leased item are treated as finance leases, with the asset recorded at the inception of the lease,classified by type, and the related debt recorded at the lower of the present value of the minimum lease paymentsor the fair value of the leased asset. Lease payments are apportioned between the finance charges and reductionof the principal of the lease liability so as to achieve a constant rate of interest on the remaining balance of theliability. Finance charges are reflected in the income statement over the lease term.
h) Financial assets
All purchases and sales of financial assets are recognized on the statement of financial position on the tradedate, i.e., when the commitment is made to purchase or sell the asset.
On the date of initial recognition, the Predecessor classifies its financial assets in four categories: financialassets at fair value through profit or loss, loans and receivables, held-to- maturity investments, and available-for-sale financial assets. These classifications are revised at year end and modified where applicable. ThePredecessor classifies all its financial assets as loans and receivables, except for derivative financial instruments,which are classified as financial assets at fair value through profit or loss.
This category of loans and receivables consists of fixed-maturity financial assets not listed in active markets.These assets are carried at amortized cost using the effective interest rate method. Gains and losses arerecognized in the income statement when the loans and receivables are derecognized or impaired, as well asthrough the amortization process.
An impairment analysis of financial assets is performed at each statement financial position date. If there isobjective evidence that an impairment loss on a financial asset carried at amortized cost has been incurred, theamount of the loss is measured as the difference between the asset’s carrying amount and the present value ofestimated future cash flows (excluding future expected credit losses that have not been incurred) discounted atthe financial asset’s original effective interest rate.
F-99
A financial asset is only fully or partially derecognized from the statement of financial position when:
1. the rights to receive cash flows from the asset have expired;
2. The Predecessor has assumed an obligation to pay the cash flows received from the asset to a thirdparty; or
3. The Predecessor has transferred its rights to receive cash flows from the asset to a third party andtransferred substantially all the risks and rewards of the asset.
i) Cash and cash equivalents
Cash and cash equivalents in the combined carve-out statement of financial position comprise cash on handand at banks, demand deposits and other highly liquid investments with an original maturity of three months orless.
These items are stated at historical cost, which does not differ significantly from realizable value.
For the purpose of the combined carve-out statement of cash flows, cash and cash equivalents are shown netof any outstanding bank overdrafts.
j) Financial liabilities
Debts are recognized initially at fair value, which is usually the amount of the consideration received, lessdirectly attributable transaction costs. After initial recognition, these financial liabilities are measured atamortized cost using the effective interest rate method. Any difference between the cash received (net oftransaction costs) and the repayment value is recognized in the income statement over the life of the debt. Debtsare shown as non-current liabilities when the maturity date is longer than 12 months or the Predecessor has theunconditional right to defer settlement for at least 12 months from the statement of financial position date.
Financial liabilities are derecognized from the statement of financial position when the correspondingobligation is settled, cancelled or matures. Where an existing financial liability is replaced by another from thesame lender under substantially different terms, such an exchange is treated as a derecognition of the originalliability and the recognition of a new liability, and the difference between the respective carrying amounts isrecognized in the income statement.
k) Derivative financial instruments and hedging
Derivative financial instruments are initially recognized at fair value, normally equivalent to cost. Theircarrying amounts are subsequently re-measured at fair value. Derivatives are carried as assets when the fair valueis positive and as liabilities when the fair value is negative. The full fair value of a hedging derivative isclassified as a non-current asset or liability when the remaining hedged item is more than 12 months and as acurrent asset or liability when the remaining maturity of the hedged item is less than 12 months. Tradingderivatives are classified as a current asset or liability.
The accounting treatment of any gain or loss resulting from changes in the fair value of a derivative dependson whether the derivative in question meets all the criteria for hedge accounting and, if appropriate, on the natureof the hedge. The Predecessor documents at the inception of the transaction the relationship between hedginginstruments and hedged items, as well as its risk management objectives and strategy for undertaking varioushedging transactions. The Predecessor also documents its assessment, both at hedge inception and on an ongoingbasis, of whether the derivatives that are used in hedging transactions are highly effective in offsetting changes infair values or cash flows of hedged items.
Fair value hedge:
Changes in fair value of the hedging derivative and of the hedged item attributable to the risk hedged arerecognized in the income statement. The Predecessor only applies fair value hedge accounting for hedging debtsincurred in currencies other than those of countries where it operates or where the companies taking on the debtare domiciled. The gain or loss relating to the effective portion of the hedge is recognized in the incomestatement within ‘finance costs’. The gain or loss relating to the ineffective portion is recognized in the incomestatement within finance income or finance costs, as applicable.
F-100
If the hedge no longer meets the criteria for hedge accounting, the adjustment to the carrying amount of ahedged item for which the effective interest method is used is amortized to profit or loss over the period tomaturity.
Cash flow hedge:
The effective portion of changes in the fair value of derivatives that are designated and qualify as cash flowhedges is recognized in other comprehensive income. The gain or loss relating to the ineffective portion isrecognized immediately in the income statement within finance income or finance costs, as applicable.
Amounts accumulated in equity are reclassified to profit or loss in the periods when the hedged item affectsprofit or loss (for example, when the forecast sale that is hedged takes place). The gain or loss relating to theeffective portion of interest rate swaps hedging variable rate borrowings is recognized in the income statementwithin finance income or finance costs, as applicable.
When a hedging instrument expires or is sold, or when a hedge no longer meets the criteria for hedgeaccounting, any cumulative gain or loss existing in equity at that time remains in equity and is recognized whenthe forecast transaction is ultimately recognized in the income statement. When a forecast transaction is nolonger expected to occur, the cumulative gain or loss that was reported in equity is immediately transferred to theincome statement within finance income or finance costs, as applicable.
The fair value of the derivative portfolio reflects estimates based on calculations made using observablemarket data, as well as specific pricing and risk-management tools commonly used by financial entities.
l) Trade receivables
Trade receivables are recognized at the original invoice amount and at the accrued amount when unbilled. Aprovision for impairment is recorded when there is objective evidence of impairment. The amount of theimpairment provision is calculated as the difference between the carrying amount of the doubtful tradereceivables and their recoverable amount. In general, cash flows relating to short-term receivables are notdiscounted.
m) Grants received
Government grants are recognized in the account “Deferred income”, part of “Other non-trade payables” inthe statement of financial position. Where there is reasonable assurance that the grant will be received and allattaching conditions will be complied with, they are released to income in equal amounts over the useful life ofthe related assets as “Government grants” under “Other operating income” in the income statement. When thegrant relates to an expense item, it is recognized as income over the period necessary to match the grant to thecosts that it is intended to compensate.
n) Provisions
Provisions are recognized when as a result of a past event, for which the Predecessor has a presentobligation (legal or constructive), it is probable that an outflow of resources embodying economic benefits willbe required to settle the obligation and a reliable estimate can be made of the amount of the obligation. When thePredecessor expects some or all of a provision to be reimbursed, for example under an insurance contract, thereimbursement is recognized as a separate asset, but only when the reimbursement is virtually certain, in whichcase the expense relating to the provision is presented in the statement of financial position net of suchreimbursement. If the effect of the time value of money is material, provisions are discounted, and thecorresponding increase in the provision due to the passage of time is recognized as a finance cost.
o) Share-based payments linked to the Telefónica, S.A. share price.
Certain Predecessor management had a variable remuneration scheme which is linked to the quoted shareprice of Telefónica, S.A.
The Directors’ remuneration plan lasts for seven years and comprises five three-year cycles (or completelyindependent payment dates), the first commencing on July 1, 2006. The right, granted at the commencement ofeach cycle, to receive a certain number of Telefónica, S.A. shares at the end of the same cycle is subject to
F-101

certain conditions being met. Telefónica, S.A. invoices the cost of the plan to its subsidiaries at the end of eachcycle. The invoices are for the total cost, equal to the fair value of the instruments delivered, calculated at thebeginning date of each cycle.
Due to its characteristics, this plan is subject to IFRS 2, Share-based payments, on the grounds that it is theentity that was the parent during the predecessor reporting period (Telefónica, S.A.) that granted the share optionrights for its own shares to the employees of a subsidiary. Thus, it is treated as a share-based paymenttransaction, and the Predecessor recognizes the expense corresponding to its employees with a balancing entry inaccounts payable with Telefonica spread out over each three-year cycle.
p) Income tax
This heading in the accompanying combined carve-out income statement includes all the expenses andcredits arising from the combined entities calculated using a method consistent with a separate tax return basis, asif the Predecessor was a separate tax payer (see Note 2). Income tax expense of each period is the aggregateamount of current and deferred taxes, if applicable.
Current tax assets and liabilities for the current and prior periods are measured at the amount expected to berecovered from or paid to taxation authorities. The tax rates and tax laws used to compute the amount are thosethat are substantively enacted by the statement of financial position date. The entity offsets current tax assets andcurrent tax liabilities if there is a legally enforceable right to set off the recognised amounts and the Predecessorintends either to settle on a net basis, or to realize the asset and settle the liability simultaneously.
Deferred taxes are calculated based on analysis of the statement of financial position, in consideration oftemporary differences generated from differences between the tax bases of assets and liabilities and their carryingamounts for financial reporting purposes.
The main temporary differences arise due to differences between the tax bases and carrying amounts ofplant, property and equipment, intangible assets, goodwill and non-deductible provisions, as well as differencesbetween the fair value and tax bases of net assets acquired from a subsidiary.
Furthermore, deferred taxes arise from unused tax credits and tax loss carryforwards.
The Predecessor determines deferred tax assets and liabilities by applying the tax rates expected to beeffective for the period when the corresponding asset is realized or the liability is settled, based on tax rates andtax laws that had been enacted (or substantively enacted) by the statement of financial position date.
The carrying amount of deferred income tax assets is reviewed at each statement of financial position dateand reduced to the extent that it is no longer probable that sufficient taxable profit will be available to allow partor all of the deferred tax asset to be utilized. Unrecognized deferred income tax assets are reassessed at eachstatement of financial position date and are recognized to the extent that it has become probable that futuretaxable profit will allow the deferred tax asset to be recovered.
Deferred tax liabilities associated with investments in subsidiaries and branches are not recognized wherethe timing of the reversal of the temporary difference can be controlled by the parent company and it is notprobable that the temporary differences will reverse in the foreseeable future.
Deferred income tax relating to items directly recognized in equity is also recognized in equity. Deferred taxassets and liabilities resulting from business combinations are added to or deducted from goodwill.
Deferred tax assets and liabilities are offset only if a legally enforceable right exists to set off current taxassets against current income tax liabilities and the deferred income taxes relate to the same taxable entity and thesame taxation authority.
q) Revenue recognition
Revenue and expenses are recognized in the income statement on an accrual basis, i.e. when the goods orservices represented by them take place, regardless of when actual payment or collection occurs.
Revenue comprises the fair value of the consideration received or receivable for services rendered in thenormal course of the Predecessor’s activities. Revenue is presented net of sales taxes or value added taxes,
F-102
returns, allowances and discounts. Revenue is recognized when the amount of revenue can be reliably measured,it is probable that future economic benefits will flow to the entity and specific criteria have been met for thePredecessor’s activities as described below.
For sales of services, revenue is recognized in the accounting period in which the services are rendered, byreference to stage of completion of the specific transaction and assessed on the basis of the actual serviceprovided as a proportion of the total services to be provided, when the costs and revenue of the service contract,as well as its percentage of completion, can be reliably measured and it is probable that the related receivableswill be collected. When one or more elements of a service contract cannot be reliably measured, revenue isrecognized only to the extent of contract costs incurred that it is probable that will be recovered.
The Predecessor obtains revenue mainly from the provision of customer services, recognizing the revenuewhen the teleoperation occurs (based on the stage of completion of the service provided) or when certain contactcenter consulting work is carried out.
r) Expenses
Expenses are recognized in the income statement on an accrual basis; i.e. when the goods or servicesrepresented by them take place, regardless of when actual payment or collection occurs.
The Predecessor’s incorporation, start-up and research expenses, as well as expenses that do not qualify forcapitalization under IFRS, are recognized in the combined carve-out income statement when incurred andclassified in accordance with their nature.
s) Employee benefits
Pension Obligations
The Predecessor provides a pension plan for managers, which is deemed a defined contribution plan. Theplan is financed exclusively by the entity via contributions at a certain percentage of the executive’s fixedremunerations. These percentages vary depending on the employee’s professional category. The group has nolegal or constructive obligations to pay further contributions if the fund does not hold sufficient assets to pay allemployees the benefits relating to employee service in the current and prior periods.
For defined contribution plans, the group pays contributions to publicly or privately administered pensioninsurance plans on a mandatory, contractual or voluntary basis. The group has no further payment obligationsonce the contributions have been paid. The contributions are recognized as employee benefit expense as part of“Employee benefits expense” when they are due. Prepaid contributions are recognized as an asset to the extentthat a cash refund or a reduction in the future payments is available.
Termination benefits
Under current labor legislation, the companies are required to pay indemnities to employees whose contractsare terminated under certain conditions. Reasonably quantifiable severance indemnities are therefore recognizedas an expense in the year in which the decision to terminate the employment is made.
t) Use of estimates and management’s judgment
The key assumptions concerning the future and other key sources of estimation uncertainty at the statementof financial position date that have a significant risk of causing a material adjustment to the carrying amounts ofassets and liabilities within the next financial year are discussed below.
A significant change in the facts and circumstances on which these estimates are based could have amaterial impact on the Predecessor´s results and financial position.
Revenue Recognition
The Predecessor recognizes revenues on an accrual basis during the period in which the services arerendered, by reference to the stage of completion of the specific transaction and assessed on the basis of theactual service provided as a proportion of the total service to be provided, as described in Note 3 q) above.
F-103
Recognizing service revenue by reference to the stage of completion involves the use of estimates in relation tocertain key elements of the service contracts, such as contract costs, period of execution and allowances relatedto the contracts. As far as practicable the Predecessor applies past experience and specific quantitative indicatorsin its estimates, considering the specific circumstances applicable to specific customers or contracts. If certaincircumstances have occurred that may have an impact on the initially estimated revenue, costs or percentage ofcompletion, estimates are reviewed based on such circumstances. Such reviews may result in adjustments tocosts and revenue recognized for a period.
Property, plant and equipment, intangible assets and goodwill
The accounting treatment of property, plant and equipment and intangible assets entails the use of estimatesto determine their useful life for depreciation and amortization purposes and to assess fair value at theiracquisition date, especially significant in relation to assets acquired in business combinations.
Determining useful life requires making estimates in connection with future technological developments andalternative uses for assets. There is a significant element of judgment involved in making technologicaldevelopment assumptions, since the timing and scope of future technological advances are difficult to predict.
When an item of property, plant and equipment or an intangible asset is considered to be impaired, theimpairment loss is recognized in the income statement for the period. The decision to recognize an impairmentloss involves estimates of the timing and amount of the impairment, as well as analysis of the reasons for thepotential loss. Furthermore, additional factors, such as technological obsolescence, the suspension of certainservices and other circumstantial changes are taken into account.
The Predecessor evaluates the performance of its cash-generating units regularly to identify potentialimpairment of goodwill. Determining the recoverable amount of the cash-generating units to which goodwill isallocated also entails the use of assumptions and estimates and requires a significant element of judgment (seeNote 7).
Deferred taxes
The Predecessor assesses the recoverability of deferred tax assets based on estimates of future earnings. Theability to recover these taxes depends ultimately on the Predecessor’s ability to generate taxable earnings over theperiod for which the deferred tax assets remain deductible. This analysis is based on the estimated timing of thereversal of deferred tax liabilities, as well as estimates of taxable earnings, which are sourced from internalprojections and are continuously updated to reflect the latest trends.
The appropriate classification of tax assets and liabilities depends on a series of factors, including estimatesas to the timing and realization of deferred tax assets and the projected tax payment schedule. Actual income taxreceipts and payments could differ from the estimates made by the Predecessor as a result of changes in taxlegislation or unforeseen transactions that could affect tax balances. (see Note 18).
Provisions
Provisions are recognized when the Predecessor has a present obligation as a result of a past event, it isprobable that an outflow of resources will be required to settle the obligation and a reliable estimate can be madeof the amount of the obligation. This obligation may be legal or constructive, deriving, inter alia, fromregulations, contracts, customary practice or public commitments that lead third parties to reasonably expect thatthe Predecessor will assume certain responsibilities. The amount of the provision is determined based on the bestestimate of the outflow of resources required to settle the obligation, bearing in mind all available information atthe closing date, including the opinions of independent experts such as legal counsel or consultants.
No provision is recognized if the amount of liability cannot be estimated reliably. In this case, the relevantinformation is provided in the notes to the financial statements.
Given the uncertainties inherent in the estimates used to determine the amount of provisions, actual outflowsof resources may differ from the amounts recognized originally on the basis of the estimates. (see Note 17).
u) Combination method
The full consolidation method is applied to all combined entities. Under this method, all their assets,liabilities, revenues, expenses and cash flows are included in the combined carve-out financial statements after
F-104
the appropriate adjustments and eliminations of inter-group transactions. Combined entities are those in whichthe Predecessor owns more than half of the voting rights or has the ability to govern their financial and operatingpolicies.
In the case of combined entities whose adopted accounting policies and principles differ from those of thePredecessor, adjustments or restatements were made upon combination in order to present the combined carve-out financial statements on a uniform basis for adaptation to IFRS.
All material accounts and transactions between combined companies were eliminated on consolidation.
v) Non-controlling interests
Non-controlling interests represent the portion of profit and loss and net assets of the combined entities notheld by the Predecessor and are presented in the combined income statement and within equity in the combinedstatement of financial position, separately from the net parent investment (see Note 2). The Predecessor accountsfor transactions with non-controlling interests as transactions with equity owners. The difference between anyconsideration paid or received and relevant share of the carrying value of net assets acquired or sold, is recordedin the net parent investment.
w) New standards issued and early adopted as of November 30, 2012
The Predecessor opted for the early adoption of the following amendment issued by the IASB:
Standards and amendmentsEffective date—annualperiods beginning after:
IAS 1—Financial statement presentation . . . . . . . . . . . . . . . . . . . . . . . . . . . . . . . . . . July 1, 2012—earlyadoption permitted,
Regarding the presentation of (1) other comprehensive income and (2) thirdstatement of financial position without the related financial statement notes . . . .
January 1, 2013—earlyadoption permitted
x) New standards and IFRIC interpretations issued but not yet adopted as of November 30, 2012
A number of new standards and amendments to standards and interpretations are effective for annualperiods beginning after November 30, 2012, and have not been applied in preparing these combined carve-outfinancial statements. None of these are expected to have a significant effect on the combined carve-out financialstatements of the Predecessor, except the following:
Standard Reference TopicEffective date—annualperiods beginning after:
IFRS 9 . . . . . . . . . . Financial instruments January 1, 2015IFRS 10 . . . . . . . . . Consolidated financial statements January 1, 2013IFRS 11 . . . . . . . . . Joint arrangements January 1, 2013IFRS 12 . . . . . . . . . Disclosures of interests in other entities January 1, 2013IFRS 13 . . . . . . . . . Fair value measurement January 1, 2013IAS 19 . . . . . . . . . . Employee benefits January 1, 2013
With respect to such standards, the Predecessor has also evaluated its early application. The standards in thetable above have not been early adopted because the Predecessor has concluded that their impact to the combinedcarve-out financial statements is not significant.
There are no other IFRSs or IFRIC interpretations that are not yet effective that would be expected to havea material impact on the group.
F-105
4. COMBINED ENTITIES
The Predecessor´s combined entities at November 30, 2012 are as follows:
Registered nameRegistered
address Line of businessFunctionalcurrency
%interest(1) Holding company
Atento Teleservicios España, S.A.U. . . . . . . Madrid (Spain) Operation of callcenters
EUR 100 .
Atento Servicios Técnicos y Consultoría,S.L.U. . . . . . . . . . . . . . . . . . . . . . . . . . . . . . Madrid
(Spain)Execution oftechnological projectsand services, andconsulting services
EUR 100 Atento TeleserviciosEspaña S.A.U.
Atento Impulsa, S.L.U.(3) . . . . . . . . . . . . . . . Barcelona(Spain)
Management ofspecializedemployment centersfor disabled workers
EUR 100 Atento TeleserviciosEspaña S.A.U.
Contact US Teleservices Inc . . . . . . . . . . . . Houston—Texas(USA)
Operation of callcenters
USD 100 Atento Mexicana, S.A. deC.V.
Atento Brasil, S.A. . . . . . . . . . . . . . . . . . . . . Sao Paulo(Brazil)
Operation of callcenters
BRL 99.999 Atento N.V.
Teleatento del Perú, S.A.C. . . . . . . . . . . . . . Lima (Peru) Operation of callcenters
PEN 83.333316.6667
Atento N.V. AtentoHolding Chile, S.A.
Atento Colombia, S.A. . . . . . . . . . . . . . . . . . Bogota DC(Colombia)
Operation of callcenters
COP 94.978710.008540.004240.004245.00427
Atento N.V.Atento Venezuela, S.A.Atento Brasil, S.A.Teleatento del Perú,S.A.C.Atento Mexicana, S.A. deC.V.
Atento Holding Chile, S.A. . . . . . . . . . . . . . . Santiago de Chile(Chile)
Holding company CLP 99.9999 Atento N.V.
Centros de Contacto Salta, S.A. . . . . . . . . . Buenos Aires(Argentina)
Operation of callcenters
ARS 955
Atento Holding Chile,S.A. Atento N.V.
Mar del Plata Gestiones y Contactos,S.A. . . . . . . . . . . . . . . . . . . . . . . . . . . . . . . . Buenos Aires
(Argentina)Operation of callcenters
ARS 955
Atento Holding Chile,S.A. Atento N.V.
Microcentro de Contacto, S.A. . . . . . . . . . . Buenos Aires(Argentina)
Operation of callcenters
ARS 955
Atento HoldingChile, S.A.Atento N.V.
Córdoba Gestiones y Contactos, S.A. . . . . . Cordoba(Argentina)
Operation of callcenters
ARS 955
Atento HoldingChile, S.A.Atento N.V.
Atusa, S.A. . . . . . . . . . . . . . . . . . . . . . . . . . . . Buenos Aires(Argentina)
Operation of callcenters
ARS 595
Atento HoldingChile, S.A.Atento N.V.
Atento Chile, S.A.(2) . . . . . . . . . . . . . . . . . . . Santiago de Chile(Chile)
Operation of callcenters
CLP 71.16 Atento HoldingChile, S.A.
Atento Educación Limitada . . . . . . . . . . . . . Santiago de Chile(Chile)
Operation of callcenters
CLP 991
Atento Chile, S.A.Atento HoldingChile, S.A.
Atento Centro de Formación TécnicaLimitada(4) . . . . . . . . . . . . . . . . . . . . . . . . . Santiago de Chile
(Chile)Operation of callcenters
CLP 991
Atento Chile, S.A.Atento HoldingChile, S.A.
Atento Argentina, S.A. . . . . . . . . . . . . . . . . . Buenos Aires(Argentina)
Operation of callcenters
ARS 24.4475.56
Atento N.V.Atento HoldingChile, S.A.
Atento Puerto Rico, Inc. . . . . . . . . . . . . . . . . Guaynabo(Puerto Rico)
Operation of callcenters
USD 100 Atento N.V.
Atento Mexicana, S.A. de C.V. . . . . . . . . . . Mexico City(Mexico)
Operation of callcenters
MXN 99.9999980.000002
Atento N.V.Atento Colombia, S.A.
Atento Servicios, S.A. de C.V. . . . . . . . . . . . Mexico City(Mexico)
Sale of goods andservices
MXN 99.99950.0005
Atento Mexicana, S.A. deC.V.Atento N.V.
Atento Atención y Servicios, S.A. deC.V. . . . . . . . . . . . . . . . . . . . . . . . . . . . . . . Mexico City
(Mexico)Administrative,professional andconsulting services
MXN 99.9980.002
Atento Mexicana, S.A. deC.V.Atento Servicios, S. A. deC.V.
Atento Centroamérica, S.A. . . . . . . . . . . . . . Guatemala(Guatemala)
Holding company GTQ 99.99990.0001
Atento N.V.Atento El Salvador S.A.de C.V.
F-106
Registered nameRegistered
address Line of businessFunctionalcurrency
%interest(1) Holding company
Atento de Guatemala, S.A. . . . . . . . . . . . . . . Guatemala(Guatemala)
Operation of callcenters
GTQ 99.999990.00001
AtentoCentroamérica. S.A.Atento El Salvador S.A.de C.V.
Atento El Salvador, S.A. de C.V. . . . . . . . . . City of SanSalvador(El Salvador)
Operation of callcenters
USD 7.405492.5946
Atento Centroamerica,S.A.Atento de Guatemala,S.A.
Atento Maroc, S.A. . . . . . . . . . . . . . . . . . . . . Casablanca(Morocco)
Operation of callcenters
MAD 99.9991 Atento TeleserviciosEspaña S.A.U.
Woknal, S.A. . . . . . . . . . . . . . . . . . . . . . . . . . . Montevideo(Uruguay)
Operation of callcenters
UYU 100 Atento N.V.
Atento Ceská Republika, a.s. . . . . . . . . . . . . Prague (CzechRepublic)
Telemarketing andother financial andbusiness services
CZK 100 Atento Inversiones yTeleservicios, S.A.U.
Atento Panamá, S.A. . . . . . . . . . . . . . . . . . . . Panama City Operation of callcenters
USD 991
Atento N.V.Atento Mexicana, S.A. deC.V.
(1) Shareholdings with voting rights.(2) The remaining 28.84% interest is owned by Telefónica CTC Chile (27.41%), Compañía de Teléfonos
Transmisiones Regionales S.A (0.47%) and Telefónica Empresas S.A. (0.96%).
Changes in the combined entities
In 2011, Atento Italia S.R.L. was liquidated for failing to conduct business. The business dissolution requestwas filed with the Italian Chamber of Commerce on August 25, 2010. On October 14, 2011, a court ruling wasissued in favor of the Predecessor over a labor suit filed by a former company employee. As a result, thecompany’s assets and liabilities were liquidated and returned to the sole shareholder (Atento, N.V.) at the end of2011.
On March 2, 2012, the company Atento Servicios Auxiliares de Contact Center, S.L was registered with theMercantile Register of Madrid.
There were also the following changes to the combined entities’ equity:
• On February 28, 2011, Atento, N.V. subscribed in full to the equity issue undertaken by Woknal,establishing a share premium of 400,000 Uruguayan pesos, remaining as the company’s soleshareholder.
• On December 20, 2011, this company carried out another equity issue, for 30,250,000 Uruguayanpesos, with Atento, N.V. again remaining as its sole shareholder.
• On December 22, 2011, Atento Argentina’s capital increased by 1,000,000 Argentinean pesos in atransaction carried out by Atento, N.V., which is now a shareholder.
There were no other changes in the combined entities in 2012.
5. FINANCIAL RISK MANAGEMENT POLICY
Financial risk factors
The Predecessor´s activities expose it to a variety of financial risks: market risk (including currency risk,fair value interest rate risk, cash flow interest rate risk and price risk), credit risk and liquidity risk. ThePredecessor´s overall risk management strategy focuses on the unpredictability of financial markets and seeks tominimize potential adverse effects on the entity’s financial performance. The Predecessor uses derivatives tolimit both interest and foreign currency risks on otherwise unhedged positions and to adapt its debt structure tomarket conditions.
Risk management is carried out by the finance department under policies approved by the respectivecorporate governance bodies. The finance department identifies, evaluates and hedges financial risks in closecooperation with the operating units.
F-107
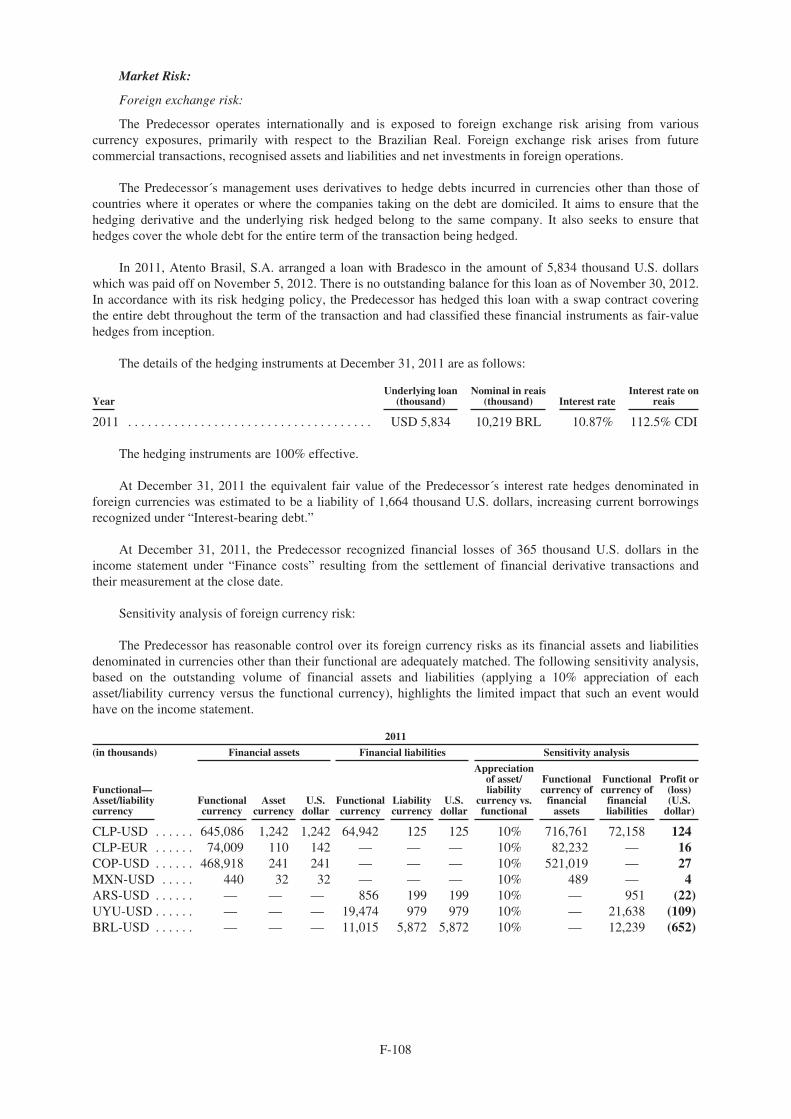
Market Risk:
Foreign exchange risk:
The Predecessor operates internationally and is exposed to foreign exchange risk arising from variouscurrency exposures, primarily with respect to the Brazilian Real. Foreign exchange risk arises from futurecommercial transactions, recognised assets and liabilities and net investments in foreign operations.
The Predecessor´s management uses derivatives to hedge debts incurred in currencies other than those ofcountries where it operates or where the companies taking on the debt are domiciled. It aims to ensure that thehedging derivative and the underlying risk hedged belong to the same company. It also seeks to ensure thathedges cover the whole debt for the entire term of the transaction being hedged.
In 2011, Atento Brasil, S.A. arranged a loan with Bradesco in the amount of 5,834 thousand U.S. dollarswhich was paid off on November 5, 2012. There is no outstanding balance for this loan as of November 30, 2012.In accordance with its risk hedging policy, the Predecessor has hedged this loan with a swap contract coveringthe entire debt throughout the term of the transaction and had classified these financial instruments as fair-valuehedges from inception.
The details of the hedging instruments at December 31, 2011 are as follows:
YearUnderlying loan
(thousand)Nominal in reais
(thousand) Interest rateInterest rate on
reais
2011 . . . . . . . . . . . . . . . . . . . . . . . . . . . . . . . . . . . . . USD 5,834 10,219 BRL 10.87% 112.5% CDI
The hedging instruments are 100% effective.
At December 31, 2011 the equivalent fair value of the Predecessor´s interest rate hedges denominated inforeign currencies was estimated to be a liability of 1,664 thousand U.S. dollars, increasing current borrowingsrecognized under “Interest-bearing debt.”
At December 31, 2011, the Predecessor recognized financial losses of 365 thousand U.S. dollars in theincome statement under “Finance costs” resulting from the settlement of financial derivative transactions andtheir measurement at the close date.
Sensitivity analysis of foreign currency risk:
The Predecessor has reasonable control over its foreign currency risks as its financial assets and liabilitiesdenominated in currencies other than their functional are adequately matched. The following sensitivity analysis,based on the outstanding volume of financial assets and liabilities (applying a 10% appreciation of eachasset/liability currency versus the functional currency), highlights the limited impact that such an event wouldhave on the income statement.
2011
(in thousands) Financial assets Financial liabilities Sensitivity analysis
Functional—Asset/liabilitycurrency
Functionalcurrency
Assetcurrency
U.S.dollar
Functionalcurrency
Liabilitycurrency
U.S.dollar
Appreciationof asset/liability
currency vs.functional
Functionalcurrency of
financialassets
Functionalcurrency of
financialliabilities
Profit or(loss)(U.S.
dollar)
CLP-USD . . . . . . 645,086 1,242 1,242 64,942 125 125 10% 716,761 72,158 124CLP-EUR . . . . . . 74,009 110 142 — — — 10% 82,232 — 16COP-USD . . . . . . 468,918 241 241 — — — 10% 521,019 — 27MXN-USD . . . . . 440 32 32 — — — 10% 489 — 4ARS-USD . . . . . . — — — 856 199 199 10% — 951 (22)UYU-USD . . . . . . — — — 19,474 979 979 10% — 21,638 (109)BRL-USD . . . . . . — — — 11,015 5,872 5,872 10% — 12,239 (652)
F-108
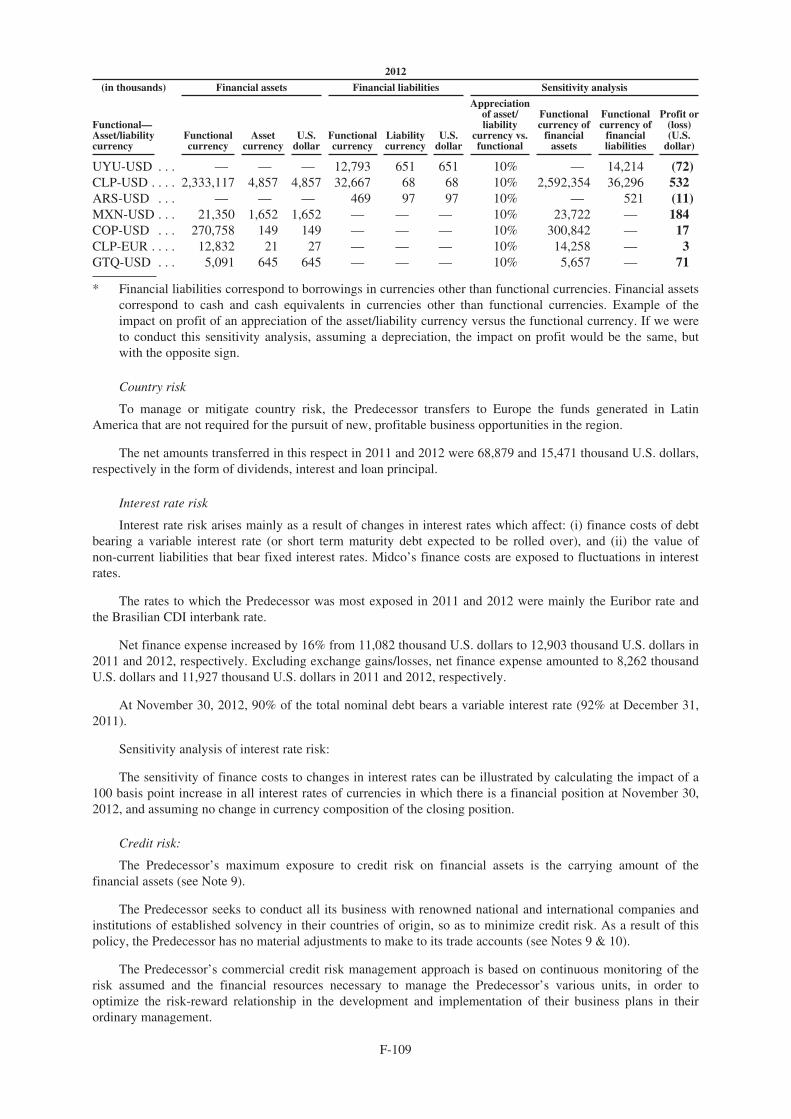
2012
(in thousands) Financial assets Financial liabilities Sensitivity analysis
Functional—Asset/liabilitycurrency
Functionalcurrency
Assetcurrency
U.S.dollar
Functionalcurrency
Liabilitycurrency
U.S.dollar
Appreciationof asset/liability
currency vs.functional
Functionalcurrency of
financialassets
Functionalcurrency of
financialliabilities
Profit or(loss)(U.S.
dollar)
UYU-USD . . . — — — 12,793 651 651 10% — 14,214 (72)CLP-USD . . . . 2,333,117 4,857 4,857 32,667 68 68 10% 2,592,354 36,296 532ARS-USD . . . — — — 469 97 97 10% — 521 (11)MXN-USD . . . 21,350 1,652 1,652 — — — 10% 23,722 — 184COP-USD . . . 270,758 149 149 — — — 10% 300,842 — 17CLP-EUR . . . . 12,832 21 27 — — — 10% 14,258 — 3GTQ-USD . . . 5,091 645 645 — — — 10% 5,657 — 71
* Financial liabilities correspond to borrowings in currencies other than functional currencies. Financial assetscorrespond to cash and cash equivalents in currencies other than functional currencies. Example of theimpact on profit of an appreciation of the asset/liability currency versus the functional currency. If we wereto conduct this sensitivity analysis, assuming a depreciation, the impact on profit would be the same, butwith the opposite sign.
Country risk
To manage or mitigate country risk, the Predecessor transfers to Europe the funds generated in LatinAmerica that are not required for the pursuit of new, profitable business opportunities in the region.
The net amounts transferred in this respect in 2011 and 2012 were 68,879 and 15,471 thousand U.S. dollars,respectively in the form of dividends, interest and loan principal.
Interest rate risk
Interest rate risk arises mainly as a result of changes in interest rates which affect: (i) finance costs of debtbearing a variable interest rate (or short term maturity debt expected to be rolled over), and (ii) the value ofnon-current liabilities that bear fixed interest rates. Midco’s finance costs are exposed to fluctuations in interestrates.
The rates to which the Predecessor was most exposed in 2011 and 2012 were mainly the Euribor rate andthe Brasilian CDI interbank rate.
Net finance expense increased by 16% from 11,082 thousand U.S. dollars to 12,903 thousand U.S. dollars in2011 and 2012, respectively. Excluding exchange gains/losses, net finance expense amounted to 8,262 thousandU.S. dollars and 11,927 thousand U.S. dollars in 2011 and 2012, respectively.
At November 30, 2012, 90% of the total nominal debt bears a variable interest rate (92% at December 31,2011).
Sensitivity analysis of interest rate risk:
The sensitivity of finance costs to changes in interest rates can be illustrated by calculating the impact of a100 basis point increase in all interest rates of currencies in which there is a financial position at November 30,2012, and assuming no change in currency composition of the closing position.
Credit risk:
The Predecessor’s maximum exposure to credit risk on financial assets is the carrying amount of thefinancial assets (see Note 9).
The Predecessor seeks to conduct all its business with renowned national and international companies andinstitutions of established solvency in their countries of origin, so as to minimize credit risk. As a result of thispolicy, the Predecessor has no material adjustments to make to its trade accounts (see Notes 9 & 10).
The Predecessor’s commercial credit risk management approach is based on continuous monitoring of therisk assumed and the financial resources necessary to manage the Predecessor’s various units, in order tooptimize the risk-reward relationship in the development and implementation of their business plans in theirordinary management.
F-109

Credit risk arising from cash and cash equivalents is managed by placing cash surpluses in high quality andhighly liquid money-market assets. These placements are regulated by a Master Agreement which is revisedannually based on conditions of the market and countries where the Predecessor operates. The Master Agreementsets: (i) the maximum amounts to be invested by counterparty based on their ratings (long- and short-term debtrating); (ii) the maximum period of the investment; and (iii) the instruments in which the surpluses may beinvested.
The Predecessor’s maximum exposure to credit risk is primarily represented by the carrying amounts of itsfinancial assets.
Liquidity risk:
The Predecessor seeks to match its debt maturity schedule to its capacity to generate cash flows to meet thepayments falling due, factoring in a degree of cushion. In practice, this has meant that the Predecessor’s debtmaturity must be longer than the length of time required to pay its debt (assuming that internal projections aremet).
At December 31, 2011, and November 30, 2012, the average term to maturity of the Predecessor’s grossfinancial debt (126,960 thousand U.S. dollars and 90,462 thousand U.S. dollars, respectively) was 3.42 and1.88 years, respectively. At the same dates, current financial assets and cash and cash equivalents totalled106,480 thousand U.S. dollars and 85,858 thousand U.S. dollars, respectively, sufficient to enable thePredecessor to service its payables in accordance with the maturity schedule.
Capital Management:
The Predecessor’s finance department, which is in charge of capital management, takes into considerationseveral factors when determining the Predecessor’s capital structure, with the aim of ensuring sustainability ofthe business and maximizing the value to shareholders. The Predecessor monitors its cost of capital with a goalof optimizing its capital structure. In order to do this, the Predecessor monitors the financial markets and updatesto standard industry approaches for calculating weighted average cost of capital, or WACC.
These general principles are refined by other considerations and the application of specific variables, such ascountry risk in the broadest sense, or the volatility in cash flow generation, when determining the Predecessorfinancial structure. Considering the nature of these combined carve-out financial statements described in Note 1,no specific ratio related to capital management has been presented.
Fair value estimation:
The table below analyses financial instruments carried at fair value, by valuation method. The differentlevels have been defined as follows:
• Quoted prices (unadjusted) in active markets for identical assets or liabilities (Level 1).
• Inputs other than quoted prices included within level 1 that are observable for the asset or liability,either directly (that is, as prices) or indirectly (that is, derived from prices) (Level 2).
• Inputs for the asset or liability that are not based on observable market data (that is, unobservableinputs) (Level 3).
The following table presents the group’s assets and liabilities that are measured at fair value at 31 December2011.
Thousands of U.S. dollars
Level 1 Level 2 Level 3 Total
AssetsDerivatives (Note 9) . . . . . . . . . . . . . . . . . . . . . . . . . . . . . . . . . . . . — 449 — 449
Total assets . . . . . . . . . . . . . . . . . . . . . . . . . . . . . . . . . . . . . . . . . . — 449 — 449
LiabilitiesDerivatives (Note 13) . . . . . . . . . . . . . . . . . . . . . . . . . . . . . . . . . . . — 2 — 2
Total liabilities . . . . . . . . . . . . . . . . . . . . . . . . . . . . . . . . . . . . . . . — 2 — 2
F-110
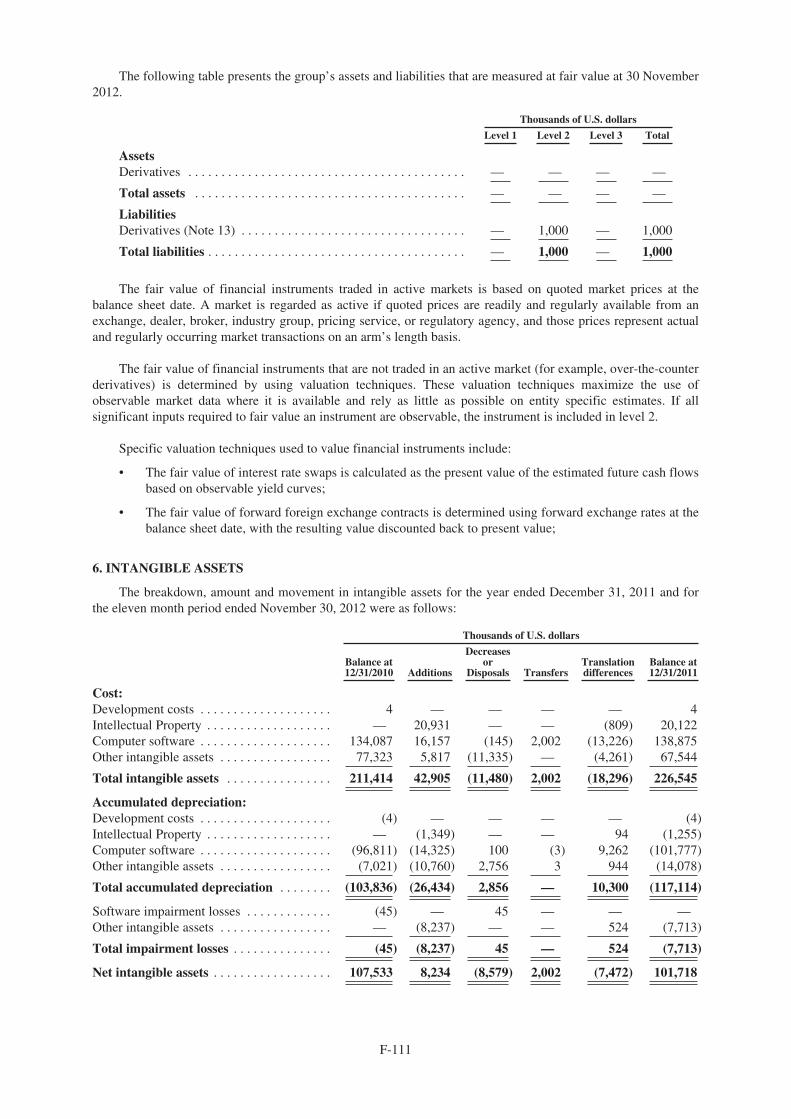
The following table presents the group’s assets and liabilities that are measured at fair value at 30 November2012.
Thousands of U.S. dollars
Level 1 Level 2 Level 3 Total
AssetsDerivatives . . . . . . . . . . . . . . . . . . . . . . . . . . . . . . . . . . . . . . . . . . — — — —
Total assets . . . . . . . . . . . . . . . . . . . . . . . . . . . . . . . . . . . . . . . . . — — — —
LiabilitiesDerivatives (Note 13) . . . . . . . . . . . . . . . . . . . . . . . . . . . . . . . . . . — 1,000 — 1,000
Total liabilities . . . . . . . . . . . . . . . . . . . . . . . . . . . . . . . . . . . . . . . — 1,000 — 1,000
The fair value of financial instruments traded in active markets is based on quoted market prices at thebalance sheet date. A market is regarded as active if quoted prices are readily and regularly available from anexchange, dealer, broker, industry group, pricing service, or regulatory agency, and those prices represent actualand regularly occurring market transactions on an arm’s length basis.
The fair value of financial instruments that are not traded in an active market (for example, over-the-counterderivatives) is determined by using valuation techniques. These valuation techniques maximize the use ofobservable market data where it is available and rely as little as possible on entity specific estimates. If allsignificant inputs required to fair value an instrument are observable, the instrument is included in level 2.
Specific valuation techniques used to value financial instruments include:
• The fair value of interest rate swaps is calculated as the present value of the estimated future cash flowsbased on observable yield curves;
• The fair value of forward foreign exchange contracts is determined using forward exchange rates at thebalance sheet date, with the resulting value discounted back to present value;
6. INTANGIBLE ASSETS
The breakdown, amount and movement in intangible assets for the year ended December 31, 2011 and forthe eleven month period ended November 30, 2012 were as follows:
Thousands of U.S. dollars
Balance at12/31/2010 Additions
Decreasesor
Disposals TransfersTranslationdifferences
Balance at12/31/2011
Cost:Development costs . . . . . . . . . . . . . . . . . . . . 4 — — — — 4Intellectual Property . . . . . . . . . . . . . . . . . . . — 20,931 — — (809) 20,122Computer software . . . . . . . . . . . . . . . . . . . . 134,087 16,157 (145) 2,002 (13,226) 138,875Other intangible assets . . . . . . . . . . . . . . . . . 77,323 5,817 (11,335) — (4,261) 67,544
Total intangible assets . . . . . . . . . . . . . . . . 211,414 42,905 (11,480) 2,002 (18,296) 226,545
Accumulated depreciation:Development costs . . . . . . . . . . . . . . . . . . . . (4) — — — — (4)Intellectual Property . . . . . . . . . . . . . . . . . . . — (1,349) — — 94 (1,255)Computer software . . . . . . . . . . . . . . . . . . . . (96,811) (14,325) 100 (3) 9,262 (101,777)Other intangible assets . . . . . . . . . . . . . . . . . (7,021) (10,760) 2,756 3 944 (14,078)
Total accumulated depreciation . . . . . . . . (103,836) (26,434) 2,856 — 10,300 (117,114)
Software impairment losses . . . . . . . . . . . . . (45) — 45 — — —Other intangible assets . . . . . . . . . . . . . . . . . — (8,237) — — 524 (7,713)
Total impairment losses . . . . . . . . . . . . . . . (45) (8,237) 45 — 524 (7,713)
Net intangible assets . . . . . . . . . . . . . . . . . . 107,533 8,234 (8,579) 2,002 (7,472) 101,718
F-111
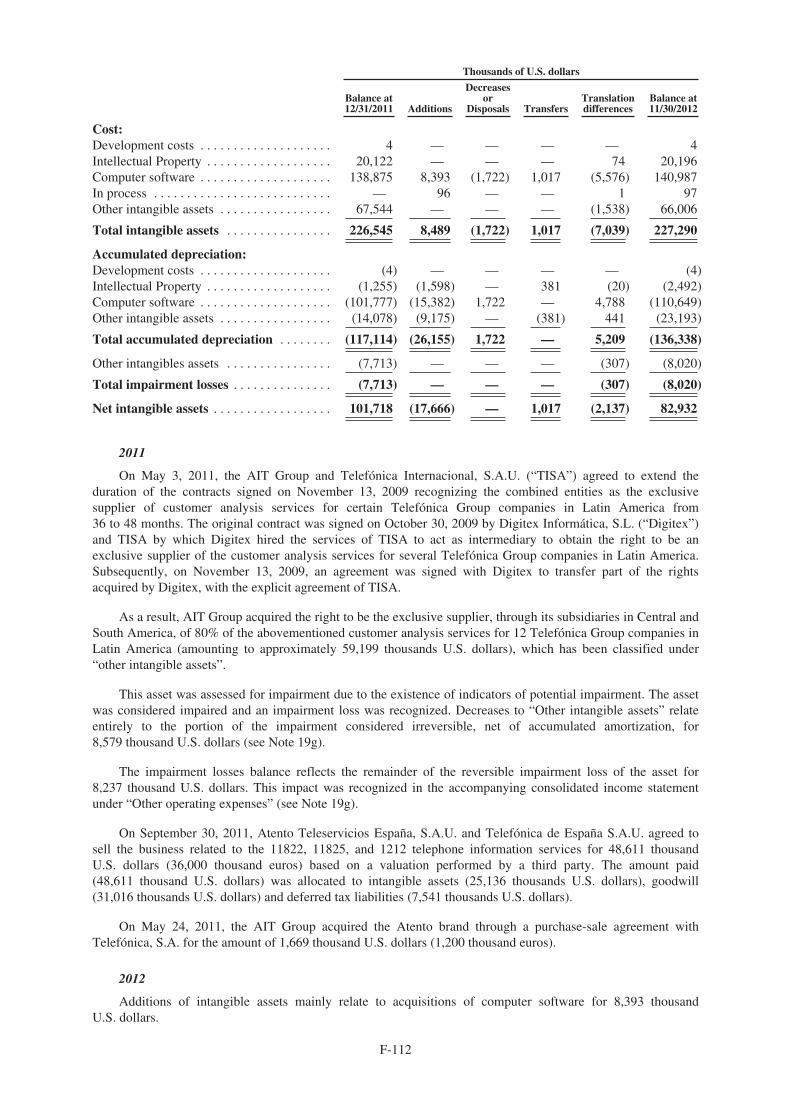
Thousands of U.S. dollars
Balance at12/31/2011 Additions
Decreasesor
Disposals TransfersTranslationdifferences
Balance at11/30/2012
Cost:Development costs . . . . . . . . . . . . . . . . . . . . 4 — — — — 4Intellectual Property . . . . . . . . . . . . . . . . . . . 20,122 — — — 74 20,196Computer software . . . . . . . . . . . . . . . . . . . . 138,875 8,393 (1,722) 1,017 (5,576) 140,987In process . . . . . . . . . . . . . . . . . . . . . . . . . . . — 96 — — 1 97Other intangible assets . . . . . . . . . . . . . . . . . 67,544 — — — (1,538) 66,006
Total intangible assets . . . . . . . . . . . . . . . . 226,545 8,489 (1,722) 1,017 (7,039) 227,290
Accumulated depreciation:Development costs . . . . . . . . . . . . . . . . . . . . (4) — — — — (4)Intellectual Property . . . . . . . . . . . . . . . . . . . (1,255) (1,598) — 381 (20) (2,492)Computer software . . . . . . . . . . . . . . . . . . . . (101,777) (15,382) 1,722 — 4,788 (110,649)Other intangible assets . . . . . . . . . . . . . . . . . (14,078) (9,175) — (381) 441 (23,193)
Total accumulated depreciation . . . . . . . . (117,114) (26,155) 1,722 — 5,209 (136,338)
Other intangibles assets . . . . . . . . . . . . . . . . (7,713) — — — (307) (8,020)
Total impairment losses . . . . . . . . . . . . . . . (7,713) — — — (307) (8,020)
Net intangible assets . . . . . . . . . . . . . . . . . . 101,718 (17,666) — 1,017 (2,137) 82,932
2011
On May 3, 2011, the AIT Group and Telefónica Internacional, S.A.U. (“TISA”) agreed to extend theduration of the contracts signed on November 13, 2009 recognizing the combined entities as the exclusivesupplier of customer analysis services for certain Telefónica Group companies in Latin America from36 to 48 months. The original contract was signed on October 30, 2009 by Digitex Informática, S.L. (“Digitex”)and TISA by which Digitex hired the services of TISA to act as intermediary to obtain the right to be anexclusive supplier of the customer analysis services for several Telefónica Group companies in Latin America.Subsequently, on November 13, 2009, an agreement was signed with Digitex to transfer part of the rightsacquired by Digitex, with the explicit agreement of TISA.
As a result, AIT Group acquired the right to be the exclusive supplier, through its subsidiaries in Central andSouth America, of 80% of the abovementioned customer analysis services for 12 Telefónica Group companies inLatin America (amounting to approximately 59,199 thousands U.S. dollars), which has been classified under“other intangible assets”.
This asset was assessed for impairment due to the existence of indicators of potential impairment. The assetwas considered impaired and an impairment loss was recognized. Decreases to “Other intangible assets” relateentirely to the portion of the impairment considered irreversible, net of accumulated amortization, for8,579 thousand U.S. dollars (see Note 19g).
The impairment losses balance reflects the remainder of the reversible impairment loss of the asset for8,237 thousand U.S. dollars. This impact was recognized in the accompanying consolidated income statementunder “Other operating expenses” (see Note 19g).
On September 30, 2011, Atento Teleservicios España, S.A.U. and Telefónica de España S.A.U. agreed tosell the business related to the 11822, 11825, and 1212 telephone information services for 48,611 thousandU.S. dollars (36,000 thousand euros) based on a valuation performed by a third party. The amount paid(48,611 thousand U.S. dollars) was allocated to intangible assets (25,136 thousands U.S. dollars), goodwill(31,016 thousands U.S. dollars) and deferred tax liabilities (7,541 thousands U.S. dollars).
On May 24, 2011, the AIT Group acquired the Atento brand through a purchase-sale agreement withTelefónica, S.A. for the amount of 1,669 thousand U.S. dollars (1,200 thousand euros).
2012
Additions of intangible assets mainly relate to acquisitions of computer software for 8,393 thousandU.S. dollars.
F-112
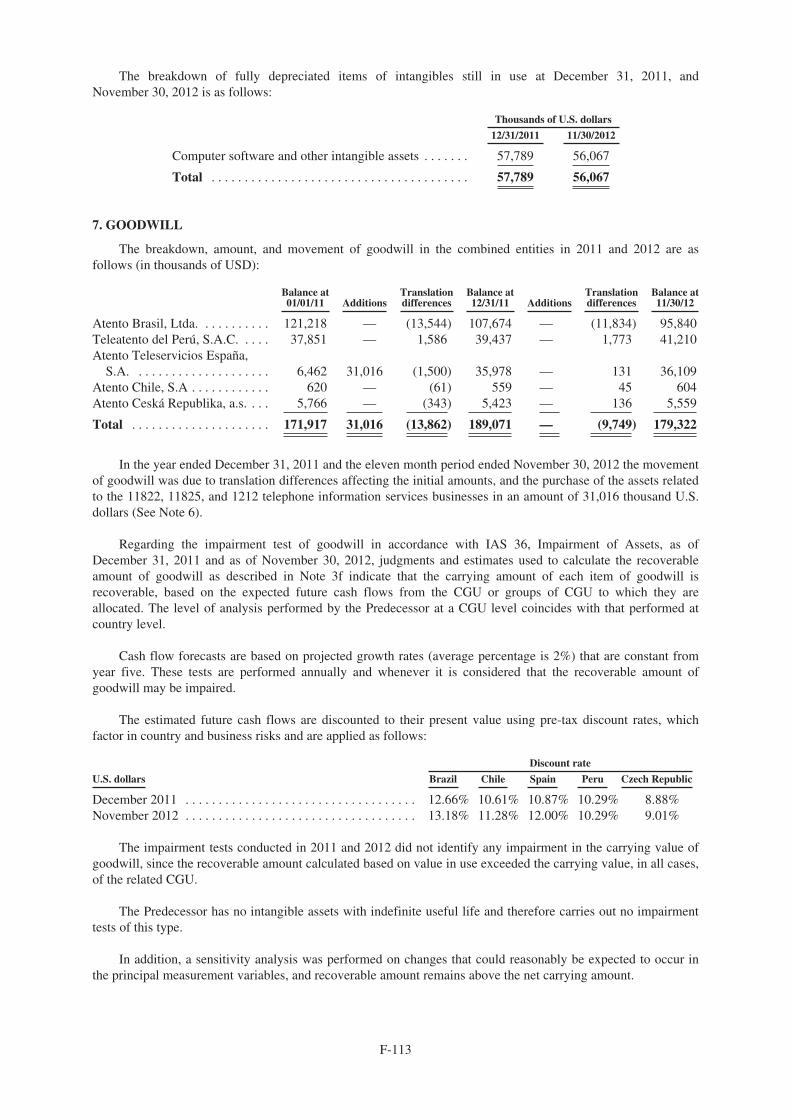
The breakdown of fully depreciated items of intangibles still in use at December 31, 2011, andNovember 30, 2012 is as follows:
Thousands of U.S. dollars
12/31/2011 11/30/2012
Computer software and other intangible assets . . . . . . . 57,789 56,067
Total . . . . . . . . . . . . . . . . . . . . . . . . . . . . . . . . . . . . . . . 57,789 56,067
7. GOODWILL
The breakdown, amount, and movement of goodwill in the combined entities in 2011 and 2012 are asfollows (in thousands of USD):
Balance at01/01/11 Additions
Translationdifferences
Balance at12/31/11 Additions
Translationdifferences
Balance at11/30/12
Atento Brasil, Ltda. . . . . . . . . . . 121,218 — (13,544) 107,674 — (11,834) 95,840Teleatento del Perú, S.A.C. . . . . 37,851 — 1,586 39,437 — 1,773 41,210Atento Teleservicios España,
S.A. . . . . . . . . . . . . . . . . . . . . 6,462 31,016 (1,500) 35,978 — 131 36,109Atento Chile, S.A . . . . . . . . . . . . 620 — (61) 559 — 45 604Atento Ceská Republika, a.s. . . . 5,766 — (343) 5,423 — 136 5,559
Total . . . . . . . . . . . . . . . . . . . . . 171,917 31,016 (13,862) 189,071 — (9,749) 179,322
In the year ended December 31, 2011 and the eleven month period ended November 30, 2012 the movementof goodwill was due to translation differences affecting the initial amounts, and the purchase of the assets relatedto the 11822, 11825, and 1212 telephone information services businesses in an amount of 31,016 thousand U.S.dollars (See Note 6).
Regarding the impairment test of goodwill in accordance with IAS 36, Impairment of Assets, as ofDecember 31, 2011 and as of November 30, 2012, judgments and estimates used to calculate the recoverableamount of goodwill as described in Note 3f indicate that the carrying amount of each item of goodwill isrecoverable, based on the expected future cash flows from the CGU or groups of CGU to which they areallocated. The level of analysis performed by the Predecessor at a CGU level coincides with that performed atcountry level.
Cash flow forecasts are based on projected growth rates (average percentage is 2%) that are constant fromyear five. These tests are performed annually and whenever it is considered that the recoverable amount ofgoodwill may be impaired.
The estimated future cash flows are discounted to their present value using pre-tax discount rates, whichfactor in country and business risks and are applied as follows:
Discount rate
U.S. dollars Brazil Chile Spain Peru Czech Republic
December 2011 . . . . . . . . . . . . . . . . . . . . . . . . . . . . . . . . . . . 12.66% 10.61% 10.87% 10.29% 8.88%November 2012 . . . . . . . . . . . . . . . . . . . . . . . . . . . . . . . . . . . 13.18% 11.28% 12.00% 10.29% 9.01%
The impairment tests conducted in 2011 and 2012 did not identify any impairment in the carrying value ofgoodwill, since the recoverable amount calculated based on value in use exceeded the carrying value, in all cases,of the related CGU.
The Predecessor has no intangible assets with indefinite useful life and therefore carries out no impairmenttests of this type.
In addition, a sensitivity analysis was performed on changes that could reasonably be expected to occur inthe principal measurement variables, and recoverable amount remains above the net carrying amount.
F-113
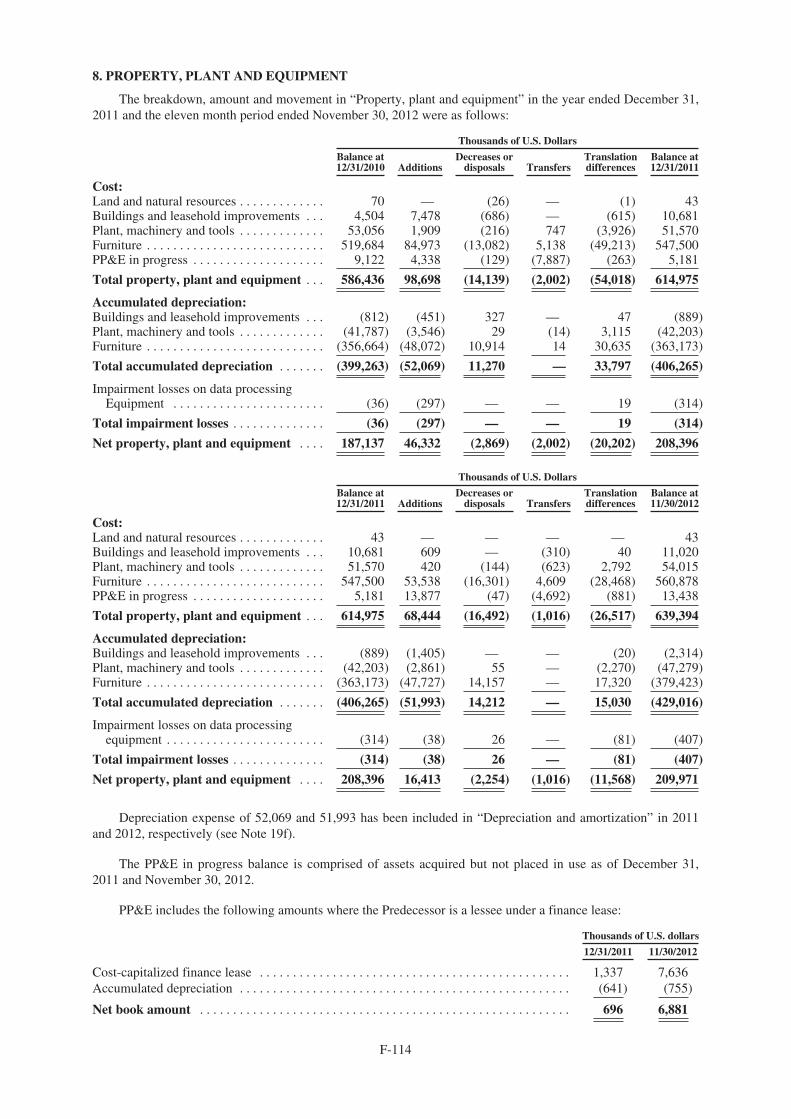
8. PROPERTY, PLANT AND EQUIPMENT
The breakdown, amount and movement in “Property, plant and equipment” in the year ended December 31,2011 and the eleven month period ended November 30, 2012 were as follows:
Thousands of U.S. Dollars
Balance at12/31/2010 Additions
Decreases ordisposals Transfers
Translationdifferences
Balance at12/31/2011
Cost:Land and natural resources . . . . . . . . . . . . . 70 — (26) — (1) 43Buildings and leasehold improvements . . . 4,504 7,478 (686) — (615) 10,681Plant, machinery and tools . . . . . . . . . . . . . 53,056 1,909 (216) 747 (3,926) 51,570Furniture . . . . . . . . . . . . . . . . . . . . . . . . . . . 519,684 84,973 (13,082) 5,138 (49,213) 547,500PP&E in progress . . . . . . . . . . . . . . . . . . . . 9,122 4,338 (129) (7,887) (263) 5,181
Total property, plant and equipment . . . 586,436 98,698 (14,139) (2,002) (54,018) 614,975
Accumulated depreciation:Buildings and leasehold improvements . . . (812) (451) 327 — 47 (889)Plant, machinery and tools . . . . . . . . . . . . . (41,787) (3,546) 29 (14) 3,115 (42,203)Furniture . . . . . . . . . . . . . . . . . . . . . . . . . . . (356,664) (48,072) 10,914 14 30,635 (363,173)
Total accumulated depreciation . . . . . . . (399,263) (52,069) 11,270 — 33,797 (406,265)
Impairment losses on data processingEquipment . . . . . . . . . . . . . . . . . . . . . . . (36) (297) — — 19 (314)
Total impairment losses . . . . . . . . . . . . . . (36) (297) — — 19 (314)
Net property, plant and equipment . . . . 187,137 46,332 (2,869) (2,002) (20,202) 208,396
Thousands of U.S. Dollars
Balance at12/31/2011 Additions
Decreases ordisposals Transfers
Translationdifferences
Balance at11/30/2012
Cost:Land and natural resources . . . . . . . . . . . . . 43 — — — — 43Buildings and leasehold improvements . . . 10,681 609 — (310) 40 11,020Plant, machinery and tools . . . . . . . . . . . . . 51,570 420 (144) (623) 2,792 54,015Furniture . . . . . . . . . . . . . . . . . . . . . . . . . . . 547,500 53,538 (16,301) 4,609 (28,468) 560,878PP&E in progress . . . . . . . . . . . . . . . . . . . . 5,181 13,877 (47) (4,692) (881) 13,438
Total property, plant and equipment . . . 614,975 68,444 (16,492) (1,016) (26,517) 639,394
Accumulated depreciation:Buildings and leasehold improvements . . . (889) (1,405) — — (20) (2,314)Plant, machinery and tools . . . . . . . . . . . . . (42,203) (2,861) 55 — (2,270) (47,279)Furniture . . . . . . . . . . . . . . . . . . . . . . . . . . . (363,173) (47,727) 14,157 — 17,320 (379,423)
Total accumulated depreciation . . . . . . . (406,265) (51,993) 14,212 — 15,030 (429,016)
Impairment losses on data processingequipment . . . . . . . . . . . . . . . . . . . . . . . . (314) (38) 26 — (81) (407)
Total impairment losses . . . . . . . . . . . . . . (314) (38) 26 — (81) (407)
Net property, plant and equipment . . . . 208,396 16,413 (2,254) (1,016) (11,568) 209,971
Depreciation expense of 52,069 and 51,993 has been included in “Depreciation and amortization” in 2011and 2012, respectively (see Note 19f).
The PP&E in progress balance is comprised of assets acquired but not placed in use as of December 31,2011 and November 30, 2012.
PP&E includes the following amounts where the Predecessor is a lessee under a finance lease:
Thousands of U.S. dollars
12/31/2011 11/30/2012
Cost-capitalized finance lease . . . . . . . . . . . . . . . . . . . . . . . . . . . . . . . . . . . . . . . . . . . . . . . 1,337 7,636Accumulated depreciation . . . . . . . . . . . . . . . . . . . . . . . . . . . . . . . . . . . . . . . . . . . . . . . . . . (641) (755)
Net book amount . . . . . . . . . . . . . . . . . . . . . . . . . . . . . . . . . . . . . . . . . . . . . . . . . . . . . . . . 696 6,881
F-114
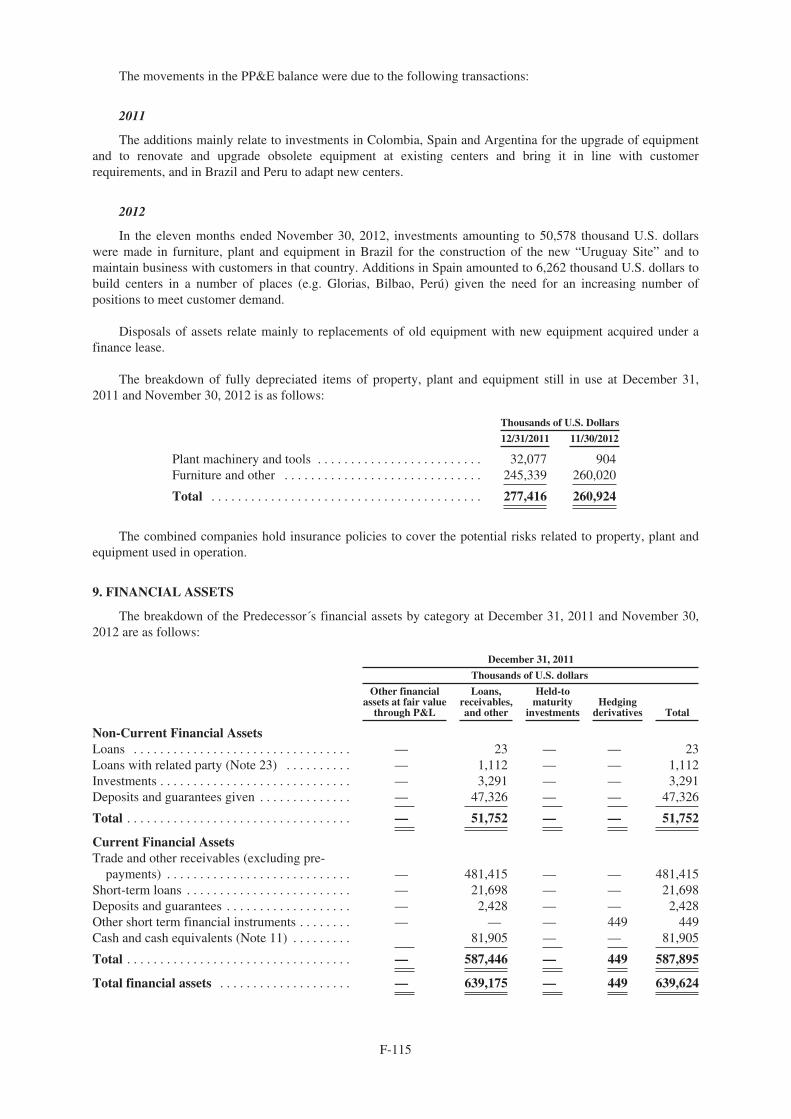
The movements in the PP&E balance were due to the following transactions:
2011
The additions mainly relate to investments in Colombia, Spain and Argentina for the upgrade of equipmentand to renovate and upgrade obsolete equipment at existing centers and bring it in line with customerrequirements, and in Brazil and Peru to adapt new centers.
2012
In the eleven months ended November 30, 2012, investments amounting to 50,578 thousand U.S. dollarswere made in furniture, plant and equipment in Brazil for the construction of the new “Uruguay Site” and tomaintain business with customers in that country. Additions in Spain amounted to 6,262 thousand U.S. dollars tobuild centers in a number of places (e.g. Glorias, Bilbao, Perú) given the need for an increasing number ofpositions to meet customer demand.
Disposals of assets relate mainly to replacements of old equipment with new equipment acquired under afinance lease.
The breakdown of fully depreciated items of property, plant and equipment still in use at December 31,2011 and November 30, 2012 is as follows:
Thousands of U.S. Dollars
12/31/2011 11/30/2012
Plant machinery and tools . . . . . . . . . . . . . . . . . . . . . . . . . 32,077 904Furniture and other . . . . . . . . . . . . . . . . . . . . . . . . . . . . . . 245,339 260,020
Total . . . . . . . . . . . . . . . . . . . . . . . . . . . . . . . . . . . . . . . . . 277,416 260,924
The combined companies hold insurance policies to cover the potential risks related to property, plant andequipment used in operation.
9. FINANCIAL ASSETS
The breakdown of the Predecessor´s financial assets by category at December 31, 2011 and November 30,2012 are as follows:
December 31, 2011
Thousands of U.S. dollars
Other financialassets at fair value
through P&L
Loans,receivables,and other
Held-tomaturity
investmentsHedging
derivatives Total
Non-Current Financial AssetsLoans . . . . . . . . . . . . . . . . . . . . . . . . . . . . . . . . . — 23 — — 23Loans with related party (Note 23) . . . . . . . . . . — 1,112 — — 1,112Investments . . . . . . . . . . . . . . . . . . . . . . . . . . . . . — 3,291 — — 3,291Deposits and guarantees given . . . . . . . . . . . . . . — 47,326 — — 47,326
Total . . . . . . . . . . . . . . . . . . . . . . . . . . . . . . . . . . — 51,752 — — 51,752
Current Financial AssetsTrade and other receivables (excluding pre-
payments) . . . . . . . . . . . . . . . . . . . . . . . . . . . . — 481,415 — — 481,415Short-term loans . . . . . . . . . . . . . . . . . . . . . . . . . — 21,698 — — 21,698Deposits and guarantees . . . . . . . . . . . . . . . . . . . — 2,428 — — 2,428Other short term financial instruments . . . . . . . . — — — 449 449Cash and cash equivalents (Note 11) . . . . . . . . . 81,905 — — 81,905
Total . . . . . . . . . . . . . . . . . . . . . . . . . . . . . . . . . . — 587,446 — 449 587,895
Total financial assets . . . . . . . . . . . . . . . . . . . . — 639,175 — 449 639,624
F-115
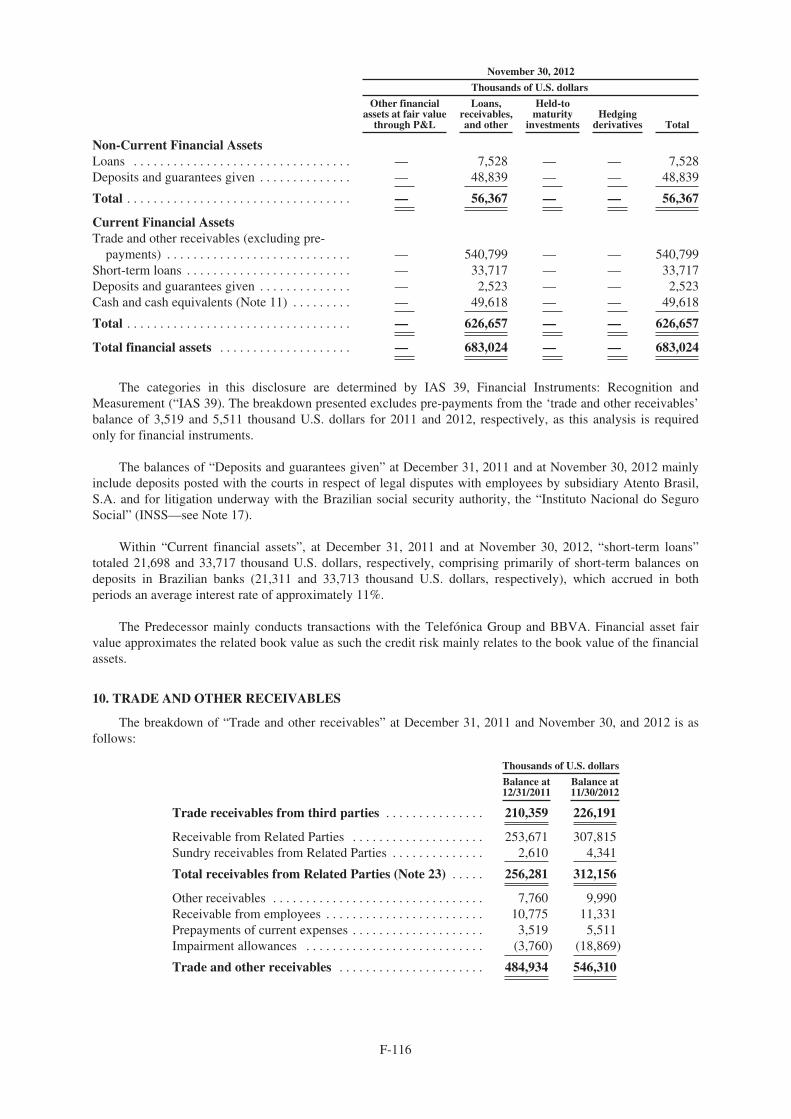
November 30, 2012
Thousands of U.S. dollars
Other financialassets at fair value
through P&L
Loans,receivables,and other
Held-tomaturity
investmentsHedging
derivatives Total
Non-Current Financial AssetsLoans . . . . . . . . . . . . . . . . . . . . . . . . . . . . . . . . . — 7,528 — — 7,528Deposits and guarantees given . . . . . . . . . . . . . . — 48,839 — — 48,839
Total . . . . . . . . . . . . . . . . . . . . . . . . . . . . . . . . . . — 56,367 — — 56,367
Current Financial AssetsTrade and other receivables (excluding pre-
payments) . . . . . . . . . . . . . . . . . . . . . . . . . . . . — 540,799 — — 540,799Short-term loans . . . . . . . . . . . . . . . . . . . . . . . . . — 33,717 — — 33,717Deposits and guarantees given . . . . . . . . . . . . . . — 2,523 — — 2,523Cash and cash equivalents (Note 11) . . . . . . . . . — 49,618 — — 49,618
Total . . . . . . . . . . . . . . . . . . . . . . . . . . . . . . . . . . — 626,657 — — 626,657
Total financial assets . . . . . . . . . . . . . . . . . . . . — 683,024 — — 683,024
The categories in this disclosure are determined by IAS 39, Financial Instruments: Recognition andMeasurement (“IAS 39). The breakdown presented excludes pre-payments from the ‘trade and other receivables’balance of 3,519 and 5,511 thousand U.S. dollars for 2011 and 2012, respectively, as this analysis is requiredonly for financial instruments.
The balances of “Deposits and guarantees given” at December 31, 2011 and at November 30, 2012 mainlyinclude deposits posted with the courts in respect of legal disputes with employees by subsidiary Atento Brasil,S.A. and for litigation underway with the Brazilian social security authority, the “Instituto Nacional do SeguroSocial” (INSS—see Note 17).
Within “Current financial assets”, at December 31, 2011 and at November 30, 2012, “short-term loans”totaled 21,698 and 33,717 thousand U.S. dollars, respectively, comprising primarily of short-term balances ondeposits in Brazilian banks (21,311 and 33,713 thousand U.S. dollars, respectively), which accrued in bothperiods an average interest rate of approximately 11%.
The Predecessor mainly conducts transactions with the Telefónica Group and BBVA. Financial asset fairvalue approximates the related book value as such the credit risk mainly relates to the book value of the financialassets.
10. TRADE AND OTHER RECEIVABLES
The breakdown of “Trade and other receivables” at December 31, 2011 and November 30, and 2012 is asfollows:
Thousands of U.S. dollars
Balance at12/31/2011
Balance at11/30/2012
Trade receivables from third parties . . . . . . . . . . . . . . . 210,359 226,191
Receivable from Related Parties . . . . . . . . . . . . . . . . . . . . 253,671 307,815Sundry receivables from Related Parties . . . . . . . . . . . . . . 2,610 4,341
Total receivables from Related Parties (Note 23) . . . . . 256,281 312,156
Other receivables . . . . . . . . . . . . . . . . . . . . . . . . . . . . . . . . 7,760 9,990Receivable from employees . . . . . . . . . . . . . . . . . . . . . . . . 10,775 11,331Prepayments of current expenses . . . . . . . . . . . . . . . . . . . . 3,519 5,511Impairment allowances . . . . . . . . . . . . . . . . . . . . . . . . . . . (3,760) (18,869)
Trade and other receivables . . . . . . . . . . . . . . . . . . . . . . 484,934 546,310
F-116
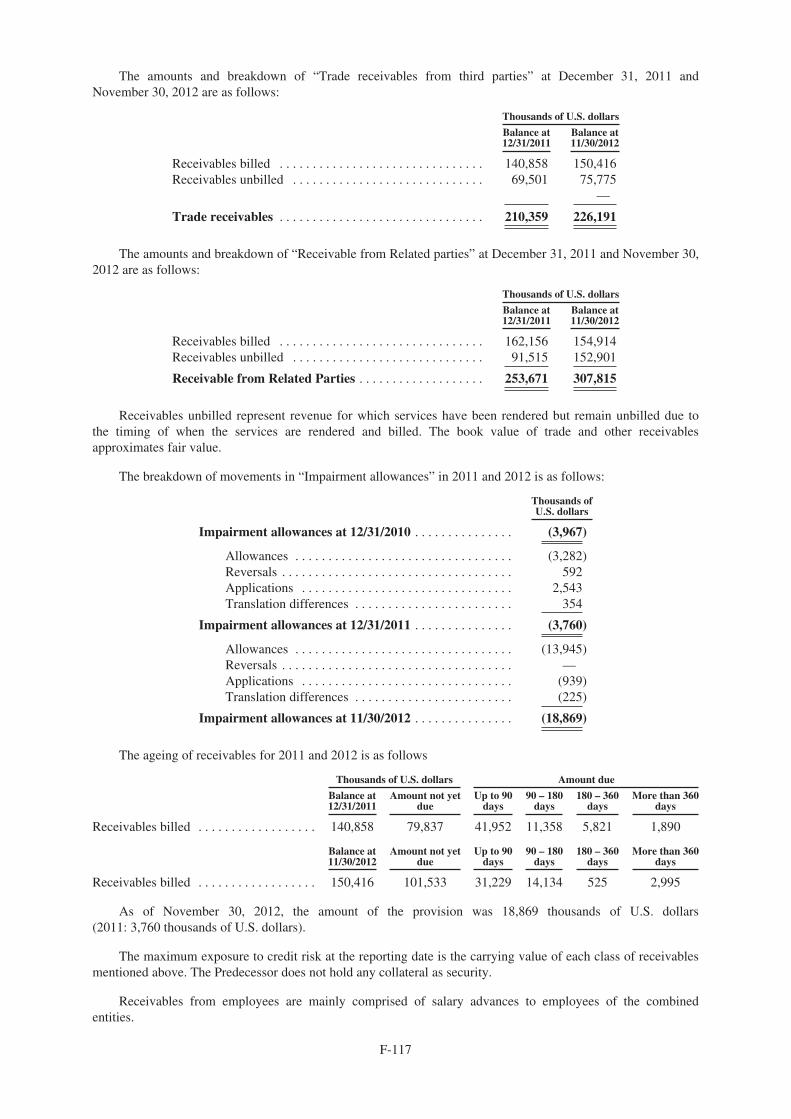
The amounts and breakdown of “Trade receivables from third parties” at December 31, 2011 andNovember 30, 2012 are as follows:
Thousands of U.S. dollars
Balance at12/31/2011
Balance at11/30/2012
Receivables billed . . . . . . . . . . . . . . . . . . . . . . . . . . . . . . . 140,858 150,416Receivables unbilled . . . . . . . . . . . . . . . . . . . . . . . . . . . . . 69,501 75,775
—
Trade receivables . . . . . . . . . . . . . . . . . . . . . . . . . . . . . . . 210,359 226,191
The amounts and breakdown of “Receivable from Related parties” at December 31, 2011 and November 30,2012 are as follows:
Thousands of U.S. dollars
Balance at12/31/2011
Balance at11/30/2012
Receivables billed . . . . . . . . . . . . . . . . . . . . . . . . . . . . . . . 162,156 154,914Receivables unbilled . . . . . . . . . . . . . . . . . . . . . . . . . . . . . 91,515 152,901
Receivable from Related Parties . . . . . . . . . . . . . . . . . . . 253,671 307,815
Receivables unbilled represent revenue for which services have been rendered but remain unbilled due tothe timing of when the services are rendered and billed. The book value of trade and other receivablesapproximates fair value.
The breakdown of movements in “Impairment allowances” in 2011 and 2012 is as follows:
Thousands ofU.S. dollars
Impairment allowances at 12/31/2010 . . . . . . . . . . . . . . . (3,967)
Allowances . . . . . . . . . . . . . . . . . . . . . . . . . . . . . . . . . (3,282)Reversals . . . . . . . . . . . . . . . . . . . . . . . . . . . . . . . . . . . 592Applications . . . . . . . . . . . . . . . . . . . . . . . . . . . . . . . . 2,543Translation differences . . . . . . . . . . . . . . . . . . . . . . . . 354
Impairment allowances at 12/31/2011 . . . . . . . . . . . . . . . (3,760)
Allowances . . . . . . . . . . . . . . . . . . . . . . . . . . . . . . . . . (13,945)Reversals . . . . . . . . . . . . . . . . . . . . . . . . . . . . . . . . . . . —Applications . . . . . . . . . . . . . . . . . . . . . . . . . . . . . . . . (939)Translation differences . . . . . . . . . . . . . . . . . . . . . . . . (225)
Impairment allowances at 11/30/2012 . . . . . . . . . . . . . . . (18,869)
The ageing of receivables for 2011 and 2012 is as follows
Thousands of U.S. dollars Amount due
Balance at12/31/2011
Amount not yetdue
Up to 90days
90 – 180days
180 – 360days
More than 360days
Receivables billed . . . . . . . . . . . . . . . . . . 140,858 79,837 41,952 11,358 5,821 1,890
Balance at11/30/2012
Amount not yetdue
Up to 90days
90 – 180days
180 – 360days
More than 360days
Receivables billed . . . . . . . . . . . . . . . . . . 150,416 101,533 31,229 14,134 525 2,995
As of November 30, 2012, the amount of the provision was 18,869 thousands of U.S. dollars(2011: 3,760 thousands of U.S. dollars).
The maximum exposure to credit risk at the reporting date is the carrying value of each class of receivablesmentioned above. The Predecessor does not hold any collateral as security.
Receivables from employees are mainly comprised of salary advances to employees of the combinedentities.
F-117
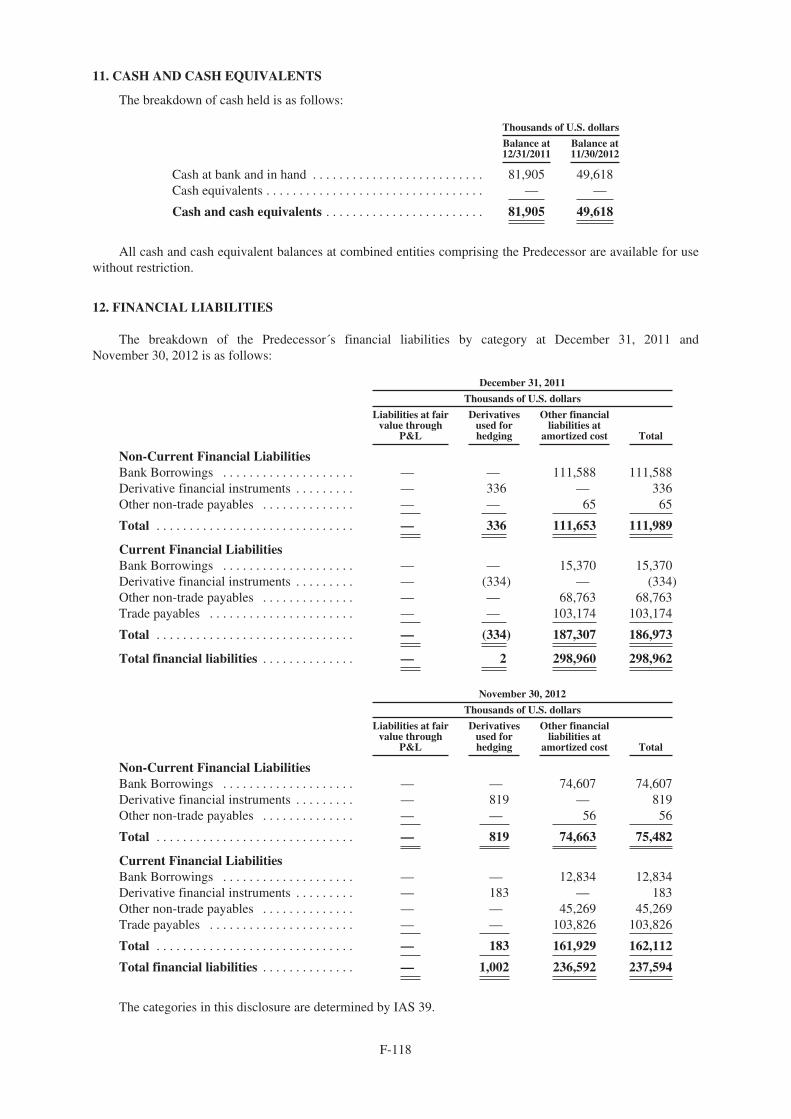
11. CASH AND CASH EQUIVALENTS
The breakdown of cash held is as follows:
Thousands of U.S. dollars
Balance at12/31/2011
Balance at11/30/2012
Cash at bank and in hand . . . . . . . . . . . . . . . . . . . . . . . . . . 81,905 49,618Cash equivalents . . . . . . . . . . . . . . . . . . . . . . . . . . . . . . . . . — —
Cash and cash equivalents . . . . . . . . . . . . . . . . . . . . . . . . 81,905 49,618
All cash and cash equivalent balances at combined entities comprising the Predecessor are available for usewithout restriction.
12. FINANCIAL LIABILITIES
The breakdown of the Predecessor´s financial liabilities by category at December 31, 2011 andNovember 30, 2012 is as follows:
December 31, 2011
Thousands of U.S. dollars
Liabilities at fairvalue through
P&L
Derivativesused forhedging
Other financialliabilities at
amortized cost Total
Non-Current Financial LiabilitiesBank Borrowings . . . . . . . . . . . . . . . . . . . . — — 111,588 111,588Derivative financial instruments . . . . . . . . . — 336 — 336Other non-trade payables . . . . . . . . . . . . . . — — 65 65
Total . . . . . . . . . . . . . . . . . . . . . . . . . . . . . . — 336 111,653 111,989
Current Financial LiabilitiesBank Borrowings . . . . . . . . . . . . . . . . . . . . — — 15,370 15,370Derivative financial instruments . . . . . . . . . — (334) — (334)Other non-trade payables . . . . . . . . . . . . . . — — 68,763 68,763Trade payables . . . . . . . . . . . . . . . . . . . . . . — — 103,174 103,174
Total . . . . . . . . . . . . . . . . . . . . . . . . . . . . . . — (334) 187,307 186,973
Total financial liabilities . . . . . . . . . . . . . . — 2 298,960 298,962
November 30, 2012
Thousands of U.S. dollars
Liabilities at fairvalue through
P&L
Derivativesused forhedging
Other financialliabilities at
amortized cost Total
Non-Current Financial LiabilitiesBank Borrowings . . . . . . . . . . . . . . . . . . . . — — 74,607 74,607Derivative financial instruments . . . . . . . . . — 819 — 819Other non-trade payables . . . . . . . . . . . . . . — — 56 56
Total . . . . . . . . . . . . . . . . . . . . . . . . . . . . . . — 819 74,663 75,482
Current Financial LiabilitiesBank Borrowings . . . . . . . . . . . . . . . . . . . . — — 12,834 12,834Derivative financial instruments . . . . . . . . . — 183 — 183Other non-trade payables . . . . . . . . . . . . . . — — 45,269 45,269Trade payables . . . . . . . . . . . . . . . . . . . . . . — — 103,826 103,826
Total . . . . . . . . . . . . . . . . . . . . . . . . . . . . . . — 183 161,929 162,112
Total financial liabilities . . . . . . . . . . . . . . — 1,002 236,592 237,594
The categories in this disclosure are determined by IAS 39.
F-118
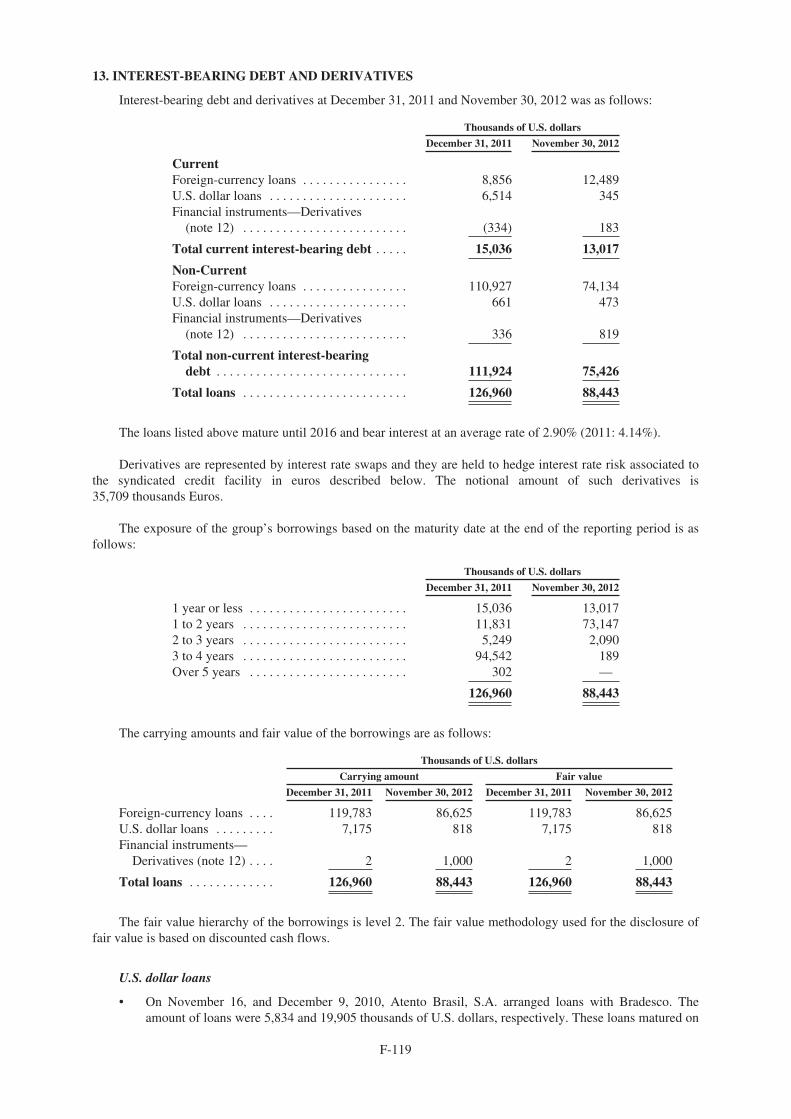
13. INTEREST-BEARING DEBT AND DERIVATIVES
Interest-bearing debt and derivatives at December 31, 2011 and November 30, 2012 was as follows:
Thousands of U.S. dollars
December 31, 2011 November 30, 2012
CurrentForeign-currency loans . . . . . . . . . . . . . . . . 8,856 12,489U.S. dollar loans . . . . . . . . . . . . . . . . . . . . . 6,514 345Financial instruments—Derivatives
(note 12) . . . . . . . . . . . . . . . . . . . . . . . . . (334) 183
Total current interest-bearing debt . . . . . 15,036 13,017
Non-CurrentForeign-currency loans . . . . . . . . . . . . . . . . 110,927 74,134U.S. dollar loans . . . . . . . . . . . . . . . . . . . . . 661 473Financial instruments—Derivatives
(note 12) . . . . . . . . . . . . . . . . . . . . . . . . . 336 819
Total non-current interest-bearingdebt . . . . . . . . . . . . . . . . . . . . . . . . . . . . . 111,924 75,426
Total loans . . . . . . . . . . . . . . . . . . . . . . . . . 126,960 88,443
The loans listed above mature until 2016 and bear interest at an average rate of 2.90% (2011: 4.14%).
Derivatives are represented by interest rate swaps and they are held to hedge interest rate risk associated tothe syndicated credit facility in euros described below. The notional amount of such derivatives is35,709 thousands Euros.
The exposure of the group’s borrowings based on the maturity date at the end of the reporting period is asfollows:
Thousands of U.S. dollars
December 31, 2011 November 30, 2012
1 year or less . . . . . . . . . . . . . . . . . . . . . . . . 15,036 13,0171 to 2 years . . . . . . . . . . . . . . . . . . . . . . . . . 11,831 73,1472 to 3 years . . . . . . . . . . . . . . . . . . . . . . . . . 5,249 2,0903 to 4 years . . . . . . . . . . . . . . . . . . . . . . . . . 94,542 189Over 5 years . . . . . . . . . . . . . . . . . . . . . . . . 302 —
126,960 88,443
The carrying amounts and fair value of the borrowings are as follows:
Thousands of U.S. dollars
Carrying amount Fair value
December 31, 2011 November 30, 2012 December 31, 2011 November 30, 2012
Foreign-currency loans . . . . 119,783 86,625 119,783 86,625U.S. dollar loans . . . . . . . . . 7,175 818 7,175 818Financial instruments—
Derivatives (note 12) . . . . 2 1,000 2 1,000
Total loans . . . . . . . . . . . . . 126,960 88,443 126,960 88,443
The fair value hierarchy of the borrowings is level 2. The fair value methodology used for the disclosure offair value is based on discounted cash flows.
U.S. dollar loans
• On November 16, and December 9, 2010, Atento Brasil, S.A. arranged loans with Bradesco. Theamount of loans were 5,834 and 19,905 thousands of U.S. dollars, respectively. These loans matured on
F-119
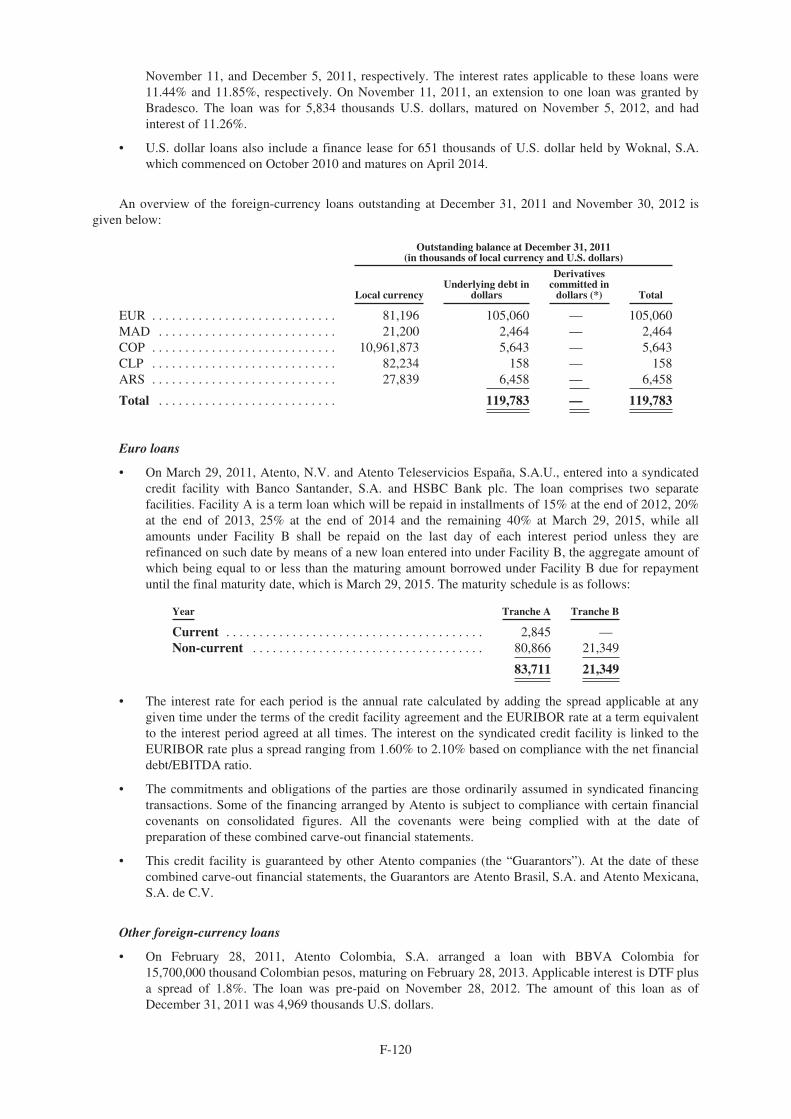
November 11, and December 5, 2011, respectively. The interest rates applicable to these loans were11.44% and 11.85%, respectively. On November 11, 2011, an extension to one loan was granted byBradesco. The loan was for 5,834 thousands U.S. dollars, matured on November 5, 2012, and hadinterest of 11.26%.
• U.S. dollar loans also include a finance lease for 651 thousands of U.S. dollar held by Woknal, S.A.which commenced on October 2010 and matures on April 2014.
An overview of the foreign-currency loans outstanding at December 31, 2011 and November 30, 2012 isgiven below:
Outstanding balance at December 31, 2011(in thousands of local currency and U.S. dollars)
Local currencyUnderlying debt in
dollars
Derivativescommitted in
dollars (*) Total
EUR . . . . . . . . . . . . . . . . . . . . . . . . . . . . 81,196 105,060 — 105,060MAD . . . . . . . . . . . . . . . . . . . . . . . . . . . 21,200 2,464 — 2,464COP . . . . . . . . . . . . . . . . . . . . . . . . . . . . 10,961,873 5,643 — 5,643CLP . . . . . . . . . . . . . . . . . . . . . . . . . . . . 82,234 158 — 158ARS . . . . . . . . . . . . . . . . . . . . . . . . . . . . 27,839 6,458 — 6,458
Total . . . . . . . . . . . . . . . . . . . . . . . . . . . 119,783 — 119,783
Euro loans
• On March 29, 2011, Atento, N.V. and Atento Teleservicios España, S.A.U., entered into a syndicatedcredit facility with Banco Santander, S.A. and HSBC Bank plc. The loan comprises two separatefacilities. Facility A is a term loan which will be repaid in installments of 15% at the end of 2012, 20%at the end of 2013, 25% at the end of 2014 and the remaining 40% at March 29, 2015, while allamounts under Facility B shall be repaid on the last day of each interest period unless they arerefinanced on such date by means of a new loan entered into under Facility B, the aggregate amount ofwhich being equal to or less than the maturing amount borrowed under Facility B due for repaymentuntil the final maturity date, which is March 29, 2015. The maturity schedule is as follows:
Year Tranche A Tranche B
Current . . . . . . . . . . . . . . . . . . . . . . . . . . . . . . . . . . . . . . . 2,845 —Non-current . . . . . . . . . . . . . . . . . . . . . . . . . . . . . . . . . . . 80,866 21,349
83,711 21,349
• The interest rate for each period is the annual rate calculated by adding the spread applicable at anygiven time under the terms of the credit facility agreement and the EURIBOR rate at a term equivalentto the interest period agreed at all times. The interest on the syndicated credit facility is linked to theEURIBOR rate plus a spread ranging from 1.60% to 2.10% based on compliance with the net financialdebt/EBITDA ratio.
• The commitments and obligations of the parties are those ordinarily assumed in syndicated financingtransactions. Some of the financing arranged by Atento is subject to compliance with certain financialcovenants on consolidated figures. All the covenants were being complied with at the date ofpreparation of these combined carve-out financial statements.
• This credit facility is guaranteed by other Atento companies (the “Guarantors”). At the date of thesecombined carve-out financial statements, the Guarantors are Atento Brasil, S.A. and Atento Mexicana,S.A. de C.V.
Other foreign-currency loans
• On February 28, 2011, Atento Colombia, S.A. arranged a loan with BBVA Colombia for15,700,000 thousand Colombian pesos, maturing on February 28, 2013. Applicable interest is DTF plusa spread of 1.8%. The loan was pre-paid on November 28, 2012. The amount of this loan as ofDecember 31, 2011 was 4,969 thousands U.S. dollars.
F-120
• On July 21, 2011, Atento Colombia, S.A. arranged a loan with BBVA Colombia for1,800,000 thousand Colombian pesos. The loan matured and was repaid on July 19, 2012 and hadinterest of DTF plus a spread of 2.5%. The amount of this loan as of December 31, 2011 was673 thousands U.S. dollars.
• On April 15, 2011, Microcentro, S.A. arranged a loan with HSBC Argentina, S.A. for 8,000 thousandArgentinean pesos, maturing on April 12, 2013, with interest of 19%. This loan was pre-paid onNovember 28, 2011.
• On April 15, 2011, Centro de Contactos Salta arranged a loan with HSBC Argentina, S.A. for18,300 thousand Argentinean pesos, maturing on April 12, 2013, with interest of 19%. This loan waspre-paid on November 28, 2011.
• On June 28, 2011, Atento Marruecos, S.A. arranged a loan with Banco Sabadell, for 21,200 thousanddirham, maturing on June 28, 2016, with interest of 6%. A portion of this loan of 10,000 dirham waspre-paid November 2012. As of November 30, 2012 this loan had an outstanding balance of879 thousand U.S. dollars (2,464 U.S. dollars as of December 31, 2011).
• Other foreign currency loans include a finance lease held by Atento Chile, S.A. which was cancelled onNovember 2013. As of November 30, 2012 this loan had an outstanding balance of 74 thousandsU.S. dollars (158 thousands U.S. dollars as of December 31, 2011).
Outstanding balance at November 30, 2012(in thousands of local currency and U.S. dollars)
Local currencyUnderlying debt in
dollars
Derivativescommitted in
dollars(*) Total
EUR . . . . . . . . . . . . . . . . . . . . . . . . . . . . . 60,659 78,770 — 78,770BRL . . . . . . . . . . . . . . . . . . . . . . . . . . . . . 14,540 6,900 — 6,900MAD . . . . . . . . . . . . . . . . . . . . . . . . . . . . 7,547 879 — 879CLP . . . . . . . . . . . . . . . . . . . . . . . . . . . . . 35,621 74 — 74
—
Total . . . . . . . . . . . . . . . . . . . . . . . . . . . . 86,623 — 86,623
• On January 2, 2012, Atento Brasil, S.A. arranged a loan with Banco Santander for 30,000 thousandBrazilian reais. It matures on January 2, 2014 and bears interest at 112.8% of the CDI. This loan waspre-paid on November 2012.
• On March 1, 2012, Atento Brasil, S.A. arranged a loan with Banco Santander for 40,000 thousandBrazilian reais, maturing on January 2, 2014 and bearing interest at 112.5% of the CDI. This loan waspre-paid on November 2012.
14. OTHER NON-TRADE PAYABLES
The breakdown of “Other non-trade payables” in 2011 and 2012 is as follows:
Thousands of U.S. dollars
Balance at12/31/2011
Balance at11/30/2012
CurrentWages and salaries payable . . . . . . . . . . . . . . . . . . . . . . . . 112,687 138,573Payables to suppliers of property, plant and Equipment . . 57,996 36,434Other non-trade payables . . . . . . . . . . . . . . . . . . . . . . . . . . 8,546 2,965Other non-trade payables to related parties . . . . . . . . . . . . 2,221 5,870Deferred income . . . . . . . . . . . . . . . . . . . . . . . . . . . . . . . . . 470 796
Total other non-trade payables . . . . . . . . . . . . . . . . . . . . 181,920 184,638
Non-currentOther payables . . . . . . . . . . . . . . . . . . . . . . . . . . . . . . . . . . 65 56Deferred income . . . . . . . . . . . . . . . . . . . . . . . . . . . . . . . . . 33 21
Total other non-trade payables . . . . . . . . . . . . . . . . . . . . 98 77
“Non-current other payables” mainly includes amounts owed to public administrations by Atento Brasil,S.A. and deferred income is primarily composed of government grants.
F-121
15. TRADE PAYABLES
The breakdown of “Trade payables” at December 31, 2011 and November 30, 2012, is as follows:
Thousands of U.S. dollars
Balance at12/31/2011
Balance at11/30/2012
CurrentPayable on purchases . . . . . . . . . . . . . . . . . . . . . . . . . . . . . 75,121 58,088Other trade payable to related parties . . . . . . . . . . . . . . . . 28,027 29,566Advances received . . . . . . . . . . . . . . . . . . . . . . . . . . . . . . . 26 9,006Other trade payable . . . . . . . . . . . . . . . . . . . . . . . . . . . . . . — 7,166
Total . . . . . . . . . . . . . . . . . . . . . . . . . . . . . . . . . . . . . . . . . . 103,174 103,826
At November 30, 2012, advances received of 9,006 thousand U.S. dollars represent cash received from theTelefónica Group for client services to be performed.
16. NON-CONTROLLING INTERESTS
In 2011 and 2012, changes recognized in non-controlling interests (NCI) were as follows:
Thousands of U.S. dollars
Company (non-controlling interest)Balance at12/31/2010
Profit forthe year
Dividendspaid Transfers
Translationdifferences
Balance at12/31/2011
Atento Chile, S.A. (Telefónica Chile) . . . . . . 13,872 2,356 — — (1,462) 14,766Atento Centro de Formación . . . . . . . . . . . . . 94 (4) — — (4) 86Atento Educación Limitada (Telefónica
Chile) . . . . . . . . . . . . . . . . . . . . . . . . . . . . . (294) 45 — — (45) (294)
Total . . . . . . . . . . . . . . . . . . . . . . . . . . . . . . . . 13,672 2,397 — — (1,511) 14,558
Thousands of U.S. dollars
Company (non-controlling interest)Balance at12/31/2011
Profit forthe year
Dividendspaid Transfers
Translationdifferences
Acquisitionof NCI
Balance at11/30/2012
Atento Chile, S.A. (TelefónicaChile) . . . . . . . . . . . . . . . . . . . 14,766 361 (5,790) — 1,181 (10,518) —
Atento Centro de Formación . . . 86 — — — 2 (88) —Atento Educación Limitada
(Telefónica Chile) . . . . . . . . . . (294) 46 — — (107) 355 —
Total . . . . . . . . . . . . . . . . . . . . . . 14,558 407 (5,790) — 1,076 (10,251) —
F-122
17. PROVISIONS AND CONTINGENCIES
The amounts of and changes in current and non-current provisions for the year ended December 31, 2011and the eleven month period ended November 30, 2012 are as follows:
Balance at12/31/2010 Increases Decreases
UnwindingDiscount Transfers
Translationdifferences
Balance at12/31/2011
Non-currentProvision for employee
benefits . . . . . . . . . . . . . . . . . . — 197 (586) — 902 (57) 456Provision for tax . . . . . . . . . . . . . — 24 — — — (1) 23Provision for dismantling . . . . . . 9,949 2,077 — 1,077 — (1,419) 11,684Provisions for other claims . . . . . 33 347 — — — (25) 355
Total . . . . . . . . . . . . . . . . . . . . . . 9,982 2,645 (586) 1,077 902 (1,502) 12,518
CurrentProvision for employee
benefits . . . . . . . . . . . . . . . . . . — 1,488 — — — (103) 1,385Provision for employee claims . . — 18,050 (24,664) (2,908) 30,629 (1,431) 19,676Provision for tax . . . . . . . . . . . . . — 793 — — — 16 809Provision for dismantling . . . . . . 1,201 270 (431) 144 — (132) 1,052Provisions for other claims . . . . . 4,891 225 (175) 1 (4,229) (180) 533Other provisions . . . . . . . . . . . . . 6,830 8 (859) — (5,175) (182) 622
Total . . . . . . . . . . . . . . . . . . . . . . 12,922 20,834 (26,129) (2,763) 21,225 (2,012) 24,077
Balance at12/31/2011 Increases Decreases
UnwindingDiscount Transfers
Translationdifferences
Balance at11/30/2012
Non-currentProvision for employee
benefits . . . . . . . . . . . . . . . . . . 456 3,069 — — — (177) 3,348Provision for tax . . . . . . . . . . . . . 23 4,950 — 297 — (421) 4,849Provision for dismantling . . . . . . 11,684 5,127 (208) — — (1,600) 15,003Other provisions . . . . . . . . . . . . . 355 — — — — — 355
Total . . . . . . . . . . . . . . . . . . . . . . 12,518 13,146 (208) 297 — (2,198) 23,555
CurrentProvision for employee
benefits . . . . . . . . . . . . . . . . . . 1,385 — (1,372) — — (13) —Provision for employee claims . . 19,676 19,610 (15,219) 2,132 — (2,499) 23,700Provision for tax . . . . . . . . . . . . . 809 95 (27) — — 38 915Provision for dismantling . . . . . . 1,052 — (988) — — (36) 28Provisions for other claims . . . . . 533 85 (124) — — (56) 438Other provisions . . . . . . . . . . . . . 622 4,329 (650) — — 60 4,361
Total . . . . . . . . . . . . . . . . . . . . . . 24,077 24,119 (18,380) 2,132 — (2,506) 29,442
Increases and decreases in this caption during 2012 correspond mainly to the provisions for employeeclaims and to the provisions for other claims in Brazil and Argentina in the amounts of 12,769 and a decrease of9,439 thousand U.S. dollars, and 6,926 and a decrease of 5,791 thousand U.S. dollars, respectively. Additionally,the amount registered in “Transfers” in 2011 is related to a reclassification recorded from the account “Trade andother payables” to this heading.
The balance of this provision at November 30, 2012 is mainly comprised of an amount of 12,426 thousandU.S. dollars corresponding to Brazil (7,784 thousand U.S. dollars at December 31, 2011), and 10,399 thousandU.S. dollars corresponding to Argentina (2011: 10,496 thousand U.S. dollars).
Given the nature of the risks covered by these provisions, it is not possible to determine a reliable scheduleof potential payments.
Current and non-current provisions for dismantling mainly include the provision for the dismantling ofAtento Brasil, S.A. for the amount of 14,266 thousand U.S. dollars (2011: 12,264 thousand U.S. dollars).
Details of ongoing litigation as of November 30, 2012 are described in the following paragraphs.
F-123
In relation to Atento Brasil’s ongoing litigation with the Brazilian Social Security Authorities (INSS) andthe Regional Labor Department (classified in 2010 as remote risk), for the payment in cash for transport passes toemployees, in December 2011 binding decision (súmula) number 60 was handed down establishing that theamount paid in cash to employees in connection with “transport passes” is exempt from social securitycontributions. This decision is binding for both the administrative and legal authorities, and implies a favorableresult for Atento Brasil in relation to all ongoing litigation. Although at the preparation date of the combinedcarve-out financial statements, the court’s final decision on the INSS litigation is still pending, Atento Brasil’sposition has resulted favorable in all instances and therefore the risk associated to this litigation has beenevaluated as possible.
At November 30, 2012 Atento Brasil was involved in approximately 8,031 labor-related disputes, filed bythe Predecessor´s employees or ex-employees for various reasons, including dismissals or differences overemployment conditions in general. The total amount of these claims is 281,744 thousand U.S. dollars, withpossible claims, as classified by the Company’s internal and external lawyers, totalling 82,287 thousandU.S. dollars. For the most part, the further along the legal proceedings in this type of case in Brazil, the moreremote the possible risk. Taking account of the amount of litigation that arises in Brazil and past experience inthis type of claim, the Company has recognized provisions at November 30, 2012 amounting to 12,426 thousandU.S. dollars, which in the opinion of its directors based in part on the advice of legal advisors is sufficient tocover the risk of payments likely to be made because of these claims.
Additionally, as of November 30, 2012, Atento Brasil has 28 lawsuits ongoing with the Tax Authorities andSocial Security Department for various reasons relating to infraction proceedings filed. The total amount of theseclaims is approximately 31,171 thousand U.S. dollars, and according to the Company’s external lawyers, the riskof materialization is possible.
Lastly, Atento Brasil has 21 civil lawsuits in progress relating to different causes. The total amount of theseclaims is approximately 6,721 thousand U.S. dollars, for which, according to the Company’s external lawyers,the risk of materialization is possible.
At November 30, 2012, Teleatento del Perú had a pending lawsuit against the Peruvian tax authority(Administración Tributaria Peruana) in the amount of 10,885 thousand U.S. dollars, for which, according to theCompany’s external lawyers, the risk of materialization is possible.
18. TAX MATTERS
The breakdown of the Predecessor’s income tax expense is as follows:
Thousands of U.S. dollars
2011 2012
Current tax:Current tax expense . . . . . . . . . . . . . . . . . . . . . . . . . . . . . . 54,310 61,989Adjustment in respect to prior years . . . . . . . . . . . . . . . . . 206 305
Total current tax . . . . . . . . . . . . . . . . . . . . . . . . . . . . . . . . . 54,516 62,294
Total deferred tax . . . . . . . . . . . . . . . . . . . . . . . . . . . . . . . . 340 (1,588)
Total income tax expense . . . . . . . . . . . . . . . . . . . . . . . . . 54,856 60,706
The effective tax rate paid by the Predecessor is 37.97% at December 31, 2011 and 40.24% atNovember 30, 2012. If we analyze the aggregated effective tax rate not considering the holding companies, theeffective tax rate will approximate 38% and 33% at December 31, 2011 and November 30, 2012, respectively,which are deemed reasonable effective tax rates. Further, the calculated tax rate is within the Predecessor’s rangeof reasonable parameters given that the official standard rates applicable to the main the Predecessor combinedcompanies range from 28% to 47%. As there are no significant permanent differences, it was not considerednecessary to provide further disclosures on the reconciliation of accounting and tax profit other than the changesin deferred taxes outlined below.
The combined entities file taxes separately in accordance with the tax legislation of their respectivecountries of incorporation.
F-124
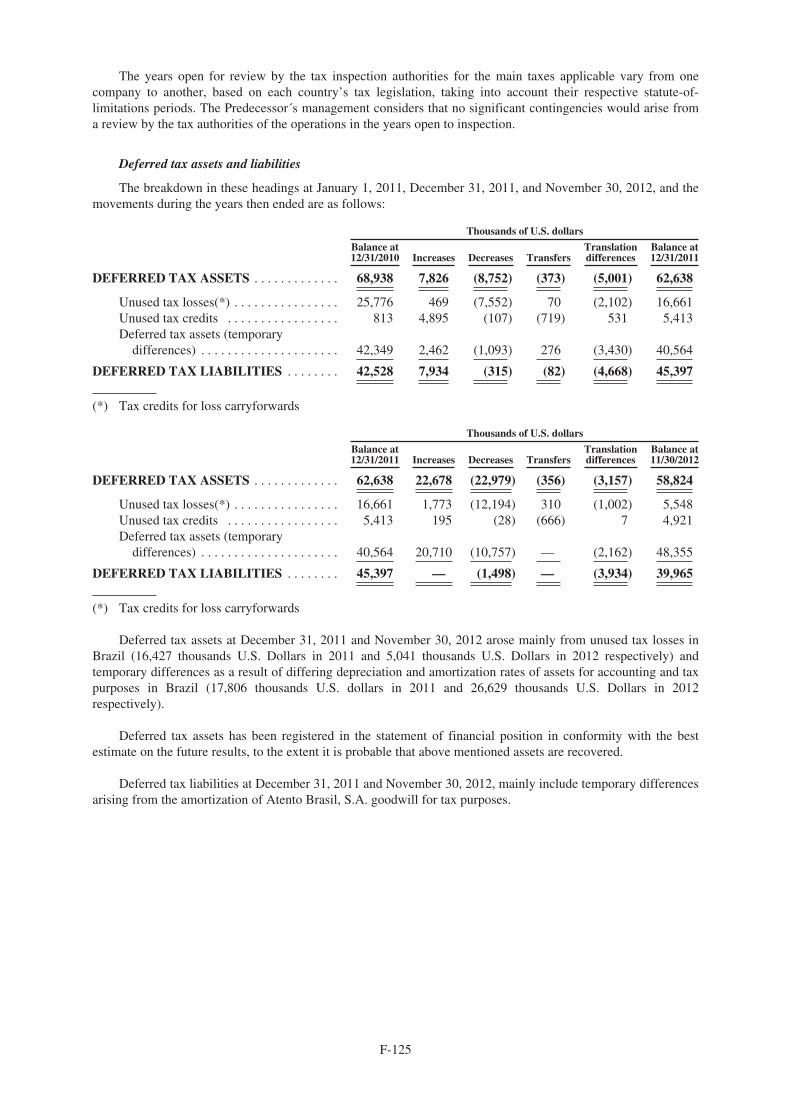
The years open for review by the tax inspection authorities for the main taxes applicable vary from onecompany to another, based on each country’s tax legislation, taking into account their respective statute-of-limitations periods. The Predecessor´s management considers that no significant contingencies would arise froma review by the tax authorities of the operations in the years open to inspection.
Deferred tax assets and liabilities
The breakdown in these headings at January 1, 2011, December 31, 2011, and November 30, 2012, and themovements during the years then ended are as follows:
Thousands of U.S. dollars
Balance at12/31/2010 Increases Decreases Transfers
Translationdifferences
Balance at12/31/2011
DEFERRED TAX ASSETS . . . . . . . . . . . . . 68,938 7,826 (8,752) (373) (5,001) 62,638
Unused tax losses(*) . . . . . . . . . . . . . . . . 25,776 469 (7,552) 70 (2,102) 16,661Unused tax credits . . . . . . . . . . . . . . . . . 813 4,895 (107) (719) 531 5,413Deferred tax assets (temporary
differences) . . . . . . . . . . . . . . . . . . . . . 42,349 2,462 (1,093) 276 (3,430) 40,564
DEFERRED TAX LIABILITIES . . . . . . . . 42,528 7,934 (315) (82) (4,668) 45,397
(*) Tax credits for loss carryforwards
Thousands of U.S. dollars
Balance at12/31/2011 Increases Decreases Transfers
Translationdifferences
Balance at11/30/2012
DEFERRED TAX ASSETS . . . . . . . . . . . . . 62,638 22,678 (22,979) (356) (3,157) 58,824
Unused tax losses(*) . . . . . . . . . . . . . . . . 16,661 1,773 (12,194) 310 (1,002) 5,548Unused tax credits . . . . . . . . . . . . . . . . . 5,413 195 (28) (666) 7 4,921Deferred tax assets (temporary
differences) . . . . . . . . . . . . . . . . . . . . . 40,564 20,710 (10,757) — (2,162) 48,355
DEFERRED TAX LIABILITIES . . . . . . . . 45,397 — (1,498) — (3,934) 39,965
(*) Tax credits for loss carryforwards
Deferred tax assets at December 31, 2011 and November 30, 2012 arose mainly from unused tax losses inBrazil (16,427 thousands U.S. Dollars in 2011 and 5,041 thousands U.S. Dollars in 2012 respectively) andtemporary differences as a result of differing depreciation and amortization rates of assets for accounting and taxpurposes in Brazil (17,806 thousands U.S. dollars in 2011 and 26,629 thousands U.S. Dollars in 2012respectively).
Deferred tax assets has been registered in the statement of financial position in conformity with the bestestimate on the future results, to the extent it is probable that above mentioned assets are recovered.
Deferred tax liabilities at December 31, 2011 and November 30, 2012, mainly include temporary differencesarising from the amortization of Atento Brasil, S.A. goodwill for tax purposes.
F-125
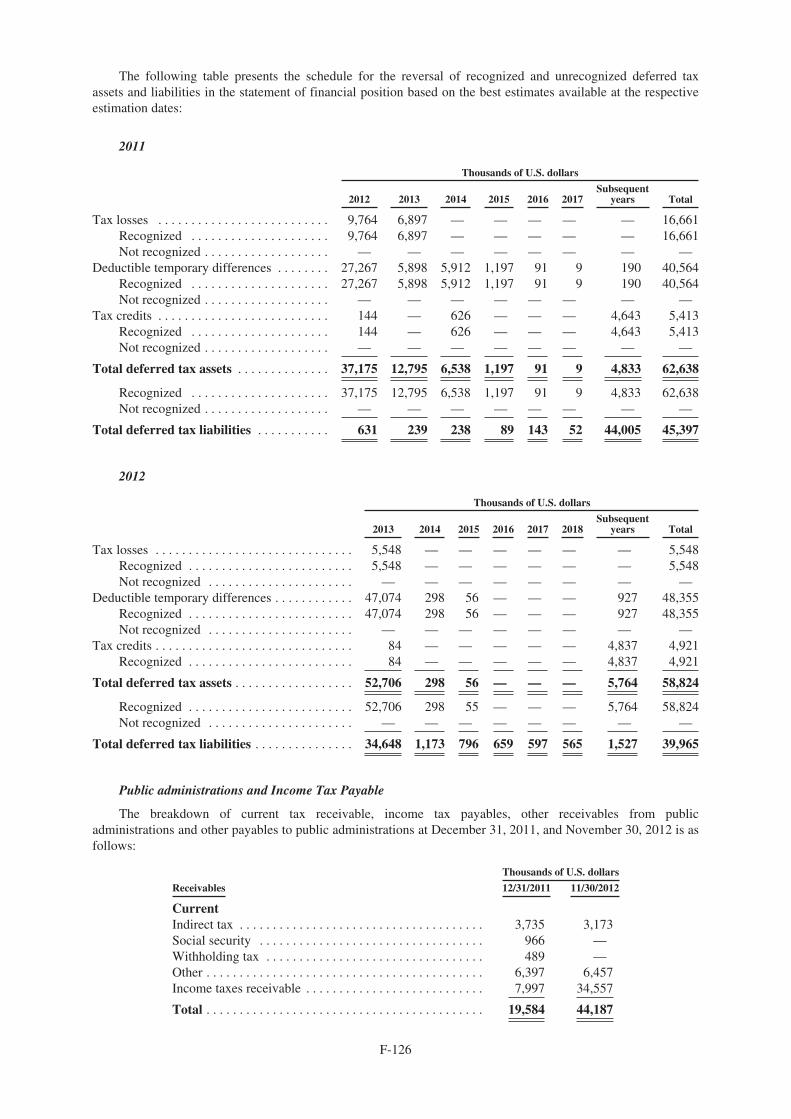
The following table presents the schedule for the reversal of recognized and unrecognized deferred taxassets and liabilities in the statement of financial position based on the best estimates available at the respectiveestimation dates:
2011
Thousands of U.S. dollars
2012 2013 2014 2015 2016 2017Subsequent
years Total
Tax losses . . . . . . . . . . . . . . . . . . . . . . . . . . 9,764 6,897 — — — — — 16,661Recognized . . . . . . . . . . . . . . . . . . . . . 9,764 6,897 — — — — — 16,661Not recognized . . . . . . . . . . . . . . . . . . . — — — — — — — —
Deductible temporary differences . . . . . . . . 27,267 5,898 5,912 1,197 91 9 190 40,564Recognized . . . . . . . . . . . . . . . . . . . . . 27,267 5,898 5,912 1,197 91 9 190 40,564Not recognized . . . . . . . . . . . . . . . . . . . — — — — — — — —
Tax credits . . . . . . . . . . . . . . . . . . . . . . . . . . 144 — 626 — — — 4,643 5,413Recognized . . . . . . . . . . . . . . . . . . . . . 144 — 626 — — — 4,643 5,413Not recognized . . . . . . . . . . . . . . . . . . . — — — — — — — —
Total deferred tax assets . . . . . . . . . . . . . . 37,175 12,795 6,538 1,197 91 9 4,833 62,638
Recognized . . . . . . . . . . . . . . . . . . . . . 37,175 12,795 6,538 1,197 91 9 4,833 62,638Not recognized . . . . . . . . . . . . . . . . . . . — — — — — — — —
Total deferred tax liabilities . . . . . . . . . . . 631 239 238 89 143 52 44,005 45,397
2012
Thousands of U.S. dollars
2013 2014 2015 2016 2017 2018Subsequent
years Total
Tax losses . . . . . . . . . . . . . . . . . . . . . . . . . . . . . . 5,548 — — — — — — 5,548Recognized . . . . . . . . . . . . . . . . . . . . . . . . . 5,548 — — — — — — 5,548Not recognized . . . . . . . . . . . . . . . . . . . . . . — — — — — — — —
Deductible temporary differences . . . . . . . . . . . . 47,074 298 56 — — — 927 48,355Recognized . . . . . . . . . . . . . . . . . . . . . . . . . 47,074 298 56 — — — 927 48,355Not recognized . . . . . . . . . . . . . . . . . . . . . . — — — — — — — —
Tax credits . . . . . . . . . . . . . . . . . . . . . . . . . . . . . . 84 — — — — — 4,837 4,921Recognized . . . . . . . . . . . . . . . . . . . . . . . . . 84 — — — — — 4,837 4,921
Total deferred tax assets . . . . . . . . . . . . . . . . . . 52,706 298 56 — — — 5,764 58,824
Recognized . . . . . . . . . . . . . . . . . . . . . . . . . 52,706 298 55 — — — 5,764 58,824Not recognized . . . . . . . . . . . . . . . . . . . . . . — — — — — — — —
Total deferred tax liabilities . . . . . . . . . . . . . . . 34,648 1,173 796 659 597 565 1,527 39,965
Public administrations and Income Tax Payable
The breakdown of current tax receivable, income tax payables, other receivables from publicadministrations and other payables to public administrations at December 31, 2011, and November 30, 2012 is asfollows:
Thousands of U.S. dollars
Receivables 12/31/2011 11/30/2012
CurrentIndirect tax . . . . . . . . . . . . . . . . . . . . . . . . . . . . . . . . . . . . . 3,735 3,173Social security . . . . . . . . . . . . . . . . . . . . . . . . . . . . . . . . . . 966 —Withholding tax . . . . . . . . . . . . . . . . . . . . . . . . . . . . . . . . . 489 —Other . . . . . . . . . . . . . . . . . . . . . . . . . . . . . . . . . . . . . . . . . . 6,397 6,457Income taxes receivable . . . . . . . . . . . . . . . . . . . . . . . . . . . 7,997 34,557
Total . . . . . . . . . . . . . . . . . . . . . . . . . . . . . . . . . . . . . . . . . . 19,584 44,187
F-126

Thousands of U.S. dollars
Payables 12/31/2011 11/30/2012
CurrentPersonal income tax withholdings . . . . . . . . . . . . . . . . . . . 45,560 40,332Indirect taxes . . . . . . . . . . . . . . . . . . . . . . . . . . . . . . . . . . . 22,973 17,023Social security . . . . . . . . . . . . . . . . . . . . . . . . . . . . . . . . . . 9,912 9,668Other . . . . . . . . . . . . . . . . . . . . . . . . . . . . . . . . . . . . . . . . . . 9,553 9,339Income taxes payable . . . . . . . . . . . . . . . . . . . . . . . . . . . . . 11,234 47,396
Total . . . . . . . . . . . . . . . . . . . . . . . . . . . . . . . . . . . . . . . . . . 99,232 123,758
19. REVENUE AND EXPENSE
a) Revenue
The breakdown of “Revenue” at the Predecessor for the year ended December 31, 2011 and the eleven-month period ended November 30, 2012 is as follows:
Thousands of U.S. dollars
2011 2012
Rendering of services to Telefónica Group companies(see Note 23) . . . . . . . . . . . . . . . . . . . . . . . . . . . . . . . . 1,235,944 1,065,376
Rendering of services to other companies . . . . . . . . . . . 1,181,342 1,060,552
Total . . . . . . . . . . . . . . . . . . . . . . . . . . . . . . . . . . . . . . . . 2,417,286 2,125,928
b) Other operating income
The breakdown of “Other operating income” in the combined carve-out income statements for the yearended December 31, 2011 and the eleven month period ended November 30, 2012 is as follows:
Thousands of U.S. dollars
2011 2012
Non-core and other operating income from TelefónicaGroup companies (Note 23) . . . . . . . . . . . . . . . . . . . . . . 431 755
Non-core and other operating income from othercompanies . . . . . . . . . . . . . . . . . . . . . . . . . . . . . . . . . . . . 1,184 (161)
Income from compensation and other non-recurring . . . . . — 479Government grants . . . . . . . . . . . . . . . . . . . . . . . . . . . . . . . 1,902 751Gains on disposal of non-current assets
(see Notes 6 & 8) . . . . . . . . . . . . . . . . . . . . . . . . . . . . . . . 3,704 33
Total . . . . . . . . . . . . . . . . . . . . . . . . . . . . . . . . . . . . . . . . . . 7,221 1,857
c) Supplies
The breakdown of this heading by item and related party or external company for the year endedDecember 31, 2011 and the eleven month period ended November 30, 2012 was as follows:
Thousands of U.S. dollars
2011 2012
Induced business . . . . . . . . . . . . . . . . . . . . . . . . . . . . . . . . 47,504 38,667Infrastructure lease . . . . . . . . . . . . . . . . . . . . . . . . . . . . . . 940 —Other . . . . . . . . . . . . . . . . . . . . . . . . . . . . . . . . . . . . . . . . . 349 3,665
Total supplies by Telefónica Group companies (seeNote 23) . . . . . . . . . . . . . . . . . . . . . . . . . . . . . . . . . . . . . 48,793 42,332
Induced business . . . . . . . . . . . . . . . . . . . . . . . . . . . . . . . . 2,996 2,976Infrastructure lease . . . . . . . . . . . . . . . . . . . . . . . . . . . . . . 35,147 25,309Other . . . . . . . . . . . . . . . . . . . . . . . . . . . . . . . . . . . . . . . . . 42,909 34,891
Total supplies by other companies . . . . . . . . . . . . . . . . . 81,052 63,176
TOTAL . . . . . . . . . . . . . . . . . . . . . . . . . . . . . . . . . . . . . . . 129,845 105,508
F-127
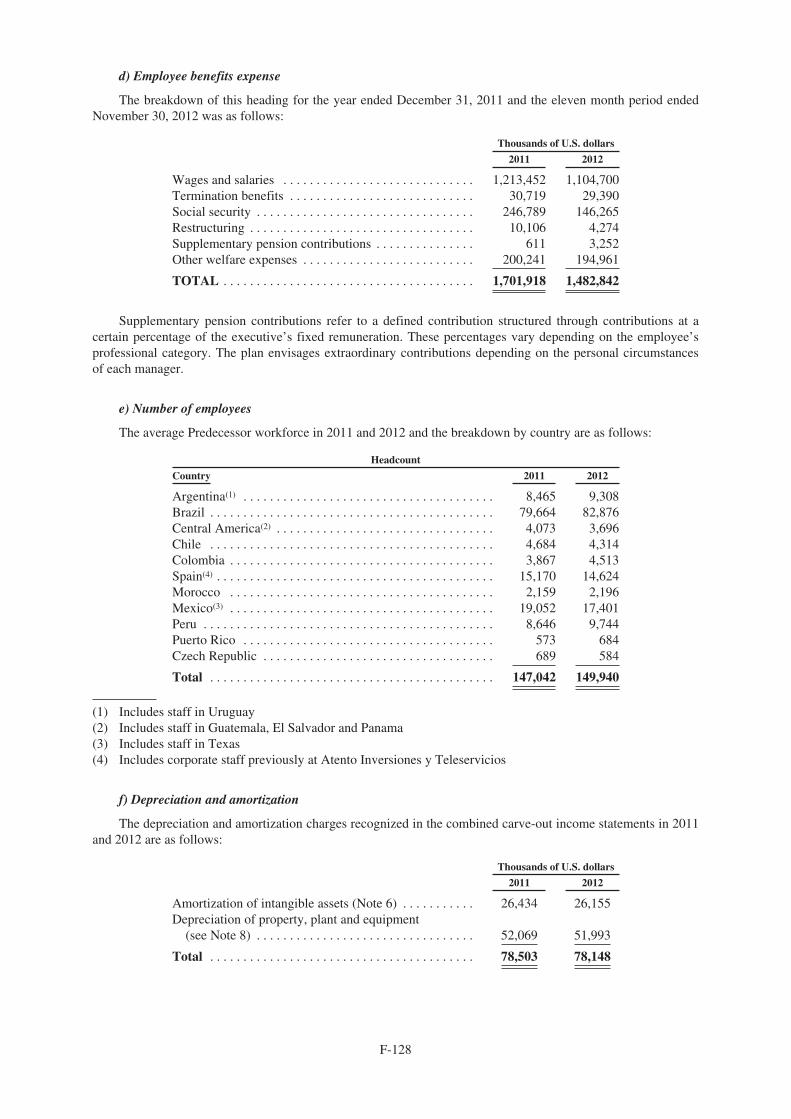
d) Employee benefits expense
The breakdown of this heading for the year ended December 31, 2011 and the eleven month period endedNovember 30, 2012 was as follows:
Thousands of U.S. dollars
2011 2012
Wages and salaries . . . . . . . . . . . . . . . . . . . . . . . . . . . . . 1,213,452 1,104,700Termination benefits . . . . . . . . . . . . . . . . . . . . . . . . . . . . 30,719 29,390Social security . . . . . . . . . . . . . . . . . . . . . . . . . . . . . . . . . 246,789 146,265Restructuring . . . . . . . . . . . . . . . . . . . . . . . . . . . . . . . . . . 10,106 4,274Supplementary pension contributions . . . . . . . . . . . . . . . 611 3,252Other welfare expenses . . . . . . . . . . . . . . . . . . . . . . . . . . 200,241 194,961
TOTAL . . . . . . . . . . . . . . . . . . . . . . . . . . . . . . . . . . . . . . 1,701,918 1,482,842
Supplementary pension contributions refer to a defined contribution structured through contributions at acertain percentage of the executive’s fixed remuneration. These percentages vary depending on the employee’sprofessional category. The plan envisages extraordinary contributions depending on the personal circumstancesof each manager.
e) Number of employees
The average Predecessor workforce in 2011 and 2012 and the breakdown by country are as follows:
Headcount
Country 2011 2012
Argentina(1) . . . . . . . . . . . . . . . . . . . . . . . . . . . . . . . . . . . . . . 8,465 9,308Brazil . . . . . . . . . . . . . . . . . . . . . . . . . . . . . . . . . . . . . . . . . . . 79,664 82,876Central America(2) . . . . . . . . . . . . . . . . . . . . . . . . . . . . . . . . . 4,073 3,696Chile . . . . . . . . . . . . . . . . . . . . . . . . . . . . . . . . . . . . . . . . . . . 4,684 4,314Colombia . . . . . . . . . . . . . . . . . . . . . . . . . . . . . . . . . . . . . . . . 3,867 4,513Spain(4) . . . . . . . . . . . . . . . . . . . . . . . . . . . . . . . . . . . . . . . . . . 15,170 14,624Morocco . . . . . . . . . . . . . . . . . . . . . . . . . . . . . . . . . . . . . . . . 2,159 2,196Mexico(3) . . . . . . . . . . . . . . . . . . . . . . . . . . . . . . . . . . . . . . . . 19,052 17,401Peru . . . . . . . . . . . . . . . . . . . . . . . . . . . . . . . . . . . . . . . . . . . . 8,646 9,744Puerto Rico . . . . . . . . . . . . . . . . . . . . . . . . . . . . . . . . . . . . . . 573 684Czech Republic . . . . . . . . . . . . . . . . . . . . . . . . . . . . . . . . . . . 689 584
Total . . . . . . . . . . . . . . . . . . . . . . . . . . . . . . . . . . . . . . . . . . . 147,042 149,940
(1) Includes staff in Uruguay(2) Includes staff in Guatemala, El Salvador and Panama(3) Includes staff in Texas(4) Includes corporate staff previously at Atento Inversiones y Teleservicios
f) Depreciation and amortization
The depreciation and amortization charges recognized in the combined carve-out income statements in 2011and 2012 are as follows:
Thousands of U.S. dollars
2011 2012
Amortization of intangible assets (Note 6) . . . . . . . . . . . 26,434 26,155Depreciation of property, plant and equipment
(see Note 8) . . . . . . . . . . . . . . . . . . . . . . . . . . . . . . . . . 52,069 51,993
Total . . . . . . . . . . . . . . . . . . . . . . . . . . . . . . . . . . . . . . . . 78,503 78,148
F-128
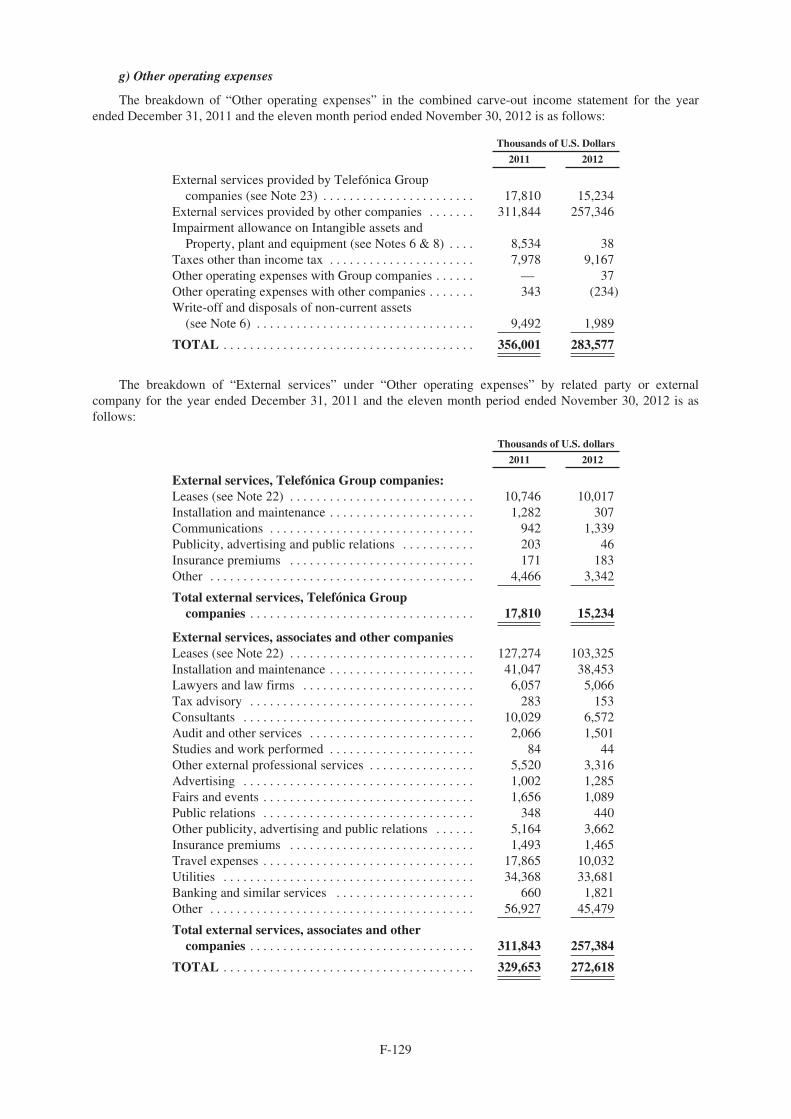
g) Other operating expenses
The breakdown of “Other operating expenses” in the combined carve-out income statement for the yearended December 31, 2011 and the eleven month period ended November 30, 2012 is as follows:
Thousands of U.S. Dollars
2011 2012
External services provided by Telefónica Groupcompanies (see Note 23) . . . . . . . . . . . . . . . . . . . . . . . 17,810 15,234
External services provided by other companies . . . . . . . 311,844 257,346Impairment allowance on Intangible assets and
Property, plant and equipment (see Notes 6 & 8) . . . . 8,534 38Taxes other than income tax . . . . . . . . . . . . . . . . . . . . . . 7,978 9,167Other operating expenses with Group companies . . . . . . — 37Other operating expenses with other companies . . . . . . . 343 (234)Write-off and disposals of non-current assets
(see Note 6) . . . . . . . . . . . . . . . . . . . . . . . . . . . . . . . . . 9,492 1,989
TOTAL . . . . . . . . . . . . . . . . . . . . . . . . . . . . . . . . . . . . . . 356,001 283,577
The breakdown of “External services” under “Other operating expenses” by related party or externalcompany for the year ended December 31, 2011 and the eleven month period ended November 30, 2012 is asfollows:
Thousands of U.S. dollars
2011 2012
External services, Telefónica Group companies:Leases (see Note 22) . . . . . . . . . . . . . . . . . . . . . . . . . . . . 10,746 10,017Installation and maintenance . . . . . . . . . . . . . . . . . . . . . . 1,282 307Communications . . . . . . . . . . . . . . . . . . . . . . . . . . . . . . . 942 1,339Publicity, advertising and public relations . . . . . . . . . . . 203 46Insurance premiums . . . . . . . . . . . . . . . . . . . . . . . . . . . . 171 183Other . . . . . . . . . . . . . . . . . . . . . . . . . . . . . . . . . . . . . . . . 4,466 3,342
Total external services, Telefónica Groupcompanies . . . . . . . . . . . . . . . . . . . . . . . . . . . . . . . . . . 17,810 15,234
External services, associates and other companiesLeases (see Note 22) . . . . . . . . . . . . . . . . . . . . . . . . . . . . 127,274 103,325Installation and maintenance . . . . . . . . . . . . . . . . . . . . . . 41,047 38,453Lawyers and law firms . . . . . . . . . . . . . . . . . . . . . . . . . . 6,057 5,066Tax advisory . . . . . . . . . . . . . . . . . . . . . . . . . . . . . . . . . . 283 153Consultants . . . . . . . . . . . . . . . . . . . . . . . . . . . . . . . . . . . 10,029 6,572Audit and other services . . . . . . . . . . . . . . . . . . . . . . . . . 2,066 1,501Studies and work performed . . . . . . . . . . . . . . . . . . . . . . 84 44Other external professional services . . . . . . . . . . . . . . . . 5,520 3,316Advertising . . . . . . . . . . . . . . . . . . . . . . . . . . . . . . . . . . . 1,002 1,285Fairs and events . . . . . . . . . . . . . . . . . . . . . . . . . . . . . . . . 1,656 1,089Public relations . . . . . . . . . . . . . . . . . . . . . . . . . . . . . . . . 348 440Other publicity, advertising and public relations . . . . . . 5,164 3,662Insurance premiums . . . . . . . . . . . . . . . . . . . . . . . . . . . . 1,493 1,465Travel expenses . . . . . . . . . . . . . . . . . . . . . . . . . . . . . . . . 17,865 10,032Utilities . . . . . . . . . . . . . . . . . . . . . . . . . . . . . . . . . . . . . . 34,368 33,681Banking and similar services . . . . . . . . . . . . . . . . . . . . . 660 1,821Other . . . . . . . . . . . . . . . . . . . . . . . . . . . . . . . . . . . . . . . . 56,927 45,479
Total external services, associates and othercompanies . . . . . . . . . . . . . . . . . . . . . . . . . . . . . . . . . . 311,843 257,384
TOTAL . . . . . . . . . . . . . . . . . . . . . . . . . . . . . . . . . . . . . . 329,653 272,618
F-129
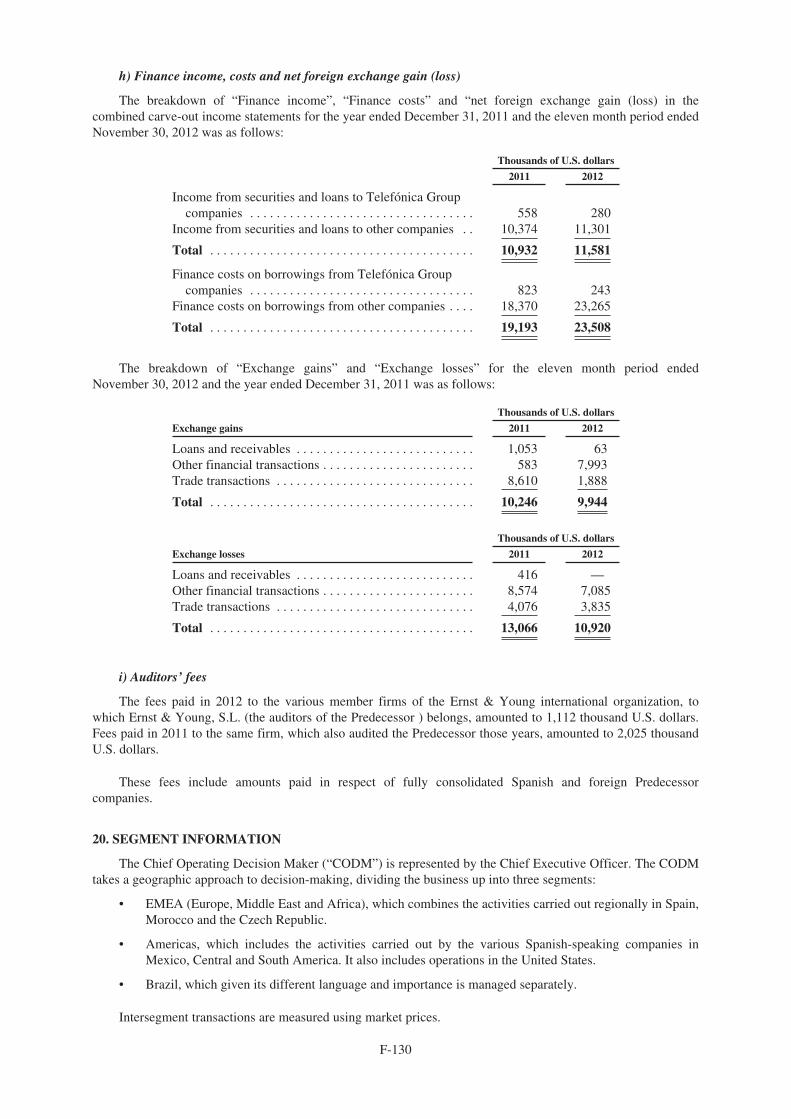
h) Finance income, costs and net foreign exchange gain (loss)
The breakdown of “Finance income”, “Finance costs” and “net foreign exchange gain (loss) in thecombined carve-out income statements for the year ended December 31, 2011 and the eleven month period endedNovember 30, 2012 was as follows:
Thousands of U.S. dollars
2011 2012
Income from securities and loans to Telefónica Groupcompanies . . . . . . . . . . . . . . . . . . . . . . . . . . . . . . . . . . 558 280
Income from securities and loans to other companies . . 10,374 11,301
Total . . . . . . . . . . . . . . . . . . . . . . . . . . . . . . . . . . . . . . . . 10,932 11,581
Finance costs on borrowings from Telefónica Groupcompanies . . . . . . . . . . . . . . . . . . . . . . . . . . . . . . . . . . 823 243
Finance costs on borrowings from other companies . . . . 18,370 23,265
Total . . . . . . . . . . . . . . . . . . . . . . . . . . . . . . . . . . . . . . . . 19,193 23,508
The breakdown of “Exchange gains” and “Exchange losses” for the eleven month period endedNovember 30, 2012 and the year ended December 31, 2011 was as follows:
Thousands of U.S. dollars
Exchange gains 2011 2012
Loans and receivables . . . . . . . . . . . . . . . . . . . . . . . . . . . 1,053 63Other financial transactions . . . . . . . . . . . . . . . . . . . . . . . 583 7,993Trade transactions . . . . . . . . . . . . . . . . . . . . . . . . . . . . . . 8,610 1,888
Total . . . . . . . . . . . . . . . . . . . . . . . . . . . . . . . . . . . . . . . . 10,246 9,944
Thousands of U.S. dollars
Exchange losses 2011 2012
Loans and receivables . . . . . . . . . . . . . . . . . . . . . . . . . . . 416 —Other financial transactions . . . . . . . . . . . . . . . . . . . . . . . 8,574 7,085Trade transactions . . . . . . . . . . . . . . . . . . . . . . . . . . . . . . 4,076 3,835
Total . . . . . . . . . . . . . . . . . . . . . . . . . . . . . . . . . . . . . . . . 13,066 10,920
i) Auditors’ fees
The fees paid in 2012 to the various member firms of the Ernst & Young international organization, towhich Ernst & Young, S.L. (the auditors of the Predecessor ) belongs, amounted to 1,112 thousand U.S. dollars.Fees paid in 2011 to the same firm, which also audited the Predecessor those years, amounted to 2,025 thousandU.S. dollars.
These fees include amounts paid in respect of fully consolidated Spanish and foreign Predecessorcompanies.
20. SEGMENT INFORMATION
The Chief Operating Decision Maker (“CODM”) is represented by the Chief Executive Officer. The CODMtakes a geographic approach to decision-making, dividing the business up into three segments:
• EMEA (Europe, Middle East and Africa), which combines the activities carried out regionally in Spain,Morocco and the Czech Republic.
• Americas, which includes the activities carried out by the various Spanish-speaking companies inMexico, Central and South America. It also includes operations in the United States.
• Brazil, which given its different language and importance is managed separately.
Intersegment transactions are measured using market prices.
F-130
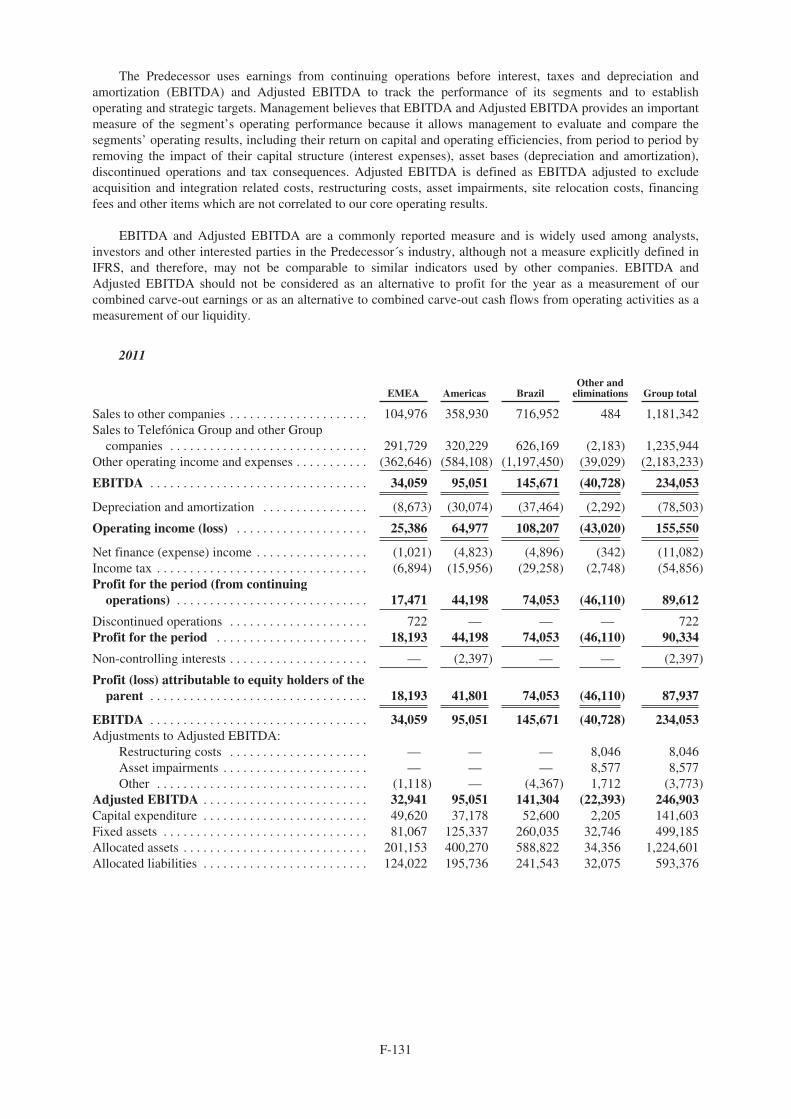
The Predecessor uses earnings from continuing operations before interest, taxes and depreciation andamortization (EBITDA) and Adjusted EBITDA to track the performance of its segments and to establishoperating and strategic targets. Management believes that EBITDA and Adjusted EBITDA provides an importantmeasure of the segment’s operating performance because it allows management to evaluate and compare thesegments’ operating results, including their return on capital and operating efficiencies, from period to period byremoving the impact of their capital structure (interest expenses), asset bases (depreciation and amortization),discontinued operations and tax consequences. Adjusted EBITDA is defined as EBITDA adjusted to excludeacquisition and integration related costs, restructuring costs, asset impairments, site relocation costs, financingfees and other items which are not correlated to our core operating results.
EBITDA and Adjusted EBITDA are a commonly reported measure and is widely used among analysts,investors and other interested parties in the Predecessor´s industry, although not a measure explicitly defined inIFRS, and therefore, may not be comparable to similar indicators used by other companies. EBITDA andAdjusted EBITDA should not be considered as an alternative to profit for the year as a measurement of ourcombined carve-out earnings or as an alternative to combined carve-out cash flows from operating activities as ameasurement of our liquidity.
2011
EMEA Americas BrazilOther and
eliminations Group total
Sales to other companies . . . . . . . . . . . . . . . . . . . . . 104,976 358,930 716,952 484 1,181,342Sales to Telefónica Group and other Group
companies . . . . . . . . . . . . . . . . . . . . . . . . . . . . . . 291,729 320,229 626,169 (2,183) 1,235,944Other operating income and expenses . . . . . . . . . . . (362,646) (584,108) (1,197,450) (39,029) (2,183,233)
EBITDA . . . . . . . . . . . . . . . . . . . . . . . . . . . . . . . . . 34,059 95,051 145,671 (40,728) 234,053
Depreciation and amortization . . . . . . . . . . . . . . . . (8,673) (30,074) (37,464) (2,292) (78,503)
Operating income (loss) . . . . . . . . . . . . . . . . . . . . 25,386 64,977 108,207 (43,020) 155,550
Net finance (expense) income . . . . . . . . . . . . . . . . . (1,021) (4,823) (4,896) (342) (11,082)Income tax . . . . . . . . . . . . . . . . . . . . . . . . . . . . . . . . (6,894) (15,956) (29,258) (2,748) (54,856)Profit for the period (from continuing
operations) . . . . . . . . . . . . . . . . . . . . . . . . . . . . . 17,471 44,198 74,053 (46,110) 89,612
Discontinued operations . . . . . . . . . . . . . . . . . . . . . 722 — — — 722Profit for the period . . . . . . . . . . . . . . . . . . . . . . . 18,193 44,198 74,053 (46,110) 90,334
Non-controlling interests . . . . . . . . . . . . . . . . . . . . . — (2,397) — — (2,397)
Profit (loss) attributable to equity holders of theparent . . . . . . . . . . . . . . . . . . . . . . . . . . . . . . . . . 18,193 41,801 74,053 (46,110) 87,937
EBITDA . . . . . . . . . . . . . . . . . . . . . . . . . . . . . . . . . 34,059 95,051 145,671 (40,728) 234,053Adjustments to Adjusted EBITDA:
Restructuring costs . . . . . . . . . . . . . . . . . . . . . — — — 8,046 8,046Asset impairments . . . . . . . . . . . . . . . . . . . . . . — — — 8,577 8,577Other . . . . . . . . . . . . . . . . . . . . . . . . . . . . . . . . (1,118) — (4,367) 1,712 (3,773)
Adjusted EBITDA . . . . . . . . . . . . . . . . . . . . . . . . . 32,941 95,051 141,304 (22,393) 246,903Capital expenditure . . . . . . . . . . . . . . . . . . . . . . . . . 49,620 37,178 52,600 2,205 141,603Fixed assets . . . . . . . . . . . . . . . . . . . . . . . . . . . . . . . 81,067 125,337 260,035 32,746 499,185Allocated assets . . . . . . . . . . . . . . . . . . . . . . . . . . . . 201,153 400,270 588,822 34,356 1,224,601Allocated liabilities . . . . . . . . . . . . . . . . . . . . . . . . . 124,022 195,736 241,543 32,075 593,376
F-131
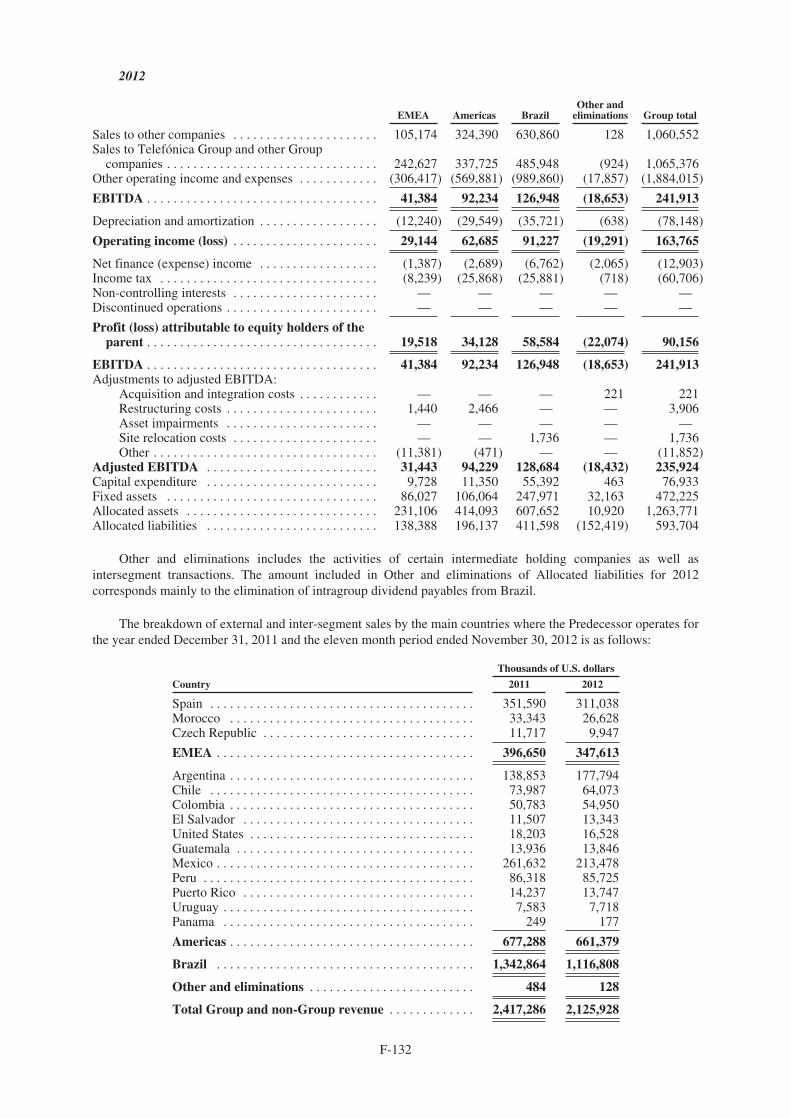
2012
EMEA Americas BrazilOther and
eliminations Group total
Sales to other companies . . . . . . . . . . . . . . . . . . . . . . 105,174 324,390 630,860 128 1,060,552Sales to Telefónica Group and other Group
companies . . . . . . . . . . . . . . . . . . . . . . . . . . . . . . . . 242,627 337,725 485,948 (924) 1,065,376Other operating income and expenses . . . . . . . . . . . . (306,417) (569,881) (989,860) (17,857) (1,884,015)
EBITDA . . . . . . . . . . . . . . . . . . . . . . . . . . . . . . . . . . . 41,384 92,234 126,948 (18,653) 241,913
Depreciation and amortization . . . . . . . . . . . . . . . . . . (12,240) (29,549) (35,721) (638) (78,148)
Operating income (loss) . . . . . . . . . . . . . . . . . . . . . . 29,144 62,685 91,227 (19,291) 163,765
Net finance (expense) income . . . . . . . . . . . . . . . . . . (1,387) (2,689) (6,762) (2,065) (12,903)Income tax . . . . . . . . . . . . . . . . . . . . . . . . . . . . . . . . . (8,239) (25,868) (25,881) (718) (60,706)Non-controlling interests . . . . . . . . . . . . . . . . . . . . . . — — — — —Discontinued operations . . . . . . . . . . . . . . . . . . . . . . . — — — — —
Profit (loss) attributable to equity holders of theparent . . . . . . . . . . . . . . . . . . . . . . . . . . . . . . . . . . . 19,518 34,128 58,584 (22,074) 90,156
EBITDA . . . . . . . . . . . . . . . . . . . . . . . . . . . . . . . . . . . 41,384 92,234 126,948 (18,653) 241,913Adjustments to adjusted EBITDA:
Acquisition and integration costs . . . . . . . . . . . . — — — 221 221Restructuring costs . . . . . . . . . . . . . . . . . . . . . . . 1,440 2,466 — — 3,906Asset impairments . . . . . . . . . . . . . . . . . . . . . . . — — — — —Site relocation costs . . . . . . . . . . . . . . . . . . . . . . — — 1,736 — 1,736Other . . . . . . . . . . . . . . . . . . . . . . . . . . . . . . . . . . (11,381) (471) — — (11,852)
Adjusted EBITDA . . . . . . . . . . . . . . . . . . . . . . . . . . 31,443 94,229 128,684 (18,432) 235,924Capital expenditure . . . . . . . . . . . . . . . . . . . . . . . . . . 9,728 11,350 55,392 463 76,933Fixed assets . . . . . . . . . . . . . . . . . . . . . . . . . . . . . . . . 86,027 106,064 247,971 32,163 472,225Allocated assets . . . . . . . . . . . . . . . . . . . . . . . . . . . . . 231,106 414,093 607,652 10,920 1,263,771Allocated liabilities . . . . . . . . . . . . . . . . . . . . . . . . . . 138,388 196,137 411,598 (152,419) 593,704
Other and eliminations includes the activities of certain intermediate holding companies as well asintersegment transactions. The amount included in Other and eliminations of Allocated liabilities for 2012corresponds mainly to the elimination of intragroup dividend payables from Brazil.
The breakdown of external and inter-segment sales by the main countries where the Predecessor operates forthe year ended December 31, 2011 and the eleven month period ended November 30, 2012 is as follows:
Thousands of U.S. dollars
Country 2011 2012
Spain . . . . . . . . . . . . . . . . . . . . . . . . . . . . . . . . . . . . . . . . 351,590 311,038Morocco . . . . . . . . . . . . . . . . . . . . . . . . . . . . . . . . . . . . . 33,343 26,628Czech Republic . . . . . . . . . . . . . . . . . . . . . . . . . . . . . . . . 11,717 9,947
EMEA . . . . . . . . . . . . . . . . . . . . . . . . . . . . . . . . . . . . . . . 396,650 347,613
Argentina . . . . . . . . . . . . . . . . . . . . . . . . . . . . . . . . . . . . . 138,853 177,794Chile . . . . . . . . . . . . . . . . . . . . . . . . . . . . . . . . . . . . . . . . 73,987 64,073Colombia . . . . . . . . . . . . . . . . . . . . . . . . . . . . . . . . . . . . . 50,783 54,950El Salvador . . . . . . . . . . . . . . . . . . . . . . . . . . . . . . . . . . . 11,507 13,343United States . . . . . . . . . . . . . . . . . . . . . . . . . . . . . . . . . . 18,203 16,528Guatemala . . . . . . . . . . . . . . . . . . . . . . . . . . . . . . . . . . . . 13,936 13,846Mexico . . . . . . . . . . . . . . . . . . . . . . . . . . . . . . . . . . . . . . . 261,632 213,478Peru . . . . . . . . . . . . . . . . . . . . . . . . . . . . . . . . . . . . . . . . . 86,318 85,725Puerto Rico . . . . . . . . . . . . . . . . . . . . . . . . . . . . . . . . . . . 14,237 13,747Uruguay . . . . . . . . . . . . . . . . . . . . . . . . . . . . . . . . . . . . . . 7,583 7,718Panama . . . . . . . . . . . . . . . . . . . . . . . . . . . . . . . . . . . . . . 249 177
Americas . . . . . . . . . . . . . . . . . . . . . . . . . . . . . . . . . . . . . 677,288 661,379
Brazil . . . . . . . . . . . . . . . . . . . . . . . . . . . . . . . . . . . . . . . 1,342,864 1,116,808
Other and eliminations . . . . . . . . . . . . . . . . . . . . . . . . . 484 128
Total Group and non-Group revenue . . . . . . . . . . . . . 2,417,286 2,125,928
F-132
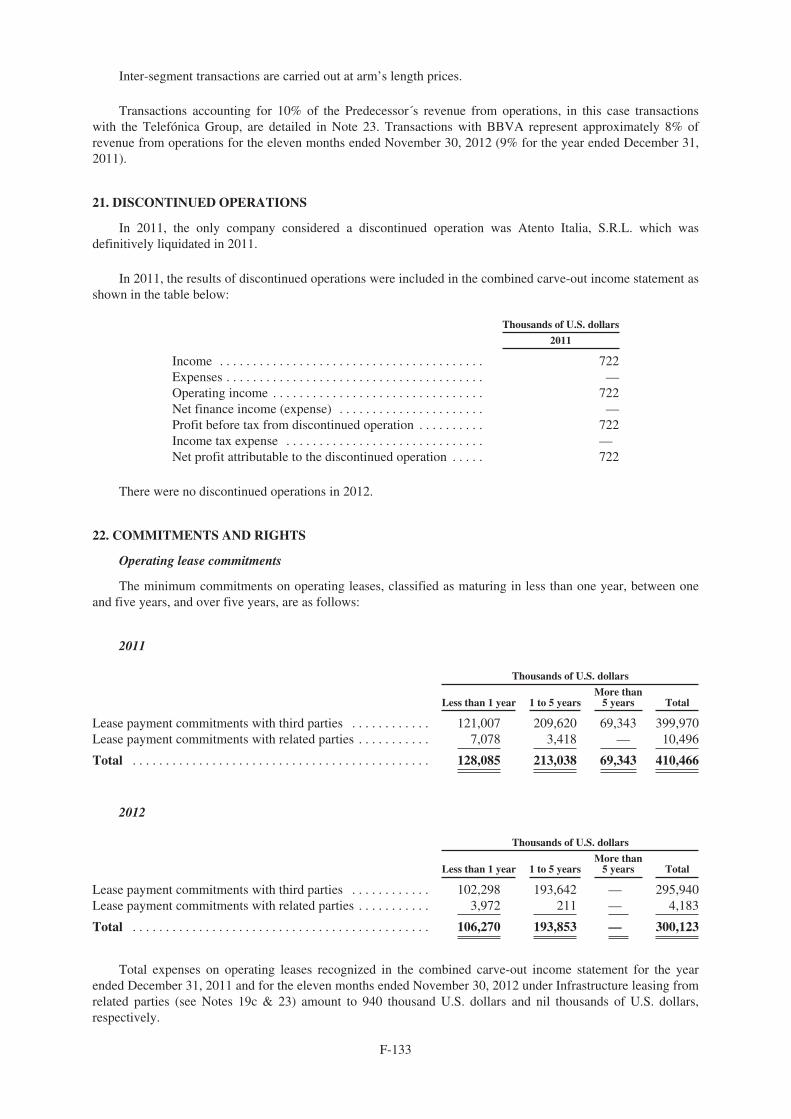
Inter-segment transactions are carried out at arm’s length prices.
Transactions accounting for 10% of the Predecessor´s revenue from operations, in this case transactionswith the Telefónica Group, are detailed in Note 23. Transactions with BBVA represent approximately 8% ofrevenue from operations for the eleven months ended November 30, 2012 (9% for the year ended December 31,2011).
21. DISCONTINUED OPERATIONS
In 2011, the only company considered a discontinued operation was Atento Italia, S.R.L. which wasdefinitively liquidated in 2011.
In 2011, the results of discontinued operations were included in the combined carve-out income statement asshown in the table below:
Thousands of U.S. dollars
2011
Income . . . . . . . . . . . . . . . . . . . . . . . . . . . . . . . . . . . . . . . . 722Expenses . . . . . . . . . . . . . . . . . . . . . . . . . . . . . . . . . . . . . . . —Operating income . . . . . . . . . . . . . . . . . . . . . . . . . . . . . . . . 722Net finance income (expense) . . . . . . . . . . . . . . . . . . . . . . —Profit before tax from discontinued operation . . . . . . . . . . 722Income tax expense . . . . . . . . . . . . . . . . . . . . . . . . . . . . . . —Net profit attributable to the discontinued operation . . . . . 722
There were no discontinued operations in 2012.
22. COMMITMENTS AND RIGHTS
Operating lease commitments
The minimum commitments on operating leases, classified as maturing in less than one year, between oneand five years, and over five years, are as follows:
2011
Thousands of U.S. dollars
Less than 1 year 1 to 5 yearsMore than
5 years Total
Lease payment commitments with third parties . . . . . . . . . . . . 121,007 209,620 69,343 399,970Lease payment commitments with related parties . . . . . . . . . . . 7,078 3,418 — 10,496
Total . . . . . . . . . . . . . . . . . . . . . . . . . . . . . . . . . . . . . . . . . . . . . 128,085 213,038 69,343 410,466
2012
Thousands of U.S. dollars
Less than 1 year 1 to 5 yearsMore than
5 years Total
Lease payment commitments with third parties . . . . . . . . . . . . 102,298 193,642 — 295,940Lease payment commitments with related parties . . . . . . . . . . . 3,972 211 — 4,183
Total . . . . . . . . . . . . . . . . . . . . . . . . . . . . . . . . . . . . . . . . . . . . . 106,270 193,853 — 300,123
Total expenses on operating leases recognized in the combined carve-out income statement for the yearended December 31, 2011 and for the eleven months ended November 30, 2012 under Infrastructure leasing fromrelated parties (see Notes 19c & 23) amount to 940 thousand U.S. dollars and nil thousands of U.S. dollars,respectively.
F-133
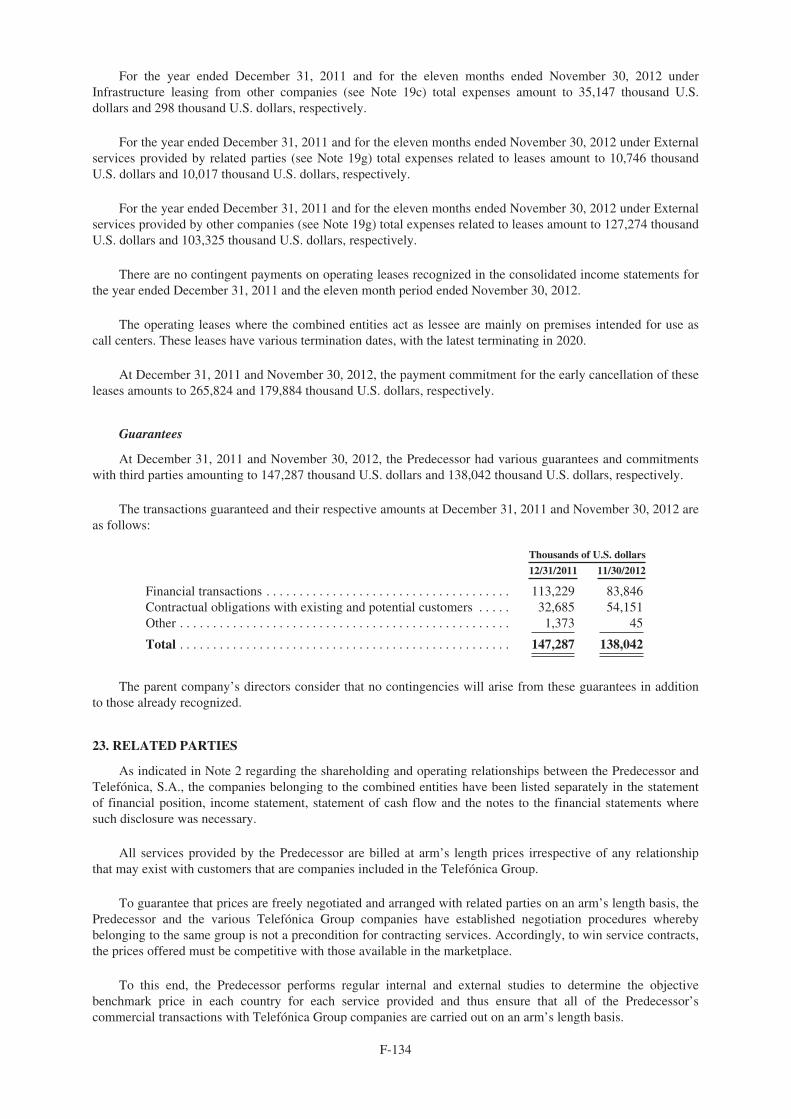
For the year ended December 31, 2011 and for the eleven months ended November 30, 2012 underInfrastructure leasing from other companies (see Note 19c) total expenses amount to 35,147 thousand U.S.dollars and 298 thousand U.S. dollars, respectively.
For the year ended December 31, 2011 and for the eleven months ended November 30, 2012 under Externalservices provided by related parties (see Note 19g) total expenses related to leases amount to 10,746 thousandU.S. dollars and 10,017 thousand U.S. dollars, respectively.
For the year ended December 31, 2011 and for the eleven months ended November 30, 2012 under Externalservices provided by other companies (see Note 19g) total expenses related to leases amount to 127,274 thousandU.S. dollars and 103,325 thousand U.S. dollars, respectively.
There are no contingent payments on operating leases recognized in the consolidated income statements forthe year ended December 31, 2011 and the eleven month period ended November 30, 2012.
The operating leases where the combined entities act as lessee are mainly on premises intended for use ascall centers. These leases have various termination dates, with the latest terminating in 2020.
At December 31, 2011 and November 30, 2012, the payment commitment for the early cancellation of theseleases amounts to 265,824 and 179,884 thousand U.S. dollars, respectively.
Guarantees
At December 31, 2011 and November 30, 2012, the Predecessor had various guarantees and commitmentswith third parties amounting to 147,287 thousand U.S. dollars and 138,042 thousand U.S. dollars, respectively.
The transactions guaranteed and their respective amounts at December 31, 2011 and November 30, 2012 areas follows:
Thousands of U.S. dollars
12/31/2011 11/30/2012
Financial transactions . . . . . . . . . . . . . . . . . . . . . . . . . . . . . . . . . . . . . 113,229 83,846Contractual obligations with existing and potential customers . . . . . 32,685 54,151Other . . . . . . . . . . . . . . . . . . . . . . . . . . . . . . . . . . . . . . . . . . . . . . . . . . 1,373 45
Total . . . . . . . . . . . . . . . . . . . . . . . . . . . . . . . . . . . . . . . . . . . . . . . . . . 147,287 138,042
The parent company’s directors consider that no contingencies will arise from these guarantees in additionto those already recognized.
23. RELATED PARTIES
As indicated in Note 2 regarding the shareholding and operating relationships between the Predecessor andTelefónica, S.A., the companies belonging to the combined entities have been listed separately in the statementof financial position, income statement, statement of cash flow and the notes to the financial statements wheresuch disclosure was necessary.
All services provided by the Predecessor are billed at arm’s length prices irrespective of any relationshipthat may exist with customers that are companies included in the Telefónica Group.
To guarantee that prices are freely negotiated and arranged with related parties on an arm’s length basis, thePredecessor and the various Telefónica Group companies have established negotiation procedures wherebybelonging to the same group is not a precondition for contracting services. Accordingly, to win service contracts,the prices offered must be competitive with those available in the marketplace.
To this end, the Predecessor performs regular internal and external studies to determine the objectivebenchmark price in each country for each service provided and thus ensure that all of the Predecessor’scommercial transactions with Telefónica Group companies are carried out on an arm’s length basis.
F-134
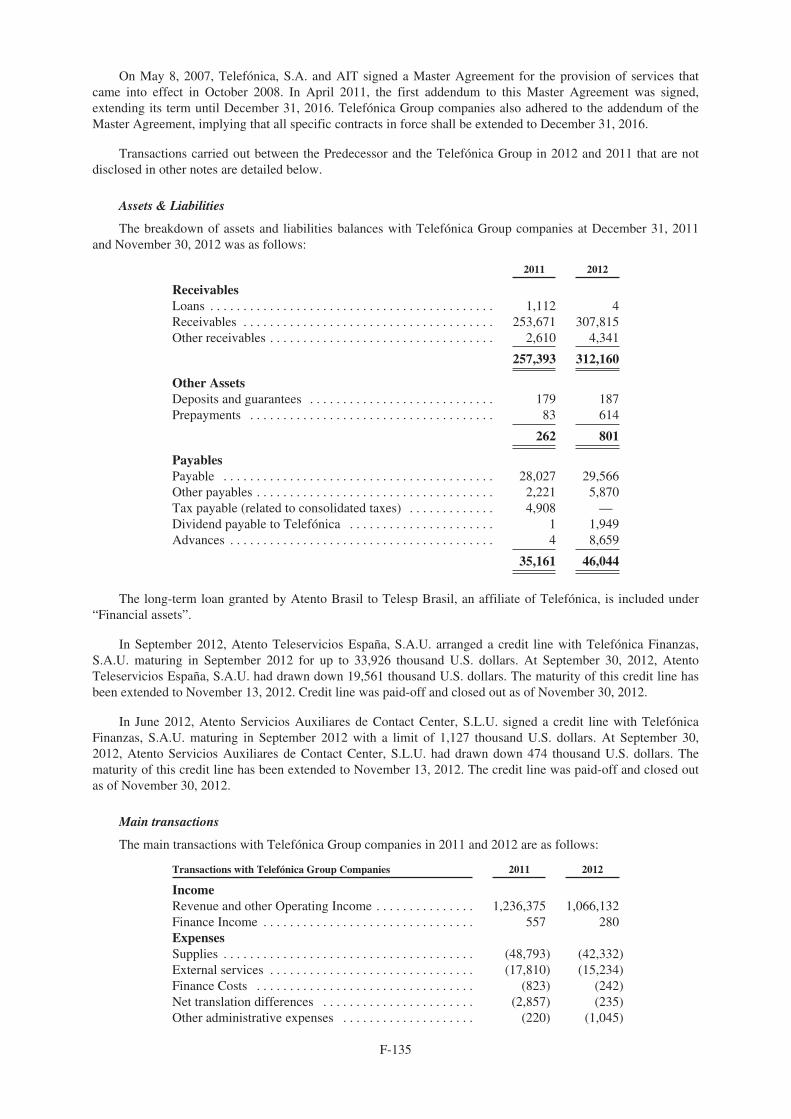
On May 8, 2007, Telefónica, S.A. and AIT signed a Master Agreement for the provision of services thatcame into effect in October 2008. In April 2011, the first addendum to this Master Agreement was signed,extending its term until December 31, 2016. Telefónica Group companies also adhered to the addendum of theMaster Agreement, implying that all specific contracts in force shall be extended to December 31, 2016.
Transactions carried out between the Predecessor and the Telefónica Group in 2012 and 2011 that are notdisclosed in other notes are detailed below.
Assets & Liabilities
The breakdown of assets and liabilities balances with Telefónica Group companies at December 31, 2011and November 30, 2012 was as follows:
2011 2012
ReceivablesLoans . . . . . . . . . . . . . . . . . . . . . . . . . . . . . . . . . . . . . . . . . . . 1,112 4Receivables . . . . . . . . . . . . . . . . . . . . . . . . . . . . . . . . . . . . . . 253,671 307,815Other receivables . . . . . . . . . . . . . . . . . . . . . . . . . . . . . . . . . . 2,610 4,341
257,393 312,160
Other AssetsDeposits and guarantees . . . . . . . . . . . . . . . . . . . . . . . . . . . . 179 187Prepayments . . . . . . . . . . . . . . . . . . . . . . . . . . . . . . . . . . . . . 83 614
262 801
PayablesPayable . . . . . . . . . . . . . . . . . . . . . . . . . . . . . . . . . . . . . . . . . 28,027 29,566Other payables . . . . . . . . . . . . . . . . . . . . . . . . . . . . . . . . . . . . 2,221 5,870Tax payable (related to consolidated taxes) . . . . . . . . . . . . . 4,908 —Dividend payable to Telefónica . . . . . . . . . . . . . . . . . . . . . . 1 1,949Advances . . . . . . . . . . . . . . . . . . . . . . . . . . . . . . . . . . . . . . . . 4 8,659
35,161 46,044
The long-term loan granted by Atento Brasil to Telesp Brasil, an affiliate of Telefónica, is included under“Financial assets”.
In September 2012, Atento Teleservicios España, S.A.U. arranged a credit line with Telefónica Finanzas,S.A.U. maturing in September 2012 for up to 33,926 thousand U.S. dollars. At September 30, 2012, AtentoTeleservicios España, S.A.U. had drawn down 19,561 thousand U.S. dollars. The maturity of this credit line hasbeen extended to November 13, 2012. Credit line was paid-off and closed out as of November 30, 2012.
In June 2012, Atento Servicios Auxiliares de Contact Center, S.L.U. signed a credit line with TelefónicaFinanzas, S.A.U. maturing in September 2012 with a limit of 1,127 thousand U.S. dollars. At September 30,2012, Atento Servicios Auxiliares de Contact Center, S.L.U. had drawn down 474 thousand U.S. dollars. Thematurity of this credit line has been extended to November 13, 2012. The credit line was paid-off and closed outas of November 30, 2012.
Main transactions
The main transactions with Telefónica Group companies in 2011 and 2012 are as follows:
Transactions with Telefónica Group Companies 2011 2012
IncomeRevenue and other Operating Income . . . . . . . . . . . . . . . 1,236,375 1,066,132Finance Income . . . . . . . . . . . . . . . . . . . . . . . . . . . . . . . . 557 280ExpensesSupplies . . . . . . . . . . . . . . . . . . . . . . . . . . . . . . . . . . . . . . (48,793) (42,332)External services . . . . . . . . . . . . . . . . . . . . . . . . . . . . . . . (17,810) (15,234)Finance Costs . . . . . . . . . . . . . . . . . . . . . . . . . . . . . . . . . (823) (242)Net translation differences . . . . . . . . . . . . . . . . . . . . . . . (2,857) (235)Other administrative expenses . . . . . . . . . . . . . . . . . . . . (220) (1,045)
F-135
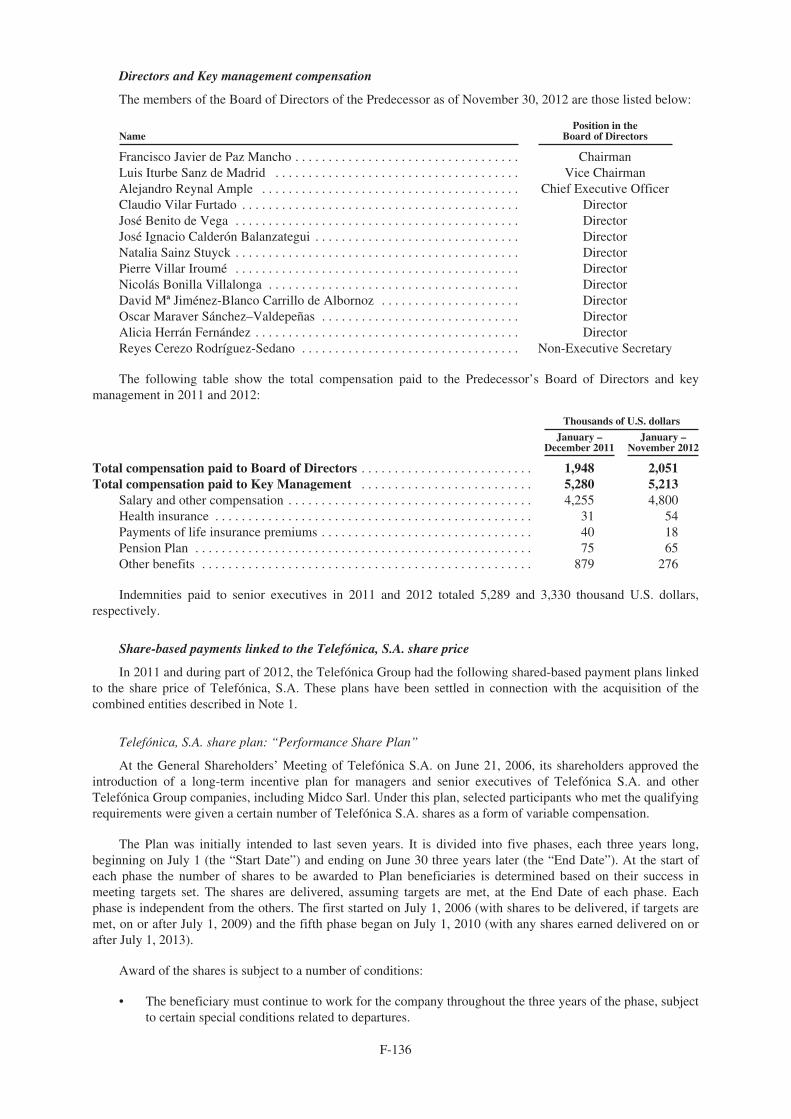
Directors and Key management compensation
The members of the Board of Directors of the Predecessor as of November 30, 2012 are those listed below:
NamePosition in the
Board of Directors
Francisco Javier de Paz Mancho . . . . . . . . . . . . . . . . . . . . . . . . . . . . . . . . . . ChairmanLuis Iturbe Sanz de Madrid . . . . . . . . . . . . . . . . . . . . . . . . . . . . . . . . . . . . . Vice ChairmanAlejandro Reynal Ample . . . . . . . . . . . . . . . . . . . . . . . . . . . . . . . . . . . . . . . Chief Executive OfficerClaudio Vilar Furtado . . . . . . . . . . . . . . . . . . . . . . . . . . . . . . . . . . . . . . . . . . DirectorJosé Benito de Vega . . . . . . . . . . . . . . . . . . . . . . . . . . . . . . . . . . . . . . . . . . . DirectorJosé Ignacio Calderón Balanzategui . . . . . . . . . . . . . . . . . . . . . . . . . . . . . . . DirectorNatalia Sainz Stuyck . . . . . . . . . . . . . . . . . . . . . . . . . . . . . . . . . . . . . . . . . . . DirectorPierre Villar Iroumé . . . . . . . . . . . . . . . . . . . . . . . . . . . . . . . . . . . . . . . . . . . DirectorNicolás Bonilla Villalonga . . . . . . . . . . . . . . . . . . . . . . . . . . . . . . . . . . . . . . DirectorDavid Mª Jiménez-Blanco Carrillo de Albornoz . . . . . . . . . . . . . . . . . . . . . DirectorOscar Maraver Sánchez–Valdepeñas . . . . . . . . . . . . . . . . . . . . . . . . . . . . . . DirectorAlicia Herrán Fernández . . . . . . . . . . . . . . . . . . . . . . . . . . . . . . . . . . . . . . . . DirectorReyes Cerezo Rodríguez-Sedano . . . . . . . . . . . . . . . . . . . . . . . . . . . . . . . . . Non-Executive Secretary
The following table show the total compensation paid to the Predecessor’s Board of Directors and keymanagement in 2011 and 2012:
Thousands of U.S. dollars
January –December 2011
January –November 2012
Total compensation paid to Board of Directors . . . . . . . . . . . . . . . . . . . . . . . . . . 1,948 2,051Total compensation paid to Key Management . . . . . . . . . . . . . . . . . . . . . . . . . . 5,280 5,213
Salary and other compensation . . . . . . . . . . . . . . . . . . . . . . . . . . . . . . . . . . . . . 4,255 4,800Health insurance . . . . . . . . . . . . . . . . . . . . . . . . . . . . . . . . . . . . . . . . . . . . . . . . 31 54Payments of life insurance premiums . . . . . . . . . . . . . . . . . . . . . . . . . . . . . . . . 40 18Pension Plan . . . . . . . . . . . . . . . . . . . . . . . . . . . . . . . . . . . . . . . . . . . . . . . . . . . 75 65Other benefits . . . . . . . . . . . . . . . . . . . . . . . . . . . . . . . . . . . . . . . . . . . . . . . . . . 879 276
Indemnities paid to senior executives in 2011 and 2012 totaled 5,289 and 3,330 thousand U.S. dollars,respectively.
Share-based payments linked to the Telefónica, S.A. share price
In 2011 and during part of 2012, the Telefónica Group had the following shared-based payment plans linkedto the share price of Telefónica, S.A. These plans have been settled in connection with the acquisition of thecombined entities described in Note 1.
Telefónica, S.A. share plan: “Performance Share Plan”
At the General Shareholders’ Meeting of Telefónica S.A. on June 21, 2006, its shareholders approved theintroduction of a long-term incentive plan for managers and senior executives of Telefónica S.A. and otherTelefónica Group companies, including Midco Sarl. Under this plan, selected participants who met the qualifyingrequirements were given a certain number of Telefónica S.A. shares as a form of variable compensation.
The Plan was initially intended to last seven years. It is divided into five phases, each three years long,beginning on July 1 (the “Start Date”) and ending on June 30 three years later (the “End Date”). At the start ofeach phase the number of shares to be awarded to Plan beneficiaries is determined based on their success inmeeting targets set. The shares are delivered, assuming targets are met, at the End Date of each phase. Eachphase is independent from the others. The first started on July 1, 2006 (with shares to be delivered, if targets aremet, on or after July 1, 2009) and the fifth phase began on July 1, 2010 (with any shares earned delivered on orafter July 1, 2013).
Award of the shares is subject to a number of conditions:
• The beneficiary must continue to work for the company throughout the three years of the phase, subjectto certain special conditions related to departures.
F-136
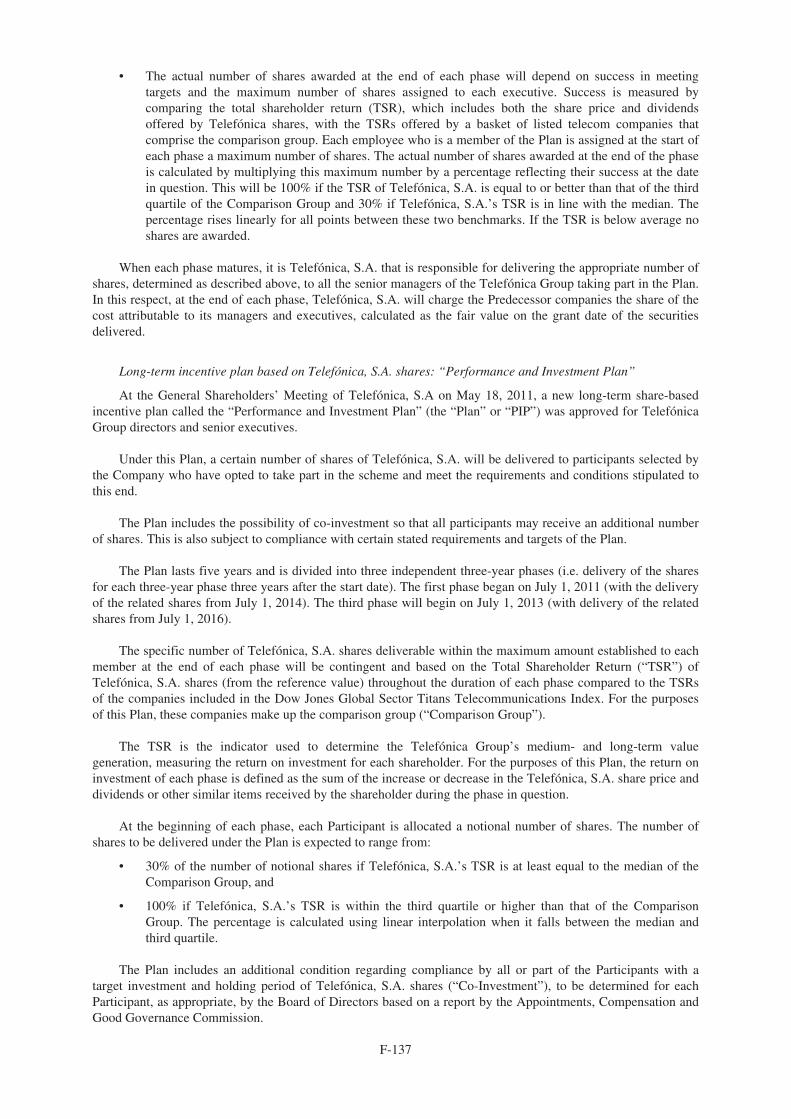
• The actual number of shares awarded at the end of each phase will depend on success in meetingtargets and the maximum number of shares assigned to each executive. Success is measured bycomparing the total shareholder return (TSR), which includes both the share price and dividendsoffered by Telefónica shares, with the TSRs offered by a basket of listed telecom companies thatcomprise the comparison group. Each employee who is a member of the Plan is assigned at the start ofeach phase a maximum number of shares. The actual number of shares awarded at the end of the phaseis calculated by multiplying this maximum number by a percentage reflecting their success at the datein question. This will be 100% if the TSR of Telefónica, S.A. is equal to or better than that of the thirdquartile of the Comparison Group and 30% if Telefónica, S.A.’s TSR is in line with the median. Thepercentage rises linearly for all points between these two benchmarks. If the TSR is below average noshares are awarded.
When each phase matures, it is Telefónica, S.A. that is responsible for delivering the appropriate number ofshares, determined as described above, to all the senior managers of the Telefónica Group taking part in the Plan.In this respect, at the end of each phase, Telefónica, S.A. will charge the Predecessor companies the share of thecost attributable to its managers and executives, calculated as the fair value on the grant date of the securitiesdelivered.
Long-term incentive plan based on Telefónica, S.A. shares: “Performance and Investment Plan”
At the General Shareholders’ Meeting of Telefónica, S.A on May 18, 2011, a new long-term share-basedincentive plan called the “Performance and Investment Plan” (the “Plan” or “PIP”) was approved for TelefónicaGroup directors and senior executives.
Under this Plan, a certain number of shares of Telefónica, S.A. will be delivered to participants selected bythe Company who have opted to take part in the scheme and meet the requirements and conditions stipulated tothis end.
The Plan includes the possibility of co-investment so that all participants may receive an additional numberof shares. This is also subject to compliance with certain stated requirements and targets of the Plan.
The Plan lasts five years and is divided into three independent three-year phases (i.e. delivery of the sharesfor each three-year phase three years after the start date). The first phase began on July 1, 2011 (with the deliveryof the related shares from July 1, 2014). The third phase will begin on July 1, 2013 (with delivery of the relatedshares from July 1, 2016).
The specific number of Telefónica, S.A. shares deliverable within the maximum amount established to eachmember at the end of each phase will be contingent and based on the Total Shareholder Return (“TSR”) ofTelefónica, S.A. shares (from the reference value) throughout the duration of each phase compared to the TSRsof the companies included in the Dow Jones Global Sector Titans Telecommunications Index. For the purposesof this Plan, these companies make up the comparison group (“Comparison Group”).
The TSR is the indicator used to determine the Telefónica Group’s medium- and long-term valuegeneration, measuring the return on investment for each shareholder. For the purposes of this Plan, the return oninvestment of each phase is defined as the sum of the increase or decrease in the Telefónica, S.A. share price anddividends or other similar items received by the shareholder during the phase in question.
At the beginning of each phase, each Participant is allocated a notional number of shares. The number ofshares to be delivered under the Plan is expected to range from:
• 30% of the number of notional shares if Telefónica, S.A.’s TSR is at least equal to the median of theComparison Group, and
• 100% if Telefónica, S.A.’s TSR is within the third quartile or higher than that of the ComparisonGroup. The percentage is calculated using linear interpolation when it falls between the median andthird quartile.
The Plan includes an additional condition regarding compliance by all or part of the Participants with atarget investment and holding period of Telefónica, S.A. shares (“Co-Investment”), to be determined for eachParticipant, as appropriate, by the Board of Directors based on a report by the Appointments, Compensation andGood Governance Commission.
F-137
In addition, and independently of any other conditions or requirements that may be established, in order tobe entitled to receive the corresponding shares, each Participant must be a Telefónica Group employee at thedelivery date for each phase, except in special cases as deemed appropriate.
Shares will be delivered at the end of each phase (i.e., in 2014, 2015, and 2016, respectively). The specificdelivery date will be determined by the Board of Directors or the committee or individual entrusted by the Boardto do so.
The shares to be delivered to Participants, subject to compliance with the pertinent legal requirements in thisconnection, may be either (a) treasury shares in Telefónica, S.A. acquired by Telefónica, S.A. itself or by any ofthe Telefónica Group companies; or (b) newly-issued shares.
2011
The third phase of the plan ended on June 30, 2011. A total of 72,176 shares were delivered by Telefónica,S.A. to the Predecessor’s managers.
At December 31, 2011, the maximum number of shares assigned to the Predecessor’s executives amountedto 255,668 shares.
The average term outstanding on these entitlements at December 31, 2011 is 1.5 years.
Therefore, at December 31, 2011, the amount recognized by the Predecessor was 1,480 thousandU.S. dollars, with the cost accrued in the period charged to personnel expenses for the portion of the cost accruedduring the year, considering the time elapsed from the launch of the Plan to the statement of financial positiondate, as well as the best estimate of the total cost attributable to it. This Plan was terminated in 2012 upon theclose of the Acquisition.
24. EVENTS AFTER THE END OF THE REPORTING PERIOD
We have evaluated subsequent events through April 29, 2014, the date these combined carve-out financialstatements were available to be issued and have identified the following subsequent events. In December 2012,Telefónica, S.A. and certain funds affiliated with Bain Capital Partners, LLC reached a definitive agreement forthe acquisition, through the Successor, of the 100% of the businesses carried out by the combined entities. Afterthe acquisition date, which was established on December 1, 2012, the combined entities are controlled by theSuccessor directly or through intermediate holding companies. The consideration paid amounts to approximately1,022,184 thousand U.S. dollars.
The Successor has accounted for the acquisition of the combined entities in accordance with IFRS 3,Business Combinations, and has recorded assets acquired and liabilities assumed at fair value.
At February 3, 2014, Banco Nacional de Desenvolvimento Economico e Social (BNDES) granted a creditfacility to the subsidiary Atento Brasil, S.A. for an amount equivalent to approximately 124.5 millionU.S. dollars. On March 27, 2014 and April 16, 2014, BNDES disbursed BRL 56.6 million (24.8 millionU.S. dollars) and BRL 23.7 million (10.6 million U.S. dollars) portions respectively of the total facility,accounting for 26.8% of total credit line.
F-138