Embed Size (px)
Citation preview
Draft version November 16, 2018Preprint typeset using LATEX style AASTeX6 v. 1.0
OPTICAL PROPERTIES OF NON-STOICHIOMETRIC AMORPHOUS SILICATES WITH APPLICATION TO
CIRCUMSTELLAR DUST EXTINCTION
Akemi Tamanai1 and Annemarie Pucci1
Universitat Heidelberg, Kirchhoff-Institut fur Physik, Im Neuenheimer Feld 227, 69120 Heidelberg, Germany
Ralf Dohmen2
Ruhr Universitat Bochum, Institut fur Geologie, Mineralogie und Geophysik,
Universitatsstr. 150, 44780 Bochum, Germany
Hans-Peter Gail3
Universitat Heidelberg, Zentrum fur Astronomie, Institut fur Theoretische Astrophysik,
Albert-Ueberle-Str. 2, 69120 Heidelberg, Germany
ABSTRACT
We determine the optical constants of non-stoichiometric amorphous magnesium-iron silicates and
demonstrate that these can well reproduce the observed mid-infrared emission spectra of evolved
stars. Stoichiometric and non-stoichiometric amorphous magnesium-iron silicate films are fabricated
by pulsed laser deposition. Transmittance and ellipsometry measurements are performed in the wave-
length range between 2 and 200 µm and 1.7 and 33 µm, respectively. Optical constants are derived
from transmittance and ellipsometric Ψ and ∆ spectra by means of oscillator models. These newly
obtained optical constants are applied in radiative transfer models for examining reproducibility of
the observed spectral features of circumstellar dust shells around supergiants. The spectra of four
selected supergiants are dominated by amorphous silicate dust emission in the wavelength range of 9
and 25 µm. To obtain a good fit to the observed spectra, we take into account amorphous corundum
and metallic iron particles as additional dust components to the model calculations to rationalize the
dust emission at λ < 8 µm. For each of the objects, a set of model parameters (dust mass, conden-
sation temperature) is derived by an automated optimization procedure which well reproduces the
observation. Consequently, our model spectra using new optical data find that the silicate bands at
∼ 10 and ∼ 18 µm depend on the magnesium and iron ratio in the silicate system, and that a good fit
requires a significant iron content of the amorphous silicate dust component to reproduce the observed
peak positions and shape of the silicate bands.
Keywords: circumstellar matter – stars: mass-loss – stars: winds, outflows – stars: AGB and post-AGB
1. INTRODUCTION
The standard cosmic element mixture found almost
everywhere in space is oxygen-rich. The oxygen abun-
dance exceeds that of carbon usually by a factor of about
two (see, e.g., Asplund et al. 2009; Lodders et al. 2009),
in which case carbon is chemically blocked in the CO
molecule. If refractory minerals form from such matter
the resulting mixture of condensed phases is strongly
dominated by the magnesium-iron (hereafter Mg-Fe) sil-
icates (e.g. Gail 2010). Silicate dust is therefore ubiqui-
tous in space if conditions are such that solids can resist
to the ever-present destroying mechanisms. Mg-Fe sil-
icates form the dominating dust component in circum-
stellar environments like protostellar accretion disks or
dust shells of evolved late type stars (if these are not
carbon-rich), and forms, besides carbon dust, the main
dust component of interstellar matter.
The nature of the dust material in space is inferred
from the wavelength dependence of the interstellar ex-
tinction or the infrared (IR) emission spectrum from cir-
cumstellar environments. In particular some strong IR
bands from lattice vibrations are indicative of the na-
ture of the material present and these have been exten-
sively used for remote sensing of the dust composition inspace (see Molster et al. 2010, for a review on observa-
arX
iv:1
707.
0090
3v1
[as
tro-
ph.S
R]
4 J
ul 2
017
2
tions). For silicate dust one uses in particular their ab-
sorption bands from stretching and bending vibrations
of the SiO4-tetrahedron around 10 µm and 18 µm, re-
spectively, and if the silicates are crystalline, there are
many additional absorption bands up to 100 µm (e.g.
Koike et al. 2003) that can be observed.
Since the earliest days of research on dust in space,
it is known (see Li 2005, for a historical review) that
the interstellar silicate dust component has an amor-
phous lattice structure. This is recognized by the broad
and smooth shape of the IR bands around 9.7 µm and
18 µm without showing the characteristic sub-structures
seen for crystalline silicates, and by the absence of far-
infrared (FIR) bands & 25 µm of crystalline materials.
Crystalline silicate dust also has been found in space,
but this is limited to special environments: circumstel-
lar dust shells and protostellar accretion disks (Molster
et al. 2010). While for accretion disks, it is quite com-
mon to have part of the silicate dust in crystalline form
and most of it as amorphous materials (e.g. Oliveira
et al. 2011), for circumstellar dust shells the presence
of some fraction of crystalline silicate dust is restricted
to an only small fraction of the objects (cf. Jones et al.
2012). Most part of the silicate dust in accretion disks
and circumstellar envelopes is seen to have an amor-
phous lattice structure like interstellar medium (ISM)
dust.
The analysis of the observed dust features requires a
detailed knowledge of the optical properties which are
largely ruled by the complex dielectric function ε(ω) of
the dust grains. Since silicate dust in space mostly has
an amorphous structure, much effort has been under-
taken to determine the variation of ε(ω) for amorphous
silicates with different compositions and prepared by
various fabrication techniques. Colangeli et al. (2003)
have reviewed the experimental work and its main re-
sults some time ago.
Optical data of olivine-like amorphous silicates with
different Fe-content are of special importance for as-
tronomical applications. While crystalline silicate dust
formed from a cosmic element mixture under near equi-
librium conditions, which are a mixture of almost Fe-free
forsterite and enstatite (e.g. Grossman 1972; Gail 2010),
the amorphous cosmic dust seems to have a different
composition due to strongly deviating formation condi-
tions in non-equilibrium condensation processes. Inter-
stellar silicate dust seems to be dominated by an amor-
phous material with composition approximately equal to
MgFeSiO4 (Draine 2003). In accretion disks, the amor-
phous dust component seems to be a more complex mix-
ture of materials with olivine-like (Mg2xFe2(1−x)SiO4)
and pyroxene-like (MgxFe1−xSiO3) composition with a
considerable iron content (1−x ≈ 0.3), (see Pollack et al.
1994), but also high fractions of crystalline olivine and
pyroxene have been reported in some cases (e.g. Watson
et al. 2009). In circumstellar dust shells, the amorphous
dust component seems also to consist of olivine- and
pyroxene-like materials with varying iron content (Mol-
ster et al. 2010).
Laboratory-measured optical properties of various
amorphous silicates have been reported so far. Day
(1979, 1981) fabricated amorphous Mg- (MgSiO3 &
Mg2SiO4) and Fe- (FeSiO3 & Fe2SiO4) silicate thin films
on KBr (potassium bromide) disks by means of reac-
tive sputtering for transmission measurements in IR re-
gions. Optical constants of these films were derived
by use of classical dispersion theory. Amorphous sil-
icate glasses with different proportions of Fe and Mg
in both pyroxene- and olivine-like systems were pro-
duced by making use of quenching-melts technique,
and both transmittance and reflectance measurements
were carried out with KBr pellet and thin slab meth-
ods, respectively, in the wavelength range between 0.19
and 500 µm (Dorschner et al. 1995). They derived
the optical constants of each amorphous silicate glass
by Kramers-Kronig relations. Likewise, Jager et al.
(2003) adopted the sol-gel technique so as to fabricate
non-stoichiometric pyroxene samples of the composition
MgxSiOy (x=0.7, 1, 1.5, 2, 2.4; y=2.7, 3, 3.5, 4, 4.4),
and reflectance spectra of dense pellets embedded in
epoxy resin and transmittance spectra of KBr (for MIR)
and PE (polyethylene for FIR) were measured as func-
tions of wavelength in the range 0.2 – 200 µm. These
optical constants were obtained by either the Lorenz-
oscillator fit method or Kramers-Kronig relations or
both. In most cases, experimentally measured opti-
cal properties are represented by absorption, transmis-
sion, or reflection (Koike & Hasegawa 1987; Tamanai
et al. 2006; Speck et al. 2011). In fact, highly accurate
optical constants of various materials are an essential
prerequisite for astrophysical modelings e.g. interstellar
dust, accretion disks around young stars, planetary at-
mospheres, and cometary dust tails. However, optical
constants of diverse chemical compositions, especially,
amorphous materials with different conditions such as
temperature- and pressure-dependent (e.g. high tem-
perature & 1273 K) and morphological aspect includ-
ing particle irregularity in shape, aggregate/agglomerate
states, and various individual particle sizes are not that
much available.
In this paper, we describe the optical properties of
non-stoichiometric amorphous silicates with composi-
tion between olivine-like and pyroxene-like and vary-
ing iron content, fabricated by pulsed laser deposition
(PLD) technique in the MIR and FIR regions so as
to characterize the effect of metals (Mg & Fe) on the
silicate absorption. For cross-checking the optical con-
stants of each investigated silicate, we carried out both
3
spectroscopic transmittance and ellipsometry measure-
ments. As an application, the newly derived optical con-
stants are utilized to compare synthetic spectra of dust
shells around supergiants to observed MIR spectra of
four objects.
2. SILICATE STARDUST
Information on the composition and size of silicate
dust grains from circumstellar dust shells enshrouding
highly evolved stars can be obtained in two ways.
The standard way is to compare IR spectra from the
objects of interest with template spectra calculated from
measured optical properties of laboratory made analo-
gous minerals and with models for the source regions
(see, e.g., Molster et al. (2010), Henning (2010), and
Colangeli et al. (2003) for reviews).
The second possibility is to analyze specimens of cos-
mic dust in the laboratory. This has become possible
by the detection in the 1980’s that primitive meteorites
contain a small fraction of stardust grains of different
composition from different stellar sources (see, e.g., the
collection of articles in Bernatovicz & Zinner (1997) or
the review of Lodders & Amari (2005)), the presolar
dust grains, which are identifyable by their suspicious
isotopic anomalies found for some elements. This al-
lows a direct study of their properties and composition
in the laboratory. Since the detection by Nguyen &
Zinner (2004) that also silicates from stellar sources are
present in meteorites it has become possible also to an-
alyze presolar silicate dust grains. Vollmer et al. (2009),
Bose et al. (2010), Nguyen et al. (2010), and Bose et al.
(2012) have provided direct information on the size and
composition for 145 such presolar silicate grains.
We concentrate here on silicate grains from the mete-
orite ACFER 094, a primitive ungrouped carbonaceous
chondrite, because the matrix material in this meteorite
seems to be only slightly metamorphosed. The ma-
trix material has not been subject to high temperatures
where the material would equilibrate and the presolar
silicate grains in this meteorite show only indications of
minor aqueous alteration and oxidation of Fe metal on
the parent body (e.g. Keller et al. 2012). Hence, the
compositions of the silicate grains probably largely re-
semble their composition at formation time in the dust
shell of an AGB star.
The fractional abundance of the six major rock form-
ing elements (O, Si, Mg, Fe, Ca, and Al) was studied in
Vollmer et al. (2009), Bose et al. (2010), Nguyen et al.
(2010), and Bose et al. (2012). We try to derive from the
laboratory derived fractional abundances of the elements
given in these papers the corresponding abundances of
the oxides SiO2, SiO, MgO, FeO, CaO and Al2O3 and
of solid iron in the dust grains which reproduces their
observed elemental composition and considers also the
10-8
10-6
10-4
10-2
100
102
90 95 100 105
χ2
atom percent
(a)
0
0.2
0.4
0.6
0.8
1
0 10 20 30
(Fe (
s) +
2F
e 2O
3) /
Fe
Fe / Si
(b)
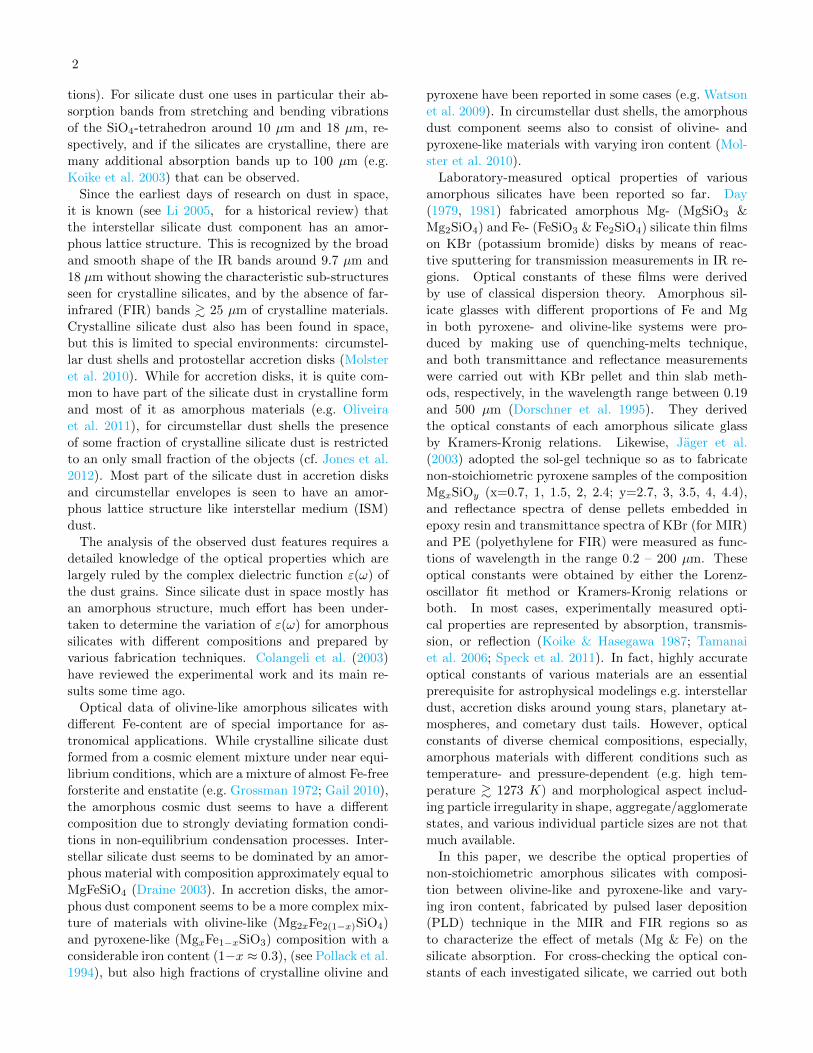
Figure 1. (a) Least square fit of composition of presolarsilicate grains from meteorite ACFER 094. The value of χ2
is plotted versus the sum of all atom-percents of the optimumfit of the elements. Circles correspond to data from Vollmeret al. (2009), squares to data from Bose et al. (2010). (b)Fraction of the total Fe not bound in the silicates, plottedfor all grains for which χ2 < 0.01, versus the atom percentof Fe in the grains. Fe(s) denotes the solid iron component.
stiochiometry of the elements.
The oxide SiO is added to the set because there exist
complex silicate structures (e.g. chains of rings) where
O/Si ratios formally correspond to an oxide component
SiOx with 1 ≤ x ≤ 2 such that the astronomical sili-
cates may deviate in their composition from the usually
assumed olivine or enstatite stoichiometry. To account
for a more complex stoichiometry the SiO is included.
We add metallic iron to the set of oxide components
since it is known that presolar silicate dust grains may
contain iron grains as nm-sized inclusions, at least in
some cases. Also iron sulphide particles are commonly
found as nm-sized inclusions if iron particles are present.
These inclusions are found in GEMS, a class of subgrains
in interplanetary dust particles (IDPs) which are char-
acterized by the presence of iron and iron-sulphide inclu-
sion embedded in a glassy ground matrix. While most of
such grains seem to be of interstellar or solar system ori-
gin, a few percent show oxygen isotopic anomalies point-
ing to an origin as stellar or supernova condensate (e.g.
Messenger et al. 2003; Matzel et al. 2008; Keller & Mes-
senger 2011). We cannot take account of the presence
of FeS particles because no S abundance was measured.
Additionally we consider Fe2O3 as a possible compo-
nent. It is unlikely that iron can be oxidized to the Fe3+
state under the strongly reducing circumstellar condi-
tions, but the presolar material may be oxidized during
its residence on the parent body of the meteorite or on
the earth’s surface before being collected.
This set of components does not cover all possibilities
for the composition of presolar material from oxygen-
rich parent stars, but the most important ones. The
relative abundances of the components are determined
by a least square minimization such that the relative
4
0
0.5
1
1.5
2
2.5
3
3.5
0 0.5 1 1.5 2 2.5 3 3.5 4 4.5 5
(a)
(Mg
+ F
e* ) / S
i
oxygen / silicon
0
0.5
1
1.5
0 0.5 1 1.5 2 2.5 3 3.5 4 4.5 5
(b)
Fe* /
(Mg+
Fe* )
oxygen / silicon
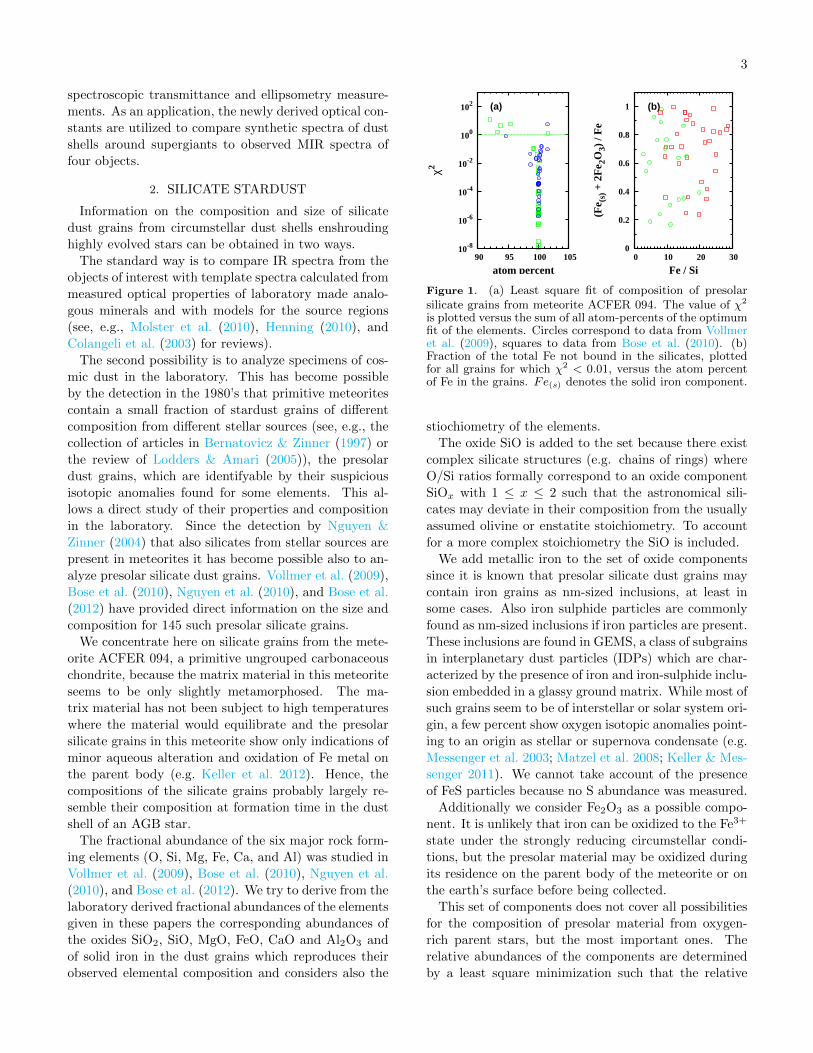
Figure 2. Composition of presolar silicate grains from mete-orite ACFER 094. Circles correspond to data from Vollmeret al. (2009), squares to data from Bose et al. (2010). Thered diamonds refer to the synthetic amorphous silicates stud-ied in this paper (see Table 1). The Fe∗ refers to that partof the total iron content that is part of the silicate lattice.(a) Correlation between cation/Si ratio and O/Si ratio. Thegray vertical bars indicate the O/Si ratio for a number sil-icate mineral structures and of solid SiO. (b) Number ofFe∗ atoms in the silicate lattice relative to total number ofcations (Mg+Fe∗).
abundance of the sum of all elements in the mixture fits
as well as possible the measured elemental abundances.
Figure 1a shows the resulting value of χ2 as function
of the fractional abundance of the sum of all elements
contained in the particle (in the figure: the percentage).
Ideally, this should sum up to 1.0 or to 100%. For most
particles a solution can be found breaking down the ma-
terial into the fundamental oxides and the additional Fe
that fits the experimental data with an accuracy better
than 10−2; in many cases even much better. This sug-
gests the corresponding particle likely to be composed
of minerals (and free iron) that contain the seven oxide
components SiO2, SiO, MgO, FeO, Fe2O3, CaO, Al2O3.
For particles where the optimum fit fails to reproduce
the measured element abundances within the limits of
10−2 the grains either contain significant fractions of ad-
ditional elements, or components with an alternate com-
position, or the measurements are inaccurate for some
reasons. We exclude those particles from further con-
siderations.
With respect to iron-bearing components found in the
fit the following holds: Metallic iron must be an inclu-
sion in the silicate or attached to its surface, and any
portion of Fe2O3 must be a secondary product of oxi-
dation of iron metal during the residence time on the
parent body or on earth. Only the fraction of Fe not
contained in these two components could be part of the
silicate material. Figure 1b shows the fraction of the
total Fe content that seems to have been built into the
presolar silicate grains as iron metal during particle for-
mation. Surprisingly, the laboratory determined com-
position of the silicate grains can be best explained if a
high fraction of the Fe contained in the presolar grains is
not part of the silicate lattice but is contained as metal-
lic iron particles, either as inclusions within the grains
or attached to its surface. The size of such iron particles
must be generally below the resolution limit of the nano-
SIMS (∼ 50 nm) used for the investigations (Vollmer
et al. 2009; Bose et al. 2010; Nguyen et al. 2010; Boseet al. 2012) because it is not reported in the papers that
such inclusions are detected in all or most of the grains.
Atom ratios Fe/Si up to 0.3 are frequent, which convert
to metal/silicate volume ratios of up to about 0.15.
Part of the particles contain some fraction of Al and
Ca. This indicates heterogeneous composed particles of
silicate and aluminum-calcium minerals or a complex
chemical composition of the grains. To avoid any am-
biguity resulting from this we do not consider Ca-Al-
bearing particles. The remaining particles are (more or
less) pure magnesium-iron-silicate particles where part
of the iron seems to be present as metallic iron.
Figure 2a shows the correlation between the cation to
silicon ratio in the presolar grains. The vertical gray
lines correspond to the O/Si ratios in different min-
eral structures varying from O/Si = 2 for framework
silicates to O/Si = 4 for island silicates and intermedi-
ate values for chain and ring silicates, and for solid SiO
(O/Si = 1). The presolar silicates cover the whole range
with no preference for one of the specific values corre-
sponding to well-defined mineral structures. This sug-
gests the amorphous character of circumstellar silicates
does not solely refers to a disorder in the arrangement
of the SiO4-building blocks in a material with other-
wise well defined composition as for mineral compounds,
as it was obtained by melt-quenching (Dorschner et al.
1995). Such kind of disorder will also manifests itself in
broad smeared-out ∼ 10 µm and ∼ 18 µm silicate bands.
The silicates condensed in stars seem to have more than
that also compositions with highly variable fractions of
bridging bonds between the SiO4-tetrahedrons not cor-
responding to any of the regular structures of minerals.
They may resemble the “chaotic silicates” discussed by
Nuth & Hecht (1990) and such a kind of material may
also form during the rapid quenching of vapor by the
vapor deposition fabrication method used for preparing
the amorphous thin films used by us (see Sect. 3.1).
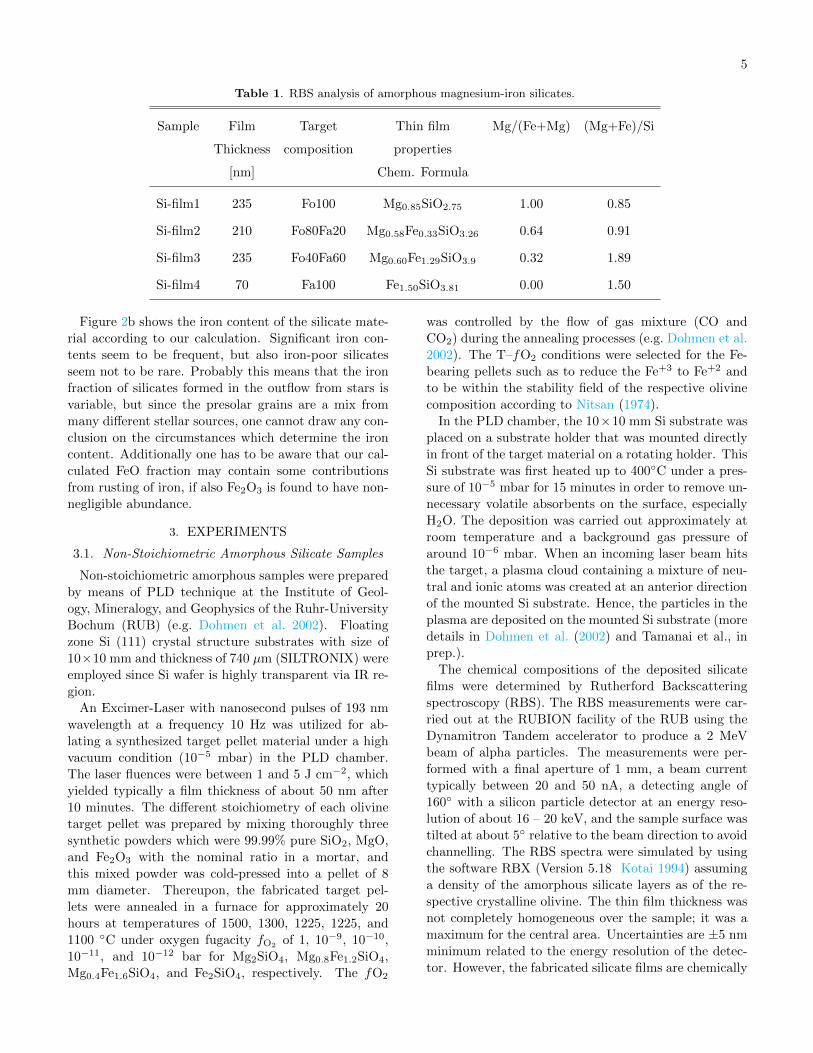
5
Table 1. RBS analysis of amorphous magnesium-iron silicates.
Sample Film Target Thin film Mg/(Fe+Mg) (Mg+Fe)/Si
Thickness composition properties
[nm] Chem. Formula
Si-film1 235 Fo100 Mg0.85SiO2.75 1.00 0.85
Si-film2 210 Fo80Fa20 Mg0.58Fe0.33SiO3.26 0.64 0.91
Si-film3 235 Fo40Fa60 Mg0.60Fe1.29SiO3.9 0.32 1.89
Si-film4 70 Fa100 Fe1.50SiO3.81 0.00 1.50
Figure 2b shows the iron content of the silicate mate-
rial according to our calculation. Significant iron con-
tents seem to be frequent, but also iron-poor silicates
seem not to be rare. Probably this means that the iron
fraction of silicates formed in the outflow from stars is
variable, but since the presolar grains are a mix from
many different stellar sources, one cannot draw any con-
clusion on the circumstances which determine the iron
content. Additionally one has to be aware that our cal-
culated FeO fraction may contain some contributions
from rusting of iron, if also Fe2O3 is found to have non-
negligible abundance.
3. EXPERIMENTS
3.1. Non-Stoichiometric Amorphous Silicate Samples
Non-stoichiometric amorphous samples were prepared
by means of PLD technique at the Institute of Geol-
ogy, Mineralogy, and Geophysics of the Ruhr-University
Bochum (RUB) (e.g. Dohmen et al. 2002). Floating
zone Si (111) crystal structure substrates with size of
10×10 mm and thickness of 740 µm (SILTRONIX) were
employed since Si wafer is highly transparent via IR re-
gion.
An Excimer-Laser with nanosecond pulses of 193 nm
wavelength at a frequency 10 Hz was utilized for ab-
lating a synthesized target pellet material under a high
vacuum condition (10−5 mbar) in the PLD chamber.
The laser fluences were between 1 and 5 J cm−2, which
yielded typically a film thickness of about 50 nm after
10 minutes. The different stoichiometry of each olivine
target pellet was prepared by mixing thoroughly three
synthetic powders which were 99.99% pure SiO2, MgO,
and Fe2O3 with the nominal ratio in a mortar, and
this mixed powder was cold-pressed into a pellet of 8
mm diameter. Thereupon, the fabricated target pel-
lets were annealed in a furnace for approximately 20
hours at temperatures of 1500, 1300, 1225, 1225, and
1100 C under oxygen fugacity fO2 of 1, 10−9, 10−10,
10−11, and 10−12 bar for Mg2SiO4, Mg0.8Fe1.2SiO4,
Mg0.4Fe1.6SiO4, and Fe2SiO4, respectively. The fO2
was controlled by the flow of gas mixture (CO and
CO2) during the annealing processes (e.g. Dohmen et al.
2002). The T–fO2 conditions were selected for the Fe-
bearing pellets such as to reduce the Fe+3 to Fe+2 and
to be within the stability field of the respective olivine
composition according to Nitsan (1974).
In the PLD chamber, the 10×10 mm Si substrate was
placed on a substrate holder that was mounted directly
in front of the target material on a rotating holder. This
Si substrate was first heated up to 400C under a pres-
sure of 10−5 mbar for 15 minutes in order to remove un-
necessary volatile absorbents on the surface, especially
H2O. The deposition was carried out approximately at
room temperature and a background gas pressure of
around 10−6 mbar. When an incoming laser beam hits
the target, a plasma cloud containing a mixture of neu-
tral and ionic atoms was created at an anterior direction
of the mounted Si substrate. Hence, the particles in the
plasma are deposited on the mounted Si substrate (more
details in Dohmen et al. (2002) and Tamanai et al., in
prep.).
The chemical compositions of the deposited silicate
films were determined by Rutherford Backscattering
spectroscopy (RBS). The RBS measurements were car-
ried out at the RUBION facility of the RUB using the
Dynamitron Tandem accelerator to produce a 2 MeV
beam of alpha particles. The measurements were per-
formed with a final aperture of 1 mm, a beam current
typically between 20 and 50 nA, a detecting angle of
160 with a silicon particle detector at an energy reso-
lution of about 16 – 20 keV, and the sample surface was
tilted at about 5 relative to the beam direction to avoid
channelling. The RBS spectra were simulated by using
the software RBX (Version 5.18 Kotai 1994) assuming
a density of the amorphous silicate layers as of the re-
spective crystalline olivine. The thin film thickness was
not completely homogeneous over the sample; it was a
maximum for the central area. Uncertainties are ±5 nm
minimum related to the energy resolution of the detec-
tor. However, the fabricated silicate films are chemically
6
200 400 600 800 1000 1200 1400 3000 4500
0.8
0.9
1.0
1.1
1.2
200 nm
MIR measurement FIR measurement
wavelength [µm]re
l. tra
nsm
ittan
ce
wavenumbers [cm -1]
24615 100 30 20 10
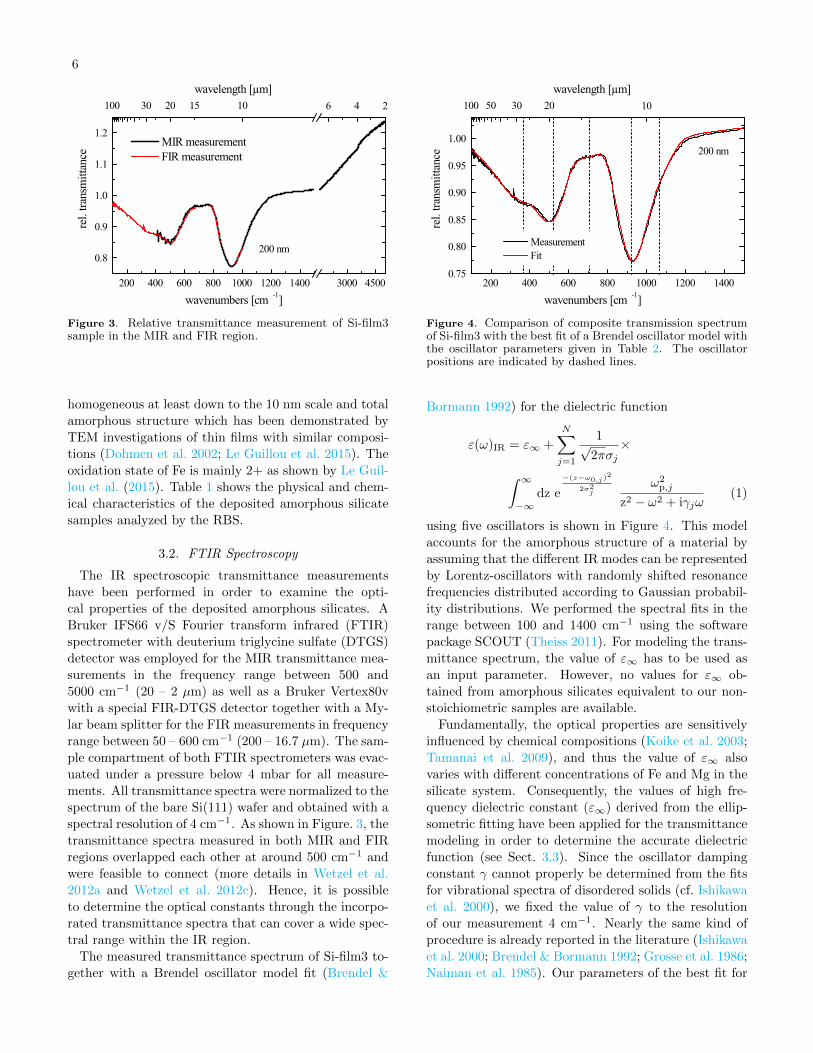
Figure 3. Relative transmittance measurement of Si-film3sample in the MIR and FIR region.
homogeneous at least down to the 10 nm scale and total
amorphous structure which has been demonstrated by
TEM investigations of thin films with similar composi-
tions (Dohmen et al. 2002; Le Guillou et al. 2015). The
oxidation state of Fe is mainly 2+ as shown by Le Guil-
lou et al. (2015). Table 1 shows the physical and chem-
ical characteristics of the deposited amorphous silicate
samples analyzed by the RBS.
3.2. FTIR Spectroscopy
The IR spectroscopic transmittance measurements
have been performed in order to examine the opti-
cal properties of the deposited amorphous silicates. A
Bruker IFS66 v/S Fourier transform infrared (FTIR)
spectrometer with deuterium triglycine sulfate (DTGS)
detector was employed for the MIR transmittance mea-
surements in the frequency range between 500 and5000 cm−1 (20 – 2 µm) as well as a Bruker Vertex80v
with a special FIR-DTGS detector together with a My-
lar beam splitter for the FIR measurements in frequency
range between 50 – 600 cm−1 (200 – 16.7 µm). The sam-
ple compartment of both FTIR spectrometers was evac-
uated under a pressure below 4 mbar for all measure-
ments. All transmittance spectra were normalized to the
spectrum of the bare Si(111) wafer and obtained with a
spectral resolution of 4 cm−1. As shown in Figure. 3, the
transmittance spectra measured in both MIR and FIR
regions overlapped each other at around 500 cm−1 and
were feasible to connect (more details in Wetzel et al.
2012a and Wetzel et al. 2012c). Hence, it is possible
to determine the optical constants through the incorpo-
rated transmittance spectra that can cover a wide spec-
tral range within the IR region.
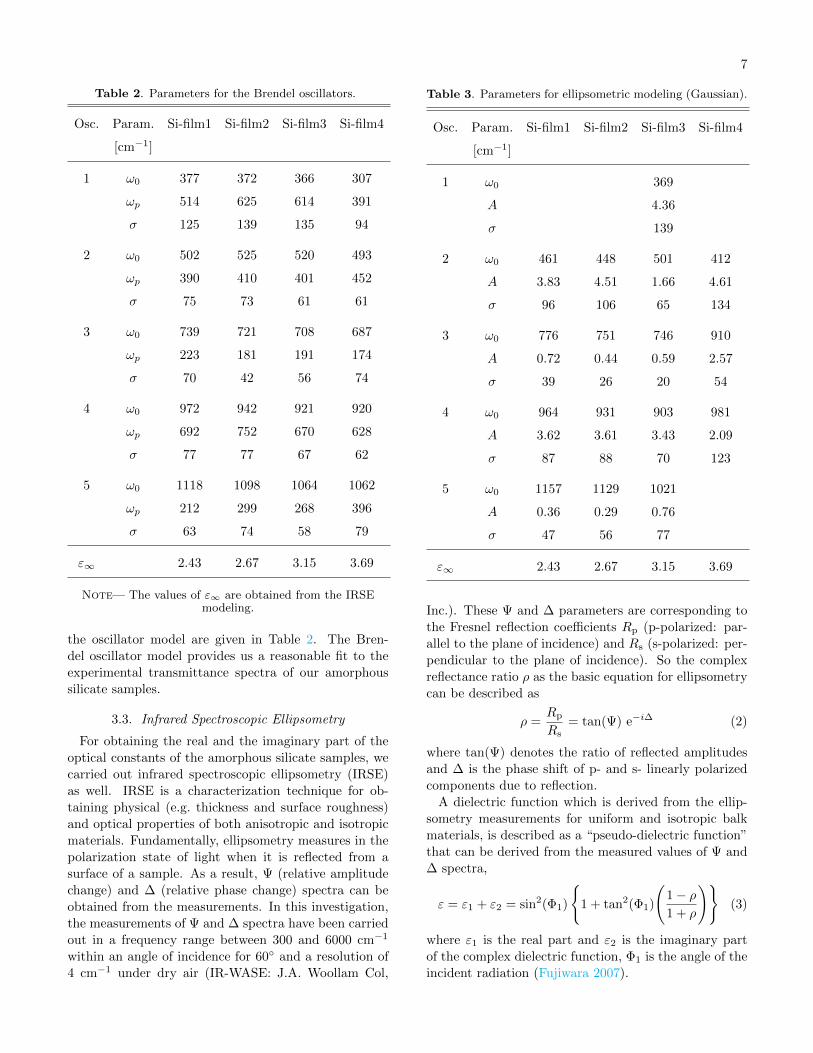
The measured transmittance spectrum of Si-film3 to-
gether with a Brendel oscillator model fit (Brendel &
200 400 600 800 1000 1200 14000.75
0.80
0.85
0.90
0.95
1.00
wavelength [µm]
200 nm
rel.
trans
mitt
ance
wavenumbers [cm -1]
Measurement Fit
100 50 30 20 10
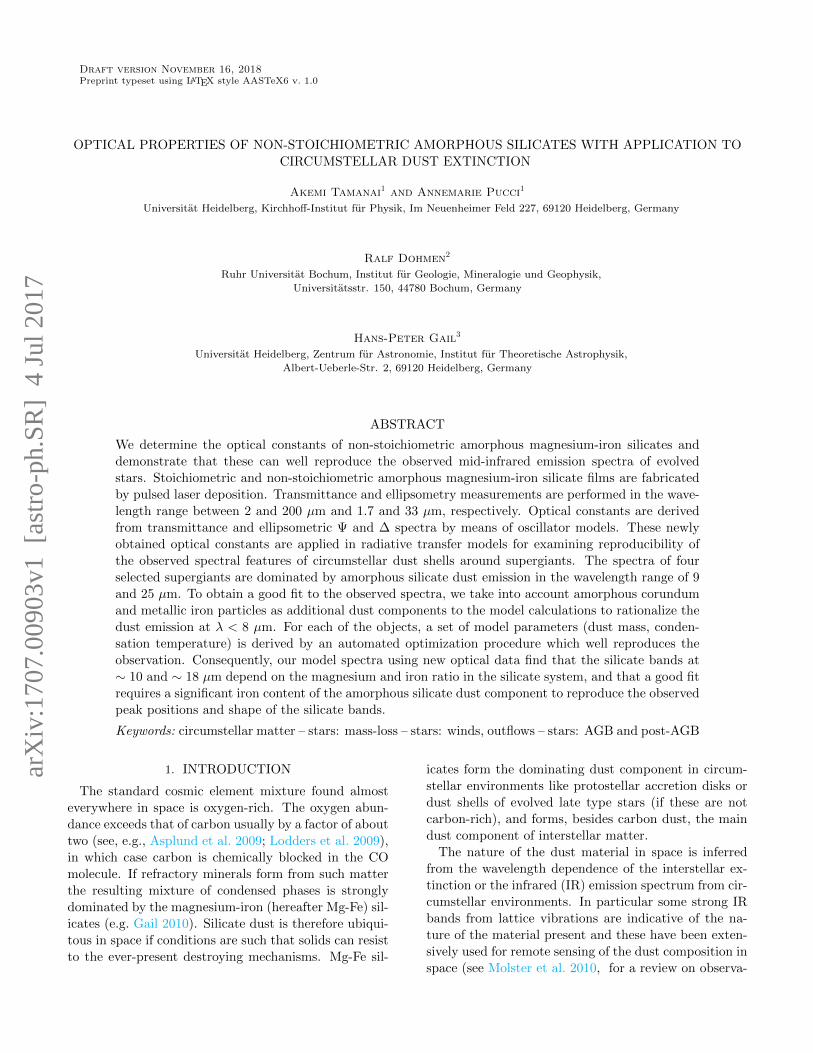
Figure 4. Comparison of composite transmission spectrumof Si-film3 with the best fit of a Brendel oscillator model withthe oscillator parameters given in Table 2. The oscillatorpositions are indicated by dashed lines.
Bormann 1992) for the dielectric function
ε(ω)IR = ε∞ +
N∑j=1
1√2πσj
×
∫ ∞−∞
dz e
−(z−ω0,j)2
2σ2j
ω2p,j
z2 − ω2 + iγjω(1)
using five oscillators is shown in Figure 4. This model
accounts for the amorphous structure of a material by
assuming that the different IR modes can be represented
by Lorentz-oscillators with randomly shifted resonance
frequencies distributed according to Gaussian probabil-
ity distributions. We performed the spectral fits in the
range between 100 and 1400 cm−1 using the software
package SCOUT (Theiss 2011). For modeling the trans-
mittance spectrum, the value of ε∞ has to be used as
an input parameter. However, no values for ε∞ ob-
tained from amorphous silicates equivalent to our non-
stoichiometric samples are available.
Fundamentally, the optical properties are sensitively
influenced by chemical compositions (Koike et al. 2003;
Tamanai et al. 2009), and thus the value of ε∞ also
varies with different concentrations of Fe and Mg in the
silicate system. Consequently, the values of high fre-
quency dielectric constant (ε∞) derived from the ellip-
sometric fitting have been applied for the transmittance
modeling in order to determine the accurate dielectric
function (see Sect. 3.3). Since the oscillator damping
constant γ cannot properly be determined from the fits
for vibrational spectra of disordered solids (cf. Ishikawa
et al. 2000), we fixed the value of γ to the resolution
of our measurement 4 cm−1. Nearly the same kind of
procedure is already reported in the literature (Ishikawa
et al. 2000; Brendel & Bormann 1992; Grosse et al. 1986;
Naiman et al. 1985). Our parameters of the best fit for
7
Table 2. Parameters for the Brendel oscillators.
Osc. Param. Si-film1 Si-film2 Si-film3 Si-film4
[cm−1]
1 ω0 377 372 366 307
ωp 514 625 614 391
σ 125 139 135 94
2 ω0 502 525 520 493
ωp 390 410 401 452
σ 75 73 61 61
3 ω0 739 721 708 687
ωp 223 181 191 174
σ 70 42 56 74
4 ω0 972 942 921 920
ωp 692 752 670 628
σ 77 77 67 62
5 ω0 1118 1098 1064 1062
ωp 212 299 268 396
σ 63 74 58 79
ε∞ 2.43 2.67 3.15 3.69
Note— The values of ε∞ are obtained from the IRSEmodeling.
the oscillator model are given in Table 2. The Bren-
del oscillator model provides us a reasonable fit to the
experimental transmittance spectra of our amorphous
silicate samples.
3.3. Infrared Spectroscopic Ellipsometry
For obtaining the real and the imaginary part of the
optical constants of the amorphous silicate samples, we
carried out infrared spectroscopic ellipsometry (IRSE)
as well. IRSE is a characterization technique for ob-
taining physical (e.g. thickness and surface roughness)
and optical properties of both anisotropic and isotropic
materials. Fundamentally, ellipsometry measures in the
polarization state of light when it is reflected from a
surface of a sample. As a result, Ψ (relative amplitude
change) and ∆ (relative phase change) spectra can be
obtained from the measurements. In this investigation,
the measurements of Ψ and ∆ spectra have been carried
out in a frequency range between 300 and 6000 cm−1
within an angle of incidence for 60 and a resolution of
4 cm−1 under dry air (IR-WASE: J.A. Woollam Col,
Table 3. Parameters for ellipsometric modeling (Gaussian).
Osc. Param. Si-film1 Si-film2 Si-film3 Si-film4
[cm−1]
1 ω0 369
A 4.36
σ 139
2 ω0 461 448 501 412
A 3.83 4.51 1.66 4.61
σ 96 106 65 134
3 ω0 776 751 746 910
A 0.72 0.44 0.59 2.57
σ 39 26 20 54
4 ω0 964 931 903 981
A 3.62 3.61 3.43 2.09
σ 87 88 70 123
5 ω0 1157 1129 1021
A 0.36 0.29 0.76
σ 47 56 77
ε∞ 2.43 2.67 3.15 3.69
Inc.). These Ψ and ∆ parameters are corresponding to
the Fresnel reflection coefficients Rp (p-polarized: par-
allel to the plane of incidence) and Rs (s-polarized: per-
pendicular to the plane of incidence). So the complex
reflectance ratio ρ as the basic equation for ellipsometry
can be described as
ρ =Rp
Rs= tan(Ψ) e−i∆ (2)
where tan(Ψ) denotes the ratio of reflected amplitudes
and ∆ is the phase shift of p- and s- linearly polarized
components due to reflection.
A dielectric function which is derived from the ellip-
sometry measurements for uniform and isotropic balk
materials, is described as a “pseudo-dielectric function”
that can be derived from the measured values of Ψ and
∆ spectra,
ε = ε1 + ε2 = sin2(Φ1)
1 + tan2(Φ1)
(1− ρ1 + ρ
)(3)
where ε1 is the real part and ε2 is the imaginary part
of the complex dielectric function, Φ1 is the angle of the
incident radiation (Fujiwara 2007).
8
15
20
25
30
35
40
45
50
55
0 1000 2000 3000 4000 5000 6000
Experiment
Model fit
10 5.0 3.3 2.5 2.0 1.7
Wavenumber (cm-1)
(a) Single layer fit
Wavelength (µm)Ψ
( )
15
20
25
30
35
40
45
50
0 1000 2000 3000 4000 5000 6000
Experiment
Model Fit
10 5.0 3.3 2.5 2.0 1.7
Wavenumber (cm-1)
(b) Graded layer fit
Wavelength (µm)
Ψ (
)
40
60
80
100
120
140
160
180
0 1000 2000 3000 4000 5000 6000
Experiment
Model fit
10 5.0 3.3 2.5 2.0 1.7
∆ (
)
Wavenumber (cm-1)
(c) Single layer fit
Wavelength (µm)
40
60
80
100
120
140
160
180
0 1000 2000 3000 4000 5000 6000
Experiment
Model fit
10 5.0 3.3 2.5 2.0 1.7
Wavenumber (cm-1)
(d) Graded layer fit
Wavelength (µm)
∆ (
)
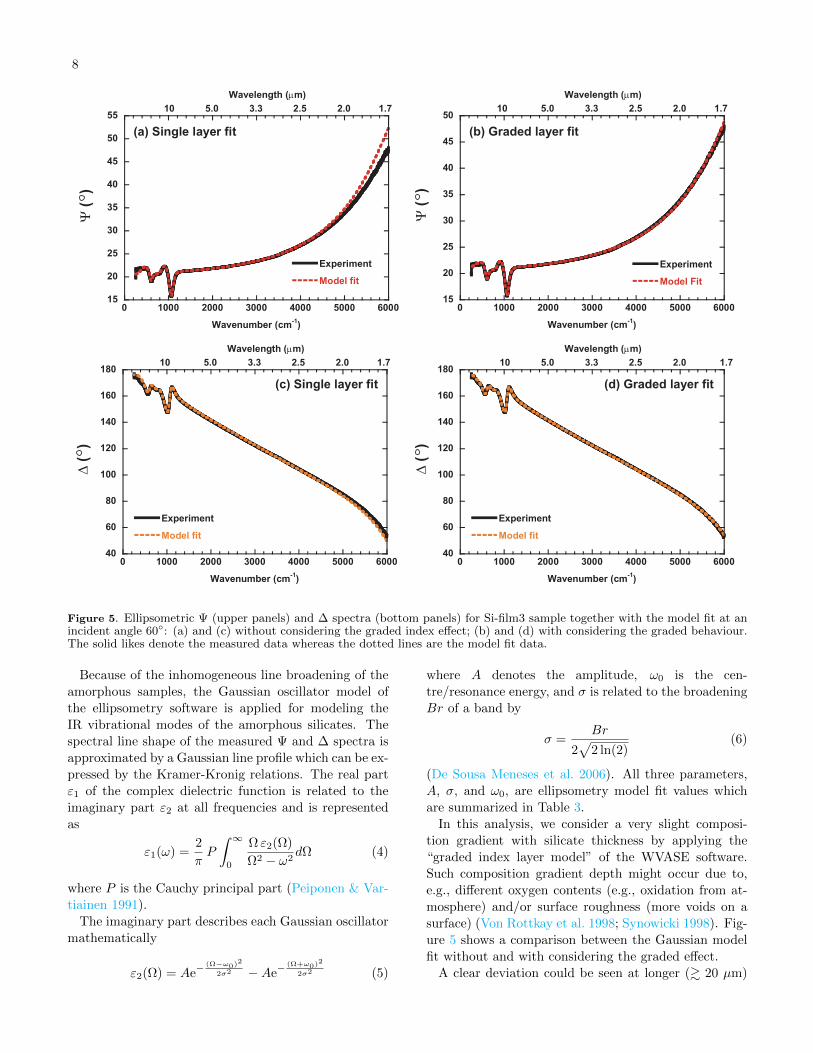
Figure 5. Ellipsometric Ψ (upper panels) and ∆ spectra (bottom panels) for Si-film3 sample together with the model fit at anincident angle 60: (a) and (c) without considering the graded index effect; (b) and (d) with considering the graded behaviour.The solid likes denote the measured data whereas the dotted lines are the model fit data.
Because of the inhomogeneous line broadening of theamorphous samples, the Gaussian oscillator model of
the ellipsometry software is applied for modeling the
IR vibrational modes of the amorphous silicates. The
spectral line shape of the measured Ψ and ∆ spectra is
approximated by a Gaussian line profile which can be ex-
pressed by the Kramer-Kronig relations. The real part
ε1 of the complex dielectric function is related to the
imaginary part ε2 at all frequencies and is represented
as
ε1(ω) =2
πP
∫ ∞0
Ω ε2(Ω)
Ω2 − ω2dΩ (4)
where P is the Cauchy principal part (Peiponen & Var-
tiainen 1991).
The imaginary part describes each Gaussian oscillator
mathematically
ε2(Ω) = Ae−(Ω−ω0)2
2σ2 −Ae−(Ω+ω0)2
2σ2 (5)
where A denotes the amplitude, ω0 is the cen-
tre/resonance energy, and σ is related to the broadening
Br of a band by
σ =Br
2√
2 ln(2)(6)
(De Sousa Meneses et al. 2006). All three parameters,
A, σ, and ω0, are ellipsometry model fit values which
are summarized in Table 3.
In this analysis, we consider a very slight composi-
tion gradient with silicate thickness by applying the
“graded index layer model” of the WVASE software.
Such composition gradient depth might occur due to,
e.g., different oxygen contents (e.g., oxidation from at-
mosphere) and/or surface roughness (more voids on a
surface) (Von Rottkay et al. 1998; Synowicki 1998). Fig-
ure 5 shows a comparison between the Gaussian model
fit without and with considering the graded effect.
A clear deviation could be seen at longer (& 20 µm)
9
0.1
0.11
0.12
0.13
0.14
0.15
0.16
0.17
0.18
8 10 12 14 16 18 20 22 24
Si-film1Si-film2Si-film3Si-film4
rel.
abso
rban
ce
Wavelength (µm)
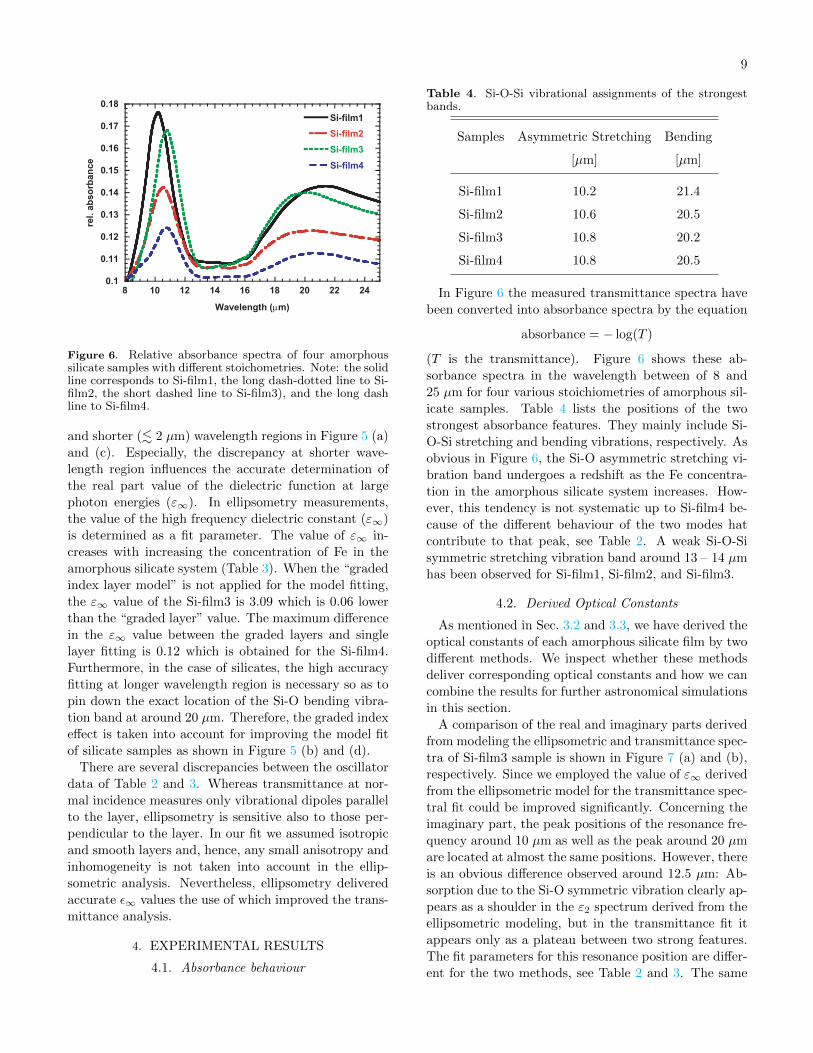
Figure 6. Relative absorbance spectra of four amorphoussilicate samples with different stoichometries. Note: the solidline corresponds to Si-film1, the long dash-dotted line to Si-film2, the short dashed line to Si-film3), and the long dashline to Si-film4.
and shorter (. 2 µm) wavelength regions in Figure 5 (a)
and (c). Especially, the discrepancy at shorter wave-
length region influences the accurate determination of
the real part value of the dielectric function at large
photon energies (ε∞). In ellipsometry measurements,
the value of the high frequency dielectric constant (ε∞)
is determined as a fit parameter. The value of ε∞ in-
creases with increasing the concentration of Fe in the
amorphous silicate system (Table 3). When the “graded
index layer model” is not applied for the model fitting,
the ε∞ value of the Si-film3 is 3.09 which is 0.06 lower
than the “graded layer” value. The maximum difference
in the ε∞ value between the graded layers and single
layer fitting is 0.12 which is obtained for the Si-film4.
Furthermore, in the case of silicates, the high accuracy
fitting at longer wavelength region is necessary so as to
pin down the exact location of the Si-O bending vibra-
tion band at around 20 µm. Therefore, the graded index
effect is taken into account for improving the model fit
of silicate samples as shown in Figure 5 (b) and (d).
There are several discrepancies between the oscillator
data of Table 2 and 3. Whereas transmittance at nor-
mal incidence measures only vibrational dipoles parallel
to the layer, ellipsometry is sensitive also to those per-
pendicular to the layer. In our fit we assumed isotropic
and smooth layers and, hence, any small anisotropy and
inhomogeneity is not taken into account in the ellip-
sometric analysis. Nevertheless, ellipsometry delivered
accurate ε∞ values the use of which improved the trans-
mittance analysis.
4. EXPERIMENTAL RESULTS
4.1. Absorbance behaviour
Table 4. Si-O-Si vibrational assignments of the strongestbands.
Samples Asymmetric Stretching Bending
[µm] [µm]
Si-film1 10.2 21.4
Si-film2 10.6 20.5
Si-film3 10.8 20.2
Si-film4 10.8 20.5
In Figure 6 the measured transmittance spectra have
been converted into absorbance spectra by the equation
absorbance = − log(T )
(T is the transmittance). Figure 6 shows these ab-
sorbance spectra in the wavelength between of 8 and
25 µm for four various stoichiometries of amorphous sil-
icate samples. Table 4 lists the positions of the two
strongest absorbance features. They mainly include Si-
O-Si stretching and bending vibrations, respectively. As
obvious in Figure 6, the Si-O asymmetric stretching vi-
bration band undergoes a redshift as the Fe concentra-
tion in the amorphous silicate system increases. How-
ever, this tendency is not systematic up to Si-film4 be-
cause of the different behaviour of the two modes hat
contribute to that peak, see Table 2. A weak Si-O-Si
symmetric stretching vibration band around 13 – 14 µm
has been observed for Si-film1, Si-film2, and Si-film3.
4.2. Derived Optical Constants
As mentioned in Sec. 3.2 and 3.3, we have derived the
optical constants of each amorphous silicate film by two
different methods. We inspect whether these methods
deliver corresponding optical constants and how we can
combine the results for further astronomical simulations
in this section.
A comparison of the real and imaginary parts derived
from modeling the ellipsometric and transmittance spec-
tra of Si-film3 sample is shown in Figure 7 (a) and (b),
respectively. Since we employed the value of ε∞ derived
from the ellipsometric model for the transmittance spec-
tral fit could be improved significantly. Concerning the
imaginary part, the peak positions of the resonance fre-
quency around 10 µm as well as the peak around 20 µm
are located at almost the same positions. However, there
is an obvious difference observed around 12.5 µm: Ab-
sorption due to the Si-O symmetric vibration clearly ap-
pears as a shoulder in the ε2 spectrum derived from the
ellipsometric modeling, but in the transmittance fit it
appears only as a plateau between two strong features.
The fit parameters for this resonance position are differ-
ent for the two methods, see Table 2 and 3. The same
10
0
2
4
6
8
10
400800120016002000
2512.58.36.25
Ellip.Trans.Comb.
ε 1
Wavenumber (cm )
(a)
-1
Wavelength (µm)
0
1
2
3
4
5
6
400800120016002000
2512.58.36.35
Ellip.Trans.Comb.
ε 2
Wavenumber (cm )
(b)
-1
Wavelength (µm)
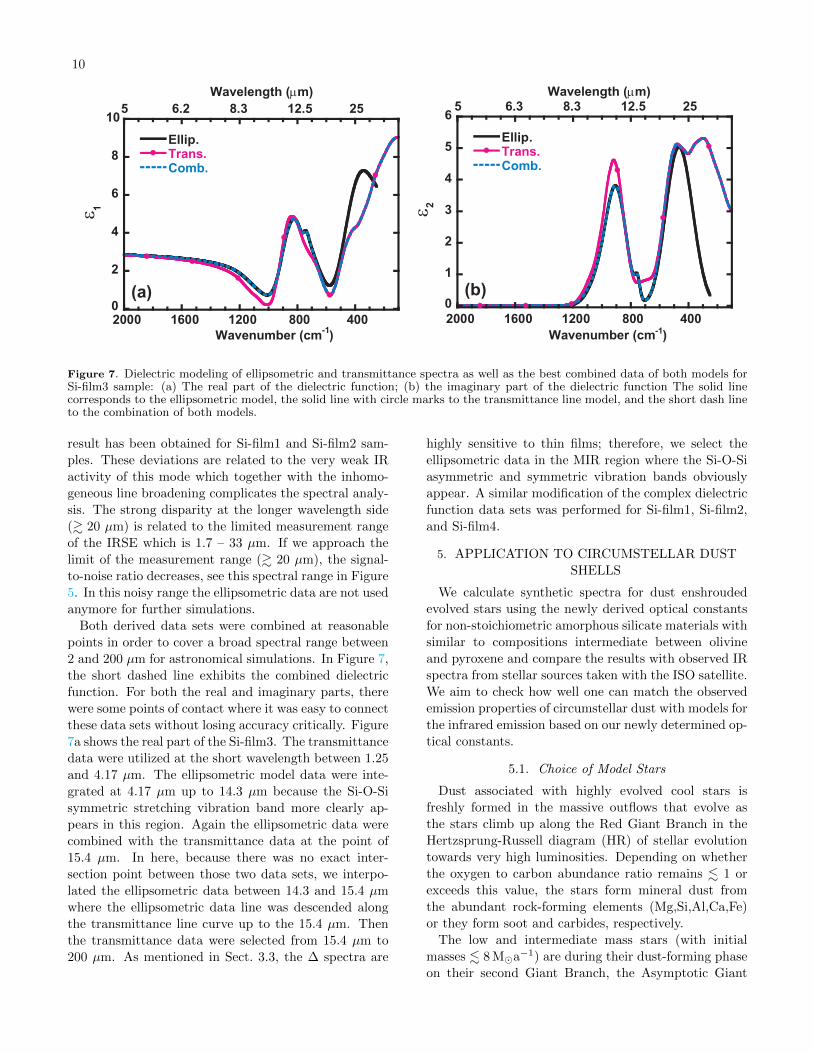
Figure 7. Dielectric modeling of ellipsometric and transmittance spectra as well as the best combined data of both models forSi-film3 sample: (a) The real part of the dielectric function; (b) the imaginary part of the dielectric function The solid linecorresponds to the ellipsometric model, the solid line with circle marks to the transmittance line model, and the short dash lineto the combination of both models.
result has been obtained for Si-film1 and Si-film2 sam-
ples. These deviations are related to the very weak IR
activity of this mode which together with the inhomo-
geneous line broadening complicates the spectral analy-
sis. The strong disparity at the longer wavelength side
(& 20 µm) is related to the limited measurement range
of the IRSE which is 1.7 – 33 µm. If we approach the
limit of the measurement range (& 20 µm), the signal-
to-noise ratio decreases, see this spectral range in Figure
5. In this noisy range the ellipsometric data are not used
anymore for further simulations.
Both derived data sets were combined at reasonable
points in order to cover a broad spectral range between
2 and 200 µm for astronomical simulations. In Figure 7,
the short dashed line exhibits the combined dielectric
function. For both the real and imaginary parts, there
were some points of contact where it was easy to connect
these data sets without losing accuracy critically. Figure
7a shows the real part of the Si-film3. The transmittance
data were utilized at the short wavelength between 1.25
and 4.17 µm. The ellipsometric model data were inte-
grated at 4.17 µm up to 14.3 µm because the Si-O-Si
symmetric stretching vibration band more clearly ap-
pears in this region. Again the ellipsometric data were
combined with the transmittance data at the point of
15.4 µm. In here, because there was no exact inter-
section point between those two data sets, we interpo-
lated the ellipsometric data between 14.3 and 15.4 µm
where the ellipsometric data line was descended along
the transmittance line curve up to the 15.4 µm. Then
the transmittance data were selected from 15.4 µm to
200 µm. As mentioned in Sect. 3.3, the ∆ spectra are
highly sensitive to thin films; therefore, we select the
ellipsometric data in the MIR region where the Si-O-Si
asymmetric and symmetric vibration bands obviously
appear. A similar modification of the complex dielectric
function data sets was performed for Si-film1, Si-film2,
and Si-film4.
5. APPLICATION TO CIRCUMSTELLAR DUST
SHELLS
We calculate synthetic spectra for dust enshrouded
evolved stars using the newly derived optical constants
for non-stoichiometric amorphous silicate materials with
similar to compositions intermediate between olivine
and pyroxene and compare the results with observed IR
spectra from stellar sources taken with the ISO satellite.
We aim to check how well one can match the observed
emission properties of circumstellar dust with models for
the infrared emission based on our newly determined op-
tical constants.
5.1. Choice of Model Stars
Dust associated with highly evolved cool stars is
freshly formed in the massive outflows that evolve as
the stars climb up along the Red Giant Branch in the
Hertzsprung-Russell diagram (HR) of stellar evolution
towards very high luminosities. Depending on whether
the oxygen to carbon abundance ratio remains . 1 or
exceeds this value, the stars form mineral dust from
the abundant rock-forming elements (Mg,Si,Al,Ca,Fe)
or they form soot and carbides, respectively.
The low and intermediate mass stars (with initial
masses . 8 Ma−1) are during their dust-forming phase
on their second Giant Branch, the Asymptotic Giant
11
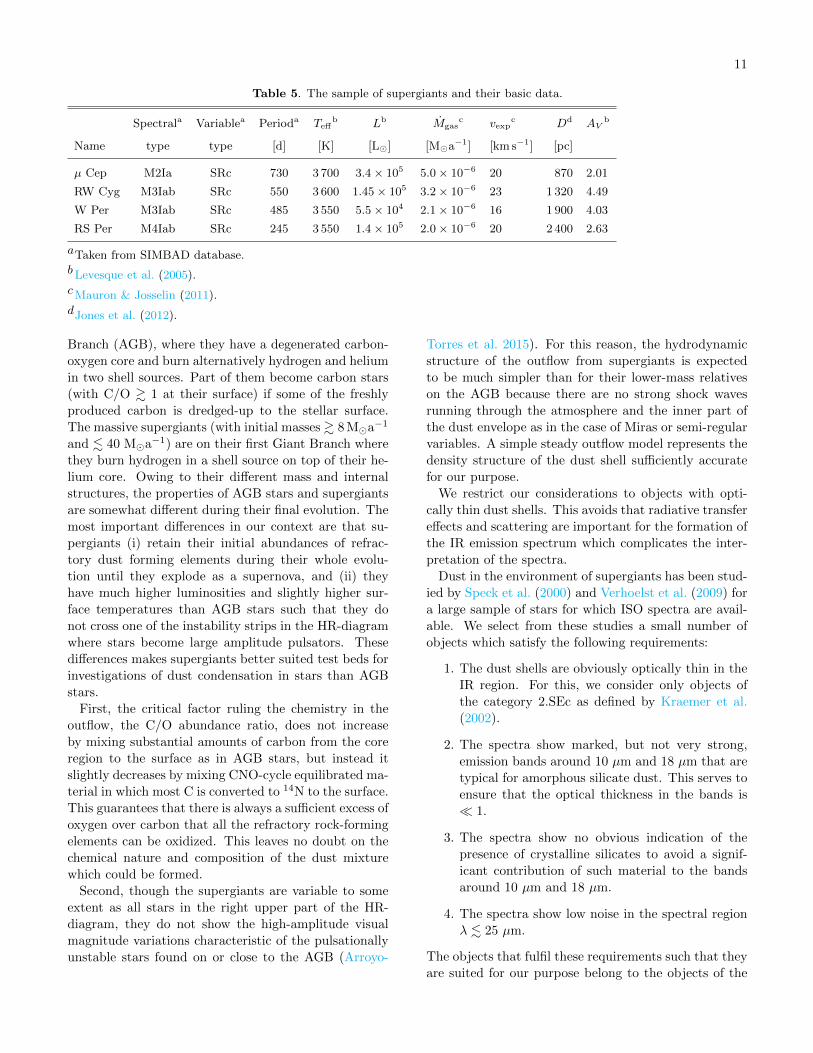
Table 5. The sample of supergiants and their basic data.
Spectrala Variablea Perioda Teffb Lb Mgas
c vexpc Dd AV
b
Name type type [d] [K] [L] [Ma−1] [km s−1] [pc]
µ Cep M2Ia SRc 730 3 700 3.4 × 10⁵ 5.0 × 10⁻⁶ 20 870 2.01
RW Cyg M3Iab SRc 550 3 600 1.45 × 10⁵ 3.2 × 10⁻⁶ 23 1 320 4.49
W Per M3Iab SRc 485 3 550 5.5 × 10⁴ 2.1 × 10⁻⁶ 16 1 900 4.03
RS Per M4Iab SRc 245 3 550 1.4 × 10⁵ 2.0 × 10⁻⁶ 20 2 400 2.63
aTaken from SIMBAD database.bLevesque et al. (2005).
cMauron & Josselin (2011).
dJones et al. (2012).
Branch (AGB), where they have a degenerated carbon-
oxygen core and burn alternatively hydrogen and helium
in two shell sources. Part of them become carbon stars
(with C/O & 1 at their surface) if some of the freshly
produced carbon is dredged-up to the stellar surface.
The massive supergiants (with initial masses & 8 Ma−1
and . 40 Ma−1) are on their first Giant Branch where
they burn hydrogen in a shell source on top of their he-
lium core. Owing to their different mass and internal
structures, the properties of AGB stars and supergiants
are somewhat different during their final evolution. The
most important differences in our context are that su-
pergiants (i) retain their initial abundances of refrac-
tory dust forming elements during their whole evolu-
tion until they explode as a supernova, and (ii) they
have much higher luminosities and slightly higher sur-
face temperatures than AGB stars such that they do
not cross one of the instability strips in the HR-diagram
where stars become large amplitude pulsators. These
differences makes supergiants better suited test beds for
investigations of dust condensation in stars than AGB
stars.
First, the critical factor ruling the chemistry in the
outflow, the C/O abundance ratio, does not increase
by mixing substantial amounts of carbon from the core
region to the surface as in AGB stars, but instead it
slightly decreases by mixing CNO-cycle equilibrated ma-
terial in which most C is converted to 14N to the surface.
This guarantees that there is always a sufficient excess of
oxygen over carbon that all the refractory rock-forming
elements can be oxidized. This leaves no doubt on the
chemical nature and composition of the dust mixture
which could be formed.
Second, though the supergiants are variable to some
extent as all stars in the right upper part of the HR-
diagram, they do not show the high-amplitude visual
magnitude variations characteristic of the pulsationally
unstable stars found on or close to the AGB (Arroyo-
Torres et al. 2015). For this reason, the hydrodynamic
structure of the outflow from supergiants is expected
to be much simpler than for their lower-mass relatives
on the AGB because there are no strong shock waves
running through the atmosphere and the inner part of
the dust envelope as in the case of Miras or semi-regular
variables. A simple steady outflow model represents the
density structure of the dust shell sufficiently accurate
for our purpose.
We restrict our considerations to objects with opti-
cally thin dust shells. This avoids that radiative transfer
effects and scattering are important for the formation of
the IR emission spectrum which complicates the inter-
pretation of the spectra.
Dust in the environment of supergiants has been stud-
ied by Speck et al. (2000) and Verhoelst et al. (2009) for
a large sample of stars for which ISO spectra are avail-
able. We select from these studies a small number of
objects which satisfy the following requirements:
1. The dust shells are obviously optically thin in theIR region. For this, we consider only objects of
the category 2.SEc as defined by Kraemer et al.
(2002).
2. The spectra show marked, but not very strong,
emission bands around 10 µm and 18 µm that are
typical for amorphous silicate dust. This serves to
ensure that the optical thickness in the bands is
1.
3. The spectra show no obvious indication of the
presence of crystalline silicates to avoid a signif-
icant contribution of such material to the bands
around 10 µm and 18 µm.
4. The spectra show low noise in the spectral region
λ . 25 µm.
The objects that fulfil these requirements such that they
are suited for our purpose belong to the objects of the
12
category 2.SEc as defined by Kramer et al. (2002) which
is essentially defined as satisfying the properties of items
1 to 3. Our set of objects selected from the database
of Sloan et al (2003) is shown in Table 5 together with
some basic parameters of the star and the outflow. Com-
pletely reduced ISO-spectra for these four stars, as used
in Verhoelst et al. (2009), were kindly provided to us by
S. Hony.
We fit the MIR spectral data of these four test objects
with calculated spectra from a model for an optically
thin circumstellar dust shell. The properties of the dust
shell including the dust mixture are determined by an
optimization procedure where we vary the parameters
of the problem such as to obtain an as good as possible
fit between observed and synthetic spectrum.
5.2. Model Assumptions
We do not model in this study the formation of dust
in the stellar outflow and the acceleration of the outflow
by radiation pressure on the dust particles and subse-
quent momentum transfer from dust to gas by frictional
coupling. Instead, we follow the practice of most other
laboratory studies which compare their results with ob-
served stellar spectra and assume a spherically symmet-
ric dust density distribution around the star and instan-
taneous condensation of dust once the dust temperature
drops below a given condensation temperature. For op-
tically thin dust shells such a simple model is also not
as unrealistic as it looks at a first glance because the de-
tails of the spatial distribution of the dust are of minor
importance (see the Appendix A).
The main purpose is to check how well the amorphous
silicates for which we determined optical constants can
reproduce the observed MIR emission spectrum of our
test stars. The amorphous silicate dust generally dom-
inates the IR-emission from circumstellar dust in the 9
to 20 µm spectral region where also the diagnostically
important resonances from stretching vibrations of the
Si-O bond (∼ 10 µm) and O-Si-O bending (∼ 18 µm)
vibrations are located. For fitting the synthetic model
we therefore use the spectral region between 9 µm and
25 µm. Further we consider in the fitting procedure the
spectral region between 3 µm and 4.5 µm because (i) in
this range the shape of the observed spectrum shows no
suspiciously strong molecular absorption bands that ren-
der it difficult to find the level of stellar continuum emis-
sion, and (ii) the absorption of silicate dust in this range
is very low such that one observes the un-attenuated
stellar radiation. This NIR spectral range helps to fix
the baseline of zero dust emission.
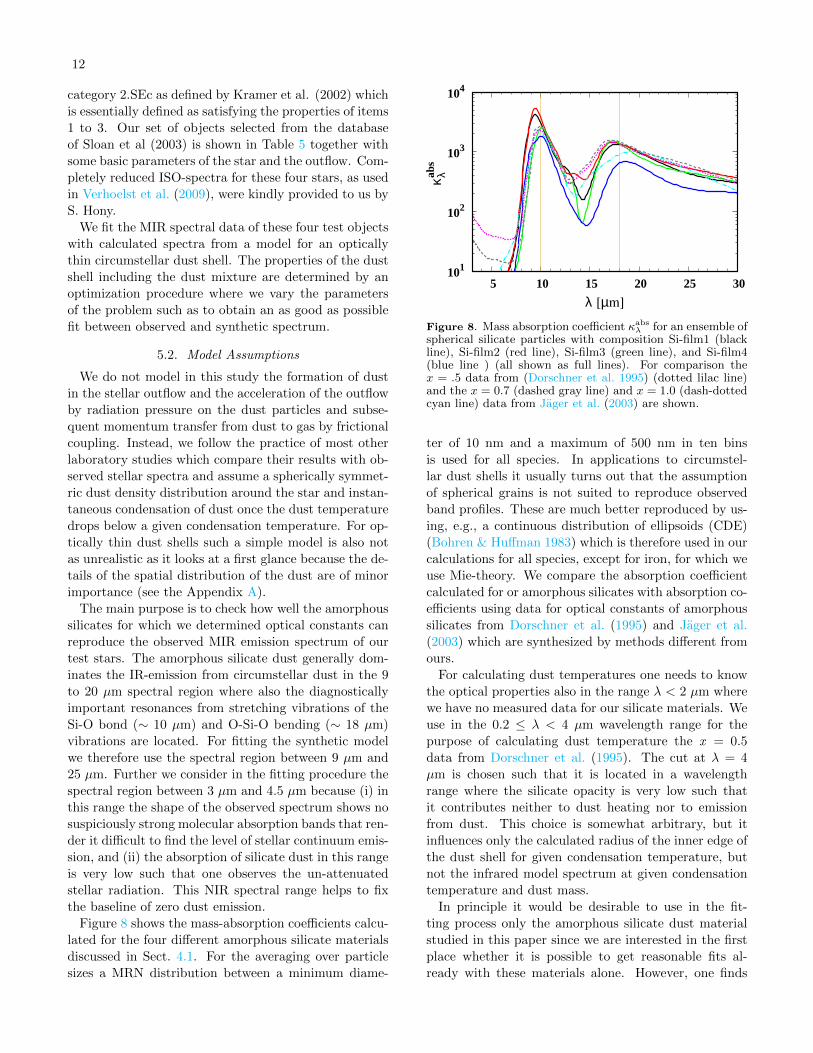
Figure 8 shows the mass-absorption coefficients calcu-
lated for the four different amorphous silicate materials
discussed in Sect. 4.1. For the averaging over particle
sizes a MRN distribution between a minimum diame-
101
102
103
104
5 10 15 20 25 30
κ λabs
λ [µm]
Figure 8. Mass absorption coefficient κabsλ for an ensemble of
spherical silicate particles with composition Si-film1 (blackline), Si-film2 (red line), Si-film3 (green line), and Si-film4(blue line ) (all shown as full lines). For comparison thex = .5 data from (Dorschner et al. 1995) (dotted lilac line)and the x = 0.7 (dashed gray line) and x = 1.0 (dash-dottedcyan line) data from Jager et al. (2003) are shown.
ter of 10 nm and a maximum of 500 nm in ten bins
is used for all species. In applications to circumstel-
lar dust shells it usually turns out that the assumption
of spherical grains is not suited to reproduce observed
band profiles. These are much better reproduced by us-
ing, e.g., a continuous distribution of ellipsoids (CDE)
(Bohren & Huffman 1983) which is therefore used in our
calculations for all species, except for iron, for which we
use Mie-theory. We compare the absorption coefficient
calculated for or amorphous silicates with absorption co-
efficients using data for optical constants of amorphous
silicates from Dorschner et al. (1995) and Jager et al.
(2003) which are synthesized by methods different from
ours.
For calculating dust temperatures one needs to know
the optical properties also in the range λ < 2 µm where
we have no measured data for our silicate materials. We
use in the 0.2 ≤ λ < 4 µm wavelength range for the
purpose of calculating dust temperature the x = 0.5
data from Dorschner et al. (1995). The cut at λ = 4
µm is chosen such that it is located in a wavelength
range where the silicate opacity is very low such that
it contributes neither to dust heating nor to emission
from dust. This choice is somewhat arbitrary, but it
influences only the calculated radius of the inner edge of
the dust shell for given condensation temperature, but
not the infrared model spectrum at given condensation
temperature and dust mass.
In principle it would be desirable to use in the fit-
ting process only the amorphous silicate dust material
studied in this paper since we are interested in the first
place whether it is possible to get reasonable fits al-
ready with these materials alone. However, one finds

13
10-2
10-1
100
0 5 10 15 20 25 30
norm
aliz
ed F
ν
λ[µm]
W Per
Figure 9. Normalized fits to the spectrum of W Per using the optical data of Si-film1, Si-film2, and Si-film3 for the amorphoussilicate component. Green dots correspond the ISO data. The orange, black, and grey curves correspond the optimized syntheticspectrum using Si-film1, Si-film2, and Si-film3 silicate material, respectively. The full magenta line and the dashed and thedotted red lines show the separate contributions of the silicate materials in the same order and the cyan, blue, and green linesthe contribution of the corundum dust to the total emission, also in the same order. The light grey line shows the stellarblack-body spectrum.
in most oxygen-rich objects also a non-negligible contri-
bution to emission from an additional dust component
which is identified with amorphous corundum (Onaka
et al. 1989a,b; Little-Marenin & Little 1990; Jones et al.
2014). Unfortunately the emission from corundum con-
tributes to the spectral range between 10 and 15 µm
such that it interferes with the silicate dust emission.
In particular it fills up the deep absorption minimum
between the two silicate features. For this reason we in-
clude amorphous corundum as a dust component in the
modeling.
Optical constants for the corundum for λ ≥ 7.8 µm
are taken from Begemann et al. (1997) (the constants for
porous amorphous aluminium oxide). For shorter wave-
lengths they are augmented by data from Palik (1985).
Interferometric observations have shown that the
corundum dust seems to be formed much closer to the
star than the silicate dust (e.g. Danchi et al. 1994;
Karovicova et al. 2013; Wittkowski et al. 2015, and ref-
erences therein), as it could be expected according to
its much higher thermal stability (Salpeter 1977). The
grains then either may be heterogeneously composed of
corundum grains condensing earlier than silicates in a
stellar outflow which later become overgrown by silicate
material as temperature drops in the outflow, or they
are the result of agglomeration of corundum grains and
silicate grains. For modeling the opacity we have to
include corundum grains either as a separate dust com-
ponent, or as inclusions within silicate grains, or in both
variants. Practically we found to include the corundum
only in form of a separate dust component to result in
slightly better fits than to include also silicate particles
with corundum inclusions. The difference is, however,
only marginal such that one cannot clearly discriminate
between the possible cases on the basis of spectral mod-
eling alone. We consider in our modeling corundum and
amorphous silicate as separate dust components.
Further, metallic iron particles seem to be present as
inclusions in the silicate grains. They are required to
explain the NIR opacity of real circumstellar dust (Os-
senkopf et al. 1992) and the elemental composition of
presolar silicate grains (see Sect. 2). The contribution
of such inclusions to the opacity of the composed par-
ticles is low in the diagnostically important spectral re-
gion at wavelengths longer than 9 µm and they cause
in that region only an almost constant upward shift of
dust opacity that cannot be discriminated from the ef-
fect of a slight increase of silicate dust abundance. The
main effect of such iron inclusions is its strong contri-
bution to the optical to NIR dust opacity which rules
14
10-2
10-1
100
0 5 10 15 20 25 30
W Per
norm
aliz
ed F
ν
10-2
10-1
100
0 5 10 15 20 25 30
RW Cyg
norm
aliz
ed F
ν
10-2
10-1
100
0 5 10 15 20 25 30
RS Per
norm
aliz
ed F
ν
10-2
10-1
100
0 5 10 15 20 25 30
µ Cep
norm
aliz
ed F
ν
λ[µm]
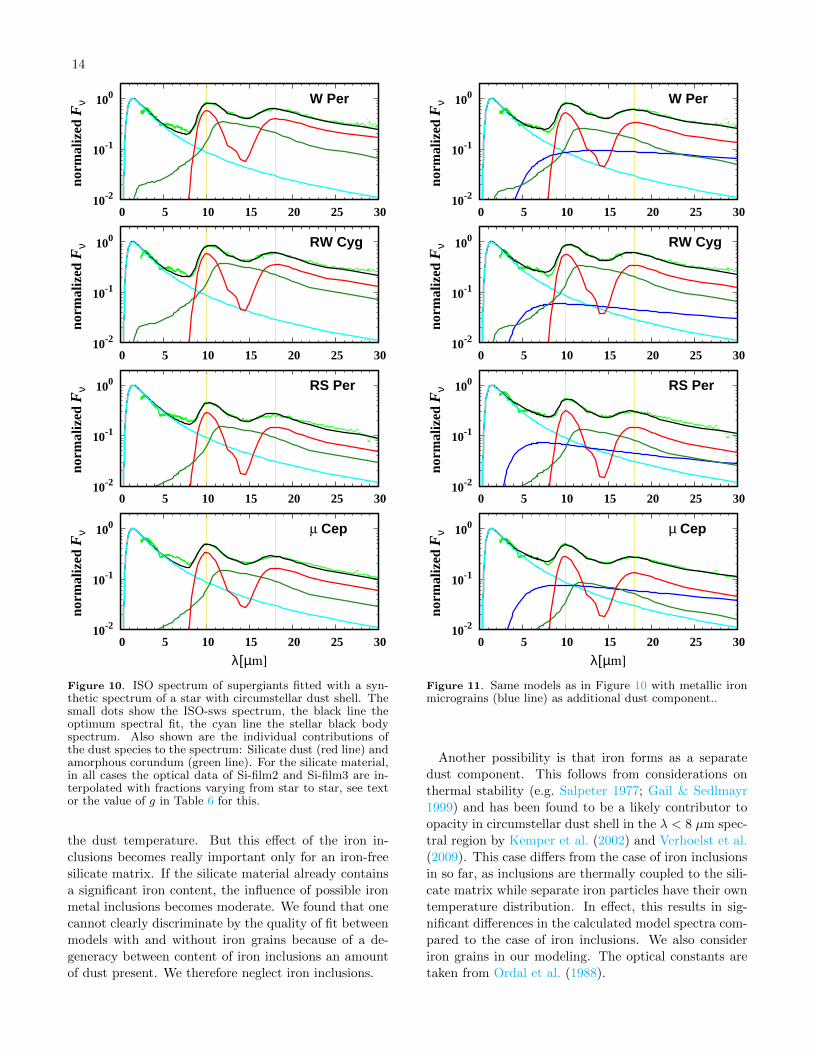
Figure 10. ISO spectrum of supergiants fitted with a syn-thetic spectrum of a star with circumstellar dust shell. Thesmall dots show the ISO-sws spectrum, the black line theoptimum spectral fit, the cyan line the stellar black bodyspectrum. Also shown are the individual contributions ofthe dust species to the spectrum: Silicate dust (red line) andamorphous corundum (green line). For the silicate material,in all cases the optical data of Si-film2 and Si-film3 are in-terpolated with fractions varying from star to star, see textor the value of g in Table 6 for this.
the dust temperature. But this effect of the iron in-
clusions becomes really important only for an iron-free
silicate matrix. If the silicate material already contains
a significant iron content, the influence of possible iron
metal inclusions becomes moderate. We found that one
cannot clearly discriminate by the quality of fit between
models with and without iron grains because of a de-
generacy between content of iron inclusions an amount
of dust present. We therefore neglect iron inclusions.
10-2
10-1
100
0 5 10 15 20 25 30
W Per
norm
aliz
ed F
ν
10-2
10-1
100
0 5 10 15 20 25 30
RW Cyg
norm
aliz
ed F
ν
10-2
10-1
100
0 5 10 15 20 25 30
RS Per
norm
aliz
ed F
ν
10-2
10-1
100
0 5 10 15 20 25 30
µ Cep
norm
aliz
ed F
ν
λ[µm]
Figure 11. Same models as in Figure 10 with metallic ironmicrograins (blue line) as additional dust component..
Another possibility is that iron forms as a separate
dust component. This follows from considerations on
thermal stability (e.g. Salpeter 1977; Gail & Sedlmayr
1999) and has been found to be a likely contributor to
opacity in circumstellar dust shell in the λ < 8 µm spec-
tral region by Kemper et al. (2002) and Verhoelst et al.
(2009). This case differs from the case of iron inclusions
in so far, as inclusions are thermally coupled to the sili-
cate matrix while separate iron particles have their own
temperature distribution. In effect, this results in sig-
nificant differences in the calculated model spectra com-
pared to the case of iron inclusions. We also consider
iron grains in our modeling. The optical constants are
taken from Ordal et al. (1988).
15
5.3. Individual Fits
We fit the MIR spectral data of the four test objects
with calculated spectra from circumstellar dust shell
models (also called synthetic spectra) by an optimiza-
tion procedure described in Appendix A.
The stellar luminosities and effective temperatures of
the objects are taken from the literature; the corre-
sponding values and references are given in Table 5. No
dereddening was finally performed for the ISO spectra
because it turned out that the corresponding correction
is very small in the wavelength range of interest for all
our objects.
The dust temperature in the models drops below 100
K at a distance of about 103 stellar radii. Regions far-
ther out do not contribute significantly to the infrared
spectral region λ < 30 µm used in our comparison of
observed with synthetic model spectra. The outer ra-
dius of the dust shell therefore cannot be pinned down
by our model optimization; it was set to a fixed value of
104 stellar radii in all cases.
5.3.1. Fits with two Dust Components
In the following models two dust species, amorphous
silicate particles and corundum particles, are considered
as opacity sources.
W Per.— A fit to W Per was tried first using the optical
constants of Si-film1, Si-film2 and Si-film3 for the silicate
component. The results are shown in Figure 9. The
iron-free Si-film1 can be excluded because the resonance
at ∼ 10 µm does not fit to the data. The optical data
of Si-film2 result in a good fit for the resonance at ∼18 µm and a reasonable fit to the peak and the long-
wavelength flank of the ∼ 10 µm resonance. The short-
wavelength flank is too extended, however. The dust
model Si-film3 gives a low quality fit, but it deviates
from the ISO data just in the opposite direction than the
Si-film2 model. This means that an amorphous silicate
of the kind studied in this paper with an intermediate
iron content between Si-film2 and Si-film3 would fit the
observed spectral energy distribution.
A linear interpolation of the data for Si-film2 and Si-
film3 using a fraction of 0.6 of Si-film2 and a fraction
of 0.4 of Si-film3 results in an rather good fit between
the ISO data and the corresponding synthetic spectrum.
The corresponding model is shown in Figure 10. The
correspondence between observed spectrum and opti-
mized synthetic spectrum appears almost perfect, ex-
cept in the range between about 6 . . . 8 µm. In partic-
ular the two silicate bands are well reproduced by the
model.
With respect to the missing flux shortward of 8 µm
see later.
RW Cyg.— Also in the case of RW Cyg the observed
stellar spectrum is embraced by the optimized models
using the data of Si-film2 or Si-film3. A model using a
weighted mean of the opacity data with a fraction of 0.4
from Si-film2 and 0.6 from Si-film3 results in a model
which well fits the observational data. This model is
shown in Figure 10.
RS Per.— Though, again, the observed stellar spec-
trum is embraced by the optimized models using the
data of Si-film2 or Si-film3, it is not possible to obtain
a simultaneous close fit of the 10 µm and the 18 µm
silicate bands for RS Per. The 10 µm band is fitted
reasonably well with a weighted mean of the opacity
data using a fraction of 0.4 from Si-film2 and 0.6 from
Si-film3. The 18 µm band is best fitted with Si-film3
alone. A compromise is to a use a weighted mean of the
opacity data using a fraction of 0.7 from Si-film3 and 0.3
from Si-film2. The resulting model spectrum is shown
in Figure 10. The peak position of the 18 µm band in
the model appears at a position slightly shortward of the
peak in the observed spectrum, and there is a noticeable
discrepancy in the model flux at wavelengths longward
of 20 µm.
µ Cep.— A similar situation is encountered for µ Cep.
A compromise is here to a use a weighted mean of the
opacity data using a fraction of 0.8 from Si-film2 and 0.2
from Si-film3. The resulting model spectrum is shown in
Figure 10. Again, the peak position of the 18 µm band
in the model appears at a position slightly shortward of
the peak in the observations, and also here there is a
noticeable discrepancy in the model flux at wavelengths
longward of 20 µm.
5.3.2. Fits with three Dust Components
In the following models metallic iron as a separate
dust component is added to the amorphous silicate and
corundum particles in order to provide opacity in the
λ < 8 µm spectral region where the silicate and corun-
dum dust components are transparent. For the opti-
mization also the wavelength range between 5.5 and 7.5
µm is included in the calculation of χ2 because iron dust
is the sole source of the emission from the dust shell in
this region.
W Per.— The addition of a third dust component
changes the relative abundances of amorphous silicate
and corundum and, additionally, the iron content of the
amorphous silicate dust required to obtain a good fit.
An interpolated dielectric function using a fraction of
0.5 for Si-film2 and Si-film3 results in a close fit between
observed and synthetic spectrum. The resulting model
spectrum is shown in Figure 11. Now the flux deficit
in the 5 . . . 8 µm spectral region of the two-component
16
0.2
0.4
0.6
0.8
1
8 9 10 11 12 13
W Per
arbi
trar
y un
its
λ[µm]
0.2
0.4
0.6
0.8
1RW Cyg
arbi
trar
y un
its
8 9 10 11 12 13 14
RS Per
λ[µm]
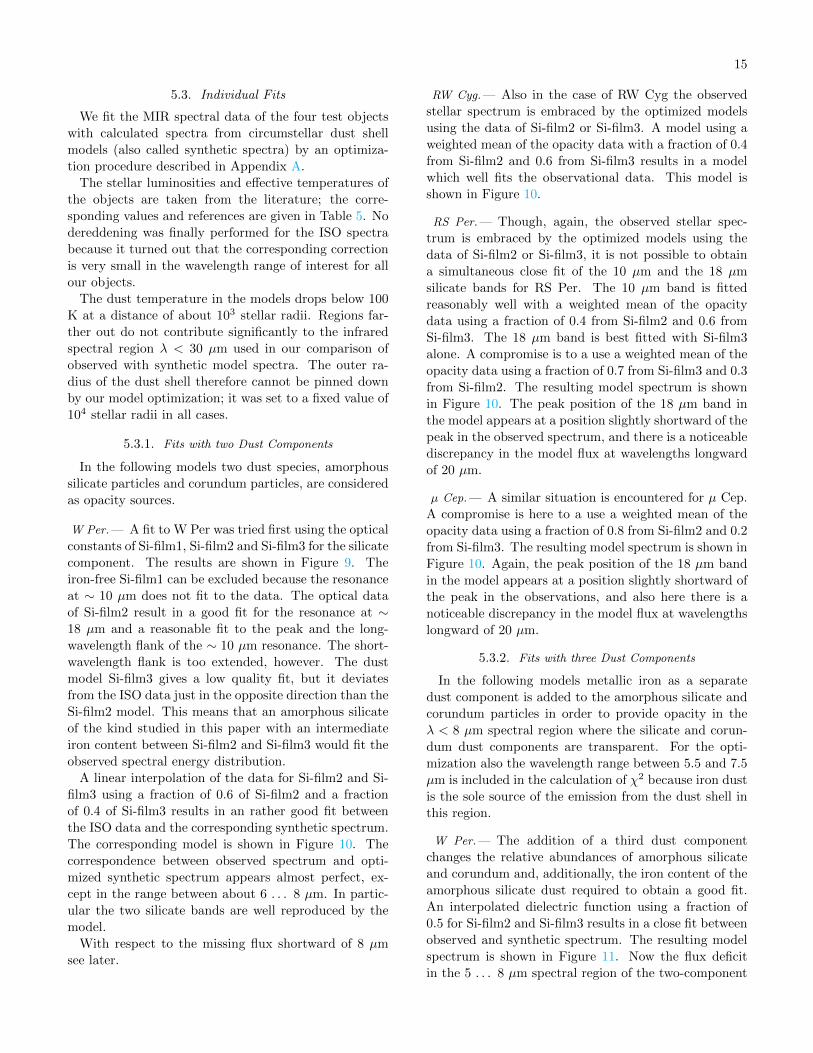
µ Cep
Figure 12. Fit of the 10 µm silicate band. Dots are ISOspectra. The blue lines corresponds to the models with threedust components, the red lines corresponds to models withtwo dust components.
models seen in Figure 10 has completely disappeared.
The remaining slight flux excesses of the synthetic spec-
trum over the observed spectrum at around 4.8, 6.8, and
8 µm are obviously due to molecular absorption bands
of CO, H2O, and SiO, respectively. The stretching and
bending modes at 10 and 18 µm of the amorphous sili-
cate are well reproduced by the model spectrum.
RW Cyg.— In this case a linear interpolation of the op-
tical constants of Si-film2 and Si-film3 with weights 0.7
and 0.3, respectively, is required for an optimum fit. The
resulting model spectrum is shown in Figure 11. The
correspondence between observed spectrum and model
spectrum is very close.
RS Per.— In this case a linear interpolation of the op-
tical constants of Si-film2 and Si-film3 with weights 0.2
and 0.8, respectively, is required for an optimum fit.
The resulting model spectrum is shown in Figure 11.
Again, the correspondence between observed spectrum
an model spectrum is good in the range between about
9 and 20 µm. At longer wavelengths the model flux is
slightly below the stellar flux.
µ Cep.— In this case a linear interpolation of the optical
constants of Si-film2 and Si-film3 with weights 0.6 and
0.4, respectively, is required for an optimum fit. The
resulting model spectrum is shown in Figure 11. The
correspondence between observed spectrum and model
spectrum now is almost perfect, also in the range λ >
20 µm.
We also tried if it is possible to reproduce the observed
spectra with omitting corundum but retaining iron to fill
up the silicate absorption trough between the two sili-
cate bands. This combination gave no good fit because
one can fit either the wavelength range between the two
silicate features or the wavelength range between 5.5 and
λ=8 µm, but not both simultaneously.
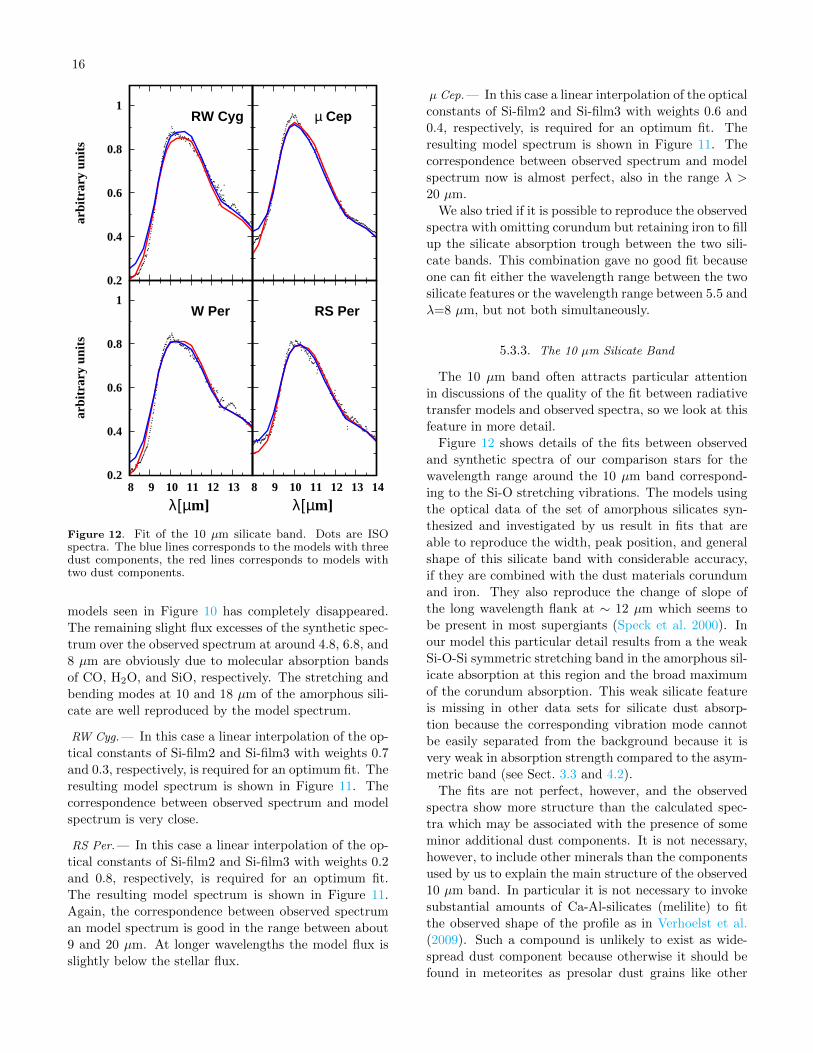
5.3.3. The 10 µm Silicate Band
The 10 µm band often attracts particular attention
in discussions of the quality of the fit between radiative
transfer models and observed spectra, so we look at this
feature in more detail.
Figure 12 shows details of the fits between observed
and synthetic spectra of our comparison stars for the
wavelength range around the 10 µm band correspond-
ing to the Si-O stretching vibrations. The models using
the optical data of the set of amorphous silicates syn-
thesized and investigated by us result in fits that are
able to reproduce the width, peak position, and general
shape of this silicate band with considerable accuracy,
if they are combined with the dust materials corundum
and iron. They also reproduce the change of slope of
the long wavelength flank at ∼ 12 µm which seems to
be present in most supergiants (Speck et al. 2000). In
our model this particular detail results from a the weak
Si-O-Si symmetric stretching band in the amorphous sil-
icate absorption at this region and the broad maximum
of the corundum absorption. This weak silicate feature
is missing in other data sets for silicate dust absorp-
tion because the corresponding vibration mode cannot
be easily separated from the background because it is
very weak in absorption strength compared to the asym-
metric band (see Sect. 3.3 and 4.2).
The fits are not perfect, however, and the observed
spectra show more structure than the calculated spec-
tra which may be associated with the presence of some
minor additional dust components. It is not necessary,
however, to include other minerals than the components
used by us to explain the main structure of the observed
10 µm band. In particular it is not necessary to invoke
substantial amounts of Ca-Al-silicates (melilite) to fit
the observed shape of the profile as in Verhoelst et al.
(2009). Such a compound is unlikely to exist as wide-
spread dust component because otherwise it should be
found in meteorites as presolar dust grains like other
17
Table 6. Optimized dust shell parameters.
Silicate Corundum Iron
Object Mdu Ti Mdu Ti Mdu Ti τ10µ g
W Per 33.1 554 16.4 1 400 .061 .6
25.0 623 12.4 1 400 53.2 379 .050 .5
RW Cyg 23.9 709 17.7 1 400 .058 .7
21.7 753 16.1 1 400 21.7 485 .053 .4
RS Per 3.6 917 3.8 1 400 .027 .7
3.1 1 087 2.9 1 400 8.6 579 .028 .2
µ Cep 10.0 854 7.0 1 400 .030 .8
7.1 959 4.0 1 400 28.2 484 .022 .6
Note—Mdu is mass of the dust species in units 10−5 M,Ti is temperature of the dust species at the inner boundary(in K) , τ10µ means optical depth of the dust shell at 10 µm,and g and 1 − g are the weighting fractions of the opticalconstants for Si-film2 and Si-film3, respectively.
aluminum oxide particles, which is not the case.1 The
over-all fit is, however, substantially improved if an iron
dust component is included, as was already found in
Verhoelst et al. (2009).
The quality of the fit of the 10 µm feature is nearly the
same for the models with or without iron dust particles.
The properties of the model with respect to dust con-
tent or iron content of the silicate material are slightly
changed by including or omitting an iron dust compo-
nent (cf. Table 6), but in both cases a parameter combi-
nation can be found that reproduces the 10 µm feature.
The presence of iron dust is inconsequential in this re-
spect.
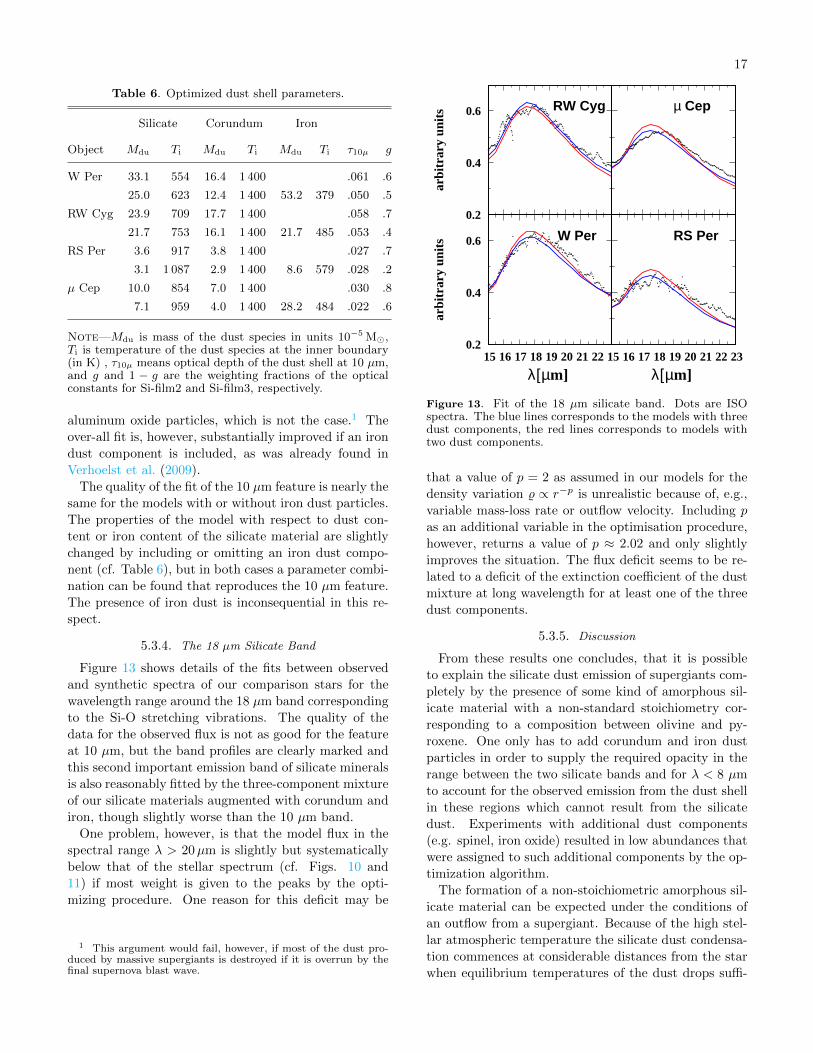
5.3.4. The 18 µm Silicate Band
Figure 13 shows details of the fits between observed
and synthetic spectra of our comparison stars for the
wavelength range around the 18 µm band corresponding
to the Si-O stretching vibrations. The quality of the
data for the observed flux is not as good for the feature
at 10 µm, but the band profiles are clearly marked and
this second important emission band of silicate minerals
is also reasonably fitted by the three-component mixture
of our silicate materials augmented with corundum and
iron, though slightly worse than the 10 µm band.
One problem, however, is that the model flux in the
spectral range λ > 20µm is slightly but systematically
below that of the stellar spectrum (cf. Figs. 10 and
11) if most weight is given to the peaks by the opti-
mizing procedure. One reason for this deficit may be
1 This argument would fail, however, if most of the dust pro-duced by massive supergiants is destroyed if it is overrun by thefinal supernova blast wave.
0.2
0.4
0.6
15 16 17 18 19 20 21 22
W Per
arbi
trar
y un
its
λ[µm]
0.2
0.4
0.6 RW Cyg
arbi
trar
y un
its
15 16 17 18 19 20 21 22 23
RS Per
λ[µm]
µ Cep
Figure 13. Fit of the 18 µm silicate band. Dots are ISOspectra. The blue lines corresponds to the models with threedust components, the red lines corresponds to models withtwo dust components.
that a value of p = 2 as assumed in our models for the
density variation % ∝ r−p is unrealistic because of, e.g.,
variable mass-loss rate or outflow velocity. Including p
as an additional variable in the optimisation procedure,
however, returns a value of p ≈ 2.02 and only slightly
improves the situation. The flux deficit seems to be re-
lated to a deficit of the extinction coefficient of the dust
mixture at long wavelength for at least one of the three
dust components.
5.3.5. Discussion
From these results one concludes, that it is possible
to explain the silicate dust emission of supergiants com-
pletely by the presence of some kind of amorphous sil-
icate material with a non-standard stoichiometry cor-
responding to a composition between olivine and py-
roxene. One only has to add corundum and iron dust
particles in order to supply the required opacity in the
range between the two silicate bands and for λ < 8 µm
to account for the observed emission from the dust shell
in these regions which cannot result from the silicate
dust. Experiments with additional dust components
(e.g. spinel, iron oxide) resulted in low abundances that
were assigned to such additional components by the op-
timization algorithm.
The formation of a non-stoichiometric amorphous sil-
icate material can be expected under the conditions of
an outflow from a supergiant. Because of the high stel-
lar atmospheric temperature the silicate dust condensa-
tion commences at considerable distances from the star
when equilibrium temperatures of the dust drops suffi-
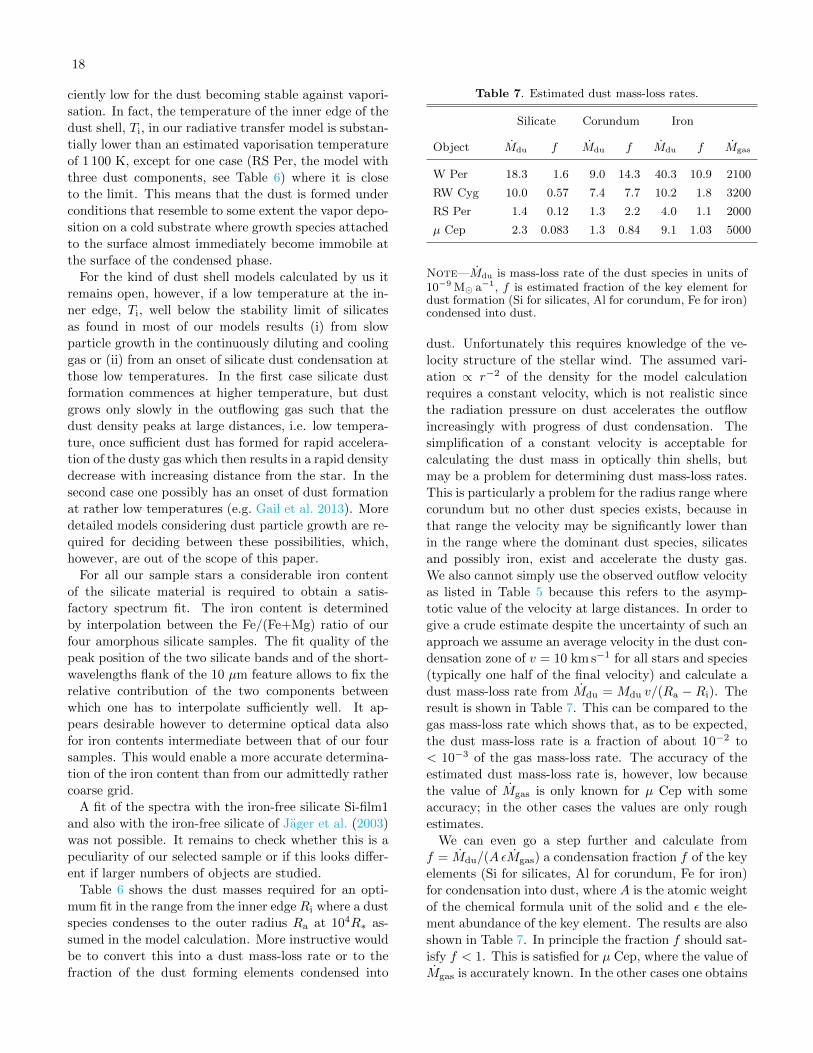
18
ciently low for the dust becoming stable against vapori-
sation. In fact, the temperature of the inner edge of the
dust shell, Ti, in our radiative transfer model is substan-
tially lower than an estimated vaporisation temperature
of 1 100 K, except for one case (RS Per, the model with
three dust components, see Table 6) where it is close
to the limit. This means that the dust is formed under
conditions that resemble to some extent the vapor depo-
sition on a cold substrate where growth species attached
to the surface almost immediately become immobile at
the surface of the condensed phase.
For the kind of dust shell models calculated by us it
remains open, however, if a low temperature at the in-
ner edge, Ti, well below the stability limit of silicates
as found in most of our models results (i) from slow
particle growth in the continuously diluting and cooling
gas or (ii) from an onset of silicate dust condensation at
those low temperatures. In the first case silicate dust
formation commences at higher temperature, but dust
grows only slowly in the outflowing gas such that the
dust density peaks at large distances, i.e. low tempera-
ture, once sufficient dust has formed for rapid accelera-
tion of the dusty gas which then results in a rapid density
decrease with increasing distance from the star. In the
second case one possibly has an onset of dust formation
at rather low temperatures (e.g. Gail et al. 2013). More
detailed models considering dust particle growth are re-
quired for deciding between these possibilities, which,
however, are out of the scope of this paper.
For all our sample stars a considerable iron content
of the silicate material is required to obtain a satis-
factory spectrum fit. The iron content is determined
by interpolation between the Fe/(Fe+Mg) ratio of our
four amorphous silicate samples. The fit quality of the
peak position of the two silicate bands and of the short-
wavelengths flank of the 10 µm feature allows to fix the
relative contribution of the two components between
which one has to interpolate sufficiently well. It ap-
pears desirable however to determine optical data also
for iron contents intermediate between that of our four
samples. This would enable a more accurate determina-
tion of the iron content than from our admittedly rather
coarse grid.
A fit of the spectra with the iron-free silicate Si-film1
and also with the iron-free silicate of Jager et al. (2003)
was not possible. It remains to check whether this is a
peculiarity of our selected sample or if this looks differ-
ent if larger numbers of objects are studied.
Table 6 shows the dust masses required for an opti-
mum fit in the range from the inner edge Ri where a dust
species condenses to the outer radius Ra at 104R∗ as-
sumed in the model calculation. More instructive would
be to convert this into a dust mass-loss rate or to the
fraction of the dust forming elements condensed into
Table 7. Estimated dust mass-loss rates.
Silicate Corundum Iron
Object Mdu f Mdu f Mdu f Mgas
W Per 18.3 1.6 9.0 14.3 40.3 10.9 2100
RW Cyg 10.0 0.57 7.4 7.7 10.2 1.8 3200
RS Per 1.4 0.12 1.3 2.2 4.0 1.1 2000
µ Cep 2.3 0.083 1.3 0.84 9.1 1.03 5000
Note—Mdu is mass-loss rate of the dust species in units of10−9 M a−1, f is estimated fraction of the key element fordust formation (Si for silicates, Al for corundum, Fe for iron)condensed into dust.
dust. Unfortunately this requires knowledge of the ve-
locity structure of the stellar wind. The assumed vari-
ation ∝ r−2 of the density for the model calculation
requires a constant velocity, which is not realistic since
the radiation pressure on dust accelerates the outflow
increasingly with progress of dust condensation. The
simplification of a constant velocity is acceptable for
calculating the dust mass in optically thin shells, but
may be a problem for determining dust mass-loss rates.
This is particularly a problem for the radius range where
corundum but no other dust species exists, because in
that range the velocity may be significantly lower than
in the range where the dominant dust species, silicates
and possibly iron, exist and accelerate the dusty gas.
We also cannot simply use the observed outflow velocity
as listed in Table 5 because this refers to the asymp-
totic value of the velocity at large distances. In order to
give a crude estimate despite the uncertainty of such an
approach we assume an average velocity in the dust con-
densation zone of v = 10 km s−1 for all stars and species
(typically one half of the final velocity) and calculate a
dust mass-loss rate from Mdu = Mdu v/(Ra − Ri). The
result is shown in Table 7. This can be compared to the
gas mass-loss rate which shows that, as to be expected,
the dust mass-loss rate is a fraction of about 10−2 to
< 10−3 of the gas mass-loss rate. The accuracy of the
estimated dust mass-loss rate is, however, low because
the value of Mgas is only known for µ Cep with some
accuracy; in the other cases the values are only rough
estimates.
We can even go a step further and calculate from
f = Mdu/(AεMgas) a condensation fraction f of the key
elements (Si for silicates, Al for corundum, Fe for iron)
for condensation into dust, where A is the atomic weight
of the chemical formula unit of the solid and ε the ele-
ment abundance of the key element. The results are also
shown in Table 7. In principle the fraction f should sat-
isfy f < 1. This is satisfied for µ Cep, where the value of
Mgas is accurately known. In the other cases one obtains
19
in part distinctively higher values. For corundum dust
this may result from a lower than assumed value of v in
the inner range of the dust shell where only corundum
dust exists, as mentioned above. For iron it may result
from the fact that we used optical data for pure iron,
while iron in space always is a nickel-iron alloy which
may have different extinction properties. And also the
estimated dust mass-loss rates as derived by Mauron &
Josselin (2011) from the formula of Jura & Kleinmann
(1990) may be systematically too low. A more accu-
rate modeling of the dust shell considering the growth
of grains and the outflow dynamics is required to deter-
mine the condensation degrees for the dust species.
6. CONCLUDING REMARKS
This paper studies the optical properties of iron-
bearing amorphous silicates with oxygen to silicon ratios
deviating from the stoichiometry of the usually consid-
ered silicates with olivine- and pyroxene-like composi-
tions. We show that for four selected supergiants used
as test-objects their observed mid-infrared emission as
determined by ISO may be well explained with the pres-
ence of such kind of material.
We produce by a method of vapor-deposition on a
cold substrate thin films of truly amorphous silicates
with different iron and magnesium contents and non-
standard oxygen to silicon ratios that are within the
range of values observed for presolar grains. The high
degree of homogeneity and uniform thickness of the pro-
duced films achieved by our experimental method allows
an accurate determination of the optical constants of the
material. We report here on our results for four amor-
phous magnesium-iron silicates with non-standard stoi-
chiometric composition: for the two end-member com-
positions of pure magnesium silicate and pure iron sili-
cate, and for two intermediate values of the iron contents
with magnesium-rich and iron-rich composition
We determine new optical constants for the four ma-
terials by IR spectroscopic transmittance measurements
and by ellipsometry. From the combined data a model
dielectric function is constructed that can be used to
analyze circumstellar emission spectra.
The new data are applied to a sample of four selected
supergiants which are optically thin at λ = 10 µm but
show substantial infrared excess emission. We aim to
check how well we can fit observed ISO-spectra for these
stars with synthetic spectra calculated for emission from
a circumstellar dust shell enshrouding these stars. Since
real stars generally seem to form also aluminium oxide
dust if they form silicate dust, we include such dust in
our model calculation. We also included a separate iron
dust component, because such dust also seems to be
present. The dust mass of each species and the temper-
ature at the inner edge of the respective dust shell are
determined from an automated fit between the synthetic
spectrum from the radiative transfer model and the ob-
servations. To obtain a good fit we have to interpolate
with respect to the Fe/(Mg+Fe) ratio between the four
data sets. We found:
1. It is possible to obtain a good fit between model
and observation with the kind of amorphous sil-
icate with non-standard stoichiometry studied in
this paper.
2. A good fit requires a significant iron content of the
silicate material.
3. The 10 µm and 18 µm features can be fitted si-
multaneously with our non-stoichiometric, amor-
phous, iron-bearing silicates.
Though the obtained fits are not perfect, they are so
close that the remaining deviations appear to be more
likely due to shortcomings in the modeling (e.g. the
assumption of CDE) than to not completely realistic
optical constants. In particular it is not necessary to in-
voke additional dust species to reproduce the peak wave-
lengths and strengths of the two broad 10 µm and 18 µm
amorphous silicate features.
Also metallic iron dust particles seem to be formed in
the outflow, which form separate particles not in phys-
ical contact with the silicate dust grains. They are re-
quired to explain the observed mid infrared excess be-
tween λ = 5.5 µm and λ = 8 µm, but a reasonable fit for
the spectral region λ > 9 µm dominated by the silicate
emission can be obtained without such a component, if
one leaves open the question on the origin of the flux
excess at λ < 8 µm.
For future analysis of much broader samples of stars
it would be desirable to have at our hands the optical
data for a much finer grid of Fe/(Mg+Fe) ratios. The
corresponding thin films are already produced and the
raw data have already been acquired for this.
We acknowledge the very constructive referee report
which helped to improve the presentation of the re-
sults. We greatly acknowledge S. Hony for making avail-
able to us a set of reduced ISO spectra for our sam-
ple stars. We express our gratitude to Dr. Theiss for
making available for us the SCOUT software. We are
thankful to Dr. S. Wetzel for his technical and sci-
entific supports. We thank Hans-Werner Becker and
Detlef Rogalla for Rutherford Backscattering analy-
sis. Our project has been supported by the ‘Deutsche
Forschungsgemeinschaft (DFG)’ under the Priority Pro-
gram SPP1385. This work is (partly) performed at
and supported by RUBION, central unit of the Ruhr-
Universitat Bochum. This research has made use of
NASA’s Astrophysics Data System.
20
APPENDIX
A. FITTING OF SYNTHETIC SPECTRA
A.1. Model Assumptions
The synthetic spectrum of a dust shell is calculated by taking advantage of the assumption of an optically thin dust
shell. This allows a very rapid calculation of a model spectrum and this in turn enables computing large sets of such
models for obtaining optimized fits between model spectra and observations. The model is calculated as follows:
1. For the emission from the central star we assume a black body spectral energy distribution with effective
temperature Teff . Alternatively a read-in spectral energy distribution can be used.
2. The dust temperature Td is determined from radiative equilibrium between absorption and emission of a dust
grain ∫ ∞0
κ(abs)ν Bν(Teff)W (r) e−τν dν =
∫ ∞0
κ(abs)ν Bν(Td) dν , (A1)
where Bν is the Kirchhoff-Planck function, κ(abs)ν the mass absorption coefficient of the dust material, and W (r) is the
geometric dilution factor of the stellar radiation field
W =1
2
(1−
√1− R2
∗r2
)(A2)
where R∗ is the stellar radius. Each dust species has its own dust temperature Td. The quantity
τν =∑j
∫ r
R+
%j
(κ
(abs)j,ν + κ
(sca)j,ν
)dr′ (A3)
is the optical depth between the stellar surface and the radial distance r of the dust grain from the stellar centre. The
density %j is the mass density of the dust species j and the summation is over all dust species present. Our assumption
of an optical thin dust shell mainly refers to the mid to far infrared wavelength for which we compare the emission
from the dust shell with observations. The heating of the dust grains is due to absorption of stellar radiation which
peaks around 1 . . . 1.5 µm. Since the extinction by dust grains strongly raises from the near infrared to the ultraviolet,
the dust shell may be optically thin in the mid to far infrared wavelength even if its optically thickness is not small in
the optical spectral region. For this reason we retain the factor exp(−τν) despite our assumption of an optically thin
dust shell.
3. For each dust species it is assumed that the dust is spherically symmetric distributed around a central star and
extends from some inner radius Ri to an outer radius Ra. The radial distribution of the dust density % is assumed to
follow a power law r−p where p is generally assumed to equal p = 2 which corresponds to a stellar wind with constant
outflow velocity. The inner radius, Ri, is determined such that the dust temperature of the species takes a prescribed
value Tc at this radius. The outer radius, Ra, is prescribed.
4. The observed spectral energy flux from the object observed at Earth is
Fν =e−τISMν
4π
D2
1
4Bν (Teff) e−τνR2
∗ +∑j
Ra∫Ri
Bν (Td,j) %jκ(abs)j,ν r2 dr
, (A4)
where D is the distance of the object from Earth and τ ISMν the optical depth of the ISM along the sightline. The first
term in curly brackets is the contribution from the star and the second that of the dust shell.
For optically thin dust shells the dust temperature distribution calculated from equation (A1) is spherically sym-
metric, even if the dust distribution is not. Therefore we introduced in the emission term spherical coordinates. More
generally the corresponding integral is a volume integral∫Bν (Td,j) %jκ
(abs)j,ν dV ,
where one may decompose the integration domain into spherical shells and perform the angular integrations over each
shell separately. Then one can write the volume integral equally well in terms of the average mass densities of the
shells. Hence, we have to interpret % in equation (A4) as the mass density averaged over concentric shells around the
star. In this sense equation (A4) also holds if the real dust distribution is not strictly spherically symmetric.
21
5. The model allows to consider an arbitrary number of dust species. The mass absorption and scattering coefficients
are calculated from the complex index of refraction. For inhomogeneously composed particles an effective complex
index of refraction according to the Bruggeman mixing rule (cf. Berryman 1995) can be calculated. The calculation
can be done for either spherical particles (Mie theory) or for small ellipsoidal particles (Bohren & Huffman 1983) with
a numerically specified distribution of axis ratios and radii, for a continuous distribution of ellipsoids (CDE, see Bohren
& Huffman 1983), or for small cubes (Fuchs 1975).
A.2. Model Parameter
In order to calculate a model for the spectral energy distribution of a given object with observed infrared spectrum one
has to specify the luminosity L and effective temperature Teff of the star. The stellar radius follows from the standard
relation 4πR2∗σT
4eff = L. Further one has to specify the dust species considered in the model, the corresponding optical
properties, and the particle shape and size distribution. For all species κ(abs)j,ν is calculated at the specified wavelength
grid. For the dust distributions of all species j one fixes the power p, the outer radius of the dust shell, Ra, and the
total dust masses, Mj , and condensation temperatures, Tj,c, of the dust species.
A.3. Model Calculation
For a given set of parameters the radial variation of dust temperature for each species is calculated according to
equation (A1) for a small set of assumed values for Ri and the value of Ri corresponding to the specified value of
Tj,c is determined by backward interpolation. Then the dust temperatures for r > Ri are calculated and the spectral
energy distribution is calculated according to equation (A4).
A.4. Optimization
For given dust properties a model depends on the two parameters L, Teff and the 2J parameters Mj , Tj,c where
J is the number of dust species. The parameters L, Teff are derived from astronomical observations and are given
quantities for an object.2 The parameters Mj , Tj,c of the dust shell are unknown and have to be determined by fitting
the observed spectrum with the model spectrum.
The goodness of fit between the synthetic and the observed spectrum is checked by calculating the quality function
χ2 =∑l
(NFobs
ν −Fcalcν
Fcalcν
)2
. (A5)
For calculating χ2 not all frequency points used for calculating the spectrum are taken into account, but only those
where no strong molecular features from the underlying star are seen in the observed spectrum. The quantity N is
a normalization factor which accounts for the circumstance that usually the distance D is not accurately known such
that to enable a comparison of the two spectra one has to apply a shift to one of them to put them one upon another.
This factor is determined such as to minimize χ2 as the solution of
∂ χ2
∂N= 0 (A6)
for N . The value of χ2 calculated with this normalization is taken as the quality function. Then we vary the 2J
parameters dust masses Mj and condensation temperatures Tj,c and search for the parameter combination for which
χ2 takes the lowest value. This parameter set is then considered as the best-fit model for the dust shell.
Such nonlinear minimization problems are notoriously difficult to solve. Here the minimization of χ2 is done by
applying a genetic algorithm that usually allows an efficient minimum search even if many parameters are involved.
We use the special variant of such an algorithm described in Charbonneau (1995) because this worked quite well in
other projects where we used this method.
The genetic algorithm operates with discrete values of the model parameters. The optimized parameter set resulting
from this method therefore is slightly off from the true minimum. Instead of improving the accuracy of the genetic
algorithm by using a finer resolution of the variable space we perform a final refinement step by minimization with a
gradient method. This converges rapidly because one starts already from a position in variable space very close to the
searched-for minimum.
2 If spectral data in the optical and near IR are given, Teff mayalso be determined by the optimization procedure.
22
Software: SCOUT(Theiss 2011),
Software: PIKAIA(Charbonneau 1995)
REFERENCES
Arroyo-Torres, B., Wittkowski, M., Chiavassa, A., et al. 2015,
A&A, 575, A50
Asplund, M., Grevesse, N., Sauval, A. J., & Scott, P. 2009,
ARA&A, 47, 481
Begemann, B., Dorschner, J., Henning, T., et al. 1997, ApJ, 476,
199
Bernatovicz, T. J., & Zinner, E. K. 1997, Astrophysical
Implications of the Laboratory Study of Presolar Material,
AIP Conf. Proc. 402 (Am. Inst. Phys.)
Berryman, J. G. 1995, in Rock Physics and Phase Relations.
AGU Ref. Shelf 3, ed. T. J. Ahrens (Washington: American
Geophysical Union), 205–228
Bohren, C. F., & Huffman, D. R. 1983, Absorption and
Scattering of Light by Small Particles. (New York: John Wiley
& Sons)
Bose, M., Floss, C., & Stadermann, F. J. 2010, ApJ, 714, 1624
Bose, M., Floss, C., Stadermann, F. J., Stroud, R. M., & Speck,
A. K. 2012, GeoCoA, 93, 77
Brendel, R., & Bormann, D. 1992, J. Appl. Phys., 71, 1
Charbonneau, P. 1995, ApJS, 101, (see also
http://download.hao.ucar.edu/archive/pikaia/)
Colangeli, L., Henning, T., Brucato, J. R., et al. 2003, A&A Rv,
11, 97
Danchi, W. C., Bester, M., Degiacomi, C. G., Greenhill, L. J., &
Townes, C. H. 1994, ApJ, 107, 1469
Day, K. L. 1979, ApJ, 234, 158
Day, K. L. 1981, ApJ, 246, 110
De Sousa Meneses, D., Malki, M., & Echegut, P. 2006, J.
Non-Cryst. Solids, 352, 769
Dohmen, R., Becker, H.-W., Meißner, E., Etzel, T., &
Chakraborty, S. 2002, Eur. J. Miner., 14, 1155
Dorschner, J., Begemann, B., Henning, T., Jager, C., &
Mutschke, H. 1995, A&A, 300, 503
Draine, B. T. 2003, ARA&A, 41, 241
Fuchs, R. 1975, Phys. Rev. B, 11, 1732
Fujiwara, H. 2007, Spectroscopic Ellipsometry: Principles and
Applications. (Chichester: John Wiley & Sons)
Gail, H.-P. 2010, in Lecture Notes in Physics, Berlin Springer
Verlag, Vol. 815, Lecture Notes in Physics, Berlin Springer
Verlag, ed. T. Henning, 61–141
Gail, H.-P., & Sedlmayr, E. 1999, A&A, 347, 594
Gail, H.-P., Wetzel, S., Pucci, A., & Tamanai, A. 2013, A&A,
555, A119
Grosse, P., Harbecke, B., Heinz, B., & Meyer, R. 1986, Appl.
Phys. A, 39, 257
Grossman, L. 1972, GeoCoA, 36, 597
Henning, T. 2010, ARA&A, 48, 21
Ishikawa, K., Suzuki, K., & Okamura, S. 2000, J. Appl. Phys.,
88, 7150
Jager, C., Dorschner, J., Mutschke, H., Posch, T., & Henning, T.
2003, A&A, 408, 193
Jones, O. C., Kemper, F., Srinivasan, S., et al. 2014, MNRAS,
440, 631
Jones, O. C., Kemper, F., Sargent, B. A., et al. 2012, MNRAS,
427, 3209
Jura, M., & Kleinmann, S. G. 1990, ApJS, 73, 769
Karovicova, I., Wittkowski, M., Ohnaka, K., et al. 2013, A&A,
560, A75
Keller, L. P., Messenge, S., & Walker, R. M. 2012, Lun. Plan.
Sci. Conf., 43, 1880
Keller, L. P., & Messenger, S. 2011, GeoCoA, 75, 5336
Kemper, F., de Koter, A., Waters, L. B. F. M., Bouwman, J., &
Tielens, A. G. G. M. 2002, A&A, 384, 585
Koike, C., Chihara, H., Tsuchiyama, A., et al. 2003, A&A, 399,
1101
Koike, C., & Hasegawa, H. 1987, Ap&SS, 134, 361
Kotai, E. 1994, Nucl. Instrum. Methods Phys. Res., B85, 588
Kraemer, K. E., Sloan, G. C., Price, S. D., & Walker, H. J. 2002,
ApJS, 140, 389
Le Guillou, C., Dohmen, R., Rogalla, D., et al. 2015, Chemical
Geology, 412, 179
Levesque, E. M., Massey, P., Olsen, K. A. G., et al. 2005, The
Astrophysical Journal, 628, 973
Li, A. 2005, Journal of Physics Conference Series, 6, 229
Little-Marenin, I. R., & Little, S. J. 1990, AJ, 99, 1173
Lodders, K., & Amari, S. 2005, Chemie der Erde, 65, 93
Lodders, K., Palme, H., & Gail, H.-P. 2009, in
Landolt-Bornstein, New Series, Group IV, Vol. 4, ed. J. E.
Trumper (Berlin: Springer), 560–599
Matzel, J., Dai, Z. R., Teslich, N., et al. 2008, in Lunar and
Planetary Science Conference, Vol. 39, Lunar and Planetary
Science Conference, 2525
Mauron, N., & Josselin, E. 2011, A&A, 526, A156
Messenger, S., Keller, L. P., Stadermann, F. J., Walker, R. M., &
Zinner, E. 2003, Science, 300, 105
Molster, F. J., Waters, L. B. F. M., & Kemper, F. 2010, in
Lecture Notes in Physics, Berlin Springer Verlag, Vol. 815,
Lecture Notes in Physics, Berlin Springer Verlag, ed.
T. Henning, 143–201
Naiman, M. L., Kirk, C. T., Emerson, B. L., Taitel, J. B., &
Senturia, S. D. 1985, J. Appl. Phys., 58, 779
Nguyen, A. N., Nittler, L. R., Stadermann, F. J., Stroud, R. M.,
& Alexander, M. O. 2010, ApJ, 719, 166
Nguyen, A. N., & Zinner, E. 2004, Science, 303, 1496
Nitsan, U. 1974, J. Geophys. Res., 79, 706
Nuth, J. A., & Hecht, J. H. 1990, Ap&SS, 163, 79
Oliveira, I., Olofsson, J., Pontoppidan, K. M., et al. 2011, ApJ,
734, 51
Onaka, T., de Jong, T., & Willems, F. J. 1989a, A&A, 218, 169
—. 1989b, A&AS, 81, 261
Ordal, M. A., Bell, R. J., Alexander, Jr., R. W., Newquist, L. A.,
& Querry, M. R. 1988, ApOpt, 27, 1203
Ossenkopf, V., Henning, T., & Mathis, J. S. 1992, A&A, 261
Palik, E. D. 1985, Handbook of Optical Constants of Solids., Vol.
Vols. I, II, III (Boston: Academic Press)
Peiponen, K.-E., & Vartiainen, E. M. 1991, Phys. Rev. B, 44,
8301
Pollack, J. B., Hollenbach, D., Beckwith, S., et al. 1994, ApJ,
421, 615
Salpeter, E. E. 1977, ARA&A, 15, 267
Speck, A. K., Barlow, M. J., Sylvester, R. J., & Hofmeister,
A. M. 2000, A&AS, 146, 437
Speck, A. K., Whittington, A. G., & Hofmeister, A. M. 2011,
ApJ, 740, 93
Synowicki, R. A. 1998, Thin Solid Films, 394, 313
Tamanai, A., Mutschke, H., Blum, J., & Meeus, G. 2006, ApJL,
648, L147
Tamanai, A., Mutschke, H., Blum, J., et al. 2009, A&A, 501
Theiss, M. 2011, SCOUT - software package for optical
spectroscopy V3.48, , , see http://www.wtheiss.com/
23
Verhoelst, T., Van der Zypen, N., Hony, S., et al. 2009, A&A,
498, 127Vollmer, C., Brenker, F. E., Hoppe, P., & Stroud, R. M. 2009,
ApJ, 700, 774
Von Rottkay, K., Rubin, M., & Ozer, N. 1998, in MaterialsResearch Society Symposium Proceedings, Vol. 403,
(Pittsburgh: Material Re-search Society), 551–556Watson, D. M., Leisenring, J. M., Furlan, E., et al. 2009, ApJS,
180, 84
Wetzel, S., Klevenz, M., Pucci, A., & Gail, H.-P. 2012c, Appl.Spectrosc., 66, 1061
Wetzel, S., Pucci, A., & Gail, H.-P. 2012a, J. Chemical & Eng.
Data, 57, 1594
Wittkowski, M., Karovicova, I., Scholz, M., Ohnaka, K., &
Boboltz, D. A. 2015, in Astronomical Society of the Pacific
Conference Series, Vol. 497, Why Galaxies Care about AGB
Stars III: A Closer Look in Space and Time, ed.
F. Kerschbaum, R. F. Wing, & J. Hron, 327