Embed Size (px)
Citation preview
Atherton State School
ANNUAL REPORT
2018 Queensland State School Reporting
Every student succeeding State Schools Strategy
Department of Education
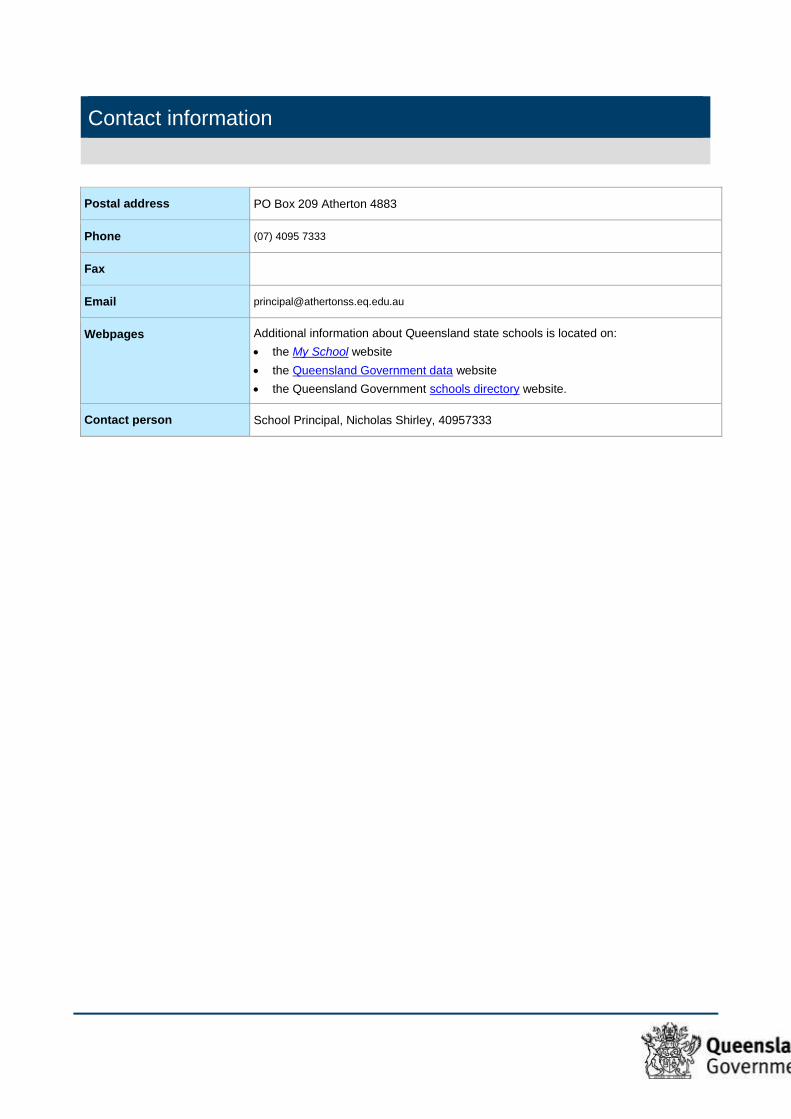
Contact information
Postal address PO Box 209 Atherton 4883
Phone (07) 4095 7333
Fax
Email [email protected]
Webpages Additional information about Queensland state schools is located on:
the My School website
the Queensland Government data website
the Queensland Government schools directory website.
Contact person School Principal, Nicholas Shirley, 40957333
From the Principal
School overview
Welcome to the School Annual Report for Atherton State School for 2018. This report outlines the existing profile of the school including information on student learning outcomes in areas such as literacy and numeracy and the level of student, staff and parent satisfaction with the current school operations. The School Annual Report also gives a perspective on future priorities and directions.
Analysis of performance data indicates that Atherton State School continues to achieve student learning outcomes above state benchmarks in many areas. Parent, staff and student surveys continue to show high satisfaction levels in most areas.
We are a co-educational state school with a current enrolment of 445. We are active members of the Atherton Cluster of Educators (ACE) and have engaged in professional development relating to developing quality learning frameworks. All ACE schools continue to develop a common curriculum journey for Prep to Year 12 students. We focus on early intervention and high preparedness in the early years with an engaging curriculum. We have quality transition strategies in place for our middle school students. At our school we celebrate: excellent relationships between staff, parents and students; genuine care and concerns for all students; being pedagogically driven with quality programs delivered by quality teachers; being technologically sophisticated with interactive whiteboards and quality teaching strategies; being a connected school of the future with a wide range of excellent support programs, and having high expectations for school standards and character values. All students are encouraged and supported to achieve to their best. Atherton State School has a strong family and community atmosphere where diversity and progress is valued and celebrated.
At our school we celebrate:
Positive Behaviour for Learning (PBL)
Explicit teaching
High expectations of school standards, values and excellent school organisation
Excellent relationships between staff, parents and students
High staff morale
Genuine care and concerns for all students
Use technology (Interactive Whiteboards in all rooms, laptops and desktop computers) to support student learning and explicit
teaching.
A wide range of extra curricula activities
We aim to provide a “welcoming feel” to our school for all whom visit and attend. All students are encouraged and supported to achieve
to their best in all areas. Atherton State School has a strong family and community atmosphere where diversity and progress is valued
and celebrated in all areas.
School progress towards its goals in 2018
Throughout 2018 we focussed on teaching explicitly our curriculum and our behaviour management strategies so that there is consistency
across each year level and across the school.
We have been a part of an Explicit Teaching network since 2010. This network provides support and a place for new ideas to be shared
for teachers to develop consistent explicit teaching as the key pedagogy (teaching method) that we use at Atherton State School. Our
teachers continued developing focussed, fast paced learning episodes called “Warm Ups or Consolidation” that consolidate essential
skills and knowledge to a level of instant recall (automaticity). When students can recall basic facts quickly without thinking there is more
space for higher order learning skills as problem solving, writing a persuasive text or understanding higher science concepts.
Our Many Ways Strong program continues to build relationships with families before their children attend Prep. This program is going
from strength to strength with more families attending each week.
We implemented the Australian Curriculum in all year levels. We continued to implement phonemic and spelling programs to improve the skill levels of our youngest learners. We improved our student learning outcomes measured through NAPLAN. We achieved excellent results with our year 3 students achieving or exceeding the National Minimum Standards in all areas of NAPLAN.
Future outlook
We are committed to continuously improving the learning outcomes of every child. We want every child, learning and achieving every day.
We are focussing on these five areas.
Explicit teaching practices that deliver quality curriculum programs.
The quality of the feedback, assessment and evaluation systems that we use to check how much and what learning has occurred
and why.
How we build and maintain relationships with children and their parents and carers.
How we teach students “getting along” and “learning” behaviours and routines.
How we provide students with frequent opportunities to achieve success in a range of areas.
In 2018 we will focus on growing the quality and consistency of our teaching. We will continue to refine our usage of Explicit Teaching;
most frequently in the teaching of English and Mathematics. We will be a part of the Explicit Teaching and Coaching regional model with
visits from John Fleming. All classrooms will refine their use of ‘warm ups or consolidations’ to consolidate vital literacy and numeracy
skills to automaticity. We will continue to concentrate on the six elements of teaching reading: Oral Language, Phonemics, Phonics,
Vocabulary, Comprehension and Fluency. CARS and STARS (comprehension program) continues to be implemented across years 2 to
6. Guided Reading will continue to be implemented with Prep to year 5 students. A school script has been developed to ensure a
consistency of approach. Parent volunteers will be trained in our Guided Reading script.
In 2018 support programs for students in Prep, year 1 and year 2 have been implemented to ensure that identified students receive
additional support three times a week with a qualified teacher. Our aim is to reduce the number of students achieving below the regional
benchmarks in reading.
We will continue to grow partnerships with all sections of our community increasing parental understanding of their child’s education and
increasing their participation. We will continue to provide our Many Ways Strong program that supports parents before their children attend
Prep.
Our school at a glance
School profile
Coeducational or single sex Coeducational
Independent public school No
Year levels offered in 2018 Prep Year - Year 6
Student enrolments
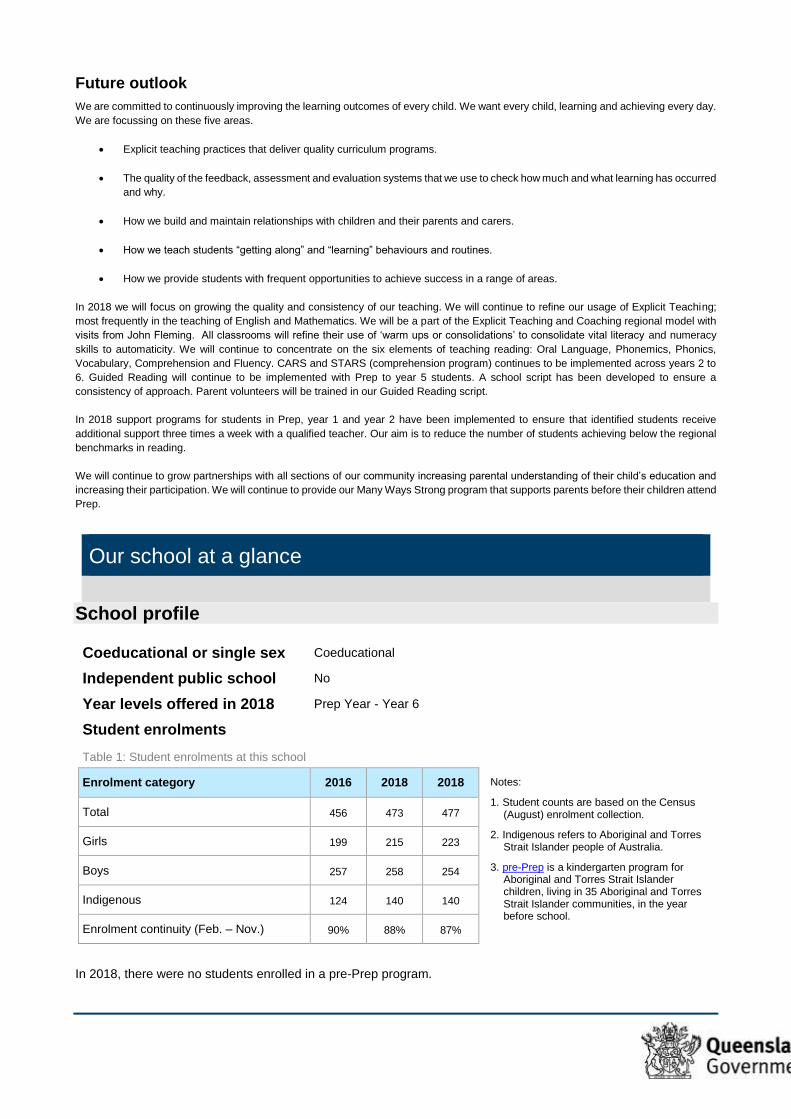
Table 1: Student enrolments at this school
Enrolment category 2016 2018 2018
Notes:
1. Student counts are based on the Census (August) enrolment collection.
2. Indigenous refers to Aboriginal and Torres Strait Islander people of Australia.
3. pre-Prep is a kindergarten program for Aboriginal and Torres Strait Islander children, living in 35 Aboriginal and Torres Strait Islander communities, in the year before school.
Total 456 473 477
Girls 199 215 223
Boys 257 258 254
Indigenous 124 140 140
Enrolment continuity (Feb. – Nov.) 90% 88% 87%
In 2018, there were no students enrolled in a pre-Prep program.
Characteristics of the student body
Overview
Overview The students who attend our school mostly live in Atherton, while some travel to school from the farms that surround the town. Even
though we are located in a rural district we are large enough to feel urban. Our ICESA rating of 925 indicates that 31% of our families are
in the bottom quartile, with 16% in the top quartile.
Our students come from many different ethnic and racial groups. Aboriginal and Torres Strait Islander students make up 25% of the
student population.
We experience a lot of transience that impacts upon all classes. As Atherton is one of the largest centres on the Atherton Tablelands, it
has a concentration of social services that are able to support the families who move here to access this often short term support. It is not
uncommon to enrol a child several times in their primary school journey or for children to have attended 3 or more schools by year 6.
Unemployment rates are high.
Average class sizes
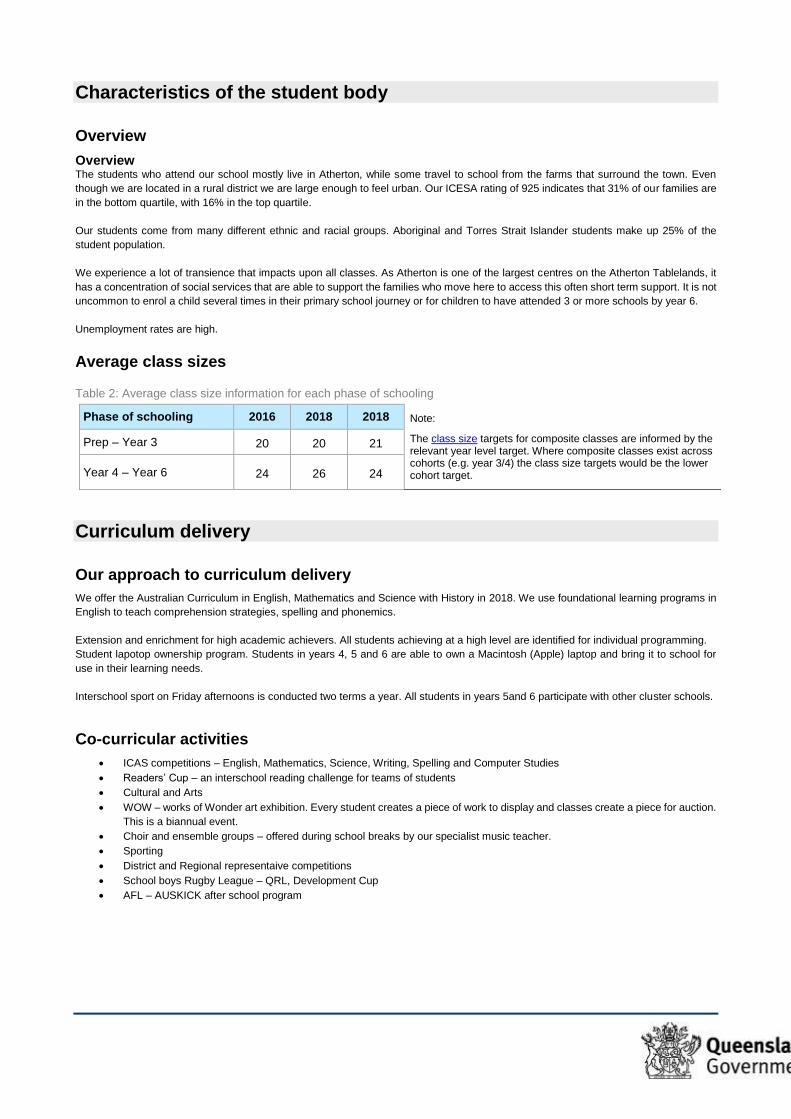
Table 2: Average class size information for each phase of schooling
Phase of schooling 2016 2018 2018
Note:
The class size targets for composite classes are informed by the relevant year level target. Where composite classes exist across cohorts (e.g. year 3/4) the class size targets would be the lower cohort target.
Prep – Year 3 20 20 21
Year 4 – Year 6 24 26 24
Curriculum delivery
Our approach to curriculum delivery
We offer the Australian Curriculum in English, Mathematics and Science with History in 2018. We use foundational learning programs in
English to teach comprehension strategies, spelling and phonemics.
Extension and enrichment for high academic achievers. All students achieving at a high level are identified for individual programming.
Student lapotop ownership program. Students in years 4, 5 and 6 are able to own a Macintosh (Apple) laptop and bring it to school for
use in their learning needs.
Interschool sport on Friday afternoons is conducted two terms a year. All students in years 5and 6 participate with other cluster schools.
Co-curricular activities
ICAS competitions – English, Mathematics, Science, Writing, Spelling and Computer Studies
Readers’ Cup – an interschool reading challenge for teams of students
Cultural and Arts
WOW – works of Wonder art exhibition. Every student creates a piece of work to display and classes create a piece for auction.
This is a biannual event.
Choir and ensemble groups – offered during school breaks by our specialist music teacher.
Sporting
District and Regional representaive competitions
School boys Rugby League – QRL, Development Cup
AFL – AUSKICK after school program
How information and communication technologies are used to assist learning
Our school places significant emphasis on the use of ICTs in the classroom. All students accessed computers and the internet in their
classrooms and in the library to enhance their information and communication skills and to provide maximum opportunities to include
these skills in the presentations of their learning.
We actively worked towards connecting our students to the future with the appropriate digital technology and critical learning skills.
All teachers use an Interactive White Board as part of their teaching. This enables all classes to access the electronic curriculum resources
that include streamed video, online interactive activities and online discussions.
All staff who work more than 4 days a fortnight are issued with a Macbook Pro laptop as part of the Computers for Teachers initiative.
Students in years 4, 5 and 6 are able to own a Macintosh (Apple) laptop and bring it to school for use in their classroom.
Social climate
Overview
We are a large school with a diverse range of students. We support students’ social and emotional development in every classroom. We
operate a voluntary chaplaincy program. Students are able to participate in a co-operative religious education program weekly.
We respond to bullying with a range of strategies. Aggressive actions are not always associated with bullying, though they do attract
disciplinary responses. Ongoing hurtful actions are considered to be bullying.
Parent, student and staff satisfaction
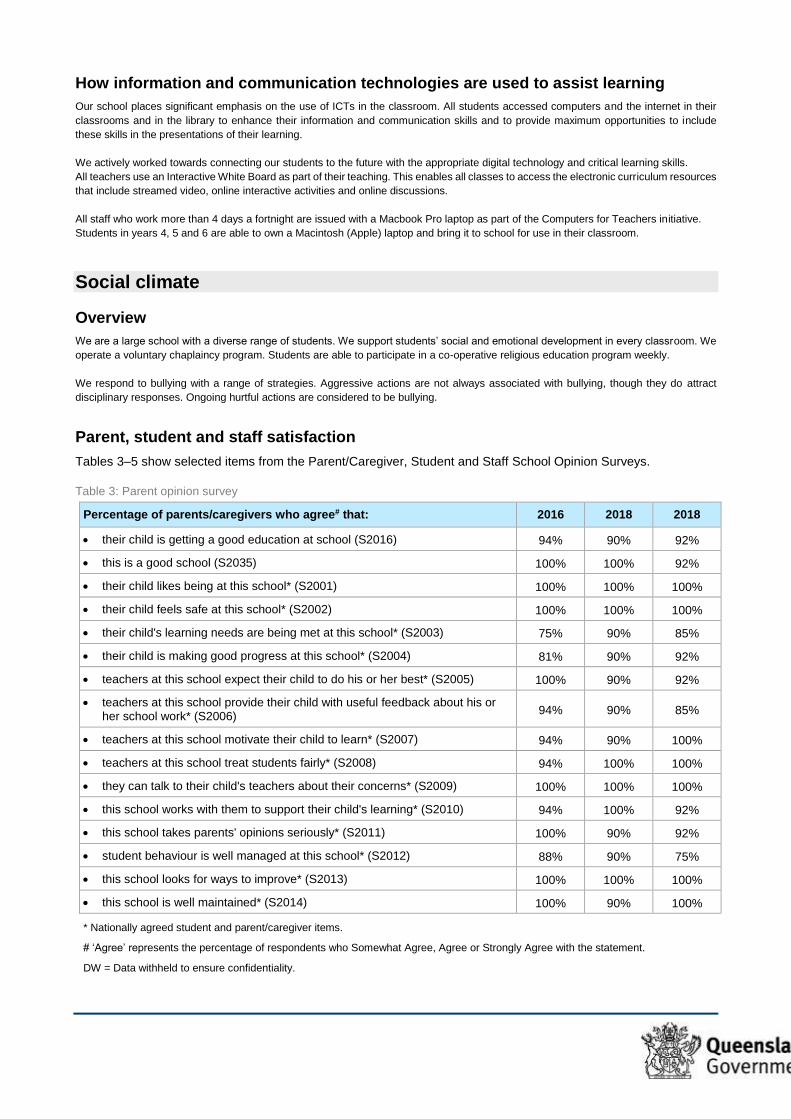
Tables 3–5 show selected items from the Parent/Caregiver, Student and Staff School Opinion Surveys.
Table 3: Parent opinion survey
Percentage of parents/caregivers who agree# that: 2016 2018 2018
their child is getting a good education at school (S2016) 94% 90% 92%
this is a good school (S2035) 100% 100% 92%
their child likes being at this school* (S2001) 100% 100% 100%
their child feels safe at this school* (S2002) 100% 100% 100%
their child's learning needs are being met at this school* (S2003) 75% 90% 85%
their child is making good progress at this school* (S2004) 81% 90% 92%
teachers at this school expect their child to do his or her best* (S2005) 100% 90% 92%
teachers at this school provide their child with useful feedback about his or her school work* (S2006)
94% 90% 85%
teachers at this school motivate their child to learn* (S2007) 94% 90% 100%
teachers at this school treat students fairly* (S2008) 94% 100% 100%
they can talk to their child's teachers about their concerns* (S2009) 100% 100% 100%
this school works with them to support their child's learning* (S2010) 94% 100% 92%
this school takes parents' opinions seriously* (S2011) 100% 90% 92%
student behaviour is well managed at this school* (S2012) 88% 90% 75%
this school looks for ways to improve* (S2013) 100% 100% 100%
this school is well maintained* (S2014) 100% 90% 100%
* Nationally agreed student and parent/caregiver items.
# ‘Agree’ represents the percentage of respondents who Somewhat Agree, Agree or Strongly Agree with the statement.
DW = Data withheld to ensure confidentiality.
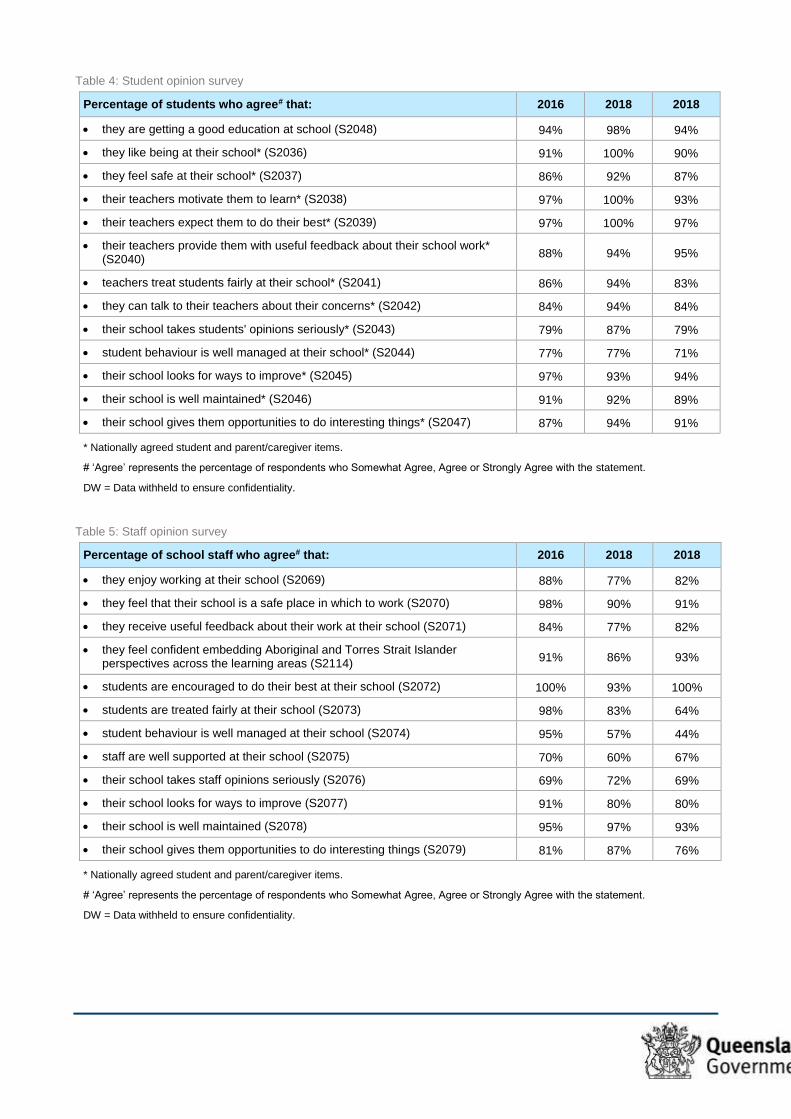
Table 4: Student opinion survey
Percentage of students who agree# that: 2016 2018 2018
they are getting a good education at school (S2048) 94% 98% 94%
they like being at their school* (S2036) 91% 100% 90%
they feel safe at their school* (S2037) 86% 92% 87%
their teachers motivate them to learn* (S2038) 97% 100% 93%
their teachers expect them to do their best* (S2039) 97% 100% 97%
their teachers provide them with useful feedback about their school work* (S2040)
88% 94% 95%
teachers treat students fairly at their school* (S2041) 86% 94% 83%
they can talk to their teachers about their concerns* (S2042) 84% 94% 84%
their school takes students' opinions seriously* (S2043) 79% 87% 79%
student behaviour is well managed at their school* (S2044) 77% 77% 71%
their school looks for ways to improve* (S2045) 97% 93% 94%
their school is well maintained* (S2046) 91% 92% 89%
their school gives them opportunities to do interesting things* (S2047) 87% 94% 91%
* Nationally agreed student and parent/caregiver items.
# ‘Agree’ represents the percentage of respondents who Somewhat Agree, Agree or Strongly Agree with the statement.
DW = Data withheld to ensure confidentiality.
Table 5: Staff opinion survey
Percentage of school staff who agree# that: 2016 2018 2018
they enjoy working at their school (S2069) 88% 77% 82%
they feel that their school is a safe place in which to work (S2070) 98% 90% 91%
they receive useful feedback about their work at their school (S2071) 84% 77% 82%
they feel confident embedding Aboriginal and Torres Strait Islander perspectives across the learning areas (S2114)
91% 86% 93%
students are encouraged to do their best at their school (S2072) 100% 93% 100%
students are treated fairly at their school (S2073) 98% 83% 64%
student behaviour is well managed at their school (S2074) 95% 57% 44%
staff are well supported at their school (S2075) 70% 60% 67%
their school takes staff opinions seriously (S2076) 69% 72% 69%
their school looks for ways to improve (S2077) 91% 80% 80%
their school is well maintained (S2078) 95% 97% 93%
their school gives them opportunities to do interesting things (S2079) 81% 87% 76%
* Nationally agreed student and parent/caregiver items.
# ‘Agree’ represents the percentage of respondents who Somewhat Agree, Agree or Strongly Agree with the statement.
DW = Data withheld to ensure confidentiality.
Parent and community engagement
We invite parents to participate in their child’s education. Assisting in classrooms with literacy, numeracy and art activities is common,
especially in the lower school. We greatly appreciate the assistance these parents provide with tasks like changing home readers, reading
with small groups and supervising busy art and craft activities.
Parents participate through our active Parents and Citizens’ Association. A fete was held in 2011 for the first time with our third in 2014.
It was a huge success thanks to the workers who dedicated time and effort into putting it together.
We run a Families As First Teachers program targeting families before their children start Prep. This program operates like a playgroup
that encourages parents to participate as the teachers and to take resources and ideas home to use with their children. We are now in
our 11th year.
Respectful relationships education programs
Atherton State School utilises the following programs to develop respectful relationships:
Peer Support Program
Junior Respect Me Program
Positive Behaviour for Learning
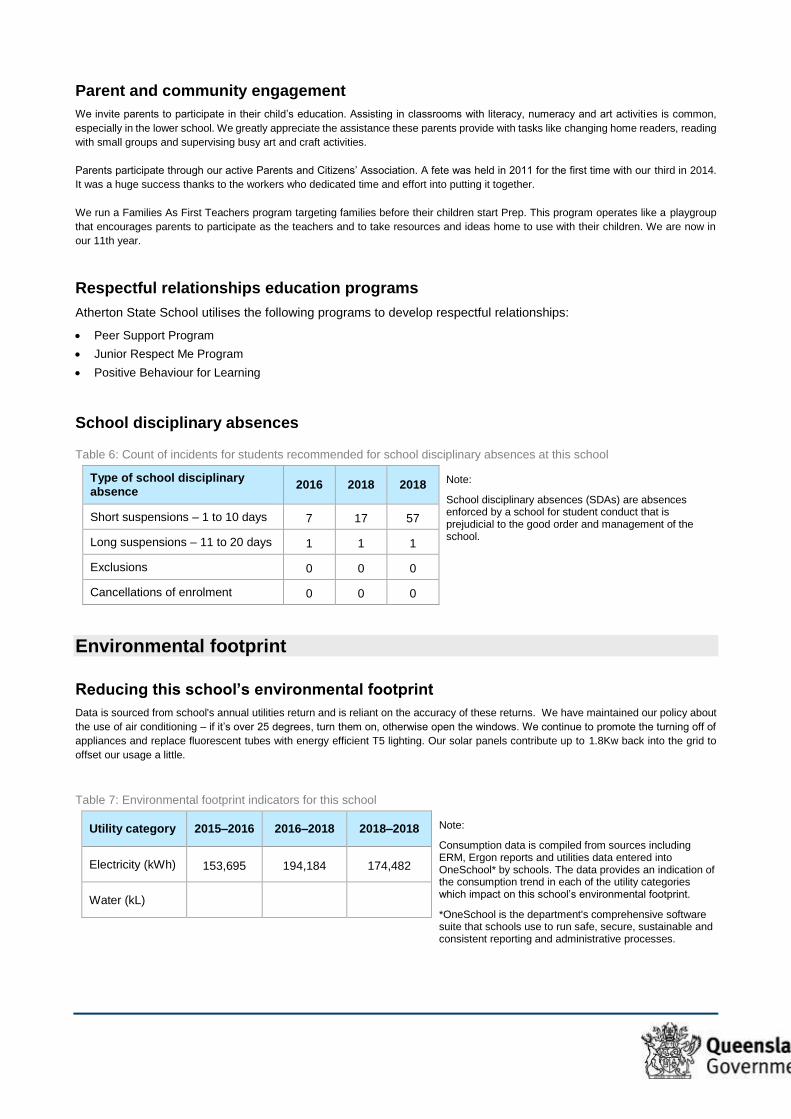
School disciplinary absences
Table 6: Count of incidents for students recommended for school disciplinary absences at this school
Type of school disciplinary absence
2016 2018 2018
Note:
School disciplinary absences (SDAs) are absences enforced by a school for student conduct that is prejudicial to the good order and management of the school.
Short suspensions – 1 to 10 days 7 17 57
Long suspensions – 11 to 20 days 1 1 1
Exclusions 0 0 0
Cancellations of enrolment 0 0 0
Environmental footprint
Reducing this school’s environmental footprint
Data is sourced from school's annual utilities return and is reliant on the accuracy of these returns. We have maintained our policy about
the use of air conditioning – if it’s over 25 degrees, turn them on, otherwise open the windows. We continue to promote the turning off of
appliances and replace fluorescent tubes with energy efficient T5 lighting. Our solar panels contribute up to 1.8Kw back into the grid to
offset our usage a little.
Table 7: Environmental footprint indicators for this school
Utility category 2015–2016 2016–2018 2018–2018
Note:
Consumption data is compiled from sources including ERM, Ergon reports and utilities data entered into OneSchool* by schools. The data provides an indication of the consumption trend in each of the utility categories which impact on this school’s environmental footprint.
*OneSchool is the department's comprehensive software suite that schools use to run safe, secure, sustainable and consistent reporting and administrative processes.
Electricity (kWh) 153,695 194,184 174,482
Water (kL)
School funding
School income broken down by funding source
School income, reported by financial year accounting cycle using standardized national methodologies and broken down by funding source is available via the My School website at.
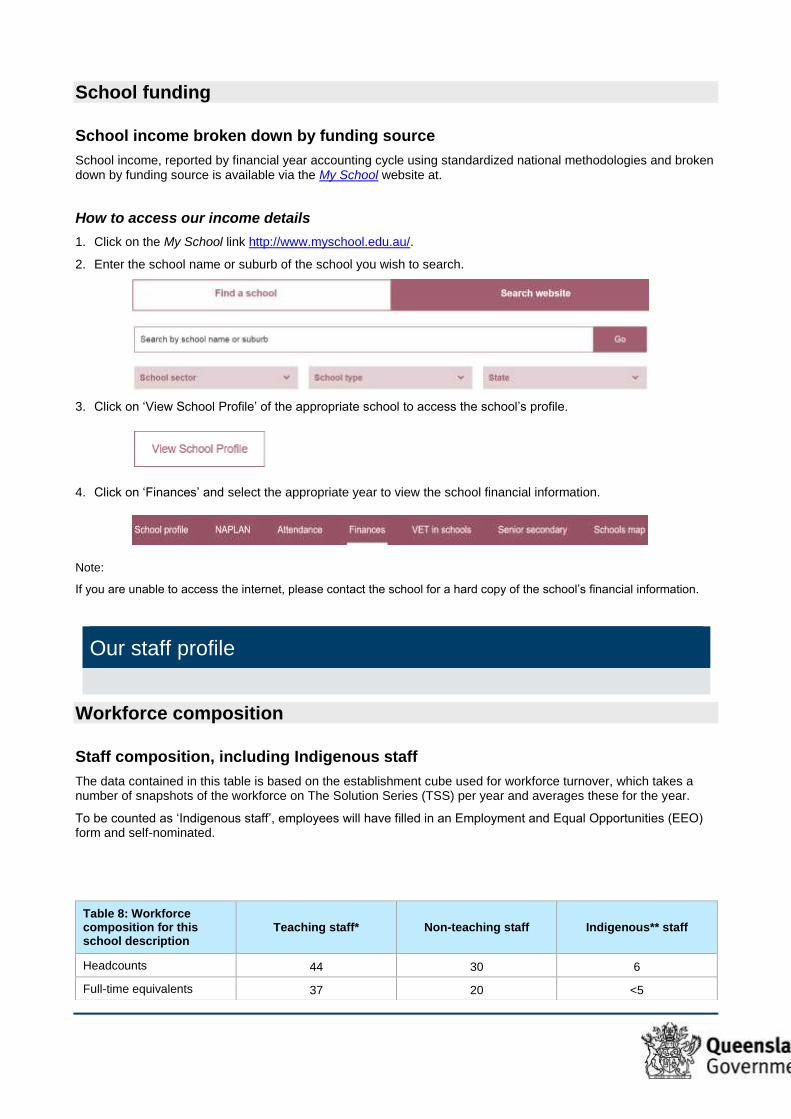
How to access our income details
1. Click on the My School link http://www.myschool.edu.au/.
2. Enter the school name or suburb of the school you wish to search.
3. Click on ‘View School Profile’ of the appropriate school to access the school’s profile.
4. Click on ‘Finances’ and select the appropriate year to view the school financial information.
Note:
If you are unable to access the internet, please contact the school for a hard copy of the school’s financial information.
Our staff profile
Workforce composition
Staff composition, including Indigenous staff
The data contained in this table is based on the establishment cube used for workforce turnover, which takes a number of snapshots of the workforce on The Solution Series (TSS) per year and averages these for the year.
To be counted as ‘Indigenous staff’, employees will have filled in an Employment and Equal Opportunities (EEO) form and self-nominated.
Table 8: Workforce composition for this school description
Teaching staff* Non-teaching staff Indigenous** staff
Headcounts 44 30 6
Full-time equivalents 37 20 <5
In accordance with the EEO privacy provisions and confidentiality, the ‘less than 5’ rule has been applied in schools whose Indigenous staff numbers are less than five.
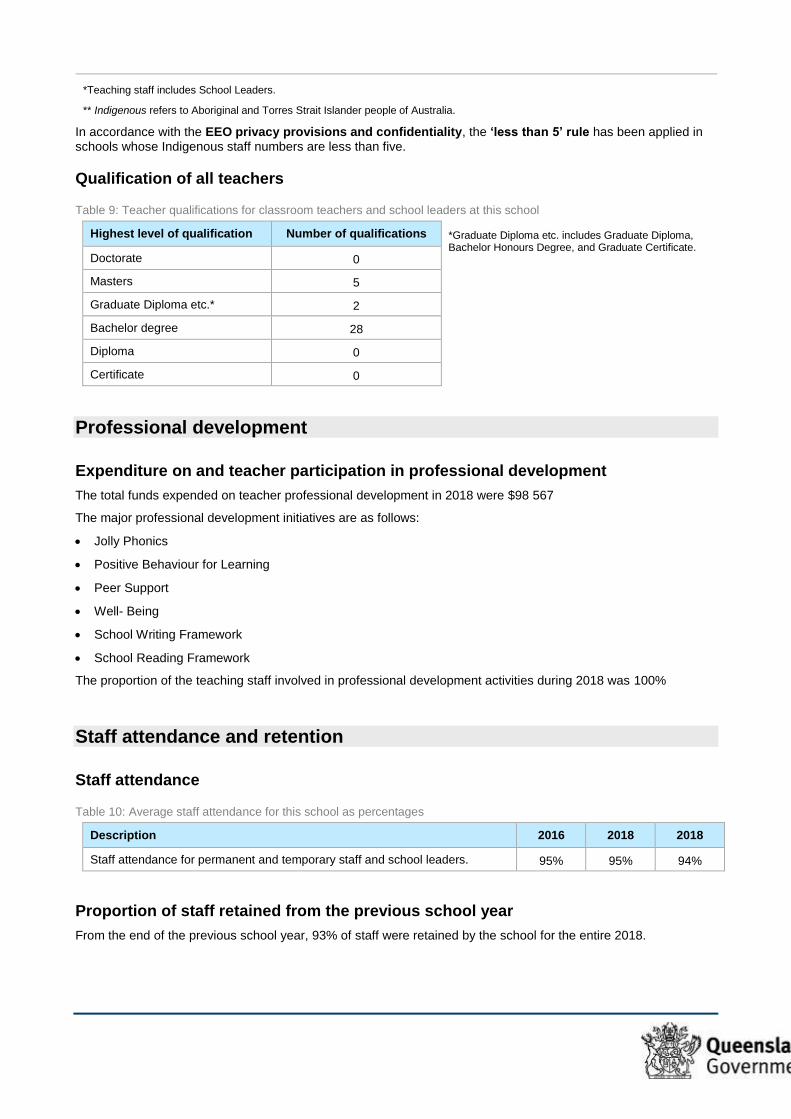
Qualification of all teachers
Table 9: Teacher qualifications for classroom teachers and school leaders at this school
Highest level of qualification Number of qualifications
*Graduate Diploma etc. includes Graduate Diploma, Bachelor Honours Degree, and Graduate Certificate.
Doctorate 0
Masters 5
Graduate Diploma etc.* 2
Bachelor degree 28
Diploma 0
Certificate 0
Professional development
Expenditure on and teacher participation in professional development
The total funds expended on teacher professional development in 2018 were $98 567
The major professional development initiatives are as follows:
Jolly Phonics
Positive Behaviour for Learning
Peer Support
Well- Being
School Writing Framework
School Reading Framework
The proportion of the teaching staff involved in professional development activities during 2018 was 100%
Staff attendance and retention
Staff attendance
Table 10: Average staff attendance for this school as percentages
Description 2016 2018 2018
Staff attendance for permanent and temporary staff and school leaders. 95% 95% 94%
Proportion of staff retained from the previous school year
From the end of the previous school year, 93% of staff were retained by the school for the entire 2018.
*Teaching staff includes School Leaders.
** Indigenous refers to Aboriginal and Torres Strait Islander people of Australia.
Performance of our students
Key student outcomes
Student attendance
The overall student attendance rate in 2018 for all Queensland state Primary schools was 92%.
Tables 11–12 show attendance rates at this school as percentages.
Table 11: Overall student attendance at this school
Description 2016 2018 2018
Overall attendance rate* for students at this school 89% 87% 88%
Attendance rate for Indigenous** students at this school 79% 78% 82%
* Student attendance rate = the total of full-days and part-days that students attended divided by the total of all possible days for students to attend (expressed as a percentage).
** Indigenous refers to Aboriginal and Torres Strait Islander people of Australia.
Table 12: Average student attendance rates for each year level at this school
Year level 2016 2018 2018 Year level 2016 2018 2018
Notes:
1. Attendance rates effectively count attendance for every student for every day of attendance in Semester 1.
2. Student attendance rate = the total of full-days and part-days that students attended divided by the total of all possible days for students to attend (expressed as a percentage).
3. DW = Data withheld to ensure confidentiality.
Prep 86% 86% 87% Year 7 100% 100%
Year 1 86% 87% 87% Year 8
Year 2 87% 86% 86% Year 9
Year 3 90% 86% 88% Year 10
Year 4 89% 86% 89% Year 11
Year 5 91% 89% 90% Year 12
Year 6 90% 89% 91%
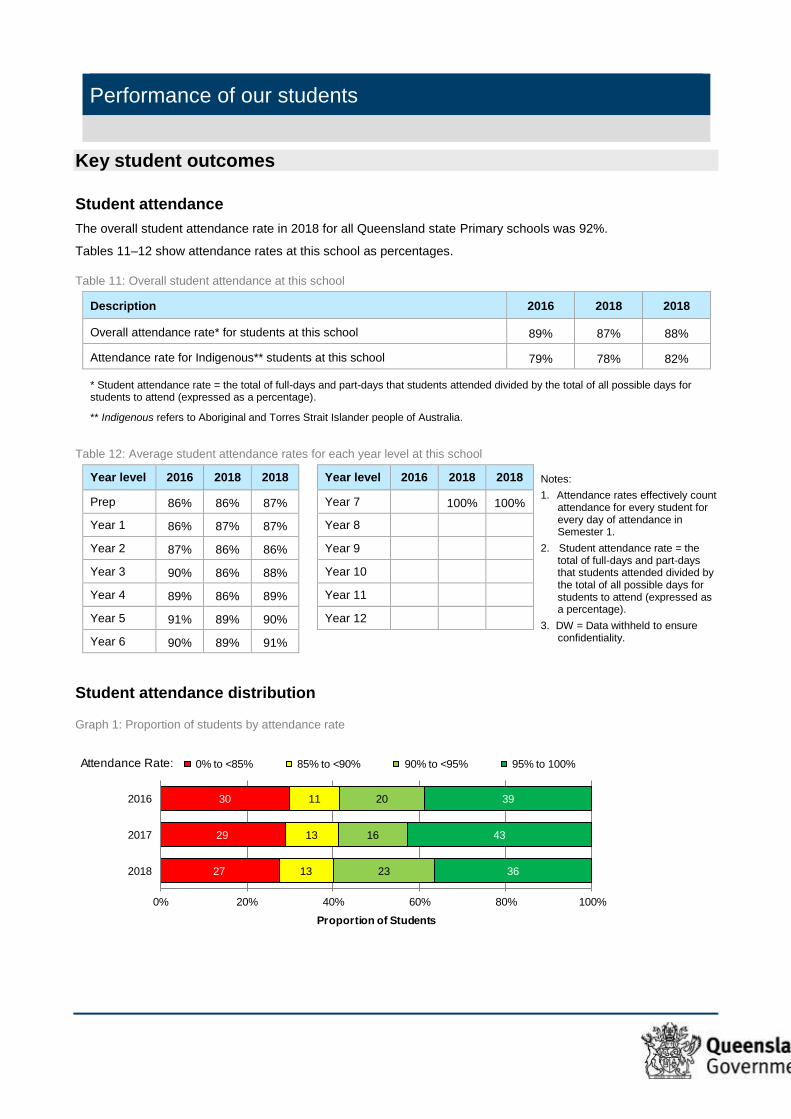
Student attendance distribution
Graph 1: Proportion of students by attendance rate
27
29
30
13
13
11
23
16
20
36
43
39
0% 20% 40% 60% 80% 100%
2018
2017
2016
Proportion of Students
Attendance Rate: 0% to <85% 85% to <90% 90% to <95% 95% to 100%
Description of how this school manages non-attendance
Queensland state schools manage non-attendance in line with the Queensland Department of Education procedures: Managing Student Absences and Enforcing Enrolment and Attendance at State Schools; and Roll Marking in State Schools, which outline processes for managing and recording student attendance and absenteeism.
Student attendance is managed at Atherton SS using the following approaches:
Daily role marking for all classes
Roles monitored daily by Administration
SMS sent to all families of students who are absent on the day of their absence
Administration contacts all families with an unexplained absence
Home visits are conducted by CEC Officer, Deputy Principal and Principal where necessary
NAPLAN
Our reading, writing, spelling, grammar and punctuation, and numeracy results for the Years 3, 5, 7 and 9 NAPLAN tests are available via the My School website.
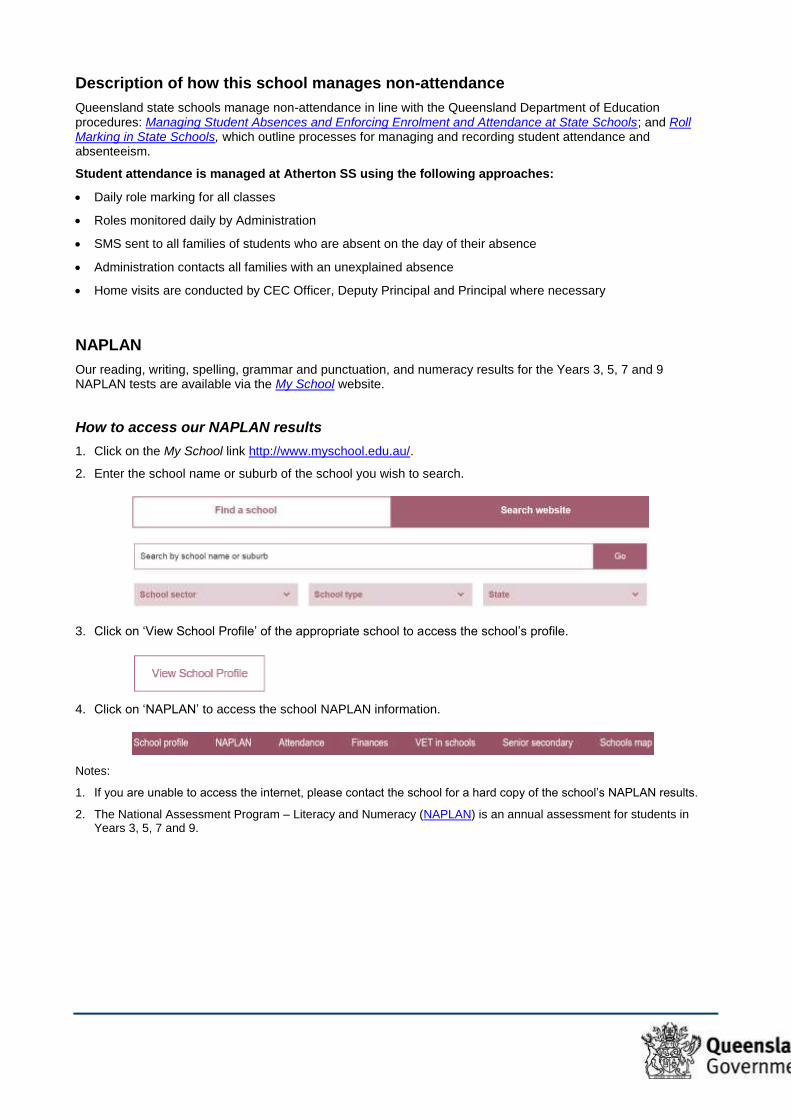
How to access our NAPLAN results
1. Click on the My School link http://www.myschool.edu.au/.
2. Enter the school name or suburb of the school you wish to search.
3. Click on ‘View School Profile’ of the appropriate school to access the school’s profile.
4. Click on ‘NAPLAN’ to access the school NAPLAN information.
Notes:
1. If you are unable to access the internet, please contact the school for a hard copy of the school’s NAPLAN results.
2. The National Assessment Program – Literacy and Numeracy (NAPLAN) is an annual assessment for students in Years 3, 5, 7 and 9.