Embed Size (px)
Citation preview

ATIS FOR INDIAN
CITIESR. Sivanandan Karthik K. Srinivasan
Lelitha Devi V Gitakrishnan Ramadurai
Asha Anand Dipankar Das
Ravi V Charan Mitchanagatla
Krishna Kumar S Subodhkant Dubey
Rakshith P And Other Team Members
Sponsor: Dept. of Electronics and Information Technology, GoI
Executing Agencies: IIT Madras and CDAC-T
July 14th 2012, UMCSP Conference, IIT Madras
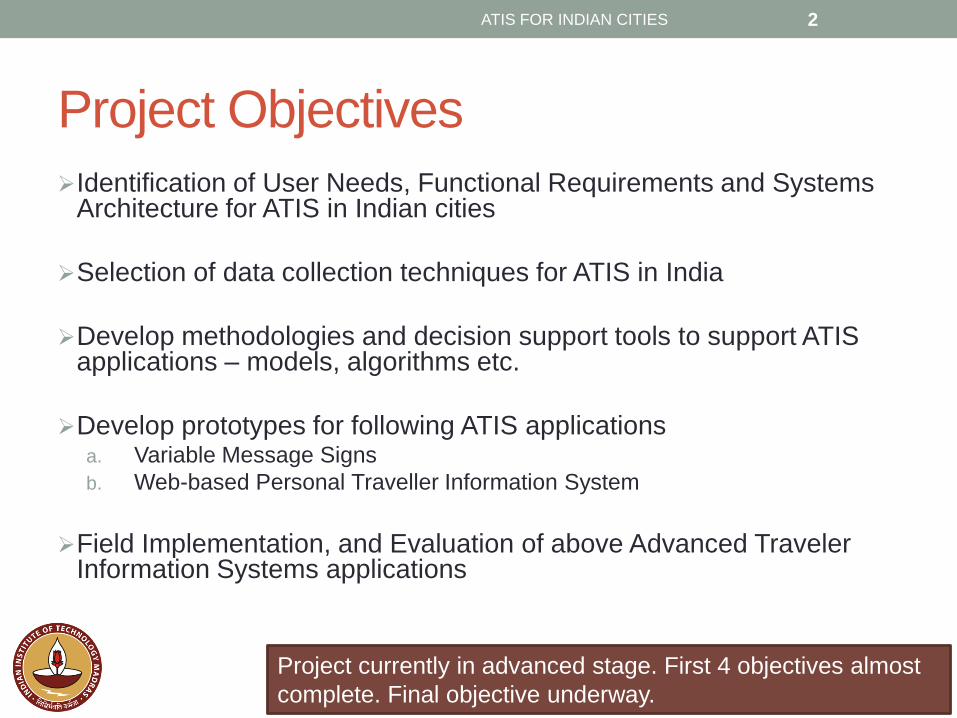
Project Objectives
Identification of User Needs, Functional Requirements and Systems Architecture for ATIS in Indian cities
Selection of data collection techniques for ATIS in India
Develop methodologies and decision support tools to support ATIS applications – models, algorithms etc.
Develop prototypes for following ATIS applicationsa. Variable Message Signs
b. Web-based Personal Traveller Information System
Field Implementation, and Evaluation of above Advanced Traveler Information Systems applications
2ATIS FOR INDIAN CITIES
Project currently in advanced stage. First 4 objectives almost
complete. Final objective underway.
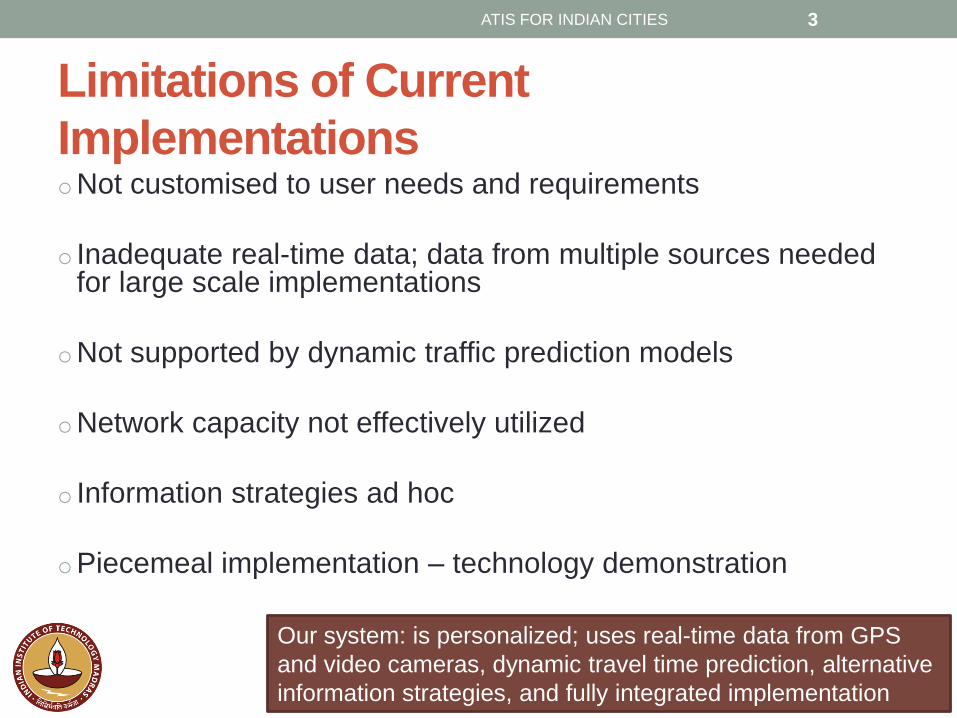
Limitations of Current
ImplementationsoNot customised to user needs and requirements
o Inadequate real-time data; data from multiple sources needed for large scale implementations
oNot supported by dynamic traffic prediction models
oNetwork capacity not effectively utilized
o Information strategies ad hoc
oPiecemeal implementation – technology demonstration
3ATIS FOR INDIAN CITIES
Our system: is personalized; uses real-time data from GPS
and video cameras, dynamic travel time prediction, alternative
information strategies, and fully integrated implementation
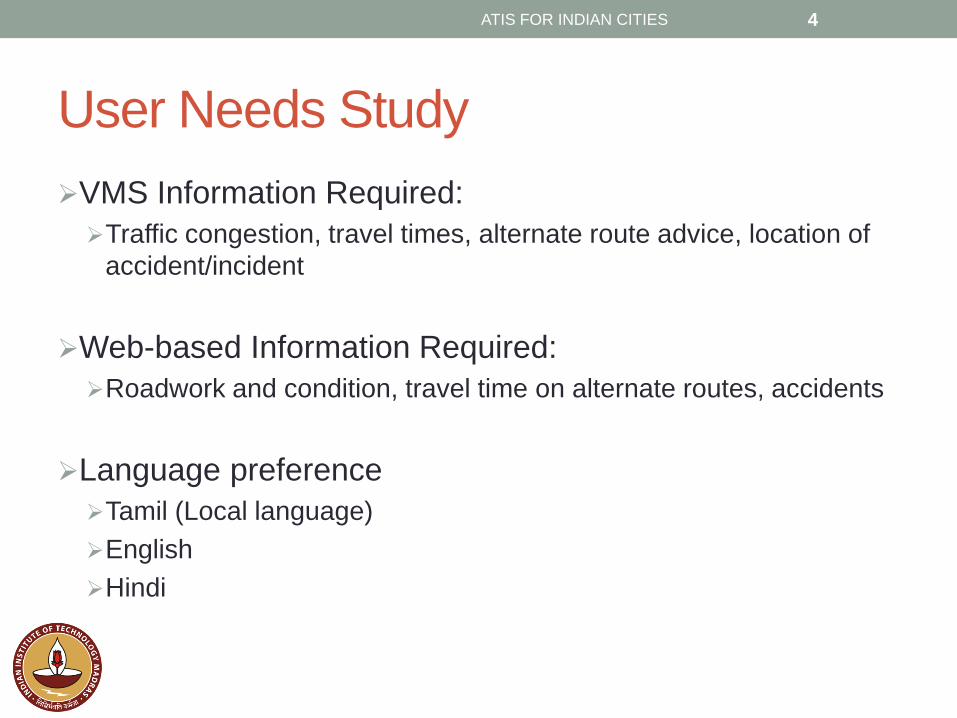
User Needs Study
VMS Information Required:
Traffic congestion, travel times, alternate route advice, location of
accident/incident
Web-based Information Required:
Roadwork and condition, travel time on alternate routes, accidents
Language preference
Tamil (Local language)
English
Hindi
ATIS FOR INDIAN CITIES 4
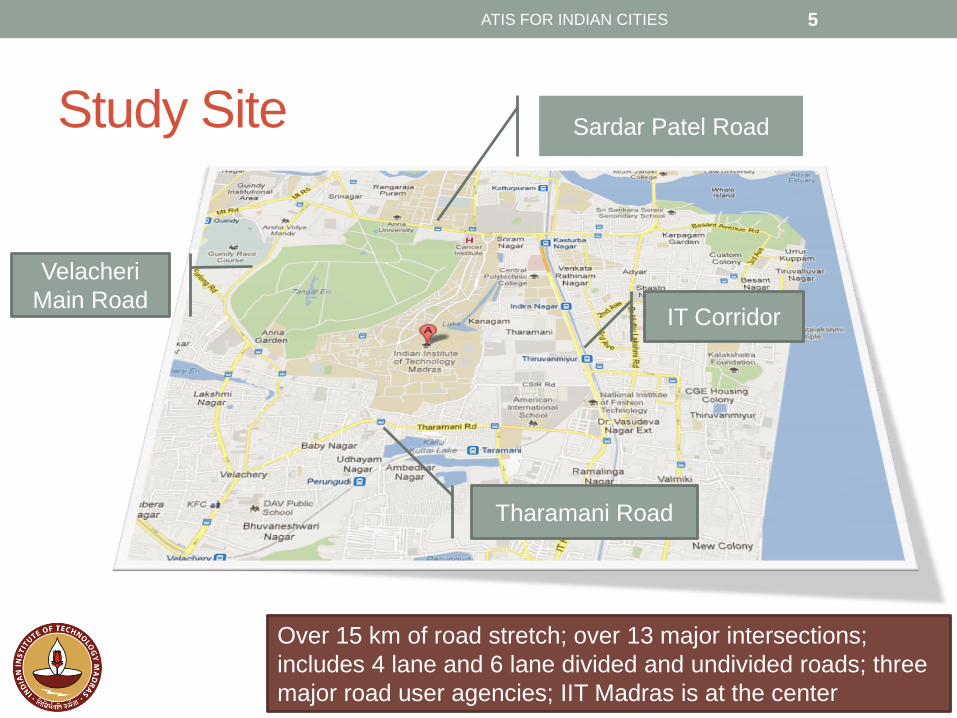
Study Site
ATIS FOR INDIAN CITIES 5
Sardar Patel Road
IT Corridor
Tharamani Road
Velacheri
Main Road
Over 15 km of road stretch; over 13 major intersections;
includes 4 lane and 6 lane divided and undivided roads; three
major road user agencies; IIT Madras is at the center
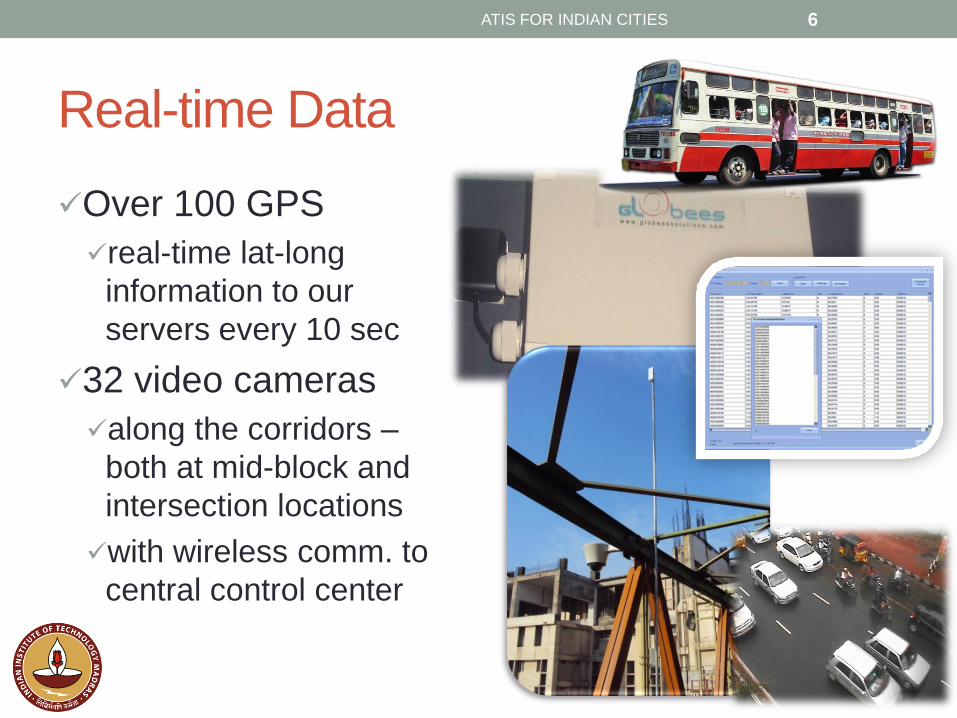
Real-time Data
Over 100 GPS
real-time lat-long
information to our
servers every 10 sec
32 video cameras
along the corridors –
both at mid-block and
intersection locations
with wireless comm. to
central control center
ATIS FOR INDIAN CITIES 6
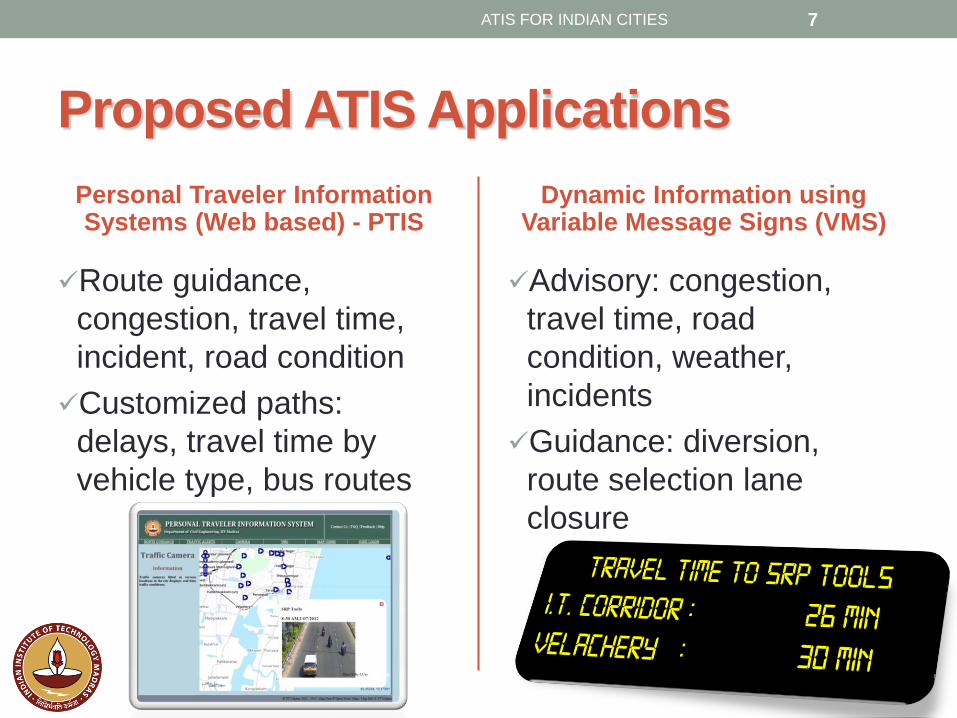
Proposed ATIS Applications
Personal Traveler Information Systems (Web based) - PTIS
Route guidance,
congestion, travel time,
incident, road condition
Customized paths:
delays, travel time by
vehicle type, bus routes
Dynamic Information using Variable Message Signs (VMS)
Advisory: congestion,
travel time, road
condition, weather,
incidents
Guidance: diversion,
route selection lane
closure
ATIS FOR INDIAN CITIES 7
Dynamic Link Travel Time Prediction
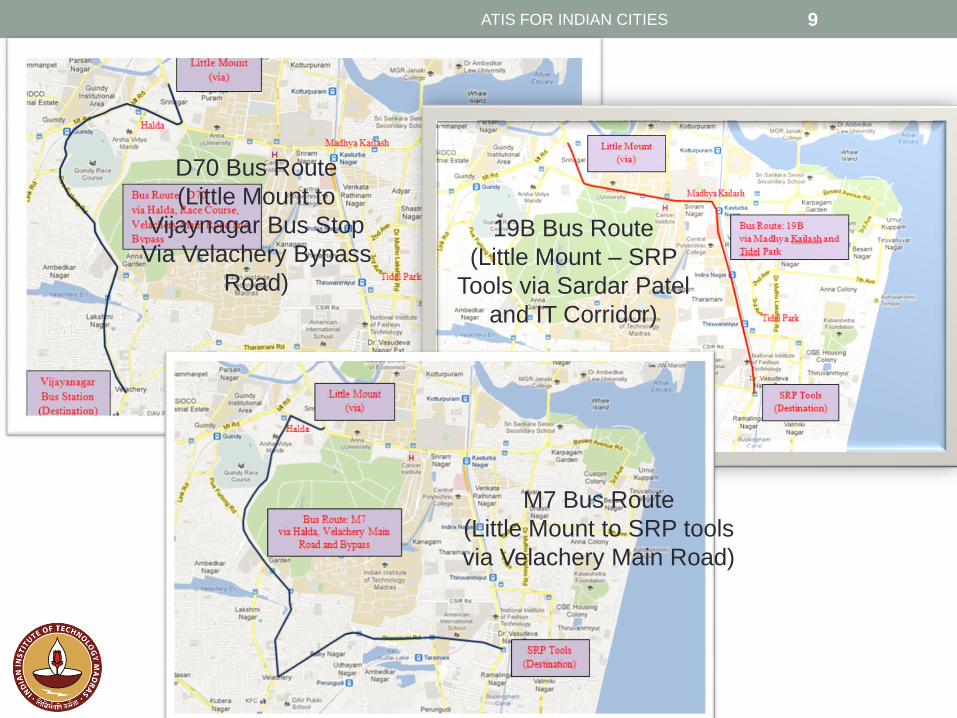
Model developed and tested using Real time GPS data.
Model combines multiple device data from different bus
routes on a given link (19B, M7, D70 for covering whole
corridor)
Provides real time status update and network level
coverage instead of route level coverage
Performance measures of prediction models: MAPE,
travel time error, reliability
Credibility of information is vital for sustained patronage of any
ATIS system – significant effort has been put into developing
best models for Indian traffic conditions
ATIS FOR INDIAN CITIES 9
19B Bus Route
(Little Mount – SRP
Tools via Sardar Patel
and IT Corridor)
D70 Bus Route
(Little Mount to
Vijaynagar Bus Stop
Via Velachery Bypass
Road)
M7 Bus Route
(Little Mount to SRP tools
via Velachery Main Road)
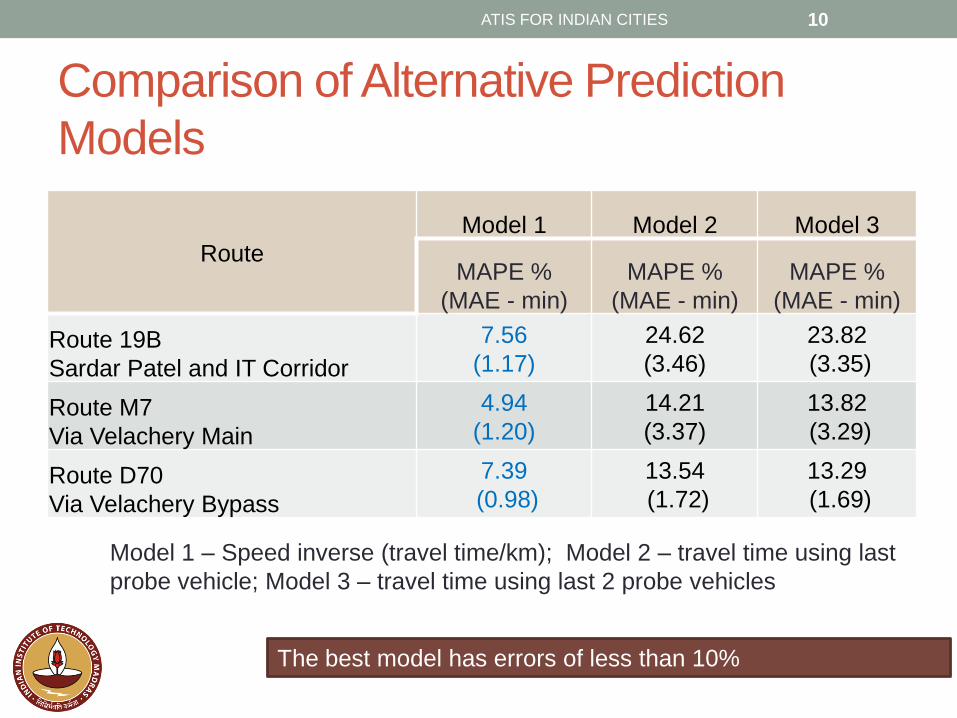
Comparison of Alternative Prediction
Models
ATIS FOR INDIAN CITIES 10
Route
Model 1 Model 2 Model 3
MAPE %
(MAE - min)
MAPE %
(MAE - min)
MAPE %
(MAE - min)
Route 19B
Sardar Patel and IT Corridor
7.56
(1.17)
24.62
(3.46)
23.82
(3.35)
Route M7
Via Velachery Main
4.94
(1.20)
14.21
(3.37)
13.82
(3.29)
Route D70
Via Velachery Bypass
7.39
(0.98)
13.54
(1.72)
13.29
(1.69)
The best model has errors of less than 10%
Model 1 – Speed inverse (travel time/km); Model 2 – travel time using last
probe vehicle; Model 3 – travel time using last 2 probe vehicles
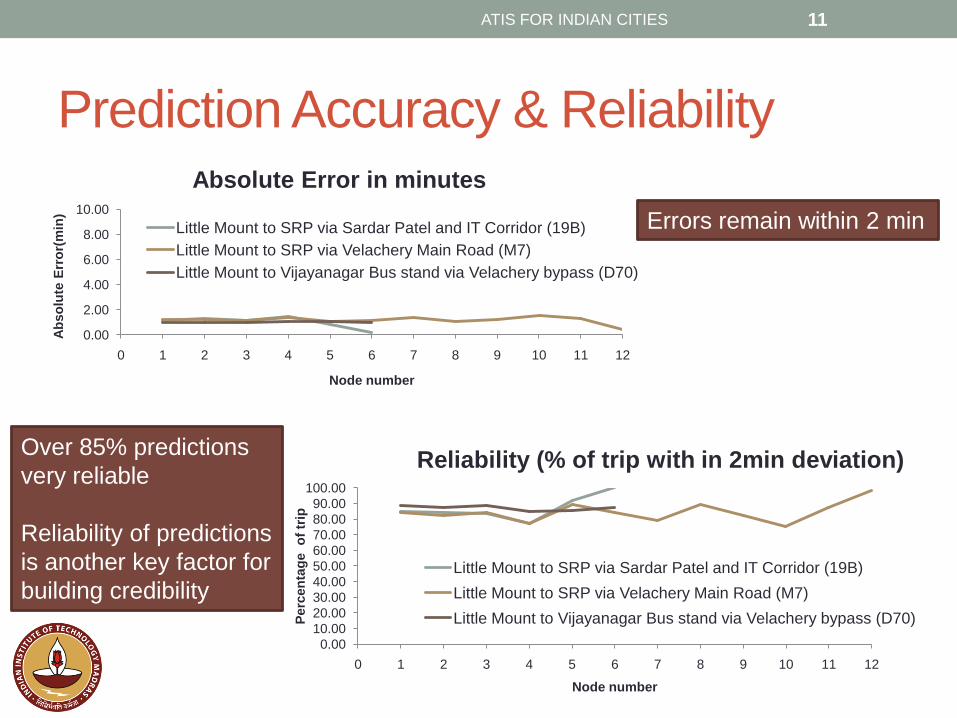
Prediction Accuracy & Reliability
ATIS FOR INDIAN CITIES 11
0.00
2.00
4.00
6.00
8.00
10.00
0 1 2 3 4 5 6 7 8 9 10 11 12
Ab
so
lute
Err
or(
min
)
Node number
Absolute Error in minutes
Little Mount to SRP via Sardar Patel and IT Corridor (19B)
Little Mount to SRP via Velachery Main Road (M7)
Little Mount to Vijayanagar Bus stand via Velachery bypass (D70)
0.00
10.00
20.00
30.00
40.00
50.00
60.00
70.00
80.00
90.00
100.00
0 1 2 3 4 5 6 7 8 9 10 11 12
Perc
en
tag
e
of
trip
Node number
Reliability (% of trip with in 2min deviation)
Little Mount to SRP via Sardar Patel and IT Corridor (19B)
Little Mount to SRP via Velachery Main Road (M7)
Little Mount to Vijayanagar Bus stand via Velachery bypass (D70)
Errors remain within 2 min
Over 85% predictions
very reliable
Reliability of predictions
is another key factor for
building credibility
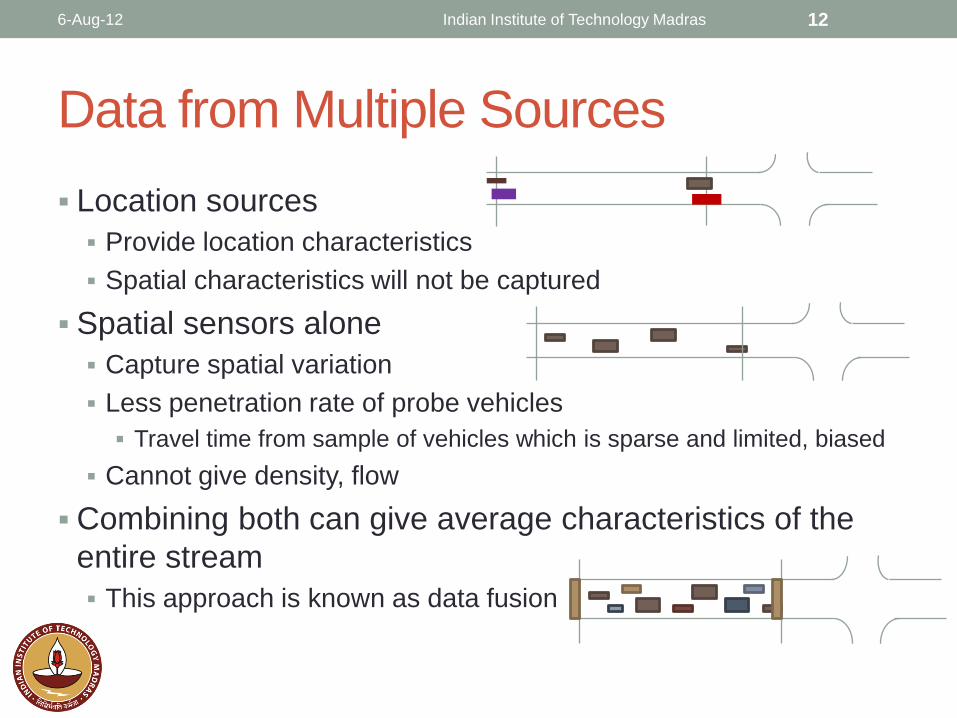
Location sources
Provide location characteristics
Spatial characteristics will not be captured
Spatial sensors alone
Capture spatial variation
Less penetration rate of probe vehicles
Travel time from sample of vehicles which is sparse and limited, biased
Cannot give density, flow
Combining both can give average characteristics of the
entire stream
This approach is known as data fusion
6-Aug-12 12Indian Institute of Technology Madras
Data from Multiple Sources
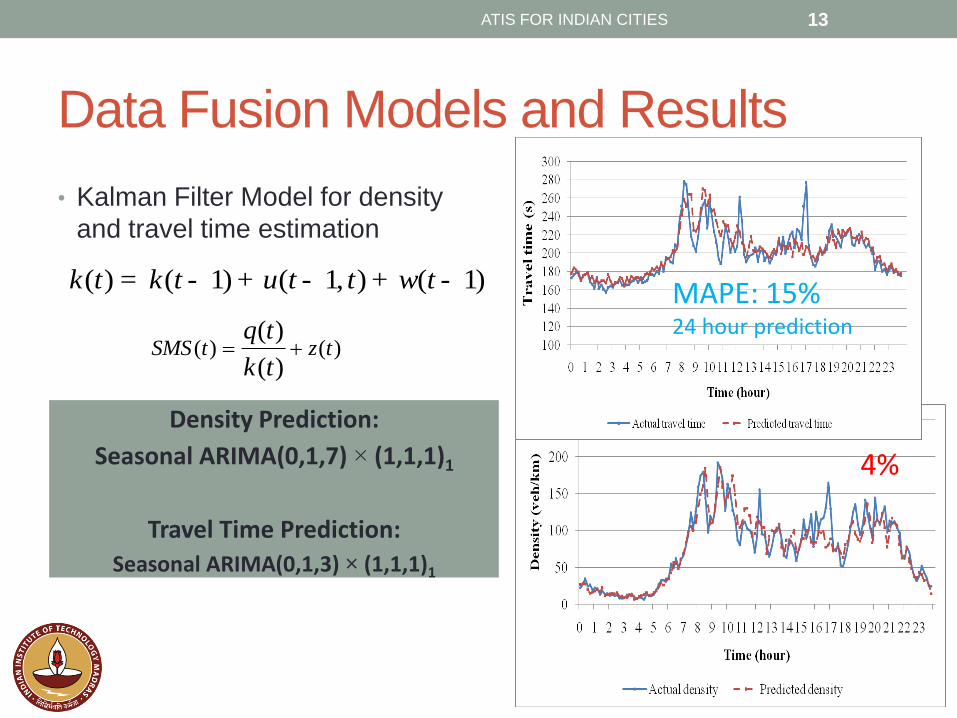
Data Fusion Models and Results
• Kalman Filter Model for density
and travel time estimation
ATIS FOR INDIAN CITIES 13
( ) ( 1) ( 1, ) ( 1)k t k t u t t w t= - + - + -
( ) ( )( )
( )SMS t z t
q t
k t
Density Prediction:
Seasonal ARIMA(0,1,7) × (1,1,1)1
Travel Time Prediction:
Seasonal ARIMA(0,1,3) × (1,1,1)1
MAPE: 15%24 hour prediction
4%
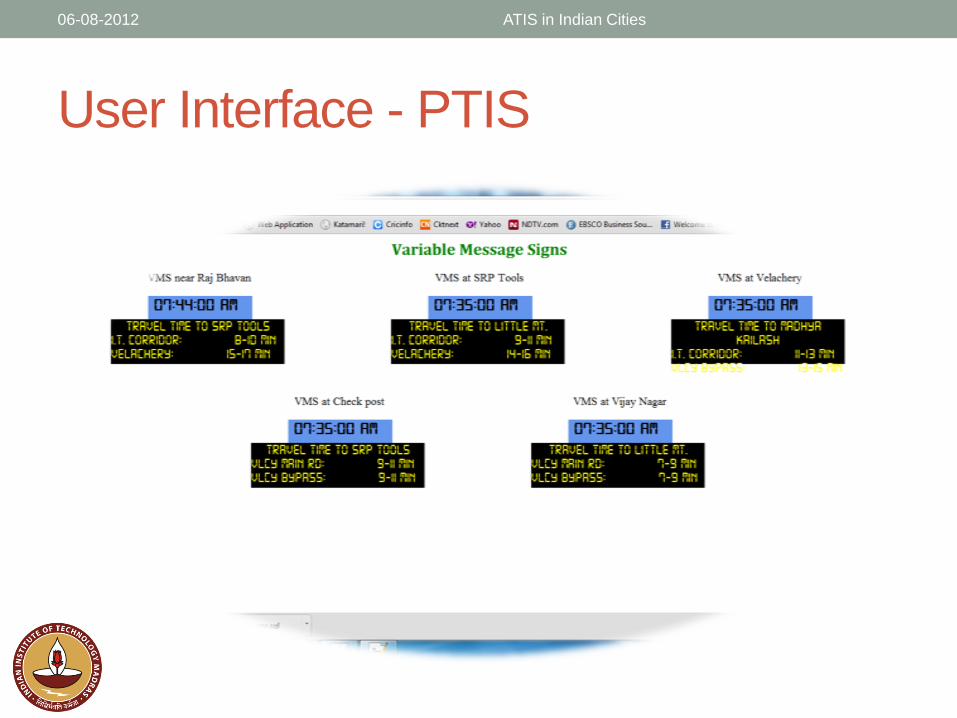
User Interface - PTIS
06-08-2012 ATIS in Indian Cities
PTIS Simulator
Stated choice experiments using web-based prototype
Over 150 responses obtained from regular users of the
study site corridors
Exploratory Analysis of experimental data performed
Preliminary models of user response to different types of
information and formats developed.
ATIS FOR INDIAN CITIES 15
Can be accessed at
http://115.115.108.126:8080/dipankar/ptis_new/new_webpage/
ATIS FOR INDIAN CITIES 16
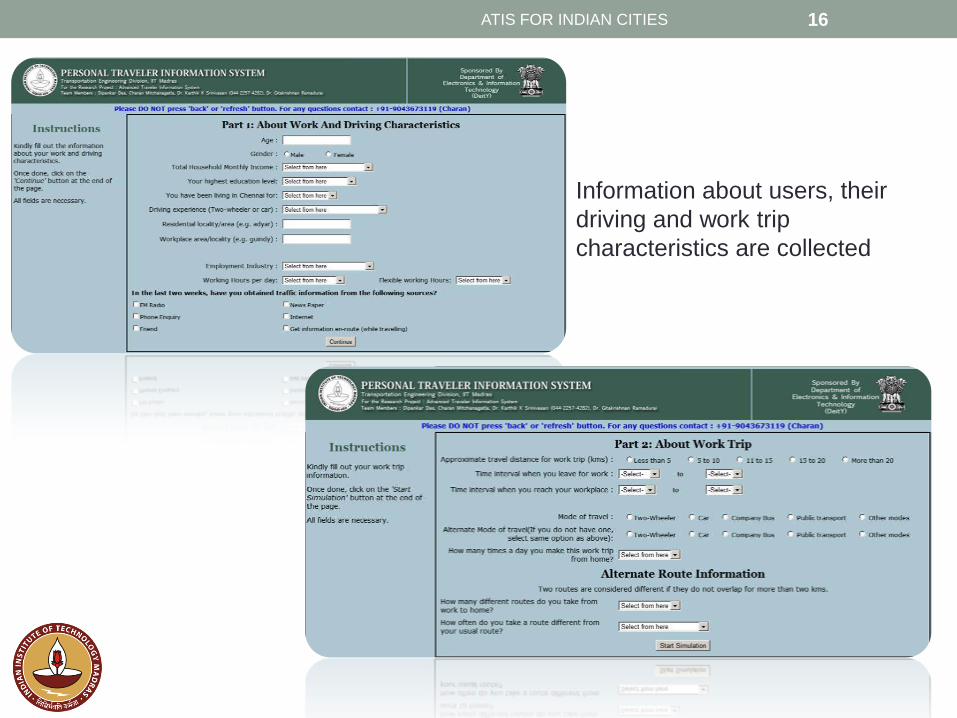
Information about users, their
driving and work trip
characteristics are collected
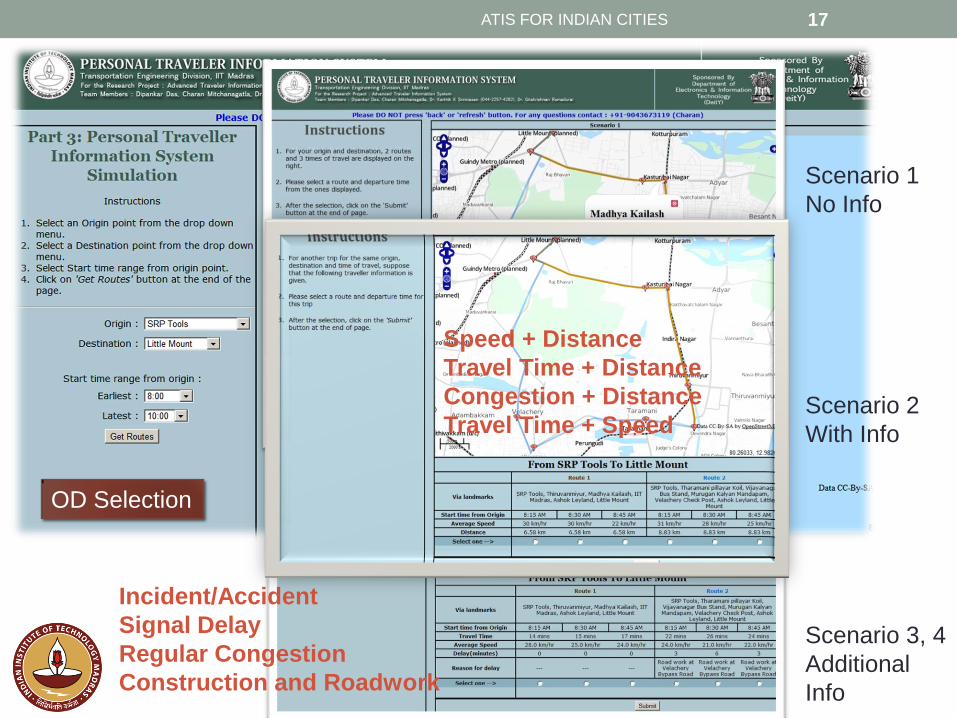
ATIS FOR INDIAN CITIES 17
OD Selection
Scenario 1
No Info
Scenario 2
With Info
Scenario 3, 4
Additional
Info
Incident/Accident
Signal Delay
Regular Congestion
Construction and Roadwork
Speed + Distance
Travel Time + Distance
Congestion + Distance
Travel Time + Speed
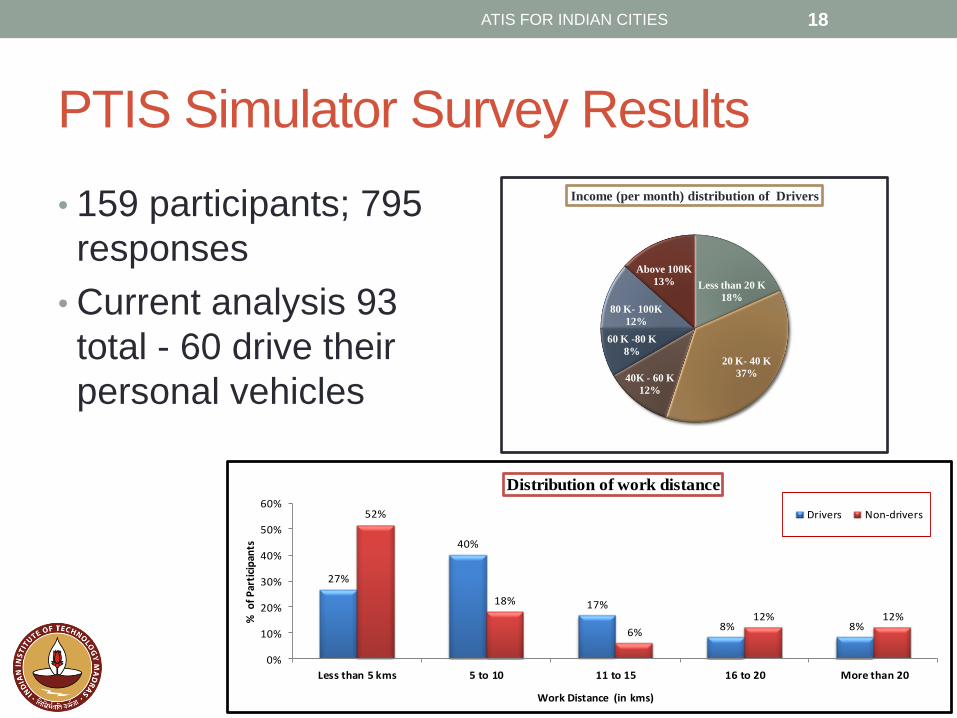
PTIS Simulator Survey Results
• 159 participants; 795
responses
• Current analysis 93
total - 60 drive their
personal vehicles
ATIS FOR INDIAN CITIES 18
Less than 20 K
18%
20 K- 40 K
37%40K - 60 K
12%
60 K -80 K
8%
80 K- 100K
12%
Above 100K
13%
Income (per month) distribution of Drivers
27%
40%
17%
8% 8%
52%
18%
6%
12% 12%
0%
10%
20%
30%
40%
50%
60%
Less than 5 kms 5 to 10 11 to 15 16 to 20 More than 20
%
of
Par
tici
pan
ts
Work Distance (in kms)
Distribution of work distance
Drivers Non-drivers
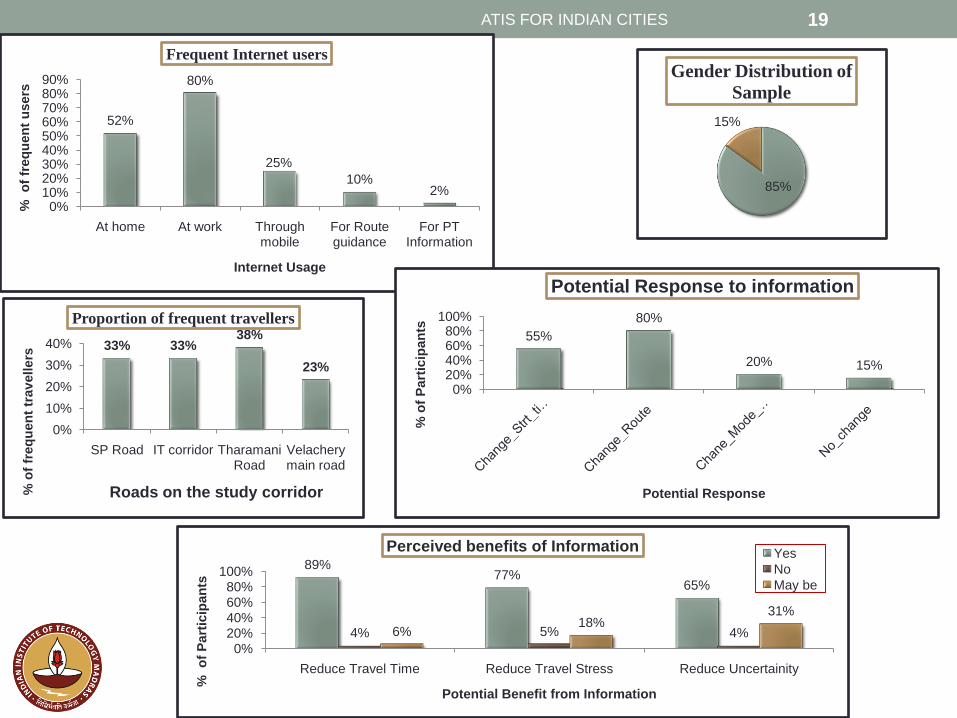
ATIS FOR INDIAN CITIES 19
52%
80%
25%
10%2%
0%10%20%30%40%50%60%70%80%90%
At home At work Through mobile
For Route guidance
For PT Information
% o
f fr
eq
uen
t u
sers
Internet Usage
Frequent Internet users
55%
80%
20% 15%
0%20%40%60%80%
100%
% o
f P
art
icip
an
ts
Potential Response
Potential Response to information
89%77%
65%
4% 5% 4%6%18%
31%
0%20%40%60%80%
100%
Reduce Travel Time Reduce Travel Stress Reduce Uncertainity
% o
f P
art
icip
an
ts
Potential Benefit from Information
Perceived benefits of Information Yes
No
May be
85%
15%
Gender Distribution of
Sample
33% 33%38%
23%
0%
10%
20%
30%
40%
SP Road IT corridor Tharamani Road
Velachery main road
% o
f fr
eq
uen
t tr
av
ellers
Roads on the study corridor
Proportion of frequent travellers
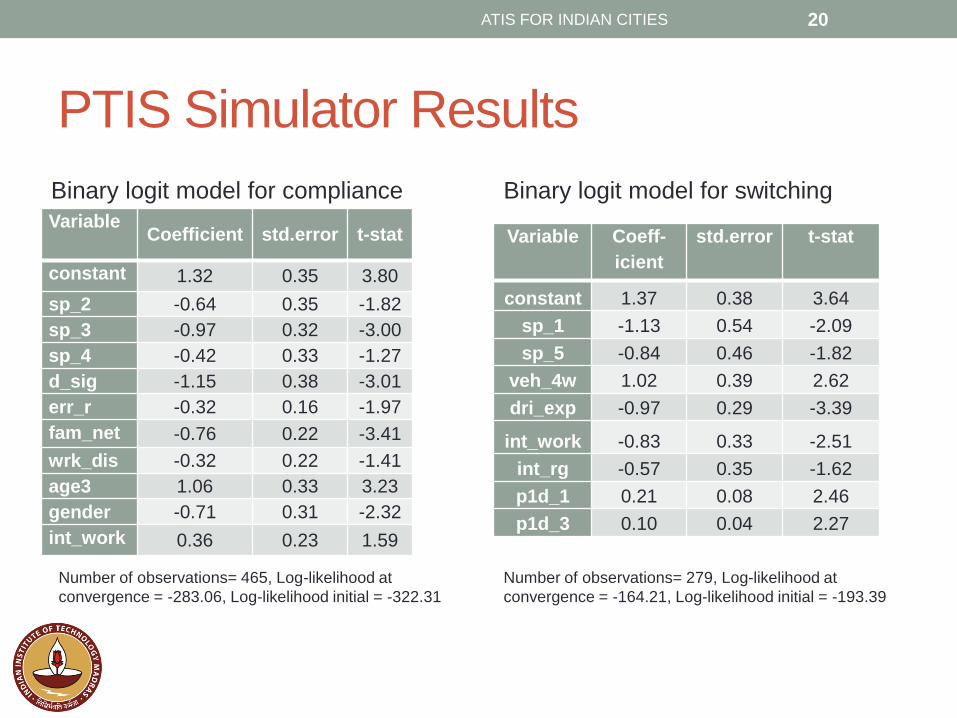
PTIS Simulator Results
VariableCoefficient std.error t-stat
constant 1.32 0.35 3.80
sp_2 -0.64 0.35 -1.82
sp_3 -0.97 0.32 -3.00
sp_4 -0.42 0.33 -1.27
d_sig -1.15 0.38 -3.01
err_r -0.32 0.16 -1.97
fam_net -0.76 0.22 -3.41
wrk_dis -0.32 0.22 -1.41
age3 1.06 0.33 3.23
gender -0.71 0.31 -2.32
int_work 0.36 0.23 1.59
Variable Coeff-
icient
std.error t-stat
constant 1.37 0.38 3.64
sp_1 -1.13 0.54 -2.09
sp_5 -0.84 0.46 -1.82
veh_4w 1.02 0.39 2.62
dri_exp -0.97 0.29 -3.39
int_work -0.83 0.33 -2.51
int_rg -0.57 0.35 -1.62
p1d_1 0.21 0.08 2.46
p1d_3 0.10 0.04 2.27
ATIS FOR INDIAN CITIES 20
Number of observations= 465, Log-likelihood at
convergence = -283.06, Log-likelihood initial = -322.31
Binary logit model for compliance Binary logit model for switching
Number of observations= 279, Log-likelihood at
convergence = -164.21, Log-likelihood initial = -193.39
PTIS Simulator Results
• Car drivers more likely to
switch routes under
information
• Response to information less
for experienced drivers
• Switching of routes and or
departure times are more
likely when there is a
significant travel time
differential between alternate
route and current route
ATIS FOR INDIAN CITIES 21
• Compliance is least when
qualitative information is
provided
• Familiarity of the OD pair
does not really affect the
compliance
• Underestimating travel times
reduces compliance, where-
as error on the left hand side
has no significant impact
• Compliance lesser for long
distance commuters
ATIS FOR INDIAN CITIES 22
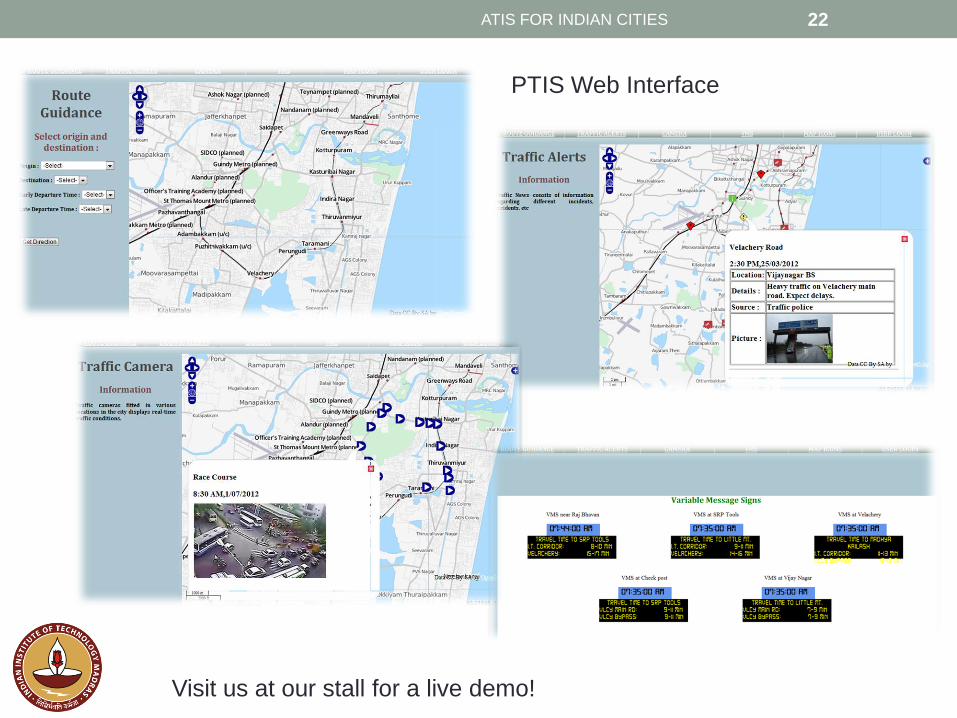
PTIS Web Interface
Visit us at our stall for a live demo!
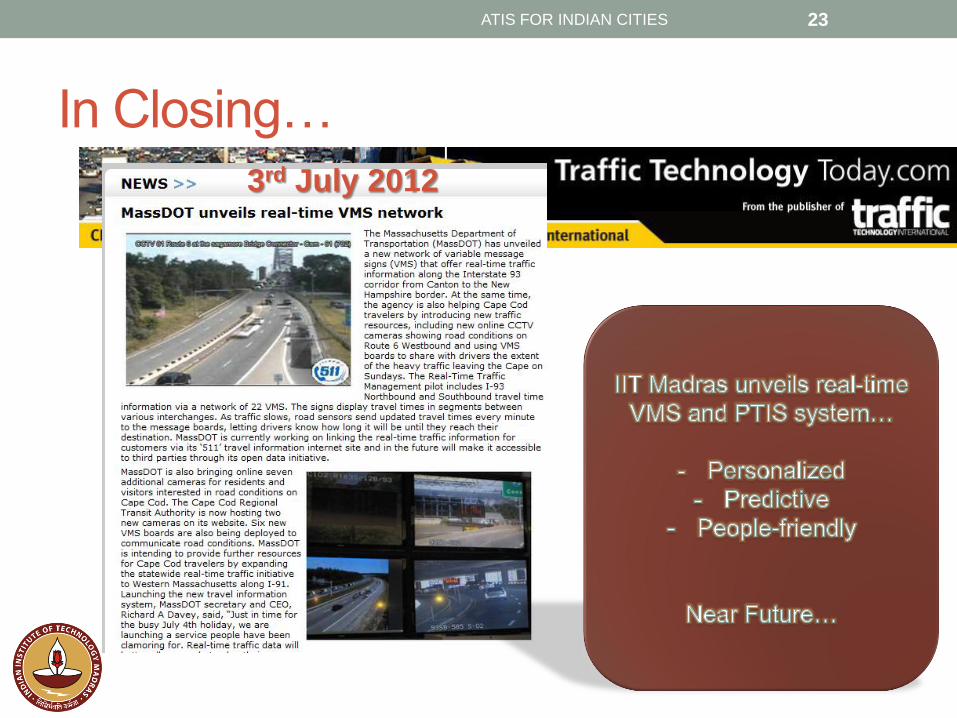
In Closing…
ATIS FOR INDIAN CITIES 23
3rd July 2012
THANK YOU!Questions and Comments?
ATIS FOR INDIAN CITIES 24
ADDITIONAL SLIDES
ATIS FOR INDIAN CITIES 25
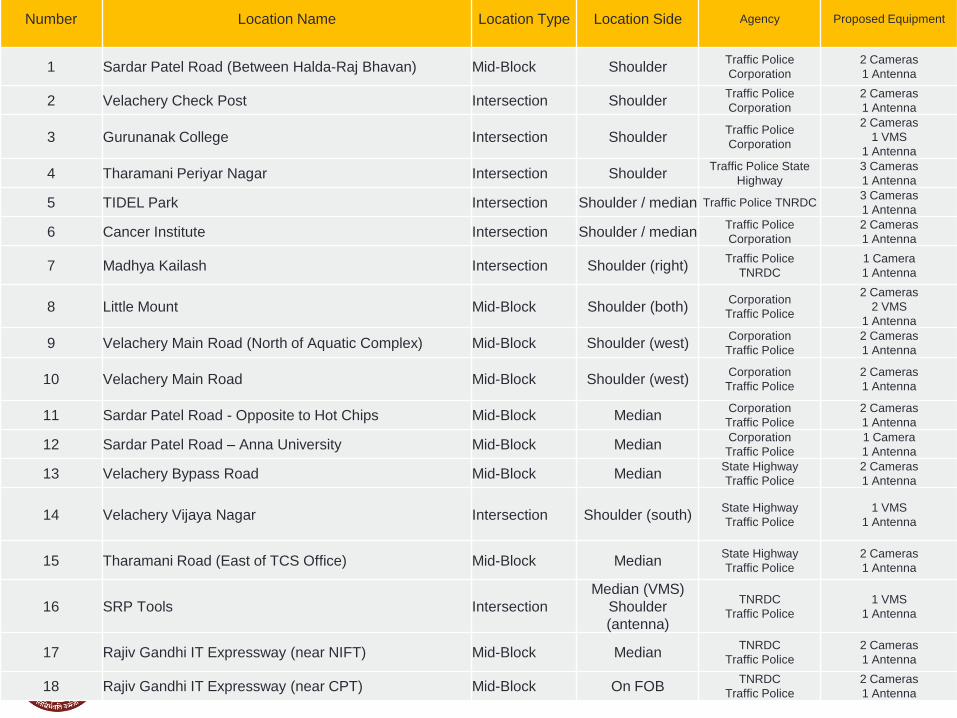
Number Location Name Location Type Location Side Agency Proposed Equipment
1 Sardar Patel Road (Between Halda-Raj Bhavan) Mid-Block ShoulderTraffic Police
Corporation
2 Cameras
1 Antenna
2 Velachery Check Post Intersection ShoulderTraffic Police
Corporation
2 Cameras
1 Antenna
3 Gurunanak College Intersection ShoulderTraffic Police
Corporation
2 Cameras
1 VMS
1 Antenna
4 Tharamani Periyar Nagar Intersection ShoulderTraffic Police State
Highway
3 Cameras
1 Antenna
5 TIDEL Park Intersection Shoulder / median Traffic Police TNRDC3 Cameras
1 Antenna
6 Cancer Institute Intersection Shoulder / medianTraffic Police
Corporation
2 Cameras
1 Antenna
7 Madhya Kailash Intersection Shoulder (right)Traffic Police
TNRDC
1 Camera
1 Antenna
8 Little Mount Mid-Block Shoulder (both)Corporation
Traffic Police
2 Cameras
2 VMS
1 Antenna
9 Velachery Main Road (North of Aquatic Complex) Mid-Block Shoulder (west)Corporation
Traffic Police
2 Cameras
1 Antenna
10 Velachery Main Road Mid-Block Shoulder (west)Corporation
Traffic Police
2 Cameras
1 Antenna
11 Sardar Patel Road - Opposite to Hot Chips Mid-Block MedianCorporation
Traffic Police
2 Cameras
1 Antenna
12 Sardar Patel Road – Anna University Mid-Block MedianCorporation
Traffic Police
1 Camera
1 Antenna
13 Velachery Bypass Road Mid-Block MedianState Highway
Traffic Police
2 Cameras
1 Antenna
14 Velachery Vijaya Nagar Intersection Shoulder (south)State Highway
Traffic Police
1 VMS
1 Antenna
15 Tharamani Road (East of TCS Office) Mid-Block MedianState Highway
Traffic Police
2 Cameras
1 Antenna
16 SRP Tools Intersection
Median (VMS)
Shoulder
(antenna)
TNRDC
Traffic Police
1 VMS
1 Antenna
17 Rajiv Gandhi IT Expressway (near NIFT) Mid-Block MedianTNRDC
Traffic Police
2 Cameras
1 Antenna
18 Rajiv Gandhi IT Expressway (near CPT) Mid-Block On FOBTNRDC
Traffic Police
2 Cameras
1 Antenna
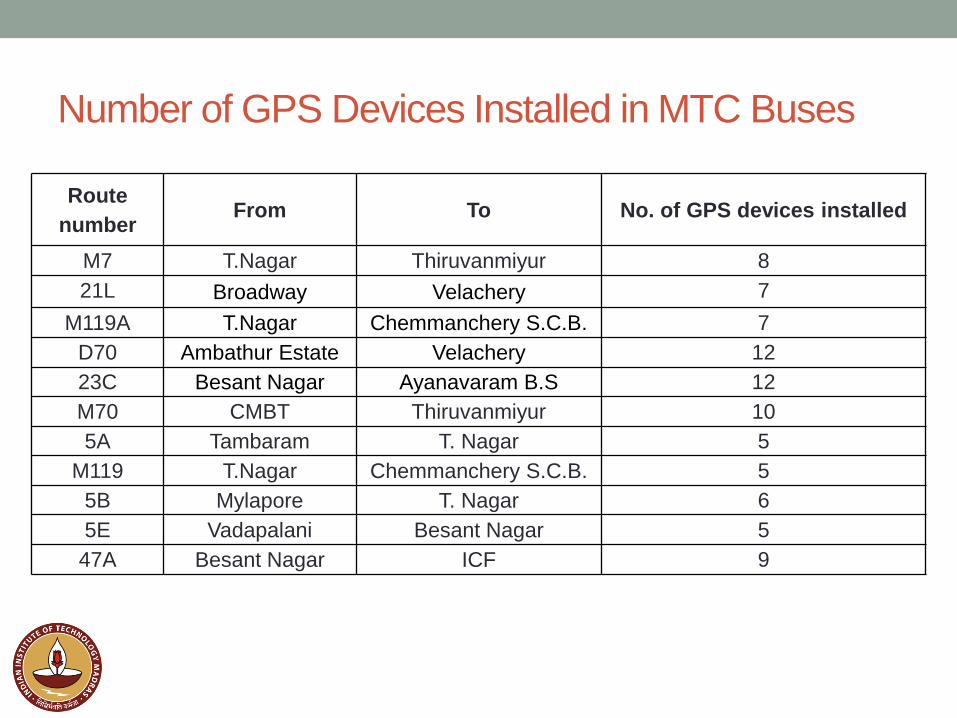
Number of GPS Devices Installed in MTC Buses
Route
numberFrom To No. of GPS devices installed
M7 T.Nagar Thiruvanmiyur 8
21L Broadway Velachery 7
M119A T.Nagar Chemmanchery S.C.B. 7
D70 Ambathur Estate Velachery 12
23C Besant Nagar Ayanavaram B.S 12
M70 CMBT Thiruvanmiyur 10
5A Tambaram T. Nagar 5
M119 T.Nagar Chemmanchery S.C.B. 5
5B Mylapore T. Nagar 6
5E Vadapalani Besant Nagar 5
47A Besant Nagar ICF 9
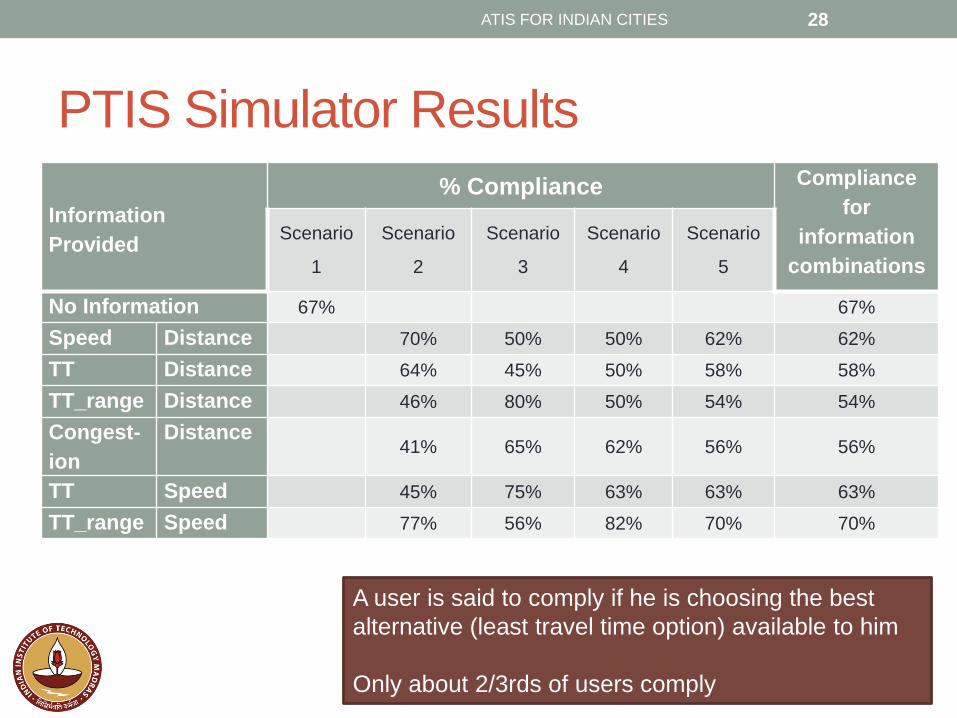
PTIS Simulator Results
ATIS FOR INDIAN CITIES 28
Information
Provided
% Compliance Compliance
for
information
combinations
Scenario
1
Scenario
2
Scenario
3
Scenario
4
Scenario
5
No Information 67% 67%
Speed Distance 70% 50% 50% 62% 62%
TT Distance 64% 45% 50% 58% 58%
TT_range Distance 46% 80% 50% 54% 54%
Congest-
ion
Distance41% 65% 62% 56% 56%
TT Speed 45% 75% 63% 63% 63%
TT_range Speed 77% 56% 82% 70% 70%
A user is said to comply if he is choosing the best
alternative (least travel time option) available to him
Only about 2/3rds of users comply
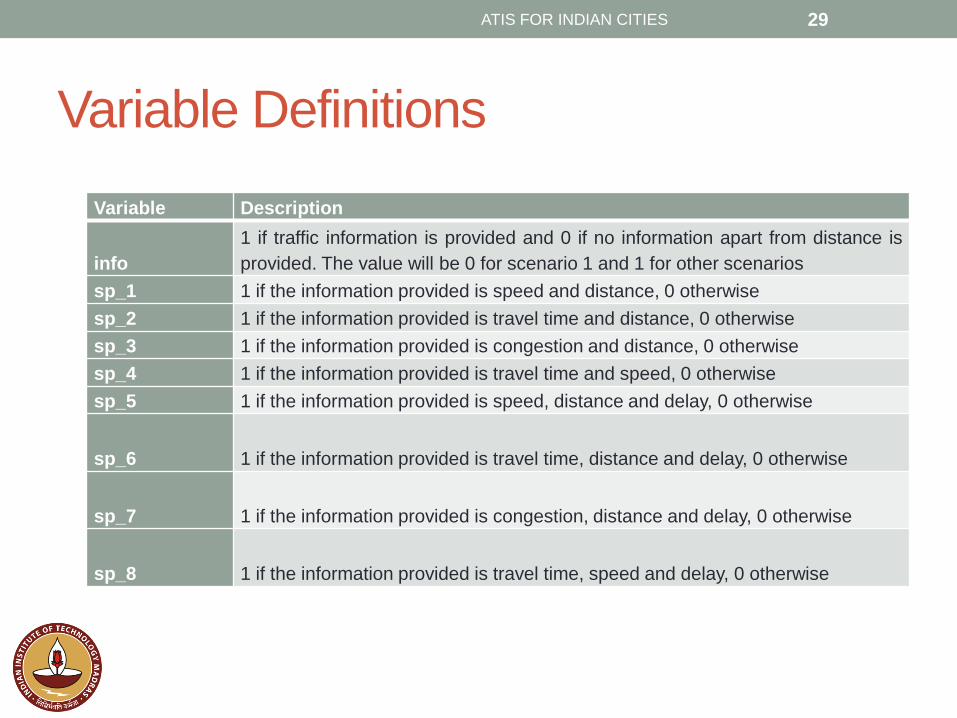
Variable Definitions
ATIS FOR INDIAN CITIES 29
Variable Description
info
1 if traffic information is provided and 0 if no information apart from distance is
provided. The value will be 0 for scenario 1 and 1 for other scenarios
sp_1 1 if the information provided is speed and distance, 0 otherwise
sp_2 1 if the information provided is travel time and distance, 0 otherwise
sp_3 1 if the information provided is congestion and distance, 0 otherwise
sp_4 1 if the information provided is travel time and speed, 0 otherwise
sp_5 1 if the information provided is speed, distance and delay, 0 otherwise
sp_6 1 if the information provided is travel time, distance and delay, 0 otherwise
sp_7 1 if the information provided is congestion, distance and delay, 0 otherwise
sp_8 1 if the information provided is travel time, speed and delay, 0 otherwise
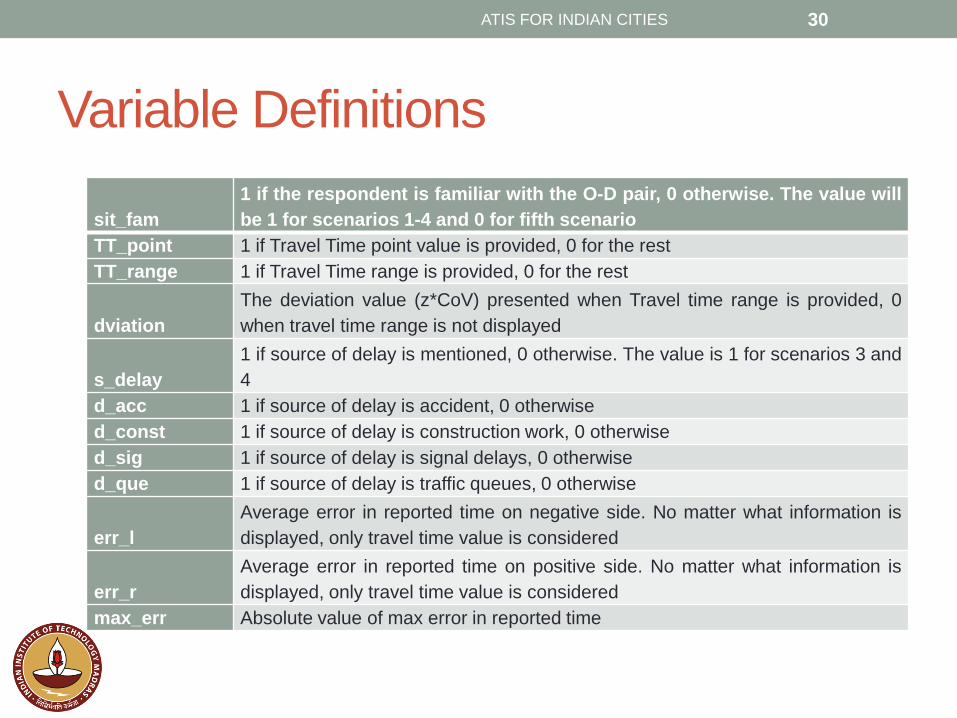
Variable Definitions
ATIS FOR INDIAN CITIES 30
sit_fam
1 if the respondent is familiar with the O-D pair, 0 otherwise. The value will
be 1 for scenarios 1-4 and 0 for fifth scenario
TT_point 1 if Travel Time point value is provided, 0 for the rest
TT_range 1 if Travel Time range is provided, 0 for the rest
dviation
The deviation value (z*CoV) presented when Travel time range is provided, 0
when travel time range is not displayed
s_delay
1 if source of delay is mentioned, 0 otherwise. The value is 1 for scenarios 3 and
4
d_acc 1 if source of delay is accident, 0 otherwise
d_const 1 if source of delay is construction work, 0 otherwise
d_sig 1 if source of delay is signal delays, 0 otherwise
d_que 1 if source of delay is traffic queues, 0 otherwise
err_l
Average error in reported time on negative side. No matter what information is
displayed, only travel time value is considered
err_r
Average error in reported time on positive side. No matter what information is
displayed, only travel time value is considered
max_err Absolute value of max error in reported time
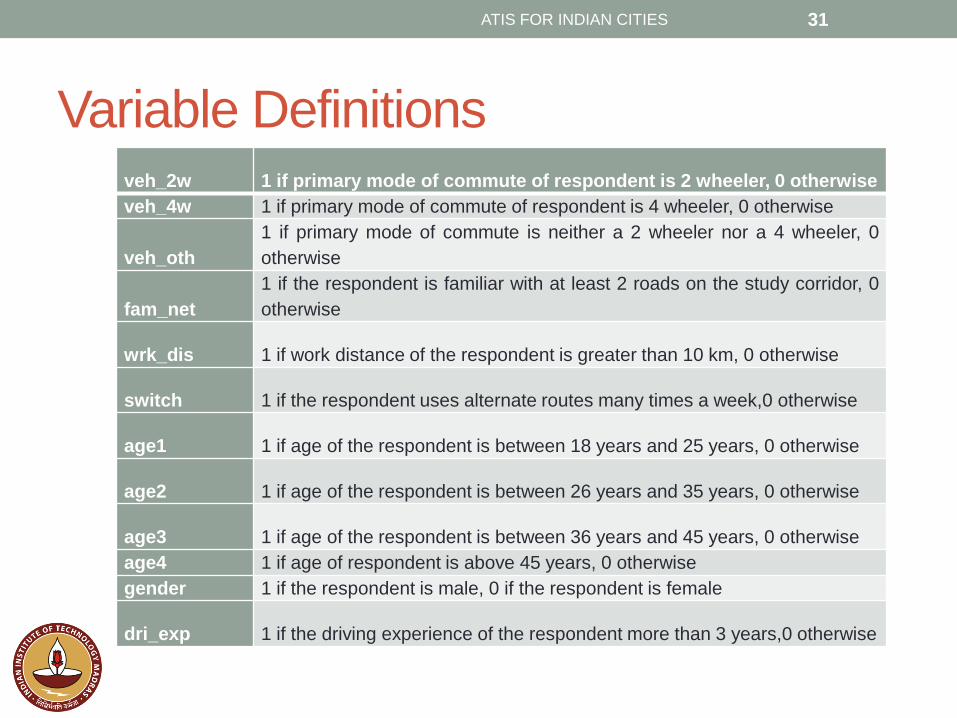
Variable Definitions
ATIS FOR INDIAN CITIES 31
veh_2w 1 if primary mode of commute of respondent is 2 wheeler, 0 otherwise
veh_4w 1 if primary mode of commute of respondent is 4 wheeler, 0 otherwise
veh_oth
1 if primary mode of commute is neither a 2 wheeler nor a 4 wheeler, 0
otherwise
fam_net
1 if the respondent is familiar with at least 2 roads on the study corridor, 0
otherwise
wrk_dis 1 if work distance of the respondent is greater than 10 km, 0 otherwise
switch 1 if the respondent uses alternate routes many times a week,0 otherwise
age1 1 if age of the respondent is between 18 years and 25 years, 0 otherwise
age2 1 if age of the respondent is between 26 years and 35 years, 0 otherwise
age3 1 if age of the respondent is between 36 years and 45 years, 0 otherwise
age4 1 if age of respondent is above 45 years, 0 otherwise
gender 1 if the respondent is male, 0 if the respondent is female
dri_exp 1 if the driving experience of the respondent more than 3 years,0 otherwise
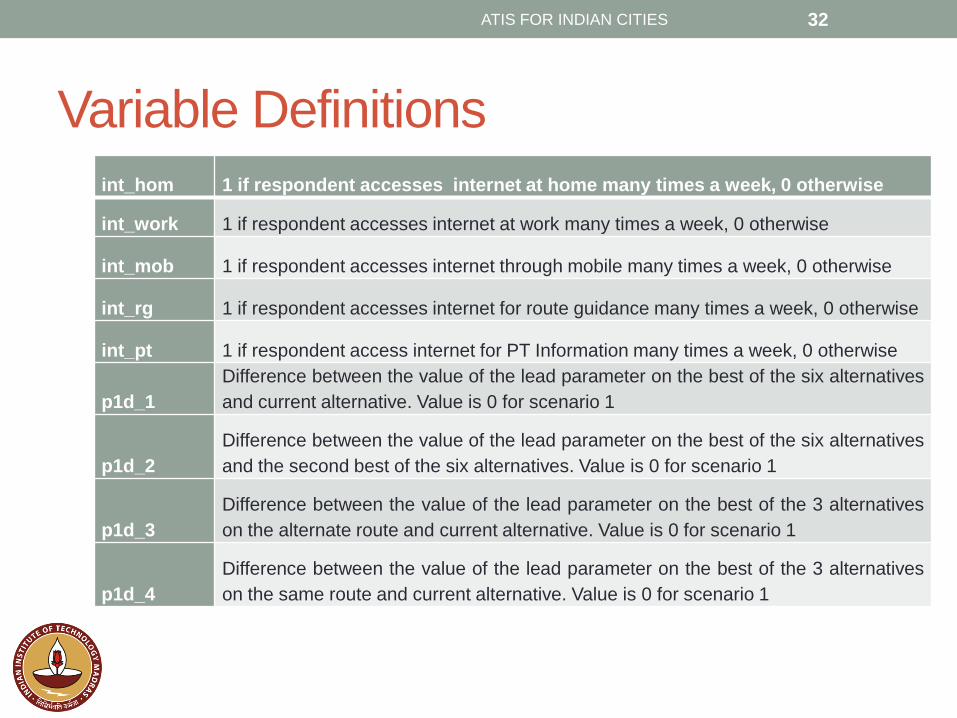
Variable Definitions
ATIS FOR INDIAN CITIES 32
int_hom 1 if respondent accesses internet at home many times a week, 0 otherwise
int_work 1 if respondent accesses internet at work many times a week, 0 otherwise
int_mob 1 if respondent accesses internet through mobile many times a week, 0 otherwise
int_rg 1 if respondent accesses internet for route guidance many times a week, 0 otherwise
int_pt 1 if respondent access internet for PT Information many times a week, 0 otherwise
p1d_1
Difference between the value of the lead parameter on the best of the six alternatives
and current alternative. Value is 0 for scenario 1
p1d_2
Difference between the value of the lead parameter on the best of the six alternatives
and the second best of the six alternatives. Value is 0 for scenario 1
p1d_3
Difference between the value of the lead parameter on the best of the 3 alternatives
on the alternate route and current alternative. Value is 0 for scenario 1
p1d_4
Difference between the value of the lead parameter on the best of the 3 alternatives
on the same route and current alternative. Value is 0 for scenario 1