Embed Size (px)
Citation preview

Atlas Air Worldwide Investor-Analyst Day June 25, 2018

2
Safe Harbor Statement
This presentation contains “forward-looking statements” within the meaning of the Private Securities Litigation Reform Act of 1995 that
reflect Atlas Air Worldwide Holdings, Inc.’s (AAWW) current views with respect to certain current and future events and financial
performance. Such forward-looking statements are and will be, as the case may be, subject to many risks, uncertainties and factors
relating to the operations and business environments of AAWW and its subsidiaries that may cause actual results to be materially different
from any future results, express or implied, in such forward-looking statements.
For additional information, we refer you to the risk factors set forth in the documents filed by AAWW with the Securities and Exchange
Commission. Other factors and assumptions not identified above are also involved in the preparation of forward-looking statements, and
the failure of such other factors and assumptions to be realized may also cause actual results to differ materially from those discussed.
AAWW assumes no obligation to update the statements in this presentation to reflect actual results, changes in assumptions, or changes
in other factors affecting such estimates, other than as required by law.
This presentation also includes some non-GAAP financial measures. You can find our presentations on the most directly comparable
GAAP financial measures calculated in accordance with accounting principles generally accepted in the United States and our
reconciliations in the appendix and our earnings releases dated February 22 and May 3, 2018, which are posted on our website at
www.atlasair.com.
3
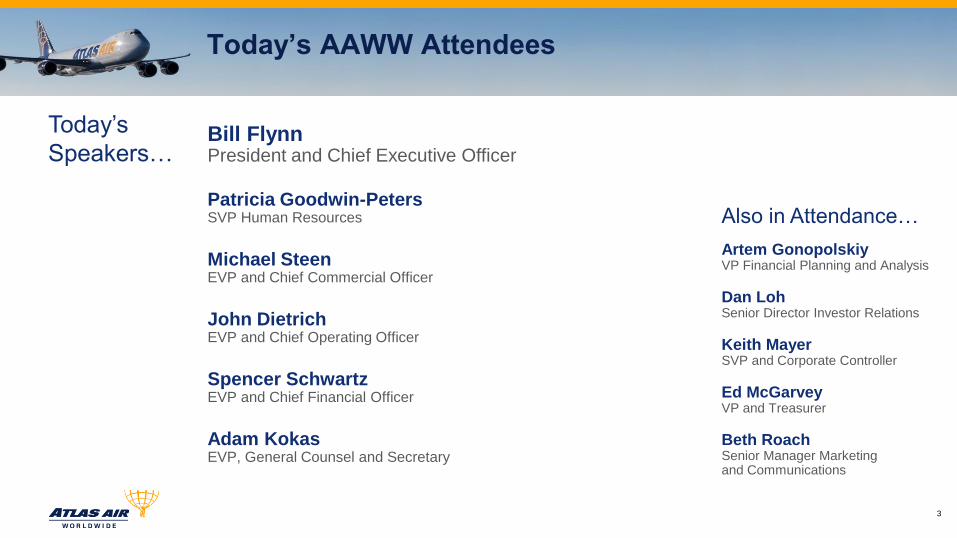
Today’s AAWW Attendees
Bill Flynn President and Chief Executive Officer
Patricia Goodwin-Peters SVP Human Resources
Michael Steen EVP and Chief Commercial Officer
John Dietrich EVP and Chief Operating Officer
Spencer Schwartz EVP and Chief Financial Officer
Adam Kokas EVP, General Counsel and Secretary
Artem Gonopolskiy VP Financial Planning and Analysis
Dan Loh Senior Director Investor Relations
Keith Mayer SVP and Corporate Controller
Ed McGarvey VP and Treasurer
Beth Roach Senior Manager Marketing and Communications
Today’s
Speakers…
Also in Attendance…

4
Today’s Agenda
Welcome Patricia Goodwin-Peters
Overview Bill Flynn
Operations John Dietrich
Commercial Michael Steen
Financial Spencer Schwartz
Governance Adam Kokas
Wrap-Up Bill Flynn
Q&A
Reception

5
To be our customers’
most trusted partner
Our Vision
6
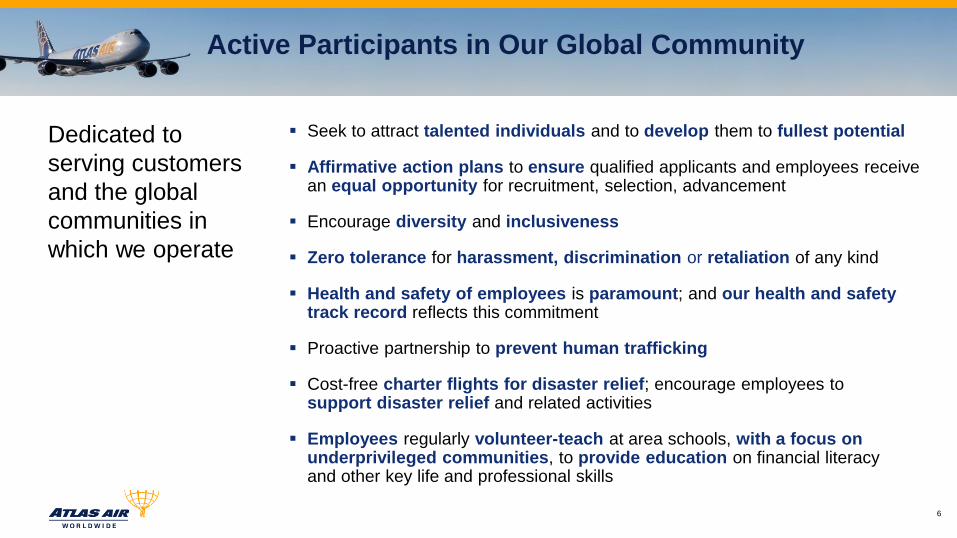
Active Participants in Our Global Community
Dedicated to
serving customers
and the global
communities in
which we operate
Seek to attract talented individuals and to develop them to fullest potential
Affirmative action plans to ensure qualified applicants and employees receive an equal opportunity for recruitment, selection, advancement
Encourage diversity and inclusiveness
Zero tolerance for harassment, discrimination or retaliation of any kind
Health and safety of employees is paramount; and our health and safety track record reflects this commitment
Proactive partnership to prevent human trafficking
Cost-free charter flights for disaster relief; encourage employees to support disaster relief and related activities
Employees regularly volunteer-teach at area schools, with a focus on underprivileged communities, to provide education on financial literacy and other key life and professional skills

Overview Bill Flynn
President and
Chief Executive Officer

Global leader in outsourced aviation
Era of significant business growth and development
Expect sharply higher adjusted net earnings in 2018
Focus on express, e-commerce, fast-growing markets
Capitalizing on initiatives to drive value and benefit for customers and investors
Opportunities to grow with existing customers and with new ones
Strong foundation for earnings and cash flow
Key Takeaways
8
Shaping a
Powerful Future

9
Executing Strategic Plan
Thought Leadership
Service Quality
Solid Financial Structure
Leading Assets
Global Scale & Scope
Diversified Mix
Transformed Business

10
2018 Objectives
Deliver superior service quality
Ensure safe, secure, compliant operation
Achieve earnings goals
Maximize business opportunities
Implement full Amazon service
Capitalize on Southern Air platform for growth
Realize continuous improvement
Maintain solid balance sheet Continued Growth and Innovation

11
So Far in 2018
Amazon
15 aircraft in service
Added two 767s in May and June
20 aircraft expected by year-end
Holiday Flowers
Total Flights: 145
Weight: 26 million lbs
Block Hours: 554
Atlas “On Tour”
Awards
Commercial Bank Financing of the Year ISHKA
Innovative Financing of the Year Airfinance Journal
Best Legal Department New York Law Journal
On the Road Again
Formula One
Moto GP
Parade Floats
Social Responsibility
Champion Award Junior Achievement of New York
Ozzy Osbourne
Taylor Swift
Radiohead
Katy Perry
Depeche Mode
Pearl Jam
Lollapalooza
12
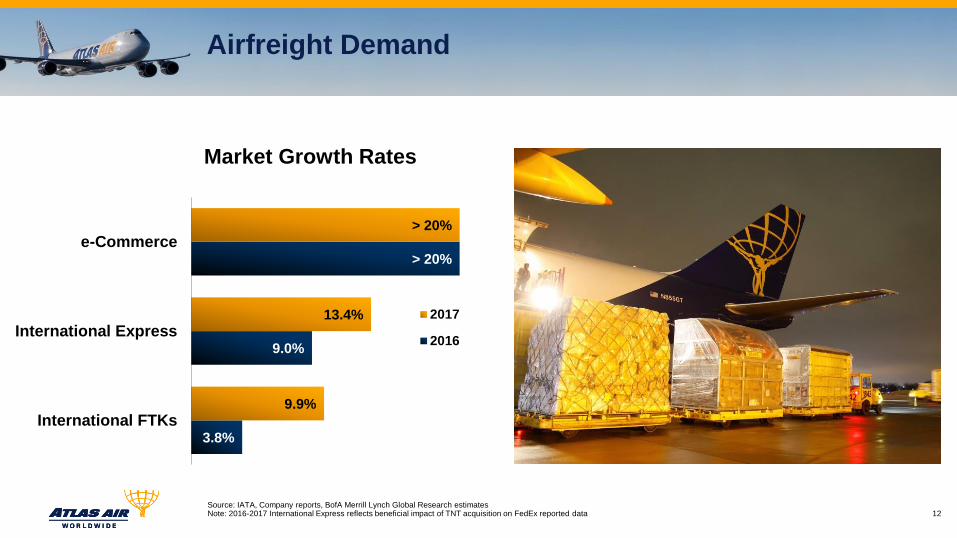
Airfreight Demand
Source: IATA, Company reports, BofA Merrill Lynch Global Research estimates Note: 2016-2017 International Express reflects beneficial impact of TNT acquisition on FedEx reported data
3.8%
9.0%
> 20%
9.9%
13.4%
> 20%
International FTKs
International Express
e-Commerce
Market Growth Rates
2017
2016

Fleet Aligned with Express and e-Commerce
Source: Company, ACMG – April 2018
Atlas Fleet in Express/ e-Commerce Compared with Global Fleet
47%
36%
AAWW Global Fleet inExpress
Large Widebody
100%
78%
AAWW Global Fleet inExpress
Medium Widebody
Total global medium
widebody freighters
(767s, A300-600s/B4s,
A330-200s, A310-200s/300s,
DC-10-10s)
Total global large
widebody freighters
(747s, 777s, MD-11s,
DC-10-30s/40s)
543 514
13

14
Atlas Load Factors Outperforming
Source: IATA, Atlas (freighter aircraft excluding those serving military and dry leasing)
Load
Factor
40%
45%
50%
55%
60%
65%
70%
2011 2012 2013 2014 2015 2016 2017
AAWW # Aircraft In Service International Load Factors AAWW Load Factors
Average Freight Load Factors

15
Our Fleet
*Estimated fleet at 12/31/18
12 Boeing 777s
2 A+CMI 777Fs
4 CMI 777Fs
6 Titan 777Fs
7 Boeing 737s
5 737-400Fs
1 737-300Fs Titan
1 737-800 Passenger Titan
42 Boeing 767/757s
35 767-200/300Fs
6 767-200/300 Passenger
1 757-200 Freighter Titan
Total Fleet: 112* Operating Fleet: 92 Dry Lease: 9 In Pipeline: 11
51 Boeing 747s
10 747-8Fs
33 747-400Fs
4 747-400 Passenger
4 Boeing Large Cargo Freighters
(LCFs)
2018 Fleet Growth: 16 Aircraft +Nine 767s +Six 747s +One 777

16
International Global Airfreight – Annual Growth
Total Global Airfreight Tonnage: IATA (June 2018)
IATA – Global airfreight
tonnage growing from
record levels
IATA – International freight
tonne kilometers (FTKs)
flown up 9.9% in 2017
IATA – Expects very healthy
4.0% FTK growth in 2018
51.7
54.0 54.8
57.0
61.5
63.6
2013 2014 2015 2016 2017 2018F
IATA Reported Airfreight Tonnage Growing from Record Levels (in millions)

17
The Key Underlying Express Market is Growing
Notes: Weighted average of growth rates in international express package volume reported by these express operators Weighting is 50% DHL, 25% UPS and 25% FedEx. 2016-2017 FedEx reported data reflects beneficial impact of TNT acquisition
The International Express
market is showing
robust growth
7.5% CAGR since 2011,
over double the pace of
general airfreight
6%
12%
19%
25%
36%
55%
2011 2012 2013 2014 2015 2016 2017
International Express Market – DHL, FedEx and UPS Change in Package Volume (Base year 2011 - 100%)

18
e-Commerce Projected Growth
Source: Euromonitor, Forrester, eMarketer, BofA Merrill Lynch Global Research estimates
Global e-Commerce
has grown and is
growing sharply
$590 $741
$943 $1,190
$1,433
$1,859
$2,290
$2,774
$3,305
$3,879
$4,479
2011 2012 2013 2014 2015 2016 2017E 2018F 2019F 2020F 2021F
Global e-Commerce Sales ($ Billion)

Global leader in outsourced aviation
Era of significant business growth and development
Expect sharply higher adjusted net earnings in 2018
Focus on express, e-commerce, fast-growing markets
Capitalizing on initiatives to drive value and benefit for customers and investors
Opportunities to grow with existing customers and with new ones
Strong foundation for earnings and cash flow
Key Takeaways
19
Shaping a
Powerful Future

Commercial
Michael Steen
Executive Vice President and
Chief Commercial Officer
President and
Chief Executive Officer
Titan Aviation Holdings

21
Business Developments
Record number of placements (10) in 2017 and expanded service for existing customers
Added several new customers: e.g., Asiana, Cathay Pacific, NCA
Launched groundbreaking ACMI service for DHL Global Forwarding, including a 2nd aircraft in 2018
Significant additional placements with express operators: DHL, FedEx and UPS
Now leasing/operating 15 767-300Fs for Amazon; expect to have 20 in service by the end of 2018
Entered strategic long-term CMI contract with NCA
Grew revenue 18% and contribution 15% in 2017
Leasing & Charter Operator of the Year (4th consecutive year)
ACMI/CMI

22
Business Developments
Charter Dry Leasing World’s leading 747 charter operator
High-profile sports, racing, entertainment charters: NFL, FC Barcelona, Manchester United, Formula One, Taylor Swift and more
Expanded our network as the leading operator in South America market
Largest provider of cargo and passenger charters to U.S. military
Grew revenue 17% and contribution 13% in 2017
Became the world’s 3rd largest freighter lessor by value
Added 20 767-300s for conversion; acquired two additional 777-200Fs
Grew revenue 13% and contribution 21% in 2017

23
Growing Relationship with DHL
Largest provider of strategic lift
41 aircraft, up from original six in 2008
Fleet Types: 747, 777, 767, 757, 737
ACMI, CMI, Charter, Dry Leasing service
Global network coverage
Transpacific express
North American
Intra-Asian
Round-the-world routes

24
Amazon and e-Commerce
Strategic long-term relationship
10-year dry leases, 7- to 10-year CMI
15 B767-300Fs currently
20 aircraft expected by end of 2018
Fast-growing market segment
Potential to grow
Dedicated and tailored solutions

25
Diversified Customer Base
Long-term, profitable relationships Resilient business model and predictable revenues
Shippers Forwarders/Brokers Express Airlines
Diversified portfolio of growth-oriented market leaders
Covering the entire air cargo supply chain
High degree of customer integration
Focused on continuous development and growth
Long-term contractual commitments
Our Strengths

16.9
12.7 12.1 11.9
11.0 10.8
8.3 7.6 7.3
6.7
FTKs by Operator (Billions)
1% of reported world
trade tonnage is carried by
air cargo
Air cargo competitive advantages –
speed, reliability, and security
35% of reported world trade value is carried by air cargo
0% 50% 100%
26M lbs of Flowers
for Holidays
High-Value
Consumer Goods
Inventory,
Just-in-Time
Environmental &
Quality Control
75M lbs of Fresh
Salmon
Flowers from
South America
Auto Parts
Globally
Electronics
Globally
Pharmaceuticals
Globally
Salmon
from Chile
Global Transportation Perspective
26

Total
$85B
Airfreight – Global and Growing
Sources: Flight Global, U.S. DOT F41, airline reports, and Boeing estimates (2017 data)
Airlines operating
freighters generate
90% of industry
revenues
27
$8.5B (10%)
$8.5B (10%)
$32.8B (39%)
$33.6B (41%)
Passenger Belly Only
All Cargo Carriers
Combination Carriers
Express Carriers

28
Market Growth 2017
Sources: IATA, Company Reports
2017 Exceeded Market Expectations Again…
8.1% 9.7% 20.1%
5.1% 3.3% 20.0% Forecasted
Actual
Forecasted
Actual
Forecasted
Actual

29
Market Growth Expectations 2018
Sources: IATA, Company Reports
7.0% 5.7%
7.0% 4.0% 19.0% Forecasted Forecasted Forecasted
YTD Actual YTD Actual 1Q18 Actual 20.6%
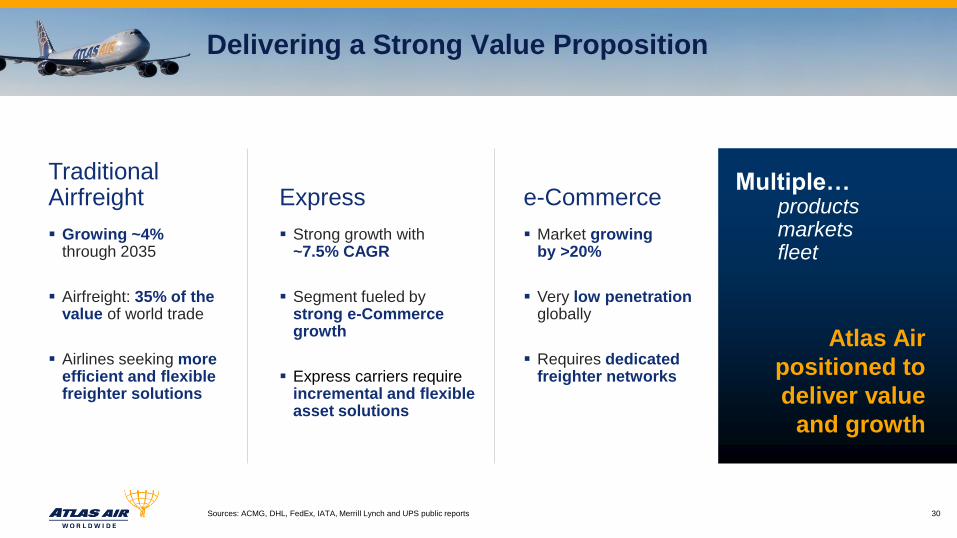
Growing ~4% through 2035
Airfreight: 35% of the value of world trade
Airlines seeking more efficient and flexible freighter solutions
Strong growth with ~7.5% CAGR
Segment fueled by strong e-Commerce growth
Express carriers require incremental and flexible asset solutions
Market growing by >20%
Very low penetration globally
Requires dedicated freighter networks
30
Delivering a Strong Value Proposition
Sources: ACMG, DHL, FedEx, IATA, Merrill Lynch and UPS public reports
Atlas Air
positioned to
deliver value
and growth
Multiple… products markets fleet
Traditional Airfreight Express e-Commerce
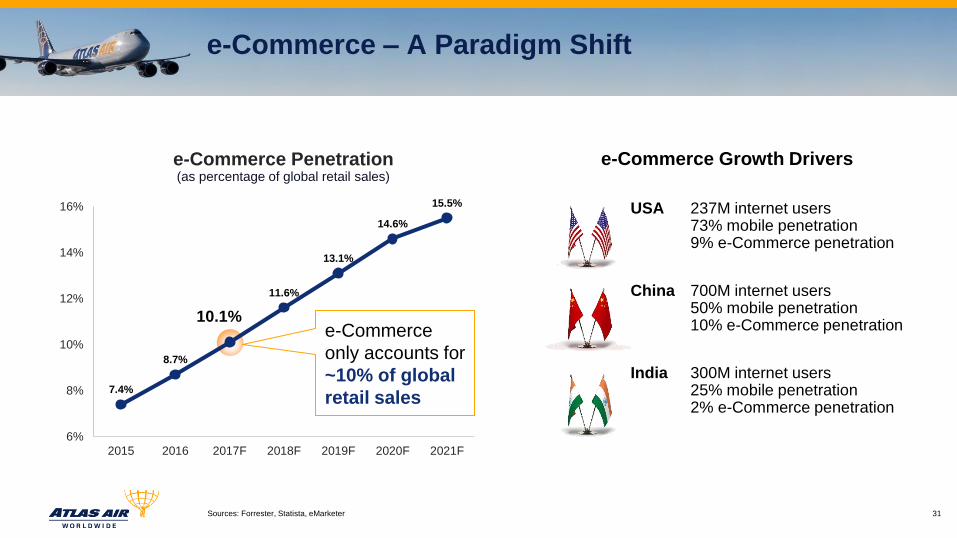
7.4%
8.7%
10.1%
11.6%
13.1%
14.6%
15.5%
6%
8%
10%
12%
14%
16%
2015 2016 2017F 2018F 2019F 2020F 2021F
e-Commerce Growth Drivers
USA 237M internet users 73% mobile penetration 9% e-Commerce penetration
China 700M internet users 50% mobile penetration 10% e-Commerce penetration
India 300M internet users 25% mobile penetration 2% e-Commerce penetration
31
e-Commerce – A Paradigm Shift
Sources: Forrester, Statista, eMarketer
e-Commerce Penetration (as percentage of global retail sales)
e-Commerce
only accounts for
~10% of global
retail sales

B2B B2C
Thousands Number of Customers Billions
High Geographical Density Low
Pallet Shipment Unit Package
Low Value / Weight Ratio High
Scheduled Delivery Frequency On-Demand
Predictable Delivery Speed ASAP
Contractual Shipper-Consignee Relationship Transactional
Purchase Order Payment Credit Card
The Impact of e-Commerce – B2B vs. B2C
32

Widebody Freighter Supply
*Excludes express aircraft: UPS, FedEx, DHL
Limited new-production deliveries over the next several years
Fewer orders
Slot constraints
Limited reactivation of parked capacity Only eight aircraft in storage under 20-years-old
49 active aircraft will surpass 30 years in age and retire
Fleet expected to grow <1% annually while demand is expected to increase ~4% annually over the next decade
Limited deliveries due to reduced orders and fleet retirements
33
2018 2019 2020 2021 2022
380
385
390
395
400
405
410
Widebody Freighter Aircraft Projections

0
25
50
2018 2019 2020
34
Demand Exceeding Current Orders
Source: Boeing, Airbus, Cargo Facts, 2018
Current Orders
New Large Freighters Needed
(at ~4% growth)
47 47
920 new production freighters needed over next 19 years (2017 – 2036)
47 25 Large body
22 Medium body
25 Large body
22 Medium body

35
Delivering Value to DHL Global Forwarding
What Strong demand growth driving shortage of
general cargo capacity and escalating cost
DHL wanted to secure capacity for customers on key trade lanes to guarantee uplift and add unique value
How Joint network and fleet analysis in order to
optimize capacity and performance
Deployed two 747-400Fs on global routes
Focus on continued growth and delivering high-quality service

36
Delivering Value to the Express Market
What Continued strong demand growth in express segment
e-Commerce impact requiring incremental capacity for peak season
Global requirements for leasing solutions
How Network analytics and segment knowledge
Delivered fleet solutions from five platforms
Innovative capacity solutions for peak-season demand
Expanded our scale with the top three global express operators

37
Tailoring Airfreight Networks for e-Commerce
Customized air networks supported by an unparalleled range of freighters
Global scale to operate domestic, regional and international networks
We match each customer with the right assets, the most efficient networks and value-adding solutions
Customers require tailored solutions, and Atlas provides:

38
Atlas is Uniquely Positioned for the Future
Modern, reliable, fuel-efficient fleet
Differentiated fleet solutions: 747, 777, 767, 757, 737
Strong portfolio of long-term customers committed to further expansion
Operating on five continents
Serving the entire air cargo supply chain
Unique integrated value proposition
High degree of customer collaboration
Focused on innovation and thought leadership
Airfreight is vital to global trade growth
~$6.9 trillion of goods airfreighted annually; ~35% of total world trade
Higher-growth e-Commerce and express markets demand dedicated freighter services
High-value, time-sensitive inventories demand airfreight-based supply chain
Airfreight provides a compelling value proposition
The Industry Atlas

Operations John Dietrich
Executive Vice President and
Chief Operating Officer

40
Operations – A Competitive Advantage
Safety, Security & Compliance
Customer Focus
Operational Excellence
Innovative Solutions
Flexibility for Customers
Continuous Improvement

41
Global Presence
~300,000 Block Hours ~50,000 Flights ~425 Airports ~105 Countries

152,707 158,937 161,090
178,060
210,444
252,802
25,274 27,946 28,916 32,505
39,882 48,983
51 57
60 67
90
103
2012 2013 2014 2015 2016 2017 2018
Growth by Year
Block Hours
Fleet Count
Departures
42

Transformation, Diversification and Growth
2011 747-8F & AMC Pax
2012/13 767 Cargo & Pax
2016/18 777 & 737 Cargo
2014/15 767 Expansion
43

44
Our Fleet
*Estimated fleet at 12/31/18
12 Boeing 777s
2 A+CMI 777Fs
4 CMI 777Fs
6 Titan 777Fs
7 Boeing 737s
5 737-400Fs
1 737-300Fs Titan
1 737-800 Passenger Titan
42 Boeing 767/757s
35 767-200/300Fs
6 767-200/300 Passenger
1 757-200 Freighter Titan
Total Fleet: 112* Operating Fleet: 92 Dry Lease: 9 In Pipeline: 11
51 Boeing 747s
10 747-8Fs
33 747-400Fs
4 747-400 Passenger
4 Boeing Large Cargo Freighters
(LCFs)
2018 Fleet Growth: 16 Aircraft +Nine 767s +Six 747s +One 777

45
U.S. Military Civil Reserve Air Fleet (CRAF)
Member of FedEx Team – FedEx, Atlas, Polar, American, Hawaiian, Delta
2017 revenues ~$496 million up 14% from 2016 – Cargo: 2018 YTD through June hours up 38% over Jan-Jun 2017
– Passenger: 2018 YTD through June hours up 5% over Jan-Jun 2017
FY17 entitlement ~53%
FY18 entitlement ~54%
AMC expects FY19 demand to remain consistent with current levels
46
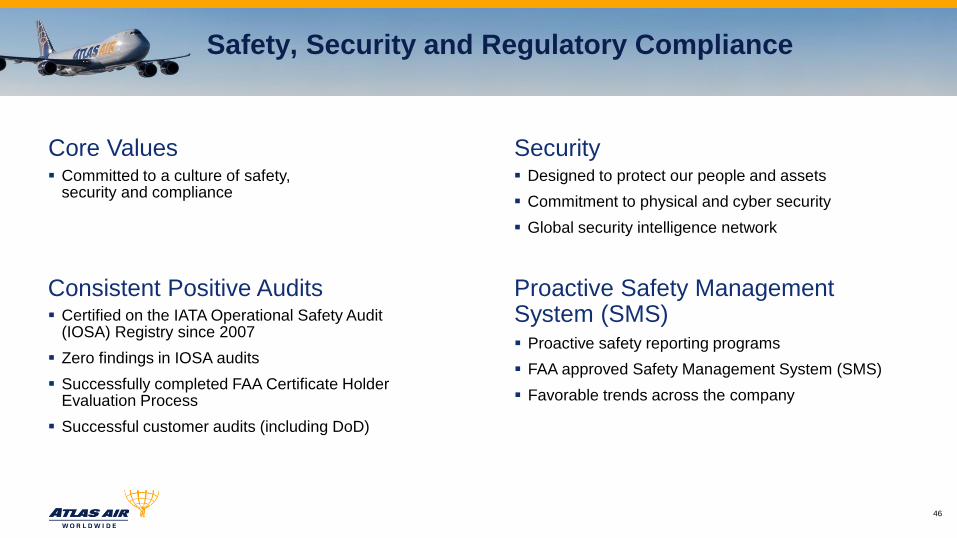
Safety, Security and Regulatory Compliance
Certified on the IATA Operational Safety Audit (IOSA) Registry since 2007
Zero findings in IOSA audits
Successfully completed FAA Certificate Holder Evaluation Process
Successful customer audits (including DoD)
Committed to a culture of safety, security and compliance
Proactive safety reporting programs
FAA approved Safety Management System (SMS)
Favorable trends across the company
Designed to protect our people and assets
Commitment to physical and cyber security
Global security intelligence network
Consistent Positive Audits
Core Values
Proactive Safety Management System (SMS)
Security

47
Continuous Improvement Focus
Part of the corporate culture
Strategic procurement
FuelWise
Crew scheduling and resource management
Strategic process improvements
Travel-cost improvements
Southern integration synergies
Strategic Process
Improvement
Traditional Initiatives
Strategic Procurement
Initiatives

48
Southern Air Integration
The integration with Southern Air is on track
Single Operating Certificate planned for 2019
Common cultures and teams working well together
Until merger completed, both airlines continue to operate separately
Pursuing single collective bargaining agreement for pilots
Remain focused on exceptional customer service

49
Amazon Ramp-Up on Schedule
22 B767-300 freighters between
3Q16 and year-end 2018 (20 active and 2 spare)
Aircraft acquisitions
Conversions slots secured
Onboarding aircraft to our Operating Certificate
Spare-part provisioning
Crew hiring and training
Ground operations support for new and existing stations
Contingency planning
Reliability monitoring and reporting
Communication protocols
Ongoing process review and future development Strategic, long-term relationship

50
Pilot Contract Update
Atlas values the significant contributions of its crewmembers and will continue to negotiate for a competitive contract
Under the Railway Labor Act, labor contracts do not expire, they become amendable and remain in force
Atlas Air, Inc. pilot collective bargaining agreement became amendable in September 2016
Southern Air, Inc. pilot collective bargaining agreement became amendable in November 2016
Both the Atlas and Southern CBAs have specific provisions and orderly processes for merging
The union does not have the right to strike under the CBA merger provisions

51
Operations – A Competitive Advantage
We manage diverse, complex and time-definite global networks
We are customer-focused and deliver superior performance
Our global scale and operational capabilities are unparalleled
Industry-leading operational expertise
We collaborate with customers to provide value-added solutions
We are always driving continuous improvement
We are strategically positioned to deliver future growth

Financial Spencer Schwartz
Executive Vice President and
Chief Financial Officer

53
Financial Objectives
Long-term performance and value
Leading-edge technology
Long-term customer contracts
Productivity improvements
Celebrating 25 years as recognized leader in outsourced aircraft and aviation operating services
Modern, world-class, fuel-efficient aircraft servicing multiple market segments
DHL Express BSA; Amazon agreements; focus on express, e-commerce and fast-growing global markets
Continuous improvement; Southern Air synergies
Balanced capital allocation
Earnings framework
Effective governance
Business investment; refinanced debt; repurchased >10% of shares since 2013
Updated throughout the year
Enhanced corporate governance

54
Significant Business Growth
*See February 22, 2018 press release for Non-GAAP reconciliations
Full-Year 2017 Performance Highlights
Strategic Highlights Financial Highlights
Expanded air transport services provided to Amazon
Significant progress on the integration of Southern Air
Entered several key new customer agreements
Volumes increased 20% to 252,802 block hours
Revenue grew 17% to $2.16 billion
Total direct contribution by our business segments increased 15% to $422.6 million
Adj. income from continuing operations, net of taxes*, grew 17% to $133.7 million
Adj. EBITDA* rose 12% to $428.6 million
20%
17%
15%
17%
12%

55
A Strong Start to 2018
*See May 3, 2018 press release for Non-GAAP reconciliations **2018 YTD data as of 6/20/18 close
Revenue
1Q18
$590.0M
24%
Block Hours
21%
1Q18
66,495
Direct Contribution
39%
1Q18
$86.5M
Adj. EBITDA*
47%
1Q18
$93.8M
Adj. Net Income*
187%
1Q18
$23.8M
26.2%
3.1%
11.8%
4.5%
AAWW Dow JonesTransportation
Russell 2000 S&P 500
TSR Performance vs. Key Indices**
Meaningful 2018 Year-to-Date
TSR Outperformance
Compared with Key Indices
1Q 2018 Performance Highlights
Shareholder Value Creation

56
2018 Framework
~19% increase to ~300,000
~75% of total in ACMI
Balance in Charter
Block Hours
Revenue >$2.6 billion
Adj. EBITDA ~$520 million
Revenue/Adj. EBITDA Stronger company
Solid demand for our services
Business
Maint Exp ~$320 million
Depr/Amort ~$220 million
Core Capex ~$100-110 million
Other 2018 Key Items
Adj. EBITDA ~$110 million
Adj. net income to increase 40% to 45% from 1Q18
2Q18 Outlook
To grow 35% to 40% compared with 2017
Adj. Net Income

57
Financial and Operating Trends
*See February 22, 2018 press release for Non-GAAP reconciliations
$1,839.6
$2,156.5
>2,600.0
2016 2017 2018E
$382.3 $428.6
~$520.0
250
450
2016 2017 2018E
210.4
252.8
~300.0
2016 2017 2018E
$114.3 $133.7
2016 2017 2018E
35-40%
Growth
Revenue (In Millions)
Block Hours (In Thousands)
Adj. EBITDA* (In Millions)
Adj. Net Income* (In Millions)
$182.2
$236.8
~$285.0
2016 2017 2018E
Free Cash Flow* (In Millions)

58
Capital Allocation Strategy
Balance Sheet Maintenance
Business Investment
Share Repurchases
Acquiring/converting 20 767-300s for Amazon
Acquired Southern Air
Refinanced high-cost 747-400 EETC debt and higher-cost 747-8F term loans
Acquired 10th 747-8F
Acquired two 777s and two 767s for Dry Leasing; also operating them in CMI
Acquired 4th and 5th 767 for AMC passenger service
Repurchased >10% of outstanding stock
Focused on maintaining healthy cash position

59
Growing/Diversifying Fleet/Managing Leverage
*See Appendix for reconciliation to GAAP measures
81 82
90 92
94 97
103 105
2Q16 3Q16 4Q16 1Q17 2Q17 3Q17 4Q17 1Q18
Fleet Size
5.4x 5.3x
4.8x 4.9x 4.9x
5.0x
4.8x 4.9x
2Q16 3Q16 4Q16 1Q17 2Q17 3Q17 4Q17 1Q18
Net Leverage Ratio*
3.5x
4.0x
4.5x
5.0x
1Q18 4Q19
Based on estimates of fleet growth,
placement dates and financing plans
Estimated Net
Leverage Ratio

60
A History of Favorable Financing
2017 Convertible Notes $289.0 million at 1.875%
Fund Amazon aircraft; enhance business and financial flexibility; support long-term growth
2015 Convertible Notes $224.5 million at 2.25%
Retire EETCs with 8.1% average rate
GEnx Engine Upgrade/ Overhaul Unsecured Financing First of its kind; UKEF and Ex-Im joint underwriting
Airline Economics Airline Management Team of the Year Award
Groundbreaking Ex-Im Backed Financing for Six 747-8F Aircraft $854.2 million, average coupon of 1.88%
Airfinance Journal North American Financing of the Year Award
Atlas/Titan Aviation/Amazon 767 Financing Bifurcated cash flows (private placement)
from the aircraft (equipment note)
$145.8 million, weighted average 3.16%
Received three industry awards

61
Benefits from U.S. Tax Reform
Lower U.S. Corporate Tax Rate Expect full-year 2018 adjusted rate of ~16%
Recorded provisional benefit of $130.0 million in 2017
Immediate Expensing of Capex Capital-intensive business
Full expensing of new and used U.S. assets
Repatriation of Overseas Earnings May repatriate if taxes are insignificant
Modifies Use of NOLs Do not expect to pay any significant U.S. federal
income tax in this decade or next

Governance and Sustainability Adam Kokas
Executive Vice President,
General Counsel and Secretary

63
Proactive Governance Enhancements
Board of Directors
Extensive board refreshment – five new directors since 2016, more diverse board
Annual evaluation to ensure right mix of skills, backgrounds, experience and diversity
Overboarding policy
Corporate Governance
Added proxy access
Enhanced disclosure of our environmental, social and governance policies
Adopted board majority voting
Strong commitment to
leading practices

64
A More Diverse Board
New Directors 2016 – 2017
John K. Wulff
2016
Bobby J. Griffin
2016
Charles F. Bolden, Jr.
2017
Jane H. Lute Sheila A. Stamps
President and CEO of SICPA
North America
Special Advisor to the Secretary-
General of the United Nations
Formerly Deputy Secretary for
the US Department of
Homeland Security
Significant technology and
cybersecurity experience
Previously EVP at
Dreambuilder Investments
Formerly Director of Pension
Investments and Cash
Management at New York State
Common Retirement Fund
Held senior positions with Bank
of America and Bank One
(now J.P. Morgan Chase)
Significant banking and finance
experience
New Directors 2018
Significant Board Refreshment Director Tenure Gender and Ethnic Diversity
Strategic Planning
Global Operations
Public Company
Board Experience
Corporate Governance
Current or Previous
Senior Executive Experience
Legal, Regulatory &
Government Affairs
Transportation & Security
Military Affairs
Supply Chain & Procurement
Cybersecurity &
Information Technology
Finance, Accounting &
Risk Management
Mergers & Acquisitions
Capital Structure
International Trade
Sales & Marketing
Civil & Governmental Aviation
Board Skills &
Qualifications
0-2 Years
5 Directors
14 Years
1 Directors
6-13 Years
4 Directors Diverse
board
members
50%
Other
board
members
50%

65
Committed to Sustainability
Modern fleet: superior fuel-efficiency, range, noise, capacity and loading capabilities
747-8Fs: ~15% more fuel-efficient than our 400s, ~15% lower carbon dioxide
emissions, 30% less noise
FuelWise fuel-management information system tracks fuel-burn rates, identifies
additional opportunities to conserve fuel
Closely engage with customers to plan more fuel-efficient routes
Participant in industry/government initiatives to optimize air-traffic management;
seek substantial reductions in fuel use and emissions, fewer delays at airports
Prohibition against shipments containing illegal items covered by wildlife trafficking laws
Strong on-ground record: no significant spills of fuel, de-icing fluids or other liquids
Planned participation in CORSIA global carbon emissions program

66
Recent Corporate Recognition
New York Law Journal Awards, 2018
Best Legal Department
Junior Achievement of New York, 2018 Champion Award
Airfinance Journal Awards, 2017 Innovative Financing of the Year
Aviation News Awards, 2017 Freighter Financing Transaction of the Year
NYSE Governance Services Leadership Awards, 2016 Exemplary Shareholder Engagement
Corporate Secretary Governance Awards, 2016 Governance Professional of the Year (Small- to Mid-Cap)
Aviation News Awards, 2016 Airline Management Team of the Year

Wrap-Up Bill Flynn
President and
Chief Executive Officer

Global leader in outsourced aviation
Era of significant business growth and development
Expect sharply higher adjusted net earnings in 2018
Focus on express, e-commerce, fast-growing markets
Capitalizing on initiatives to drive value and benefit for customers and investors
Opportunities to grow with existing customers and with new ones
Strong foundation for earnings and cash flow
Key Takeaways
68
Shaping a
Powerful Future

Appendix

70
Reconciliation to Non-GAAP Measures
*Items may not sum due to rounding
$ millions 12/31/17 12/31/16 12/31/15 12/31/14 12/31/13 12/31/12 12/31/11
Income from cont. ops, net of taxes $ 224.3 $ 42.6 $ 7.3 $ 102.2 $ 94.0 $ 129.7 $ 96.3
Income tax expense (benefit) (81.0) 46.8 (24.5) (12.7) 23.8 75.6 60.7
Income from cont. ops before income taxes $ 143.4 $ 89.4 $ (17.2) $ 89.5 $ 117.8 $ 205.3 $ 157.0
U.S. Tax Cuts and Jobs Act special bonus 3.7 - - - - - -
Special charge 0.1 10.1 17.4 15.1 18.6 - 5.4
Noncash expenses and income, net 17.9 8.1 4.5 (0.1) (1.1) (1.1) (0.9)
Transaction-related expenses 4.8 45.6 - - - - -
Accrual for legal matters 4.1 6.5 104.4 1.3 - - -
Pre-operating expenses - - - - - - 17.1
Insurance gain - - - - - (6.3) -
Loss on early extinguishment of debt 0.1 0.1 69.7 - 5.5 0.6 -
Loss on disposal of aircraft / Fleet retirement costs 0.0 0.0 1.5 14.7 0.4 (2.4) (0.4)
Gain on investments - - (13.4) - - - -
Unrealized gain on financial instruments 12.5 2.9 - - - - -
Adjusted pretax income* $ 186.7 $ 162.7 $ 166.9 $ 120.5 $ 141.2 $ 196.1 $ 178.3
Net interest expense 75.6 70.6 81.1 87.8 65.0 29.6 (2.5)
Other non-operating expenses (0.4) 0.1 1.2 1.1 2.0 0.8 (0.2)
Adjusted operating income* $ 261.9 $ 233.4 $ 249.2 $ 209.4 $ 208.2 $ 226.5 $ 175.6
Depreciation and amortization 166.7 148.9 128.7 120.8 86.4 62.5 39.3
EBITDA, as adjusted* $ 428.6 $ 382.3 $ 377.9 $ 330.2 $ 294.6 $ 289.0 $ 214.9

71
Reconciliation to Non-GAAP Measures
EBITDAR: Earnings before interest, taxes, depreciation, amortization, aircraft rent expense, U.S. Tax Cuts and Jobs Act special bonus, noncash interest expenses and income, net, gain on disposal of aircraft, special charge, costs associated with transactions, accrual for legal matters and professional fees, charges associated with refinancing debt, and unrealized loss (gain) on financial instruments, as applicable
(In $Millions) 1Q18 4Q17 3Q17 2Q17 1Q17 4Q16 3Q16 2Q16
Face Value of Debt $ 2,416.6 $ 2,378.8 $ 2,259.8 $ 2,307.2 $ 2,068.1 $ 1,943.4 $ 1,967.7 $ 2,001.7
Plus: Present Value of
Operating Leases 709.7 656.6 681.9 661.0 678.6 749.9 774.7 799.4
Total Debt 3,126.2 3,035.4 2,941.8 2,968.2 2,746.7 2,693.2 2,742.4 2,801.1
Less: Cash and Equivalents $ 130.4 $ 291.9 $ 176.3 $ 282.7 $ 118.9 $ 138.3 $ 115.6 $ 168.3
Less: EETC Asset 27.8 29.0 29.9 30.9 31.9 32.3 34.8 35.8
LTM EBITDAR $ 603.0 $ 570.4 $ 546.8 $ 543.1 $ 525.6 $ 526.0 $ 485.9 $ 484.7
Net Leverage Ratio 4.9x 4.8x 5.0x 4.9x 4.9x 4.8x 5.3x 5.4x