Embed Size (px)
Citation preview

ATLAS ATCA cooling evaluation project
ATLASProjectDocumentNo: InstituteDocumentNo. Created:02-Ago-16 Page:1of23
EDMS1609794 Modified:30-Aug-16 Rev.No.:1.1
The objective of this document is to present the motivations, methodology and results of the air cooling assessment of the capabilities of the standard 52U LHC racks equipped with
ATCA shelves for the upgrades of LS2 and LS3.
Preparedby
C. Bortolin (EP-ADO) M. Kalinowski (EP-ADO)
Checkedby:
L. Zwalinski (EP-DT)
Vincent Bobiller (EP-ESE) Stefan L. Haas (EP-ESE)
Approvedby:
Francois Vasey (EP-ESE) L. Pontecorvo (EP-ADO)
Distribution List

2
History of Changes Rev. No. Date Pages Description of changes
1.0 1.1
15.06.2016 30.08.2016
22 23
Initial version started Completed some corrections suggested by Francois Vasey (EP-ESE)

3
ATLAS ATCA cooling evaluation project C. Bortolin a, V. Bobillier a, D. Dyngosz b, P. Dziurdzia b, M. Kalinowski b,
P. J. Koziol b, L. Zwalinski a
a CERN European Laboratory for Particle Physics, Physics Department, Geneva, Switzerland b Cracow University Of Technology, Cracow, Poland
Email: [email protected]
INTRODUCTION
As part of the Phase-II upgrade of the ATLAS experiment new off-detector electronics will be introduced, this will allow to increase the bandwidth and processing capabilities of these systems using the latest technologies available. The expected instantaneous and total luminosities at the High-Luminosity LHC (HL-LHC) and the new ATLAS trigger system scheme correspond to operation conditions that are beyond the design specifications of part of the current readout electronics of the experiment.
As part of the electronics upgrade, the current VME crates, which were used so far, will be replaced with ATCA (Advanced Telecommunication Computing Architecture) shelves. As required by the Phase-II electronics, these new shelves provide higher backplane bandwidths, processing speed and cooling capacity and present therefore higher power density and consumption.
This is the reason why in 2013 the Electronic System for Experiments group of the Physics Department (EP-ESE) started an Evaluation Project with the aim of providing the technical evaluation of the Telecommunication Computing Architecture (xTCA) which was selected as the hardware platform for the upgrade of the back-end electronics systems of ATLAS [1], [2]. The evaluation project focuses mainly on the evaluation of the xTCA infrastructure equipment: shelves, power supply, blades and cooling modules.
In collaboration with the ATLAS technical coordination a rack cooling test campaign was carried out with the following motivations:
- Assessing cooling capabilities of the LHC rack equipped with the ATCA shelves - Identifying potential in-rack bottlenecks and airflow resistance sources - Introducing mechanical improvements on the rack to optimize the cooling performance - Comparison of different configurations such as horizontal and vertical cooling - Evaluating thermal and safety aspects of the environment for the future installations in
the ATLAS counting rooms (i.e.: noisy measurements, etc.) - Checking possible failure modes and their impact on the cooling performance.
SYSTEM DESCRIPTION Rack Setup
The vertical cooling tests were carried out using the infrastructure layout illustrated in fig.1a:
• 2 power supplies of the shelves (3U each)
• 1 air deflector (2U) that reverts the airflow direction driving the air bottom up through the ATCA blades and heat exchangers.
• 3 air/water heat exchangers (1U each), providing potentially up to 3.8 kW of thermal capacity each. The 4th heat exchanger was added later during the high power tests.
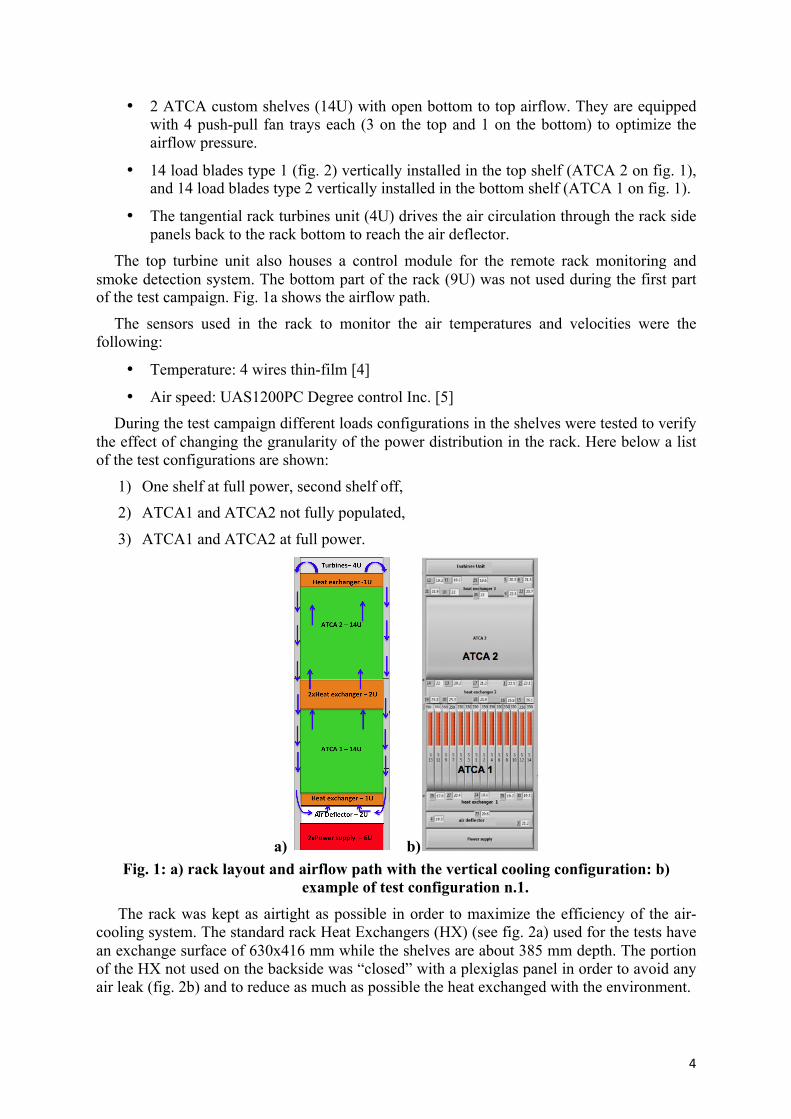
4
• 2 ATCA custom shelves (14U) with open bottom to top airflow. They are equipped with 4 push-pull fan trays each (3 on the top and 1 on the bottom) to optimize the airflow pressure.
• 14 load blades type 1 (fig. 2) vertically installed in the top shelf (ATCA 2 on fig. 1), and 14 load blades type 2 vertically installed in the bottom shelf (ATCA 1 on fig. 1).
• The tangential rack turbines unit (4U) drives the air circulation through the rack side panels back to the rack bottom to reach the air deflector.
The top turbine unit also houses a control module for the remote rack monitoring and smoke detection system. The bottom part of the rack (9U) was not used during the first part of the test campaign. Fig. 1a shows the airflow path.
The sensors used in the rack to monitor the air temperatures and velocities were the following:
• Temperature: 4 wires thin-film [4]
• Air speed: UAS1200PC Degree control Inc. [5] During the test campaign different loads configurations in the shelves were tested to verify
the effect of changing the granularity of the power distribution in the rack. Here below a list of the test configurations are shown:
1) One shelf at full power, second shelf off, 2) ATCA1 and ATCA2 not fully populated,
3) ATCA1 and ATCA2 at full power.
a) b)
Fig. 1: a) rack layout and airflow path with the vertical cooling configuration: b) example of test configuration n.1.
The rack was kept as airtight as possible in order to maximize the efficiency of the air-cooling system. The standard rack Heat Exchangers (HX) (see fig. 2a) used for the tests have an exchange surface of 630x416 mm while the shelves are about 385 mm depth. The portion of the HX not used on the backside was “closed” with a plexiglas panel in order to avoid any air leak (fig. 2b) and to reduce as much as possible the heat exchanged with the environment.

5
a)
b)
Fig. 2: a) Heat exchanger dimensions: b) interface between air deflector – Heat exchanger - ATCA crate.
ThedesignperformancesoftheHXarethefollowing:
Water circuit
• Pressure inlet pin=6 bar
• Max delta pressure (in-out) Dp max=1.5 bar
• Flow: 0.8 m3/h
• Temperature inlet: Tin ≈15°C Air circuit
• Max delta pressure (in-out) Dp max≈90 Pa
• Flow max: 1700 m3/h
4 fan trays constitute the air flow circulation in the integrated airflow system with 15 fans (9 on the top and 6 on the bottom (fig. 3), each fan can potentially provide up to about 8.3 m3/min of air-flow (table 1) with a power dissipation of 96 W. When the system was running without bottom fan-trays, front and back panels were used to cover the holes to guarantee the correct air circulation reducing to the minimum the leaks.
Fig. 3: on the left the top fan tray (3x), and on the right the bottom fan tray (1x).
Flowstopper

6
Tab. 1: Crate fans system characteristics and turbine working parameters. During the test campaign it was measured that the fans were dissipating 145 W each, which is about 50% higher the power specified by the manufacturer which is 96W as already mentioned before. In fig. 4 you can see the characteristic curves of the fans provided by the supplier, the dash lines are the measured performance while the continuous lines are the nominal performance measured in an “open air” environment. The air resistance gave by the shelves reduced the maximum air-flow of the fans to about 4 m3/min.
Fig. 4: Fan performance curves.
Load blades
Two types of load blades were used. Each Comtel [3] load blade (fig. 5) is provided with 8 heating zones based on Surface-Mount Device (SMD) resistors, next to each resistor, a SMD temperature sensor is installed measuring the board temperatures. Additional temperature and air velocity sensors are installed allowing the air inlet and outlet
Concernedcurve
WorkingPoint

7
measurements. The front board (right side of fig. 5) once inserted in a shelf is vertical, in this position, zone 1 is on the top while 4 is at the bottom side. Therefore, the air inlet is below zones 4, 5 and 6 while the outlet is above zones 1, 2 and 3. The front board can dissipate up to 300 W while the RTM heaters can achieve a maximum power of 50 W. The design of the real electronic boards is ongoing and the total power dissipation is foreseen to be at maximum 400 W (Front+RTM).
Fig. 5: Comtel load blades, RTM is the left part and the front blades is the right one.
In fig. 6 a picture of the ASIS [6] load blade is shown, they can provide only the air temperature measurements at the inlet and outlet of the boards. They were equipped with 6 T sensors, 2 on the bottom and 4 on the top of the boards. These blades can dissipate up to 600 W each.
Fig. 6: ASIS load blades: air circulation is from bottom to top. 6 Temperature sensors provide the air temperature inlet/outlet conditions

8
VERTICAL TESTS RESULTS
a) Since the beginning of the tests it was known that air velocity is an important parameter to be measured. To see the effect of air speed and temperatures the following tests were scheduled using ASIS 14U vertical shelves:
• ATCA 1 with Comtel Boards 14x350 [W] for total power of 4.9 [kW]. Top and bottom fan trays running at maximum speed. ATCA 2 switched off (no power on blades, top and bottom fan trays off), see fig. 7a
• ATCA 1 switched off (no power on blades, top and bottom fan trays off). ATCA 2 14x350 [W] for total power of 4.9 [kW]. Top and bottom fan trays running at maximum speed. See fig. 7b
b) a)
Fig. 7: Rack layout of air velocity test.

9
Fig. 8: Air velocity measurements.
As you can see on the charts (fig. 8) the effect of temperature and air speed is evident, where air inlet velocity is lower the temperatures reached higher values.
b) During the test campaign ASIS Pro collaborated with CERN on these studies. They ran many cooling simulations, using both, nominal values and the tests results as input conditions for the simulations. After many iterations it has been found that the RTM zone was not cooled properly (see fig. 9).

10
35°C
37°C
39°C
41°C
43°C
45°C
47°C
49°C
51°C
53°C
55°C
s13 s11 s09 s07 s05 s03 s01 s02 s04 s06 s08 s10 s12 s14
Tempe
rature[°C]
WithboWomfansZONE4 WithgapsandboWomfansZONE4
WithoutboWomfansZONE4 WithgapsandwithoutboWomfansZONE4
Fig. 9: Results of the simulation. After these simulations the company suggested that this behaviour may be caused by nonhomogeneous airflow distribution. So, they advised to apply some modifications on the rack layout:
• To introduce gaps to use a bigger heat exchangers surface, • To remove the bottom fans to improve distribution of the air on RTM zone.
After implementing the modifications, the tests were carried out. Here below you can see the relevant results (fig. 10):
ATCA 1 ALL ON and ATCA 2 ONLY FANS Zone 4 (Highest temperature zone on board)
Fig. 10: Cooling tests results after implementing the modifications.
While introducing the gaps did not change dramatically the performance, removing bottom fans improved a lot the cooling efficiency: a more homogeneous flow distribution makes the average temperature of the load blades lower.
c) To see if the bottom fans can provide sufficient cooling to the blades in case of top fan trays failure, the following tests were carried out:
The top fan trays were removed from both shelves (the gaps were covered using plexiglas panels to prevent any air leakage), while the bottom fan trays in both shelves were running at maximum speed.
• ATCA 2 13x350 [W] slot 3 at 336 [W] (due to a hardware issue) – Comtel load blades (Top),
• ATCA 1 14x400 [W] – ASIS load blades (Bottom).

11
Fig. 11: Cooling tests results using only bottom fans.
In case of failure of one or more of the top fan trays the relevant blades are strongly affected.
d) At the beginning of the test campaign the rack was equipped with three heat exchangers, but the results were not satisfying since the temperatures on the boards were above 50°C. Therefore a 4th heat exchanger was added and the new layout changed with 2 heat exchangers between the 2 shelves. Since the first tests it was observed a temperature drop on the load blades of about 3 degrees. In the future tests there is still the possibility of installing a 5th heat exchanger, the results has shown that the average temperature is linearly lower increasing the number of HX. Anyway the water flow could be affected by the additional pressure drop in the circuit and the drop of temperature could be lower. Then the safety aspect must be taken in account since for any heat exchanger installed directly above electronics, there could be a water leakage which is a potential risk for the system.
After adding the 4th heat exchanger, the water flow inlet and outlet temperatures were measured. The results showed that the heat exchangers are removing about 11 kW out of 13,4 kW of heat produced by the shelves (blades and fans). The nominal cooling capacity of the heat exchangers is about 3.8kW each so the potential cooling capacity, with 4 of them, is 15.2 kW according to the specs of the supplier. As already mentioned the heat exchangers depth is larger than the shelves, so the real heat exchange area is about 70% of the total available which is compatible with the 11 kW removed according to the water in/out parameters.
48°C50°C52°C54°C56°C58°C60°C62°C64°C66°C68°C70°C
s13 s11 s9 s7 s5 s3 s1 s2 s4 s6 s8 s10 s12 s14
Tempe
rature[°C]
2xATCAVer]cal28LBonlyboWomfansHighesttemperaturezone
Topshelftemperatureonboard BoWomshelfairtemperature

12
To see the outcome of any possible electronic equipment failures in which half of the crate stops working, the tests were carried out in the 4 following layouts (see fig. 12):
Fig. 12: Electronic failure modes - tests layouts.
Fig. 13: Electronic failure modes - tests results.
The results showed that in each configuration the temperatures on turned off blades are about 25°C, and temperatures on working blades are below 50°C. On the chart you can see most extreme temperatures on working blades (layout no. 3 on fig. 12).
e) The main goal of the test campaign was to assess cooling performance of the rack, fully populated with highly powered load blades. It is important to remember that each shelf was equipped with 3 fan trays on the top that dissipated nominally 1305 W. Therefore the tests were carried out according to the following configuration:
• ATCA 2 13x350 [W], slot 9 - 336 [W] (due to a hardware issue) for total power of 4.9 [kW]. The bottom fans were removed, the top fans were running at maximum speed.
• ATCA 1 14x400 [W] for total power of 5.6 [kW]. The bottom fans were removed, the top fans were running at maximum speed.

13
Fig. 14: High power tests results.
As you can see on the chart (fig. 14) temperatures of blades were oscillating around 50ºC, and the average temperature of blades in both shelves was below 50ºC.
f) To balance the total power on both shelves, the blades of two types were distributed between them as you can see in fig. 15.
Fig. 15: Mixed load blades - layout.
ASIS load blade
Comtel load blade
14
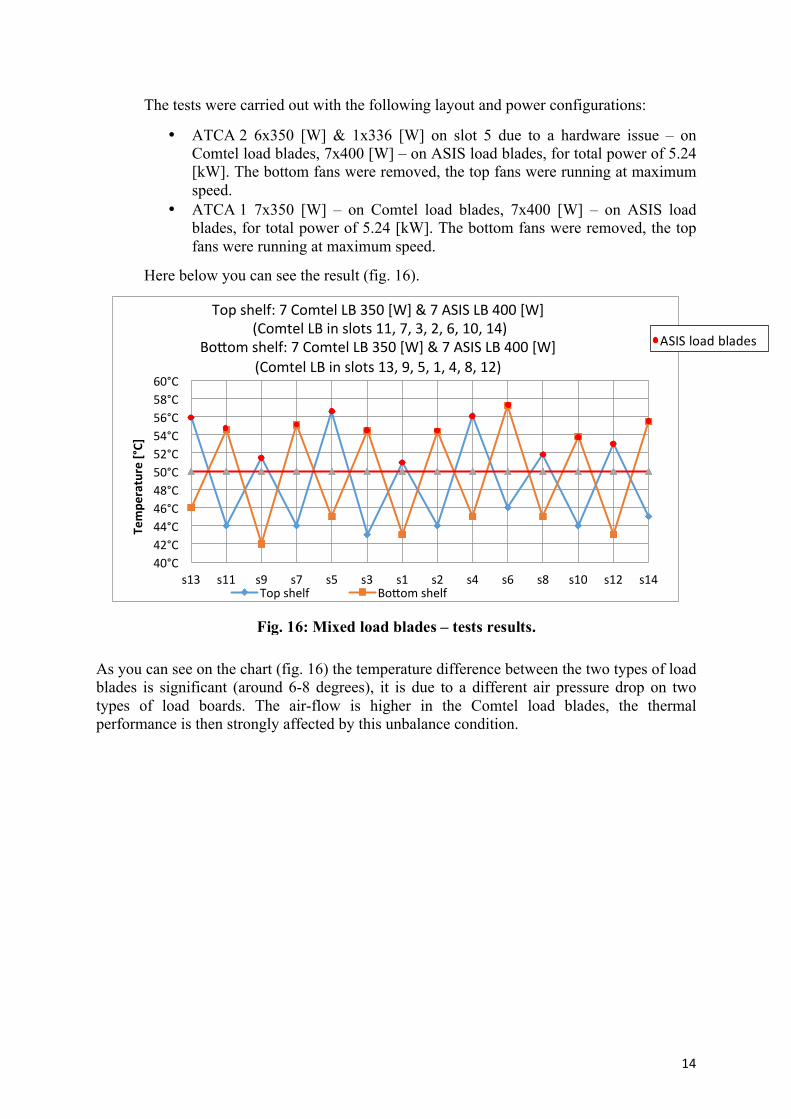
The tests were carried out with the following layout and power configurations:
• ATCA 2 6x350 [W] & 1x336 [W] on slot 5 due to a hardware issue – on Comtel load blades, 7x400 [W] – on ASIS load blades, for total power of 5.24 [kW]. The bottom fans were removed, the top fans were running at maximum speed.
• ATCA 1 7x350 [W] – on Comtel load blades, 7x400 [W] – on ASIS load blades, for total power of 5.24 [kW]. The bottom fans were removed, the top fans were running at maximum speed.
Here below you can see the result (fig. 16).
As you can see on the chart (fig. 16) the temperature difference between the two types of load blades is significant (around 6-8 degrees), it is due to a different air pressure drop on two types of load boards. The air-flow is higher in the Comtel load blades, the thermal performance is then strongly affected by this unbalance condition.
Fig. 16: Mixed load blades – tests results.
40°C42°C44°C46°C48°C50°C52°C54°C56°C58°C60°C
s13 s11 s9 s7 s5 s3 s1 s2 s4 s6 s8 s10 s12 s14
Tempe
rature[°C]
Topshelf:7ComtelLB350[W]&7ASISLB400[W](ComtelLBinslots11,7,3,2,6,10,14)
BoWomshelf:7ComtelLB350[W]&7ASISLB400[W](ComtelLBinslots13,9,5,1,4,8,12)
Topshelf BoWomshelf
ASISloadblades

15
HORIZONTAL COOLING RESULTS
To test the horizontal cooling system, the rack was equipped with two shelves (fig. 17). It was also equipped with several sensors to measure air velocity, air temperature and water temperature. With the horizontal configuration the air is released to the room, in order to prevent any increase of temperature on the environment a cooling door was installed on the back side of the rack (fig. 18). The cooling door is provided with an internal water circuit that remove the heat from the air which is going through the door; the released temperature of the air in the room is lower. Since in this layout heat exchangers were not used, the water inlet/outlet were connected only to the cooling door. Here below you can see the schematic view of the rack equipped with all the components and the sensors positions are underlined (fig. 17).
Fig. 17: Horizontal cooling layout.
Fig. 18: Cooling door.
The cooling door provides nominally up to 14 kW of thermal capacity (data taken from the specifications given by the supplier as you can see in tab. 2). Depending on water temperature inlet and outlet, and also on water flow - the door can perform differently.

16
Water T° inlet/outlet
(°C)
Water flow (m3/h)
Power (kW)
13/18 2.4 14
Tab. 2: Cooling door specification.
During the tests it was measured the water flow and the relevant inlet and outlet temperatures. Using these parameters it is possible to calculate the heat removed by the water flow using equation (1), m is the mass flow in kg/s, Cp is the specific heat capacity of water that is 4,186 kJ/(kg K) and Tin and Tout are the inlet/outlet water temperatures measured in Kelvin. Here below you can see the results of the thermal behaviour of the water circuit during a full load test on 2 shelves that corresponds to a 14.1 kW of power dissipated by the shelves, top and bottom fans included (fig. 19).
Fig. 19: Measurements the water inlet and outlet temperatures.
• Flow: 1.8 [m3/h] • T inlet 16 C, T outlet 18.6 C
𝑄 = 𝑚𝐶! 𝑇!"# − 𝑇!" = 0.5×4.18× 18.6− 16 = 5.43𝑘𝑊 (1)
As you can see, during this test, the real cooling door capacity was around 39% of its nominal value. The reasons of such inefficiency could be the following:
• Inlet water temperature was 3 K higher than the specifications. • The water flow was lower than the nominal one which should be 2.4 [m3/h].

17
Fig. 20: Measurements of the cooling door inlet and outlet temperatures.
Fig. 21: Measurements of the shelves air temperature inlet and outlet.
As already mentioned the important parameter that must be considered with the horizontal cooling layout is the air temperature release to the environment. The measured outlet temperature was about 2.5 K higher than the average inlet air temperature which was about 19°C (fig. 21). In case the counting room in the service cavern would be equipped with several racks the room cooling system could not be enough powerful to maintain the environmental conditions constant. To assess cooling capacity of the rack equipped with horizontal crates, with and without bottom fan tray working, the tests were carried out with the following conditions:
• ATCA 1 14x350 [W] for total power of 4.9 [kW]. • ATCA 2 14x350 [W] for total power of 4.9 [kW].

18
s13 s11 s09 s07 s05 s03 s01 s02 s04 s06 s08 s10 s12 s14Zone2 36,940,838,9 35 36 35,635,832,735,137,938,239,436,738,1Zone4 36,537,836,836,233,932,934,535,235,534,433,436,737,636,1Zone2WOUTBF 41,541,540,937,739,538,236,934,838,139,938,339,640,243,7Zone4WOUTBF 38,739,337,439,536,536,136,3 35 36,736,735,135,938,741,6Inlet1 21 21 21 20 21 21 21 21 21 22 23 23 22 23InletWOUTBF 21 19 19 19 19 20 20 20 20 20 20 21 22 23
15°C20°C25°C30°C35°C40°C45°C50°C55°C60°C
Tempe
rature[°C]
MeasurementsofthemaximumAIRtemperatures
As you can see on the chart (fig. 22), the temperatures of the blades in the tests, without bottom fans were lower and more homogenous than the ones where they were operative.
Fig. 23: Measurements of the maximum air temperatures.
As you can see on the chart (fig. 23) the air temperatures measured without bottom fans are higher because the air distribution is more homogeneous and the cooling is more effective.
s13s11 s09s07 s05s03s01s02s04 s06s08s10s12s14Zone4 50 54 45 41 44 52 52 46 38 43 50 54 42 42Zone4WOUTBF 49 45 45 45 46 44 44 43 44 47 44 44 43 46
15°C20°C25°C30°C35°C40°C45°C50°C55°C60°C
Tempe
rature[°C]
MeasurementsofthemaximumboardstemperaturesonLBtype1
Fig. 22: Horizontal shelf – maximum temperature on load blades type 1.

19
COMPARISON BETWEEN HORIZONTAL AND VERTICAL LAYOUTS
Summarizing the results obtained so far you can see in figures 24 and 25 the comparison of the boards temperatures installed in the top shelf and the ASIS one on the bottom.
Figure 24 shows the maximum values of the Comtel LB so the board temperatures in case of vertical cooling (green square dots) and in horizontal configuration (yellow diamond dots); the power applied to the boards were 343W each. In vertical configuration the ASIS boards on the bottom were powered with 322W each, these values were lower slightly lower the nominal because of a limitation give by the power supply.
Fig. 24: Comparison of the maximum boards temperature in horizontal (350W for ASIS
LB and Comtel) and vertical (322 W for ASIS LB and 343W for Comtel LB) layouts.
Fig. 25: Comparison of the maximum air temperature in horizontal (350W for ASIS LB
and Comtel) and vertical (322 W for ASIS LB and 343W for Comtel LB) layouts.

20
Figure 25 instead regards the air temperatures measured on the bottom shelf equipped with the ASIS boards in the same tests. The horizontal tests were carried out with all the blades at 350W.
Despite the nominal power applied to the boards the horizontal configuration looks more promising than the vertical one, in fact during the high power tests, in some slots equipped with the Comtel LB, the temperatures exceeded slightly the maximum value of 50 C as shown in fig. 14, anyway these values can be considered acceptable. The horizontal layout shows temperatures around 45C but slot 13, the air temperature released to the environment in this configuration could become an issue if the rack cooling door is not performing according to the specifications. In order to mitigate the problem a colder inlet temperature of the water could be a feasible solution.
NOISE MEASUREMENTS
Since the beginning of the test campaign it was known that both, horizontal and vertical cooling systems, are very noisy. The HSE group carried out a measurements in USA15 (see the location in fig 24) the following configurations:
• Two horizontal shelves with the top and bottom fans working at 75% of the maximum speed (fig. 25a),
• Two vertical shelves with the top and bottom fans working at maximum speed (fig. 25b),
• Two vertical shelves with only the top fans working at maximum speed (fig. 25c).
Fig. 24: Noisy level measurements layout.
a) b) c)
Fig. 25: Noisy level measurements.

21
The results of the measurement are summarized in fig. 25. The noisy level, is exceeding the safety level. Above 85 [dB] some measures must be taken to allow people to work close to the rack (i.e. ears protection, safety trainings). In additions, considering that every time that the number of noisy equipment is doubling, the noisy level increases by 3 [dB]. The HSE expert advised the ATLAS technical coordinator to install noisy insolation panels or similar infrastructures to reduce the noise and the risks for the operators.
CONCLUSIONS
Both horizontal and vertical cooling schemes can maintain the backend electronics at acceptable temperature levels. Since both layouts have some pros and cons that must be considered before selecting the most promising solution on the long term for the upgrades of data acquisition electronic equipment of ATLAS. Here below you can see the table were the main conclusions are shown (tab. 3).
HORIZONTAL VERTICAL Use of COTS xTCA shelves Custom xTCA shelves mandatory (related NRE costs
and potential higher lead-time) Sufficient cooling capacity available per rack (up to
15kW per cooling door with water inlet at 13C, actual 16C)
Limited heat-exchanger efficiency (2/3 of surface capacity resulting in 2kW cooling power)
Heat of 48V AC-DC removed by the rack rear cooling door
48V AC-DC converter (horizontally cooled) must be placed outside of vertical airflow (below the
deflector and its cooling must rely on the CR AC) Less damage risk in case of water leak from the heat
exchanger Risk of water dripping on the ATCA electronic
Independent shelf airflow (one shelf could be turned OFF while the other is loaded)
Cross shelf airflow dependency (in case one shelf is stopped the other sees a high airflow resistance). Can
lead to potential electronics overheating Racks has to be modified and equipped with rear
cooling doors Reuse of the rack (horizontal heat exchangers and
deflectors may have to be repositioned) In-rack smoke detection must be adapted for rear-
cooling doors Reuse of the existing rack infrastructure (smoke
detection, monitoring and control) Front and back cabling must be managed
appropriately in order not to obstruct the air inlet and outlet
Free access to both sides of the shelf
Some racks are currently equipped with a full height glass front door. It is not know yet if such doors can
be used with horizontal airflow
Racks can be closed with doors
Higher level of noise Also noisy… Easier to install sound absorbing material
Tab. 3: Horizontal and vertical cooling – pros and cons.
The most important points of the vertical layout are:
• There is no need of changing existing rack infrastructure (such as smoke detection system and DCS), since they are already in place.
• The air circulation in the vertical cooled rack is nearly a closed volume so there is no impact on the room temperature.
• The shelves are strongly dependant on each other – in case of the failure of one of the shelves, the second one is affected.
• There is quite a big risk of flooding the ATCA electronics in case of water leakage – due to the position of the heat exchangers (directly above the ATCA shelves).

22
The most important points of the horizontal layout are:
• The shelves are independent so in case of failure of one of them, the second one is not affected.
• The horizontal cooled rack is a commercial solution, so in the future there is a possibility of upgrading the rack.
• The smoke detection system and the DCS must be adapted to the new rack layout. • The air temperature outlet from cooling doors is about 2.5 K higher than the room
temperature, which can strongly affect the working environment, if the room will be equipped with several racks.
[1] M. Di Cosmo et al., “Evaluation results of xTCA equipment for HEP experiments at CERN” – TWEPP 2013 Perugia (Italy) [2] Test report – ASIS custom ATCA crate https://espace.cern.ch/ph-dep-ESE-BE-ATCAEvaluationProject/SitePages/Home.aspx [3] COMTEL ATCA Load Boards, http://www.comtel-online.com/index.php/products/atca/atca-test-blades. [4] http://www.itsirl.com/pt100theory.php [5]http://www.degreec.com/en/download-center.raw?task=callelement&item_id=36&element=f85c494b-2b32-4109-b8c1-083cca2b7db6&method=download [6]http://www.asis-pro.com/atca-systems/600W-Load-Blade