Embed Size (px)
Citation preview
U.S. Department of the InteriorU.S. Geological Survey
Scientific Investigations Report 2008–5152
Prepared in cooperation with the National Park Service
Atmospheric Deposition and Surface-Water Chemistry in Mount Rainier and North Cascades National Parks, U.S.A., Water Years 2000 and 2005–2006

Cover photograph: Lake Louise from Tatoosh Range, looking northeast by Rebecca A. Lofgren and Stefan Lofgren.
Atmospheric Deposition and Surface-Water Chemistry in Mount Rainier and North Cascades National Parks, U.S.A., Water Years 2000 and 2005–2006
By David W. Clow and Donald H. Campbell
Prepared in cooperation with the National Park Service
Scientific Investigations Report 2008–5152
U.S. Department of the InteriorU.S. Geological Survey
U.S. Department of the InteriorDIRK KEMPTHORNE, Secretary
U.S. Geological SurveyMark D. Myers, Director
U.S. Geological Survey, Reston, Virginia: 2008
For product and ordering information: World Wide Web: http://www.usgs.gov/pubprod Telephone: 1-888-ASK-USGS
For more information on the USGS--the Federal source for science about the Earth, its natural and living resources, natural hazards, and the environment: World Wide Web: http://www.usgs.gov Telephone: 1-888-ASK-USGS
Any use of trade, product, or firm names is for descriptive purposes only and does not imply endorsement by the U.S. Government.
Although this report is in the public domain, permission must be secured from the individual copyright owners to reproduce any copyrighted materials contained within this report.
Suggested citation:Clow, D.W., and Campbell, D.H., 2008, Atmospheric deposition and surface-water chemistry in Mount Rainier and North Cascades National Parks, U.S.A., water years 2000 and 2005–2006: U.S. Geological Survey Scientific Investigations Report 2008–5152, 37 p.
iii
Contents
Abstract ...........................................................................................................................................................1Introduction.....................................................................................................................................................2
Purpose and Scope ..............................................................................................................................2Study Approach.....................................................................................................................................2Regional Characteristics .....................................................................................................................4Site Characterization ............................................................................................................................5
Methods...........................................................................................................................................................6Wet- and Dry-Deposition Sampling ...................................................................................................6Bulk Deposition Sampling ...................................................................................................................6Snowpack Sampling .............................................................................................................................6Water Sampling and Analyses ...........................................................................................................6Laboratory Methods and Quality Assurance ...................................................................................7Hydrologic Data Collection .................................................................................................................7Statistical Analyses ..............................................................................................................................7
Meteorologic and Hydrologic Conditions During Study ..........................................................................8Precipitation...........................................................................................................................................8Streamflow .............................................................................................................................................8
Atmospheric Deposition of Inorganic Nitrogen and Sulfur ....................................................................9Spatial and Temporal Patterns in Wet Deposition and Emissions ................................................9Bulk Deposition at Paradise ..............................................................................................................13Snowpack Chemistry..........................................................................................................................13Dry Deposition .....................................................................................................................................14
Surface-Water Chemistry ...........................................................................................................................17Volume-Weighted Mean Solute Concentrations ...........................................................................17Seasonal Patterns in Surface-Water Chemistry ...........................................................................17Hydrogeochemical Processes Controlling Surface-Water Chemistry ......................................24Response of Surface-Water Chemistry to Storms ........................................................................25Comparison of Solute Concentrations at Eunice Lake in 2000 and 2005–2006 .........................27
Synthesis of Historical Lake-Chemistry Data ..........................................................................................28Data Sets ..............................................................................................................................................28Lake Characteristics...........................................................................................................................28Acidification Status and Sensitivity .................................................................................................28Geochemical Processes Influencing Lake Chemistry ..................................................................30Nutrient Concentrations ....................................................................................................................30Trophic Status ......................................................................................................................................30Nutrient Limitation ..............................................................................................................................33
Summary and Conclusions .........................................................................................................................34Acknowledgments .......................................................................................................................................35References Cited..........................................................................................................................................35
iv
Figures
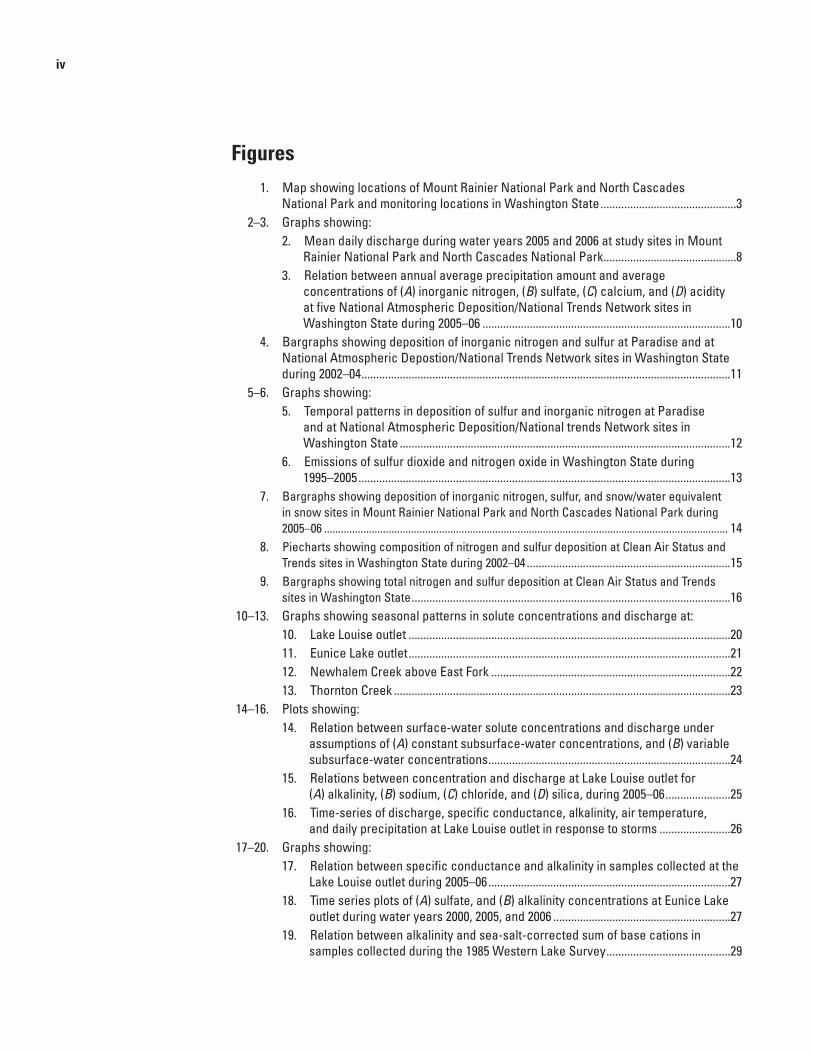
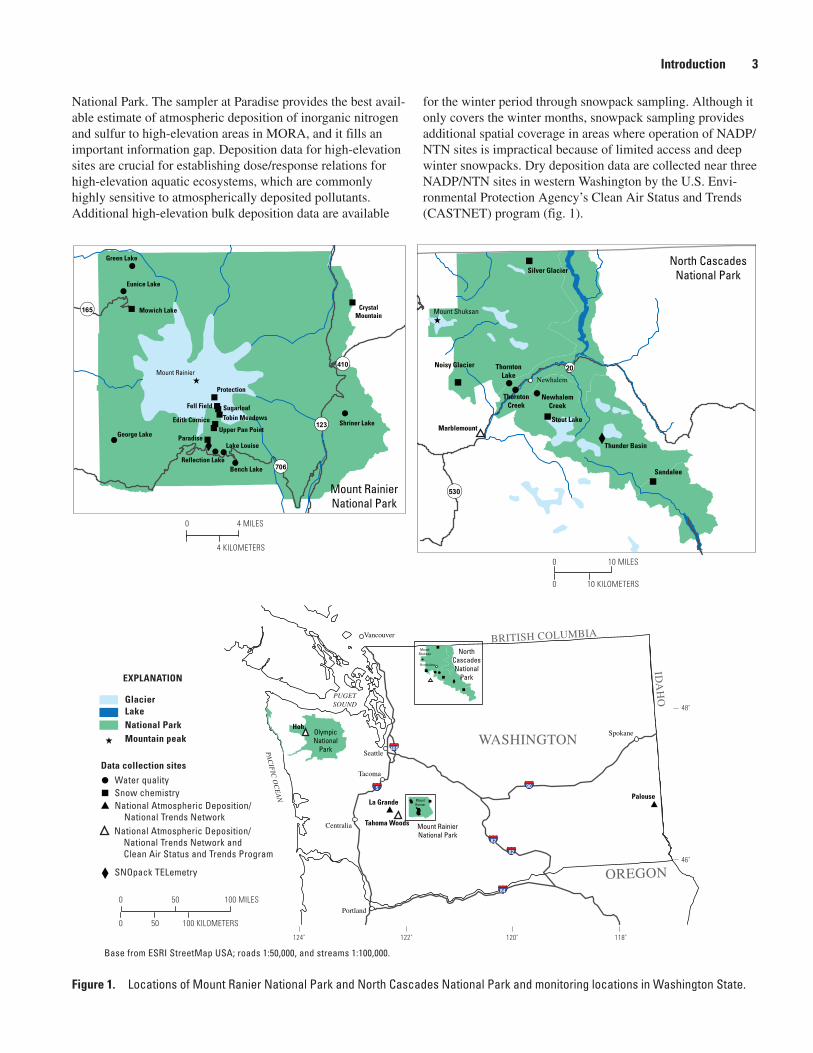
1. Map showing locations of Mount Rainier National Park and North Cascades National Park and monitoring locations in Washington State ..............................................3
2–3. Graphs showing: 2. Mean daily discharge during water years 2005 and 2006 at study sites in Mount
Rainier National Park and North Cascades National Park .............................................8 3. Relation between annual average precipitation amount and average
concentrations of (A) inorganic nitrogen, (B) sulfate, (C) calcium, and (D) acidity at five National Atmospheric Deposition/National Trends Network sites in Washington State during 2005–06 ....................................................................................10
4. Bargraphs showing deposition of inorganic nitrogen and sulfur at Paradise and at National Atmospheric Depostion/National Trends Network sites in Washington State during 2002–04 .............................................................................................................................11
5–6. Graphs showing: 5. Temporal patterns in deposition of sulfur and inorganic nitrogen at Paradise
and at National Atmospheric Deposition/National trends Network sites in Washington State ................................................................................................................12
6. Emissions of sulfur dioxide and nitrogen oxide in Washington State during 1995–2005 ..............................................................................................................................13
7. Bargraphs showing deposition of inorganic nitrogen, sulfur, and snow/water equivalent in snow sites in Mount Rainier National Park and North Cascades National Park during 2005–06 ................................................................................................................................................ 14
8. Piecharts showing composition of nitrogen and sulfur deposition at Clean Air Status and Trends sites in Washington State during 2002–04 .....................................................................15
9. Bargraphs showing total nitrogen and sulfur deposition at Clean Air Status and Trends sites in Washington State ............................................................................................................16
10–13. Graphs showing seasonal patterns in solute concentrations and discharge at: 10. Lake Louise outlet .............................................................................................................20 11. Eunice Lake outlet .............................................................................................................21 12. Newhalem Creek above East Fork .................................................................................22 13. Thornton Creek ..................................................................................................................23 14–16. Plots showing: 14. Relation between surface-water solute concentrations and discharge under
assumptions of (A) constant subsurface-water concentrations, and (B) variable subsurface-water concentrations ..................................................................................24
15. Relations between concentration and discharge at Lake Louise outlet for (A) alkalinity, (B) sodium, (C) chloride, and (D) silica, during 2005–06 ......................25
16. Time-series of discharge, specific conductance, alkalinity, air temperature, and daily precipitation at Lake Louise outlet in response to storms ........................26
17–20. Graphs showing: 17. Relation between specific conductance and alkalinity in samples collected at the
Lake Louise outlet during 2005–06 ..................................................................................27 18. Time series plots of (A) sulfate, and (B) alkalinity concentrations at Eunice Lake
outlet during water years 2000, 2005, and 2006 ............................................................27 19. Relation between alkalinity and sea-salt-corrected sum of base cations in
samples collected during the 1985 Western Lake Survey ..........................................29
v
20. Variations in nitrate and total phosphorus concentrations and annual precipitation at Mount Rainier National Park lakes over time, 1988–2004 .............31
21. Bargraph showing trophic status of lakes in Mount Rainier National Park and North Cascades National Park based on trophic state index .............................................32
22. Box and whisker plot showing variations in distribution of trophic state index based on total phosphorus (TSI[TP]) over time at lakes in Mount Rainier National Park ..............................................................................................................................32
23. Bargraph showing percentage of lakes in Mount Rainier National Park, North Cascades National Park, and in North Cascades region limited by phosphorus, nitrogen plus phosphorus, and nitrogen .................................................................................33
24. Graph showing relation between dissolved organic nitrogen:total phosphorus (DIN:TP) and trophic state index based on total phosphorus (TSI[TP]) in samples from Mount Rainier National Park, North Cascades National Park, and in North Cascades region ........................................................................................................................34
Tables
1. Site characteristics for surface-water monitoring sites in Mount Rainier and North Cascades National Parks ............................................................................................................5
2. Average annual volume-weighted mean concentrations in wet deposition during 2000–05 at National Atmospheric Deposition Program/National Trends Network sites in Washington State............................................................................................................9
3. Solute concentrations in surface water at study sites, 2005–06 water years .................18 4. Average solute concentrations during lake surveys in Mount Rainier National
Park (MORA) and North Cascades National Park (NOCA) ..................................................19
vi
Conversion Factors
Inch/Pound to SI
Multiply By To obtain
Length
inch (in.) 2.54 centimeter (cm)
foot (ft) 0.3048 meter (m)
mile (mi) 1.609 kilometer (km)
Area
acre 0.4047 hectare (ha)
acre 0.004047 square kilometer (km2)
square mile (mi2) 259.0 hectare (ha)
square mile (mi2) 2.590 square kilometer (km2)
Volume
ounce, fluid (fl. oz) 0.02957 liter (L)
pint (pt) 0.4732 liter (L)
quart (qt) 0.9464 liter (L)
gallon (gal) 3.785 liter (L)
gallon (gal) 0.003785 cubic meter (m3)
cubic foot (ft3) 0.02832 cubic meter (m3)
cubic yard (yd3) 0.7646 cubic meter (m3)
acre-foot (acre-ft) 1,233 cubic meter (m3)
Flow rate
acre-foot per day (acre-ft/d) 0.01427 cubic meter per second (m3/s)
cubic foot per second (ft3/s) 0.02832 cubic meter per second (m3/s)
million gallons per day (Mgal/d) 0.04381 cubic meter per second (m3/s)
Mass
pound, avoirdupois (lb) 0.4536 kilogram (kg)
Temperature in degrees Celsius (°C) may be converted to degrees Fahrenheit (°F) as follows:
°F=(1.8×°C)+32
Temperature in degrees Fahrenheit (°F) may be converted to degrees Celsius (°C) as follows:
°C=(°F–32)/1.8
Altitude, as used in this report, refers to distance above the vertical datum.
Vertical coordinate information is referenced to the North American Vertical Datum of 1988 (NAVD 88).
Specific conductance is given in microsiemens per centimeter at 25 degrees Celsius (µS/cm at 25°C).
Water year, as used in this report, refers to the period October 1 through September 30 and is designated by the year in which it ends.
vii
Abreviations, acronyms, and symbols used in this report
DIN dissolved inorganic nitrogen
MORA Mount Rainier National Park
NAD83 North American Datum of 1983
NADP/NTN National Atmospheric Deposition Program/National Trends Network
NOCA North Cascades National Park
NPS National Park Service
NRCS Natural Resources Conservation Service
PCA Principal Components Analysis
PNW Pacific Northwest
SNOTEL SNOpack TELemetry
SWE snow/water equivalent
TP total phosphorus
TSI Trophic Status Index
USGS U.S. Geological Survey
VWM volume-weighted mean
WACAP Western Airborne Contaminants Assessment Project
cm centimeters
ha hectares
m meters
nm nanometers
kg/ha kilograms per hectare
mg/L milligrams per liter
µeq/L microequivalents per liter
µg/L micrograms per liter
µmol/L micromoles per liter
µS/cm microsiemens per centimeter
°C degrees Celsius
< less than
> greater than
≤ less than or equal to
± plus or minus

Abstract
High-elevation aquatic ecosystems in Mount Rainier and North Cascades National Parks are highly sensitive to atmo-spheric deposition of nitrogen and sulfur. Thin, rocky soils promote fast hydrologic flushing rates during snowmelt and rain events, limiting the ability of basins to neutralize acidity and assimilate nitrogen deposited from the atmosphere. Poten-tial effects of nitrogen and sulfur deposition include episodic or chronic acidification of terrestrial and aquatic ecosystems. In addition, nitrogen deposition can cause eutrophication of water bodies and changes in species composition in lakes and streams.
This report documents results of a study performed by the U.S. Geological Survey, in cooperation with the National Park Service, of the effects of atmospheric deposition of nitrogen and sulfur on surface-water chemistry in Mount Rainier and North Cascades National Parks. Inorganic nitrogen in wet deposition was highest in the vicinity of North Cascades National Park, perhaps due to emissions from human sources and activities in the Puget Sound area. Sulfur in wet deposition was highest near the Pacific coast, reflecting the influence of marine aerosols. Dry deposition generally accounted for less than 30 percent of wet plus dry inorganic nitrogen and sulfur deposition, but occult deposition (primarily fog) represents a potentially substantial unmeasured component of total deposition. Trend analyses indicate inorganic nitrogen in wet deposition was relatively stable during 1986–2005, but sulfur in wet deposition declined substantially during that time, par-ticularly after 2001, when emissions controls were added to a large powerplant in western Washington. Surface-water sulfate concentrations at the study site nearest the powerplant showed a statistically significant decrease between 2000 and 2005–06, but there was no statistically significant change in alkalinity, indicating a delayed response in surface-water alkalinity.
Seasonal patterns in surface-water chemistry and stream-flow are strongly influenced by melting of seasonal snow-packs, which release large amounts of dilute, slightly acidic water to terrestrial and aquatic ecosystems during spring
snowmelt. Concentrations of sulfate, alkalinity, and base cations in surface water declined rapidly during snowmelt, then gradually recovered during summer and fall. Preferential elution of acidic solutes from the snowpack at the beginning of snowmelt may cause episodic acidification in small alpine streams; evidence is provided by a stream sample collected at one of the sites during spring 2006 that was acidic (pH = 4.8, alkalinity = –18 microequivalents per liter) and had high concentrations of nitrate and sulfate and low concentrations of weathering products. Rain-on-snow events caused sharp declines in specific conductance, which was measured con-tinuously using an in-stream sensor. A strong correlation was observed between measured specific conductance and mea-sured alkalinity (r2 = 0.76), permitting estimation of alkalinity from specific-conductance data using a regression equation. Estimated alkalinity declined by an order of magnitude during the rain-on-snow events, in one case to 8 microequivalents per liter. Actual declines in alkalinity might be greater because the regression equation accounts only for dilution effects; at low concentrations, the relation between specific conductance and alkalinity is likely to be nonlinear and have a negative intercept (negative alkalinity). Thus, episodic acidification is possible during rain-on-snow events. The scale of episodic acidification is unknown, but if it occurs, it could have detri-mental effects on aquatic life and amphibians.
Historical lake-survey data indicate that most lakes are oligotrophic and have low nitrogen and phosphorus concentra-tions. Nitrogen limitation is more common in lakes in Mount Rainier National Park than in North Cascades National Park due to higher nitrate concentrations at North Cascades. The slightly higher surface-water nitrate concentrations at North Cascades National Park are consistent with higher inorganic nitrogen deposition that occurs there relative to Mount Rainier National Park. Nitrogen fixation associated with red alders may be an additional source of nitrogen to low-elevation streams in North Cascades National Park. Future monitoring for effects of atmospheric deposition of nitrogen in the parks needs to focus on high-elevation ecosystems to avoid the con-founding effects of nitrogen fixation by alders.
Atmospheric Deposition and Surface-Water Chemistry in Mount Rainier and North Cascades National Parks, U.S.A., Water Years 2000 and 2005–2006
By David W. Clow and Donald H. Campbell
2 Atmospheric Deposition and Surface-Water Chemistry in Mount Rainier and North Cascades National Parks, USA
Introduction
High-elevation aquatic ecosystems in national parks in the Pacific Northwest are sensitive to atmospheric deposition of pollutants, such as sulfur and nitrogen compounds, for several reasons. Alpine and subalpine soils have little ability to neu-tralize acidic deposition or assimilate atmospherically depos-ited nitrogen because the soils typically are thin and poorly developed, bedrock is resistant to weathering, and vegetation is sparse (Campbell and others, 1995). In addition, alpine/subal-pine areas receive abundant precipitation, which moves quickly through the coarse soils. These characteristics allow pollutants to reach aquatic ecosystems with little alteration, particularly during periods of snowmelt, when hydrologic flushing rates are high (Clow and Sueker, 2000).
Sulfur and nitrogen compounds are emitted into the atmosphere from a variety of anthropogenic activities, with a range of environmental consequences that are summarized by the U.S. Environmental Protection Agency (2001). Sulfur dioxide is released primarily by coal-burning powerplants and is a major component of acidic deposition. Nitrogen oxide and ammonia also can be important contributors to acidic deposi-tion. Nitrogen oxide emissions are primarily from vehicle exhaust and powerplants fired by coal and natural gas. Ammo-nia emissions are derived mainly from agricultural activities, such as livestock and crop production. Sulfur dioxide and nitrous oxide undergo chemical reactions in the atmosphere to form acidifying compounds, such as sulfuric acid and nitric acid. When deposited on terrestrial and aquatic ecosystems, these compounds reduce soil and surface water pH, with potential adverse effects on sensitive plants and aquatic species. Most ammonia (NH
3) emissions are converted to ammonium
(NH4+) in the atmosphere, which in turn undergoes conversions
in terrestrial ecosystems that can generate acidity (Stoddard, 1994). Nitrogen compounds also act as nutrients that can contribute to eutrophication of aquatic ecosystems, leading to changes in water chemistry and species composition in lakes and streams (Aber and others, 1989; Stoddard, 1994). Nitrous oxide emissions contribute to the formation of ground-level ozone, which is the primary constituent of smog (U.S. Environ-mental Protection Agency, 2001). High concentrations of ozone can impair lung function in humans and can damage leaves and needles of sensitive plant species. Additionally, sulfate and nitrate aerosols form particulates that are major components of regional haze, which impairs visibility and is an important concern in national parks and wilderness areas (National Park Service, 2002).
The State of Washington has three national parks and five wilderness areas classified as Class 1 under the Clean Air Act of 1977. The Clean Air Act and amendments stipulate that Class 1 areas receive the highest level of air-quality protection (National Park Service, 2002). State air-quality agencies and the U.S. Environmental Protection Agency are responsible for evaluating proposed new emissions sources to determine whether they might affect air-quality-related values in Class 1
areas, and if so, require that the best available control technol-ogy be used to limit emissions.
Federal land managers, such as the National Park Service and USDA Forest Service, have no direct control on permit requests but are important in the decisionmaking process, pro-viding monitoring and assessment data to the regulatory agen-cies. They need information from scientific assessments of the possible effects of new emissions sources on soils, vegetation, and visibility in order to make sound recommendations on permit applications.
Air-quality-related values are being affected at Mount Rainier National Park (MORA) and North Cascades National Park (NOCA), which receive air pollution from local, regional, and possibly global sources (National Park Service, 2002). Local and regional sources include vehicles, powerplants, and industrial facilities in the Puget Sound area, which includes the cities of Seattle, Tacoma, and Vancouver in Washing-ton and Portland in Oregon. Visibility impairment and high ozone concentrations have been documented at MORA and at NOCA; ozone concentrations showed a statistically significant increase between 1996 and 2005 (www2.nature.nps.gov/air/Pubs/pdf/gpra/GPRA_AQ_ConditionsTrendReport2006.pdf, accessed December 2007). Both of the parks have lakes and streams considered highly sensitive to atmospheric deposition of pollutants, and some lakes have acid-neutralizing capacities of less than 50 microequivalents per liter (µeq/L) (Larson and others, 1994; Larson and others, 1999).
In 2005, the U.S. Geological Survey (USGS), in coopera-tion with the National Park Service, began a study with the objective of assessing potential effects of atmospheric depo-sition of nitrogen and sulfur on surface-water chemistry in Mount Rainier and North Cascades National Parks.
Purpose and Scope
The purpose of this report is to (1) describe spatial and temporal patterns in atmospheric deposition of nitrogen and sulfur in Mount Rainier and North Cascades National Parks, (2) describe seasonal responses of surface-water chemistry to atmospheric-deposition inputs at two sites in each park, with special focus on the snowmelt period, and (3) review histori-cal lake-survey data in the context of possible influences of nitrogen and sulfur deposition on surface-water chemistry in the parks.
Study Approach
A combination of wet-, bulk-, and dry-deposition moni-toring data was used to characterize atmospheric deposition of nitrogen and sulfur. Wet-deposition data were collected at five low-elevation sites in Washington during 2000–05 through the National Atmospheric Deposition/National Trends Network (NADP/NTN) (fig. 1). To obtain data at high elevation, the National Park Service operates a bulk-deposition monitoring site at Paradise (elevation 1,560 m, fig. 1) in Mount Rainier
Introduction 3
National Park. The sampler at Paradise provides the best avail-able estimate of atmospheric deposition of inorganic nitrogen and sulfur to high-elevation areas in MORA, and it fills an important information gap. Deposition data for high-elevation sites are crucial for establishing dose/response relations for high-elevation aquatic ecosystems, which are commonly highly sensitive to atmospherically deposited pollutants. Additional high-elevation bulk deposition data are available
for the winter period through snowpack sampling. Although it only covers the winter months, snowpack sampling provides additional spatial coverage in areas where operation of NADP/NTN sites is impractical because of limited access and deep winter snowpacks. Dry deposition data are collected near three NADP/NTN sites in western Washington by the U.S. Envi-ronmental Protection Agency’s Clean Air Status and Trends (CASTNET) program (fig. 1).
Glacier
EXPLANATION
LakeNational ParkMountain peak
Data collection sites
Water qualitySnow chemistryNational Atmospheric Deposition/ National Trends Network
SNOpack TELemetry
National Atmospheric Deposition/ National Trends Network and Clean Air Status and Trends Program
Base from ESRI StreetMap USA; roads 1:50,000, and streams 1:100,000.
MountRainier
MountShuksan North
CascadesNational
Park
OlympicNational
Park
Mount RainierNational Park
Portland
Centralia
Newhalem
Tacoma
Seattle
Spokane
La GrandePalouse
Hoh
Mount Rainier
Eunice Lake
Mowich Lake
Protection
Fell Field
Edith Cornice
ParadiseLake Louise
SugarloafTobin Meadows
CrystalMountain
Mount RainierNational Park
Mount Shuksan
Silver GlacierNorth Cascades
National Park
Noisy Glacier
Marblemount
ThorntonCreek
Stout Lake
NewhalemCreek
Thunder Basin
Sandalee
Newhalem
PUGETSOUND
PAC
IFIC
OC
EA
N
BRITISH COLUMBIA
IDA
HO
WASHINGTON
OREGON
0
0
0 10 KILOMETERS
10 MILES
0
0 50 100 KILOMETERS
50 100 MILES
4 KILOMETERS
4 MILES
124˚ 122˚ 120˚ 118˚
46˚
48˚
Vancouver
Tahoma Woods
Upper Pan Point
ThorntonLake
Green Lake
Bench LakeReflection Lake
George Lake
Shriner Lake
Figure 1. Locations of Mount Ranier National Park and North Cascades National Park and monitoring locations in Washington State.
4 Atmospheric Deposition and Surface-Water Chemistry in Mount Rainier and North Cascades National Parks, USA
Meteorologic and hydrologic conditions during the study were compared to long-term averages to provide context for the observed seasonal patterns in surface-water chemistry.
Seasonal responses of surface-water chemistry to atmospheric inputs were characterized by measuring water chemistry and streamflow at two sites in each park during water years 2005 and 2006 (October 2004–September 2006). The sites included two lake outlets in MORA and two stream sites in NOCA; temporary gages were installed at each site to obtain discharge data. Site selection was based on the follow-ing criteria: (1) availability of historical data, (2) anticipated sensitivity to atmospheric deposition of pollutants, as indicated by low surface-water specific conductivity, and (3)access. Water-quality data for the four study sites are stored in the USGS National Water Information System (NWIS) database (http://waterdata.usgs.gov/nwis/qw, accessed March 2008).
The historical data used in this study were obtained from a lake-water chemistry database containing data from the 1985 Western Lake Survey (http://www.epa.gov/emap2/html/data/surfwatr/data/wls.html/, accessed January 2008), unpublished surface-water chemistry databases maintained by the NPS, and statistical summaries of lake chemistry published in journal articles and USGS reports.
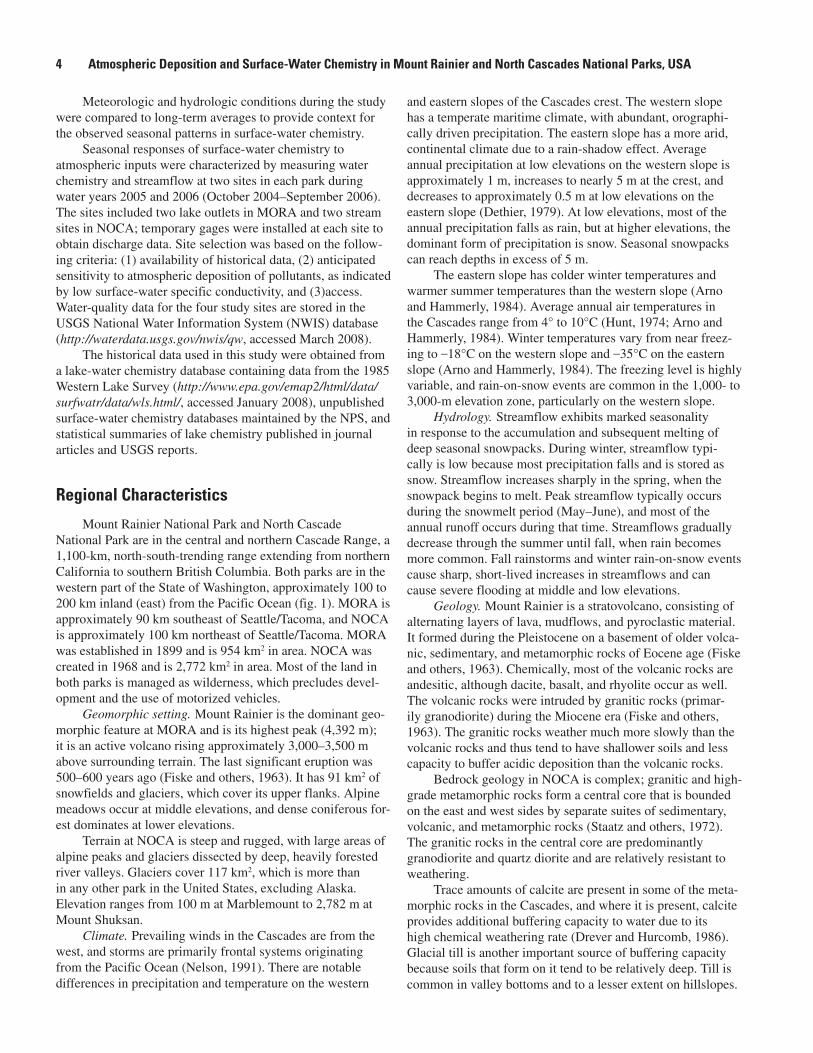
Regional Characteristics
Mount Rainier National Park and North Cascade National Park are in the central and northern Cascade Range, a 1,100-km, north-south-trending range extending from northern California to southern British Columbia. Both parks are in the western part of the State of Washington, approximately 100 to 200 km inland (east) from the Pacific Ocean (fig. 1). MORA is approximately 90 km southeast of Seattle/Tacoma, and NOCA is approximately 100 km northeast of Seattle/Tacoma. MORA was established in 1899 and is 954 km2 in area. NOCA was created in 1968 and is 2,772 km2 in area. Most of the land in both parks is managed as wilderness, which precludes devel-opment and the use of motorized vehicles.
Geomorphic setting. Mount Rainier is the dominant geo-morphic feature at MORA and is its highest peak (4,392 m); it is an active volcano rising approximately 3,000–3,500 m above surrounding terrain. The last significant eruption was 500–600 years ago (Fiske and others, 1963). It has 91 km2 of snowfields and glaciers, which cover its upper flanks. Alpine meadows occur at middle elevations, and dense coniferous for-est dominates at lower elevations.
Terrain at NOCA is steep and rugged, with large areas of alpine peaks and glaciers dissected by deep, heavily forested river valleys. Glaciers cover 117 km2, which is more than in any other park in the United States, excluding Alaska. Elevation ranges from 100 m at Marblemount to 2,782 m at Mount Shuksan.
Climate. Prevailing winds in the Cascades are from the west, and storms are primarily frontal systems originating from the Pacific Ocean (Nelson, 1991). There are notable differences in precipitation and temperature on the western
and eastern slopes of the Cascades crest. The western slope has a temperate maritime climate, with abundant, orographi-cally driven precipitation. The eastern slope has a more arid, continental climate due to a rain-shadow effect. Average annual precipitation at low elevations on the western slope is approximately 1 m, increases to nearly 5 m at the crest, and decreases to approximately 0.5 m at low elevations on the eastern slope (Dethier, 1979). At low elevations, most of the annual precipitation falls as rain, but at higher elevations, the dominant form of precipitation is snow. Seasonal snowpacks can reach depths in excess of 5 m.
The eastern slope has colder winter temperatures and warmer summer temperatures than the western slope (Arno and Hammerly, 1984). Average annual air temperatures in the Cascades range from 4° to 10°C (Hunt, 1974; Arno and Hammerly, 1984). Winter temperatures vary from near freez-ing to –18°C on the western slope and –35°C on the eastern slope (Arno and Hammerly, 1984). The freezing level is highly variable, and rain-on-snow events are common in the 1,000- to 3,000-m elevation zone, particularly on the western slope.
Hydrology. Streamflow exhibits marked seasonality in response to the accumulation and subsequent melting of deep seasonal snowpacks. During winter, streamflow typi-cally is low because most precipitation falls and is stored as snow. Streamflow increases sharply in the spring, when the snowpack begins to melt. Peak streamflow typically occurs during the snowmelt period (May–June), and most of the annual runoff occurs during that time. Streamflows gradually decrease through the summer until fall, when rain becomes more common. Fall rainstorms and winter rain-on-snow events cause sharp, short-lived increases in streamflows and can cause severe flooding at middle and low elevations.
Geology. Mount Rainier is a stratovolcano, consisting of alternating layers of lava, mudflows, and pyroclastic material. It formed during the Pleistocene on a basement of older volca-nic, sedimentary, and metamorphic rocks of Eocene age (Fiske and others, 1963). Chemically, most of the volcanic rocks are andesitic, although dacite, basalt, and rhyolite occur as well. The volcanic rocks were intruded by granitic rocks (primar-ily granodiorite) during the Miocene era (Fiske and others, 1963). The granitic rocks weather much more slowly than the volcanic rocks and thus tend to have shallower soils and less capacity to buffer acidic deposition than the volcanic rocks.
Bedrock geology in NOCA is complex; granitic and high-grade metamorphic rocks form a central core that is bounded on the east and west sides by separate suites of sedimentary, volcanic, and metamorphic rocks (Staatz and others, 1972). The granitic rocks in the central core are predominantly granodiorite and quartz diorite and are relatively resistant to weathering.
Trace amounts of calcite are present in some of the meta-morphic rocks in the Cascades, and where it is present, calcite provides additional buffering capacity to water due to its high chemical weathering rate (Drever and Hurcomb, 1986). Glacial till is another important source of buffering capacity because soils that form on it tend to be relatively deep. Till is common in valley bottoms and to a lesser extent on hillslopes.
Introduction 5
Soils. Soils in alpine and subalpine areas of the Cascades are predominantly Inceptisols, which are poorly developed soils with low cation-exchange capacity and low base satura-tion (Nelson, 1991). Alpine/subalpine areas that were glaci-ated during the Holocene and late Pleistocene typically have soils that show little profile development and thin organic horizons. They usually are medium to coarse textured, with moderate to high permeability. Talus deposits, which are com-mon at the base of cliffs in alpine areas, have little organic matter, are extremely coarse textured, and have very high permeability.
Forest soils are mostly Ultisols, which are more highly weathered than Inceptisols (Nelson, 1991). Forest soils tend to have higher buffering capacity than alpine/subalpine soils because they are deeper, have well-developed soil profiles with thick organic horizons, and have higher cation-exchange capacities than alpine/subalpine soils.
Vegetation. Treeline in the northern Cascade Moun-tains ranges from approximately 1,400- to 1,900-m elevation (Nelson, 1991). Below treeline, dense forests of Douglas fir (Pseudotsuga menziesii) grow, with lesser western hemlock (Tsuga heterophylla) and western red cedar (Thuja plicata) (Nelson, 1991). In disturbed and riparian areas, maple (Acer macrophyllum), poplar (Populus balsamifera), and red alder (Alnus rubra) grow. Red alder can be a significant source of nitrogen to streams because its roots are a host to an actinomy-cete that fixes atmospheric nitrogen (Edmonds, 1980; Luken and Fonda, 1983).
Near treeline, there is a transition to subalpine and alpine vegetation with increasing elevation. Species on western slopes of the Cascade Range include Pacific silver fir (Abies amabilis), subalpine fir (Abies lasiocarpa), mountain hem-lock (Tsuga mertensiana), and Alaska cedar (Chamaecyparis nootkatensis) (Nelson, 1991). On the drier eastern slopes, white-bark pine (Pinus albicaulis) and Englemann spruce (Picea engelmannii) dominate (Nelson, 1991). Recently deglaciated terrain, talus fields, and bedrock exposures have only sparse vegetation.
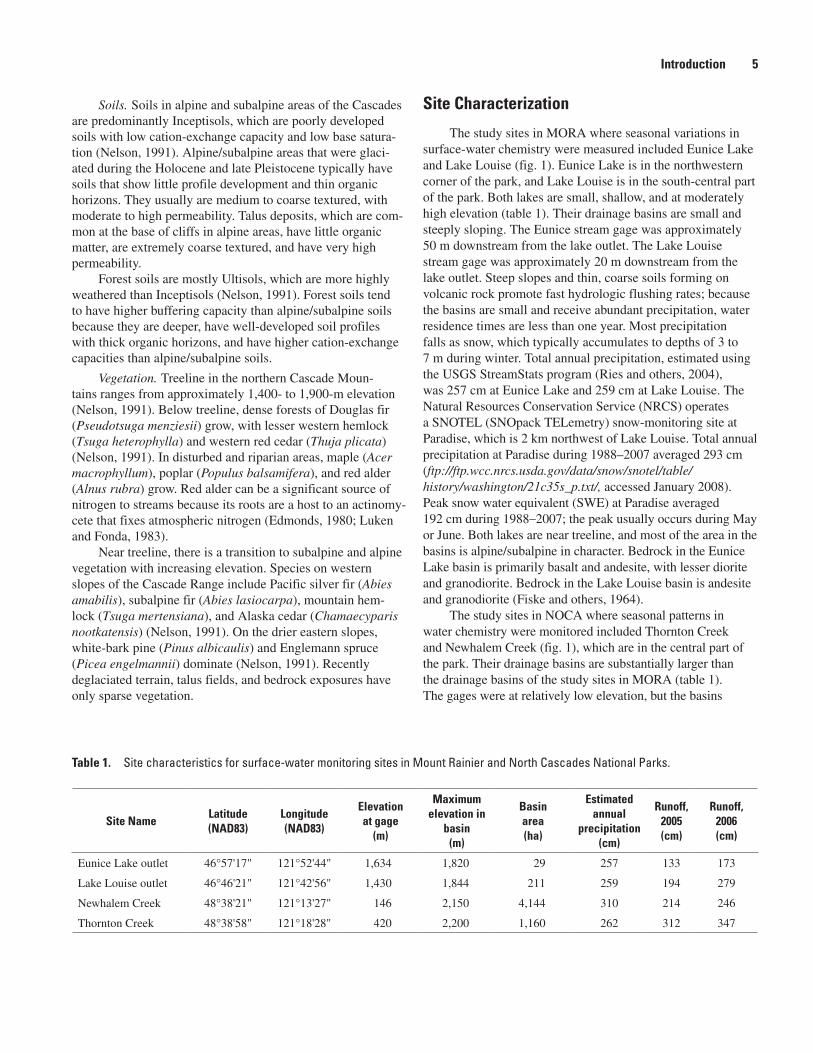
Site Characterization
The study sites in MORA where seasonal variations in surface-water chemistry were measured included Eunice Lake and Lake Louise (fig. 1). Eunice Lake is in the northwestern corner of the park, and Lake Louise is in the south-central part of the park. Both lakes are small, shallow, and at moderately high elevation (table 1). Their drainage basins are small and steeply sloping. The Eunice stream gage was approximately 50 m downstream from the lake outlet. The Lake Louise stream gage was approximately 20 m downstream from the lake outlet. Steep slopes and thin, coarse soils forming on volcanic rock promote fast hydrologic flushing rates; because the basins are small and receive abundant precipitation, water residence times are less than one year. Most precipitation falls as snow, which typically accumulates to depths of 3 to 7 m during winter. Total annual precipitation, estimated using the USGS StreamStats program (Ries and others, 2004), was 257 cm at Eunice Lake and 259 cm at Lake Louise. The Natural Resources Conservation Service (NRCS) operates a SNOTEL (SNOpack TELemetry) snow-monitoring site at Paradise, which is 2 km northwest of Lake Louise. Total annual precipitation at Paradise during 1988–2007 averaged 293 cm (ftp://ftp.wcc.nrcs.usda.gov/data/snow/snotel/table/ history/washington/21c35s_p.txt/, accessed January 2008). Peak snow water equivalent (SWE) at Paradise averaged 192 cm during 1988–2007; the peak usually occurs during May or June. Both lakes are near treeline, and most of the area in the basins is alpine/subalpine in character. Bedrock in the Eunice Lake basin is primarily basalt and andesite, with lesser diorite and granodiorite. Bedrock in the Lake Louise basin is andesite and granodiorite (Fiske and others, 1964).
The study sites in NOCA where seasonal patterns in water chemistry were monitored included Thornton Creek and Newhalem Creek (fig. 1), which are in the central part of the park. Their drainage basins are substantially larger than the drainage basins of the study sites in MORA (table 1). The gages were at relatively low elevation, but the basins
Table 1. Site characteristics for surface-water monitoring sites in Mount Rainier and North Cascades National Parks.
Site NameLatitude (NAD83)
Longitude (NAD83)
Elevation at gage
(m)
Maximum elevation in
basin (m)
Basin area (ha)
Estimated annual
precipitation (cm)
Runoff, 2005 (cm)
Runoff, 2006 (cm)
Eunice Lake outlet 46°57'17" 121°52'44" 1,634 1,820 29 257 133 173
Lake Louise outlet 46°46'21" 121°42'56" 1,430 1,844 211 259 194 279
Newhalem Creek 48°38'21" 121°13'27" 146 2,150 4,144 310 214 246
Thornton Creek 48°38'58" 121°18'28" 420 2,200 1,160 262 312 347
6 Atmospheric Deposition and Surface-Water Chemistry in Mount Rainier and North Cascades National Parks, USA
have nearly 2,000 m of relief (table 1). Estimated annual precipitation in the Thornton Creek basin is 262 cm, and in the Newhalem Creek basin, it is 310 cm. At the Thunder Basin NRCS SNOTEL site 22 km southeast from Newhalem (Thunder Basin, elevation 1,280 m), total annual precipita-tion averaged 180 cm during 1988–2007; peak SWE averaged 84 cm and typically occurs during early to mid-April. Most precipitation falls as rain at lower elevations in the NOCA study basins, but snow dominates at the higher elevations. Hillslopes in the Thornton Creek and Newhalem Creek basins are steep and densely forested at elevations below approxi-mately 1,500 m; higher elevations are alpine in character, with small glaciers in cirques. The Thornton Creek basin is underlain by granodiorite, schist, and orthogneiss, and the Newhalem Creek basin is underlain by banded gneiss, schist, and orthogneiss (Staatz and others, 1972; Tabor and Haugerud, 1999).
Methods
Wet- and Dry-Deposition Sampling
Wet-deposition data were obtained for all available years from the NADP/NTN Web site (http://nadp.sws.uiuc.edu/, accessed January 2008). The NADP/NTN is a nationwide network that included more than 250 precipitation monitor-ing sites in 2006. NADP/NTN calculates solute deposition by multiplying concentration by precipitation amount; weekly deposition values are summed to estimate seasonal and annual deposition.
Dry-deposition data were obtained for the three most recent years of available data (2002–2004) from the U.S. Envi-ronmental Protection Agency Clean Air Status and Trends Web site (http://www.epa.gov/castnet/, accessed January 2008). CASTNET is a nationwide network with more than 80 stations in operation in 2006. The NADP/NTN and CASTNET programs use standardized methods at all of the sites, allowing analysis of geographic patterns.
Bulk Deposition Sampling
Atmospheric deposition has been measured by the National Park Service at Paradise, in the south-central part of MORA (fig. 1), since 1989. The sampler at Paradise is an Aerochem wet-deposition sampler, which until 2002 was operated using NADP/NTN protocols during summer and as a bulk deposition sampler during winter. Difficult access pre-cluded following strict NADP/NTN protocols during winter because the collection bucket would often overfill with snow between site visits. An inverted funnel was fitted to the top of the bucket during winter, reducing the size of the opening and the catch efficiency. Since 2002, it has been operated as a bulk precipitation sampler throughout the year. Precipitation volume is estimated from a National Weather Service
meteorological site at Paradise. Although evaporation and dry deposition could affect solute concentrations of precipitation collected using bulk samplers, the effect probably is minimal during winter (Clow and others, 2002).
Snowpack Sampling
Depth-integrated snowpack samples were collected by the U.S. Geological Survey and National Park Service at NOCA and MORA during spring 2005 and spring 2006 as part of the Western Airborne Contaminants Assessment Proj-ect (WACAP) and Pacific Northwest (PNW) snow chemistry projects. At NOCA, the same sites were sampled in 2005 and 2006. In MORA, dangerous snow and weather conditions in 2006 prevented resampling of the sites that were used in 2005, so nearby sites were substituted.
Samples for analyses of major-element chemistry were collected as follows: (1) a snowpit was dug from the snow surface to the ground, (2) approximately 5 cm of snow was removed from the snow surface and from the face of one wall of the pit by using a clean plastic shovel to expose only clean, fresh snow, (3) a thin column of snow was incrementally removed from the cleaned face and placed in a precleaned 10-L Teflon bag, and (4) the bag was closed, sealed, and placed in a cooler containing dry ice for transport to the labo-ratory. Samples were kept frozen until processed in the labora-tory. Processing procedures and additional details regarding sampling methods are described in Ingersoll (1995).
Snowpack depth was recorded, and density, tem-perature, and snow morphology were measured in 10- to 40-cm increments from the snow surface to the base of the pack. Thermometers were calibrated to within ±0.5°C in an ice-water bath before use. The density, temperature, and snow-morphology data were used to determine whether the snowpack had begun to melt, which would render it unsuitable for snow chemistry sampling.
Water Sampling and Analyses
Water samples were collected as part of this study from the two lake outlets in MORA and two streams in NOCA along well-mixed reaches by using grab sampling methods (Wilde and others, 1998). Samples were collected in 1-L plas-tic bottles, which were washed and soaked using 18-megohm deionized water before use. Sampling frequency varied, with highest frequency (weekly) during periods of snowmelt, and lowest frequency (monthly) during fall. Samples were not collected from November through February because deep snowpacks limited access to the lakes, and flow generally was low. An automated water sampler (autosampler) was used to collect water samples from the Eunice Lake outlet during springtime to obtain samples during the rising limb of the snowmelt hydrograph. Several samples were collected from the epilimnion of Eunice Lake and Lake Louise for compari-son with chemistry at the lake outlets.
Methods 7
Water samples were filtered onsite within 2 hours of collection, except those collected using the autosampler, which were filtered in a field laboratory within 24 hours of being removed from the field. Samples were retrieved from the autosampler every 2 weeks; deep snowpacks surrounding the autosampler helped keep samples cool during that time. Equipment cleaning, sampling, and filtration followed proto-cols in the USGS National Field Manual (Wilde and others, 1998). The fraction of sulfate derived from marine aerosols in a sample was calculated by multiplying the chloride concen-tration in the sample by the sulfate:chloride ratio in seawater, which is 0.1092 (Gregor and others, 2004).
Laboratory Methods and Quality Assurance
Alkalinity, pH, and specific conductance were measured in the laboratory on unfiltered aliquots of the sample within 1 week of collection. Alkalinity was measured by Gran titra-tion (Gran, 1952), and pH was measured using an electrode designed for low-ionic-strength water. Calcium, magnesium, and silica were determined by inductively coupled plasma spectroscopy on filtered, acidified samples within 2 months of collection. Sodium, potassium, ammonium, sulfate, nitrate, and chloride were measured by ion chromotography on filtered, unacidified aliquots within 1 month of collection. Dissolved organic carbon (DOC) was measured by UV-promoted per-sulfate oxidation and infrared spectrometry, and ultra-violet absorbance (UVA) was measured at 254 nm. DOC and UVA were measured within 1 month of collection. Detection limits were less than 1 µmol/L for all dissolved constituents, except DOC, which had a detection limit of 0.3 mg/L.
Quality-assurance procedures included collection and analyses of field blanks and field splits, which accounted for 10 percent of the total sample load. Solute concentrations in all of the blanks were less than the detection limit for all con-stituents. Median differences of field splits were ≤ 1 µmol/L, except for alkalinity and calcium, for which median differences were ≤ 2 µmol/L.
Sample analyses were performed at the U.S. Geological Survey research laboratory in Boulder, Colorado. Laboratory quality-assurance checks included routine analyses of certi-fied high-purity standards traceable to the National Institute of Standards and USGS standard reference samples (Ludtke and Woodworth, 1997) within each analytical run. The laboratory also participated in blind-audit performance tests conducted by the USGS and by the National Laboratory for Environmen-tal Testing, National Water Research Institute, Environment Canada (Blum and Alkema, 2000). Results of the blind-audit tests indicated analyses were accurate to within 6 percent for all constituents. Analytical results were checked for each sample based on charge balance; all samples had charge bal-ances within 13 percent or 18 µeq/L.
Hydrologic Data Collection
Discharge (streamflow) at the lake outlets and in the streams listed in table 1 was calculated from stage (water depth), which was monitored using submersible pressure transducers connected to automatic dataloggers. Hourly aver-ages were calculated from stage measurements that were made every minute. Minor datum corrections to the pressure trans-ducer record were made on the basis of manual stage readings obtained from reference staff gages.
Manual discharge measurements were made over a range of flows using a current meter (Rantz and others, 1982a). A rating equation was created for each site, allowing computa-tion of discharge from the adjusted stage data (Rantz and others, 1982b).
Equipment malfunctions caused some gaps in the stage record. Regression equations were developed to relate dis-charge at the study sites to discharge at the closest USGS streamgaging stations; the regression equations were used to estimate discharge at the study sites for periods when equip-ment at those stations was not operating. Data gaps accounted for 0 to 35 percent of the record at the four gages. Correlations between discharge at the study sites and the gages used for reconstruction ranged from 70 to 98 percent.
Statistical Analyses
Trend analyses were performed on precipitation and deposition of solutes in precipitation using the Spearman’s rho test, which is a nonparametric test that is relatively resistant to the effect of data outliers (Helsel and Hirsch, 1992). In this report, a p-value of less than 0.05 was considered statistically significant. LOWESS (LOcally-WEighted Scatterplot Smooth-ing) lines were fitted to nitrogen and sulfur deposition data by weighted least squares to illustrate variations in temporal patterns (Cleveland and Devlin, 1988).
Multiple linear regression was used to determine the rela-tive importance of precipitation and solute concentrations on atmospheric deposition of solutes; the method involves using a least-squares approach to model the dependent variable using one or more independent variables (Helsel and Hirsch, 1992). The nonparametric Wilcoxon signed-rank test was used to test for differences in sulfate and alkalinity concentrations at Eunice Lake during 2000, 2005, and 2006 (Helsel and Hirsch, 1992).
Principal Components Analysis (PCA) was used evaluate geochemical processes influencing surface-water chemistry. PCA is a statistical technique for analyzing the variance of complex data sets in a manner that identifies how solutes vary together (covariance)(Lins, 1985). Solutes that exhibit covari-ance are grouped into components, which can be interpreted in terms of specific processes. A one-way analysis of variance (ANOVA) was used to test for differences in nutrient con-centrations among lakes in quadrants of the parks at p < 0.05 (Webster and Oliver, 2001).
8 Atmospheric Deposition and Surface-Water Chemistry in Mount Rainier and North Cascades National Parks, USA
Meteorologic and Hydrologic Conditions During Study
Precipitation
Precipitation was below the recent 20-year average (1988–2007) during 2005 and 2006 in both parks. Climate records at the Paradise SNOTEL site in MORA indicate that total precipitation during water year 2005 was 215 cm, and during water year 2006 it was 280 cm; average annual precipi-tation during 1988–2007 was 293 cm (ftp://ftp.wcc.nrcs.usda.gov/data/snow/snotel/table/history/washington/21c35s_p.txt/, accessed January 2008). At the Thunder Basin SNOTEL site in NOCA, total precipitation during water year 2005 was 143 cm, and during water year 2006 it was 153 cm; aver-age annual precipitation during 1988–2007 was 180 cm (ftp://ftp.wcc.nrcs.usda.gov/data/snow/snotel/table/history/washington/20a07s_p.txt/, accessed January 2008).
There were substantial differences in the percentage of precipitation falling as rain compared to that falling as snow in 2005 and 2006. At Paradise and Thunder Basin, approximately one-half of the precipitation fell as snow in 2005, whereas in 2006, two-thirds to three-fourths fell as snow. Most of the rain fell during fall and spring, but there also were substantial rain-on-snow events during winter. Summers were relatively dry.
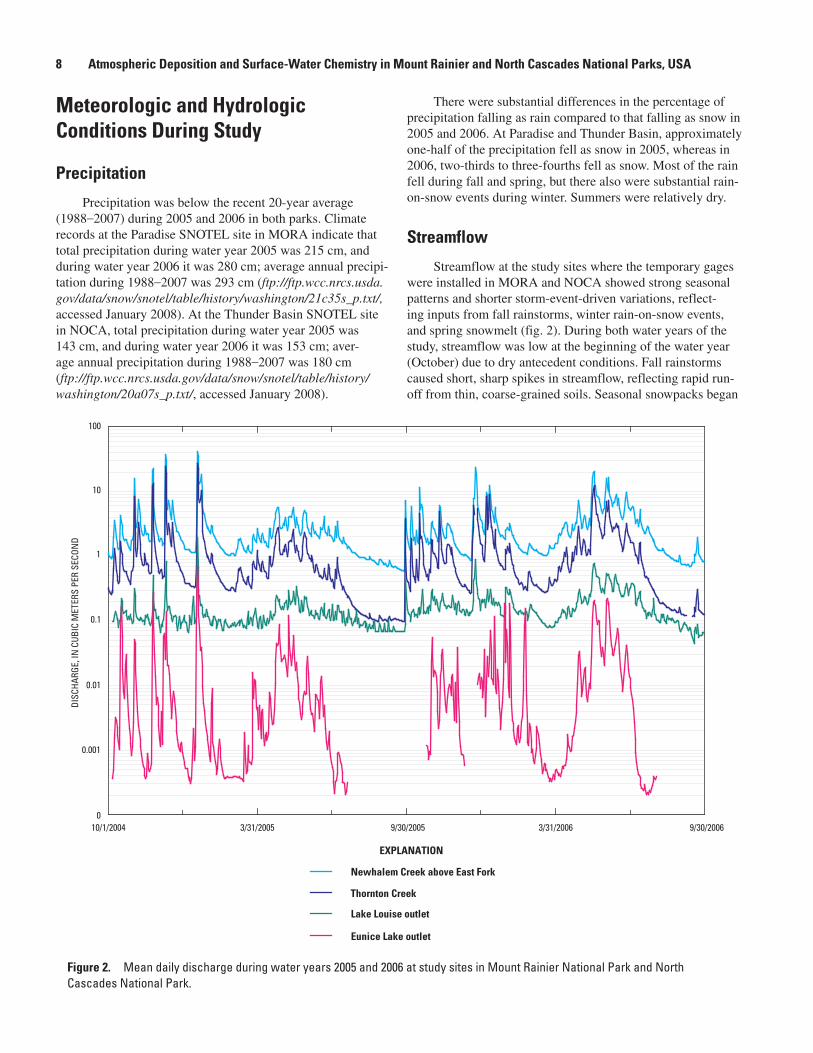
Streamflow
Streamflow at the study sites where the temporary gages were installed in MORA and NOCA showed strong seasonal patterns and shorter storm-event-driven variations, reflect-ing inputs from fall rainstorms, winter rain-on-snow events, and spring snowmelt (fig. 2). During both water years of the study, streamflow was low at the beginning of the water year (October) due to dry antecedent conditions. Fall rainstorms caused short, sharp spikes in streamflow, reflecting rapid run-off from thin, coarse-grained soils. Seasonal snowpacks began
0
0.001
0.01
0.1
1
10
100
DISC
HARG
E, IN
CUB
IC M
ETER
S PE
R SE
CON
D
Newhalem Creek above East Fork
Thornton Creek
EXPLANATION
Lake Louise outlet
Eunice Lake outlet
10/1/2004 3/31/2005 9/30/2005 3/31/2006 9/30/2006
Figure 2. Mean daily discharge during water years 2005 and 2006 at study sites in Mount Rainier National Park and North Cascades National Park.
Atmospheric Deposition of Inorganic Nitrogen and Sulfur 9
accumulating during November as mean daily air temperatures cooled. Rain falling on snowpacks 1 to 2 m in depth caused large midwinter discharge peaks. Some of the increased streamflow probably was due to direct rainfall runoff. In some cases, however, melting of the snowpack occurred as well, as indicated by a loss in SWE from the snowpack during mid-winter precipitation events. For example, at Paradise during mid-January 2005, a multiday storm deposited 24.9 cm of precipitation, and there was a loss of 12 cm of SWE from the snowpack. Average daily air temperatures at Paradise during the storm ranged from 5.0 to 6.9°C, so much of the precipita-tion must have fallen as rain that melted some of the snow as it passed through the snowpack.
Streamflow declined during late winter/early spring, then increased gradually in March as snowmelt began. Deeper snowpacks in 2006 delayed the onset and peak of snowmelt runoff and caused substantially higher and longer runoff in 2006 compared to 2005.
The timing, duration, and magnitude of runoff peaks can provide information about the geographic scale of meteoro-logic events and about the hydrologic characteristics of the study basins. Runoff peaks from the fall rainstorms and winter rain-on-snow events were sharp and nearly contemporaneous among the study sites, indicating that the study basins were responding to broad, regional-scale synoptic weather patterns (fig. 2). Discharge peaks at the NOCA sites were higher and of longer duration than those at the MORA sites, reflecting larger basin size and longer water residence times in the NOCA basins. The duration of discharge peaks at Eunice Lake was noticeably shorter than at the other sites, and streamflow at the Eunice Lake outlet often decreased to zero during late sum-mer. This indicates that the Eunice Lake basin has relatively little subsurface storage capacity.
Atmospheric Deposition of Inorganic Nitrogen and Sulfur
Spatial and Temporal Patterns in Wet Deposition and Emissions
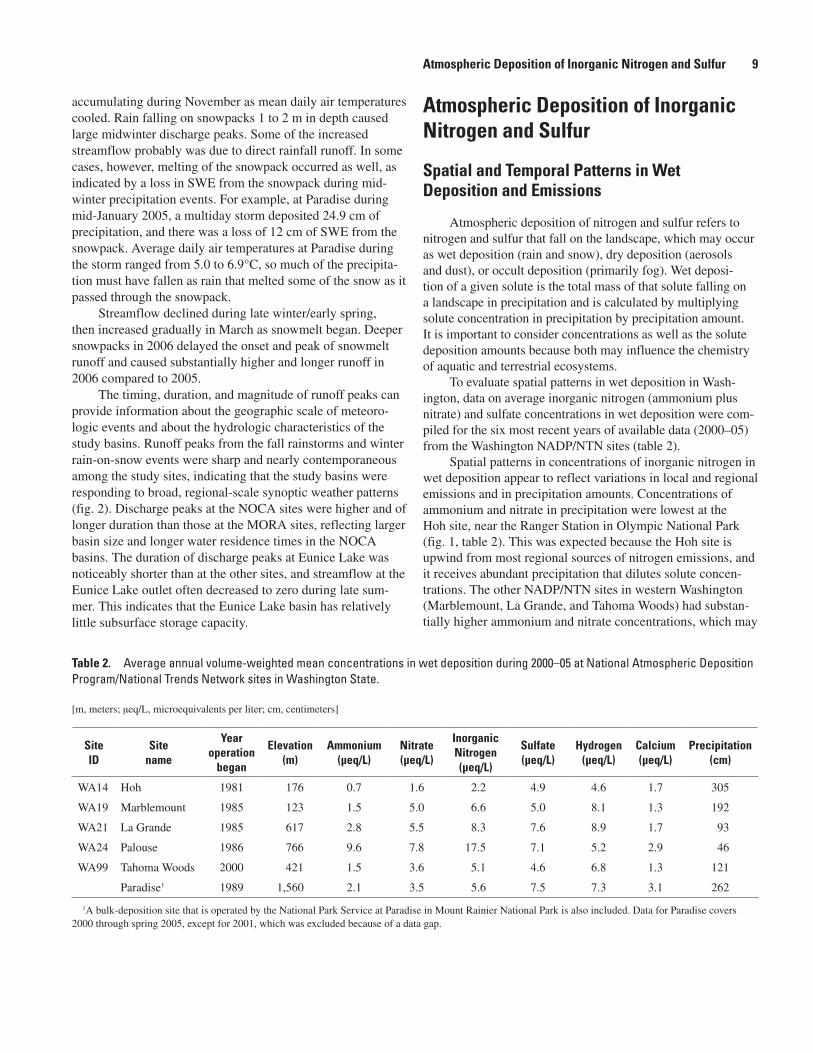
Atmospheric deposition of nitrogen and sulfur refers to nitrogen and sulfur that fall on the landscape, which may occur as wet deposition (rain and snow), dry deposition (aerosols and dust), or occult deposition (primarily fog). Wet deposi-tion of a given solute is the total mass of that solute falling on a landscape in precipitation and is calculated by multiplying solute concentration in precipitation by precipitation amount. It is important to consider concentrations as well as the solute deposition amounts because both may influence the chemistry of aquatic and terrestrial ecosystems.
To evaluate spatial patterns in wet deposition in Wash-ington, data on average inorganic nitrogen (ammonium plus nitrate) and sulfate concentrations in wet deposition were com-piled for the six most recent years of available data (2000–05) from the Washington NADP/NTN sites (table 2).
Spatial patterns in concentrations of inorganic nitrogen in wet deposition appear to reflect variations in local and regional emissions and in precipitation amounts. Concentrations of ammonium and nitrate in precipitation were lowest at the Hoh site, near the Ranger Station in Olympic National Park (fig. 1, table 2). This was expected because the Hoh site is upwind from most regional sources of nitrogen emissions, and it receives abundant precipitation that dilutes solute concen-trations. The other NADP/NTN sites in western Washington (Marblemount, La Grande, and Tahoma Woods) had substan-tially higher ammonium and nitrate concentrations, which may
Site ID
Site name
Year operation
began
Elevation (m)
Ammonium (µeq/L)
Nitrate (µeq/L)
Inorganic Nitrogen (µeq/L)
Sulfate (µeq/L)
Hydrogen (µeq/L)
Calcium (µeq/L)
Precipitation (cm)
WA14 Hoh 1981 176 0.7 1.6 2.2 4.9 4.6 1.7 305
WA19 Marblemount 1985 123 1.5 5.0 6.6 5.0 8.1 1.3 192
WA21 La Grande 1985 617 2.8 5.5 8.3 7.6 8.9 1.7 93
WA24 Palouse 1986 766 9.6 7.8 17.5 7.1 5.2 2.9 46
WA99 Tahoma Woods 2000 421 1.5 3.6 5.1 4.6 6.8 1.3 121
Paradise1 1989 1,560 2.1 3.5 5.6 7.5 7.3 3.1 262
Table 2. Average annual volume-weighted mean concentrations in wet deposition during 2000–05 at National Atmospheric Deposition Program/National Trends Network sites in Washington State.
[m, meters; µeq/L, microequivalents per liter; cm, centimeters]
1A bulk-deposition site that is operated by the National Park Service at Paradise in Mount Rainier National Park is also included. Data for Paradise covers 2000 through spring 2005, except for 2001, which was excluded because of a data gap.
10 Atmospheric Deposition and Surface-Water Chemistry in Mount Rainier and North Cascades National Parks, USA
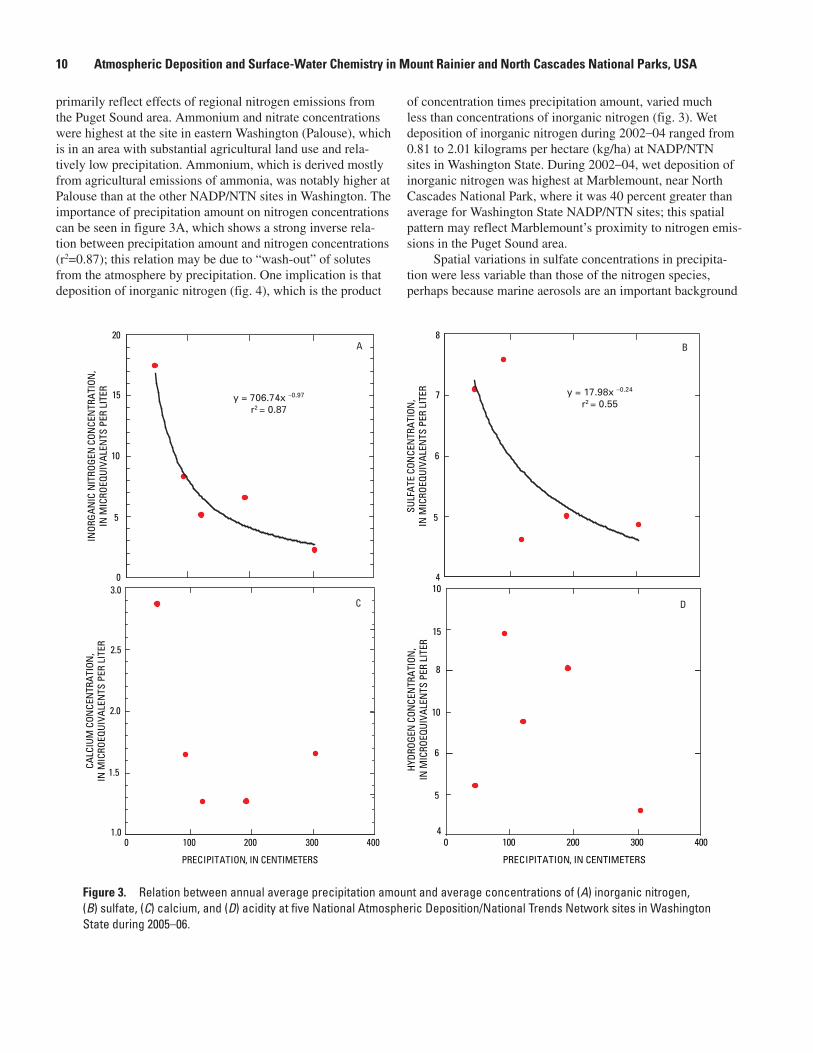
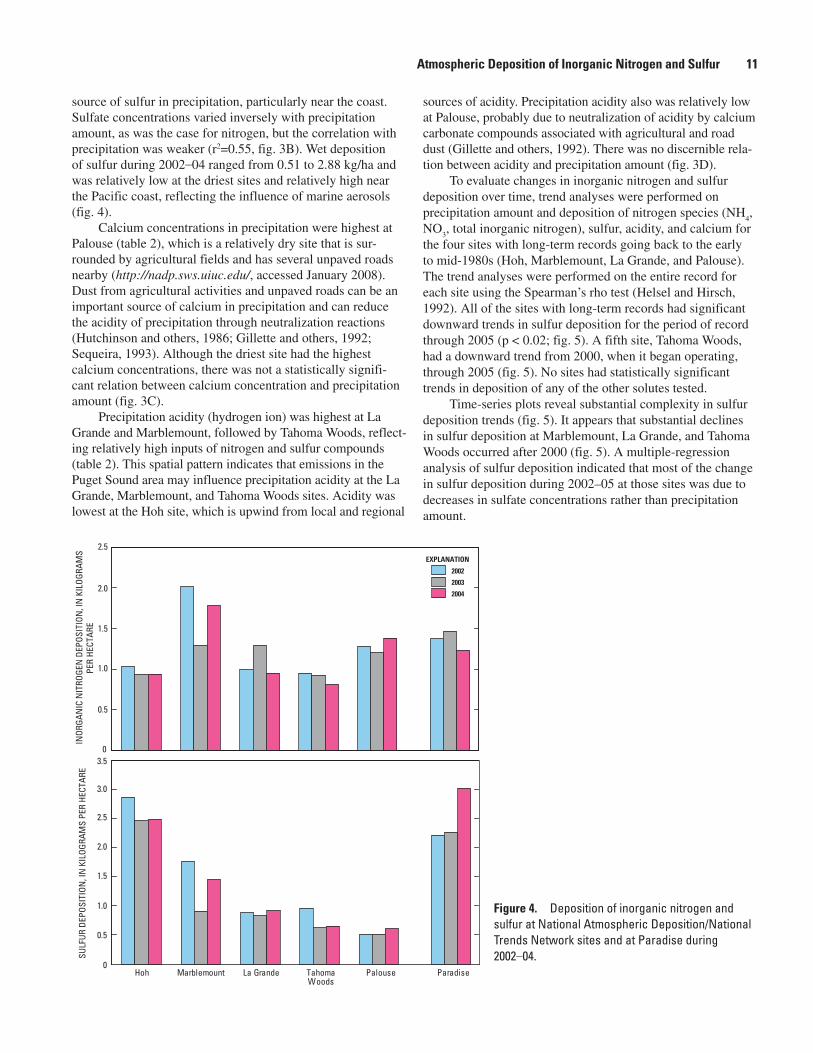
primarily reflect effects of regional nitrogen emissions from the Puget Sound area. Ammonium and nitrate concentrations were highest at the site in eastern Washington (Palouse), which is in an area with substantial agricultural land use and rela-tively low precipitation. Ammonium, which is derived mostly from agricultural emissions of ammonia, was notably higher at Palouse than at the other NADP/NTN sites in Washington. The importance of precipitation amount on nitrogen concentrations can be seen in figure 3A, which shows a strong inverse rela-tion between precipitation amount and nitrogen concentrations (r2=0.87); this relation may be due to “wash-out” of solutes from the atmosphere by precipitation. One implication is that deposition of inorganic nitrogen (fig. 4), which is the product
of concentration times precipitation amount, varied much less than concentrations of inorganic nitrogen (fig. 3). Wet deposition of inorganic nitrogen during 2002–04 ranged from 0.81 to 2.01 kilograms per hectare (kg/ha) at NADP/NTN sites in Washington State. During 2002–04, wet deposition of inorganic nitrogen was highest at Marblemount, near North Cascades National Park, where it was 40 percent greater than average for Washington State NADP/NTN sites; this spatial pattern may reflect Marblemount’s proximity to nitrogen emis-sions in the Puget Sound area.
Spatial variations in sulfate concentrations in precipita-tion were less variable than those of the nitrogen species, perhaps because marine aerosols are an important background
y = 706.74x –0.97
r2 = 0.87
y = 17.98x –0.24
r2 = 0.55
0
5
10
15
20
INOR
GAN
IC N
ITRO
GEN
CON
CEN
TRAT
ION
,IN
MIC
ROEQ
UIVA
LEN
TS P
ER L
ITER
4
5
6
7
8
SULF
ATE
CON
CEN
TRAT
ION
,IN
MIC
ROEQ
UIVA
LEN
TS P
ER L
ITER
BA
PRECIPITATION, IN CENTIMETERS
0 100 200 300 4001.0
1.5
2.0
2.5
3.0
CALC
IUM
CON
CEN
TRA
TION
,IN
MIC
ROEQ
UIV
ALE
NTS
PER
LIT
ER
C
0 100 200 300 400
PRECIPITATION, IN CENTIMETERS
4
6
5
10
8
15
10
HYDR
OGEN
CON
CEN
TRAT
ION
,IN
MIC
ROEQ
UIVA
LEN
TS P
ER L
ITER
D
Figure 3. Relation between annual average precipitation amount and average concentrations of (A) inorganic nitrogen, (B) sulfate, (C) calcium, and (D) acidity at five National Atmospheric Deposition/National Trends Network sites in Washington State during 2005–06.
Atmospheric Deposition of Inorganic Nitrogen and Sulfur 11
source of sulfur in precipitation, particularly near the coast. Sulfate concentrations varied inversely with precipitation amount, as was the case for nitrogen, but the correlation with precipitation was weaker (r2=0.55, fig. 3B). Wet deposition of sulfur during 2002–04 ranged from 0.51 to 2.88 kg/ha and was relatively low at the driest sites and relatively high near the Pacific coast, reflecting the influence of marine aerosols (fig. 4).
Calcium concentrations in precipitation were highest at Palouse (table 2), which is a relatively dry site that is sur-rounded by agricultural fields and has several unpaved roads nearby (http://nadp.sws.uiuc.edu/, accessed January 2008). Dust from agricultural activities and unpaved roads can be an important source of calcium in precipitation and can reduce the acidity of precipitation through neutralization reactions (Hutchinson and others, 1986; Gillette and others, 1992; Sequeira, 1993). Although the driest site had the highest calcium concentrations, there was not a statistically signifi-cant relation between calcium concentration and precipitation amount (fig. 3C).
Precipitation acidity (hydrogen ion) was highest at La Grande and Marblemount, followed by Tahoma Woods, reflect-ing relatively high inputs of nitrogen and sulfur compounds (table 2). This spatial pattern indicates that emissions in the Puget Sound area may influence precipitation acidity at the La Grande, Marblemount, and Tahoma Woods sites. Acidity was lowest at the Hoh site, which is upwind from local and regional
sources of acidity. Precipitation acidity also was relatively low at Palouse, probably due to neutralization of acidity by calcium carbonate compounds associated with agricultural and road dust (Gillette and others, 1992). There was no discernible rela-tion between acidity and precipitation amount (fig. 3D).
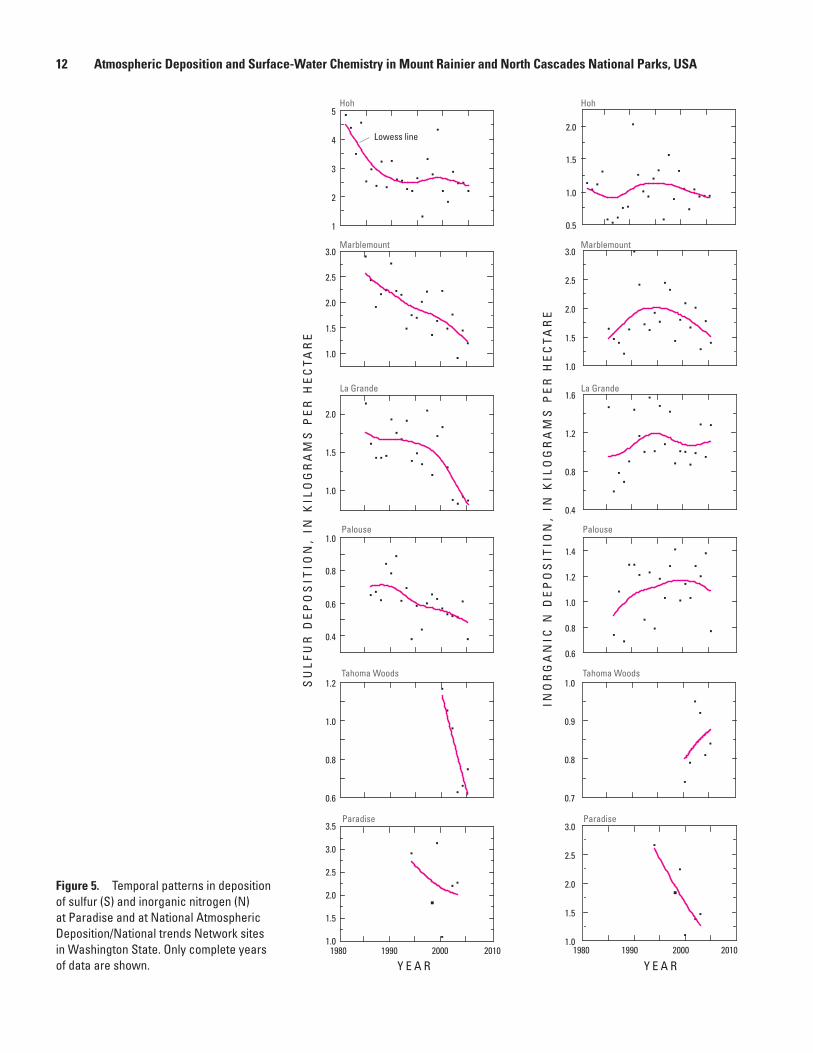
To evaluate changes in inorganic nitrogen and sulfur deposition over time, trend analyses were performed on precipitation amount and deposition of nitrogen species (NH
4,
NO3, total inorganic nitrogen), sulfur, acidity, and calcium for
the four sites with long-term records going back to the early to mid-1980s (Hoh, Marblemount, La Grande, and Palouse). The trend analyses were performed on the entire record for each site using the Spearman’s rho test (Helsel and Hirsch, 1992). All of the sites with long-term records had significant downward trends in sulfur deposition for the period of record through 2005 (p < 0.02; fig. 5). A fifth site, Tahoma Woods, had a downward trend from 2000, when it began operating, through 2005 (fig. 5). No sites had statistically significant trends in deposition of any of the other solutes tested.
Time-series plots reveal substantial complexity in sulfur deposition trends (fig. 5). It appears that substantial declines in sulfur deposition at Marblemount, La Grande, and Tahoma Woods occurred after 2000 (fig. 5). A multiple-regression analysis of sulfur deposition indicated that most of the change in sulfur deposition during 2002–05 at those sites was due to decreases in sulfate concentrations rather than precipitation amount.
0
0.5
1.0
1.5
2.0
2.5
INOR
GAN
IC N
ITRO
GEN
DEP
OSIT
ION
, IN
KIL
OGRA
MS
PER
HECT
ARE
SULF
UR D
EPOS
ITIO
N, I
N K
ILOG
RAM
S PE
R HE
CTAR
E
0
0.5
1.0
1.5
2.0
2.5
3.0
3.5
Hoh Marblemount La Grande PalouseTahomaWoods
Paradise
2002
EXPLANATION
2003
2004
Figure 4. Deposition of inorganic nitrogen and sulfur at National Atmospheric Deposition/National Trends Network sites and at Paradise during 2002–04.
12 Atmospheric Deposition and Surface-Water Chemistry in Mount Rainier and North Cascades National Parks, USA
1.0
1.5
2.0
2.5
3.0Marblemount
1
2
3
4
5Hoh
1.0
1.5
2.0
La Grande
Palouse
0.4
0.6
0.8
1.0
0.6
0.8
1.0
1.2Tahoma Woods
0.5
1.0
1.5
2.0
1.0
1.5
2.0
2.5
3.0
0.4
0.8
1.2
1.6
0.6
0.8
1.0
1.2
1.4
0.7
0.8
0.9
1.0SU
LF
UR
DE
PO
SIT
ION
, IN
KIL
OG
RA
MS
PE
R H
EC
TA
RE
1.0
1.5
2.0
2.5
3.0
3.5
1980 1990 2000 2010
Y E A R Y E A R
Paradise
Marblemount
Hoh
La Grande
Palouse
Tahoma Woods
Paradise
1.0
1.5
2.0
2.5
3.0
1980 1990 2000 2010
INO
RG
AN
IC N
DE
PO
SIT
ION
, IN
KIL
OG
RA
MS
PE
R H
EC
TA
RE
Lowess line
Figure 5. Temporal patterns in deposition of sulfur (S) and inorganic nitrogen (N) at Paradise and at National Atmospheric Deposition/National trends Network sites in Washington State. Only complete years of data are shown.
Atmospheric Deposition of Inorganic Nitrogen and Sulfur 13
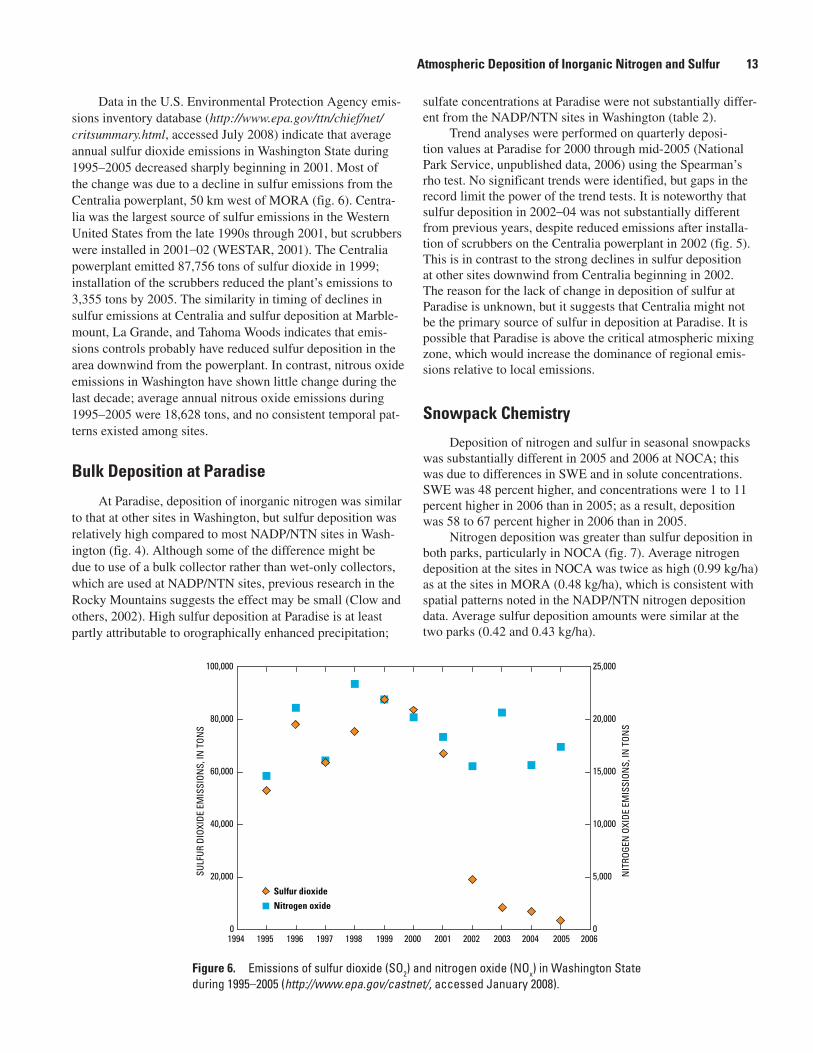
Data in the U.S. Environmental Protection Agency emis-sions inventory database (http://www.epa.gov/ttn/chief/net/critsummary.html, accessed July 2008) indicate that average annual sulfur dioxide emissions in Washington State during 1995–2005 decreased sharply beginning in 2001. Most of the change was due to a decline in sulfur emissions from the Centralia powerplant, 50 km west of MORA (fig. 6). Centra-lia was the largest source of sulfur emissions in the Western United States from the late 1990s through 2001, but scrubbers were installed in 2001–02 (WESTAR, 2001). The Centralia powerplant emitted 87,756 tons of sulfur dioxide in 1999; installation of the scrubbers reduced the plant’s emissions to 3,355 tons by 2005. The similarity in timing of declines in sulfur emissions at Centralia and sulfur deposition at Marble-mount, La Grande, and Tahoma Woods indicates that emis-sions controls probably have reduced sulfur deposition in the area downwind from the powerplant. In contrast, nitrous oxide emissions in Washington have shown little change during the last decade; average annual nitrous oxide emissions during 1995–2005 were 18,628 tons, and no consistent temporal pat-terns existed among sites.
Bulk Deposition at Paradise
At Paradise, deposition of inorganic nitrogen was similar to that at other sites in Washington, but sulfur deposition was relatively high compared to most NADP/NTN sites in Wash-ington (fig. 4). Although some of the difference might be due to use of a bulk collector rather than wet-only collectors, which are used at NADP/NTN sites, previous research in the Rocky Mountains suggests the effect may be small (Clow and others, 2002). High sulfur deposition at Paradise is at least partly attributable to orographically enhanced precipitation;
sulfate concentrations at Paradise were not substantially differ-ent from the NADP/NTN sites in Washington (table 2).
Trend analyses were performed on quarterly deposi-tion values at Paradise for 2000 through mid-2005 (National Park Service, unpublished data, 2006) using the Spearman’s rho test. No significant trends were identified, but gaps in the record limit the power of the trend tests. It is noteworthy that sulfur deposition in 2002–04 was not substantially different from previous years, despite reduced emissions after installa-tion of scrubbers on the Centralia powerplant in 2002 (fig. 5). This is in contrast to the strong declines in sulfur deposition at other sites downwind from Centralia beginning in 2002. The reason for the lack of change in deposition of sulfur at Paradise is unknown, but it suggests that Centralia might not be the primary source of sulfur in deposition at Paradise. It is possible that Paradise is above the critical atmospheric mixing zone, which would increase the dominance of regional emis-sions relative to local emissions.
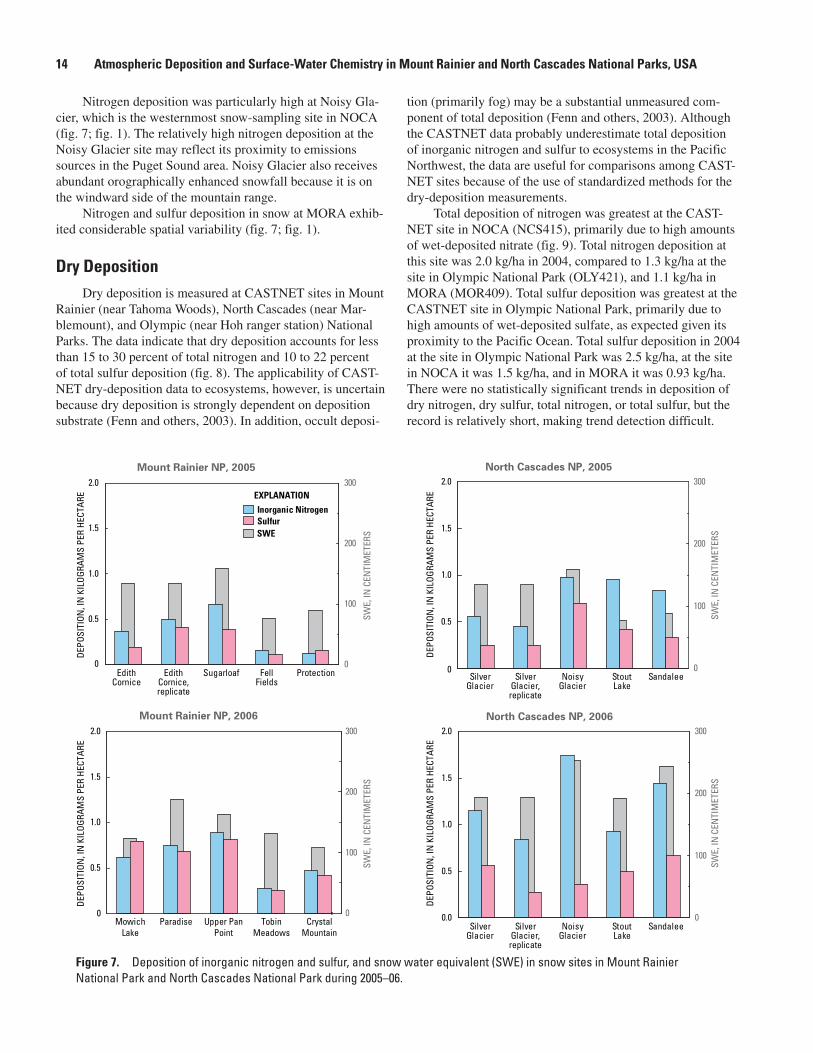
Snowpack Chemistry
Deposition of nitrogen and sulfur in seasonal snowpacks was substantially different in 2005 and 2006 at NOCA; this was due to differences in SWE and in solute concentrations. SWE was 48 percent higher, and concentrations were 1 to 11 percent higher in 2006 than in 2005; as a result, deposition was 58 to 67 percent higher in 2006 than in 2005.
Nitrogen deposition was greater than sulfur deposition in both parks, particularly in NOCA (fig. 7). Average nitrogen deposition at the sites in NOCA was twice as high (0.99 kg/ha) as at the sites in MORA (0.48 kg/ha), which is consistent with spatial patterns noted in the NADP/NTN nitrogen deposition data. Average sulfur deposition amounts were similar at the two parks (0.42 and 0.43 kg/ha).
0
20,000
40,000
60,000
80,000
100,000
1994 1995 1996 1997 1998 1999 2000 2002 20032001 2004 2005 20060
5,000
10,000
15,000
20,000
25,000
Sulfur dioxide
Nitrogen oxide
SULF
UR D
IOXI
DE E
MIS
SION
S, IN
TON
S
NIT
ROGE
N O
XIDE
EM
ISSI
ONS,
IN T
ONS
Figure 6. Emissions of sulfur dioxide (SO2) and nitrogen oxide (NOx) in Washington State during 1995–2005 (http://www.epa.gov/castnet/, accessed January 2008).
14 Atmospheric Deposition and Surface-Water Chemistry in Mount Rainier and North Cascades National Parks, USA
Mount Rainier NP, 2005
0
0.5
1.0
1.5
2.0
EdithCornice
EdithCornice,replicate
Sugarloaf FellFields
Protection0
100
200
300
Inorganic Nitrogen
EXPLANATION
SulfurSWE
Mount Rainier NP, 2006
0
0.5
1.0
1.5
2.0
MowichLake
Paradise Upper PanPoint
TobinMeadows
CrystalMountain
0
100
200
300
North Cascades NP, 2005
0
0.5
1.0
1.5
2.0
SilverGlacier
SilverGlacier,replicate
NoisyGlacier
StoutLake
Sandalee
SilverGlacier
SilverGlacier,replicate
NoisyGlacier
StoutLake
Sandalee
DEPO
SITI
ON, I
N K
ILOG
RAM
S PE
R HE
CTAR
E
DEPO
SITI
ON, I
N K
ILOG
RAM
S PE
R HE
CTAR
E
DEPO
SITI
ON, I
N K
ILOG
RAM
S PE
R HE
CTAR
E
SWE,
IN C
ENTI
MET
ERS
SWE,
IN C
ENTI
MET
ERS
SWE,
IN C
ENTI
MET
ERS
SWE,
IN C
ENTI
MET
ERS
DEPO
SITI
ON, I
N K
ILOG
RAM
S PE
R HE
CTAR
E
0
100
200
300
North Cascades NP, 2006
0.0
0.5
1.0
1.5
2.0
0
100
200
300
Nitrogen deposition was particularly high at Noisy Gla-cier, which is the westernmost snow-sampling site in NOCA (fig. 7; fig. 1). The relatively high nitrogen deposition at the Noisy Glacier site may reflect its proximity to emissions sources in the Puget Sound area. Noisy Glacier also receives abundant orographically enhanced snowfall because it is on the windward side of the mountain range.
Nitrogen and sulfur deposition in snow at MORA exhib-ited considerable spatial variability (fig. 7; fig. 1).
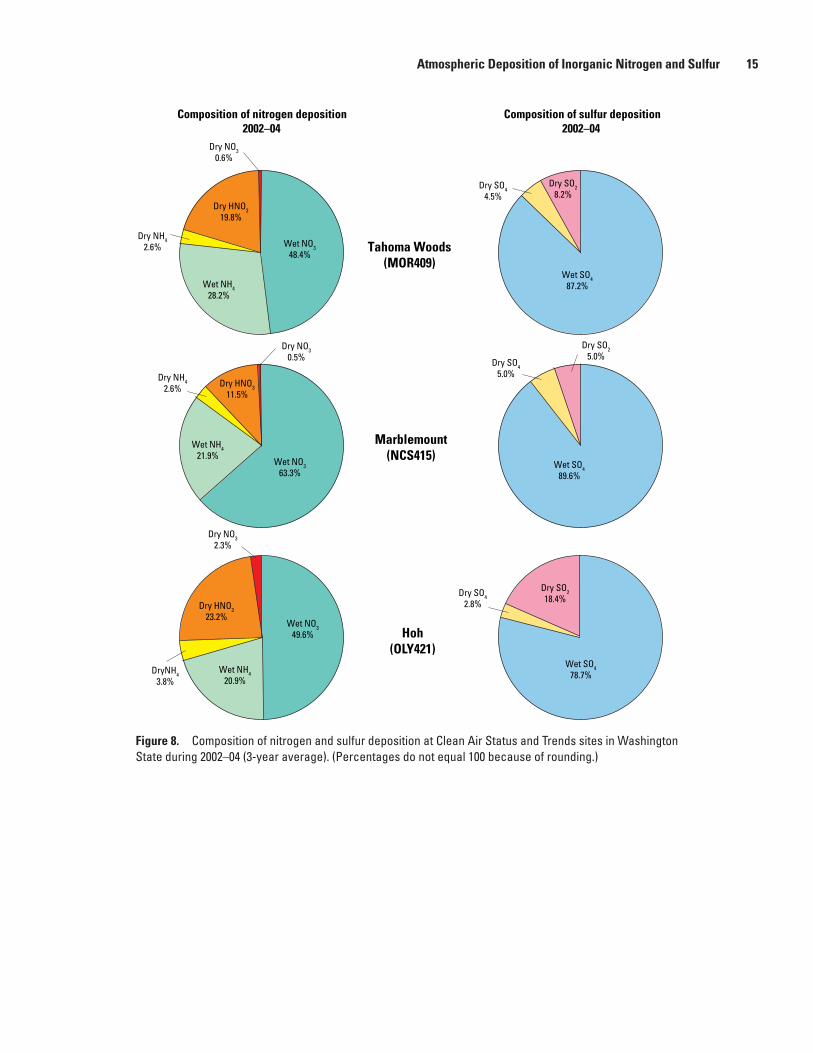
Dry DepositionDry deposition is measured at CASTNET sites in Mount
Rainier (near Tahoma Woods), North Cascades (near Mar-blemount), and Olympic (near Hoh ranger station) National Parks. The data indicate that dry deposition accounts for less than 15 to 30 percent of total nitrogen and 10 to 22 percent of total sulfur deposition (fig. 8). The applicability of CAST-NET dry-deposition data to ecosystems, however, is uncertain because dry deposition is strongly dependent on deposition substrate (Fenn and others, 2003). In addition, occult deposi-
tion (primarily fog) may be a substantial unmeasured com-ponent of total deposition (Fenn and others, 2003). Although the CASTNET data probably underestimate total deposition of inorganic nitrogen and sulfur to ecosystems in the Pacific Northwest, the data are useful for comparisons among CAST-NET sites because of the use of standardized methods for the dry-deposition measurements.
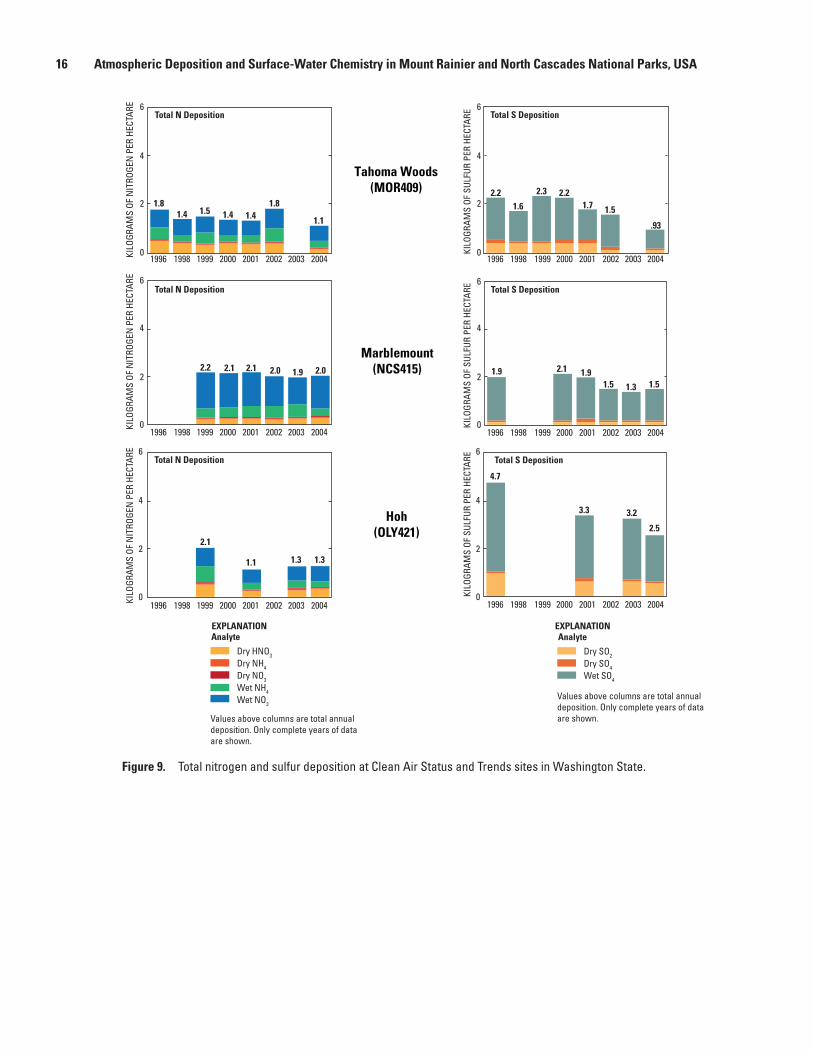
Total deposition of nitrogen was greatest at the CAST-NET site in NOCA (NCS415), primarily due to high amounts of wet-deposited nitrate (fig. 9). Total nitrogen deposition at this site was 2.0 kg/ha in 2004, compared to 1.3 kg/ha at the site in Olympic National Park (OLY421), and 1.1 kg/ha in MORA (MOR409). Total sulfur deposition was greatest at the CASTNET site in Olympic National Park, primarily due to high amounts of wet-deposited sulfate, as expected given its proximity to the Pacific Ocean. Total sulfur deposition in 2004 at the site in Olympic National Park was 2.5 kg/ha, at the site in NOCA it was 1.5 kg/ha, and in MORA it was 0.93 kg/ha. There were no statistically significant trends in deposition of dry nitrogen, dry sulfur, total nitrogen, or total sulfur, but the record is relatively short, making trend detection difficult.
Figure 7. Deposition of inorganic nitrogen and sulfur, and snow water equivalent (SWE) in snow sites in Mount Rainier National Park and North Cascades National Park during 2005–06.
Atmospheric Deposition of Inorganic Nitrogen and Sulfur 15
Composition of nitrogen deposition2002–04
Composition of sulfur deposition2002–04
Dry HNO319.8%
Wet NH428.2%
Dry NH42.6% Wet NO3
48.4%Tahoma Woods
(MOR409)
Marblemount(NCS415)
Hoh(OLY421)
Dry SO44.5%
Dry SO28.2%
Wet SO487.2%
Wet SO489.6%
Dry SO218.4%
Wet SO478.7%
Dry SO45.0%
Dry SO42.8%
Dry SO25.0%
Dry NH42.6% Dry HNO3
11.5%
Wet NH421.9%
Wet NO363.3%
Dry HNO323.2%
Wet NH420.9%
Wet NO349.6%
DryNH43.8%
Dry NO30.5%
Dry NO32.3%
Dry NO30.6%
Figure 8. Composition of nitrogen and sulfur deposition at Clean Air Status and Trends sites in Washington State during 2002–04 (3-year average). (Percentages do not equal 100 because of rounding.)
16 Atmospheric Deposition and Surface-Water Chemistry in Mount Rainier and North Cascades National Parks, USA
1.8
2.2 2.1
2.1
1.1 1.3 1.3
2.1 1.92.0 2.0
1.81.4 1.41.5
1.1
2.2
1.9
4.7
3.3 3.2
2.5
1.91.5 1.51.3
2.1
2.22.3
1.6 1.7 1.5
.931.4
Total S Deposition
Total N Deposition
Total N Deposition
Total S Deposition
Total N Deposition Total S Deposition
6
4
2
0
6
4
2
0
6
4
2
0
6
4
2
0
6
4
2
0
6
4
2
0
1996 1998 1999 2000 2001 2002 2003 2004
1996 1998 1999 2000 2001 2002 2003 2004
1996 1998 1999 2000 2001 2002 2003 2004
1996 1998 1999 2000 2001 2002 2003 2004
1996 1998 1999 2000 2001 2002 2003 2004
1996 1998 1999 2000 2001 2002 2003 2004
AnalyteEXPLANATION EXPLANATION
Dry HNO3
Dry NH4
Dry NO3
Wet NH4
Wet NO3
Analyte
Dry SO2
Dry SO4
Wet SO4
KILO
GRAM
S OF
SUL
FUR
PER
HECT
ARE
KILO
GRAM
S OF
SUL
FUR
PER
HECT
ARE
KILO
GRAM
S OF
SUL
FUR
PER
HECT
ARE
KILO
GRAM
S OF
NIT
ROGE
N P
ER H
ECTA
REKI
LOGR
AMS
OF N
ITRO
GEN
PER
HEC
TARE
KILO
GRAM
S OF
NIT
ROGE
N P
ER H
ECTA
RE
Marblemount(NCS415)
Hoh(OLY421)
Values above columns are total annual deposition. Only complete years of data are shown.
Values above columns are total annual deposition. Only complete years of data are shown.
Tahoma Woods(MOR409)
Figure 9. Total nitrogen and sulfur deposition at Clean Air Status and Trends sites in Washington State.
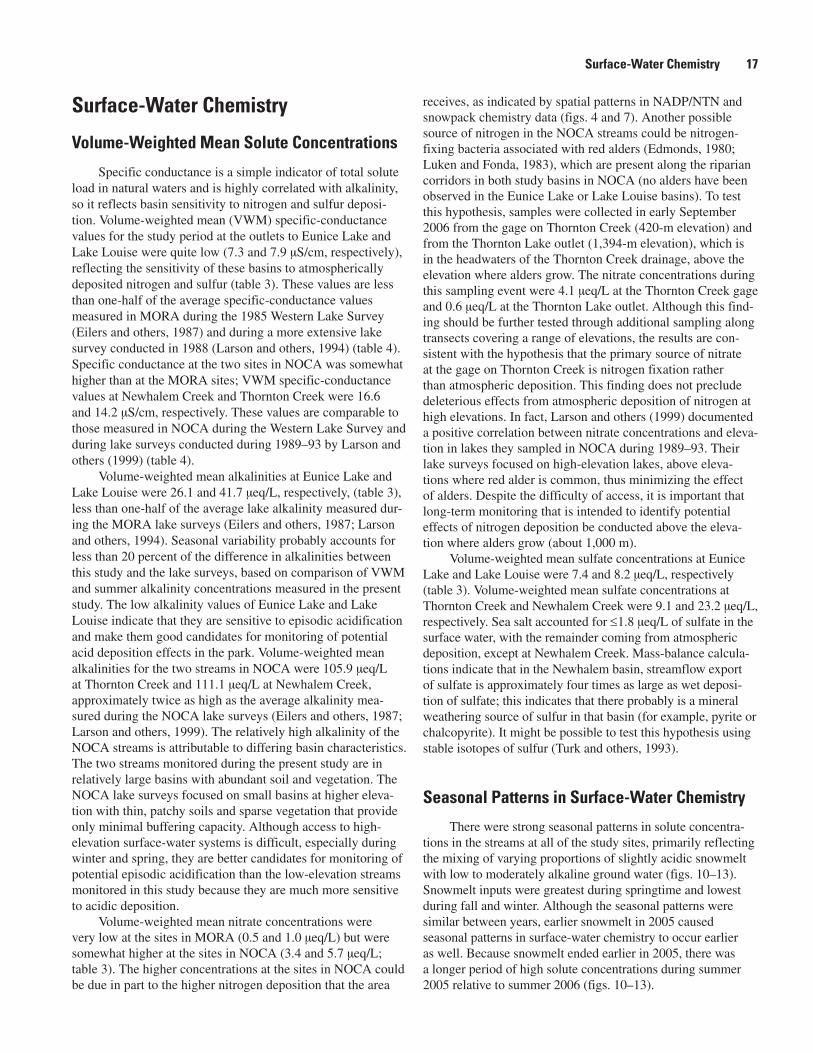
Surface-Water Chemistry 17
Surface-Water Chemistry
Volume-Weighted Mean Solute Concentrations
Specific conductance is a simple indicator of total solute load in natural waters and is highly correlated with alkalinity, so it reflects basin sensitivity to nitrogen and sulfur deposi-tion. Volume-weighted mean (VWM) specific-conductance values for the study period at the outlets to Eunice Lake and Lake Louise were quite low (7.3 and 7.9 µS/cm, respectively), reflecting the sensitivity of these basins to atmospherically deposited nitrogen and sulfur (table 3). These values are less than one-half of the average specific-conductance values measured in MORA during the 1985 Western Lake Survey (Eilers and others, 1987) and during a more extensive lake survey conducted in 1988 (Larson and others, 1994) (table 4). Specific conductance at the two sites in NOCA was somewhat higher than at the MORA sites; VWM specific-conductance values at Newhalem Creek and Thornton Creek were 16.6 and 14.2 µS/cm, respectively. These values are comparable to those measured in NOCA during the Western Lake Survey and during lake surveys conducted during 1989–93 by Larson and others (1999) (table 4).
Volume-weighted mean alkalinities at Eunice Lake and Lake Louise were 26.1 and 41.7 µeq/L, respectively, (table 3), less than one-half of the average lake alkalinity measured dur-ing the MORA lake surveys (Eilers and others, 1987; Larson and others, 1994). Seasonal variability probably accounts for less than 20 percent of the difference in alkalinities between this study and the lake surveys, based on comparison of VWM and summer alkalinity concentrations measured in the present study. The low alkalinity values of Eunice Lake and Lake Louise indicate that they are sensitive to episodic acidification and make them good candidates for monitoring of potential acid deposition effects in the park. Volume-weighted mean alkalinities for the two streams in NOCA were 105.9 µeq/L at Thornton Creek and 111.1 µeq/L at Newhalem Creek, approximately twice as high as the average alkalinity mea-sured during the NOCA lake surveys (Eilers and others, 1987; Larson and others, 1999). The relatively high alkalinity of the NOCA streams is attributable to differing basin characteristics. The two streams monitored during the present study are in relatively large basins with abundant soil and vegetation. The NOCA lake surveys focused on small basins at higher eleva-tion with thin, patchy soils and sparse vegetation that provide only minimal buffering capacity. Although access to high-elevation surface-water systems is difficult, especially during winter and spring, they are better candidates for monitoring of potential episodic acidification than the low-elevation streams monitored in this study because they are much more sensitive to acidic deposition.
Volume-weighted mean nitrate concentrations were very low at the sites in MORA (0.5 and 1.0 µeq/L) but were somewhat higher at the sites in NOCA (3.4 and 5.7 µeq/L; table 3). The higher concentrations at the sites in NOCA could be due in part to the higher nitrogen deposition that the area
receives, as indicated by spatial patterns in NADP/NTN and snowpack chemistry data (figs. 4 and 7). Another possible source of nitrogen in the NOCA streams could be nitrogen-fixing bacteria associated with red alders (Edmonds, 1980; Luken and Fonda, 1983), which are present along the riparian corridors in both study basins in NOCA (no alders have been observed in the Eunice Lake or Lake Louise basins). To test this hypothesis, samples were collected in early September 2006 from the gage on Thornton Creek (420-m elevation) and from the Thornton Lake outlet (1,394-m elevation), which is in the headwaters of the Thornton Creek drainage, above the elevation where alders grow. The nitrate concentrations during this sampling event were 4.1 µeq/L at the Thornton Creek gage and 0.6 µeq/L at the Thornton Lake outlet. Although this find-ing should be further tested through additional sampling along transects covering a range of elevations, the results are con-sistent with the hypothesis that the primary source of nitrate at the gage on Thornton Creek is nitrogen fixation rather than atmospheric deposition. This finding does not preclude deleterious effects from atmospheric deposition of nitrogen at high elevations. In fact, Larson and others (1999) documented a positive correlation between nitrate concentrations and eleva-tion in lakes they sampled in NOCA during 1989–93. Their lake surveys focused on high-elevation lakes, above eleva-tions where red alder is common, thus minimizing the effect of alders. Despite the difficulty of access, it is important that long-term monitoring that is intended to identify potential effects of nitrogen deposition be conducted above the eleva-tion where alders grow (about 1,000 m).
Volume-weighted mean sulfate concentrations at Eunice Lake and Lake Louise were 7.4 and 8.2 µeq/L, respectively (table 3). Volume-weighted mean sulfate concentrations at Thornton Creek and Newhalem Creek were 9.1 and 23.2 µeq/L, respectively. Sea salt accounted for ≤1.8 µeq/L of sulfate in the surface water, with the remainder coming from atmospheric deposition, except at Newhalem Creek. Mass-balance calcula-tions indicate that in the Newhalem basin, streamflow export of sulfate is approximately four times as large as wet deposi-tion of sulfate; this indicates that there probably is a mineral weathering source of sulfur in that basin (for example, pyrite or chalcopyrite). It might be possible to test this hypothesis using stable isotopes of sulfur (Turk and others, 1993).
Seasonal Patterns in Surface-Water Chemistry
There were strong seasonal patterns in solute concentra-tions in the streams at all of the study sites, primarily reflecting the mixing of varying proportions of slightly acidic snowmelt with low to moderately alkaline ground water (figs. 10–13). Snowmelt inputs were greatest during springtime and lowest during fall and winter. Although the seasonal patterns were similar between years, earlier snowmelt in 2005 caused seasonal patterns in surface-water chemistry to occur earlier as well. Because snowmelt ended earlier in 2005, there was a longer period of high solute concentrations during summer 2005 relative to summer 2006 (figs. 10–13).
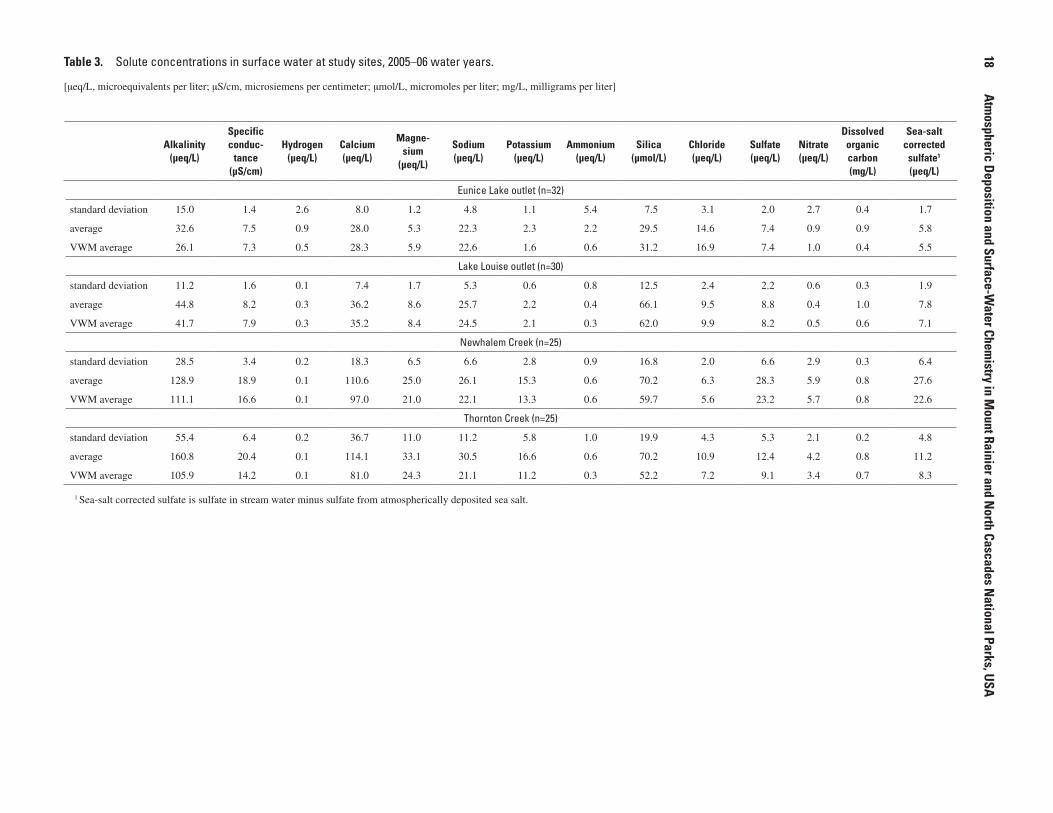
18
Atm
ospheric Deposition and Surface-W
ater Chemistry in M
ount Rainier and North Cascades N
ational Parks, USA
Alkalinity(µeq/L)
Specific conduc-
tance(µS/cm)
Hydrogen(µeq/L)
Calcium(µeq/L)
Magne-sium
(µeq/L)
Sodium(µeq/L)
Potassium(µeq/L)
Ammonium(µeq/L)
Silica(µmol/L)
Chloride(µeq/L)
Sulfate(µeq/L)
Nitrate(µeq/L)
Dissolved organic carbon(mg/L)
Sea-salt corrected
sulfate1 (µeq/L)
Eunice Lake outlet (n=32)
standard deviation 15.0 1.4 2.6 8.0 1.2 4.8 1.1 5.4 7.5 3.1 2.0 2.7 0.4 1.7
average 32.6 7.5 0.9 28.0 5.3 22.3 2.3 2.2 29.5 14.6 7.4 0.9 0.9 5.8
VWM average 26.1 7.3 0.5 28.3 5.9 22.6 1.6 0.6 31.2 16.9 7.4 1.0 0.4 5.5
Lake Louise outlet (n=30)
standard deviation 11.2 1.6 0.1 7.4 1.7 5.3 0.6 0.8 12.5 2.4 2.2 0.6 0.3 1.9
average 44.8 8.2 0.3 36.2 8.6 25.7 2.2 0.4 66.1 9.5 8.8 0.4 1.0 7.8
VWM average 41.7 7.9 0.3 35.2 8.4 24.5 2.1 0.3 62.0 9.9 8.2 0.5 0.6 7.1
Newhalem Creek (n=25)
standard deviation 28.5 3.4 0.2 18.3 6.5 6.6 2.8 0.9 16.8 2.0 6.6 2.9 0.3 6.4
average 128.9 18.9 0.1 110.6 25.0 26.1 15.3 0.6 70.2 6.3 28.3 5.9 0.8 27.6
VWM average 111.1 16.6 0.1 97.0 21.0 22.1 13.3 0.6 59.7 5.6 23.2 5.7 0.8 22.6
Thornton Creek (n=25)
standard deviation 55.4 6.4 0.2 36.7 11.0 11.2 5.8 1.0 19.9 4.3 5.3 2.1 0.2 4.8
average 160.8 20.4 0.1 114.1 33.1 30.5 16.6 0.6 70.2 10.9 12.4 4.2 0.8 11.2
VWM average 105.9 14.2 0.1 81.0 24.3 21.1 11.2 0.3 52.2 7.2 9.1 3.4 0.7 8.3
Table 3. Solute concentrations in surface water at study sites, 2005–06 water years.
[µeq/L, microequivalents per liter; µS/cm, microsiemens per centimeter; µmol/L, micromoles per liter; mg/L, milligrams per liter]
1 Sea-salt corrected sulfate is sulfate in stream water minus sulfate from atmospherically deposited sea salt.
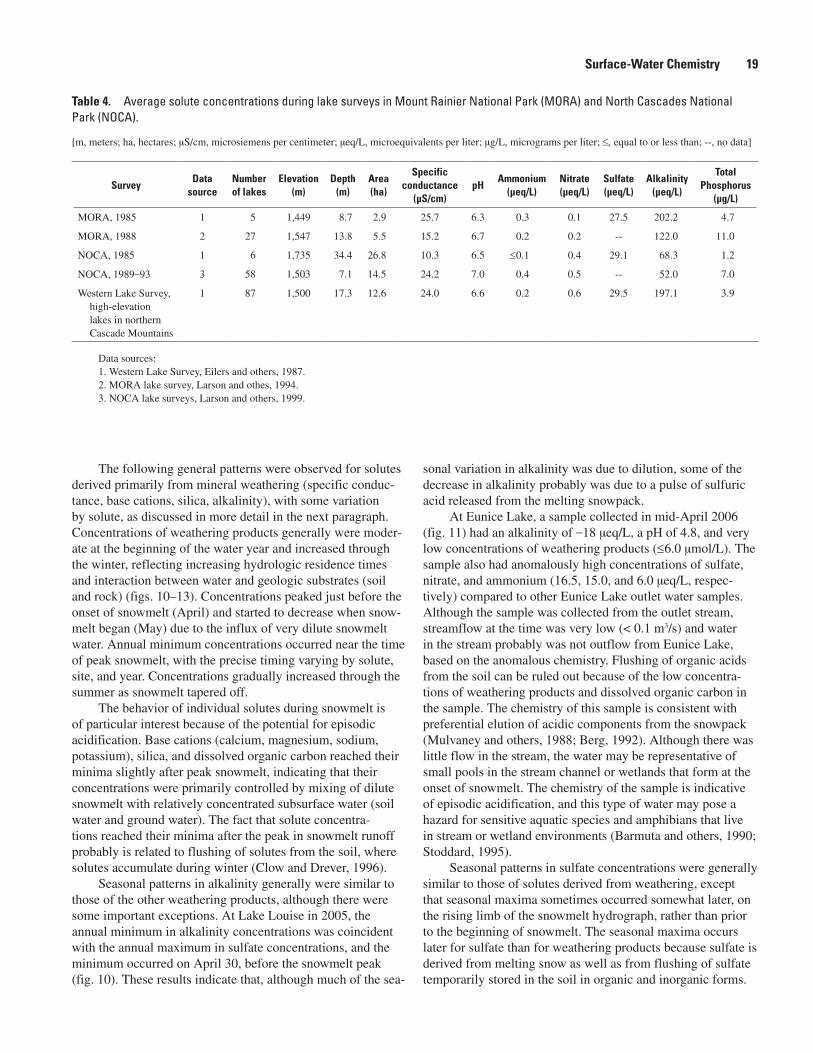
Surface-Water Chemistry 19
The following general patterns were observed for solutes derived primarily from mineral weathering (specific conduc-tance, base cations, silica, alkalinity), with some variation by solute, as discussed in more detail in the next paragraph. Concentrations of weathering products generally were moder-ate at the beginning of the water year and increased through the winter, reflecting increasing hydrologic residence times and interaction between water and geologic substrates (soil and rock) (figs. 10–13). Concentrations peaked just before the onset of snowmelt (April) and started to decrease when snow-melt began (May) due to the influx of very dilute snowmelt water. Annual minimum concentrations occurred near the time of peak snowmelt, with the precise timing varying by solute, site, and year. Concentrations gradually increased through the summer as snowmelt tapered off.
The behavior of individual solutes during snowmelt is of particular interest because of the potential for episodic acidification. Base cations (calcium, magnesium, sodium, potassium), silica, and dissolved organic carbon reached their minima slightly after peak snowmelt, indicating that their concentrations were primarily controlled by mixing of dilute snowmelt with relatively concentrated subsurface water (soil water and ground water). The fact that solute concentra-tions reached their minima after the peak in snowmelt runoff probably is related to flushing of solutes from the soil, where solutes accumulate during winter (Clow and Drever, 1996).
Seasonal patterns in alkalinity generally were similar to those of the other weathering products, although there were some important exceptions. At Lake Louise in 2005, the annual minimum in alkalinity concentrations was coincident with the annual maximum in sulfate concentrations, and the minimum occurred on April 30, before the snowmelt peak (fig. 10). These results indicate that, although much of the sea-
sonal variation in alkalinity was due to dilution, some of the decrease in alkalinity probably was due to a pulse of sulfuric acid released from the melting snowpack.
At Eunice Lake, a sample collected in mid-April 2006 (fig. 11) had an alkalinity of –18 µeq/L, a pH of 4.8, and very low concentrations of weathering products (≤6.0 µmol/L). The sample also had anomalously high concentrations of sulfate, nitrate, and ammonium (16.5, 15.0, and 6.0 µeq/L, respec-tively) compared to other Eunice Lake outlet water samples. Although the sample was collected from the outlet stream, streamflow at the time was very low (< 0.1 m3/s) and water in the stream probably was not outflow from Eunice Lake, based on the anomalous chemistry. Flushing of organic acids from the soil can be ruled out because of the low concentra-tions of weathering products and dissolved organic carbon in the sample. The chemistry of this sample is consistent with preferential elution of acidic components from the snowpack (Mulvaney and others, 1988; Berg, 1992). Although there was little flow in the stream, the water may be representative of small pools in the stream channel or wetlands that form at the onset of snowmelt. The chemistry of the sample is indicative of episodic acidification, and this type of water may pose a hazard for sensitive aquatic species and amphibians that live in stream or wetland environments (Barmuta and others, 1990; Stoddard, 1995).
Seasonal patterns in sulfate concentrations were generally similar to those of solutes derived from weathering, except that seasonal maxima sometimes occurred somewhat later, on the rising limb of the snowmelt hydrograph, rather than prior to the beginning of snowmelt. The seasonal maxima occurs later for sulfate than for weathering products because sulfate is derived from melting snow as well as from flushing of sulfate temporarily stored in the soil in organic and inorganic forms.
SurveyData
sourceNumber of lakes
Elevation (m)
Depth (m)
Area (ha)
Specific conductance
(µS/cm)pH
Ammonium (µeq/L)
Nitrate (µeq/L)
Sulfate (µeq/L)
Alkalinity (µeq/L)
Total Phosphorus
(µg/L)
MORA, 1985 1 5 1,449 8.7 2.9 25.7 6.3 0.3 0.1 27.5 202.2 4.7
MORA, 1988 2 27 1,547 13.8 5.5 15.2 6.7 0.2 0.2 -- 122.0 11.0
NOCA, 1985 1 6 1,735 34.4 26.8 10.3 6.5 ≤0.1 0.4 29.1 68.3 1.2
NOCA, 1989–93 3 58 1,503 7.1 14.5 24.2 7.0 0.4 0.5 -- 52.0 7.0
Western Lake Survey, high-elevation lakes in northern Cascade Mountains
1 87 1,500 17.3 12.6 24.0 6.6 0.2 0.6 29.5 197.1 3.9
Data sources:1. Western Lake Survey, Eilers and others, 1987.2. MORA lake survey, Larson and othes, 1994.3. NOCA lake surveys, Larson and others, 1999.
Table 4. Average solute concentrations during lake surveys in Mount Rainier National Park (MORA) and North Cascades National Park (NOCA).
[m, meters; ha, hectares; µS/cm, microsiemens per centimeter; µeq/L, microequivalents per liter; µg/L, micrograms per liter; ≤, equal to or less than; --, no data]
20 Atmospheric Deposition and Surface-Water Chemistry in Mount Rainier and North Cascades National Parks, USA
0 DISC
HARG
E, IN
CUB
IC M
ETER
S PE
R SE
CON
D
0.5
1.0
1.5
2.0
2.5
0 DISC
HARG
E, IN
CUB
IC M
ETER
S PE
R SE
CON
D
0.5
1.0
1.5
2.0
2.5
0 DISC
HARG
E, IN
CUB
IC M
ETER
S PE
R SE
CON
D
0.5
1.0
1.5
2.0
2.5
0 DISC
HARG
E, IN
CUB
IC M
ETER
S PE
R SE
CON
D0.5
1.0
1.5
2.0
2.5
0 DISC
HARG
E, IN
CUB
IC M
ETER
S PE
R SE
CON
D
0.5
1.0
1.5
2.0
2.5
0 DISC
HARG
E, IN
CUB
IC M
ETER
S PE
R SE
CON
D
0.5
1.0
1.5
2.0
2.5
0 DISC
HARG
E, IN
CUB
IC M
ETER
S PE
R SE
CON
D
0.5
1.0
1.5
2.0
2.5
0 DISC
HARG
E, IN
CUB
IC M
ETER
S PE
R SE
CON
D
0.5
1.0
1.5
2.0
2.5
0 DISC
HARG
E, IN
CUB
IC M
ETER
S PE
R SE
CON
D
0.5
1.0
1.5
2.0
2.5
0 DISC
HARG
E, IN
CUB
IC M
ETER
S PE
R SE
CON
D
0.5
1.0
1.5
2.0
2.5
9/1/2004 9/1/2005 9/1/2006
9/1/2004 9/1/2005 9/1/2006
9/1/2004 9/1/2005 9/1/2006
9/1/2004 9/1/2005 9/1/2006
9/1/2004 9/1/2005 9/1/2006 9/1/2004 9/1/2005 9/1/2006
9/1/2004 9/1/2005 9/1/2006
9/1/2004 9/1/2005 9/1/2006
9/1/2004 9/1/2005 9/1/2006
9/1/2004 9/1/2005 9/1/2006
SILI
CA, I
N M
ICRO
MOL
ES P
ER L
ITER
SODI
UM, I
N M
ICRO
EQUI
VALE
NTS
PER
LIT
ERCA
LCIU
M, I
N M
ICRO
EQUI
VALE
NTS
PER
LIT
ERpH
SPEC
IFIC
CON
DUCT
ANCE
, IN
MIC
ROSI
EMEN
SPE
R CE
NTI
MET
ER
5
15Outlet Replicate Epilimnion Discharge
10
0
6.8
6.7
6.6
6.5
6.3
6.4
6.2
60
40
50
30
20
10
0
40
35
30
20
25
15
10
5
0
0
20
30
10
40
50
60
70
80
90
100
ALKA
LIN
ITY,
IN M
ICRO
EQUI
VALE
NTS
PER
LIT
ER 80
70
60
50
40
30
20
10
0
SULF
ATE,
IN M
ICRO
EQUI
VALE
NTS
PER
LIT
ER
16
14
12
10
8
6
4
2
0N
ITRA
TE, I
N M
ICRO
EQUI
VALE
NTS
PER
LIT
ER
3.0
2.0
2.5
1.5
1.0
0.5
0
CHLO
RIDE
, IN
MIC
ROEQ
UIVA
LEN
TS P
ER L
ITER
16
14
12
10
8
6
4
2
0
DISS
OLVE
D OR
GAN
IC C
ARBO
N,
IN M
ILLI
GRAM
S PE
R LI
TER
1.6
1.4
1.2
1.0
0.8
0.6
0.4
0.2
0
Figure 10. Seasonal patterns in solute concentrations and discharge at Lake Louise outlet.
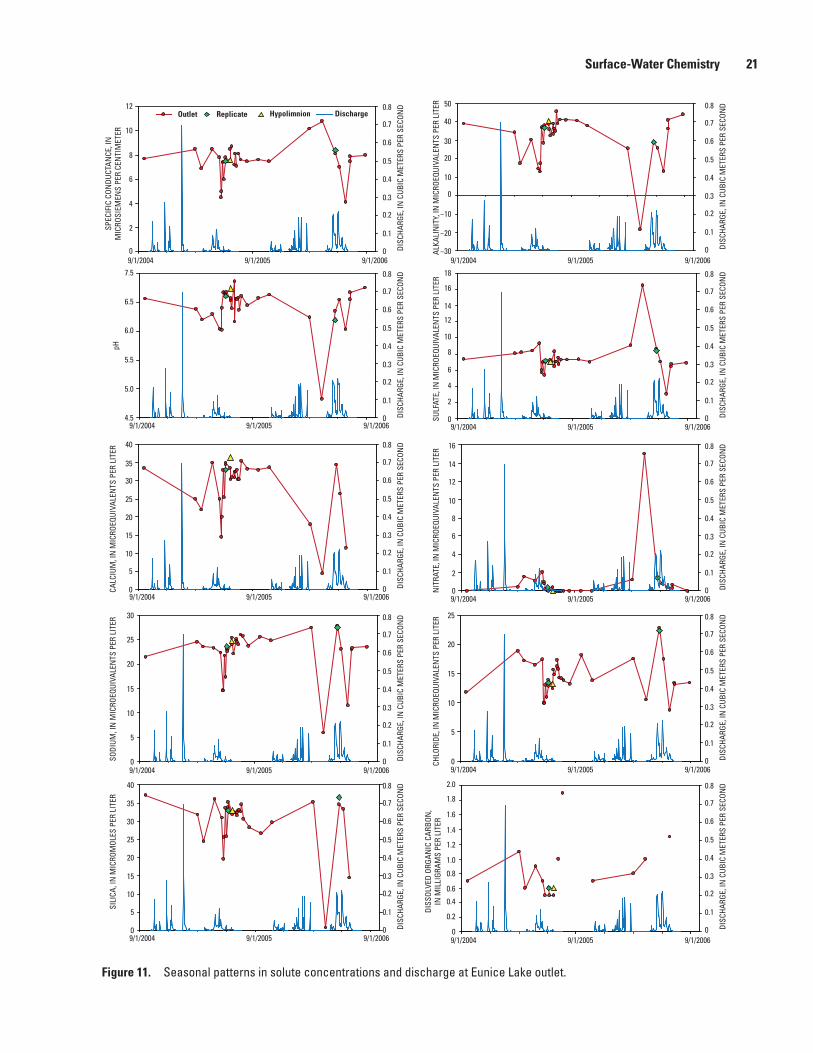
Surface-Water Chemistry 21
0 DISC
HARG
E, IN
CUB
IC M
ETER
S PE
R SE
CON
D
0.1
0.2
0.3
0.4
0.8
0.7
0.6
0.5
0 DISC
HARG
E, IN
CUB
IC M
ETER
S PE
R SE
CON
D0.1
0.2
0.3
0.4
0.8
0.7
0.6
0.5
0 DISC
HARG
E, IN
CUB
IC M
ETER
S PE
R SE
CON
D
0.1
0.2
0.3
0.4
0.8
0.7
0.6
0.5
0 DISC
HARG
E, IN
CUB
IC M
ETER
S PE
R SE
CON
D
0.1
0.2
0.3
0.4
0.8
0.7
0.6
0.5
0 DISC
HARG
E, IN
CUB
IC M
ETER
S PE
R SE
CON
D
0.1
0.2
0.3
0.4
0.8
0.7
0.6
0.5
0 DISC
HARG
E, IN
CUB
IC M
ETER
S PE
R SE
CON
D
0.1
0.2
0.3
0.4
0.8
0.7
0.6
0.5
0 DISC
HARG
E, IN
CUB
IC M
ETER
S PE
R SE
CON
D
0.1
0.2
0.3
0.4
0.8
0.7
0.6
0.5
0 DISC
HARG
E, IN
CUB
IC M
ETER
S PE
R SE
CON
D
0.1
0.2
0.3
0.4
0.8
0.7
0.6
0.5
0 DISC
HARG
E, IN
CUB
IC M
ETER
S PE
R SE
CON
D
0.1
0.2
0.3
0.4
0.8
0.7
0.6
0.5
0 DISC
HARG
E, IN
CUB
IC M
ETER
S PE
R SE
CON
D
0.1
0.2
0.3
0.4
0.8
0.7
0.6
0.5
9/1/2004 9/1/2005 9/1/2006
9/1/2004 9/1/2005 9/1/2006
9/1/2004 9/1/2005 9/1/2006
9/1/2004 9/1/2005 9/1/2006
9/1/2004 9/1/2005 9/1/2006 9/1/2004 9/1/2005 9/1/2006
9/1/2004 9/1/2005 9/1/2006
9/1/2004 9/1/2005 9/1/2006
9/1/2004 9/1/2005 9/1/2006
9/1/2004 9/1/2005 9/1/2006
SILI
CA, I
N M
ICRO
MOL
ES P
ER L
ITER
SODI
UM, I
N M
ICRO
EQUI
VALE
NTS
PER
LIT
ERCA
LCIU
M, I
N M
ICRO
EQUI
VALE
NTS
PER
LIT
ERpH
12Outlet Replicate Hypolimnion Discharge
10
8
6
4
2
0
7.5
6.5
6.0
5.5
5.0
4.5
40
35
25
30
10
5
15
20
0
30
25
20
15
10
0
5
0
5
10
15
20
25
30
35
40
SPEC
IFIC
CON
DUCT
ANCE
, IN
MIC
ROSI
EMEN
S PE
R CE
NTI
MET
ER
DISS
OLVE
D OR
GAN
IC C
ARBO
N,
IN M
ILLI
GRAM
S PE
R LI
TER
1.4
1.6
1.8
2.0
1.2
1.0
0.8
0.6
0.4
0.2
0
CHLO
RIDE
, IN
MIC
ROEQ
UIVA
LEN
TS P
ER L
ITER
25
20
15
10
5
0
NIT
RATE
, IN
MIC
ROEQ
UIVA
LEN
TS P
ER L
ITER
10
12
14
16
8
6
4
2
0
SULF
ATE,
IN M
ICRO
EQUI
VALE
NTS
PER
LIT
ER
18
16
14
12
10
8
6
4
2
0
ALKA
LIN
ITY,
IN M
ICRO
EQUI
VALE
NTS
PER
LIT
ER 50
40
30
20
10
0
−10
−20
−30
Figure 11. Seasonal patterns in solute concentrations and discharge at Eunice Lake outlet.
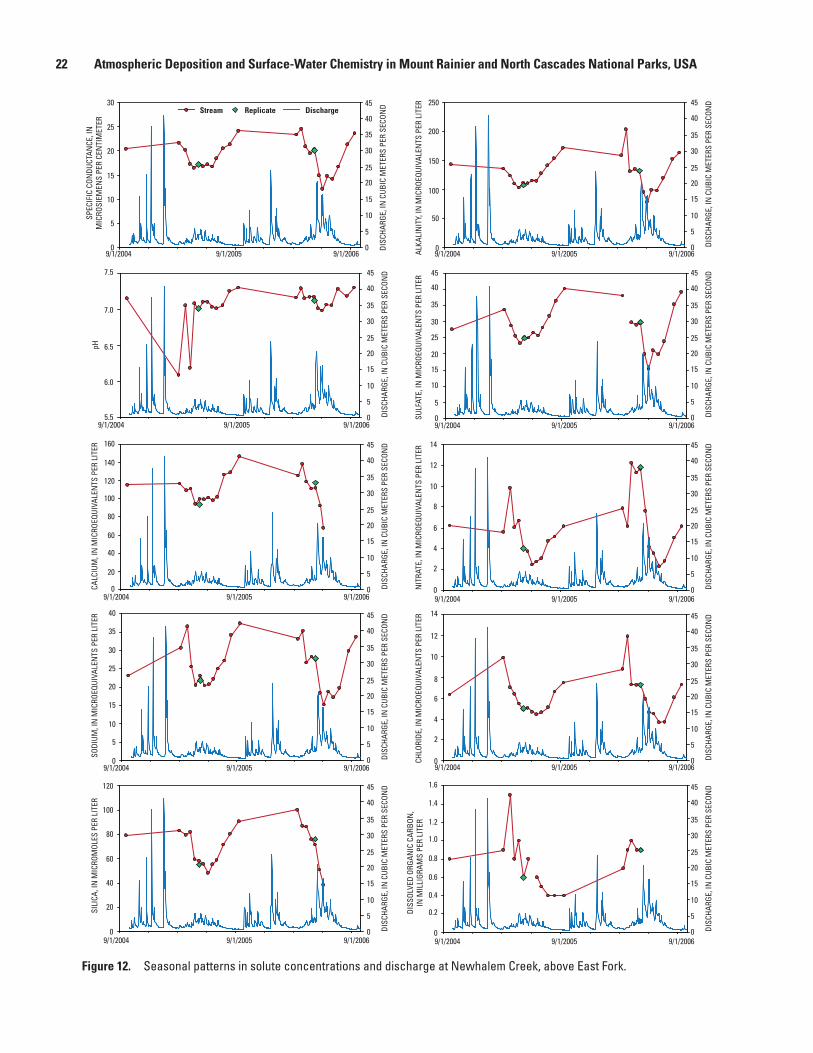
22 Atmospheric Deposition and Surface-Water Chemistry in Mount Rainier and North Cascades National Parks, USA
0 DISC
HARG
E, IN
CUB
IC M
ETER
S PE
R SE
CON
D
5
10
15
20
25
30
35
40
45
0 DISC
HARG
E, IN
CUB
IC M
ETER
S PE
R SE
CON
D
5
10
15
20
25
30
35
40
45
0 DISC
HARG
E, IN
CUB
IC M
ETER
S PE
R SE
CON
D
5
10
15
20
25
30
35
40
45
0 DISC
HARG
E, IN
CUB
IC M
ETER
S PE
R SE
CON
D
5
10
15
20
25
30
35
40
45
0 DISC
HARG
E, IN
CUB
IC M
ETER
S PE
R SE
CON
D
5
10
15
20
25
30
35
40
45
0 DISC
HARG
E, IN
CUB
IC M
ETER
S PE
R SE
CON
D
5
10
15
20
25
30
35
40
45
0 DISC
HARG
E, IN
CUB
IC M
ETER
S PE
R SE
CON
D
5
10
15
20
25
30
35
40
45
0 DISC
HARG
E, IN
CUB
IC M
ETER
S PE
R SE
CON
D
5
10
15
20
25
30
35
40
45
0 DISC
HARG
E, IN
CUB
IC M
ETER
S PE
R SE
CON
D
5
10
15
20
25
30
35
40
45
0 DISC
HARG
E, IN
CUB
IC M
ETER
S PE
R SE
CON
D
5
10
15
20
25
30
35
40
45
9/1/2004 9/1/2005 9/1/2006
9/1/2004 9/1/2005 9/1/2006
9/1/2004 9/1/2005 9/1/2006
9/1/2004 9/1/2005 9/1/2006
9/1/2004 9/1/2005 9/1/2006 9/1/2004 9/1/2005 9/1/2006
9/1/2004 9/1/2005 9/1/2006
9/1/2004 9/1/2005 9/1/2006
9/1/2004 9/1/2005 9/1/2006
9/1/2004 9/1/2005 9/1/2006
SILI
CA, I
N M
ICRO
MOL
ES P
ER L
ITER
SODI
UM, I
N M
ICRO
EQUI
VALE
NTS
PER
LIT
ERCA
LCIU
M, I
N M
ICRO
EQUI
VALE
NTS
PER
LIT
ERpH
SPEC
IFIC
CON
DUCT
ANCE
, IN
MIC
ROSI
EMEN
S PE
R CE
NTI
MET
ER30
Stream Replicate Discharge
25
20
15
10
5
0
7.5
7.0
6.5
6.0
5.5
160
140
100
120
40
20
60
80
0
40
35
30
25
20
15
10
0
5
0
20
40
60
80
100
120
ALKA
LIN
ITY,
IN M
ICRO
EQUI
VALE
NTS
PER
LIT
ER 250
200
150
100
50
0
SULF
ATE,
IN M
ICRO
EQUI
VALE
NTS
PER
LIT
ER
40
45
35
30
25
20
15
10
5
0N
ITRA
TE, I
N M
ICRO
EQUI
VALE
NTS
PER
LIT
ER
10
12
14
8
6
4
2
0
CHLO
RIDE
, IN
MIC
ROEQ
UIVA
LEN
TS P
ER L
ITER
14
12
10
8
2
4
6
0
DISS
OLVE
D OR
GAN
IC C
ARBO
N,
IN M
ILLI
GRAM
S PE
R LI
TER
1.6
1.4
1.2
1.0
0.8
0.6
0.4
0.2
0
Figure 12. Seasonal patterns in solute concentrations and discharge at Newhalem Creek, above East Fork.
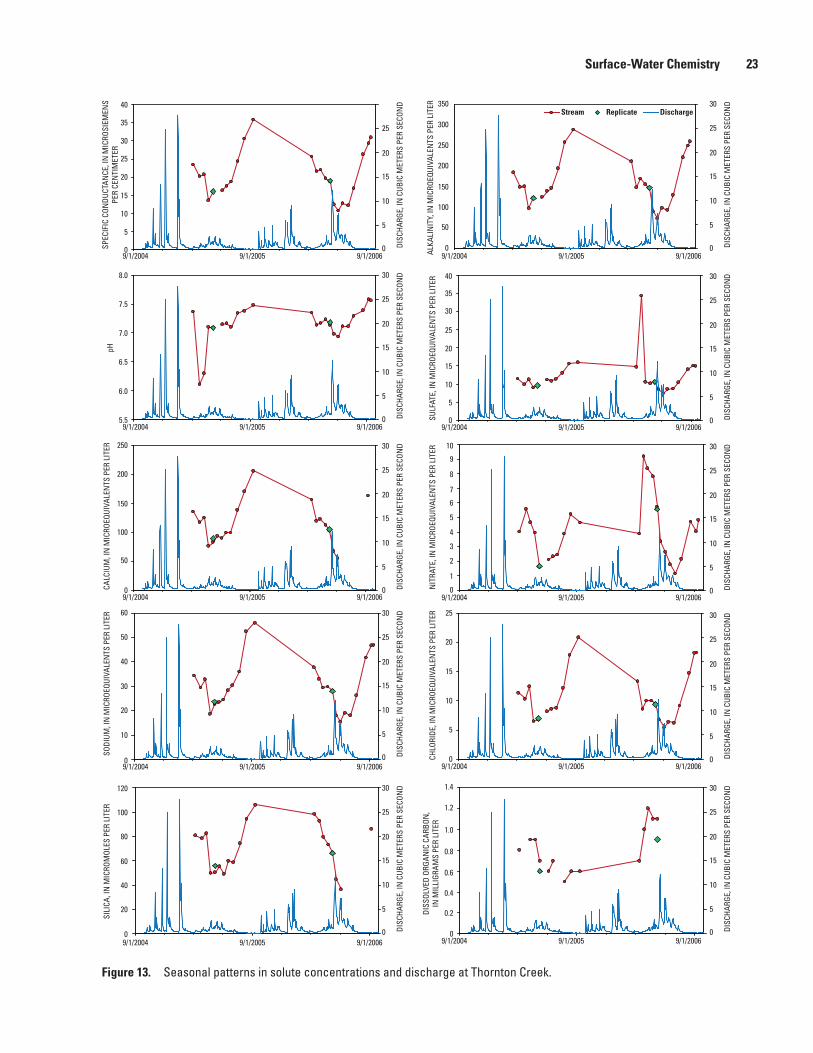
Surface-Water Chemistry 23
0 DISC
HARG
E, IN
CUB
IC M
ETER
S PE
R SE
CON
D
ALKA
LIN
ITY,
IN M
ICRO
EQUI
VALE
NTS
PER
LIT
ER
5
10
15
20
350Stream Replicate Discharge
300
250
200
150
100
50
0
SULF
ATE,
IN M
ICRO
EQUI
VALE
NTS
PER
LIT
ER
40
35
30
25
20
15
10
5
0N
ITRA
TE, I
N M
ICRO
EQUI
VALE
NTS
PER
LIT
ER
10
7
8
9
6
5
4
3
2
1
0
CHLO
RIDE
, IN
MIC
ROEQ
UIVA
LEN
TS P
ER L
ITER 25
20
15
10
5
0
DISS
OLVE
D OR
GAN
IC C
ARBO
N,
IN M
ILLI
GRAM
S PE
R LI
TER
1.4
1.2
1.0
0.8
0.6
0.4
0.2
0
25
0 DISC
HARG
E, IN
CUB
IC M
ETER
S PE
R SE
CON
D5
10
15
20
30
25
0 DISC
HARG
E, IN
CUB
IC M
ETER
S PE
R SE
CON
D
5
10
15
20
30
25
0 DISC
HARG
E, IN
CUB
IC M
ETER
S PE
R SE
CON
D
5
10
15
20
30
25
0 DISC
HARG
E, IN
CUB
IC M
ETER
S PE
R SE
CON
D
5
10
15
20
30
25
0 DISC
HARG
E, IN
CUB
IC M
ETER
S PE
R SE
CON
D
5
10
15
20
30
25
0 DISC
HARG
E, IN
CUB
IC M
ETER
S PE
R SE
CON
D5
10
15
20
30
25
0 DISC
HARG
E, IN
CUB
IC M
ETER
S PE
R SE
CON
D
5
10
15
20
30
25
0 DISC
HARG
E, IN
CUB
IC M
ETER
S PE
R SE
CON
D
5
10
15
20
30
25
0 DISC
HARG
E, IN
CUB
IC M
ETER
S PE
R SE
CON
D
5
10
15
20
30
25
9/1/2004 9/1/2005 9/1/2006
9/1/2004 9/1/2005 9/1/2006
9/1/2004 9/1/2005 9/1/2006
9/1/2004 9/1/2005 9/1/2006 9/1/2004 9/1/2005 9/1/2006
9/1/2004 9/1/2005 9/1/2006
9/1/2004 9/1/2005 9/1/2006
9/1/2004 9/1/2005 9/1/2006
9/1/2004 9/1/2005 9/1/20069/1/2004
SILI
CA, I
N M
ICRO
MOL
ES P
ER L
ITER
SODI
UM, I
N M
ICRO
EQUI
VALE
NTS
PER
LIT
ERCA
LCIU
M, I
N M
ICRO
EQUI
VALE
NTS
PER
LIT
ERpH
SPEC
IFIC
CON
DUCT
ANCE
, IN
MIC
ROSI
EMEN
SPE
R CE
NTI
MET
ER
9/1/2005 9/1/2006
40
35
30
25
20
15
10
5
0
8.0
7.5
7.0
6.5
6.0
5.5
250
200
150
100
50
0
60
50
40
30
20
10
0
0
20
40
60
80
100
120
Figure 13. Seasonal patterns in solute concentrations and discharge at Thornton Creek.
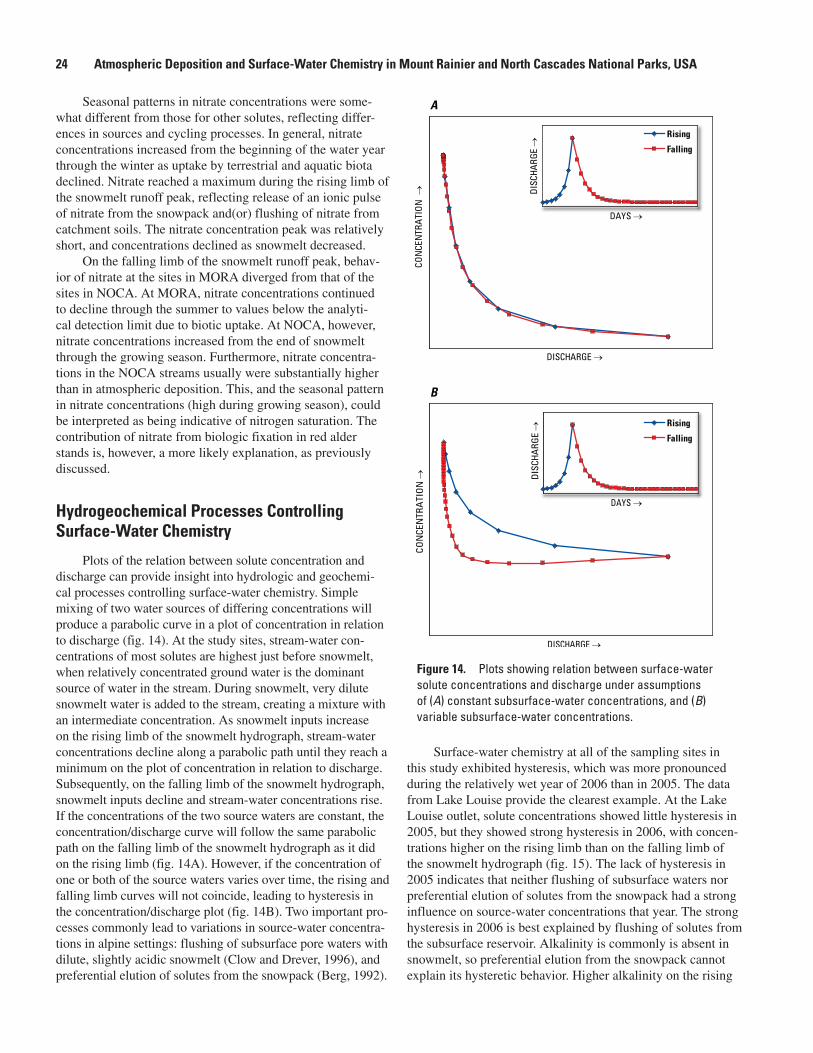
24 Atmospheric Deposition and Surface-Water Chemistry in Mount Rainier and North Cascades National Parks, USA
Seasonal patterns in nitrate concentrations were some-what different from those for other solutes, reflecting differ-ences in sources and cycling processes. In general, nitrate concentrations increased from the beginning of the water year through the winter as uptake by terrestrial and aquatic biota declined. Nitrate reached a maximum during the rising limb of the snowmelt runoff peak, reflecting release of an ionic pulse of nitrate from the snowpack and(or) flushing of nitrate from catchment soils. The nitrate concentration peak was relatively short, and concentrations declined as snowmelt decreased.
On the falling limb of the snowmelt runoff peak, behav-ior of nitrate at the sites in MORA diverged from that of the sites in NOCA. At MORA, nitrate concentrations continued to decline through the summer to values below the analyti-cal detection limit due to biotic uptake. At NOCA, however, nitrate concentrations increased from the end of snowmelt through the growing season. Furthermore, nitrate concentra-tions in the NOCA streams usually were substantially higher than in atmospheric deposition. This, and the seasonal pattern in nitrate concentrations (high during growing season), could be interpreted as being indicative of nitrogen saturation. The contribution of nitrate from biologic fixation in red alder stands is, however, a more likely explanation, as previously discussed.
Hydrogeochemical Processes Controlling Surface-Water Chemistry
Plots of the relation between solute concentration and discharge can provide insight into hydrologic and geochemi-cal processes controlling surface-water chemistry. Simple mixing of two water sources of differing concentrations will produce a parabolic curve in a plot of concentration in relation to discharge (fig. 14). At the study sites, stream-water con-centrations of most solutes are highest just before snowmelt, when relatively concentrated ground water is the dominant source of water in the stream. During snowmelt, very dilute snowmelt water is added to the stream, creating a mixture with an intermediate concentration. As snowmelt inputs increase on the rising limb of the snowmelt hydrograph, stream-water concentrations decline along a parabolic path until they reach a minimum on the plot of concentration in relation to discharge. Subsequently, on the falling limb of the snowmelt hydrograph, snowmelt inputs decline and stream-water concentrations rise. If the concentrations of the two source waters are constant, the concentration/discharge curve will follow the same parabolic path on the falling limb of the snowmelt hydrograph as it did on the rising limb (fig. 14A). However, if the concentration of one or both of the source waters varies over time, the rising and falling limb curves will not coincide, leading to hysteresis in the concentration/discharge plot (fig. 14B). Two important pro-cesses commonly lead to variations in source-water concentra-tions in alpine settings: flushing of subsurface pore waters with dilute, slightly acidic snowmelt (Clow and Drever, 1996), and preferential elution of solutes from the snowpack (Berg, 1992).
Surface-water chemistry at all of the sampling sites in this study exhibited hysteresis, which was more pronounced during the relatively wet year of 2006 than in 2005. The data from Lake Louise provide the clearest example. At the Lake Louise outlet, solute concentrations showed little hysteresis in 2005, but they showed strong hysteresis in 2006, with concen-trations higher on the rising limb than on the falling limb of the snowmelt hydrograph (fig. 15). The lack of hysteresis in 2005 indicates that neither flushing of subsurface waters nor preferential elution of solutes from the snowpack had a strong influence on source-water concentrations that year. The strong hysteresis in 2006 is best explained by flushing of solutes from the subsurface reservoir. Alkalinity is commonly is absent in snowmelt, so preferential elution from the snowpack cannot explain its hysteretic behavior. Higher alkalinity on the rising
A
Rising
Falling
Rising
Falling
B
Figure 14. Plots showing relation between surface-water solute concentrations and discharge under assumptions of (A) constant subsurface-water concentrations, and (B) variable subsurface-water concentrations.
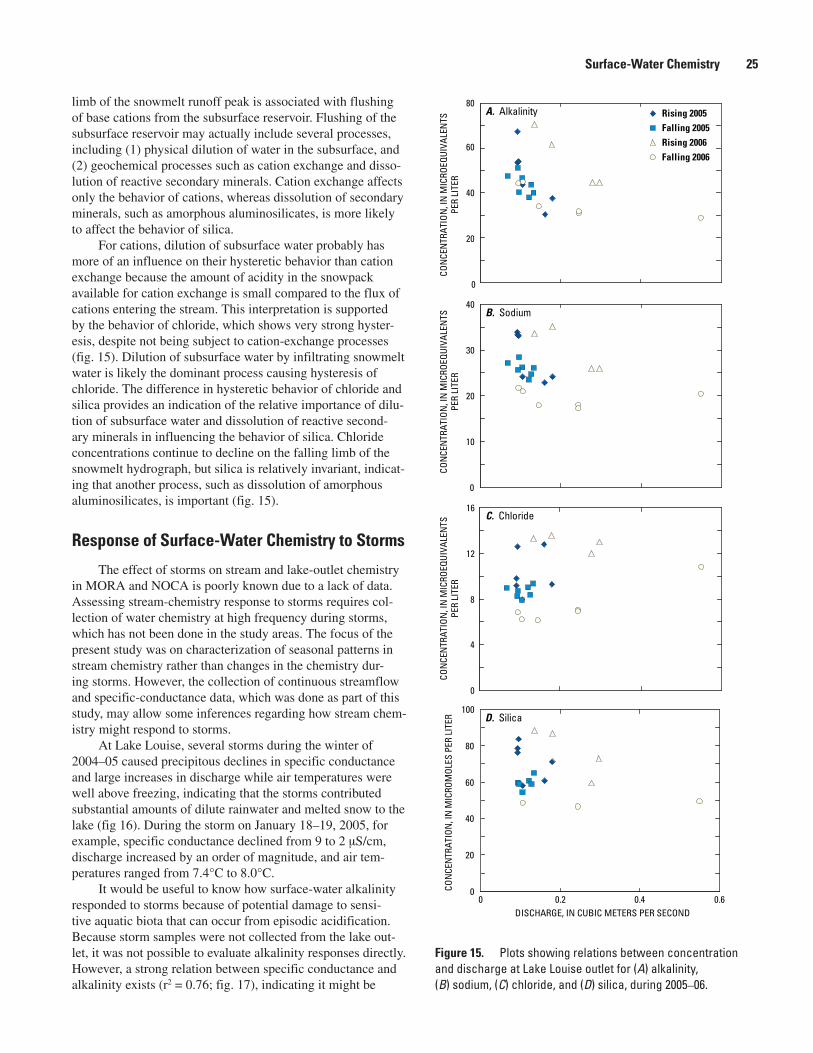
Surface-Water Chemistry 25
limb of the snowmelt runoff peak is associated with flushing of base cations from the subsurface reservoir. Flushing of the subsurface reservoir may actually include several processes, including (1) physical dilution of water in the subsurface, and (2) geochemical processes such as cation exchange and disso-lution of reactive secondary minerals. Cation exchange affects only the behavior of cations, whereas dissolution of secondary minerals, such as amorphous aluminosilicates, is more likely to affect the behavior of silica.
For cations, dilution of subsurface water probably has more of an influence on their hysteretic behavior than cation exchange because the amount of acidity in the snowpack available for cation exchange is small compared to the flux of cations entering the stream. This interpretation is supported by the behavior of chloride, which shows very strong hyster-esis, despite not being subject to cation-exchange processes (fig. 15). Dilution of subsurface water by infiltrating snowmelt water is likely the dominant process causing hysteresis of chloride. The difference in hysteretic behavior of chloride and silica provides an indication of the relative importance of dilu-tion of subsurface water and dissolution of reactive second-ary minerals in influencing the behavior of silica. Chloride concentrations continue to decline on the falling limb of the snowmelt hydrograph, but silica is relatively invariant, indicat-ing that another process, such as dissolution of amorphous aluminosilicates, is important (fig. 15).
Response of Surface-Water Chemistry to Storms
The effect of storms on stream and lake-outlet chemistry in MORA and NOCA is poorly known due to a lack of data. Assessing stream-chemistry response to storms requires col-lection of water chemistry at high frequency during storms, which has not been done in the study areas. The focus of the present study was on characterization of seasonal patterns in stream chemistry rather than changes in the chemistry dur-ing storms. However, the collection of continuous streamflow and specific-conductance data, which was done as part of this study, may allow some inferences regarding how stream chem-istry might respond to storms.
At Lake Louise, several storms during the winter of 2004–05 caused precipitous declines in specific conductance and large increases in discharge while air temperatures were well above freezing, indicating that the storms contributed substantial amounts of dilute rainwater and melted snow to the lake (fig 16). During the storm on January 18–19, 2005, for example, specific conductance declined from 9 to 2 µS/cm, discharge increased by an order of magnitude, and air tem-peratures ranged from 7.4°C to 8.0°C.
It would be useful to know how surface-water alkalinity responded to storms because of potential damage to sensi-tive aquatic biota that can occur from episodic acidification. Because storm samples were not collected from the lake out-let, it was not possible to evaluate alkalinity responses directly. However, a strong relation between specific conductance and alkalinity exists (r2 = 0.76; fig. 17), indicating it might be
A. Alkalinity
0
20
40
60
80
D. Silica
0
20
40
60
80
100
0 0.2 0.4 0.6DISCHARGE, IN CUBIC METERS PER SECOND
C. Chloride
0
4
8
12
16
CON
CEN
TRAT
ION
, IN
MIC
ROEQ
UIVA
LEN
TSPE
R LI
TER
CON
CEN
TRAT
ION
, IN
MIC
ROEQ
UIVA
LEN
TSPE
R LI
TER
CON
CEN
TRAT
ION
, IN
MIC
ROEQ
UIVA
LEN
TSPE
R LI
TER
CON
CEN
TRAT
ION
, IN
MIC
ROM
OLES
PER
LIT
ER
B. Sodium
0
10
20
30
40
Rising 2005Falling 2005Rising 2006Falling 2006
Figure 15. Plots showing relations between concentration and discharge at Lake Louise outlet for (A) alkalinity, (B) sodium, (C) chloride, and (D) silica, during 2005–06.
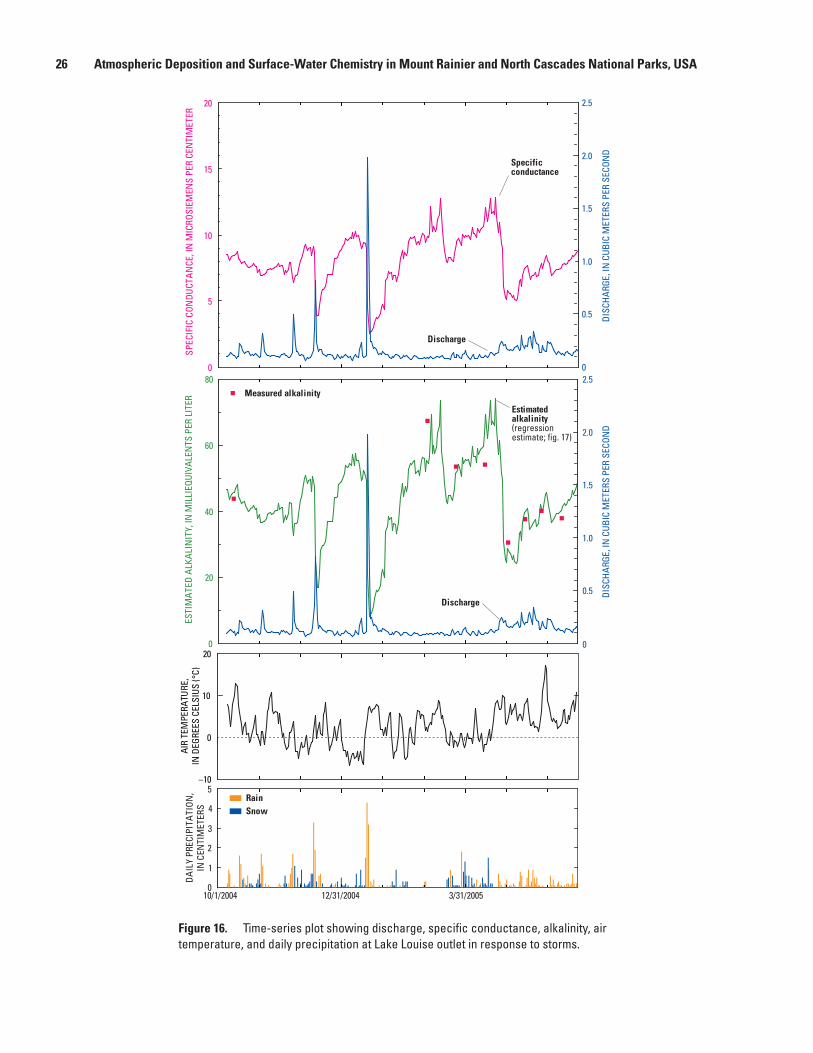
26 Atmospheric Deposition and Surface-Water Chemistry in Mount Rainier and North Cascades National Parks, USA
0
5
10
15
20
SPEC
IFIC
CON
DUCT
AN
CE, I
N M
ICRO
SIEM
ENS
PER
CEN
TIM
ETER
0
0.5
1.0
1.5
2.0
2.5
DIS
CHA
RGE,
IN C
UBIC
MET
ERS
PER
SECO
ND
DIS
CHA
RGE,
IN C
UBIC
MET
ERS
PER
SECO
ND
Specificconductance
Discharge
0
20
40
60
80
ESTI
MA
TED
ALK
ALI
NIT
Y, IN
MIL
LIEQ
UIVA
LEN
TS P
ER L
ITER
0
0.5
1.0
1.5
2.0
2.5
Estimatedalkalinity(regressionestimate; fig. 17)
Measured alkalinity
0
1
2
3
4
5
10/1/2004 12/31/2004 3/31/2005
DA
ILY
PREC
IPIT
ATI
ON,
IN C
ENTI
MET
ERS
RainSnow
Discharge
–10
0
10
20
AIR
TEM
PERA
TURE
,IN
DEG
REES
CEL
SIUS
(°C)
Figure 16. Time-series plot showing discharge, specific conductance, alkalinity, air temperature, and daily precipitation at Lake Louise outlet in response to storms.
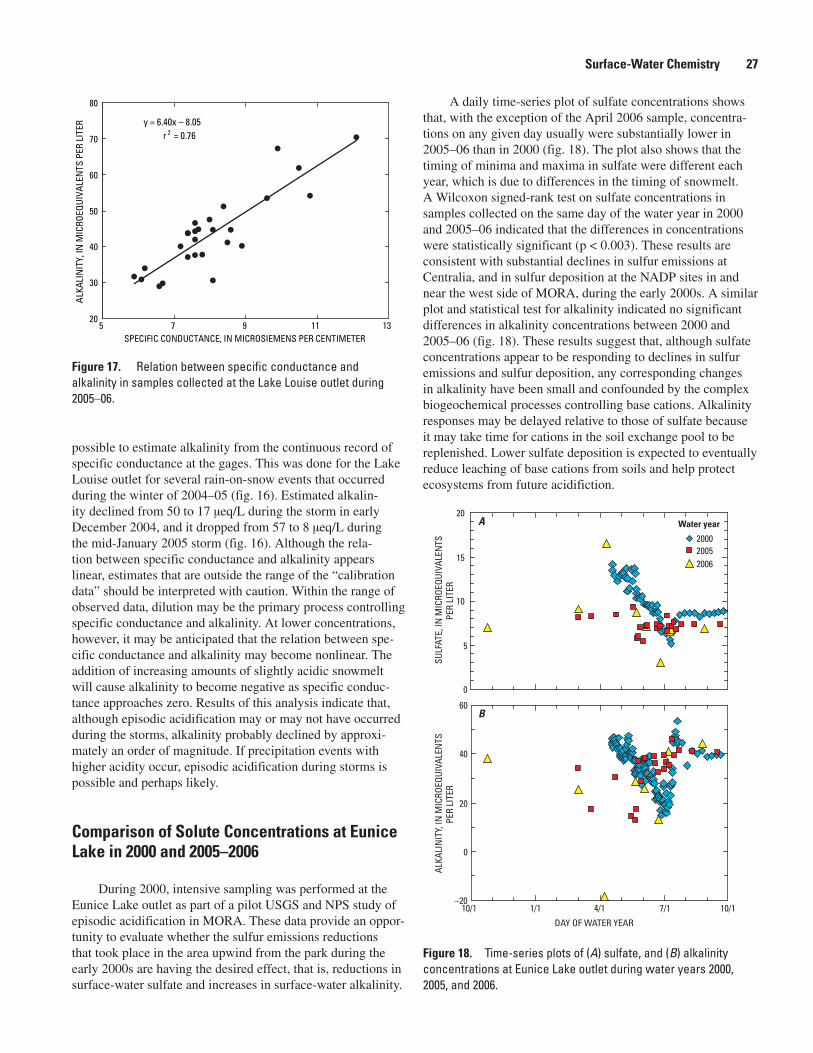
Surface-Water Chemistry 27
possible to estimate alkalinity from the continuous record of specific conductance at the gages. This was done for the Lake Louise outlet for several rain-on-snow events that occurred during the winter of 2004–05 (fig. 16). Estimated alkalin-ity declined from 50 to 17 µeq/L during the storm in early December 2004, and it dropped from 57 to 8 µeq/L during the mid-January 2005 storm (fig. 16). Although the rela-tion between specific conductance and alkalinity appears linear, estimates that are outside the range of the “calibration data” should be interpreted with caution. Within the range of observed data, dilution may be the primary process controlling specific conductance and alkalinity. At lower concentrations, however, it may be anticipated that the relation between spe-cific conductance and alkalinity may become nonlinear. The addition of increasing amounts of slightly acidic snowmelt will cause alkalinity to become negative as specific conduc-tance approaches zero. Results of this analysis indicate that, although episodic acidification may or may not have occurred during the storms, alkalinity probably declined by approxi-mately an order of magnitude. If precipitation events with higher acidity occur, episodic acidification during storms is possible and perhaps likely.
Comparison of Solute Concentrations at Eunice Lake in 2000 and 2005–2006
During 2000, intensive sampling was performed at the Eunice Lake outlet as part of a pilot USGS and NPS study of episodic acidification in MORA. These data provide an oppor-tunity to evaluate whether the sulfur emissions reductions that took place in the area upwind from the park during the early 2000s are having the desired effect, that is, reductions in surface-water sulfate and increases in surface-water alkalinity.
A daily time-series plot of sulfate concentrations shows that, with the exception of the April 2006 sample, concentra-tions on any given day usually were substantially lower in 2005–06 than in 2000 (fig. 18). The plot also shows that the timing of minima and maxima in sulfate were different each year, which is due to differences in the timing of snowmelt. A Wilcoxon signed-rank test on sulfate concentrations in samples collected on the same day of the water year in 2000 and 2005–06 indicated that the differences in concentrations were statistically significant (p < 0.003). These results are consistent with substantial declines in sulfur emissions at Centralia, and in sulfur deposition at the NADP sites in and near the west side of MORA, during the early 2000s. A similar plot and statistical test for alkalinity indicated no significant differences in alkalinity concentrations between 2000 and 2005–06 (fig. 18). These results suggest that, although sulfate
concentrations appear to be responding to declines in sulfur emissions and sulfur deposition, any corresponding changes in alkalinity have been small and confounded by the complex biogeochemical processes controlling base cations. Alkalinity responses may be delayed relative to those of sulfate because it may take time for cations in the soil exchange pool to be replenished. Lower sulfate deposition is expected to eventually reduce leaching of base cations from soils and help protect ecosystems from future acidifiction.
y = 6.40x – 8.05r 2 = 0.76
20
30
40
50
60
70
80
5 7 9 11 13SPECIFIC CONDUCTANCE, IN MICROSIEMENS PER CENTIMETER
ALK
ALIN
ITY,
IN M
ICRO
EQUI
VALE
NTS
PER
LIT
ER
0
5
10
15
20
200020052006
–20
0
20
40
60
10/1 1/1 4/1 7/1 10/1
DAY OF WATER YEAR
ALKA
LIN
ITY,
IN M
ICRO
EQUI
VALE
NTS
PER
LITE
R SU
LFAT
E, IN
MIC
ROEQ
UIVA
LEN
TSPE
R LI
TER
Water yearA
B
Figure 17. Relation between specific conductance and alkalinity in samples collected at the Lake Louise outlet during 2005–06.
Figure 18. Time-series plots of (A) sulfate, and (B) alkalinity concentrations at Eunice Lake outlet during water years 2000, 2005, and 2006.
28 Atmospheric Deposition and Surface-Water Chemistry in Mount Rainier and North Cascades National Parks, USA
Synthesis of Historical Lake-Chemistry Data
Data Sets
Substantial sets of lake-chemistry data are available for MORA and NOCA. The MORA data sets include (1) detailed chemistry on five lakes sampled as part of the 1985 Western Lake Survey (Eilers and others, 1987; Nelson, 1991); (2) sta-tistical summaries of pH, specific conductance, alkalinity, and nutrients in 27 lakes from a survey conducted in 1988 (Larson and others, 1994); (3) a USGS report on water quality in rela-tion to acidification (Turney and others, 1986); and (4) data in an unpublished database maintained by MORA staff, which contains chemical data from 65 lakes and ponds sampled by NPS between 1988 and 2004 as part of ongoing monitoring. The primary NOCA data sets include (1) detailed chemistry on six lakes sampled as part of the 1985 Western Lake Survey (Eilers and others, 1987; Nelson, 1991); (2) a statistical summary of alkalinity concentrations in 14 lakes sampled in 1983–84 (Brakke and Loranger, 1986); (3) statistical summa-ries of lake pH, specific conductance, alkalinity, and nutrients from lake surveys conducted during 1989 through 1993 in which a total of 58 lakes were sampled (Larson and others, 1999); and (4) data in an unpublished database maintained by NOCA staff, which primarily contains data on pH, alkalinity, nutrients, and field properties collected through a variety of studies in the park during 1970–99.
Although the number of lake-water samples collected in the parks is large, most were analyzed only for pH, specific conductance, and alkalinity; nonetheless, they provide a useful database for evaluating acidification status. Slightly less than one-half of the samples were analyzed for nutrients, includ-ing nitrate, ammonium, orthophosphate, and total phosphorus; data from these samples allow determination of lake trophic status and nutrient limitation. A small subset of samples col-lected in MORA (less than 15 percent) and NOCA (less than 1 percent) were analyzed for all major constituents, including pH, specific conductance, alkalinity, cations, anions, and nutri-ents. These samples are valuable because data can be checked for quality using charge-balance calculations and because they provide sufficient information for identifying major processes responsible for contributing solutes to surface waters.
It should be noted that the average solute concentra-tions calculated for lakes using data in the unpublished NPS water-chemistry databases should be interpreted with caution because the number and timing of samples collected from the lakes vary substantially.
Lake Characteristics
Lakes in MORA and NOCA typically are cold, clear, and dilute (Larson and others, 1994). The dominant solutes include calcium, sodium, bicarbonate (alkalinity), and silica. Their
depth and area are highly variable, but on average, they are small and shallow (table 4). They generally are at high eleva-tion and are snow- and ice-covered most of the year; ice-out usually occurs during late May through early July. Epilimnion lake temperatures typically warm into the 10–20°C range during summer, with shallow lakes warming more than deep lakes. Summertime water temperatures tend to be warmer in lakes on the eastern side than on the western side of the parks, reflecting warmer summertime air temperatures on the eastern side (Larson and others, 1994) and earlier and smaller volumes of snowmelt. In most shallow lakes, transparency as measured by secchi disk was equal to total lake depth (Larson and others, 1994). In deeper lakes, transparency was positively correlated with lake depth, indicating that shallower lakes tended to have a higher density of light-scattering particles and be more productive (Larson and others, 1999). Shallow lakes generally do not stratify, but deeper lakes stratify during winter and during summer (Larson and others, 1994; Larson and others, 1999). Stratification breaks down in the deep lakes during spring snowmelt and fall overturn, when strong winds and isothermal temperatures in the lakes promote mixing. Dissolved oxygen concentrations usually are near saturation at the surface. In stratified lakes, dissolved oxygen generally decreases with depth.
Acidification Status and Sensitivity
In calcium-sodium-bicarbonate lakes in basins where silicate mineral weathering is the dominant source of solutes, the specific conductance of water samples reflects their total ionic load and thus is a measure both of how dilute the water is and of basin sensitivity to acidification and nitrogen deposi-tion. The covariance of sensitivity to acidification and nitrogen deposition occurs because the types of basin characteristics that are conducive to low specific conductance and alkalin-ity (thin, rocky soils and steep topographic slopes) also limit nitrogen assimilation rates. Thin, rocky soils and steep slopes are conducive to fast hydrologic flushing rates. This limits interaction between percolating water and soil and vegetation through which chemical weathering and nitrogen uptake occur.
Survey data collected by Brakke and Loranger (1986), Larson and others (1994), and Larson and others (1999) indicate that lakes in MORA and NOCA are dilute, with an average specific conductance of ≤26 µS/cm (table 4), similar to the average specific conductance of high-elevation lakes sampled in the northern Cascades region during the Western Lake Survey (Eilers and others, 1987) (table 4). Thus, lakes in MORA and NOCA should be relatively sensitive to acidifica-tion and nitrogen deposition.
Lake-survey data indicate that the pH of lakes in MORA and NOCA is circumneutral, averaging 6.3 to 7.0 (table 4). Survey data indicate that lakes in MORA tend to have slightly lower pH values than lakes in NOCA (table 4). The minimum pH measured in the lake surveys was 5.9, indicating that none of the survey lakes were acidic at the time of sampling.
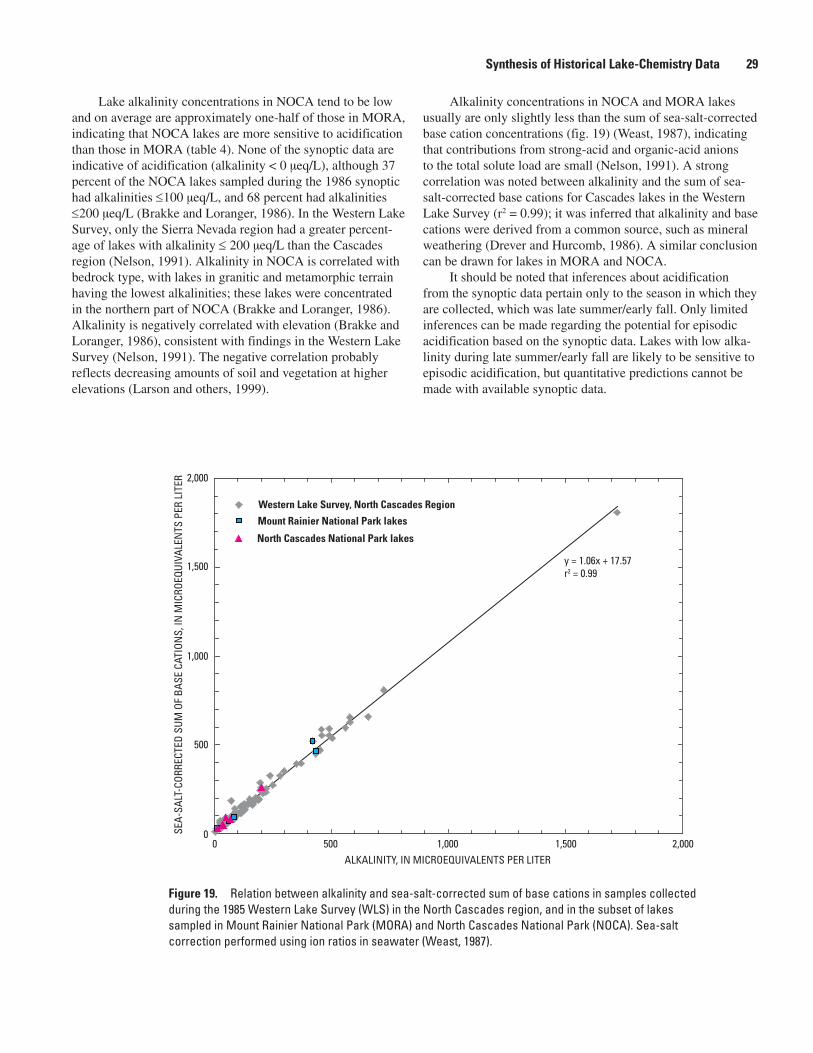
Synthesis of Historical Lake-Chemistry Data 29
Lake alkalinity concentrations in NOCA tend to be low and on average are approximately one-half of those in MORA, indicating that NOCA lakes are more sensitive to acidification than those in MORA (table 4). None of the synoptic data are indicative of acidification (alkalinity < 0 µeq/L), although 37 percent of the NOCA lakes sampled during the 1986 synoptic had alkalinities ≤100 µeq/L, and 68 percent had alkalinities ≤200 µeq/L (Brakke and Loranger, 1986). In the Western Lake Survey, only the Sierra Nevada region had a greater percent-age of lakes with alkalinity ≤ 200 µeq/L than the Cascades region (Nelson, 1991). Alkalinity in NOCA is correlated with bedrock type, with lakes in granitic and metamorphic terrain having the lowest alkalinities; these lakes were concentrated in the northern part of NOCA (Brakke and Loranger, 1986). Alkalinity is negatively correlated with elevation (Brakke and Loranger, 1986), consistent with findings in the Western Lake Survey (Nelson, 1991). The negative correlation probably reflects decreasing amounts of soil and vegetation at higher elevations (Larson and others, 1999).
Alkalinity concentrations in NOCA and MORA lakes usually are only slightly less than the sum of sea-salt-corrected base cation concentrations (fig. 19) (Weast, 1987), indicating that contributions from strong-acid and organic-acid anions to the total solute load are small (Nelson, 1991). A strong correlation was noted between alkalinity and the sum of sea-salt-corrected base cations for Cascades lakes in the Western Lake Survey (r2 = 0.99); it was inferred that alkalinity and base cations were derived from a common source, such as mineral weathering (Drever and Hurcomb, 1986). A similar conclusion can be drawn for lakes in MORA and NOCA.
It should be noted that inferences about acidification from the synoptic data pertain only to the season in which they are collected, which was late summer/early fall. Only limited inferences can be made regarding the potential for episodic acidification based on the synoptic data. Lakes with low alka-linity during late summer/early fall are likely to be sensitive to episodic acidification, but quantitative predictions cannot be made with available synoptic data.
2,000
0 500 1,000ALKALINITY, IN MICROEQUIVALENTS PER LITER
SEA-
SALT
-COR
RECT
ED S
UM O
F BA
SE C
ATIO
NS,
IN M
ICRO
EQUI
VALE
NTS
PER
LIT
ER
1,500 2,000
1,500
1,000
500
0
Western Lake Survey, North Cascades Region
Mount Rainier National Park lakes
North Cascades National Park lakes
y = 1.06x + 17.57r2 = 0.99
Figure 19. Relation between alkalinity and sea-salt-corrected sum of base cations in samples collected during the 1985 Western Lake Survey (WLS) in the North Cascades region, and in the subset of lakes sampled in Mount Rainier National Park (MORA) and North Cascades National Park (NOCA). Sea-salt correction performed using ion ratios in seawater (Weast, 1987).
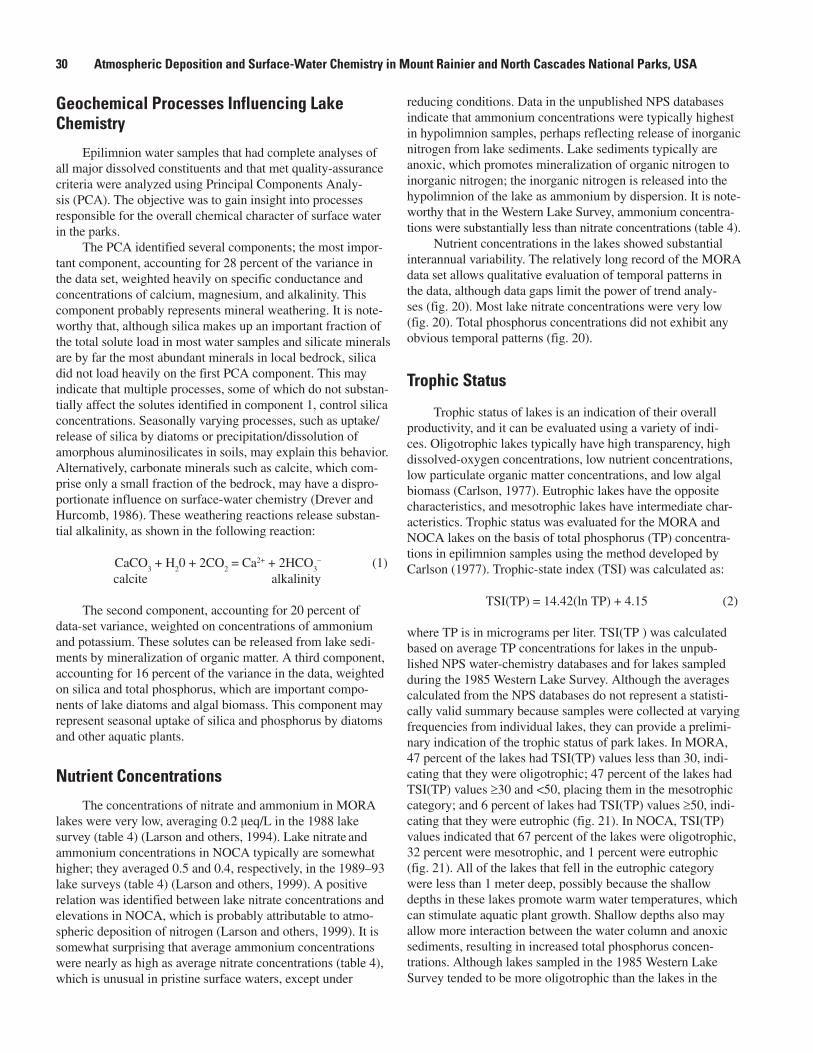
30 Atmospheric Deposition and Surface-Water Chemistry in Mount Rainier and North Cascades National Parks, USA
Geochemical Processes Influencing Lake Chemistry
Epilimnion water samples that had complete analyses of all major dissolved constituents and that met quality-assurance criteria were analyzed using Principal Components Analy-sis (PCA). The objective was to gain insight into processes responsible for the overall chemical character of surface water in the parks.
The PCA identified several components; the most impor-tant component, accounting for 28 percent of the variance in the data set, weighted heavily on specific conductance and concentrations of calcium, magnesium, and alkalinity. This component probably represents mineral weathering. It is note-worthy that, although silica makes up an important fraction of the total solute load in most water samples and silicate minerals are by far the most abundant minerals in local bedrock, silica did not load heavily on the first PCA component. This may indicate that multiple processes, some of which do not substan-tially affect the solutes identified in component 1, control silica concentrations. Seasonally varying processes, such as uptake/release of silica by diatoms or precipitation/dissolution of amorphous aluminosilicates in soils, may explain this behavior. Alternatively, carbonate minerals such as calcite, which com-prise only a small fraction of the bedrock, may have a dispro-portionate influence on surface-water chemistry (Drever and Hurcomb, 1986). These weathering reactions release substan-tial alkalinity, as shown in the following reaction:
CaCO3 + H
20 + 2CO
2 = Ca2+ + 2HCO
3– (1)
calcite alkalinity
The second component, accounting for 20 percent of data-set variance, weighted on concentrations of ammonium and potassium. These solutes can be released from lake sedi-ments by mineralization of organic matter. A third component, accounting for 16 percent of the variance in the data, weighted on silica and total phosphorus, which are important compo-nents of lake diatoms and algal biomass. This component may represent seasonal uptake of silica and phosphorus by diatoms and other aquatic plants.
Nutrient Concentrations
The concentrations of nitrate and ammonium in MORA lakes were very low, averaging 0.2 µeq/L in the 1988 lake survey (table 4) (Larson and others, 1994). Lake nitrate
and
ammonium concentrations in NOCA typically are somewhat higher; they averaged 0.5 and 0.4, respectively, in the 1989–93 lake surveys (table 4) (Larson and others, 1999). A positive relation was identified between lake nitrate concentrations and elevations in NOCA, which is probably attributable to atmo-spheric deposition of nitrogen (Larson and others, 1999). It is somewhat surprising that average ammonium concentrations were nearly as high as average nitrate concentrations (table 4), which is unusual in pristine surface waters, except under
reducing conditions. Data in the unpublished NPS databases indicate that ammonium concentrations were typically highest in hypolimnion samples, perhaps reflecting release of inorganic nitrogen from lake sediments. Lake sediments typically are anoxic, which promotes mineralization of organic nitrogen to inorganic nitrogen; the inorganic nitrogen is released into the hypolimnion of the lake as ammonium by dispersion. It is note-worthy that in the Western Lake Survey, ammonium concentra-tions were substantially less than nitrate concentrations (table 4).
Nutrient concentrations in the lakes showed substantial interannual variability. The relatively long record of the MORA data set allows qualitative evaluation of temporal patterns in the data, although data gaps limit the power of trend analy-ses (fig. 20). Most lake nitrate concentrations were very low (fig. 20). Total phosphorus concentrations did not exhibit any obvious temporal patterns (fig. 20).
Trophic Status
Trophic status of lakes is an indication of their overall productivity, and it can be evaluated using a variety of indi-ces. Oligotrophic lakes typically have high transparency, high dissolved-oxygen concentrations, low nutrient concentrations, low particulate organic matter concentrations, and low algal biomass (Carlson, 1977). Eutrophic lakes have the opposite characteristics, and mesotrophic lakes have intermediate char-acteristics. Trophic status was evaluated for the MORA and NOCA lakes on the basis of total phosphorus (TP) concentra-tions in epilimnion samples using the method developed by Carlson (1977). Trophic-state index (TSI) was calculated as:
TSI(TP) = 14.42(ln TP) + 4.15 (2)
where TP is in micrograms per liter. TSI(TP ) was calculated based on average TP concentrations for lakes in the unpub-lished NPS water-chemistry databases and for lakes sampled during the 1985 Western Lake Survey. Although the averages calculated from the NPS databases do not represent a statisti-cally valid summary because samples were collected at varying frequencies from individual lakes, they can provide a prelimi-nary indication of the trophic status of park lakes. In MORA, 47 percent of the lakes had TSI(TP) values less than 30, indi-cating that they were oligotrophic; 47 percent of the lakes had TSI(TP) values ≥30 and <50, placing them in the mesotrophic category; and 6 percent of lakes had TSI(TP) values ≥50, indi-cating that they were eutrophic (fig. 21). In NOCA, TSI(TP) values indicated that 67 percent of the lakes were oligotrophic, 32 percent were mesotrophic, and 1 percent were eutrophic (fig. 21). All of the lakes that fell in the eutrophic category were less than 1 meter deep, possibly because the shallow depths in these lakes promote warm water temperatures, which can stimulate aquatic plant growth. Shallow depths also may allow more interaction between the water column and anoxic sediments, resulting in increased total phosphorus concen-trations. Although lakes sampled in the 1985 Western Lake Survey tended to be more oligotrophic than the lakes in the
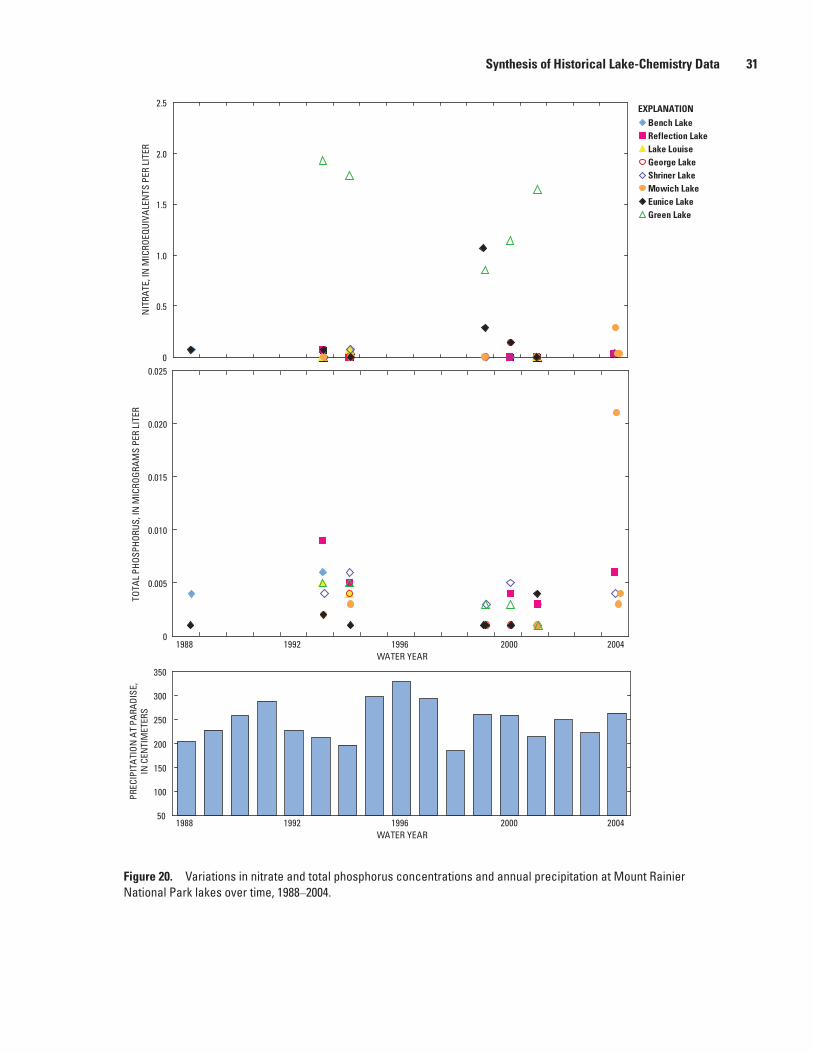
Synthesis of Historical Lake-Chemistry Data 31
0
0.5
1.0
1.5
2.0
2.5
NIT
RATE
, IN
MIC
ROEQ
UIVA
LEN
TS P
ER L
ITER
Bench LakeEXPLANATION
Reflection LakeLake LouiseGeorge LakeShriner LakeMowich LakeEunice LakeGreen Lake
0
0.005
0.010
0.015
0.020
0.025
TOTA
L PH
OSPH
ORUS
, IN
MIC
ROGR
AMS
PER
LITE
R
50
100
150
200
250
300
350
1988 1992 1996 2000 2004WATER YEAR
1988 1992 1996 2000 2004WATER YEAR
PREC
IPIT
ATI
ON
AT
PARA
DIS
E,IN
CEN
TIM
ETER
S
Figure 20. Variations in nitrate and total phosphorus concentrations and annual precipitation at Mount Rainier National Park lakes over time, 1988–2004.
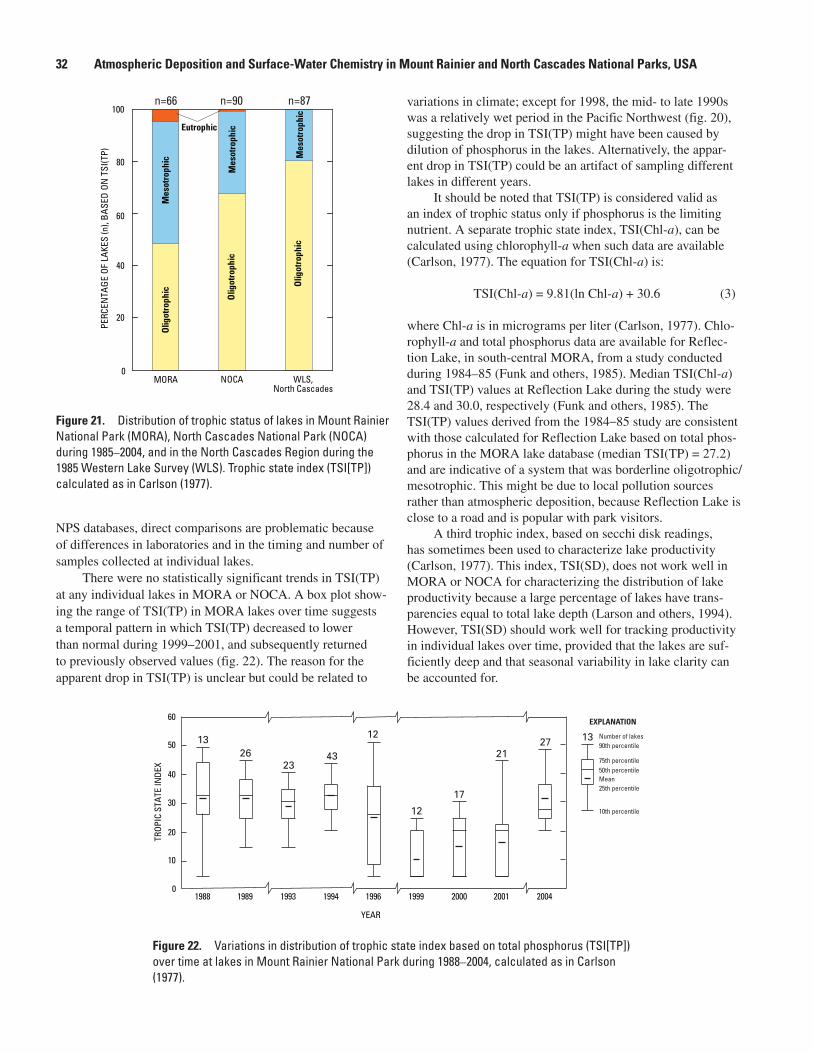
32 Atmospheric Deposition and Surface-Water Chemistry in Mount Rainier and North Cascades National Parks, USA
NPS databases, direct comparisons are problematic because of differences in laboratories and in the timing and number of samples collected at individual lakes.
There were no statistically significant trends in TSI(TP) at any individual lakes in MORA or NOCA. A box plot show-ing the range of TSI(TP) in MORA lakes over time suggests a temporal pattern in which TSI(TP) decreased to lower than normal during 1999–2001, and subsequently returned to previously observed values (fig. 22). The reason for the apparent drop in TSI(TP) is unclear but could be related to
variations in climate; except for 1998, the mid- to late 1990s was a relatively wet period in the Pacific Northwest (fig. 20), suggesting the drop in TSI(TP) might have been caused by dilution of phosphorus in the lakes. Alternatively, the appar-ent drop in TSI(TP) could be an artifact of sampling different lakes in different years.
It should be noted that TSI(TP) is considered valid as an index of trophic status only if phosphorus is the limiting nutrient. A separate trophic state index, TSI(Chl-a), can be calculated using chlorophyll-a when such data are available (Carlson, 1977). The equation for TSI(Chl-a) is:
TSI(Chl-a) = 9.81(ln Chl-a) + 30.6 (3)
where Chl-a is in micrograms per liter (Carlson, 1977). Chlo-rophyll-a and total phosphorus data are available for Reflec-tion Lake, in south-central MORA, from a study conducted during 1984–85 (Funk and others, 1985). Median TSI(Chl-a) and TSI(TP) values at Reflection Lake during the study were 28.4 and 30.0, respectively (Funk and others, 1985). The TSI(TP) values derived from the 1984–85 study are consistent with those calculated for Reflection Lake based on total phos-phorus in the MORA lake database (median TSI(TP) = 27.2) and are indicative of a system that was borderline oligotrophic/mesotrophic. This might be due to local pollution sources rather than atmospheric deposition, because Reflection Lake is close to a road and is popular with park visitors.
A third trophic index, based on secchi disk readings, has sometimes been used to characterize lake productivity (Carlson, 1977). This index, TSI(SD), does not work well in MORA or NOCA for characterizing the distribution of lake productivity because a large percentage of lakes have trans-parencies equal to total lake depth (Larson and others, 1994). However, TSI(SD) should work well for tracking productivity in individual lakes over time, provided that the lakes are suf-ficiently deep and that seasonal variability in lake clarity can be accounted for.
0
20
40
60
80
100
MORA NOCA WLS,North Cascades
PERC
ENTA
GE
OF L
AKES
(n),
BA
SED
ON
TSI
(TP)
Eutrophic
Mes
otro
phic
Mes
otro
phic
Mes
otro
phic
Olig
otro
phic
Olig
otro
phic
Olig
otro
phic
n=66 n=90 n=87
TROP
IC S
TATE
INDE
X
1988 1989 1993 1994 1996 1999 2000 2001 2004
YEAR
0
10
20
30
40
50
60
75th percentile
25th percentileMean
EXPLANATION
50th percentile
90th percentileNumber of lakes
10th percentile
1326
2343
12
12
17
2127 13
Figure 22. Variations in distribution of trophic state index based on total phosphorus (TSI[TP]) over time at lakes in Mount Rainier National Park during 1988–2004, calculated as in Carlson (1977).
Figure 21. Distribution of trophic status of lakes in Mount Rainier National Park (MORA), North Cascades National Park (NOCA) during 1985–2004, and in the North Cascades Region during the 1985 Western Lake Survey (WLS). Trophic state index (TSI[TP]) calculated as in Carlson (1977).
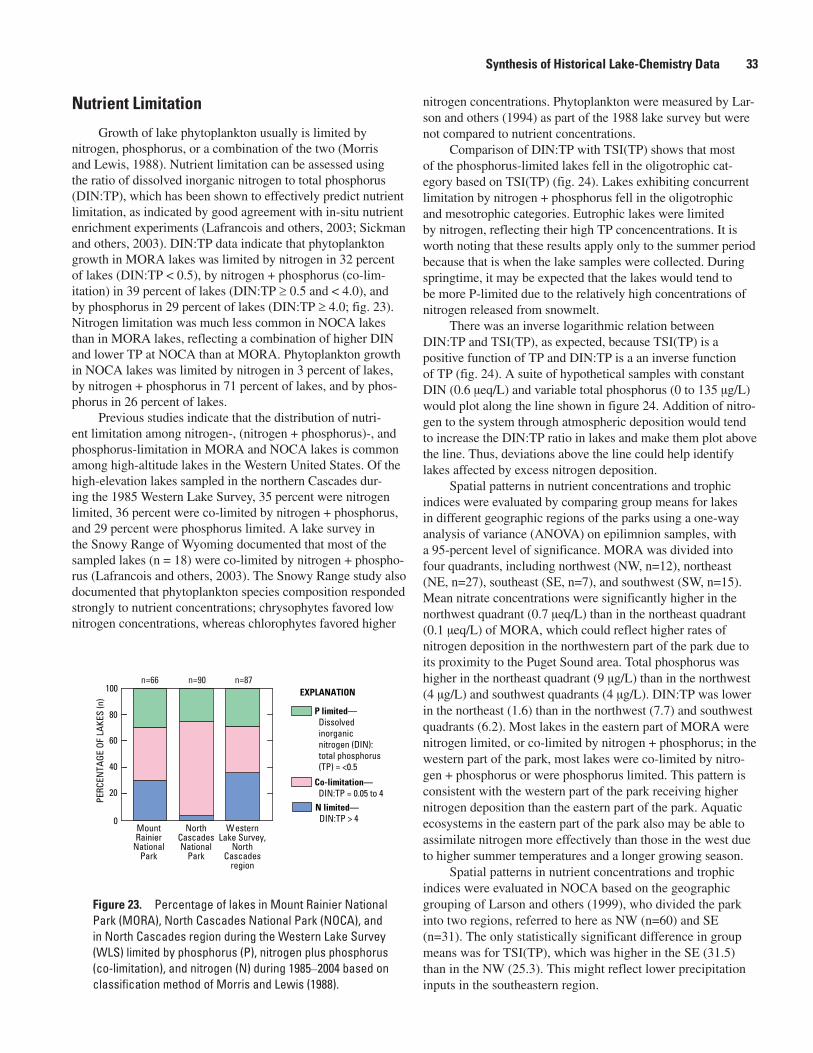
Synthesis of Historical Lake-Chemistry Data 33
Nutrient Limitation
Growth of lake phytoplankton usually is limited by nitrogen, phosphorus, or a combination of the two (Morris and Lewis, 1988). Nutrient limitation can be assessed using the ratio of dissolved inorganic nitrogen to total phosphorus (DIN:TP), which has been shown to effectively predict nutrient limitation, as indicated by good agreement with in-situ nutrient enrichment experiments (Lafrancois and others, 2003; Sickman and others, 2003). DIN:TP data indicate that phytoplankton growth in MORA lakes was limited by nitrogen in 32 percent of lakes (DIN:TP < 0.5), by nitrogen + phosphorus (co-lim-itation) in 39 percent of lakes (DIN:TP ≥ 0.5 and < 4.0), and by phosphorus in 29 percent of lakes (DIN:TP ≥ 4.0; fig. 23). Nitrogen limitation was much less common in NOCA lakes than in MORA lakes, reflecting a combination of higher DIN and lower TP at NOCA than at MORA. Phytoplankton growth in NOCA lakes was limited by nitrogen in 3 percent of lakes, by nitrogen + phosphorus in 71 percent of lakes, and by phos-phorus in 26 percent of lakes.
Previous studies indicate that the distribution of nutri-ent limitation among nitrogen-, (nitrogen + phosphorus)-, and phosphorus-limitation in MORA and NOCA lakes is common among high-altitude lakes in the Western United States. Of the high-elevation lakes sampled in the northern Cascades dur-ing the 1985 Western Lake Survey, 35 percent were nitrogen limited, 36 percent were co-limited by nitrogen + phosphorus, and 29 percent were phosphorus limited. A lake survey in the Snowy Range of Wyoming documented that most of the sampled lakes (n = 18) were co-limited by nitrogen + phospho-rus (Lafrancois and others, 2003). The Snowy Range study also documented that phytoplankton species composition responded strongly to nutrient concentrations; chrysophytes favored low nitrogen concentrations, whereas chlorophytes favored higher
nitrogen concentrations. Phytoplankton were measured by Lar-son and others (1994) as part of the 1988 lake survey but were not compared to nutrient concentrations.
Comparison of DIN:TP with TSI(TP) shows that most of the phosphorus-limited lakes fell in the oligotrophic cat-egory based on TSI(TP) (fig. 24). Lakes exhibiting concurrent limitation by nitrogen + phosphorus fell in the oligotrophic and mesotrophic categories. Eutrophic lakes were limited by nitrogen, reflecting their high TP concencentrations. It is worth noting that these results apply only to the summer period because that is when the lake samples were collected. During springtime, it may be expected that the lakes would tend to be more P-limited due to the relatively high concentrations of nitrogen released from snowmelt.
There was an inverse logarithmic relation between DIN:TP and TSI(TP), as expected, because TSI(TP) is a positive function of TP and DIN:TP is a an inverse function of TP (fig. 24). A suite of hypothetical samples with constant DIN (0.6 µeq/L) and variable total phosphorus (0 to 135 µg/L) would plot along the line shown in figure 24. Addition of nitro-gen to the system through atmospheric deposition would tend to increase the DIN:TP ratio in lakes and make them plot above the line. Thus, deviations above the line could help identify lakes affected by excess nitrogen deposition.
Spatial patterns in nutrient concentrations and trophic indices were evaluated by comparing group means for lakes in different geographic regions of the parks using a one-way analysis of variance (ANOVA) on epilimnion samples, with a 95-percent level of significance. MORA was divided into four quadrants, including northwest (NW, n=12), northeast (NE, n=27), southeast (SE, n=7), and southwest (SW, n=15). Mean nitrate concentrations were significantly higher in the northwest quadrant (0.7 µeq/L) than in the northeast quadrant (0.1 µeq/L) of MORA, which could reflect higher rates of nitrogen deposition in the northwestern part of the park due to its proximity to the Puget Sound area. Total phosphorus was higher in the northeast quadrant (9 µg/L) than in the northwest (4 µg/L) and southwest quadrants (4 µg/L). DIN:TP was lower in the northeast (1.6) than in the northwest (7.7) and southwest quadrants (6.2). Most lakes in the eastern part of MORA were nitrogen limited, or co-limited by nitrogen + phosphorus; in the western part of the park, most lakes were co-limited by nitro-gen + phosphorus or were phosphorus limited. This pattern is consistent with the western part of the park receiving higher nitrogen deposition than the eastern part of the park. Aquatic ecosystems in the eastern part of the park also may be able to assimilate nitrogen more effectively than those in the west due to higher summer temperatures and a longer growing season.
Spatial patterns in nutrient concentrations and trophic indices were evaluated in NOCA based on the geographic grouping of Larson and others (1999), who divided the park into two regions, referred to here as NW (n=60) and SE (n=31). The only statistically significant difference in group means was for TSI(TP), which was higher in the SE (31.5) than in the NW (25.3). This might reflect lower precipitation inputs in the southeastern region.
0
20
40
60
80
100
MountRainier
NationalPark
NorthCascadesNational
Park
WesternLake Survey,
NorthCascades
region
PERC
ENTA
GE O
F LA
KES
(n)
P limited— Dissolved inorganic nitrogen (DIN): total phosphorus (TP) = <0.5
EXPLANATION
Co-limitation— DIN:TP = 0.05 to 4N limited— DIN:TP > 4
n=66 n=87n=90
Figure 23. Percentage of lakes in Mount Rainier National Park (MORA), North Cascades National Park (NOCA), and in North Cascades region during the Western Lake Survey (WLS) limited by phosphorus (P), nitrogen plus phosphorus (co-limitation), and nitrogen (N) during 1985–2004 based on classification method of Morris and Lewis (1988).
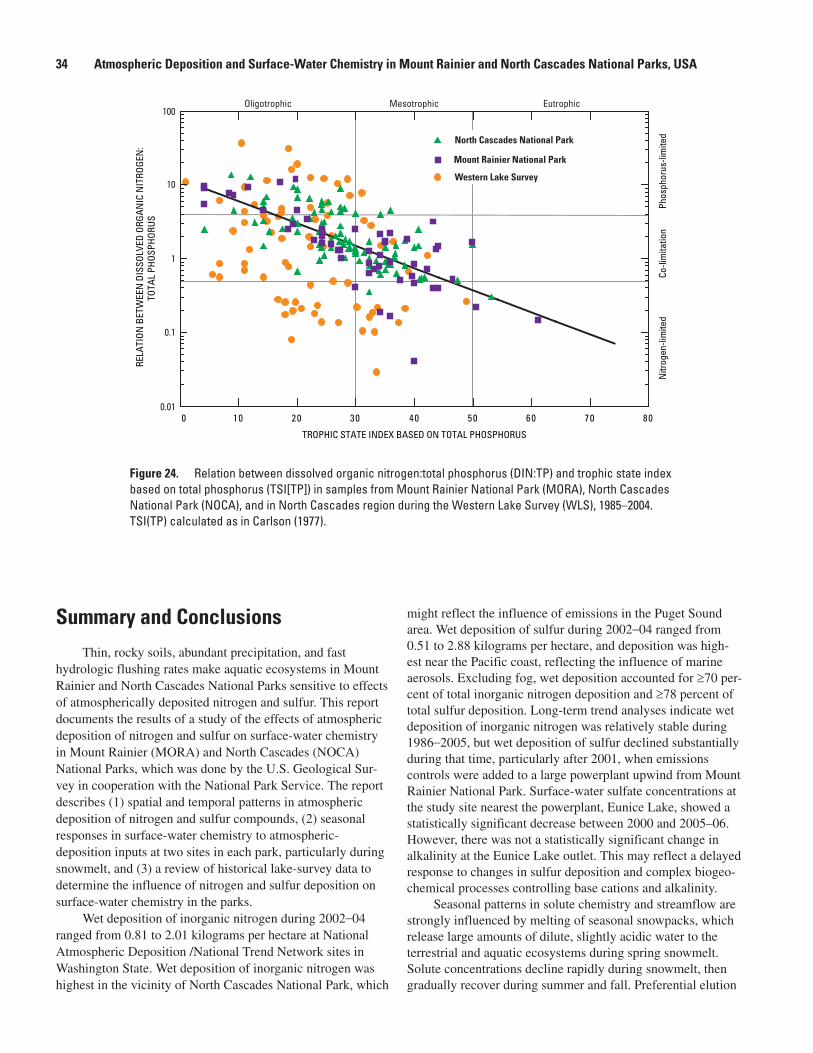
34 Atmospheric Deposition and Surface-Water Chemistry in Mount Rainier and North Cascades National Parks, USA
Summary and Conclusions
Thin, rocky soils, abundant precipitation, and fast hydrologic flushing rates make aquatic ecosystems in Mount Rainier and North Cascades National Parks sensitive to effects of atmospherically deposited nitrogen and sulfur. This report documents the results of a study of the effects of atmospheric deposition of nitrogen and sulfur on surface-water chemistry in Mount Rainier (MORA) and North Cascades (NOCA) National Parks, which was done by the U.S. Geological Sur-vey in cooperation with the National Park Service. The report describes (1) spatial and temporal patterns in atmospheric deposition of nitrogen and sulfur compounds, (2) seasonal responses in surface-water chemistry to atmospheric- deposition inputs at two sites in each park, particularly during snowmelt, and (3) a review of historical lake-survey data to determine the influence of nitrogen and sulfur deposition on surface-water chemistry in the parks.
Wet deposition of inorganic nitrogen during 2002–04 ranged from 0.81 to 2.01 kilograms per hectare at National Atmospheric Deposition /National Trend Network sites in Washington State. Wet deposition of inorganic nitrogen was highest in the vicinity of North Cascades National Park, which
might reflect the influence of emissions in the Puget Sound area. Wet deposition of sulfur during 2002–04 ranged from 0.51 to 2.88 kilograms per hectare, and deposition was high-est near the Pacific coast, reflecting the influence of marine aerosols. Excluding fog, wet deposition accounted for ≥70 per-cent of total inorganic nitrogen deposition and ≥78 percent of total sulfur deposition. Long-term trend analyses indicate wet deposition of inorganic nitrogen was relatively stable during 1986–2005, but wet deposition of sulfur declined substantially during that time, particularly after 2001, when emissions controls were added to a large powerplant upwind from Mount Rainier National Park. Surface-water sulfate concentrations at the study site nearest the powerplant, Eunice Lake, showed a statistically significant decrease between 2000 and 2005–06. However, there was not a statistically significant change in alkalinity at the Eunice Lake outlet. This may reflect a delayed response to changes in sulfur deposition and complex biogeo-chemical processes controlling base cations and alkalinity.
Seasonal patterns in solute chemistry and streamflow are strongly influenced by melting of seasonal snowpacks, which release large amounts of dilute, slightly acidic water to the terrestrial and aquatic ecosystems during spring snowmelt. Solute concentrations decline rapidly during snowmelt, then gradually recover during summer and fall. Preferential elution
0 10 20 30 40 50 60 70 80
Nitr
ogen
-lim
ited
North Cascades National Park
Mount Rainier National Park
Western Lake Survey
Phos
phor
us-li
mite
dCo
-lim
itatio
n
RELA
TION
BET
WEE
N D
ISSO
LVED
ORG
ANIC
NIT
ROGE
N:
TOTA
L PH
OSPH
ORUS
TROPHIC STATE INDEX BASED ON TOTAL PHOSPHORUS
100
10
1
0.1
0.01
Oligotrophic Mesotrophic Eutrophic
Figure 24. Relation between dissolved organic nitrogen:total phosphorus (DIN:TP) and trophic state index based on total phosphorus (TSI[TP]) in samples from Mount Rainier National Park (MORA), North Cascades National Park (NOCA), and in North Cascades region during the Western Lake Survey (WLS), 1985–2004. TSI(TP) calculated as in Carlson (1977).

References Cited 35
of acidic solutes from snowpack at the beginning of snowmelt may cause sharp drops in pH and alkalinity in small alpine streams. A streamwater sample collected during spring 2006 was acidic (pH = 4.8, alkalinity = –18 µeq/L) and had high concentrations of nitrate and sulfate and low concentrations of weathering products. This chemistry is indicative of episodic acidification due to preferential elution of acidic components from melting snow. The scale of episodic acidification is unknown, but it might be restricted to small pools of nearly-stagnant water that form in stream channels and local depres-sions at the beginning of snowmelt. Nonetheless, it could have detrimental effects on aquatic life and amphibians.
Midwinter rain-on-snow events also have potential to cause episodic acidification. Lake-outlet alkalinity was estimated for several midwinter rain-on-snow events based on changes in specific conductance, which was monitored by using an in-stream sensor. Results indicated that alkalinity declined by an order of magnitude during the rain-on-snow events. In one case, modeled alkalinity declined to 8 µeq/L. High-elevation surface waters in North Cascades National Park are likely to be similarly sensitive.
Historical lake-survey data indicate that surface-water nitrate concentrations were very low in Mount Rainier National Park (average ≤0.2 µeq/L) and in North Cascades National Park (average ≤0.5 µeq/L). The slightly higher sur-face-water nitrate concentrations at North Cascades National Park are consistent with higher inorganic nitrogen deposition that occurs there relative to Mount Rainier National Park. At low elevations in North Cascades National Park (below approximately 1,000 m), nitrogen fixation associated with red alder appears to contribute substantial nitrogen to stream water. Future monitoring for effects of atmospheric deposi-tion of nitrogen should focus on high-elevation ecosystems to avoid the confounding effects of nitrogen fixation by alders.
Historical lake-survey data indicate that most lakes in the two parks are oligotrophic and have low concentrations of nitrogen and phosphorus. Nitrogen limitation was more common at MORA than at NOCA due to lower dissolved inorganic nitrogen concentrations and higher total phosphorus concentrations at MORA. Spatial patterns in nutrient status and limitation indices suggest that nitrogen deposition may be affecting the northwest part of MORA more than other parts of the park. There were no significant differences in nitro-gen concentrations between lakes in the northwestern part of NOCA compared to those in the southeastern part of the park. However, lake surveys have documented a positive relation between nitrate concentrations and elevation in alpine lakes in the NOCA, suggesting that atmospheric deposition of nitrogen may be affecting high-elevation lakes in the park. Total phos-phorus concentrations tend to be higher on the eastern side of both parks, which may reflect drier conditions and warmer summertime conditions there compared to the western side of the parks.
Acknowledgments
The authors gratefully acknowledge the assistance of Rebecca Lofgren and Michael Larrabee of the National Park Service in organizing and conducting field work for this study. Michael Stevens and Anthony Paulson of the USGS provided thoughtful technical reviews, and Mary Kidd (USGS) provided a helpful editorial review.
References Cited
Aber, J.D., Nadelhoffer, K.J., Steudler, P., and Melillo, J.M., 1989, Nitrogen saturation in northern forest ecosystems: BioScience, v. 39, no. 6, p. 378–386.
Arno, S.F., and Hammerly, R.P., 1984, Timberline—Mountain and arctic forest frontiers: Seattle, Mountaineers Books, 304 p.
Barmuta, L.A., Cooper, S.D., Hamilton, S.K., Kratz, K.W., and Melack, J.M., 1990, Responses of zooplankton and zoobenthos to experimental acidification in a high-elevation lake (Sierra Nevada, California, U.S.A.): Freshwater Bio-logy, v. 23, p. 571–586.
Berg, N.H., 1992, Ion elution and release sequence from deep snowpacks in the central Sierra Nevada, California: Water, Air, and Soil Pollution, v. 61, p. 139–168.
Blum, J., and Alkema, H., 2000, Ecosystem performance evaluation quality assurance program, rain and soft waters: National Laboratory for Environmental Testing, National Water Research Institute, Environment Canada NLET–TN00–014, 6 p.
Brakke, D.F., and Loranger, T.J., 1986, Acid neutralizing capacity of lakes in the North Cascades area of Washington State: Water, Air, and Soil Pollution, v. 30, p. 1045–1053.
Campbell, D.H., Clow, D.W., Ingersoll, G.P., Mast, M.A., Spahr, N.E., and Turk, J.T., 1995, Processes controlling the chemistry of two snowmelt-dominated streams in the Rocky Mountains: Water Resources Research, v. 31, no. 11, p. 2811–2821.
Carlson, R.E., 1977, A trophic state index for lakes: Limnol-ogy and Oceanography, v. 22, no. 2, p. 361–369.
Cleveland, W.S., and Devlin, S.J., 1988, Locally weighted regression—An approach to regression analysis by local fit-ting: Journal of the American Statistical Association, v. 83, p. 596–610.
Clow, D.W., and Drever, J.I., 1996, Weathering rates as a function of flow through an alpine soil: Chemical Geology, v. 132, p. 131–141.
36 Atmospheric Deposition and Surface-Water Chemistry in Mount Rainier and North Cascades National Parks, USA
Clow, D.W., Ingersoll, G.P., Mast, M.A., Turk, J.T., and Campbell, D.H., 2002, Comparison of snowpack and winter wet-deposition chemistry in the Rocky Mountains, U.S.A.—Implications for winter dry deposition: Atmo-spheric Environment, v. 36, p. 2337–2348.
Clow, D.W., and Sueker, J.K., 2000, Relations between basin characteristics and stream-water chemistry in alpine/sub-alpine basins in Rocky Mountain National Park, Colorado: Water Resources Research, v. 36, no. 1, p. 49–61.
Dethier, D.P., 1979, Atmospheric contributions to stream water chemistry in the northern Cascade Range, Washington: Water Resources Research, v. 15, no. 4, p. 787–794.
Drever, J.I., and Hurcomb, D.R., 1986, Neutralization of atmospheric acidity by chemical weathering in an alpine drainage in the North Cascade Mountains: Geology, v. 14, p. 221–224.
Edmonds, R.L., 1980, Litter decomposition and nutrient release in Douglas-fir, red alder, western hemlock, and Pacific silver-fir ecosystems in western Washington: Cana-dian Journal of Forest Research, v. 10, p. 327–337.
Eilers, J.M., Kanciruk, P., McCord, R.A., Overton, W.S., Hook, L., Blick, D.J., Brakke, D.F., Kellar, P.E., DeHann, M.S., Silverstein, M.E., and Landers, D.H., 1987, West-ern Lake Survey, phase 1. Characteristics of lakes in the Western United States—Volume II, Data compendium for selected physical and chemical variables: U.S. Environ-mental Protection Agency EPA–600/3–86/054b.
Fenn, M.E., Haeuber, R., Tonnesen, G.S., Baron, J.S., Gross-man-Clarke, S., Hope, D., Jaffe, D.A., Copeland, S., Geiser, L., Rueth, H., and Sickman, J.O., 2003, Nitrogen emissions, deposition, and monitoring in the Western United States: BioScience, v. 53, no. 4, p. 391–403.
Fiske, R.S., Hopson, C.A., and Waters, A.C., 1963, Geology of Mt. Rainier National Park, Washington: U.S. Geological Survey Professional Paper 444, 93 p.
Fiske, R.S., Hopson, C.A., and Waters, A.C., 1964, Geologic map and section of Mount Rainier National Park, Washing-ton: U.S. Geological Survey I–Map 432, scale 1:62,500.
Funk, W.H., Moore, B.C., Johnstone, D.L., Larsen, C.P., McKarns, T.C., Porter, J.P., Juul, S.T.J., Trout, C.K., and Becker, B.L., 1985, Baseline study of Reflection Lakes, Mount Rainier National Park: Pullman, Washington State University, Water Research Center, Report 66, 58 p.
Gillette, D.A., Stensland, G.J., Williams, A.L., Barnard, W., Gatz, D., Sinclair, P.C., and Tezz, C.J., 1992, Emissions of alkaline elements calcium, magnesium, potassium, and sodium from open sources in the contiguous United States: Global Biogeochemical Cycles, v. 6, no. 4, p. 437–457.
Gran, G., 1952, Determination of the equivalence point in potentiometric titrations, part II: The Analyst, v. 77, p. 661–671.
Gregor, H.D., Werner, B., and Spranger, T., 2004, Manual on methodologies and criteria for mapping critical levels/loads and geographical areas where they are exceeded: Berlin, Germany, ICP Modeling and Mapping, 212 p.
Helsel, D.R., and Hirsch, R.M., 1992, Statistical methods in water resources: Amsterdam, The Netherlands, Elsevier, v. 49, 522 p.
Hunt, C.B., 1974, Natural regions of the United States and Canada: San Francisco, W.H. Freeman & Co. Ltd., 737 p.
Hutchinson, T.C., Adams, C.M., and Gaber, B.A., 1986, Neutralization of acidic raindrops on leaves of agricultural crop and boreal forest species: Water, Air, and Soil Pollu-tion, v. 31, no. 1–2, p. 475–484.
Ingersoll, G.P., 1995, Maximum-accumulation snowpack chemistry at selected sites in northwestern Colorado during spring 1994: U.S. Geological Survey Open-File Report 95–139, 14 p.
Lafrancois, B.M., Nydick, K.R., and Caruso, B., 2003, Influ-ence of nitrogen on phytoplankton biomass and community composition in fifteen Snowy Range lakes (Wyoming, U.S.A.): Arctic, Antarctic, and Alpine Research, v. 35, no. 4, p. 499–508.
Larson, G.L., Lomnicky, G., Hoffman, R., Liss, W.J., and Deimling, E., 1999, Integrating physical and chemical char-acteristics of lakes into the glacially influenced landscape of the Northern Cascade Mountains, Washington State, U.S.A.: Environmental Management, v. 24, no. 2, p. 219–228.
Larson, G.L., Wones, A., McIntire, C.D., and Samora, B., 1994, Integrating limnological characteristics of high moun-tain lakes into the landscape of a natural area: Environmen-tal Management, v. 18, no. 6, p. 871–888.
Lins, H.F., 1985, Interannual streamflow variability in the United States based on principal components: Water Resources Research, v. 21, no. 5, p. 691–701.
Ludtke, A., and Woodworth, M., 1997, USGS blind sample project—Monitoring and evaluating laboratory analytical quality: U.S. Geological Survey Fact Sheet FS–136–97, 2 p.
Luken, J.O., and Fonda, R.W., 1983, Nitrogen accumulation in a chronosequence of red alder communities along the Hoh River, Olympic National Park, Washington: Canadian Journal of Forest Research, v. 13, p. 1228–1237.
Morris, D.P., and Lewis, W.M., 1988, Phytoplankton nutrient limitation in Colorado mountain lakes: Freshwater Biology, v. 20, p. 315–327.
References Cited 37
Mulvaney, R., Wolff, E.W., and Oates, K., 1988, Sulphuric acid at grain boundaries in Antarctic ice: Nature, v. 331, p. 247–249.
National Park Service, 2002, Air quality in the National Parks, 2nd edition: Lakewood, Colorado, National Park Service, no. D–2266.
Nelson, P.O., 1991, Cascade Mountains, in Charles, D.F., ed., Acidic deposition and aquatic ecosystems—Regional case studies: New York, Springer-Verlag, p. 531–563.
Rantz, S.E., and others, 1982a, Measurement and computation of streamflow—Volume 1. Measurement of stage and dis-charge: U.S. Geological Survey Water-Supply Paper 2175, 631 p.
Rantz, S.E., and others, 1982b, Measurement and computation of streamflow—Volume 2. Computation of discharge: U.S. Geological Survey Water-Supply Paper 2175, 631 p.
Ries, K.G.I., Steeves, P.A., Coles, J.D., Rea, A.H., and Stew-art, D.W., 2004, StreamStats—A U.S. Geological Survey web application for stream information: U.S. Geological Survey Fact Sheet 2004–3115, 4 p.
Sequeira, R., 1993, On the large-scale impact of arid dust on precipitation chemistry of the continental northern hemisphere: Atmospheric Environment, v. 27A, no. 10, p. 1553–1565.
Sickman, J.O., Melack, J.M., and Clow, D.W., 2003, Evidence for nutrient enrichment of high-elevation lakes in the Sierra Nevada, California: Limnology and Oceanography, v. 48, p. 1885–1892.
Staatz, M.H., Tabor, R.W., Weis, P.L., Robertson, J.F., Van Noy, R.M., and Pattee, E.C., 1972, Geology and min-eral resources of the northern part of the North Cascades National Park, Washington: U.S. Geological Survey Bul-letin 1359, 132 p.
Stoddard, J.L., 1994, Long-term changes in watershed reten-tion of nitrogen, in Baker, L.A., ed., Environmental chem-istry of lakes and reservoirs: American Chemical Society, p. 223–284.
Stoddard, J.L., 1995, Episodic acidification during snowmelt of high elevation lakes in the Sierra Nevada mountains of California: Water, Air, and Soil Pollution, v. 85, p. 353–358.
Tabor, R., and Haugerud, R., 1999, Geology of the North Cascades—A mountain mosaic: Seattle, Washington, The Mountaineers, 144 p.
Turk, J.T., Campbell, D.H., and Spahr, N.E., 1993, Use of chemistry and stable sulfur isotopes to determine sources and trends in sulfate of Colorado lakes: Water, Air, and Soil Pollution, v. 67, p. 415–431.
Turney, G.L., Dion, N.P., and Sumioka, S.S., 1986, Water quality of selected lakes in Mount Rainier National Park, Washington, with respect to lake acidification: U.S. Geo-logical Survey Water-Resources Investigations Report 85–4254, 45 p.
U.S. Environmental Protection Agency, 2001, National air quality and emissions trends report, 1999: U.S. Environ-mental Protection Agency EPA 454/R–01–004.
Weast, R.C., ed., 1987, CRC Handbook of chemistry and physics (68th ed.): Boca Raton, Florida, CRC Press, Inc., 2440 p.
Webster, R., and Oliver, M., 2001, Geostatistics for envi-ronmental scientists: West Sussex, England, John Wiley & Sons, 271 p.
WESTAR, 2001, RA BART and RA BART-like case studies: WESTAR Council WGA Contract# 30203-13, 19 p., avail-able at http://www.westar.org/RA%20BART%20Template.html.
Wilde, F.D., Radtke, D.B., Gibs, J., and Iwatsubo, R.T., eds., 1998, National field manual for the collection of water-quality data: Denver, U.S. Geological Survey Techniques of Water-Resources Investigations, book 9, available at http://water.usgs.gov/owq/FieldManual/
Publishing support provided by: Denver Publishing Service Center
Manuscript approved for publication August 26, 2008.Edited by Mary Kidd. Layout by Margo VanAlstine.
For more information concerning this publication, contact:Director, USGS Colorado Water Science CenterBox 25046, Mail Stop 415Denver, CO 80225(303)236-4882
Or visit the Colorado Water Science Center Web site at:http://co.water.usgs.gov/

Clow and Cam
pbell—A
tmospheric D
eposition and Surface-Water Chem
istry, Mount Rainier and N
orth Cascades National Parks—
USG
S SIR 2008–5152
![No. [5152]-502 STRENGTH OF MATERIAL (2015 …collegecirculars.unipune.ac.in/sites/examdocs/April 2017...[5152]-503 2 3. (a) In a standard proctor test the following observations wererecorded](https://img.pdfslide.net/doc/110x75/5e9751cdb09f30688846fd46/no-5152-502-strength-of-material-2015-2017-5152-503-2-3-a-in-a-standard.jpg)