Embed Size (px)
Citation preview
PHYSICAL REVIEW D VOLUME 53, NUMBER 3 1 FEBRUARY 1996
0556-28
Atmospheric neutrino flux above 1 GeV
Vivek Agrawal,’ T.K. G&se,* Paolo Lipari,’ and Todor Stanev’
‘Bartol Research Institote, University of Delwmre, Newark, Delaware 19716 ZDipartimento di Fisica, Universitd di Roma, Piazzale Aldo Mom 2, Rome, Italy
(Received 13 July 1995)
In this paper we extend an earlier calculation of the flux of atmospheric neutrinos to higher energy. The earlier calculation of the neutrino flux below 3 GeV has been used for calculation of the rate of contained neutrino interactions in deep underground detectors. The fluxes are needed up to neutrino energies of 10 TeV to calculate the expected rate of neutrino-induced muons passing into and through large, deep detectors. We compare our results with several other calculations, and we evaluate the uncertainty in the rate of neutrino-induced muons due to uncertainties in the neutrino flux.
PACS number(s): 96.40.Tv, 14.6O.Pq, 95.85.Ry
I. INTRODUCTION
In the past few years several groups have reported new measurements of v-induced muons passing through large, deep-underground detectors [l-6]. These measurements provide better statistics than the earlier pioneering mea- surements at KGF [i’] and in South Africa [s], but the re- sults and their interpretation remain ambiguous, in part because of the intrinsic difficulty of the measurement but
in part because of differences in the calculations used to interpret the measurements. In particular, the relation of these measurements to the anomalous flavor ratio of
contained interactions of atmospheric neutrinos [9, lo] is still controversial.
Interpretation of the flux of neutrino-induced muons depends on an absolute comparison between a measured rate and a calculated intensity. The calculation con- tains three essential ingredients: propagation of muons after they are produced in charged-current interactions of v,, and fi,,; the energy spectrum of muons produced in charged-current interactions of neutrinos as well as the magnitude of the cross section; and the flux of atmo- spheric neutrinos itself. The first factor in the calculation is well understood, and different calculations give simi- lar results [ll, 121. The uncertainty in the cross section is discussed in recent papers [13-151. In this paper we discuss the calculation of the neutrino flux in the energy range relevant for neutrino-induced muons; that is, from one GeV up to lo4 GeV of neutrino energy. The calcu- lated flux of neutrinos and muons given here is essentially an extension of the low energy calculation [16] that has been used extensively for evaluation of the rate of con- tained neutrino interactions. In this paper we also give a critical discussion of the sources of uncertainty in the +xlation, as well as a comparison of these results to those of other calculations.
The neutrino flux depends on the primary cosmic-ray
spectrum and on the production of pions and kaons by interactions of cosmic-ray hadrons in the atmosphere. Because of the close relationship between neutrino and muon fluxes, we tabulate both fluxes. We also discuss the
extent to which meastiements of the muon flux place con-
21/96/53~3~/1314~10~/~06.00 12
straints on the neutrino flux. We begin in Sec. II with a discussion of the primary spectrum and its uncertainties. Then in Sec. III we discuss the inclusive cross sections that determine the production of muons and neutrinos in the atmospheric cosmic-ray cascading. Section IV con- tains the neutrino and muon fluxes in tabular form. In the conclusion we compare this calculation with others and summarize our assessment of the uncertainty in the atmospheric neutrino flux.
The cosmic-ray spectrum incident on the atmosphere consists of protons and nuclei. To a first approximation the uncorrelated spectra of atmospheric secondaries, such as neutrinos and muons, depend only on the number of incident nucleons in the primary spectrum as a function of energy per nucleon 1171. We call this the all-nucleon spectrum. The range of neutrino energies important for
v-induced muons is 1 5 & 5 lo4 GeV, as shown, for example in Fig. 2 of Ref. [13]. The corresponding range of primary energy per nucleon is about a factor of ten
higher, as illustrated in Fig. 1. Approximately 85% of neutrino-induced muons come from primary nucleons with energies less than lo4 GeV. (The exact fraction de- pends somewhat on the angle as shown in Fig. 1.)
In this energy range, the all-nucleon spectrum is dom- inated by hydrogen and helium, even in the case of ex- trapolations in which the spectrum in total energy per nucleus (the so-called “all-particle” spectrum) is dom- inated by heavy nuclei at higher energy. The relative contribution of different nuclei to the all-nucleon spec- trum is discussed in Ref. [18], where it is shown, for example, that hydrogen contributes about 81 (68) % of the intensity at 10 (104) GeV and helium 72 (70) % of the remainder. Thus the overall uncertainty is dominated by the uncertainty in the measurements of the spectrum of hydrogen. The fraction of helium is crucial for de- termining the charge ratio of muons and the V/D ratios because this is the origin of most of the incident neu-
trons. Heavy nuclei may become more important around lo5 GeV/nucleon, as noted below.
II. PRIMARY SPECTRUM
1314 01996 The American Physical Society

3 ATMOSPHERIC NEUTRINO FLUX ABOVE 1 GeV 1315
FIG. 1. Primary cosmic-ray nucleon energy contribution to the upward-going neutrino induced muon flux (E,, >1 GeV). The solid line is for cos(O)=-1 and the dashed is for cos(B)=-0.15.
Figure 2 shows the data summary from Ref. [18] of the direct measurements of the primary protons, helium and heavier nuclei made with various balloon and satellite ex- periments. There are two measurements of the spectrum of hydrogen [19,20) in the 10-100 GeV range that dif- fer in normalization by about 30%, an amount which is larger than the statistical error of either experiment. Up to about lo4 GeV, the envelope of the measurements also covers a range of about 30%. Thus we assign an uncer- tainty of 515% to the all-nucleon spectrum in this entire energy range.
At higher energy the uncertainty of the cosmic-ray composition plays a bigger role. The data of JACEE (23, 241 (shown by the filled circles in Fig. 2) have two main features - a downward bend in the proton spectrum and an increase of the contribution of all-nuclei heav- ier than helium. These two effects tend to compensate each other and leave the slope of the all-nucleon spec- trum unchanged up to lo5 GeV. If, however, the bend of the proton spectrum is real but the flattening of the spectra of the heavy nuclei is not, there will be a corre- sponding steepening of the all-nucleon spectrum around lo4 GeV. These two possibilities are indicatedjn Fig. 2. Since primaries with E > lo4 GeV/nucleon contribute only about 15% of the flux of upward muons, however, uncertainties at the level of 20 - 30 % above this energy increase the uncertainty in the upward muowrate only by a few percent.
For the calculations in this paper we use the all-nucleon spectrum with the higher extrapolati&, which corre- sponds to the dash-dotted curves in Fig. 2. This pri- mary spectrum was based originally on an analysis of the data summary of Garcia-Munoz and Simpson [33] done for the calculation of Ref. [lS]. It is extended to higher energy 1181 by including data. from the summary of Swordy (341 and other more recent data. At energies above IO4 GeV/nucleon we use only the measurements of JACEE [23,24], shown with filled circles in Fig. 2. In Fig. 3 we compare the nucleon spectrum used for this calcula-
FIG. 2. Direct data on the spectra of different cosmic- ray nuclei. The data for Ii and He are from: open circles, Ref. [19]; inverted triangles, Ref. [ZO]; triangles, Ref. [21]; filled squares, Ref. [22]; filled circles, Refs. [23, 241; crosses, Ref. 1251; hexagons, Ref. 1261; and open squares, Ref. [27]. The data for heavier nuclei are from: open circles, Ref. 1281; trian- gles, Ref. 1291; open squares, Ref. [30]; filled squares, Ref. [31]; crosses, Ref. [32]; and filled circles, Ref. [24]. The lines repro sent the two fits discussed in the text: (1) (solid line) steepen- ing H and all nucleon spectrum; (2) (dash-dotted) a gradual bending of the H spectrum which is compensated by flatten- ing of the spectra of all heavier nuclei.
tion with the other fit to the data of Fig. 2 and with the spectra used in other calculations of the neutrino flux at high energy.
The low energy part of the spectrum (< 20 GeV) is affected by the geomagnetic field and by modulation by the solar wind, both of which prevent some fraction of the low energy galactic cosmic rays from reaching the atmosphere to produce secondaries. These effects are of greatest importance for the - GeV neutrino flux that is responsible for contained neutrino interactions, but they also have some importance for neutrino-induced muons, especially for muons that enter and stop in the detector. A new evaluation of the geomagnetic cutoffs is the subject of Ref. [39]. We tabulate below the reduction in neutrino flux due to the geomagnetic cutoffs at several detector locations.

AGRAWAL, GAISSER, LIPARI, AND STANEV
102 lo3 10’ lo6 108
E. Ge”
FIG. 3. The all-nucleon spectra derived from the fits from Fig. 2 (same line coding) compared with spectra used in other neutrino flux calculations: short dashed, Ref. [35]; long dashed, Ref. [36]; dotted, Ref. [37]; and short-long dashed, Ref. [38]. The two data points are from the JACEE data set [23,24].
III. HADRON PRODUCTION
To calculate the atmospheric cascade we use a model of hadronic interactions called TARGET that is essen- tially the same as originally used in Ref. [16] for calcula- tion of the neutrino flux below 3 GeV. It is based on a parametrization of particle interactions on targets of dif-
ferent mass (401. It is tuned to describe correctly differ$nt sets of experimental data in the tens [41-431 to hundreds of GeV [44] range of lab energy. The original version of this model is described in Ref. [45]. The only significant change since the calculation [16] concerns the description of the.production of strange hadrons at high energy. The description of the production and decay of resonances in the GeV region was also improved. The neutrino fluxes below 3 GeV are indistinguishable from those of Ref. [16] in the absence of geomagnetic cutoffs. A change in the
production of kaons in interactions with energy above 1000 GeV leads to an increase of the neutrino flux in the TeV region relative to a preliminary version of this
calculation used in Ref. [13]. On the other hand, the assumptions of this model about kaon production on nu- clear targets at high energy are at the higher end of the experimental range and may overestimate kaon produc- tion around 1 TeV and above. The uncertainty about production of kaons at high energy is a principal source of uncertainty in the model which we discuss later.
To get an idea of the uncertainties in the neutrino fluxes that arise from uncertainties in the description’ of hadronic interactions it is useful to characterize the in-
clusive cross sections by their moments, weighted by the shape of the primary spectrum. For example, the contri- bution of pions is approximately proportional to
53
where dN/dx is the distribution of charged pions pro- duced in collisions of protons with nuclei in the atmo- sphere, z = ET/E, and y is the integral spectral index
of the primary cosmic-ray spectrum. The corresponding factors Z,,* (for production of charged kaons), Zpxa,
Zd 3 z,,, etc., are defined analogously. These spectrum weighted moments appear explicitly
in analytic approximations to the uncorrelated parti- cle fluxes in the atmosphere 146,471. Inspection of the analytic approximations for neutrino and muon fluxes from power-law primary spectra is sufficient to determine which are the most important sources of uncertainty in
different ranges of primary energy [48]. For vertically incident leptons with energy below 100 GeV, approxi- mately 95% of muons and 65% of Us come from pions, whereas above 1000 GeV about 50% of muons but less than - 10% of up come from decay of pions. Most of the remainder come from decay of charged kaons. (For hor- izontal leptons this transition region is shifted to higher energy [47], so that kaons are less important for produc- tion of horizontal v,-induced muons.)
The relative importance of kaons for production of neu- trinos at high energy is a consequence of the kinematics of meson decay coupled with the steep primary spectrum, as explained in Ref. [48]. In the low energy region, the uncertainties in both the muon and the neutrino fluxes are dominated by the uncertainty in pion production, as represented by Z,,. At high energy the dominant source
of uncertainty in the neutrino flux is kaon production, but this is not the case for muons. As a consequence, the extent to which measurement of the atmospheric muon spectrum can be used to normalize the neutrino spectrum
is limited. With this background, we now compare the Z fac-
tors as estimated from various sets of data and as rep- resented in the TARGET model. We also quote the Z
factors used for some other calculations [52,53] of the fluxes of high energy neutrinos, where available. The first six lines of Table I [54] show estimates of the Z fac- tors and related parameters based on three data sets for proton-proton collisions at energies from 175 GeV [49] to 400 GeV [50] on fixed targets and from the CERN Inter-
secting Storage Rings (ISR) [51] equivalent to lab energy of - 1500 GeV. The second and third columns are esti- mates of the spectrum-weighted moments. Column 4 is a
tabulation of RK, - Z,, be discussed belo:. -
i-/Z,,, The factors E(i) will
Two estimates of the parameters are given for each of the three data sets in Table I. For the data of Ref. 1491 the first line comes from the parametrization given in that reference, and the second line from the fit that
we performed to the data points. For Ref. [50] the first line is from direct integration of all data points, and the second excludes the contribution from z >0.6, where the measurements show a strange feature (possibly due to a contamination of protons in the samples of positive m&ns). For Ref. [51] the first line is from the analysis of Perkins [55] and the second from Ref. [56].
In addition to differences among the moments obtained from data on hydrogen targets, there is also the un- certainty associated with the relation between inclusive

ATMOSPHERIC NBUTRINO FLUX ABOVE 1 GeV 1317
TABLE I. Comparison of Z factors..
Reference Z& Z,,+ &lr E(P) E(k) E(h)
(491 (175 GeV) 0.074 0.0086 0.12 10.03 2.47 0.078 0.076 0.0097 0.13 10.54 2.73 0.087
[50] (400 GeV) 0.079 0.0074 0.09 10.22 2.23 0.068 0.074 0.0074 0.10 9.70 2.20 0.068
[51] (1500 GeV) 0.083 0.0086 0.10 10.96 2.53 0.079 0.083 0.0100 0.12 11.34 2.85 0.090
[52! (P-P) 0.072 0.0094 0.13 10.04 2.64 0.085
p2; 5 ;y; alr 0.069 0.065 0.0087 0.010 0.13 0.15 9.54 9.47 2.46 2.72 0.078 0.089
TARGET (1000 GeV) 0.072 0.0105 0.15 10.34 2.89 0.094
cross sections on proton targets and cross sections on light nuclei. In one case where the same group took data on both hydrogen and nuclear targets, the inclusive cross sections at pb = 0.3 GeV/c and z = 0.3 (as near to the peak of the in&grand of Eq. (1) as possible with the nuclear target data [44]) are similar for the two types of targets. Comparison of Z factors ‘calculated in an event generator which treats both pp and p-nucleus collisions (SIBYLL) [57] also shows negligible differences between the two.
On the other hand, studies of the A dependence of inclusive cross sections on a variety of nuclear targets (excluding hydrogen) do show significant variation in the fragmentation region, with a tendency for the K/n ratio to increase with target mass [41,58,59]. Production of both pions and kaons is enhanced in collisions on nuclear targets, but kaons may be more enhanced than pions.
Associated production of kaons through p + AK+ in the fragmentation region accounts for the large ra- tio of Z,,+/Z,,. since K- are produced essentially only through K+/K- pair production in thecentral re- gion. The analogous process for an incident neutron is 7~ + AK’. In TARGET the incident nucleon has an energy-dependent probability to dissociate into a AK+ pair, which is assumed to increase from threshold to 4.2% at 30 GeV/c, 6.5% at 300 GeV/c and asymptotically to
x x
6.8%. By comparison, the integrated cross section in the forward fragmentation region for p + Be -+ A + X at 300 GeV/c [60] is - 15 mb, which corresponds to a prob- ability of 7.3% for op~e = 206 mb. The probability for A production in pp collisions is approximately 5 - 6% in each hemisphere (611. As a consequence of the extra channel available for production of positive kaons by pro- tons, the inclusive cross section is significantly harder for K+ than for K- [SZ].
Production of K+IK- pairs is determined in TAR- GET by the energy-dependent multiplicity of K- [63] with an assumed enhancement of 1.45 for target “air” nuclei (A = 14.5) [58]. The resulting distributions of pro- duced ?r* and K* agree fairly well with the 19-24 GeV/c data [41,42]. In Fig. 4 we compare the distributions from TARGET for p-air interactions at 400 GeV/c with three sets ofpp data (175,400, and 1500 GeV/c). As described above, both pion and kaon production are enhanced at low z in TARGET, but kaons more so than pions. For z > 0.2 ?r+ distributions from TARGET (for p-air colli- sions) are somewhat below the pp data and K+ somewhat above.
The 2 factors corresponding to TARGET are listed in Table I, along with the values from Refs. [52,37] in which the scheme of Ref. [64] was used to relate pp to p air. The values used by Volkova [35] to calculate the
FIG. 4. Spectrum-weighted inclusive dis-
.I tributions for charged secondaries integrated
? over transverse momentum as derived from
% experimental data on pp (pp) interactions at
5 incident energy of 175 GeV (triangles) [49],
x .05 400 GeV (circles) [50], and an equivalent lab energy of 1500 GeV (ISR, squares) [51]. Dis- tributions from the event generator TAR- GET for pair collisions at 400 GeV are
0 shown for comparison.
0 2 .4 .6 .8 1 0 2 .4 .6 .8 ,I

1318 AGRAWAL,GAISSER,LIPARI,AND STANEV 12
TABLE II. 2 factors from the TARGET event generator for proton interactions on air nuclei for y = 1.7.
EP 11 Secondary particles
(GeV) P a+ ?T- K+ K- 2 If" n
3 0.4600 0.0239 0.0154 0.0001 0.0000 0.0200 0.0001 0.1013 10 0.2742 0.0529 0.0365 0.0014 0.0000 0.0447 0.0008 0.0352 102 0.2681 0.0456 0.0329 0.0072 0.0029 0.0390 0.0082 0.0335 103 0.2732 0.0414 0.0302 0.0079 0.0027 0.0356 0.0071 0.0372
104 0.2710 0.0405 0.0301 0.0076 0.0026 0.0346 0.0070 0.0369 105 0.2696 0.0409 0.0292 0.0076 0.0025 0.0346 0.0068 0.0372
flux of high energy atmospheric neutrinos are listed here from Ref. [53]. Considering all the estimates listed in Table I (for both pp and p air), the Z,,, cover a range of approximately f12%. The corresponding range for Z,,, is f17%. In the Conclusion we use these numbers to estimate the contribution of the uncertainties in the input to the neutrino flux calculations to the uncertainty in the expected flux of neutrino-induced muons.,
The last three columns of Table I show the influence of these Z-factor sets on the estimates of the uncorrelated fluxes of muons and neutrinos. E(p), &(v,), and &(v,) are the coefficients for the asymptotic ratio of the vertical lepton flux to the primary cosmic flux in the relation @, = El x &R/E, [47]. At asymptotically high energy this form gives a good estimate of the actual muon and neutrino fluxes. The range of values is fS% for muons and i14% for neutrinos.
Finally, there is the question of the energy dependence of the Z factors, as shown in Table II for TARGET. For E < 100 GeV there is energy dependence (especially for production of strange particles) as the high energy, qua- siscaling region is approached. The gross energy depen- dence of TARGET above 1000 GeV is determined by adjusting the model of Ref. [40] so that it also fits mea-
FIG. 5. Ratios of the v*+P,, flux calculated with different Z factors increased by their maximum experimental uncer- tainty to the flux calculated with the central Z-factor values. The ratios are symmetric, i.e., inverted when the calculatioIi is done with the lowest allowed Z-factor values.
surements of charged particles produced in interactions ,of 20 TeV protons in lucite [65] as described in Ref. [45]. The extrapolation reproduces the rise of the central ra- pidity plateau that continues to the energy range of pp colliders. Since there is no information on particle pro- duction in the fragmentation region above 1000 GeV, we make the assumption that the Z factors remain constant above this energy. This is the difference mentioned at the beginning of this section that leads to an increase in kaon production compared to the original version of TARGET.
To estimate the contribution of each Z factor to the overall uncertainty in the flux of uw + oP we used the analytic approximations for the neutrino fluxes from a power-law primary spectrum [46,47]. The result is shown as a function of energy in Fig. 5 for estimated maximum uncertainty in each of the various Z factors as tabulated in the last column of Table III. The other entries in Ta- ble III show the relative changes in the flux of vw + P,, due to a fractional change in the corresponding Z fac- tor. Most neutrino-induced upward muons are produced
by neutrinos with 10 5 E, 5 1000 GeV. For this rea- son, the single most importapt factor is the uncertainty
in Z,,K+.
TABLE III. Effect of different Z factors on the flux of muon neutrinos and antineutrinos. Only Z factors affecting the Eux by more than 2% are included.. The last column gives the maximum relative uncertainty deduced from experimental data and used for the estimate shown in Fig. 5
Z a, gp& IlZ
Ev (GeV) 10 100 1000 AZ/Z
PP 0.338 0.307 0.310 0.14
pn 0.046 0.040 0.030 0.68
P”+ 0.482 0.359 0.186 0.12
PT- 01276 0.222 0.146 0.12
PK+ 0.163 0.273 0.436 0.25
PK- 0.071 0.118 0.188 0.25 ?r+n+ 0.019 0.047 0.048 0.19 ?i+lc+ 0.003 0.037 0.045 0.29 ?i+K- 0.002 0.020 0.024 0.25
53 ATMOSPHERIC NEUTRINO FLUX ABOVE 1 GeV 1319
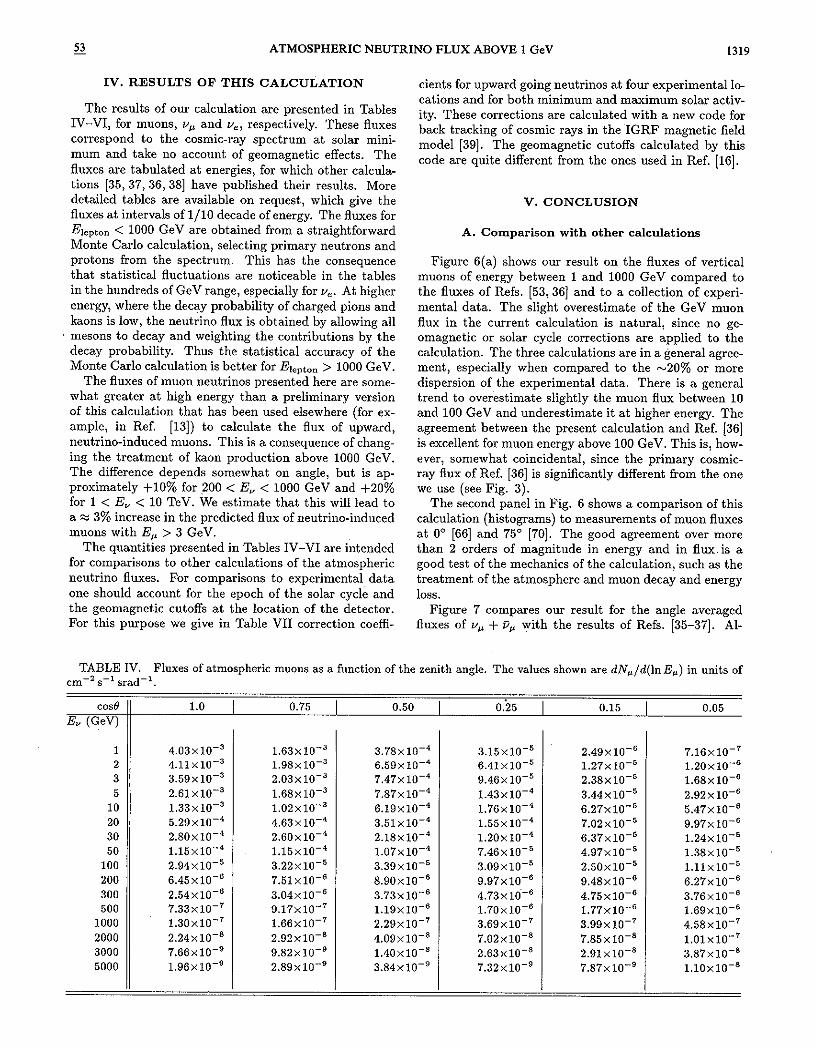
IV. RESULTS OF THIS CALCULATION
The results of our calculation are presented in Tables IV-VI, for muons, vP and v,, respectively. These fluxes correspond to the cosmic-ray spectrum at solar mini- mum and take no account of geomagnetic effects. The fluxes are tabulated at energies, for which other calcula- tions [35,37,36,38] have published their results. More detailed tables are available on request, which give the fluxes at intervals of l/10 decade of energy. The fluxes for I&ton < 1000 GeV are obtained from a straightforward Monte Carlo calculation, selecting primary neutrons and protons from the spectrum. This has the consequence that statistical fluctuations are noticeable in the tables in the hundreds of GeV range, especially for v,. At higher energy, where the decay probability of charged pions and kaons is low, the neutrino flux is obtained by allowing all mesons to decay and weighting the contributions by the decay probability. Thus the statistical accuracy of the Monte Carlo calculation is better for Elepk,, > 1000 GeV.
The fluxes of muon neutrinos presented here are some- what greater at high energy than a preliminary version of this calculation that has been used elsewhere (for ex- ample, in Ref. [13]) to calculate the flux of upward, neutrino-induced muons. This is a consequence of chang- ing the treatment of kaon production above 1000 GeV. The difference depends somewhat on angle, but is ap- proximately +10% for 200 < E, < 1000 GeV and +ZO% for 1 < E, < 10 TeV. We estimate that this will lead to a = 3% increase in the predicted flux of neutrino-induced muons with E,, > 3 GeV.
The quantities presented in Tables IV-VI are intended for comparisons to other calculations of the atmospheric neutrino fluxes. For comparisons to experimental data one should account for the epoch of the solar cycle and the geomagnetic cutoffs at the location of the detector. For this purpose we give in Table VII correction coeffi-
cients for upward going neutrinos at four experimental lo- cations and for both minimum and maximum solar activ- ity. These corrections are calculated with a new code for back tracking of cosmic rays in the IGRF magnetic field model [39]. The geomagnetic cutoffs calculated by this code are quite different from the one.s used in Ref. [16].
V. CONCLUSION
A. Comparison with other calculations
Figure 6(a) shows our result on the fluxes of vertical muons of energy between 1 and 1000 GeV compared to the fluxes of Refs. [53,36] and to a collection of experi- mental data. The slight overestimate of the GeV muon flux in the current calculation is natural, since no ge- omagnetic or solar cycle corrections are applied to the calculation. The three calculations are in a general agree- ment, especially when compared to the -20% or more dispersion of the experimental data. There is a general trend to overestimate slightly the muon flux between 10 and 100 GeV and underestimate it at higher energy. The agreement between the present calculation and Ref. 1361 is excellent for muon energy above 100 GeV. This is, how- ever, somewhat coincidental, since the primary cosmic- ray flux of Ref. [36] is significantly different from the one we use (see Fig. 3).
The second panel in Fig. 6 shows a comparison of this calculation (histograms) to measurements of muon fluxes at 0’ [66] and 75’ [70]. The good agreement over more than 2 orders of magnitude in energy and in flux, is a good test of the mechanics of the calculation, such as the treatment of the atmosphere and muon decay and energy 1OSS.
Figure 7 compares our result for the angle averaged fluxes of u,, + v,, with the results of Refs. [35-371. Al-
TABLE IV. Fluxes of atmospheric muons as a function of the zenith angle. The values shown are dN,,/d(ln E,) in units of c~-~s-’ srad-’
cose
Ev (GeV)
1.0 I 0.75 I 0.50
1 4.03x10⁻³ 1.63~10-~ 3.78x10⁻⁴ 2 4.11x10⁻³ 1.9*x10-3 6.59~10-~ 3 3.59x10⁻³ 2.03x10⁻³ 7.47x10⁻⁴ 5 2.61x10@ 1.68~10-~ 7.87~10-~
10 1.33x10⁻³ 1.02x10⁻³ 6.19x10⁻⁴ 20 5.29~10-~ 4.63x10K4 3.51x10⁻⁴ 30 2.80x10⁻⁴ 2.60x10-” 2.18~10-~ 50 1.15x10⁻⁴ 1.15x10⁻⁴ 1.07x10⁻⁴
100 2.94x1o-5 3.22~10-~ 3.39x10-’ 200 6.45x10-’ 7.51x10re 8.90x10-” 300 2.54x10-’ 3.04XlOr+ 3.73x10⁻⁶ 500 7.33x10-’ 9.17~10-~ 1.19xlo-e
1000 1.30x10⁻⁷ 1.66x10⁻⁷ 2.29x10-’ 2000 2.24x10-’ 2.92x1o-e 4.o9x1o-8 3000 7.66x10rs 9.82x1o-g 1.4ox1o-a 5000 1.96x1o-s 2.89x10-’ 3.84~10-~
I oi5
3.15x1o-b 6.41~10-~ 9.46x10-’ 1.43x10⁻⁴ 1.76x10K4 1.55x10⁻⁴ 1.20x10⁻⁴ 7.46x10-’ 3.o9x1o-5 9.97x10-’ 4.73x10⁻⁹ 1.7ox1o-o 3.69x10-’ 7.02x10-* 2.63x10-* 7.32x10-Q
I 0.15
2.49x10-” 1.27x10⁻⁵ 2.38x10-’ 3.44x10⁻⁵ 6.27x10-’ 7.02x10-’ 6.37x10-’ 4.97x10⁻⁵ 2.50x10+ 9.48x10-’ 4.75x10⁻⁶ 1.77x10⁻⁶ 3.99x10-’ 7.85x10-* 2.91x10⁻⁸ 7.87x10-’
-L 0.05
7.16~10-~ 1.20x10⁻⁶ 1.68x10-@ 2.92x10-” 5.47x10re 9.97~10-~ 1.24x10-’ 1.38~10-~ 1.11x10-~ 6.27x10-’ 3.76x10-’ 1.69x10-’ 4.58x10-’ 1.01x10-’ 3.87x10-* 1.10x10-~

1320 A
GR
AW
AL
, G
AISSE
R,
LIP
AR
I, A
ND
ST
AN
EV
53

53 ATMOSPHERIC NEUTRINO FLUX ABOVE 1 GeV 1321
TABLE VII. Geomagnetic corrections for upward going muon neutrinos plus antineutrinos for several experimental loca- tions.
Location cos 9
E"
Kamioka
IMB
GS/Fkjus
SNO/Soudan
eV)
1.0 2.0 3.0
5.0
1.0 2.0 3.0
5.0
1.0 2.0
3.0
5.0
1.0 2.0
3.0
5.0
I
0.75 0.70 0.69 0.64 0.60 0.56 0.75 0.70 0.69 0.64
0.92 0.88 0.87 0.83 0.78 0.75 0.92 0.88 0.88 0.84
0.99 0.96 0.95 0.90 0.88 0.85 1.00 0.96 0.96 0.90
1.00 0.98 1.00 0.94 0.94 0.93 1.00 0.98 1.00 0.94
0.89 0.90 0.91 0.91 0.87 0.78 0.98 0.96 0.96 0.97 0.97 0.95 0.90 0.98 1.00 0.98 1.00 0.98 0.99 0.96 1.00 1.00 0.99 1.00 0.99 0.99 0.99 1.00
1.00 1.00 0.94 0.84
1.00 1.00 0.97 0.91 1.00 1.00 0.99 0.96 1.00 1.00 0.99 0.99
0.86
0.96
1.00
1.00
0.89
0.96
1.00 1.00
0.87 0.87 0.82 0.75 0.68 0.92 0.95 0.96 0.95 0.88 0.83 0.98 0.98 1.00 0.97 0.95 0.91 1.00 0.99 1.00 0.98 0.97 0.96 1.00
0.92 0.86 0.79 0.72
0.98 0.96 0.90 0.84 1.00 0.97 0.96 0.91 1.00 0.99 0.98 0.97
0.90
0.96
0.99
1.00
0.92 0.89 0.83 0.98 0.98 0.96 0.93 0.98 0.99 0.99 0.98 1.00 1.00 0.99 0.99 1.00
1.00 1.00 0.97 0.89 1.00 1.00 0.98 0.94 1.00 1.00 1.00 0.98 , 1.00 1.00 1.00 0.99
=
0.90
0.97
1.00 1.00
z
0.99
0.99
0.99
1.00
0.93 0.97 1.00 1.00
0.99 0.99 1.00 1.00
7??zzzz
0 ‘ms: -0.50 I
min
I -0.25 I -0.15 I
0.61 0.79 0.88
0.94
-0.05
0.57
0.75
0.85
0.93
though the general agreement between the four calcula- tions is not bad, there are significant differences in the important energy range between 10 and 1000 GeV that
cause differences of order 10 - 15 % in the calculated flux of upward going neutrino induced GeV muoix
B. Uncertainty in the neutrino flux
Uncertainties in the calculated neutrino intensity arise from lack of precise knowledge of the input quantities,
which are the primary spectrum and the inclusive cross section for production of pions and kaons by hadronic in- teractions in the atmosphere. Because the relative contri- butions of kaons and pions to the neutrino flu depends both on energy and on angle, it is not possible to assign a single estimate of the uncertainty to the calculation. We have estimated the primary spectrum uncertainty by a single overall f15%.’ If we also were to assign a similar single uncertainty to the production cross sections, then we would estimate a overall uncertainty of f21% as in Ref. [13].
FIG. 6. (a) Vertical muon
Euxes calculated in Refs. [53] (dotted lines with high and low normalization) and [36] are compared with the current cal- culation (solid line) and ex- perimental data. The data points are from Refs. 1661 (squares), [67] (hexagons), [68]
(diamonds), and [69] (pen- tagons). (b) Muon flux at 0 = 0” (diamonds) 1661 and 0 = 7S0 (squares) 1701 compared to the current calculation.
‘The uncertainties in the primary spectrum may also change with energy if it is possible to choose one of the two [19,20] 10 - 100 GeV measurements over the other.

1322 AGRAWAL, GAISSER, LIPARI, AND STANEV
E., GeV E.. GeV
FIG. ‘7. (a) Angle average fluxes of v,, + ge calculated by Volkova [35] (short dashed), Butkevich et al. [36] (long dashed), Mitsui et al. [37] (dotted), and Honda et al. (381 (short-long dashed) compared to the calculation (dash-dotted). (b) To expand the comparison, we show the same information on a linear scale by plotting the ratio of each calculated flux F, from (a) to our calculation, F,(B). The line coding is the same except for the reference calculation.
Approximately 70% of neutrino-induced muons are produced by neutrinos with 10 < E(v,) 5 1000 GeV. If.we focus on this energy region, about half the (verti-
cal) neutrinos come from pions and half from kaons (a larger proportion of kaons above 100 GeV and a smaller
proportion below 100 GeV). Thus if there is a +12% un- certainty in Z,,+ and an independent f17% uncertainty in Z,,,, then these contribute, respectively, f6% and i&5%. Combining these unce+nties with the *15% uncertainty in the primary spectrum as if they were all statistical errors, we would estimate a flS% uncertainty. For illustration, let us call this nominal result 1 f 0.18.
Another possibility is to use the measured muon spec- trum as a constraint. As discussed before, this flux de- pends only weakly on the properties of kaon production and essentially measures the product of the primary flux with Z,,,+. Since the muon on average takes more en- ergy than the neutrino in ?r + pup, the relevant range of muon energies is 30~ < & < 3000 GeV. From Fig. 6, we estimate this uncertainty as &lo%. Combining this uncertainty with the uncertainty in Z,,+ as if they were uncorrelated statistical errors, we find an overall system- atic error of *14%.
The errors are not statistical, however. For example, if it were determined that the higher set [19] of primary spectrum measurements below 100 GeV were correct and the spectral index could be determined with sufficient precision to extrapolate to higher energy, we would shift the central value upward by 12% and assign a smaller error - HO% to the spectrum. Relative to the nominal estimate above, our new estimate would be 1.12 f 0.16, aqsuming the other ,uncertainties remain unchanged.
Finally, by a similar argument, if we shift the estimate of Z,,+ downward by 20%, for example, then (always averaging over the energy range i&vant for vertical up- ward neutrino-induced muons) the central value would drpp from unity to 0.9. If the uncertainties remain as initially assumed, the new estimate would be 0.9 f 0.16.
ACKNOWLEDGMENTS
We are grateful for helpful discussions with D. Michael and S. Mikheyev. This work was supported in part by the US. Department of Energy (T.K.G. and T.S.) and by the INFN (P.L.).
[l] IBM Collaboration, R. Becker-Szendy et al., Phys. Rev. Lett. 69,lOlO (1992).
[2] M. Mori et al., Phys. Lett. B 210, 89 (1991). [3] M.M. B&w et al., in Proceedings of the 3rd International
Workshop on Neutrino Telescopes, Venice, Italy, 1991, edited by M. Baldo-Ceolin (Istituto Nadonale di Fisica Nucleare, Padova, 1991), p. 235.
[4] Frejus Collaboration, K. Daum et al., Z. Phys. C 66, 417 (1995).
[5] MACRO Collaboration, D. Michael et al., in TAUP 99, Proceedings of the Third International Workshop on Theoretical and Phenomenological Aspects of Under- ground Physics, Asswergi, Italy, edited by C. Arpesella
et al. [Nucl. Phys. B (Proc. Suppl.) 35 (1994)]. [6] LVD Collaboration M. Aglietta et al., Astropart. Phys.
3, 311 (1995). [7] C.V. Achar et al., Phys. Lett. 18, 196 (1965); 19, 78
(1965). [S] F. Reines et al., Phys. Rev. Lett. 15, 429 (1965). [9] Kam-II Collaboration, KS. Hirata et al., Phys. Lett. B
280, 146 (1992); Y. Fukuda et al., ibid. 335, 237 (1994). [lo] IMB Collaboration, R. Becker-Ssendy et al., Phys. Rev.
D 46, 3720 (1992). See also D. Caper et al., Phys. Rev. Lett. 66, 2561 (1991).
[ll] W. Lohmann, R. Kopp, and R. Voss, CERN Yellow Re- port No. EP/85-03 (unpublished).

12 ATMOSPHERIC NEUTRINO FLUX ABOVE 1 GeV 1323
[12] Paolo Lipari and Todar Stanev, Phys. Rev. D 44, 3543 (1991).
[13] W. fiati, T.K. Ga&er, A.K. Mann, and Tudor Stanev, Phys. Rev. D 48, 1140 (1993).
[14] IMB Collaboration, R. Becker-Szendy et al., in Neutrino 94 [4], p. 331.
(151 Pa& Lipari, Maurisio Lusignoli, and Francesca Sartogo, Phvs. Rev. Lett. 22. 4384 (19951. \ ,
1161 Giles Barr, T.K. Ga&er, and Todor Stanev, Phys. Rev. D 89, 3532 (1989).
[17] J. Engel et al., Phys. Rev. D 46, 5013 (1992). [IS] T.K. Gaisser and Todor Stanev (unpublished). [19] W.R. Webber, R.L. Golden, and S.A. Stephens, in Pro-
ceedings of the 90th Intenatiopal Cosmic Ray Confer- ence, Moscow, USSR, 1987, edited by V. Koayarivsky et al. (Na&a, Moscow, 1987), Vol. 1, p. 325.
[ZOl E.-S. Seo et al., Astrophys. J. 378, 763 (1991). 1211 M.J. Ryan, J.F. Ormes, and V.K. Balasubramanyan,
Phys. Rev. Lett. 28, 985 (1972); 28, 14973 (1972). [22] I.P. Ivanenko et al., in Cosmic Ray Conference, Proceed-
ings of the 23rd International Conference, edited by D.A. Leahy et al. (University of Calgary, Calgary, Canada, 1993), Vol. 2, p. 25.
1231 K. Asakimori et al., in Cosmic Ray Conference [22], p, 21.
[24] K. Asakimori et al., in Cosmic Ray Conference [22], p. 25.
1251 Y. Kawamura et al., Phys. Rev. D 40, 729 (1989). 1261 V.I. Zatsepin et al., in Cosmic Ray Conference [22], p.
130. 1271 J. Dwyer et al., in Cosmic Ray Conference [22], Vol. 1,
p. 587. [28] J.J. Engelmann et al., Astron. Astrophys. 233,96 (1090). [29] M. Simon et al., Astrophys. J. 239, 712 (1980). 1301 J. Buckley et al., in Cosmic Ray Conference 1221, Vol. 1,
p. 599. [31] D. Miiller et al., Astrophys. J. 374, 356 (1991); S.P.
Swordv. J. L’Heureux. P. Mever. and D. Miiller. ibid. 403, 6”;, (1993). ”
[32] M. Ichimura et al., Phys. Rev. D 48, 1949 (1993). [33] J.A. Simpson, Annu. Rev. Nucl. Part. Sci. 33, 323 (1983). [34j S. Swordy, in Cosmic Ray Confemnce [22], p. 243. 1351 L.V. Volkova, Yad. Fiz. 31, 1510 (1980) [Sov. J. Nucl.
Phys. 31, 784 (lOSO)]. [36] A.V. Butkevich, L.C. Dedenko, and LM. Zheleznykh,
Yad. Fiz. 50, 142 (1989) [Sov. J. Nucl. Phys. 50, 90 (1989)].
13’7) K. Mitsui, Y. Minorikawa, and H. Komori, Nuovo Ci- mento c9, 995 (1986).
1381 M. Honda, T. Kajita, K. Kasahara, and S. Midorikawa, Phys. Rev. D 52. 4985 (19951.
[39] P. iipari and T. Stanev‘(unpublished). 1401 E. Stenlund and I. Otterlund, CERN Report No.
CERN/EP/82-42 (unpublished). (411 T. Eichten et al., Nucl. Phys. B44, 333 (1972). [42] J.V. Allaby et al., CERN Yellow Report No. 70-12 (un-
published). 1431 W.D. Walker, in High Energy Physics - 1980, Proceed-
ings of the 20th International Conference, Madison, Wis- consin, edited by L. Durand and L.G. Pondrom, AIP Cant Proc. No. 68 (AIP, New York, 1980), p. 77.
[44] D.S. Barton et al., Phys. Rev. D 27, 2580 (1983). 1451 T.K. Gaisser, R.J. Protheroe, and Todor Stanev, in Pro-
ceedings of the 18th International Cosmic Ray Confer- ence, Bang&re, India, 1983, edited by N. Durgaprasad et al. (TIFR, Bombay, 1983), Vol. 5, p. 174 (Fig. 1 of this paper is incorrectly plotted).
[46] Thomas K. Ga&er, Cosmic Rays and Particle Physics (Cambridge University Press, Cambridge, England 1990).
[47] Paolo Lipari, Astropart. Phys. 1, 195 (1993). [48] T.K. Gaisser, P. Lipari, and T. Stanev, in Cosmic Ray
Conference [22], Vol. 4, p. 495. 1491 A.E. Brenner et al., Phys. Rev. D 26, 1497 (1982). [50] M. Aguilar-Benitee et al., Z. Phys. C 50, 405 (1991). [51] E. Yen, Phys. Rev. D 10, 836 (1974). [52] Y. Minorikawa and K. Mitsui, Lett. Nuovo Cimento 41,
333 (1984). [53] L.V. Volkova, G.T. Zatsepin, and L.A. Kuz’michev, Yad.
Fia. 29, 1252 (1979). [54] R.S. Fletcher et al., in Cosmic Ray Conference [22], Vol.
4, p. 40. [55] D.H. Perkins, Astropart. Phys. 2, 249 (1994). [56] A.M. Hillas, Proceedings of the 16th International Cosmic
Ray Conference (Institute Cosmic Ray Research, Tokyo, 1979), Vol. 8, p. 7.
[57] R.S. Fletcher et al., Phys. Rev. D 50, 5710 (1994). [58] G.J. Marmer et al., Phys. Rev. 179, 1294 (1969). [59] D. Antreasyan et al., Phys. Rev. D 19, 764 (1979). [60] P. Skubic et al., Phys. Rev. D 18, 3115 (1978). [61] K. Jaeger, D. Colley, L. Hyman, and J. Rest, Phys. Rev.
D 11, 2405 (1975). [62] M. Bourquin et al., Nucl. Phys. B153, 13 (1979). [63] M. Antinucci et al., Lett. Nuovo Cimento 6, 121 (1973). [64] F. Tagaki, Prog. Theor. Phys. 65, 1350 (1981). [65] S. Ta&a et al., Phys. Rev. D 25, 1765 (1982). [66] O.C. Allkofer, K. Carstensen, and W.D. Dau, Phys. Lett.
36B, 425 (1971). [67] B.C. R.&in, J. Phys. G 10, 1609 (1984). [68] CA. Ayre et al., J. Phys. G 1, 584 (1975). [69] I.P. Ivanenko et al., in Pnxeedings of the 19th Inter-
national Cosmic Ray Conference, La Jolla, California, 1985, edited by F.C. Jones, J. Adams, and G.M. Ma- son, NASA Conf. Publ. No. 2376 (Goddard Space Flight Center, Greenbelt, MD, 1985), Vol. 8, p. 210.
[?O] H. Jokisch et al., Phys. Rev. D 10, 1368 (1979).


![Calculation of DM properties in extensions of Standard ModelPositron flux = 1.04E-13[cm^2 sr s GeV]^{-1} for E=300.0[GeV] Antiproton flux = 5.88E-13[cm^2 sr s GeV]^{-1} for E=300.0[GeV]](https://img.pdfslide.net/doc/110x75/60960aa12db3350f207f62b8/calculation-of-dm-properties-in-extensions-of-standard-model-positron-flux-104e-13cm2.jpg)


![Neutrino Telescope Techniques - Indico [Home]indico.ictp.it/event/a0355/session/53/contribution/35/material/0/0.pdf · Neutrino Telescope Techniques E eV Flux of neutrinos decreases](https://img.pdfslide.net/doc/110x75/5acaa7ca7f8b9a7d548e0475/neutrino-telescope-techniques-indico-home-telescope-techniques-e-ev-flux-of.jpg)