Embed Size (px)
Citation preview
ATMOSPHERIC PARTICULATE MATTER BY SEM-EDX
C. Grassi, P. Narducci, L. Tognotti Department of Chemical Engineering, University of Pisa, 56126 Pisa (Italy) e.mail [email protected], [email protected], [email protected]
ABSTRACT Particulate Matter, depending on their nature, have very different size, composition and morphology. By the combination of these criteria it is possible to distinguish the emitting sources (primary or secondary). The shape and the dimension of the particles have also a direct interaction with the risk assessment for human health. Scanning Electron Microscope S.E.M. was used for the dimensional and morphological characterisation of P.M. on filters and the EDX system for chemical identification of the main constituents. With the proposed method quantitative results were obtained either for the number, surface and mass distribution of the particles or for the morphological characterisation. Large number of particles were analysed (>105 single particles for each filter) due to image processing of the electron microscope images. Single particles chemical analysis were performed to have information on the nature of the aerosols and together with the dimensional and shape parameters allows to identify the most probable direct source emission or the secondary source processes. In particular it was possible to distinguish different shapes of particles found in urban, rural or marine environment by the analysis of several filters collected in different areas of the Tuscany region. The results show interesting correlation between PM10 concentrations and meteorological data. These results were found to be crucial for the characterisation of the P.M. and for the sources apportionment study. KEYWORDS: Particulate Matter, PM10, PM2.5, S.E.M., Size Distribution, EDX. INTRODUCTION Particulate Matter (PM) is one the most important pollutant monitored for the air quality assessment and in particular PM10/PM2.5 have direct effects on human health. This pollutant deals with a wide range of sources either anthrophogenic, natural or “secondary”, as well as with climate and meteorological phenomena. The complex mixture of inorganic and organic compound, dealing with the particulate matter composition, is one of the main aspects either for their characterisation or for the sources emissions apportionment. Other important parameters to be taken into account are the morphology and dimensions of the particles. The shape and the dimension of the particles have a direct interaction with their nature and with the risk assessment for human health. The smallest particles are able to reach the deepest parts of the human respiratory organs [lungs] and up to directly interacting in the alveolus with the blood. The shapes of the particles determine different superficial area and densities so that the PM could be very good absorbing or adsorbing media for dangerous toxic and cancerogenous compounds and could also determine several ways of interacting with the human body. Due to the different possible formation pathways (chemical reaction in atmosphere, nucleation, condensation, coagulation and cloud processes) the PM shows a wide range of different shapes and dimensional distribution. It is well known [4] how the microphysics processes of particles formation and evolution could generate particles from 10 nm to 10 µm with very
different chemical composition. All these information could be of great interest due to the need of understanding how the pollution from particulate matter take place in a specific area. Different techniques are nowadays used for the size distribution measurement of aerosols particles in particular automatic instruments are tested: differential mobility analyser or condensation particles counters for the small particles [0.01 µm to 0.5 µm] and for the larger particles laser spectrometer [1] or optical particles counter [0.2 µm to 20 µm] [2,3]. In this work a new approach for the elaboration of Scanning Electron Microscope S.E.M. for the dimensional and morphological characterisation of P.M. on filters is presented. The use of this reliable technique is useful because allows, at the same time, to obtain either dimensional or morphological information, that could be very useful for the characterisation of the P.M. and for the sources apportionment study. EXPERIMENTAL For the present study on the PM10/2.5 an experimental method was developed joining the different analytical requirements either for the sampling techniques or for the SEM and image processing techniques. Sampling techniques used for characterisation of PM are very different concerning to the type of the chemical and physical analysis that should be done. Different approaches are applied for the characterisation of PM by S.E.M. Our research objective is to obtain the most consistent information from the fine particles without any type of chemical or physical treatment before the analysis. For this reason we used Low Volume Sampler (LVS), Tecora TCR, with sampling head USEPA-cfr part.50 for PM10 with operating flow rate of 16.7 liter/min. For collecting the aerosols samples POLICARBONAT PC40 AOX filters ∅47 mm, ∅0.4 µm pore diameters, were used. This type of filters media gives good results for morphological and dimensional analysis, in particular their pure composition and their flat surface let them suitable for the S.E.M. analysis. The sampling time was set up to be able to collect a sufficient number of particles to be easily detected and for this reason we sample from 2 up to 3 m3 of air. The particles were collected either for a period of 2 hours when there is the need to capture specific information or for 15 minutes every 2 hr during the all day (24 hr) for average daytime pollution. The sampling were performed in different sites, to test the performances of the proposed method in the identification of the variation of the PM10 nature. The polycarbonate filters were analysed with a Joel 5600LVS scanning electron microscope S.E.M.. The filters were firstly coated with gold to obtain the maximum resolution from the S.E.M. images. For each filters we stored several images for the four magnifications, figure 1, following random sampling statistical method [5] to have representative information about all the filter content. Those images are then elaborated with an image analysis software, Image-Pro® Plus, for the dimensional and morphological analysis. The images are firstly processed for the identification of the single particles by the grey-scale images distribution. The application of either low pass filter or manual selection of the grey scale distribution allows to separate the background, the filter, from the particles and to identify each single particle. The available image resolution [1280x960pixel] determine the identification of particles bigger than 0.03µm. This lower limits was determined by considering the 10000x magnification, in which each pixel is 10nm x 10nm, so the minimum detectable particles dimension was at least made by 3 x 3 pixels, 30nm x 30nm. In this condition the procedure allows to identify up to 20.000 particles on each image sample [100µm2] and to compute their dimensions and shapes characteristics. Several parameters were determined for PM classification, both for the dimensional characterisation (diameters,
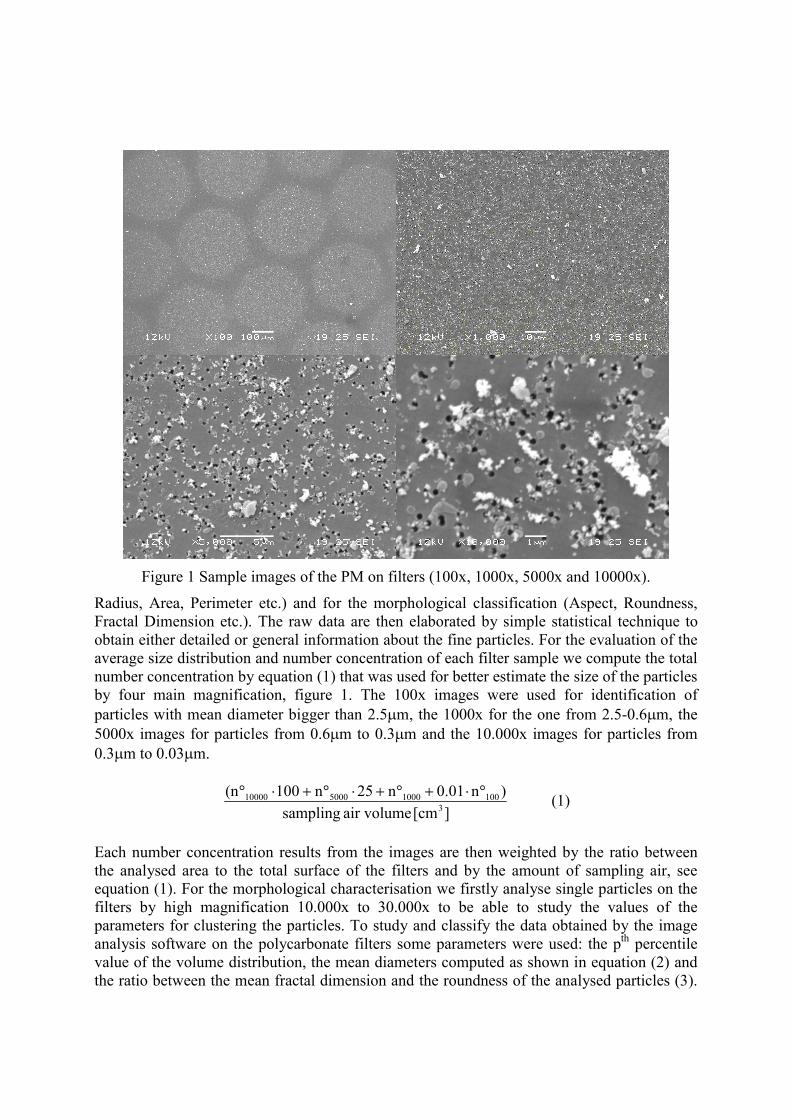
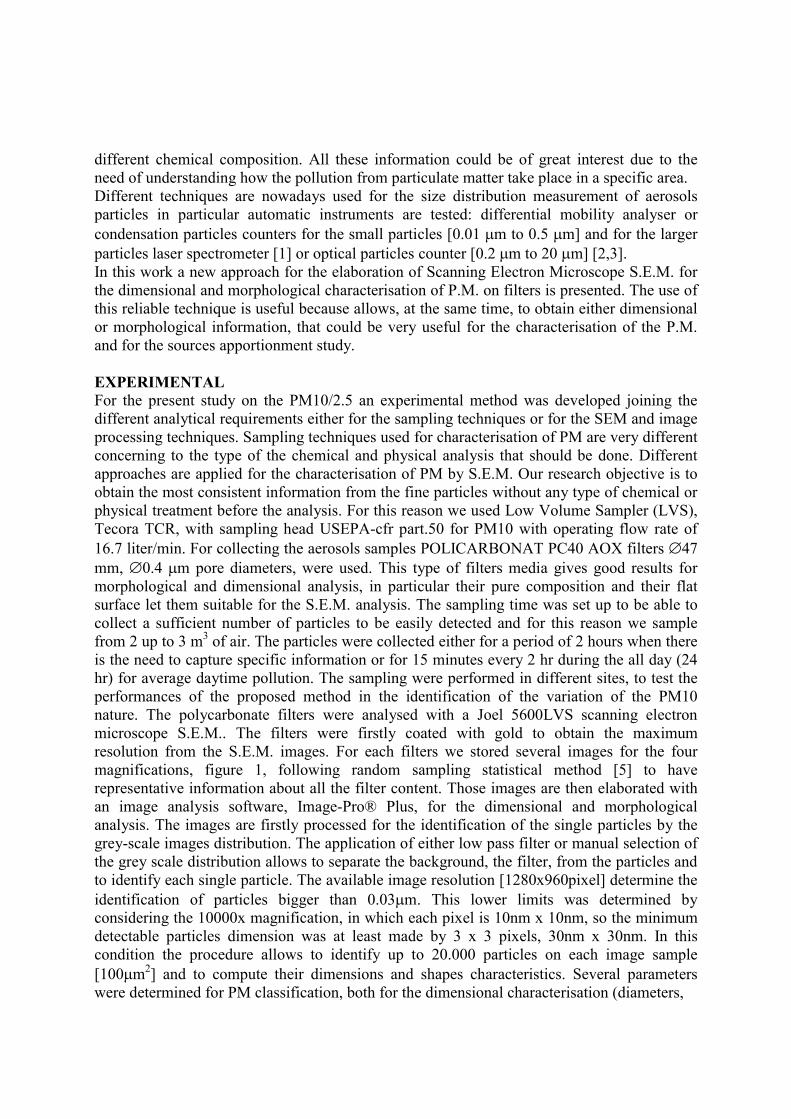
Figure 1 Sample images of the PM on filters (100x, 1000x, 5000x and 10000x).
Radius, Area, Perimeter etc.) and for the morphological classification (Aspect, Roundness, Fractal Dimension etc.). The raw data are then elaborated by simple statistical technique to obtain either detailed or general information about the fine particles. For the evaluation of the average size distribution and number concentration of each filter sample we compute the total number concentration by equation (1) that was used for better estimate the size of the particles by four main magnification, figure 1. The 100x images were used for identification of particles with mean diameter bigger than 2.5µm, the 1000x for the one from 2.5-0.6µm, the 5000x images for particles from 0.6µm to 0.3µm and the 10.000x images for particles from 0.3µm to 0.03µm.
][cm air volume sampling)n0.01 n 25n 100(n
31001000500010000 °⋅+°+⋅°+⋅° (1)
Each number concentration results from the images are then weighted by the ratio between the analysed area to the total surface of the filters and by the amount of sampling air, see equation (1). For the morphological characterisation we firstly analyse single particles on the filters by high magnification 10.000x to 30.000x to be able to study the values of the parameters for clustering the particles. To study and classify the data obtained by the image analysis software on the polycarbonate filters some parameters were used: the pth percentile value of the volume distribution, the mean diameters computed as shown in equation (2) and the ratio between the mean fractal dimension and the roundness of the analysed particles (3).
The EDX system (Energy Dispersive X ray analysis), mounted on the Jeol S.E.M. detects, on the polycarbonate filters: Na, Mg, Al, Si, P, S, Cl, K, Ca, Ti, V, Cr, Fe, Ni, Cu, Zn, Br and Pb.
qp
j
iiq
i
j
iip
i
qp
Dn
DnD
−
=
=
⋅
⋅
=
∑
∑
1
1
1,
(2)
⋅
⋅
=
∑
∑
=
=
j
iii
j
iii
RFD
Rdn
FDnR
1
1,
(3)
The instrument acquires either single spot spectrum or area spectrum, in this way it is possible to identify a single particle analysis and the mean values of the constituents from a group of particles. Post processing of the recorded images and the EDX analysis were performed to correlate chemical and dimension results. RESULTS AND DISCUSSION The possibility to analyse the data available for each single particle is an important outcome of this techniques that could also be used to go back, by the obtained results, to identify possible sources emission or specific particle characterisation by mean of clustering algorithms applied to these data. The data are elaborated, as previously described, to obtain the number concentration of the particle as a function of the particles mean diameters [6]. The surface area and the volume/mass distribution were computed by these data assuming spherical particles and unit density value. The results of two samples taken in two different days and meteorological conditions, the sample named “A” is referred to the 2nd march 2004 and the sample “B” 2nd march 2004. The monitoring site is placed in the Engineering faculty in Pisa. The results shown in figure 2 well describe how the proposed technique can identify the difference in the number and volume/mass distribution of the sampled PM10. In figure 2a the cumulative number concentration distribution are shown, for the two monitored situation, and in figure 2b the volume/mass distribution as function of the particles diameters. In table 1 the related meteorological parameters are shown measured during the sampling time.
Date Sample Wind direction[°N]
Wind speed [m/s]
Pressure(mbar)
Ur (%)
Temp.[°C]
02/03/2004 A WN 3.2 1024 45 8 03/03/2004 B E 1.9 1024 41 10
Table 2 Meteorological condition for the two sampling days
As it can be seen, figure 2a, the difference in the size distribution from the two tests sample is clearly evident, this difference also reflects to the volume distribution that show significant variation in the ratio of the pick of the contribution to the total volume values from the smaller to the bigger particles, figure 2b. The PM10 concentration values, measured from the three stations (Borghetto, Oratoio and Fazio) of the air quality monitoring network in the Pisa urban area (the three stations cover an area of 10km x 10 km), during the 2nd march 2004 were respectively 34 µg/m3, 25 µg/m3, 30 µg/m3 and during the 3rd march 2004 were 57 µg/m3, 52 µg/m3, 55 µg/m3. These numbers reveal an explicit increase in the PM10 mass concentration values and from figure 2b, it is possible to identify a clear correlation with the number and volume/mass distribution that show, for the sample B, the presence of particles bigger than 3µm and the decrease in the particles smaller that 1 µm. These results could better
explained by the characteristics diameters parameters and shown in table 1. These parameters could be considered as specific characteristics of the sampled PM10 and could be useful for further considerations.
Figure 2 Cumulative number concentration (a) Volume number concentration (b) for the two test samples.
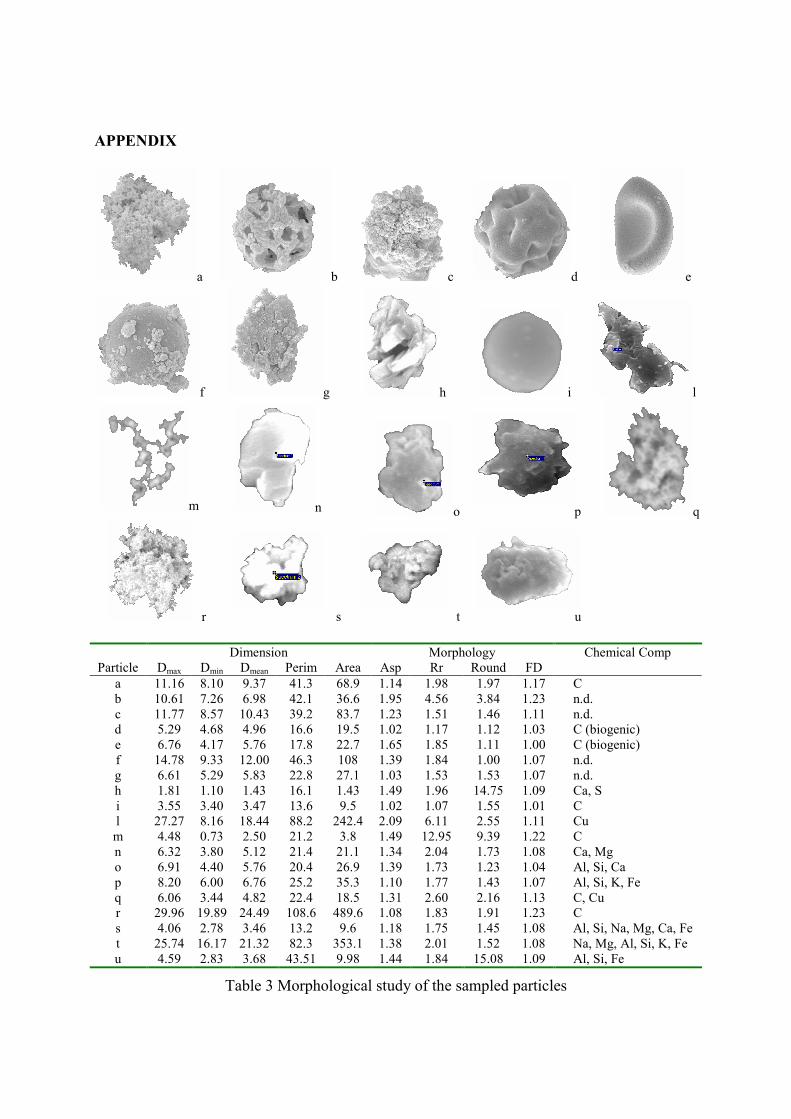
As previously described, the use of the scanning electron microscope equipped with the EDX system, allows to determine the chemical composition of the collected particles. As a results of the application of these techniques to the single particles chemical analysis coupled with the dimensional and morphological characterisation, it is possible to identify the dimension of the particles related to the presence of the various elements and due to the shape parameters also determine their nature. In the appendix there are listed some of the analysed particles with their characteristics parameters. As a relevant results of the proposed method the storage of the data for each filter allow the post-elaboration of the data.
Sample Number Conc. Volume Conc. D1,0 D3,0 D3,2 Dv[0.1] Dv[0.5] Dv[0.9] RFD,R [1/cm3] [µm3/cm3] [µµµµm] A 2300 5791 0.20 0.43 0.81 0.37 0.97 1.92 0.7 B 1950 8250 0.12 0.51 2.23 0.92 4.97 9.92 0.5
Table 1 Concentration and dimensional parameters for PM10 on filters
CONCLUSION The proposed approach to the elaboration of the images and chemical data obtained from the electron scanning microscope were used to identify and characterise the PM10 collected on filters. The parameters computed and elaborated allow to distinguish from particles with similar composition by their dimension and morphology and add important information for the source identification of the particles collected on filters. REFERENCES 1. Tuch Th. et al., Atmospheric Environment, 34 (2000) 139-149. 2. Keyling W.G. et al., Atmosferic Environment 37 (2003) 3841-3848. 3. Naoe H. et al. Atmosferic Environment 37 (2003) 3047-3055. 4. Raes F. et al., Atmospheric Environment 34 (2000) 4215-4240. 5. Gilbert O.R., 1987, John Wiley & Sons 6. Seinfeld, J.H., Pandis, S.N., 1998. Atmospheric Chemistry and Physics. Wiley, New York.
0
50
100150
200
250300
350
400N
NNE
NE
ENE
E
ESE
SE
SSES
SSW
WS
WWS
W
WNW
WN
NWN
A
B
APPENDIX
a b c d e
f g h i l
m n o p q
r
s
t u
Dimension Morphology Chemical Comp Particle Dmax Dmin Dmean Perim Area Asp Rr Round FD
a 11.16 8.10 9.37 41.3 68.9 1.14 1.98 1.97 1.17 C b 10.61 7.26 6.98 42.1 36.6 1.95 4.56 3.84 1.23 n.d. c 11.77 8.57 10.43 39.2 83.7 1.23 1.51 1.46 1.11 n.d. d 5.29 4.68 4.96 16.6 19.5 1.02 1.17 1.12 1.03 C (biogenic) e 6.76 4.17 5.76 17.8 22.7 1.65 1.85 1.11 1.00 C (biogenic) f 14.78 9.33 12.00 46.3 108 1.39 1.84 1.00 1.07 n.d. g 6.61 5.29 5.83 22.8 27.1 1.03 1.53 1.53 1.07 n.d. h 1.81 1.10 1.43 16.1 1.43 1.49 1.96 14.75 1.09 Ca, S i 3.55 3.40 3.47 13.6 9.5 1.02 1.07 1.55 1.01 C l 27.27 8.16 18.44 88.2 242.4 2.09 6.11 2.55 1.11 Cu m 4.48 0.73 2.50 21.2 3.8 1.49 12.95 9.39 1.22 C n 6.32 3.80 5.12 21.4 21.1 1.34 2.04 1.73 1.08 Ca, Mg o 6.91 4.40 5.76 20.4 26.9 1.39 1.73 1.23 1.04 Al, Si, Ca p 8.20 6.00 6.76 25.2 35.3 1.10 1.77 1.43 1.07 Al, Si, K, Fe q 6.06 3.44 4.82 22.4 18.5 1.31 2.60 2.16 1.13 C, Cu r 29.96 19.89 24.49 108.6 489.6 1.08 1.83 1.91 1.23 C s 4.06 2.78 3.46 13.2 9.6 1.18 1.75 1.45 1.08 Al, Si, Na, Mg, Ca, Fe t 25.74 16.17 21.32 82.3 353.1 1.38 2.01 1.52 1.08 Na, Mg, Al, Si, K, Fe u 4.59 2.83 3.68 43.51 9.98 1.44 1.84 15.08 1.09 Al, Si, Fe
Table 3 Morphological study of the sampled particles