Embed Size (px)
DESCRIPTION
Atmospheric Wind Measurement WindSat. University of Colorado at Colorado Springs WindSat Team: Rodger Mourning Courtnee Applegate Justin Perkins Anna Stanko Faculty Advisor: Dr. Jason Roney. Presentation Agenda. WindSat project overview Flight summaries Results Conclusions - PowerPoint PPT Presentation
Citation preview
Atmospheric Wind MeasurementAtmospheric Wind MeasurementWindSatWindSat
University of ColoradoUniversity of Colorado at Colorado Springsat Colorado Springs
WindSat Team:WindSat Team:Rodger MourningRodger Mourning
Courtnee ApplegateCourtnee ApplegateJustin PerkinsJustin PerkinsAnna StankoAnna Stanko
Faculty Advisor:Faculty Advisor:Dr. Jason RoneyDr. Jason Roney
Presentation AgendaPresentation Agenda WindSat project overviewWindSat project overview Flight summariesFlight summaries ResultsResults ConclusionsConclusions QuestionsQuestions
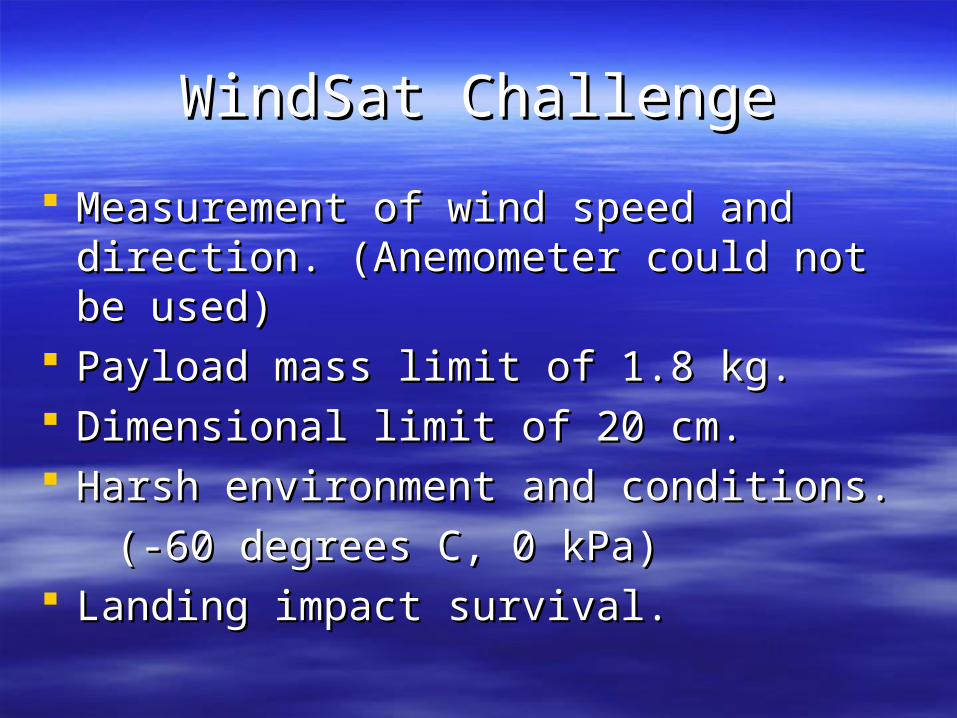
WindSat ChallengeWindSat Challenge
Measurement of wind speed and direction. Measurement of wind speed and direction. (Anemometer could not be used)(Anemometer could not be used)
Payload mass limit of 1.8 kg.Payload mass limit of 1.8 kg. Dimensional limit of 20 cm.Dimensional limit of 20 cm. Harsh environment and conditions.Harsh environment and conditions.
(-60 degrees C, 0 kPa)(-60 degrees C, 0 kPa) Landing impact survival.Landing impact survival.

WindSat ApplicationsWindSat Applications
Space Missions / Research:Space Missions / Research:
Determination of atmospheric Determination of atmospheric conditions prior to a planetary conditions prior to a planetary explorer descent can greatly explorer descent can greatly decrease the chance of mission decrease the chance of mission failure.failure.
Atmospheric Research:Atmospheric Research:
Direct wind measurement would Direct wind measurement would improve weather models.improve weather models.
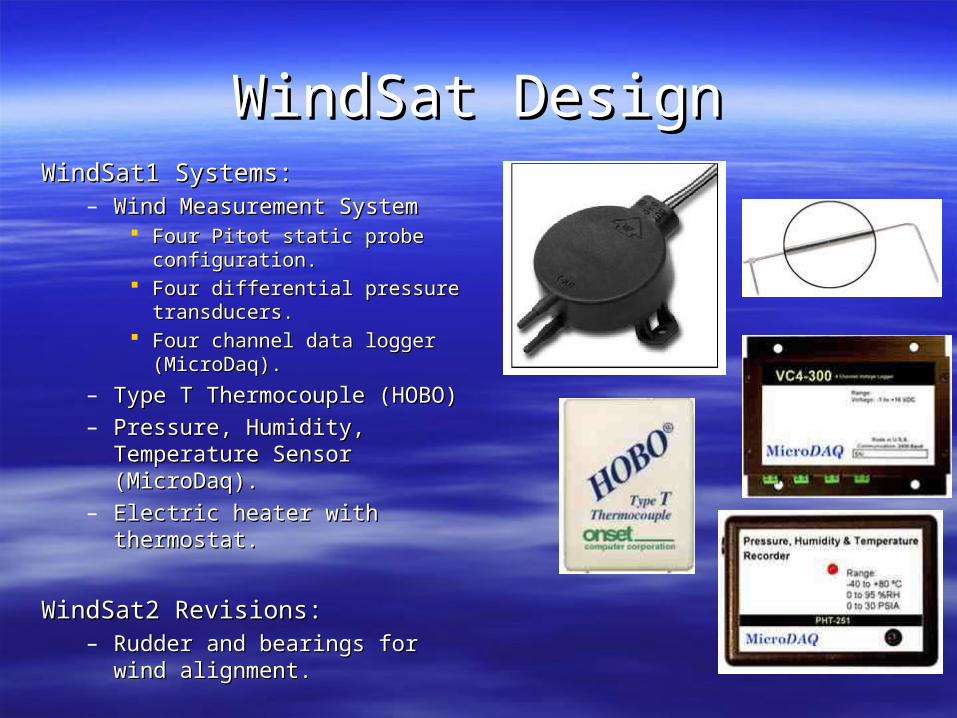
WindSat DesignWindSat DesignWindSat1 Systems:WindSat1 Systems:
– Wind Measurement SystemWind Measurement System Four Pitot static probe Four Pitot static probe
configuration.configuration. Four differential pressure Four differential pressure
transducers.transducers. Four channel data logger Four channel data logger
(MicroDaq).(MicroDaq).
– Type T Thermocouple (HOBO)Type T Thermocouple (HOBO)
– Pressure, Humidity, Pressure, Humidity, Temperature Sensor Temperature Sensor (MicroDaq).(MicroDaq).
– Electric heater with thermostat.Electric heater with thermostat.
WindSat2 Revisions:WindSat2 Revisions:– Rudder and bearings for wind Rudder and bearings for wind
alignment.alignment.
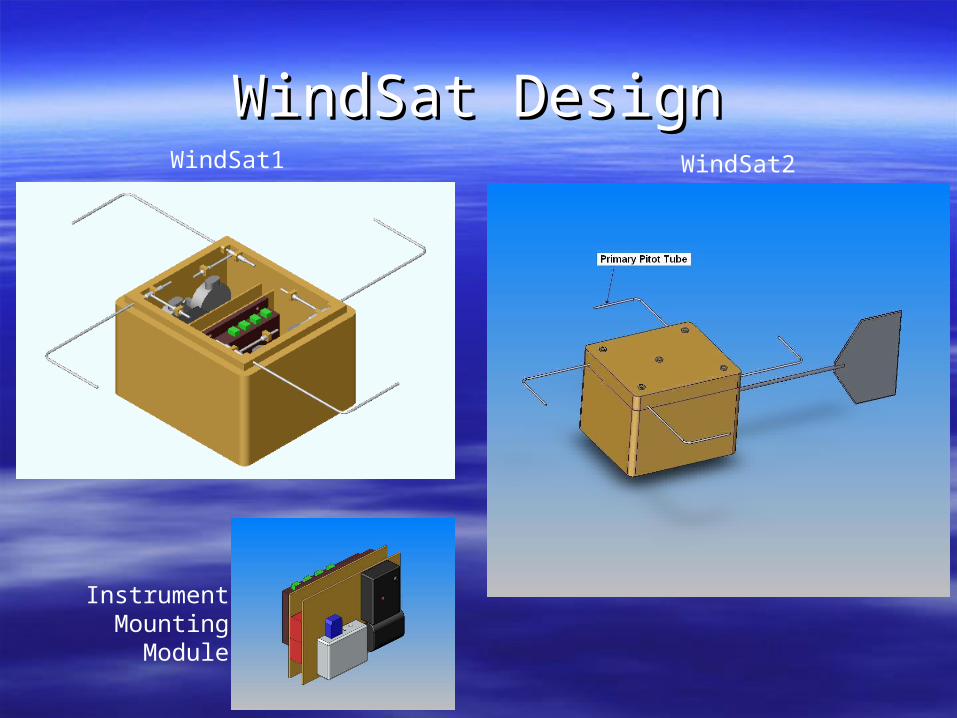
WindSat DesignWindSat Design
InstrumentMounting
Module
WindSat1 WindSat2

Instrument TestingInstrument Testing
Preliminary tests were Preliminary tests were exploratory.exploratory.– Determine variables of Determine variables of
dependency.dependency.
– Become familiar with Become familiar with instruments (operating range, instruments (operating range, etc.)etc.)
Pressure transducer calibration.Pressure transducer calibration. Pitot tube wind tunnel testing.Pitot tube wind tunnel testing. Instrument accuracy verification.Instrument accuracy verification.
Average Transducer Voltage vs Angle of Attack
22.05
2.12.15
2.22.25
2.32.35
2.42.45
2.5
0 90 180 270 360
Angle (degrees)
Vol
tage
(V)
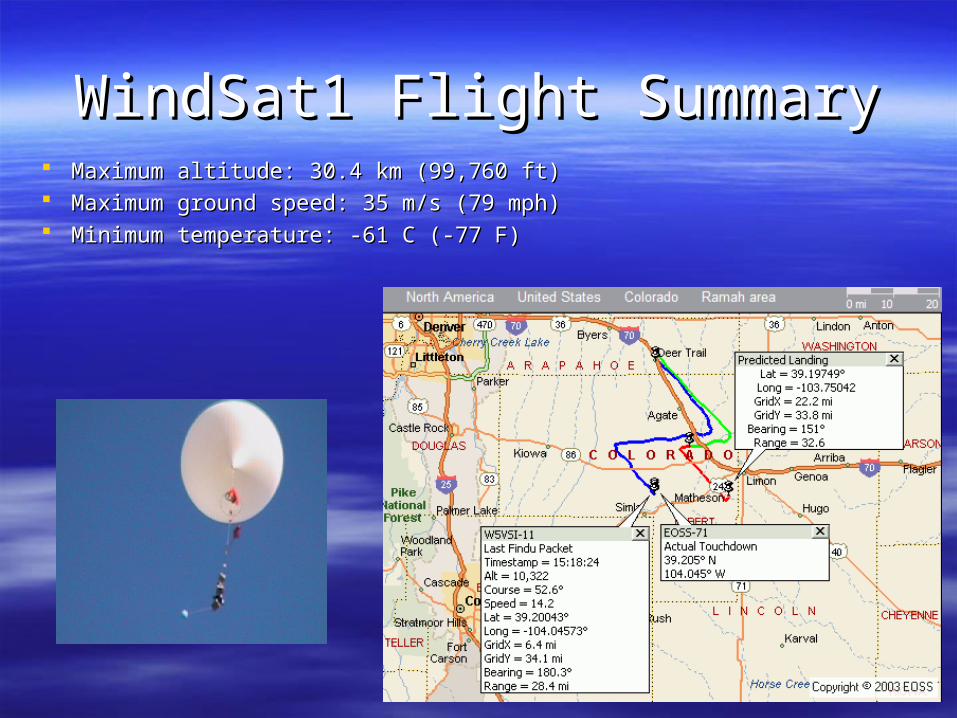
WindSat1 Flight SummaryWindSat1 Flight Summary Maximum altitude: 30.4 km (99,760 ft)Maximum altitude: 30.4 km (99,760 ft) Maximum ground speed: 35 m/s (79 mph)Maximum ground speed: 35 m/s (79 mph) Minimum temperature: -61 C (-77 F)Minimum temperature: -61 C (-77 F)
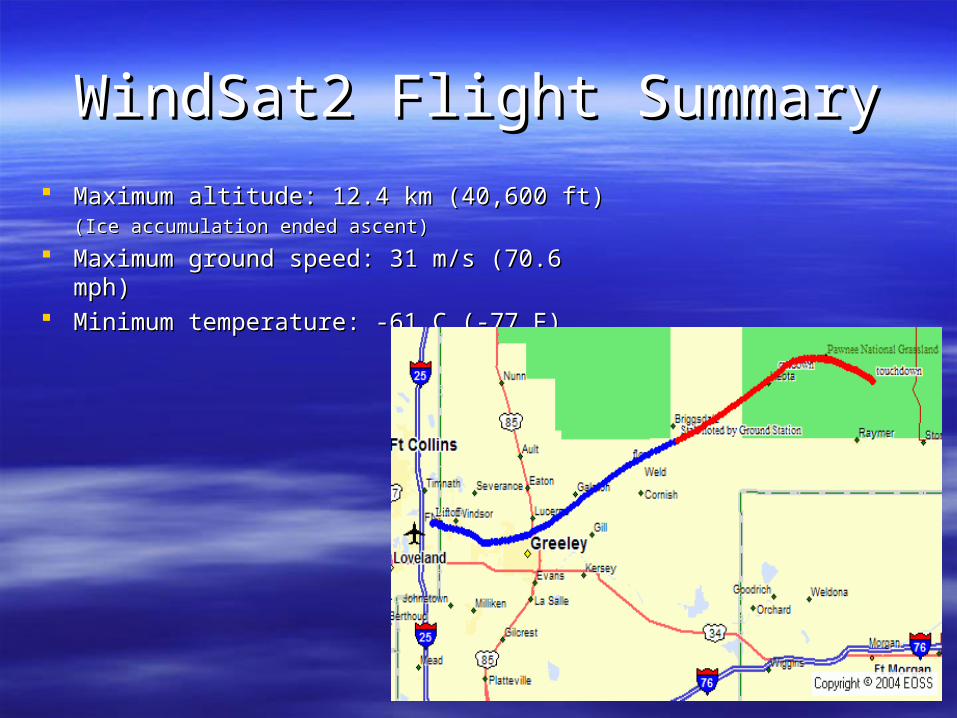
WindSat2 Flight SummaryWindSat2 Flight Summary
Maximum altitude: 12.4 km (40,600 ft)Maximum altitude: 12.4 km (40,600 ft)(Ice accumulation ended ascent)(Ice accumulation ended ascent)
Maximum ground speed: 31 m/s (70.6 mph)Maximum ground speed: 31 m/s (70.6 mph) Minimum temperature: -61 C (-77 F)Minimum temperature: -61 C (-77 F)
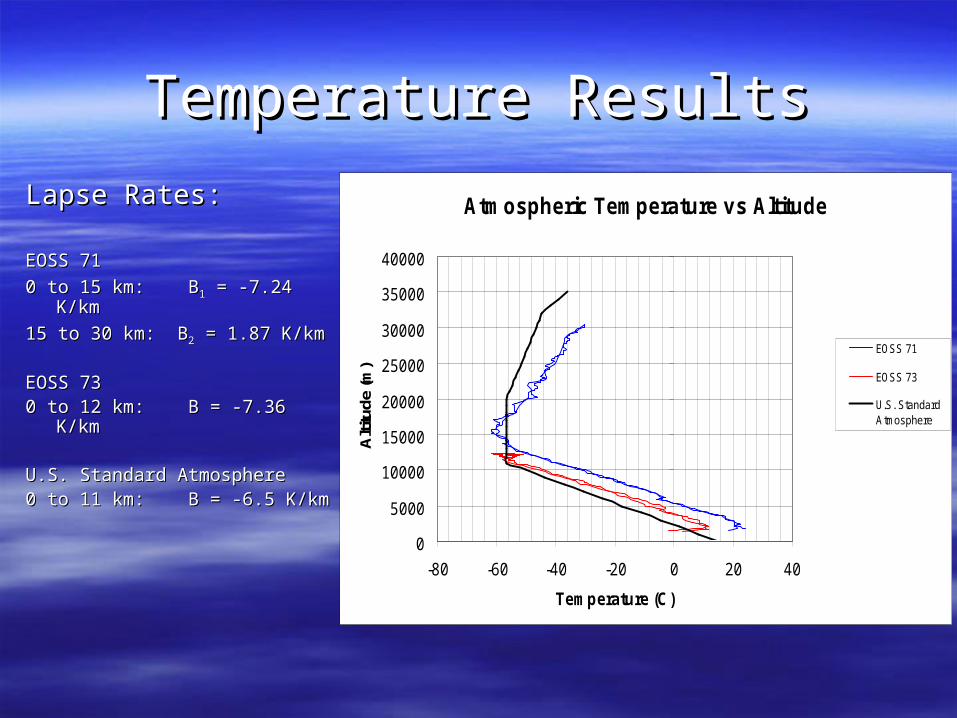
Temperature ResultsTemperature Results
Lapse Rates:Lapse Rates:
EOSS 71EOSS 71
0 to 15 km: B0 to 15 km: B11 = -7.24 K/km = -7.24 K/km
15 to 30 km: B15 to 30 km: B22 = 1.87 K/km = 1.87 K/km
EOSS 73EOSS 730 to 12 km: B = -7.36 K/km0 to 12 km: B = -7.36 K/km
U.S. Standard AtmosphereU.S. Standard Atmosphere0 to 11 km: B = -6.5 K/km0 to 11 km: B = -6.5 K/km
Atmospheric Temperature vs Altitude
0
5000
10000
15000
20000
25000
30000
35000
40000
-80 -60 -40 -20 0 20 40
Temperature (C)
Alti
tude
(m)
EOSS 71
EOSS 73
U.S. StandardAtmosphere
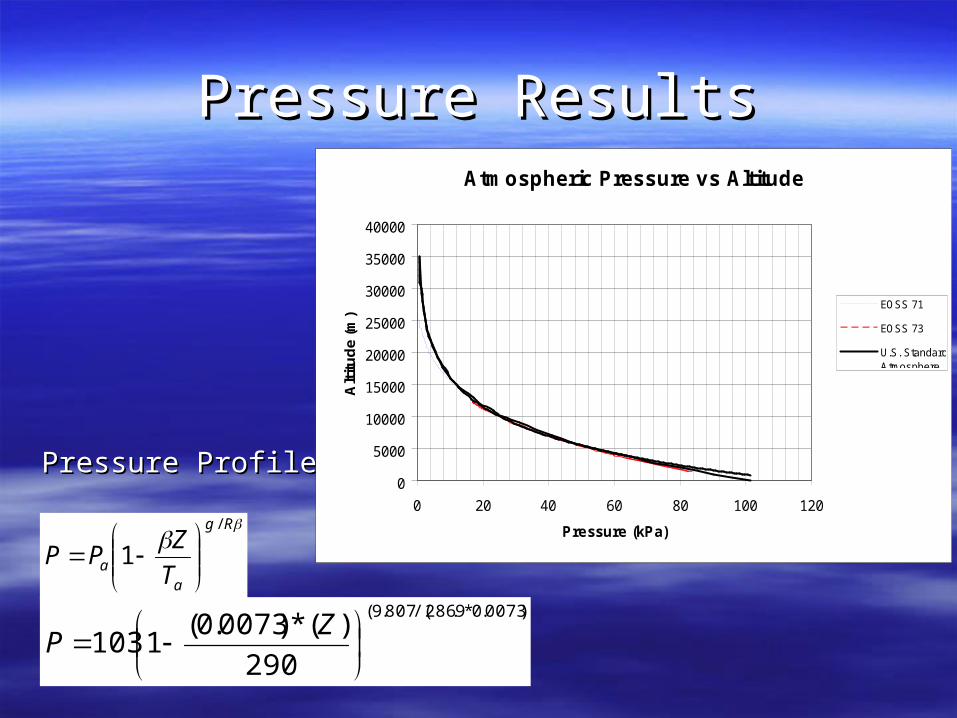
Pressure ResultsPressure Results
Pressure Profile:Pressure Profile:
Rg
aa T
ZPP
/
1
)0073.0*9.286/(807.9(
290
)(*)0073.0(1103
ZP
Atmospheric Pressure vs Altitude
0
5000
10000
15000
20000
25000
30000
35000
40000
0 20 40 60 80 100 120
Pressure (kPa)
Alt
itu
de
(m)
EOSS 71
EOSS 73
U.S. StandardAtmosphere
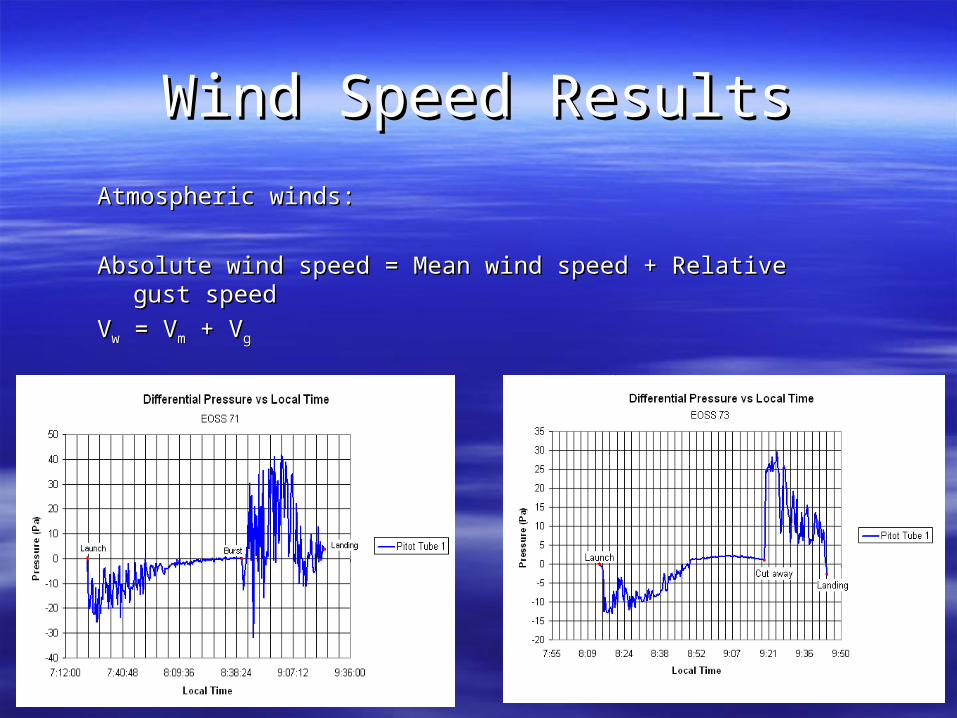
Wind Speed ResultsWind Speed Results
Atmospheric winds:Atmospheric winds:
Absolute wind speed = Mean wind speed + Relative gust speedAbsolute wind speed = Mean wind speed + Relative gust speed
VVww = V = Vmm + V + Vgg
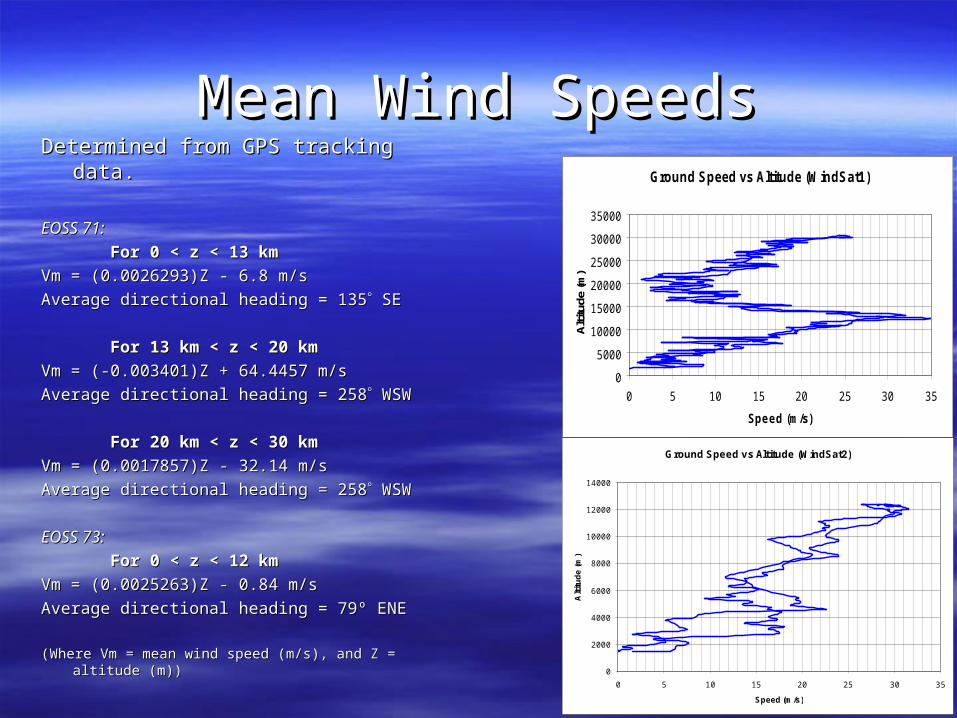
Mean Wind SpeedsMean Wind SpeedsDetermined from GPS tracking data.Determined from GPS tracking data.
EOSS 71:EOSS 71:
ForFor 0 < z < 13 km0 < z < 13 km
Vm = (0.0026293)Z - 6.8 m/s Vm = (0.0026293)Z - 6.8 m/s
Average directional heading = 135Average directional heading = 135 SE SE
ForFor 13 km < z < 20 km13 km < z < 20 km
Vm = (-0.003401)Z + 64.4457 m/s Vm = (-0.003401)Z + 64.4457 m/s
Average directional heading = 258Average directional heading = 258 WSW WSW
ForFor 20 km < z < 30 km 20 km < z < 30 km
Vm = (0.0017857)Z - 32.14 m/s Vm = (0.0017857)Z - 32.14 m/s
Average directional heading = 258Average directional heading = 258 WSW WSW
EOSS 73:EOSS 73:
For 0 < z < 12 kmFor 0 < z < 12 km
Vm = (0.0025263)Z - 0.84 m/s Vm = (0.0025263)Z - 0.84 m/s
Average directional heading = 79º ENEAverage directional heading = 79º ENE
(Where Vm = mean wind speed (m/s), and Z = altitude (m))(Where Vm = mean wind speed (m/s), and Z = altitude (m))
Ground Speed vs Altitude (WindSat1)
0
5000
10000
15000
20000
25000
30000
35000
0 5 10 15 20 25 30 35
Speed (m/s)
Alti
tude
(m)
Ground Speed vs Altitude (WindSat2)
0
2000
4000
6000
8000
10000
12000
14000
0 5 10 15 20 25 30 35
Speed (m/s)
Alt
itu
de
(m
)
Wind Gust SpeedsWind Gust Speeds
Relative Wind Gust Speed vs Altitude (WindSat2)
0
2000
4000
6000
8000
10000
12000
14000
0 5 10 15 20
Speed (m/s)
Alt
itu
de
(m
)
Primary PitotTube
Relative Wind Gust Speed vs Altitude (WindSat1)
0
2000
4000
6000
8000
10000
12000
14000
16000
18000
0 5 10 15 20
Speed (m/s)
Alt
itu
de
(m) Transducer 1
Transducer 2
Transducer 3
Transducer 4
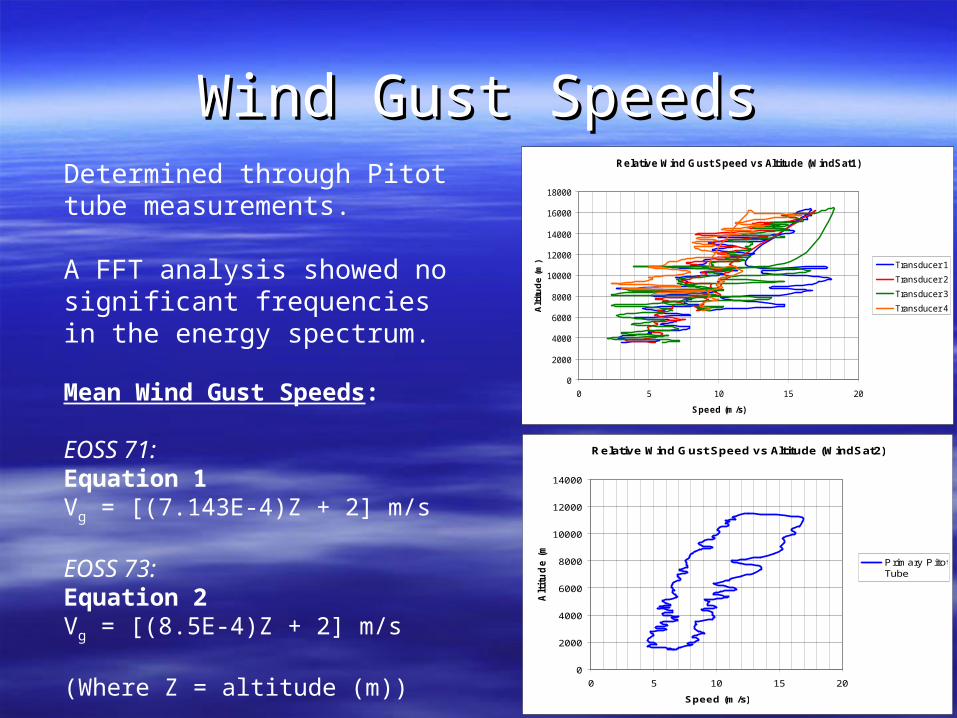
Determined through Pitot tube measurements.
A FFT analysis showed no significant frequencies in the energy spectrum.
Mean Wind Gust Speeds:
EOSS 71:Equation 1Vg = [(7.143E-4)Z + 2] m/s
EOSS 73:Equation 2Vg = [(8.5E-4)Z + 2] m/s
(Where Z = altitude (m))

ConclusionsConclusions
Mission goals were met.Mission goals were met. Need for planetary explorer pre-landing Need for planetary explorer pre-landing
probe.probe. Improvement of weather models.Improvement of weather models.

ReferencesReferences
NASA:NASA:
http://marsweb.jpl.nasa.gov/msp98/msss/mardi_hardware/history/huygens/index.htmlhttp://marsweb.jpl.nasa.gov/msp98/msss/mardi_hardware/history/huygens/index.html
http://marsweb.jpl.nasa.gov/msp98/lander/m9821.jpghttp://marsweb.jpl.nasa.gov/msp98/lander/m9821.jpg
National Oceanic and Atmospheric Administration (NOAA):National Oceanic and Atmospheric Administration (NOAA):
http://www.noaa.org/http://www.noaa.org/
http://http://www.npoess.noaa.gov/images/wind_speed.jpgwww.npoess.noaa.gov/images/wind_speed.jpg

Questions ?Questions ?


![Analysis of offshore turbulence intensity comparison with … · [4] S. Emeis, ”Wind Energy Meteorology. Atmospheric Physics for Wind Power Generation”, Springer, 2012 Atmospheric](https://img.pdfslide.net/doc/110x75/5edaeee309ac2c67fa688a79/analysis-of-offshore-turbulence-intensity-comparison-with-4-s-emeis-awind.jpg)