Embed Size (px)
Citation preview
Atomic and Nuclear Physics X-ray physics Compton effect and X-ray physics
LD
Physics
Leaflets
P6.3.7.2
1
0415
-Iv
/Sel
Objects of the experiment
Recording the energy spectra of X-rays scattered on a scattering body under various angles.
Determining the energy of the scattered photons as a function of the scattering angle.
Comparing the measured energies with the energies calculated from energy and momentum conservation.
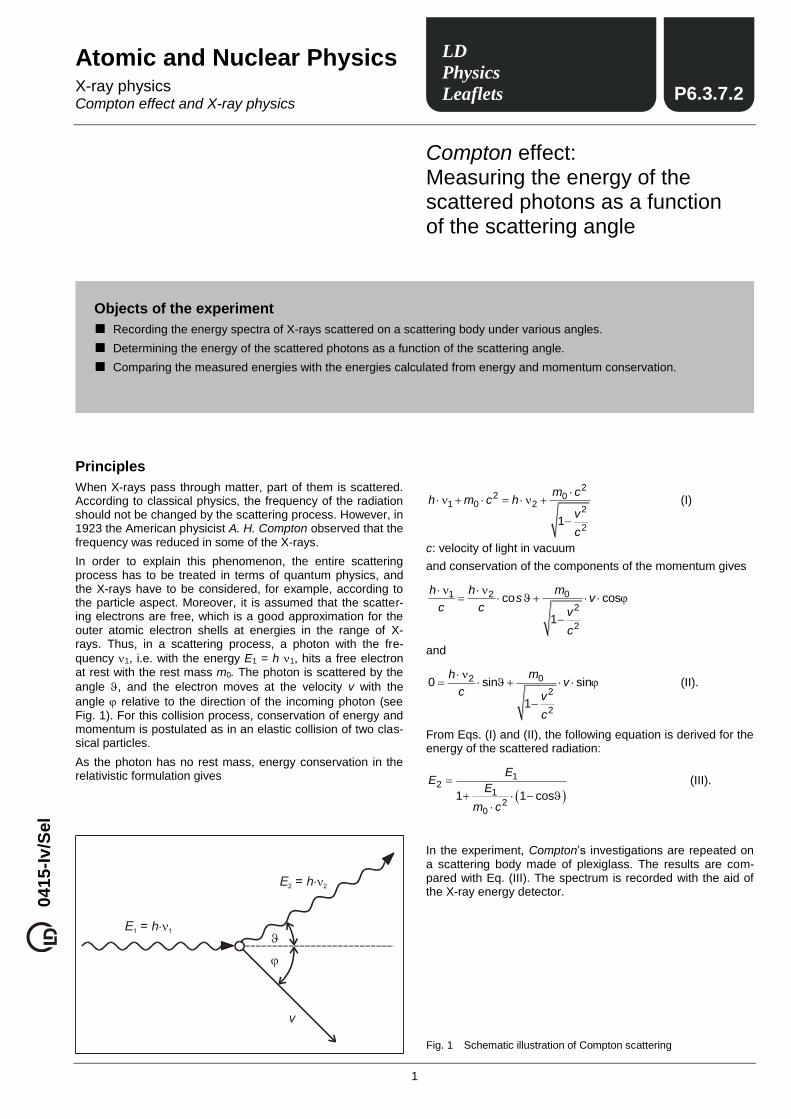
Fig. 1 Schematic illustration of Compton scattering
Compton effect: Measuring the energy of the scattered photons as a function of the scattering angle
Principles
When X-rays pass through matter, part of them is scattered. According to classical physics, the frequency of the radiation should not be changed by the scattering process. However, in 1923 the American physicist A. H. Compton observed that the frequency was reduced in some of the X-rays.
In order to explain this phenomenon, the entire scattering process has to be treated in terms of quantum physics, and the X-rays have to be considered, for example, according to the particle aspect. Moreover, it is assumed that the scatter-ing electrons are free, which is a good approximation for the outer atomic electron shells at energies in the range of X-rays. Thus, in a scattering process, a photon with the fre-
quency 1, i.e. with the energy E1 = h 1, hits a free electron at rest with the rest mass m0. The photon is scattered by the
angle , and the electron moves at the velocity v with the
angle relative to the direction of the incoming photon (see Fig. 1). For this collision process, conservation of energy and momentum is postulated as in an elastic collision of two clas-sical particles.
As the photon has no rest mass, energy conservation in the relativistic formulation gives
22 0
1 0 22
21
m ch m c h
v
c
(I)
c: velocity of light in vacuum
and conservation of the components of the momentum gives
01 2
2
2
co cos
1
mh hs v
c c v
c
and
02
2
2
0 sin sin
1
mhv
c v
c
(II).
From Eqs. (I) and (II), the following equation is derived for the energy of the scattered radiation:
12
12
0
1 1 cos
EE
E
m c
(III).
In the experiment, Compton’s investigations are repeated on a scattering body made of plexiglass. The results are com-pared with Eq. (III). The spectrum is recorded with the aid of the X-ray energy detector.

P6.3.7.2 LD Physics Leaflets
2
Apparatus
1 X-ray apparatus with X-ray tube Mo and goniometer 554 811
1 Compton accessory Xray II 554 837
1 X-ray energy detector 559 938
1 Sensor-CASSY 524 010 1 MCA box 524 058 1 CASSY Lab 524 200
1 BNC cable, 1 m 501 02
1 PC with Windows 98/NT or higher version
The X-ray apparatus fulfils all regulations on the design of an X-ray apparatus and fully protected device for instruc-tional use and is type approved for school use in Germany (NW 807 / 97 Rö).
The built-in protective and shielding fixtures reduce the dose rate outside the X-ray apparatus to less than
1 Sv/h, which is of the order of magnitude of the natural background radiation.
Before putting the X-ray apparatus into operation, inspect it for damage and check whether the high volt-age is switched off when the sliding doors are opened (see instruction sheet of the X-ray apparatus).
Protect the X-ray apparatus against access by unau-thorized persons.
Avoid overheating of the X-ray tube.
When switching the X-ray apparatus on, check whether the ventilator in the tube chamber starts rotating.
The goniometer is positioned solely by means of electric stepper motors.
Do not block the target arm and sensor arm and do not use force to move them.
Fig. 2 Experimental setup for measuring the primary beam (above) and for measuring the energy of the scattered photons as a function of the scattering angle (below) Zr filter (a), circular collimator (b), attenuating aperture (c), X-ray energy detector (d), scattering body (e)
Setup
The experimental setup is illustrated in Fig. 2.
– Put the Zr filter (from the scope of delivery of the X-ray apparatus) onto the beam entrance side of the circular collimator (from the scope of delivery of the Compton ac-cessory Xray II).
– Mount the circular collimator in the collimator mount of the X-ray apparatus.
– Guide the connection cable of the table power supply
through the empty duct of the X-ray apparatus, and con-nect it to the Mini-DIN socket of the X-ray energy detector.
– Fasten the assembly of the X-ray energy detector and the sensor holder in the sensor arm of the goniometer.
– Use the BNC cable supplied with the X-ray energy detec-tor to connect the signal output of the detector to the BNC socket SIGNAL IN of the X-ray apparatus.
– Push a sufficient length of the connection cable into the duct so that the sensor arm can perform a complete rota-tion.
– Press the SENSOR key and, using the ADJUST knob, adjust a sensor angle of 150° manually. If necessary, push the goniometer to the right.
– Adjust the distance between the X-ray energy detector and the axis of rotation so that the detector housing just does not cover the X-ray beam at this sensor angle.
– Then push the goniometer to the left so that the detector housing just does not touch the circular collimator (approx. 8 cm distance between the circular collimator and the axis of rotation).
– Connect the Sensor-CASSY to the computer, and plug in
the MCA box.
– Use a BNC cable to connect the output SIGNAL OUT on the terminal panel of the X-ray apparatus to the MCA box.
Carrying out the experiment
– Connect the table power supply to the mains (after approx. 2 minutes the LED shines green and the X-ray energy detector is ready for operation).
– Call CASSY Lab, and select the measuring parameters “Multichannel Measurement, 256 Channels, Negative Pulses, Gain -3, Measuring Time 300 s”.
LD Physics Leaflets P6.3.7.2
3
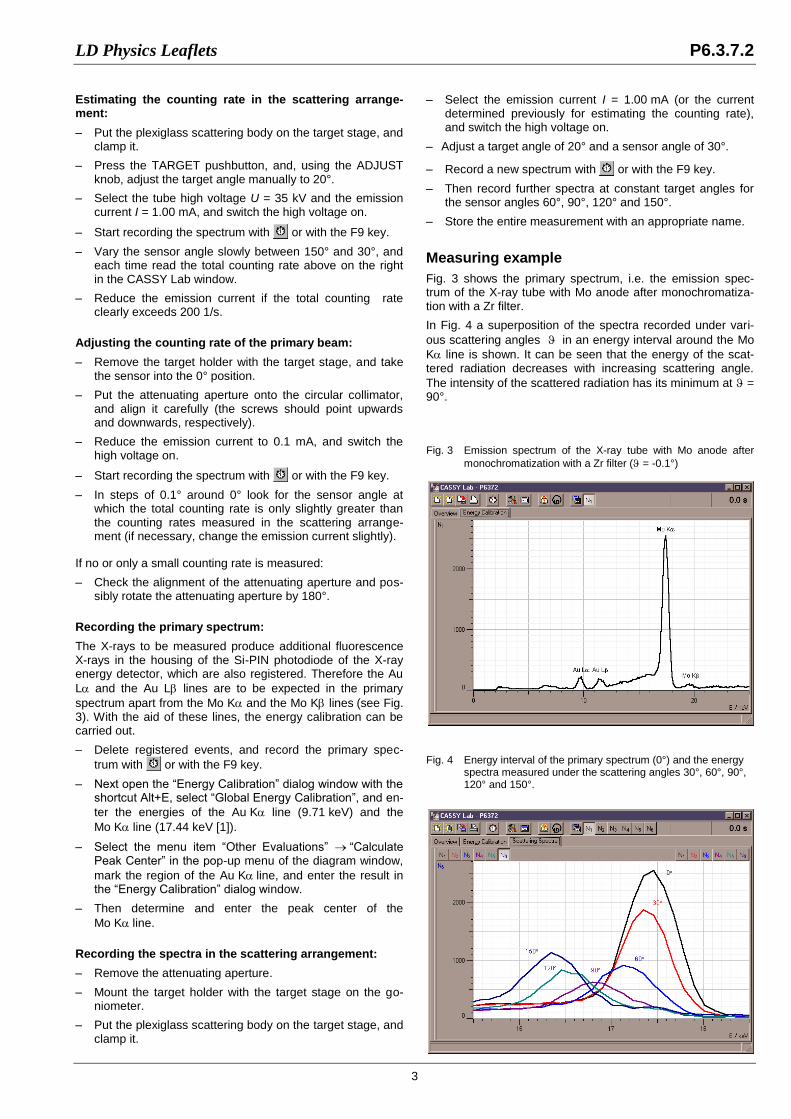
Fig. 3 Emission spectrum of the X-ray tube with Mo anode after
monochromatization with a Zr filter ( = -0.1°)
Fig. 4 Energy interval of the primary spectrum (0°) and the energy spectra measured under the scattering angles 30°, 60°, 90°, 120° and 150°.
Estimating the counting rate in the scattering arrange-ment:
– Put the plexiglass scattering body on the target stage, and clamp it.
– Press the TARGET pushbutton, and, using the ADJUST knob, adjust the target angle manually to 20°.
– Select the tube high voltage U = 35 kV and the emission current I = 1.00 mA, and switch the high voltage on.
– Start recording the spectrum with or with the F9 key.
– Vary the sensor angle slowly between 150° and 30°, and each time read the total counting rate above on the right in the CASSY Lab window.
– Reduce the emission current if the total counting rate clearly exceeds 200 1/s.
Adjusting the counting rate of the primary beam:
– Remove the target holder with the target stage, and take the sensor into the 0° position.
– Put the attenuating aperture onto the circular collimator, and align it carefully (the screws should point upwards and downwards, respectively).
– Reduce the emission current to 0.1 mA, and switch the high voltage on.
– Start recording the spectrum with or with the F9 key.
– In steps of 0.1° around 0° look for the sensor angle at which the total counting rate is only slightly greater than the counting rates measured in the scattering arrange-ment (if necessary, change the emission current slightly).
If no or only a small counting rate is measured:
– Check the alignment of the attenuating aperture and pos-sibly rotate the attenuating aperture by 180°.
Recording the primary spectrum:
The X-rays to be measured produce additional fluorescence X-rays in the housing of the Si-PIN photodiode of the X-ray energy detector, which are also registered. Therefore the Au
L and the Au L lines are to be expected in the primary
spectrum apart from the Mo K and the Mo K lines(see Fig. 3). With the aid of these lines, the energy calibration can be carried out.
– Delete registered events, and record the primary spec-
trum with or with the F9 key.
– Next open the “Energy Calibration” dialog window with the shortcut Alt+E, select “Global Energy Calibration”, and en-
ter the energies of the Au K line (9.71 keV) and the
Mo K line (17.44 keV [1]).
– Select the menu item “Other Evaluations” “Calculate Peak Center” in the pop-up menu of the diagram window,
mark the region of the Au Kline, and enter the result in the “Energy Calibration” dialog window.
– Then determine and enter the peak center of the
Mo Kline.
Recording the spectra in the scattering arrangement:
– Remove the attenuating aperture.
– Mount the target holder with the target stage on the go-niometer.
– Put the plexiglass scattering body on the target stage, and clamp it.
– Select the emission current I = 1.00 mA (or the current determined previously for estimating the counting rate), and switch the high voltage on.
– Adjust a target angle of 20° and a sensor angle of 30°.
– Record a new spectrum with or with the F9 key.
– Then record further spectra at constant target angles for the sensor angles 60°, 90°, 120° and 150°.
– Store the entire measurement with an appropriate name.
Measuring example
Fig. 3 shows the primary spectrum, i.e. the emission spec-trum of the X-ray tube with Mo anode after monochromatiza-tion with a Zr filter.
In Fig. 4 a superposition of the spectra recorded under vari-
ous scattering angles in an energy interval around the Mo
K line is shown. It can be seen that the energy of the scat-tered radiation decreases with increasing scattering angle.
The intensity of the scattered radiation has its minimum at = 90°.

P6.3.7.2 LD Physics Leaflets
4
Fig. 5e Shifted Mo K line from the spectrum N5 (120°) and unshifted line from N1.
Fig. 5c Shifted Mo K line from the spectrum N3 (60°) and unshifted line from N1.
Fig. 5a Section of the spectrum N1 (0°, primary spectrum)
with the unshifted Mo K line
Evaluation
Fig. 5f Shifted Mo K line from the spectrum N6 (150°) and unshifted line from N1.
Fig. 5d Shifted Mo K line from the spectrum N4 (90°) and unshifted line from N1.
Fig. 5b Shifted Mo K line from the spectrum N2 (30°) and unshifted line from N1.

LD Physics Leaflets P6.3.7.2
LD Didactic GmbH Leyboldstrasse 1 D-50354 Huerth / Germany Phone: (02233) 604-0 Fax: (02233) 604-222 e-mail: [email protected] by LD Didactic GmbH Printed in the Federal Republic of Germany Technical alterations reserved
Fig. 6 Energy E2 determined from the measured energy spectra as
a function of the scattering angle and curve calculated ac-cording to Eq. (III) .
Preparation for further evaluation in CASSY Lab:
– Create the new quantity “Scattering Angle” (as parameter, symbol: &J, unit: °, from: 0, to: 180, decimal places: 0).
– Create the new quantity “Energy” (as parameter, symbol: E_2, unit: keV, from: 0, to: 20, decimal places: 2).
– Create the new display “Evaluation” with the scattering angle as x-axis and the energy as y-axis.
Determining the energy as a function of the scattering angle:
– Select an energy spectrum and a suitable interval.
– Call the menu item “Other Evaluations” “Calculate Peak Center” in the pop-up menu of the diagram window, and mark the region of the energy-shifted peak (starting from
= 90° the energy resolution of the detector is sufficient to separate the unshifted and the shifted peaks, see Fig. 5d to 5f).
– Enter the peak center obtained and the associated scat-tering angle in the table of the display “Evaluation” (see Fig. 6).
Comparison of the measured energies with the energies calculated from energy and momentum conservation:
– Select the display “Evaluation”, and open the “Free Fit” dialog window with the shortcut Alt+F.
– Enter f(x,A,B,C,D) = 17.44/(1+17.44*(1-cos(x))/A) and the initial value for A: 511 (constant).
– Click on “Continue with marking a range”, and mark the data points in the diagram.
The result is a theoretical curve calculated according to Eq. (III) with the parameters E1 = 17.44 keV and m c
2 = 511 keV,
which is in good agreement with the measured values (see Fig. 6).
Results
When X-rays pass through matter, part of them is scattered and experiences an energy shift (Compton effect).
The energy shift can be calculated by describing the scatter-ing process as a collision between an X-ray photon and a free electron at rest and by postulating the conservation of energy and momentum in this process.
Supplementary information
Alternatively, the comparison between measurement and theory can be carried out as a free fit with the free fit parame-ter A (the “rest mass” of the collision partner of the X-ray photon).
As a result a value for the parameter A is obtained, which agrees with the “rest mass” of an electron (m c
2 = 511 keV) to
a good approximation.
Literature
[1] weighted mean value from C. M. Lederer and V. S. Shirley, Table of Isotopes, 7th Edition, 1978, John Wiley & Sons, Inc., New York, USA.