Embed Size (px)
Citation preview
ATOMIC DATA AND NUCLEAR DATA TABLES 17, 177-210 (1976)
TRANSPORT PROPERTIES OF GASEOUS IONS OVER A WIDE ENERGY RANGE*
H. W. ELLIS, R. Y. PAI, and E. W. MCDANIEL
School of Physics, Georgia Institute of Technology Atlanta, Georgia 30332
and
E. A. MASON and L. A. VIEHLAND
Brown University Providence. Rhode Island 029 12
A compil.ation of experimental data is presented for the mobilities of mass-identified ions in neutral gases at room temperature as a function of the ionic energy parameter E/N, the ratio of electric field strength to neutral gas number density. The literature has been covered to February 1976. In addition, a recently developed theory of gaseous ion mobility is used to compute, for each ion-gas combination, the zero-field reduced mobility as a function of the common ion-gas temperature. Finally, it is shown how the tabulated data can be used to estimate the ionic diffusion coefficients and to obtain information about the ion-neutral interaction potential.
* Research sup,ported by the U.S. Office of Naval Research, the National Science Foundation, and the U.S. Army Research Office (Grant numbers DAHC04-74-G-0192, Project number P-12134-P, and DAHC04-75-G-0116, Project number P-12761-C)
Copyright 0 1976 by Academic Press, Inc. All rights of reproduction in any form reserved.
177 atomic hta and Nuclear Data T&k, '40, 17, No. 3, March 1976
ELLIS, PAI. MCDANIEL, MASON, and VIEHLAND Transport Properties of Gaseous Ions
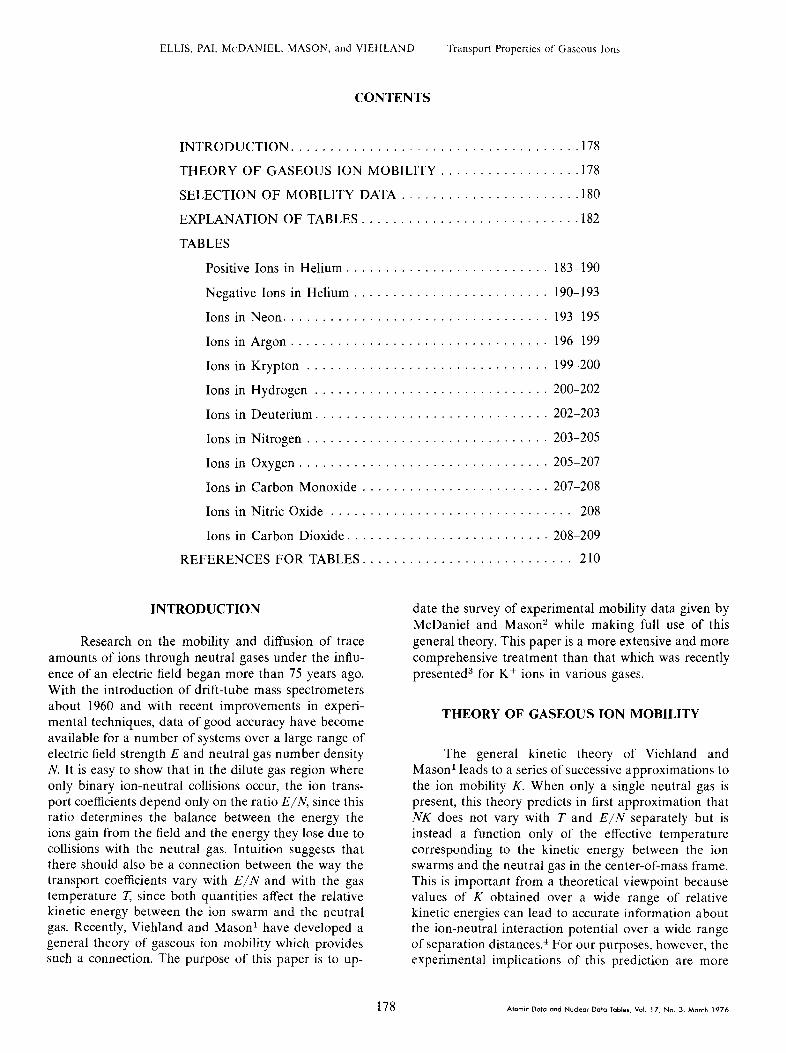
CONTENTS
INTRODUCTION. ..................
THEORY OF GASEOUS ION MOBILITY
SELECTION OF MOBILITY DATA .....
EXPLANATION OF TABLES. .........
TABLES
Positive Ions in Helium ............
Negative Ions in Helium ...........
Ions in Neon. ...................
Ions in Argon ...................
Ions in Krypton .................
Ions in Hydrogen ................
Ions in Deuterium. ...............
Ions in Nitrogen .................
Ions in Oxygen ..................
Ions in Carbon Monoxide ..........
Ions in Nitric Oxide ..............
Ions in Carbon Dioxide. ...........
REFERENCES FOR TABLES. .........
INTRODUCTION
Research on the mobility and diffusion of trace amounts of ions through neutral gases under the influ- ence of an electric field began more than 75 years ago. With the introduction of drift-tube mass spectrometers about 1960 and with recent improvements in experi- mental techniques, data of good accuracy have become available for a number of systems over a large range of electric field strength E and neutral gas number density N. It is easy to show that in the dilute gas region where only binary ion-neutral collisions occur, the ion trans- port coefficients depend only on the ratio E/N, since this ratio determines the balance between the energy the ions gain from the field and the energy they lose due to collisions with the neutral gas. Intuition suggests that there should also be a connection between the way the transport coefficients vary with E/N and with the gas temperature T since both quantities affect the relative kinetic energy between the ion swarm and the neutral gas. Recently, Viehland and Mason1 have developed a general theory of gaseous ion mobility which provides such a connection. The purpose of this paper is to up-
. .
.
. .
. . . . .
. . . .
. . . .
. . .
. . . . .
...... 178
...... 178
...... 180
...... 182
. 1833190
190-193
. 193-195
. 196-199
. . 199-200
. 200-202
202-203
. 203-205
. 205-207
. . 207-208
. . . 208
208-209
. . . 210
date the survey of experimental mobility data given by McDaniel and Mason2 while making full use of this general theory. This paper is a more extensive and more comprehensive treatment than that which was recently presented3 for K+ ions in various gases.
THEORY OF GASEOUS ION MOBILITY
The general kinetic theory of Viehland and Mason’ leads to a series of successive approximations to the ion mobility K. When only a single neutral gas is present, this theory predicts in first approximation that NK does not vary with T and E/N separately but is instead a function only of the effective temperature corresponding to the kinetic energy between the ion swarms and the neutral gas in the center-of-mass frame. This is important from a theoretical viewpoint because values of K obtained over a wide range of relative kinetic energies can lead to accurate information about the ion-neutral interaction potential over a wide range of separation distances.4 For our purposes, however, the experimental implications of this prediction are more
178 Atomic Data and Nucleor Data Tabler, Vol. 17, No. 3, March 1976

ELLIS, PAI, MCDANIEL, MASON, and VIEHLAND Transport Properties of Gaseous Ions
important; it greatly simplifies the presentation and correlation of experimental results.
In first approximation the effective temperature upon which K depends is given by Eq. (1) with p = 0
+kT,, = +kT + +M(LJ~)~(~ + ,8). (1)
Here k is Boltzmann’s constant, M is the mass of the neutral molecules, and the quantity
vd = KE (2)
is the drift velocity, the terminal velocity that the ions attain as they are pulled l.hrough the neutral gas by the electrostatic field. It has been shown in Ref. 1 and veri- fied in this work that experimental mobility data do seem to trace a single curve when plotted against T,, as given by Eq. 1, despite the fact that such data were taken by a number of diflrerent groups at different com- binations of T and E/N. It seems well established there- fore that K is a function only of T,,,.
Although setting fl = 0 in Eq. 1 suffices for most purposes-and is used to obtain the tables to be pre- sented in this paper-a more accurate expression for ,8 is’
P= mM(5 - 2A*) dMK)
5(m” + w) + 4mMA* dln(E/N) (3)
where m is the ion mass. The quantity A* is a ratio of collision integrals1 which varies only slowly with T,,, and which depends only weakly upon the details of the ion-neutral interaction potential; for most purposes A* may be assumed to lie within the range 1.1-1.2, the high-field values corresponding to repulsive potentials ranging from V(r) a y-g to y-12. Finally, the logarith- mic derivative in Eq. 3 can be obtained from the relation
l+ dn(K) dn( E/N)
= [l -- 2(1 -&)-.$$l’- (4)
Since ,8 is a small correction factor, little error arises by evaluating dln(K)/dln(T?,,) from a plot of K versus the first approximation (/3 == 0) to T,,, as given by Eq. 1.
Mobility in Mixtures of Neutral Gases
The mobility of ions in a mixture of neutral gases can be related1,5-7 to the mobilities Ki measured in the pure neutral gasesi at l.he same E. N, and T as in the mixture. Thus
where Xi is the mole fraction of species j. When the second term is neglected, Eq. 5 reduces to the familiar expression known as Blanc’s law.2 Equations 5 and 6 have been shown8 to be in accord with experimental results.
Relation between Gaseous Ion Mobility and DlJTusion
A general theory of gaseous ion diffusion in elec- tric fields of arbitrary strength has not been developed, despite the considerable effort devoted to the subject. However, two ad hoc theories of moderate accuracys,10 are suggested for the case where only a single neutral gas is present. Both theories relate the gaseous ion- diffusion coefficients to the ion mobility by generalized Einstein relations of the form11-13
dlnK
dln(E/N) ’ I (7)
Here q is the ionic charge and DL and D, are the coeffi- cients describing diffusion parallel and perpendicular to the direction of the electrostatic field. Viehland and Mason9 suggest that TL and TT be determined by the equations
kT, =kT$ 5nz - (2m - M)A* Mui
5m + 3MA* I (1 - )/)2 ; t9)
kT,=kT+ (m+M)A* Mu%
5~2 + 3MA* (1 - y)2 ’ 1 (10)
i
0 v* < v&
y = Y,(U, - QIVd V’B < Vd < 2U0, (11)
Yx Vd 2 2v0,
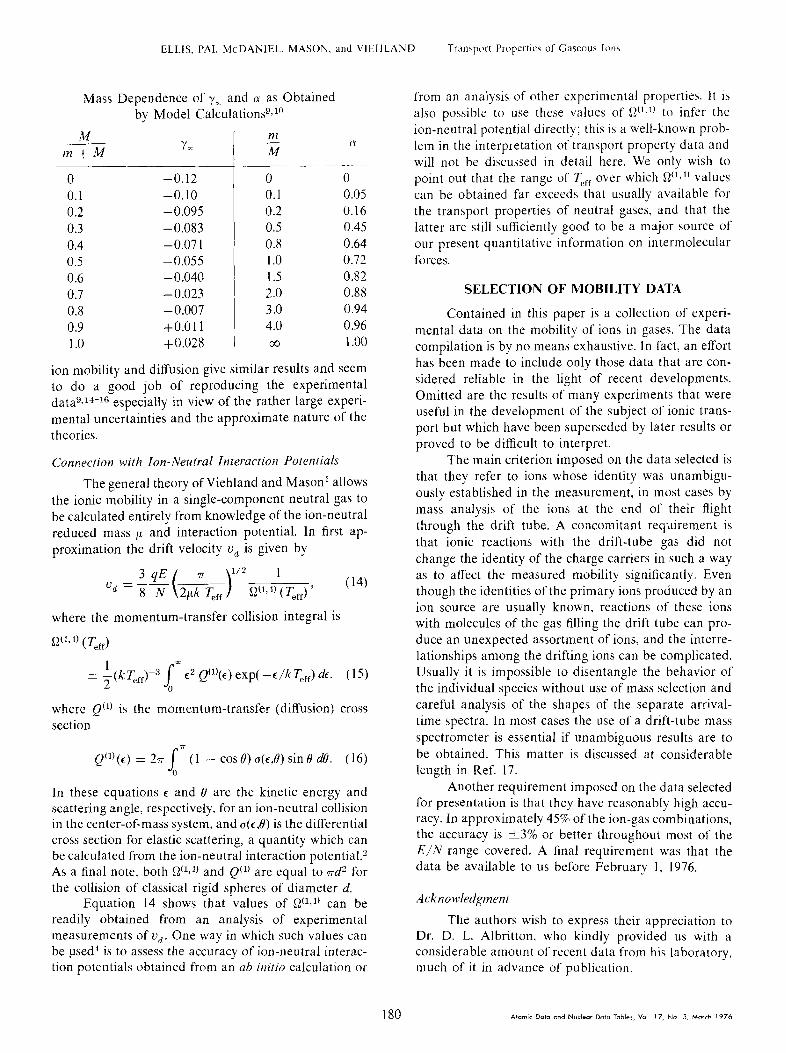
where vi is the value of the drift velocity at the point where the logarithmic derivative in Eq. 4 equals zero and where y, has the mass dependence shown in the following Table. On the other hand, SkullerudlO suggests that
kT- = kT+ 5m - (2m - M)A*
5m + 3MA* 1 x l+oc
L dlnK
dln(E/N) 1 Mu;; (12)
kT,=kT+ Cm + MM* 5m + 3MA* 1 MU;, (13)
where (Y depends on the mass ratio shown in the Table. These ad hoc theories of relation between gaseous
179
ELLIS, PAI. MCDANIEL. MASON, and VIEHLAND Tran\port Properties of Crase~~us Ion\
Mass Dependence of y, and LY as Obtained by Model CalculationsY,‘”
Ad Wl (Y
m+M Y, z
0 -0.12 0 0 0.1 -0.10 0.1 0.05 0.2 -0.095 0.2 0.16 0.3 -0.083 0.5 0.45 0.4 -0.07 I 0.8 0.64 0.5 -0.055 1.0 0.72 0.6 -0.040 I .5 0.82 0.7 -0.023 2.0 0.88 0.8 - 0.007 3.0 0.94 0.9 +O.Oll 4.0 0.96 1 .o +0.028 co 1 .oo
ion mobility and diffusion give similar results and seem to do a good job of reproducing the experimental data”T14-16 especially in view of the rather large experi- mental uncertainties and the approximate nature of the theories.
Connection with Ion-Neutral Interaction Potentials
The general theory of Viehland and Mason’ allows the ionic mobility in a single-component neutral gas to be calculated entirely from knowledge of the ion-neutral reduced mass p and interaction potential. In first ap- proximation the drift velocity vd is given by
where the momentum-transfer collision integral is
w, l) (T,,,)
= ;(kTp Jrn c2 Q(l)(c) exp( -c/kT,,,) de, (15) 0
where Q(l) is the momentum-transfer (diffusion) cross section
Q”‘(C) = 2a JT (1 - cos 0) a(r,B) sin 6’ dt3. (16) 0
In these equations c and 8 are the kinetic energy and scattering angle, respectively, for an ion-neutral collision in the center-of-mass system, and a(r,8) is the differential cross section for elastic scattering, a quantity which can be calculated from the ion-neutral interaction potential.” As a final note, both Q”yl) and Q(l) are equal to ad2 for the collision of classical rigid spheres of diameter d.
Equation 14 shows that values of Goal) can be readily obtained from an analysis of experimental measurements of vd. One way in which such values can be used” is to assess the accuracy of ion-neutral interac- tion potentials obtained from an ab itlitio calculation or
180
from an analysis of other experimental properties. It is also possible to use these values of St”,” to infer the ion-neutral potential directly: this is a well-known prob- lem in the interpretation of transport property data and will not be discussed in detail here. We only wish to point out that the range of T,,, over which Q2”q1’ values can be obtained far exceeds that usually available for the transport properties of neutral gases, and that the latter are still sufficiently good to be a major source of our present quantitative information on intermolecular forces.
SELECTION OF MOBILITY DATA
Contained in this paper is a collection of experi- mental data on the mobility of ions in gases. The data compilation is by no means exhaustive. In fact, an effort has been made to include only those data that are con- sidered reliable in the light of recent developments. Omitted are the results of many experiments that were useful in the development of the subject of ionic trans- port but which have been superseded by later results or proved to be difficult to interpret.
The main criterion imposed on the data selected is that they refer to ions whose identity was unambigu- ously established in the measurement, in most cases by mass analysis of the ions at the end of their flight through the drift tube. A concomitant requirement is that ionic reactions with the drift-tube gas did not change the identity of the charge carriers in such a way as to affect the measured mobility significantly. Even though the identities of the primary ions produced by an ion source are usually known, reactions of these ions with molecules of the gas filling the drift tube can pro- duce an unexpected assortment of ions, and the interre- lationships among the drifting ions can be complicated. Usually it is impossible to disentangle the behavior of the individual species without use of mass selection and careful analysis of the shapes of the separate arrival- time spectra. In most cases the use of a drift-tube mass spectrometer is essential if unambiguous results are to be obtained. This matter is discussed at considerable length in Ref. 17.
Another requirement imposed on the data selected for presentation is that they have reasonably high accu- racy. In approximately 45% of the ion-gas combinations, the accuracy is i3% or better throughout most of the E/N range covered. A final requirement was that the data be available to us before February 1, 1976.
Acknowledgment
The authors wish to express their appreciation to Dr. D. L. Albritton. who kindly provided us with a considerable amount of recent data from his laboratory, much of it in advance of publication.

ELLIS. PAL MCDANIEL, MASON. and VIEHLAND Transport Properties of Gaseous Ions
References for Introduction 9. L. A. Viehland and E. A. Mason, J. Chem. Phys. 63, 2913 (1975) 1.
2.
3.
4.
5.
6.
7.
8.
L. A. Viehland and E. A. Mason, Ann. Phys. (N.Y.) 91, 499 (1975)
E. W. McDaniel and E. A. Mason, The Mobi1it.y and Di$ksion of Ions in Gases (Wiley, New York, 1973)
E. A. Mason et al., Phys. Fluids 18, 1070 (1975)
W. F. Morrison et al., J. Chem. Phys. 63,2238 (1975)
J. H. Whealton and E. A. Mason, Phys. Rev. A 6, 1939 (1972)
10.
11.
12.
13.
14.
15. J. H. Whealton, E. A. Mason, and R. E. Robson, Phys. Rev. A 9, 1017 ( 1974)
J. H. Whealton and E. A. Mason, Ann. Phys. (N.Y.) 84, 8 (1974)
H. B. Milloy and R. E. Robson, J. Phys. B 6, 1139 (1973)
16.
17.
181 atomic ch+a and Nucleor Data Tables, Vol. 17. No. 3, March 1976
H. R. Skullerud, to be published
G. H. Wannier, Bell Syst. Tech. J. 32, 170 (1953). See also Phys. Rev. 83, 281 (1951): 87, 795 (1952)
R. E. Robson, Aust. J. Phys. 25, 685 (1972)
G. H. Wannier, Aust. J. Phys. 26, 897 (1973)
R. Y. Pai et al., J. Chem. Phys. 63, 2916 (1975)
R. Y. Pai et al., Phys. Rev. A 12, 1781 (1975)
R. Y. Pai, H. W. Ellis, and E. W. McDaniel, to be published as a note in J. Chem. Phys.. Vol. 64 (1976)
E. W. McDaniel and E. A. Mason, The Mobi1it.y and Diffusion of Ions in Gases (Wiley, New York, 19731, Section 2- 1

ELLIS, PAI. MCDANIEL, MASON. and VIEHLAND Transport Properties of Gaseous Ions
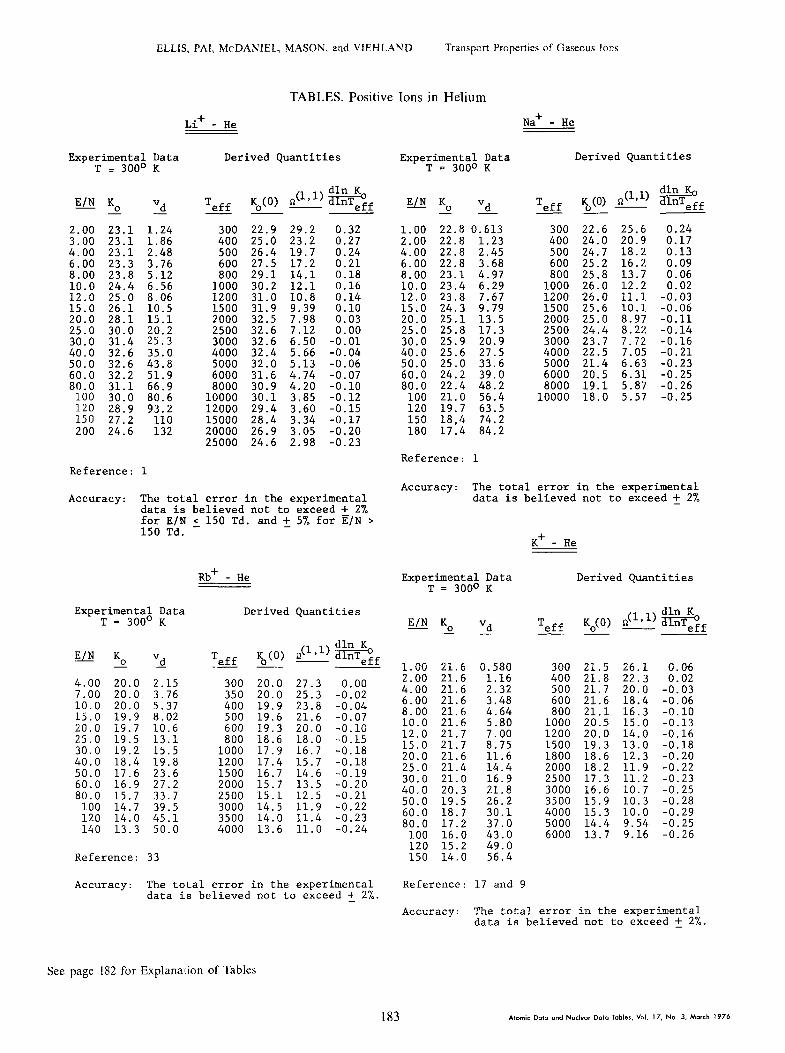
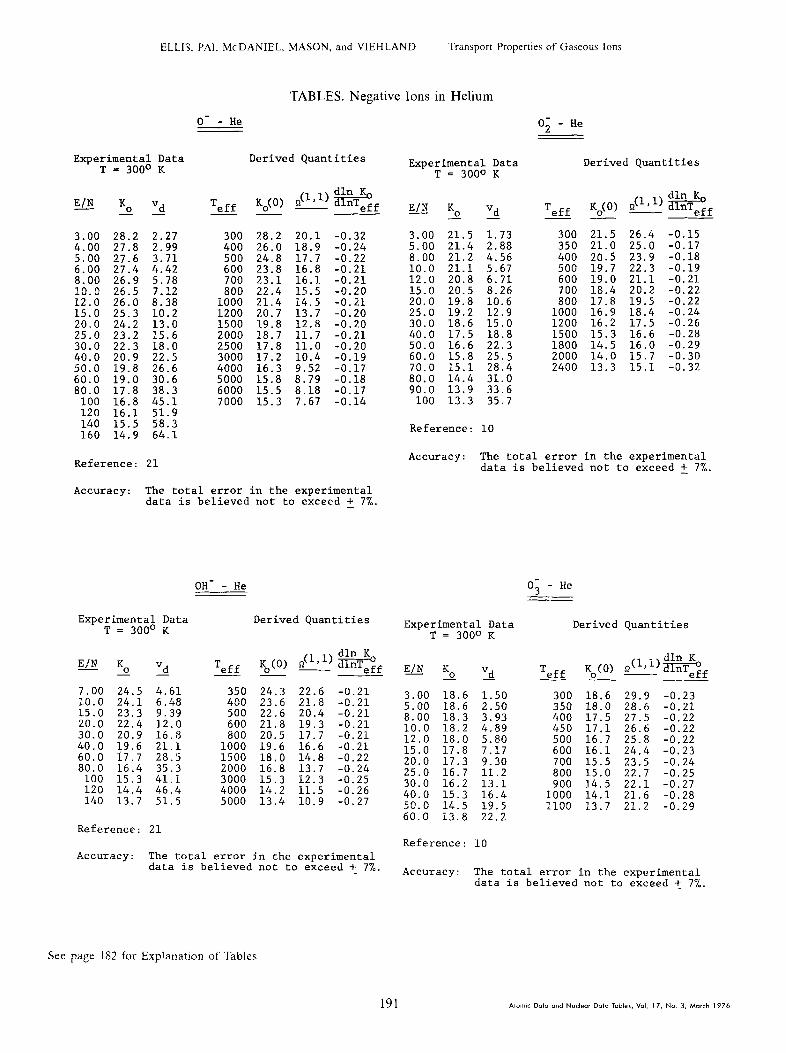
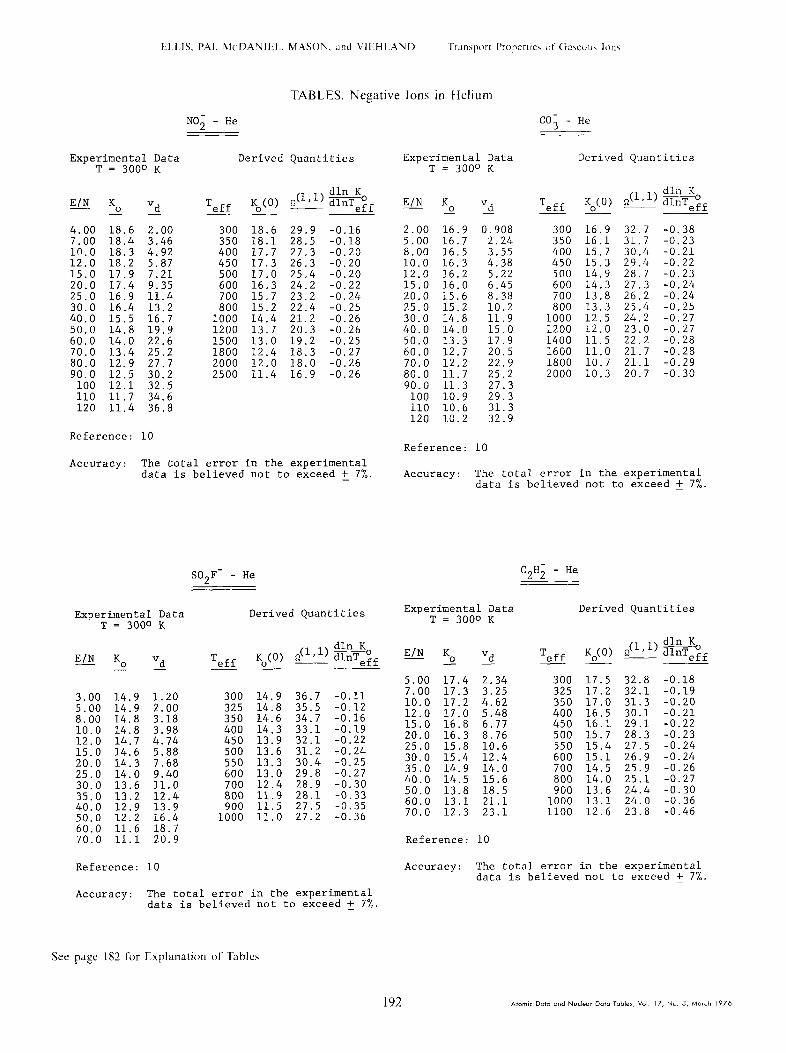
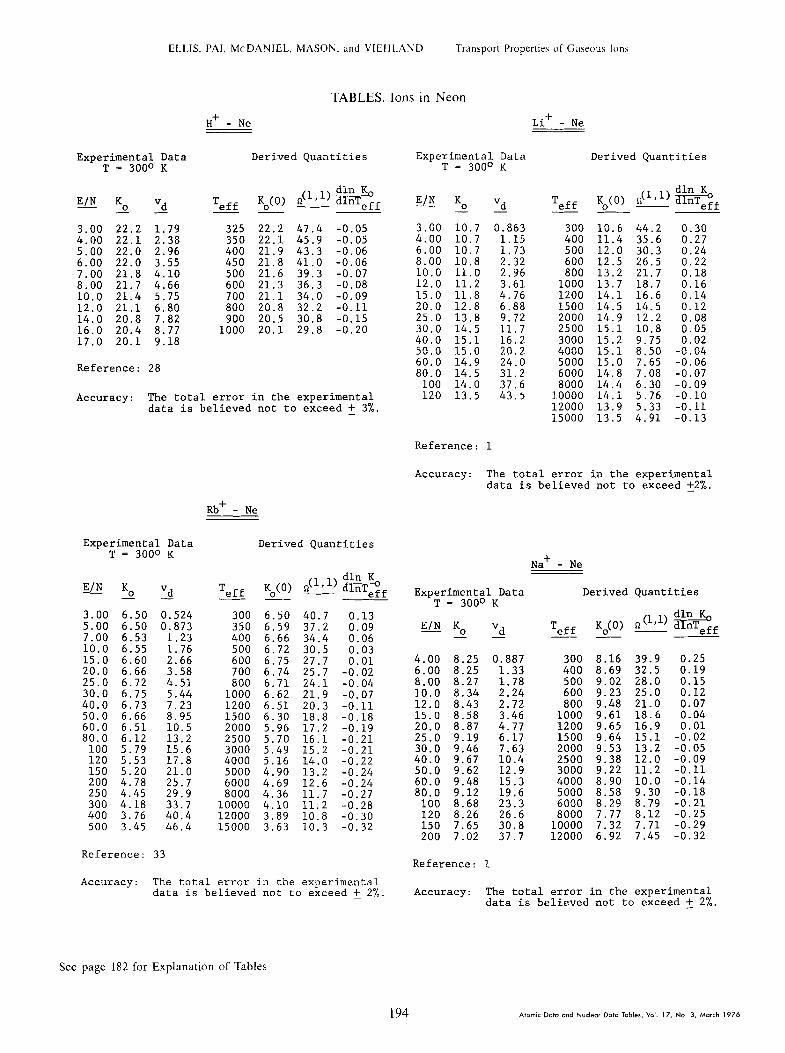
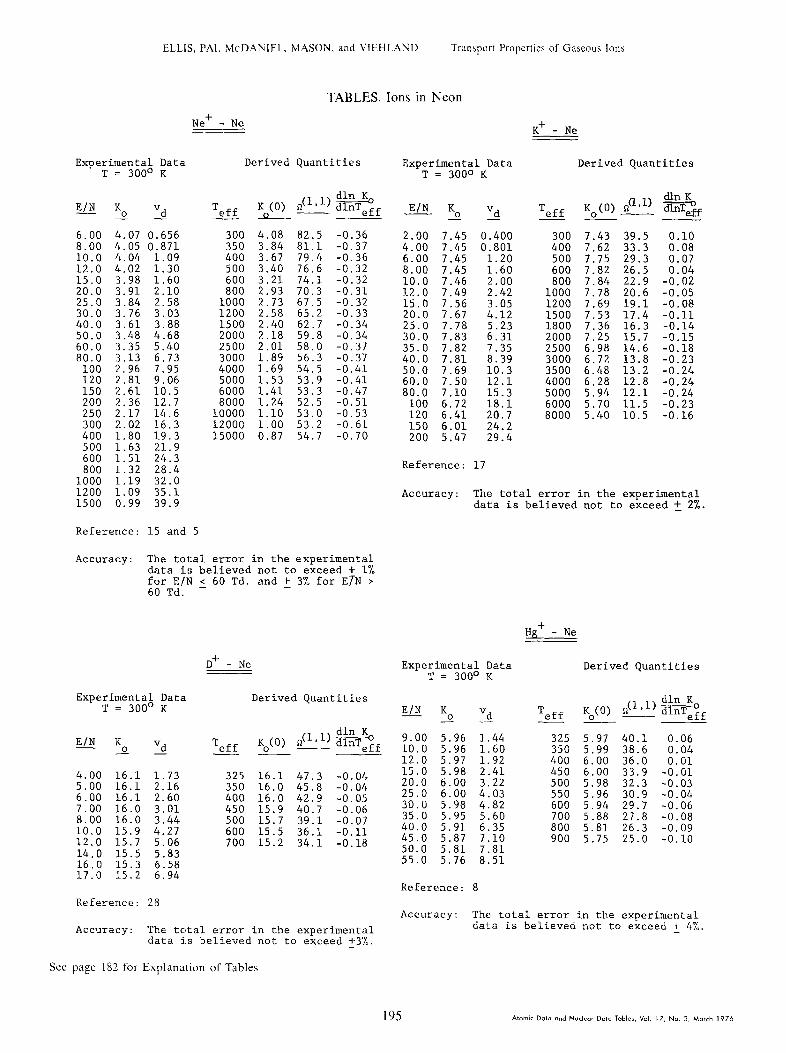
EXPLANATION OF TABLES
E/N The ratio of electric field strength to the neutral-gas number density. The unit employed is the Townsend (Td), 1 Td = 1 O-l7 V-cm’
“d
KLl
The ionic drift velocity in the neutral gas, in units of 10” cm/set
The reduced mobility of the ions in the neutral gas, in units of cm2/V-sec. The reduced mobility is related to the mobility K = v,/E by
K, = K(P/760)(273.16,'T) = NK/(2.69 x 10lg),
where P and Tare the neutral gas pressure and temperature in torr and “K, respectively
T eff
K,(O)
The effective ion-gas temperature in “K obtained from Eq. (1) with p = 0
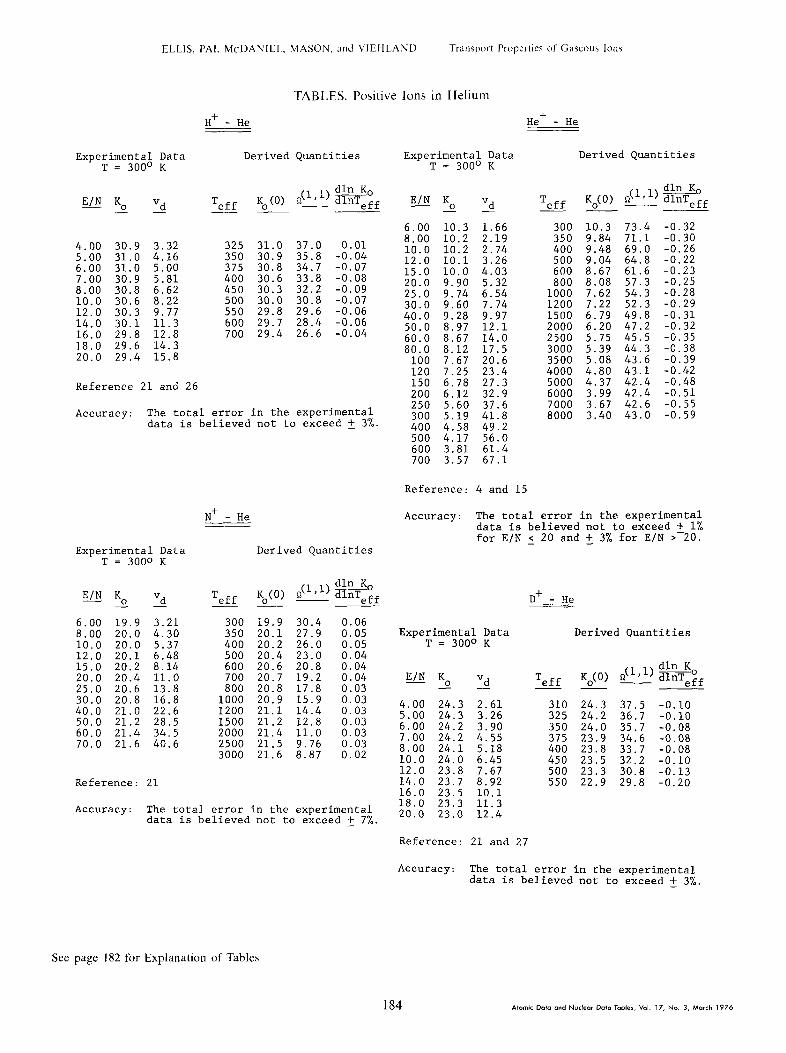
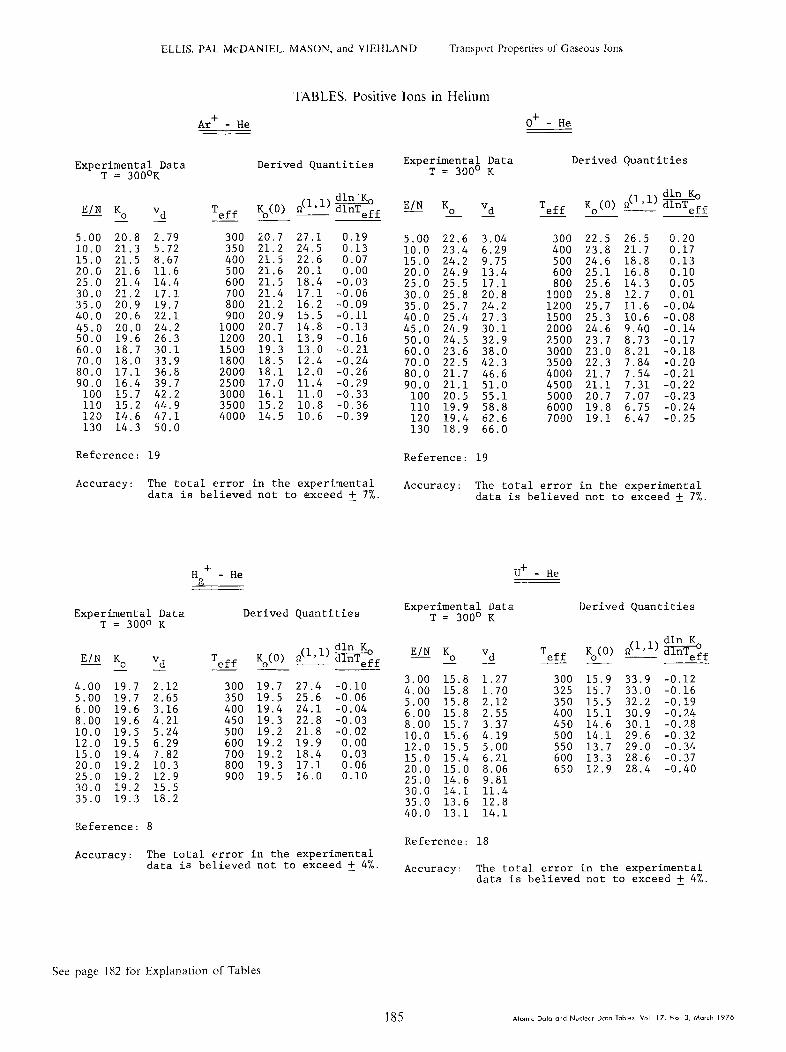
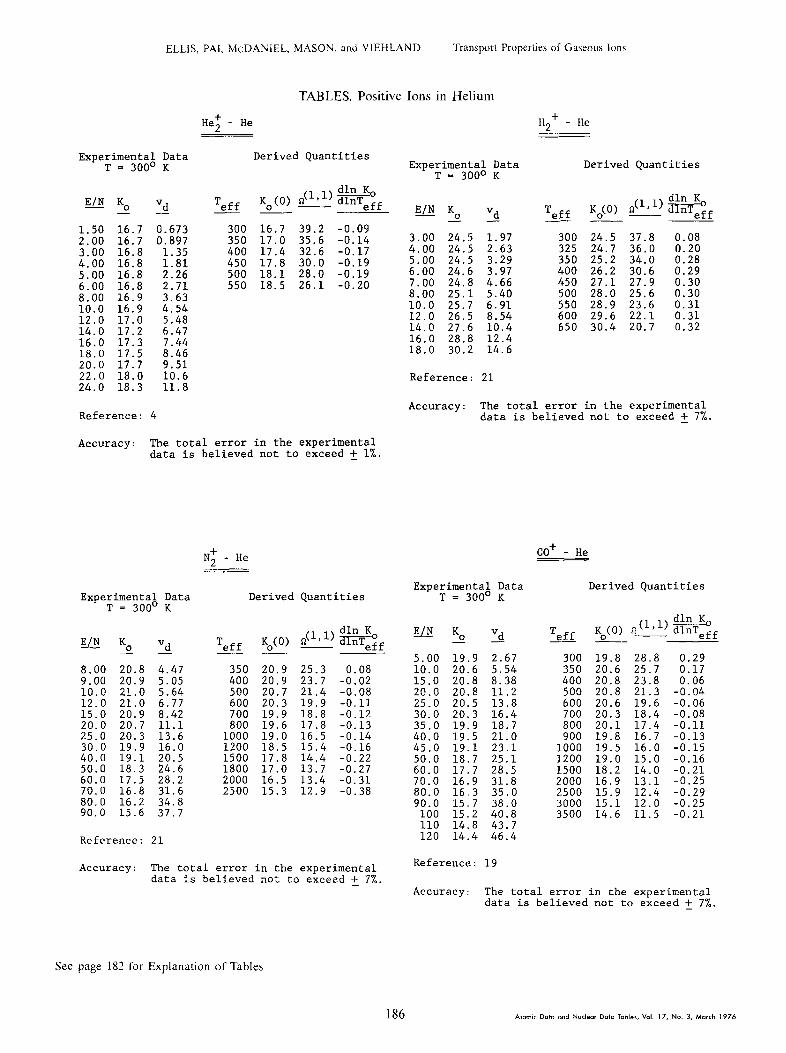
The reduced ionic mobility as a function of T,,,, in the limit of vanishing electric field strength (E/N -+ 0). The units are cm’/V-sec. The tabulated numbers have been read from a smootn curve drawn through experimental mobility values plotted as a function of the (calculated) effective temperature
Q2(1,1) The momentum-transfer collision integral in square angstroms ( IO-i6 cm2) as obtained from ud measurements and Eq. (14)
Structure of Tables
Each table is divided into two independent parts. The first three columns on the left present the measured drift velocities and mobilities of the ions in the neutral gas as a function of the experimental parameter E/N. Both vd and K, are given merely for convenience to facilitate use of the tables as a quick reference. All these data were collected at or near room temperature. We have labeled the experimental data T = 300 “K in order to stress the fixed temperature of the experimental data.
In most cases, the precision of the data was greater than the accuracy. Often the variation in the mobility as a function of E/N was significant even though the mag- nitude of the variation was within the limits of error. Thus, in most cases, three significant figures are given, although the estimated error may only allow two of them to be meaningful in the absolute sense.
In the four right-hand columns the independent variable is Teff, obtained from theory, in first approxi- mation. The quantity K,, (0) is interpreted as the reduced ionic mobility in the zero-field limit (E/N + 0), but at the ion-gas temperature T,,. Calculation of G(l,r) (T,,,) is
allowed by this interpretation as explained above. The results are presented. The logarithmic derivative of & (0) with respect to T,,, is included to allow the user of the tables to make higher-order corrections to the calcu-
lated effective temperature if greater accuracy is desired and to aid in the calculation of diffusion coefficients [see Eqs. (7)-( 13)]. The error in the derivative is estimated at +- IO%, although it may actually be larger (-20%) at the highest and lowest values of T,,. Finally, we note that
dlnW,J din(K) -=-.
dlnx dlnx
Use of Tables
The first three columns on the left of each Table, which constitute a compilation of experimental data, are intended to provide a convenient “handbook” source of mobility data on mass-identified ions in neutral gases. The numbers presented were taken from a smooth curve drawn through the experimental data and represent our best estimate of the true mobility function.
The right-hand part (four columns) of each Table presents results derived from the application of theory to the experimental data on the left. Of direct experimental interest is the ability to read the zero-field reduced mobility K,(E/N-+ 0) as a function of the temperature T,,,. Of theoretical interest is that, having acquired K, (T,,). one may obtain information about the ion-neutral potential and calculate the ionic diffusion coefficients.
182 Atomic Data md Nuclear Doto Tables, Vol. I?. No. 3, March 1976
ELLIS, PAI, MCDANIEL, MASON, and VIEHLAND Transport Properties of Gaseous Ions
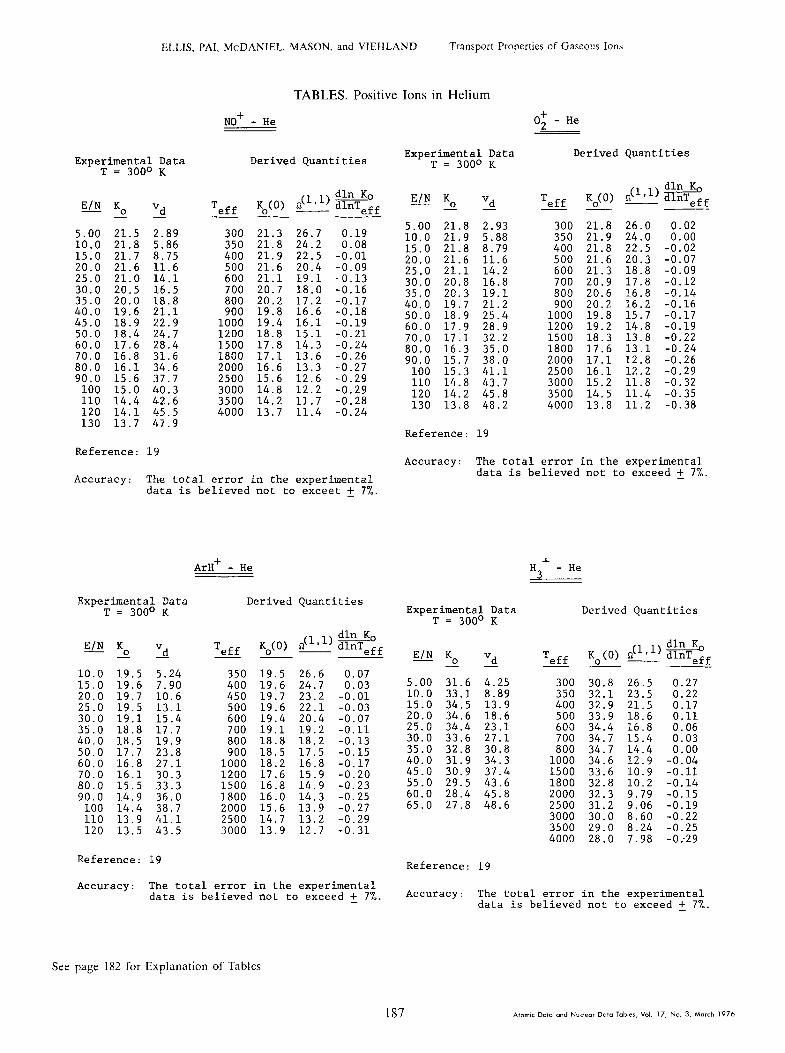
TABLES. Positive Ions in Helium
Na+ - He I.i+ - He z
Experimental Data T = 300' K
Derived Quantities Derived Quantities Experimental Data T = 3000 K
22.6 24.0 24.7 25.2 25.8 26.0 26.0 25.6 25.0 24.4 23.7 22.5 21.4 20.5 19.1 18.0
dln K, dlnTeff
0.24 0.17 0.13 0.09 0.06 0.02
-0.03 -0.06 -0.11 -0.14 -0.16 -0.21 -0.23 -0.25 -0.26 -0.25
T eff Ko(0) &l) :::T>f --
&U E/N K,, E/N K. - - Vd 1.00 22.8 O.Ei3 0.32
0.27 2.00 22.8 1.23 0.24 4.00 22.8 2.45
T eff
2.00 23.1 3.00 23.1 4.00 23.1 6.00 23.3 8.00 23.8 10.0 24.4 12.0 25.0 15.0 26.1 20.0 28.1 25.0 30.0 30.0 31.4 40.0 32.6 50.0 32.6 60.0 32.2 80.0 31.1
100 30.0 120 28.9 150 27.2 200 24.6
Vd - 1.24 1.86 2.48 3.76 5.12 6.56 8.06 10.5 15.1
232 3510 43.8 51.9 66.9 80.6 93.2 110 132
Reference: 1
300 400 500 600 800
1000 1200
22.9 29.2 25.0 23.2 26.4 19.7 27.5 17.2 29.1 14.1 30.2 12.1 31.0 10.8 31.9 9.39 32.5 7.98 32.6 7.12 32.6 6.50 32.4 5.66 32.0 5.13 31.6 4.74 30.9 4.20 30.1 3.85 29.4 3.60 28.4 3.34 26.9 3.05 24.6 2.98
300 400 500 600 800
1000 1200
25.6 20.9 18.2 16.2 13.7 12.2 1L.l 10.1 8.97 8.22 7.72 7.05 6.63 6.31 5.87 5.57
0.21 6.00 22.8 3.68 0.18 8.00 23.1 4.97 0.16 10.0 23.4 6.29 0.14 12.0 23.8 7.67
1500
22%
0.10 0.03 0.00
15.0 24.3 9.79 20.0 25.1 13.5 25.0 25.8 17.3 30.0 25.9 20.9 40.0 25.6 27.5 50.0 25.0 33.6
1500 2000 2500 3000 4000 5000 6000 8000
10000
3000 4000 5000 6000 8000
10000 12000 15000 20000 25000
-0.01 -0.04 -0.06 -0.07 -0.10 -0.12
60.0 24.2 39.0 80.0 22.4 48.2
100 21.0 56.4 120 19.7 63.5 150 18,4 74.2 180 17.4 84.2
-0.15 -0.17 -0.20 -0.23
Reference: 1
Accuracy: Accuracy: The total error in the experimental
data is believed not to exceed +_ 2% The total error in the experimental data is believed not to exceed +_ 2% for E/N 5 150 Td. and +_ 5% for E/N > 150 Td.
K+ - He
Rb+ - He Experimental Data T = 300° K
Derived Quantities
Experimental Data T = 300'
Derived Quantities K T eff K(0) n("') wff 0 - --
E/N K - 0 Vd - - dln K
E&IK 52
T 2 eff l&(O) n(“‘) dlnTeOff ____ 1.00 21.6 0.580 300 21.5 26.1 0.06
2.00 21.6 1.16 400 21.8 22.3 0.02 4.00 21.6 2.32 500 21.7 20.0 -0.03 4.00 20.0 2.15 300 20.0 27.3 0.00
7.00 20.0 3.76 350 20.0 25.3 -0.02 6.00 21.6 3.48 8.00 21.6 4.64 10.0 21.6 5.80
600 21.6 18.4 -0.06 800 21.1 16.3 -0.10
1000 20.5 15.0 -0.13 1200 20.0 14.0 -0.16 1500 19.3 13.0 -0.18 1800 18.6 12.3 -0.20 2000 18.2 11.9 -0.22 2500 17.3 11.2 -0.23 3000 16.6 10.7 -0.25 3500 15.9 10.3 -0.28 4000 15.3 10.0 -0.29 5000 14.4 9.54 -0.25 6000 13.7 9.16 -0.26
10.0 20.0 5.37 400 19.9 23.8 -0.04 15.0 19.9 8.02 500 19.6 21.6 -0.07 20.0 19.7 10.6 600 19.3 20.0 -0.10 25.0 19.5 13.1 800 18.6 18.0 -0.15 30.0 19.2 15.5 1000 17.9 16.7 -0.18 40.0 18.4 19.8 1200 17.4 15.7 -0.18
12.0 21.7 7.00 15.0 21.7 8.75 20.0 21.6 11.6 25.0 21.4 14.4 30.0 21.0 16.9 40.0 20.3 21.8
50.0 17.6 23.6 1500 16.7 14.6 -0.19 60.0 16.9 27.2 2000 15.7 13.5 -0.20 80.0 15.7 33.7 2500 15.1 12.5 -0.21
100 14.7 39.5 3000 14.5 11.9 -0.22 120 14.0 45.1 3500 14.0 11.4 -0.23 140 13.3 50.0 4000 13.6 11.0 -0.24
50.0 19.5 26.2 60.0 18.7 30.1 80.0 17.2 37.0
100 16.0 43.0 120 15.2 49.0 150 14.0 56.4 Reference: 33
Accuracy: The total error in the experimental data is believed not to exceed +_ 2%.
Reference: 17 and 9
Accuracy: The total error in the experimental data is believed not to exceed +_ 2%.
See page 182 for Explanaition of Tables
183
ELLIS, PAI. MCDANIEL. MASON. and VIEHLAND Trmsport Properties of Ciasrour Ion5
Experimental Data T = 300' K
E/N K. - - “d
4.00 30.9 3.32 5.00 31.0 4.16 6.00 31.0 5.00 7.00 30.9 5.81 8.00 30.8 6.62 10.0 30.6 8.22 12.0 30.3 9.77 14.0 30.1 11.3 16.0 29.8 12.8 18.0 29.6 14.3 20.0 29.4 15.8
TABLES. Positive Ions in Helium
H+ - He He+ - He
Derived Quantities
T eff K (0) np,l> g+ 0 - eff
325 31.0 37.0 0.01 350 30.9 35.8 -0.04 375 30.8 34.7 -0.07 400 j0.6 33.8 -0.08 450 30.3 32.2 -0.09 500 30.0 30.8 -0.07 550 29.8 29.6 -0.06 600 29.7 28.4 -0.06 700 29.4 26.6 -0.04
Reference 21 and 26
Accuracy: The total error in the experimental data is believed not to exceed 2 3%.
Experimental Data T = 3000 K
E/N K. vd - - -
6.00 19.9 3.21 8.00 20.0 4.30 10.0 20.0 5.37 12.0 20.1 6.48 15.0 20.2 8.14 20.0 20.4 11.0 25.0 20.6 13.8 30.0 20.8 16.8 40.0 21.0 22.6 50.0 21.2 28.5 60.0 21.4 34.5 70.0 21.6 40.6
700 20.7 19.2 0.04 800 20.8 17.8 0.03
1000 20.9 15.9 0.03 1200 21.1 14.4 0.03 1500 21.2 12.8 0.03 2000 21.4 11.0 0.03 2500 21.5 9.76 0.03 3000 21.6 8.87 0.02
E/N K - 0 Vd -
4.00 24.3 2.61 5.00 24.3 3.26 6.00 24.2 3.90 7.00 24.2 4.55 8.00 24.1 5.18 10.0 24.0 6.45 12.0 23.8 7.67
Reference: 21 14.0 23.7 8.92 16.0 23.5 10.1
Accuracy: The total error in the experimental 18.0 23.3 11.3 data is believed not to exceed +_ 7%. 20.0 23.0 12.4
N+ - He
Derived Quantities
Experimental Data T = 300' K
E/N K - A! "d
6.00 10.3 1.66 8.00 10.2 2.19 10.0 10.2 2.74 12.0 10.1 3.26 15.0 10.0 4.03 20.0 9.90 5.32 25.0 9.74 6.54 30.0 9.60 7.74 40.0 9.28 9.97 50.0 8.97 12.1 60.0 8.67 14.0 80.0 8.12 17.5 100 7.67 20.6 120 7.25 23.4 150 6.78 27.3 200 6.12 32.9 250 5.60 37.6 300 5.19 41.8 400 4.58 49.2 500 4.17 56.0 600 3.81 61.4 700 3.57 67.1
Derived Quantities
T eff K (0) #,l) e 0 - eff
300 10.3 73.4 -0.32 350 9.84 71.1 -0.30 400 9.48 69.0 -0.26 500 9.04 64.8 -0.22 600 8.67 61.6 -0.23 800 8.08 57.3 -0.25
1000 7.62 54.3 -0.28 1200 7.22 52.3 -0.29 1500 6.79 49.8 -0.31 2000 6.20 47.2 -0.32 2500 5.75 45.5 -0.35 3000 5.39 44.3 -0.38 3500 5.08 43.6 -0.39 4000 4.80 43.1 -0.42 5000 4.37 42.4 -0.48 6000 3.99 42.4 -0.51 7000 3.67 42.6 -0.55 8000 3.40 43.0 -0.59
Reference: 4 and 15
Accuracy: The total error in the experimental data is believed not to exceed t 1% for E/N 5 20 and +_ 3% for E/N > 20.
T eff K (0) CI(',') :::TKo 0 - eff
300 19.9 30.4 0.06 350 20.1 27.9 0.05 Experimental Data 400 20.2 26.0 0.05 T = 300° K 500 20.4 23.0 0.04 600 20.6 20.8 0.04
D+ - He -
Derived Quantities
T eff Ko(0) n(',') w, --
310 24.3 37.5 -0.10 325 24.2 36.7 -0.10 350 24.0 35.7 -0.08 375 23.9 34.6 -0.08 400 23.8 33.7 -0.08 450 23.5 32.2 -0.10 500 23.3 30.8 -0.13 550 22.9 29.8 -0.20
Reference: 21 and 27
Accuracy: The total error in the experimental data is believed not to exceed +_ 3%.
See page 182 for Explanation of Tables
184 A+om~ Data and Nuclear Doto Tables, Vol. 17, No. 3, March 1976
ELLIS. PAI. MCDANIEL. MASON. and VIEHLAND Transport Properties of Gaseous Ions
TABLES. Positive Ions in Helium
Ar+ - He 0+ - He
Experimental Data T = 300°K
Derived Quantities Experimental Data T = 300' K
E/N K. - - Vd -
2.79 5.72 8.67 11.6 14.4 17.1 19.7 22.1 24.2 26.3 30.1 33.9 36.8 39.7 42.2 44.9 47.1 50.0
T K (0) $I(“~) it:‘? eff 0 - eff __ -
E/N K 0 Vd --
5.00 20.8 10.0 21.3 15.0 21.5 20.G 21.6 25.0 21.4 30.0 21.2 35.0 20.9 40.0 20.6
E :::6" 60:0 18.7 70.0 18.0 80.0 17.1 90.0 16.4
100 15.7 110 15.2 120 14.6 130 14.3
300 20.7 27.1 0.19 350 21.2 24.5 0.13 400 21.5 22.6 0.07 500 21.6 20.1 0.00 600 21.5 18.4 -0.03 700 21.4 17.1 -0.06 800 21.2 16.2 -0.09 900 20.9 15.5 -0.11
1000 20.7 14.8 -0.13 1200 20.1 13.9 -0.16 1500 19.3 13.0 -0.21 1800 18.5 12.4 -0.24 2000 18.1 12.0 -0.26 2500 17.0 11.4 -0.29 3000 16.1 11.0 -0.33 3500 15.2 10.8 -0.36 4000 14.5 10.6 -0.39
5.00 22.6 3.04 10.0 23.4 6.29 15.0 24.2 9.75 20.0 24.9 13.4 25.0 25.5 17.1 30.0 25.8 20.8 35.0 25.7 24.2 40.0 25.4 27.3 45.0 24.9 30.1 50.0 24.5 32.9 60.0 23.6 38.0 70.0 22.5 42.3 80.0 21.7 46.6 90.0 21.1 51.0
100 20.5 55.1 110 19.9 58.8 120 19.4 62.6 130 18.9 66.0
Reference: 19 Reference: 19
Derived Quantities
T eff K (0) n(l") w 0 - eff
Accuracy:
300 400 500 600 800
1000
22.5 26.5 0.20 23.8 21.7 0.17 24.6 18.8 0.13 25.1 16.8 0.10 25.6 14.3 0.05 25.8 12.7 0.01
1200 25.7 11.6 -0.04 1500 25.3 10.6 -0.08 2000 24.6 9.40 -0.14 2500 23.7 8.73 -0.17 3000 23.0 8.21 -0.18 3500 22.3 7.84 -0.20 4000 21.7 7.54 -0.21 4500 21.1 7.31 -0.22 5000 20.7 7.07 -0.23 6000 19.8 6.75 -0.24 7000 19.1 6.47 -0.25
The total error in the experimental data is believed not to exceed +_ 7%.
Accuracy: The total error in the experimental data is believed not to exceed f. 7%.
iJ+ - He H+ - He L
Experimental Data T = 300' K
Derived Quantities Experimental Data
T = 300° K Derived Quantities
E/N K. vd T K (0) &l'l) wff eff 0 - - - -- E/N - K. - 19.7 19.7 19.6 19.6
T eff K (0)
0 $p ,l> ;:,“TKo
eff
300 19.7 27.4 -0.10 350 19.5 25.6 -0.06
Vd -
2.12 2.65 3.16 4.21 5.24 6.29 7.82 10.3 12.9 15.5 18.2
3.00 15.8 1.27 4.00 15.8 1.70 5.00 15.8 2.12 6.00 15.8 2.55 8.00 15.7 3.37 10.0 15.6 4.19 12.0 15.5 5.00 15.0 15.4 6.21 20.0 15.0 8.06 25.0 14.6 9.81 30.0 14.1 11.4 35.0 13.6 12.8 40.0 13.1 14.1
300 15.9 33.9 -0.12 325 15.7 33.0 -0.16 350 15.5 32.2 -0.19 400 15.1 30.9 -0.24 450 14.6 30.1 -0.28 500 14.1 29.6 -0.32 550 13.7 29.0 -0.34 600 13.3 28.6 -0.37 650 12.9 28.4 -0.40
4.00 5.00 6.00 a.00 10.0 12.0 15.0
400 19.4 24.1 -0.04 450 19.3 22.8 -0.03 500 19.2 21.8 -0.02 19.5
19.5 19.4 19.2
600 19.2 19.9 0.00 700 19.2 18.4 0.03 800 19.3 17.1 0.06 20.0
25.0 30.0 35.0
19.2 19.2 19.3
900 19.5 16.0 0.10
Reference: 8 Reference: 18
Accuracy: The total error in the experimental data is believed not to exceed +_ 4%. Accuracy: The total error in the experimental
data is believed not to exceed +_ 4%.
See page 182 for Explanation of Tables
185
ELLIS, PAL MCDANIEL. MASON,and VIEHLAND Transport Properties of Gaseous Ions
TABLES. Positive Ions in Helium
He: - He H2+ - He
Derived Quantities
T K (0) n("') $&f eff 0 - --
300 16.7 39.2 -0.09 350 17.0 35.6 -0.14 400 17.4 32.6 -0.17 450 17.8 30.0 -0.19 500 18.1 28.0 -0.19 550 18.5 26.1 -0.20
Experimental Data T = 300' K Experimental Data
T = 300° K Derived Quantities
E/N K. Vd - - -
1.50 16.7 0.673 2.00 16.7 0.897 3.00 16.8 1.35 4.00 16.8 1.81 5.00 16.8 2.26 6.00 16.8 2.71 8.00 16.9 3.63 10.0 16.9 4.54 12.0 17.0 5.48 14.0 17.2 6.47 16.0 17.3 7.44 18.0 17.5 8.46 20.0 17.7 9.51 22.0 18.0 10.6 24.0 18.3 11.8
T eff K (0) n('>l) ef 0 - -- E/N K - Vd 0 -
3.00 24.5 1.97 4.00 24.5 2.63 5.00 24.5 3.29 6.00 24.6 3.97 7.00 24.8 4.66 8.00 25.1 5.40 10.0 25.7 6.91 12.0 26.5 8.54 14.0 27.6 10.4 16.0 28.8 12.4 18.0 30.2 14.6
300 325 350 400 450 500 550 600 650
24.5 37.8 0.08 24.7 36.0 0.20 25.2 34.0 0.28 26.2 30.6 0.29 27.1 27.9 0.30 28.0 25.6 0.30 28.9 23.6 0.31 29.6 22.1 0.31 30.4 20.7 0.32
Reference: 21
Accuracy: The total error in the experimental data is believed not to exceed 5 7%. Reference: 4
Accuracy: The total error in the experimental data is believed not to exceed +_ 1%.
co+ - He N+ 2 - He
Experimental Data T = 300' K
Derived Quantities Experimental Data
T = 300° K Derived Quantities
E/N K. Vd T - K (0) n(lJ1) ef eff 0 - - - -__
8.00 20.8 4.47 9.00 20.9 5.05 10.0 21.0 5.64 12.0 21.0 6.77 15.0 20.9 8.42 20.0 20.7 11.1 25.0 20.3 13.6 30.0 19.9 16.0 40.0 19.1 20.5 50.0 18.3 24.6 60.0 17.5 28.2 70.0 16.8 31.6 80.0 16.2 34.8 90.0 15.6 37.7
350 20.9 25.3 0.08 400 20.9 23.7 -0.02 500 20.7 21.4 -0.08 600 20.3 19.9 -0.11 700 19.9 18.8 -0.12 800 19.6 17.8 -0.13
1000 19.0 16.5 -0.14 1200 18.5 15.4 -0.16 1500 17.8 14.4 -0.22 1800 17.0 13.7 -0.27 2000 16.5 13.4 -0.31 2500 15.3 12.9 -0.38
T eff n("') ::,nTfoff Ko(0) E&K 0 "d
5.00 19.9 2.67 10.0 20.6 5.54 15.0 20.8 8.38 20.0 20.8 11.2 25.0 20.5 13.8 30.0 20.3 16.4 35.0 19.9 18.7 40.0 19.5 21.0 45.0 19.1 23.1 50.0 18.7 25.1 60.0 17.7 28.5 70.0 16.9 31.8 80.0 16.3 35.0 90.0 15.7 38.0 100 15.2 40.8 110 14.8 43.7 120 14.4 46.4
300 19.8 28.8 0.29 350 20.6 25.7 0.17 400 20.8 23.8 0.06 500 20.8 21.3 -0.04 600 20.6 19.6 -0.06 700 20.3 18.4 -0.08 800 20.1 17.4 -0.il 900 19.8 16.7 -0.13
1000 19.5 16.0 -0.15 1500 19.0 15.0 -0.16 1500 18.2 14.0 -0.21 2000 16.9 13.1 -0.25 2500 15.9 12.4 -0.29 3000 15.1 12.0 -0.25 3500 14.6 11.5 -0.21
Reference: 21
Reference: 19 Accuracy: The total error in the experimental data is believed not to exceed +_ 7%.
Accuracy: The total error in the experimental data is believed not to exceed +_ 7%.
See page 182 for Explanation of Tables
186 Atomic Doto and Nuclear Doto Tobler, Vol. 17. No. 3, March 1976
ELLIS, PAL MCDANIEL. MASON,and VIEHLAND Transport Properties of Gaseous Ions
TABLES. Positive Ions in Helium
0+ 2 - He -
NO+ - He
Experimental Data T = 300° K
Derived Quantities Experimental Data
T = 300° K Derived Quantities
T eff K (0) &l) w 0 ~ eff
300 21.8 26.0 0.02 350 21.9 24.0 0.00 400 21.8 22.5 -0.02 500 21.6 20.3 -0.07 600 21.3 18.8 -0.09
T eff K (0) &l,l> @
0 - eff E/N K -0 Vd - E/N K. vd -
- -
5.00 21.5 2.89 10.0 21.8 5.86
5.00 21.8 2.93 10.0 21.9 5.88 15.0 21.8 8.79 20.0 21.6 11.6 25.0 21.1 14.2 30.0 20.8 16.8 35.0 20.3 19.1 40.0 19.7 21.2
300 21.3 26.7 0.19 350 21.8 24.2 0.08
15.0 21.7 8.75 400 21.9 22.5 -0 20.0 21.6 11.6 500 21.6 20.4 -0 25.0 21.0 14.1 600 21.1 19.1 -0
ii 13 700 20.9 17.8 -0.12
800 20.6 16.8 -0.14 900 20.2 16.2 -0.16
30.0 20.5 16.5 700 20.7 18.0 -0.16 35.0 20.0 18.8 800 20.2 17.2 -0.17 40.0 19.6 21.1 900 19.8 16.6 -0.18 45.0 18.9 22.9 1000 19.4 16.1 -0.19
50.0 18.9 25.4 60.0 17.9 28.9 70.0 17.1 32.2 80.0 16.3 35.0 90.0 15.7 38.0
100 15.3 41.1 110 14.8 43.7 120 14.2 45.8 130 13.8 48.2
1000 19.8 15.7 -0.17 1200 19.2 14.8 -0.19 1500 18.3 13.8 -0.22 1800 17.6 13.1 -0.24
50.0 18.4 24.7
110 14.4 42.6 120 14.1 45.5
60.0 17.6 28.4
130 13.7 47.9
70.0 16.8 31.6 80.0 16.1 34.6 90.0 15.6 37.7
100 15.0 40.3 3500 14.2 11.7 -0.28 4000 13.7 11.4 -0.24
1200 18.8 15.1 -0.21 1500 17.8 14.3 -0.24 1800 17.1 13.6 -0.26 2000 16.6 13.3 -0.27 2500 15.6 12.6 -0.29 3000 14.8 12.2 -0.29
2000 17.1 12.8 -0.26 2500 16.1 12.2 -0.29 3000 15.2 11.8 -0.32 3500 14.5 11.4 -0.35 4000 13.8 11.2 -0.38
Reference: 19
Reference: 19 Accuracy: The total error in the experimental
data is believed not to exceed +_ 7%. Accuracy: The tot.al error in the experimental
data is. believed not to exceet + 7%. -
ArH+ - He H+ - He
Experimental Data T = 300' K
Derived Quantities Experimental Data
T = 300' K Derived Quantities
E/N K T - 0 #>l) w
Id ---- K (0)
eff 0 eff T eff
500 33.9 18.6
K (0) n(l'l) :::T"o
0.11
0
600 34.4 16.8
-
0.06
eff
700 34.7 15.4
300 30.8
0.03
26.5
800 34.7 14.4
0.27 350
0.00 1000 34.6 12.9 -0.04
32.1
1500 33.6 10.9 -0.11
23.5 0.22 400 32.9 21.5 0.17
E/N K - 0 - 3 10.0 19.5 5.24 15.0 19.6 7.90 20.0 19.7 10.6 25.0 19.5 13.1 30.0 19.1 15.4 35.0 18.8 17.7 40.0 18.5 19.9 50.0 17.7 23.8 60.0 16.8 27.1 70.0 16.1 30.3
350 19.5 26.6 0 400 19.6 24.7 0 450 19.7 23.2 -0 500 19.6 22.1 -0 600 19.4 20.4 -0 700 19.1 19.2 -0 800 18.8 18.2 -0 900 18.5 17.5 -0
1000 18.2 16.8 -0 1200 17.6 15.9 -0 1500 16.8 14.9 -0 1800 16.0 14.3 -0 2000 15.6 13.9 -0 2500 14.7 13.2 -0 3000 13.9 12.7 -0
5.00 31.6 4.25
20.0 34.6 18.6
10.0 33.1 8.89 15.0 34.5 13.9
25.0 34.4 23.1 30.0 33.6 27.1 35.0 32.8 30.8 40.0 31.9 34.3 45.0 30.9 37.4 55.0 29.5 43.6 60.0 28.4 45.8 65.0 27.8 48.6
1800 32.8 10.2 -0.14 80.0 15.5 33.3 90.0 14.9 36.0
100 14.4 38.7 110 13.9 41.1 120 13.5 43.5
2000 12.3 9.79 -0.15 2500 31.2 9.06 -0.19 3000 30.0 8.60 -0.22 3500 29.0 8.24 -0.25 4000 28.0 7.98 -0;29
25 27 29 31
Reference: 19 Reference: 19
Accuracy: The total error in the experimental data is believed not to exceed + 7%. - Accuracy: The total error in the experimental
data is believed not to exceed + 7%.
See page 182 for Explanation of Tables
187
ELLIS. PAI. McDANlEL. MASON. and VItHLAND Transport Prclperties of Gsszous Ion>
Experimental Data T = 300° K
E/N K 0 23
5.00 20.2 2.71 10.0 20.4 5.48 15.0 20.3 8.18 20.0 19.9 10.7 25.0 19.7 13.2 30.0 19.4 15.6 35.0 18.9 17.8 40.0 18.5 19.9 45.0 18.0 21.8 50.0 17.5 23.5 60.0 16.7 26.9 10.0 15.9 29.9 80.0 15.3 32.9 90.0 14.7 35.5 loo 14.3 38.4 110 13.8 40.8 120 13.5 43.5
Reference: 19
T eff
300 350 400 500 600 700 800 900
1000 1200 1500 1800 2000 2500 3000 3500
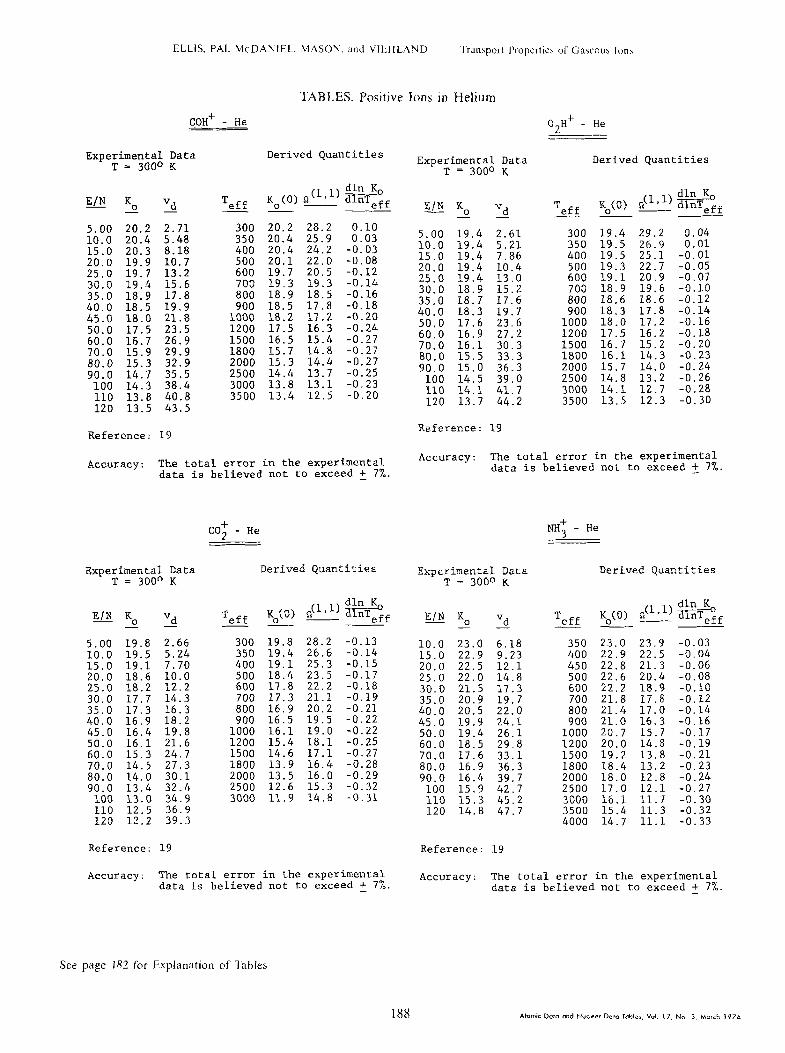
TABLES. Positive Ions in Helium
COH+ - He 02H+ - He
Derived Quantities
Ko(O) dl")eff
20.2 28.2 0.10 20.4 25.9 0.03 20.4 24.2 -0.03 20.1 22.0 -0.08 19.7 20.5 -0.12 19.3 19.3 -0.14 18.9 18.5 -0.16 18.5 17.8 -0.18 18.2 17.2 -0.20 17.5 16.3 -0.24 16.5 15.4 -0.27 15.7 14.8 -0.27 15.3 14.4 -0.27 14.4 13.7 -0.25 13.8 13.1 -0.23 13.4 12.5 -0.20
Accuracy: The total error in the experimental data is believed not to exceed +_ 7%.
CO: - He NH; - He
Experimental Data T = 300° K
Derived Quantities
E/N K Vd ‘I - 0 eff K (0) #J) Wff - - 0 -
5.00 19.8 2.66 300 19.8 28.2 ib:iI 19.5 5.24 350 19.4 26.6 15.0 19.1 7.70 400 19.1 25.3 20.0 18.6 10.0 500 18.4 23.5 25.0 18.2 12.2 600 17.8 22.2 30.0 17.7 14.3 700 17.3 21.1 35.0 17.3 16.3 800 16.9 20.2 40.0 16.9 18.2 900 16.5 19.5 bj.6 16.4 19.8 1000 16.1 19.0 50.0 16.1 21.6 1200 15.4 18.1 60.0 15.3 24.7 1500 14.6 17.1 71) 0 II 5 27.3 1800 13.9 16.4
-0.17 -0.18 -0.19 -0.21 -0.22 -0.22 -0.25 -0.27 -0.28 -0.29 -0.32 -0.31
,-.- -..- ~--- 80.0 14.0 30.1 2000 13.5 16.0 90.0 13.4 32.4 2500 12.6 15.3
100 13.0 34.9 3000 11.9 14.8 110 12.5 36.9 120 12.2 39.3
-0.13 -0.14 -0.15
Reference: 19
Accuracy: The total error in the experimental data is believed not to exceed + 7%.
Experimental Data T = 300° K
E/N K. vd - - - T
eff K (0) Q(=) ::TKo
0 - eff
5.00 19.4 2.61 300 19.4 29.2 0.04 10.0 19.4 5.21 350 19.5 26.9 0.01 15.0 19.4 7.86 400 19.5 25.1 -0.01 20.0 19.4 10.4 500 19.3 22.7 -0.05 25.0 19.4 13.0 600 19.1 20.9 -0.07 30.0 18.9 15.2 700 18.9 19.6 -0.10 35.0 18.7 17.6 800 18.6 18.6 -0.12 40.0 18.3 19.7 900 18.3 17.8 -0.14 50.0 17.6 23.6 1000 18.0 17.2 -0.16 60.0 16.9 27.2 1200 17.5 16.2 -0.18 70.0 16.1 30.3 1500 16.7 15.2 -0.20 80.0 15.5 33.3 1800 16.1 14.3 -0.23 9610 15.0 36.3 2000 15.7 14.0 -0.24
100 14.5 39.0 2500 14.8 13.2 -0.26 110 14.1 41.7 3000 14.1 12.7 -0.28 120 13.7 44.2 3500 13.5 12.3 -0.30
Reference: 19
Derived Quantities
Accuracy: The total error in the experimental data is believed not to exceed +_ 7%.
Experimental Data T = 300O K
Derived Quantities
E/N K. Vd T - eff K (0) n(lrl)wff 0 ___ - -
10.0 23.0 6.18 350 23.0 23.9 -0.03 15.0 22.9 9.23 400 22.9 22.5 -0.04 20.0 22.5 12.1 450 22.8 21.3 -0.06 25.0 22.0 14.8 500 22.6 20.4 -0.08 30.0 21.5 17.3 600 22.2 18.9 -0.10 35.0 20.9 19.7 700 21.8 17.8 -0.12 40.0 20.5 22.0 800 21.4 17.0 -0.14 45.0 19.9 24.1 900 21.0 16.3 -0.16 50.0 19.4 26.1 1000 20.7 15.7 -0.17 60.0 18.5 29.8 1200 20.0 14.8 -0.19 70.0 17.6 33.1 1500 19.2 13.8 -0.21 80.0 16.9 36.3 1800 18.4 13.2 -0.23 90.0 16.4 39.7 2000 18.0 12.8 -0.24
100 15.9 42.7 2500 17.0 12.1 -0.27 110 15.3 45.2 3000 16.1 11.7 -0.30 120 14.8 47.7 3500 15.4 11.3 -0.32
4000 14.7 11.1 -0.33
Reference: 19
Accuracy: The total error in the experimental data is believed not to exceed +_ 7%.
See page 182 for Explanation of Tables
188
ELLIS, PAI. MCDANIEL. MASON,and VIEHLAND Transport Properties of Gaseous Ions
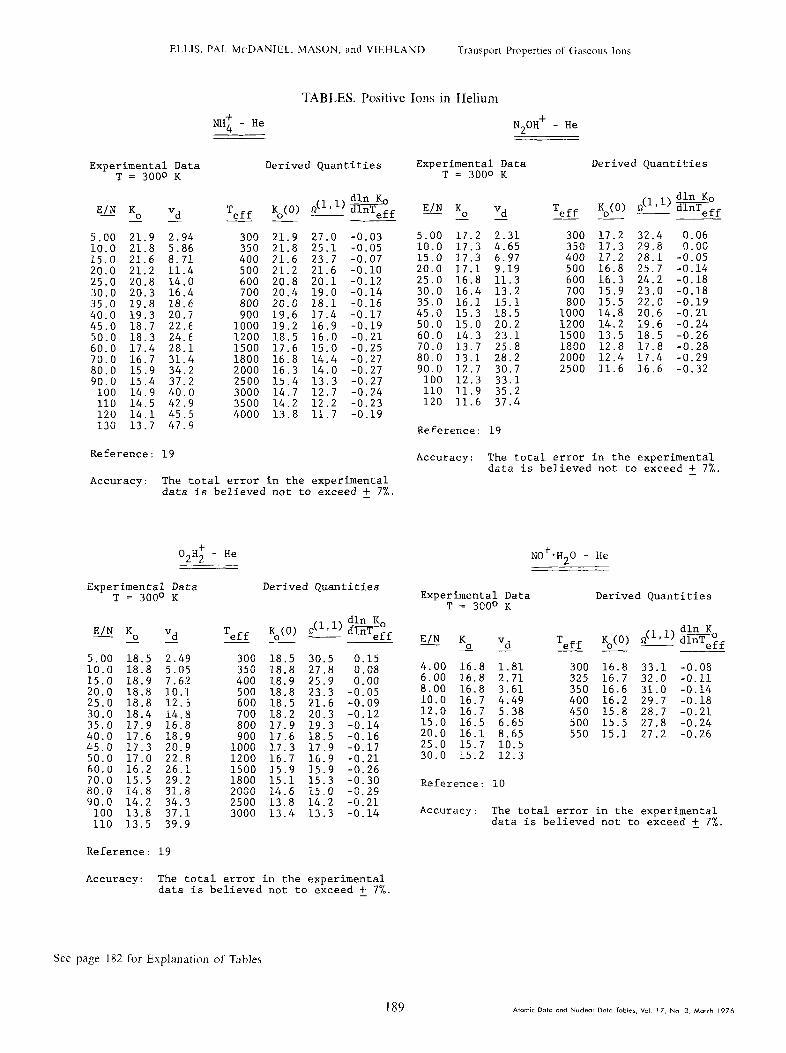
TABLES. Positive Ions in Helium
NH+ 4 - He N2OH+ - He
Derived Quantities Experimental Data T = 3000 K
Experimental Data T = 3000 K
Derived Quantities
T eff Ko(o> T eff K (0) &l,l> w 0 ___ eff
K, dln n(l,') dlnTeff E/N K.
-
5.00 21.9 10.0 21.8 15.0 21.6 20.0 21.2 25.0 20.8 30.0 20.3 35.0 19.8 40.0 19.3 45.0 18.7 50.0 18.3 60.0 17.4 70.0 16.7 80.0 15.9 90.0 15.4
100 14.9 110 14.5 120 14.1 130 13.7
Vd -
2.94 5.86 8.71 11.4 14.0 16.4 18.6 20.7 22.6 24.6~ 28.1 31.4 34.2 37.2 40.0 42.9 45.5 47.9
Reference: 19
Accuracy: The total error in the experimental data is believed not to exceed + 7%.
E/N K. vd - - -
5.00 17.2 2.31 10.0 17.3 4.65 15.0 17.3 6.97 20.0 17.1 9.19
300 350 400 500 600 700
17.2 32.4 17.3 29.8 17.2 28.1 16.8 25.7 16.3 24.2 15.9 23.0 15.5 22.0 14.8 20.6 14.2 19.6 13.5 18.5
0.06 0.00
-0.05 -0.14 -0.18 -0.18 -0.19 -0.21 -0.24 -0.26 -0.28 -0.29 -0.32
300 350 400 500 600 700 800 900
21.9 21.8
27.0 -0.03 25.1 -0.05
2.67 -0.07
20:1 -0.10 -0.12
19.0 -0.14 18.1 -0.16 17.4 -0.17
21.6 21.2 20.8 20.4 20.0 19.6
25.0 16.8 11.3 30.0 16.4 13.2 35.0 16.1 15.1 45.0 15.3 18.5 50.0 15.0 20.2
1000 1200 1500 1800 2000
1000 1200 1500 1800 2000 2500
19.2 18.5 17.6 16.8 16.3
16.9 -0.19 16.0 -0.21 15.0 -0.25
60.0 14.3 23.1 70.0 13.7 25.8 80.0 13.1 28.2 90.0 12.7 30.7
100 12.3 33.1 110 11.9 35.2 120 11.6 37.4
12.8 17.8 12.4 17.4 11.6 16.6
14.4 -0.27 14.0 -0.27 13.3 -0.27 12.7 -0.24 12.2 -0.23 11.7 -0.19
2500 15.4 14.7 14.2 13.8
3000 3500 4000
Reference: 19
Accuracy: The total error in the experimental data is believed not to exceed + 7%. -
O<,H+ 1. 2 - He =
Experimental Data T = 300°
Derived Quantities K
NO+*H20 - He
Experimental Data T = 300°
Derived Quantities K
E/N K. vd T _ eff - - 0 - E/N K ___ - Vd T 0 - eff K (0) n(ll') %TKo 0 - eff
5.00 18.5 2.4!3 300 18.5 30.5 0.15 10.0 18.8 5.0!5 350 18.8 27.8 0.08 4.00 16.8 1.81 300 16.8 33.1 -0.08
6.00 16.8 2.71 325 16.7 32.0 -0.11 8.00 16.8 3.61 350 16.6 31.0 -0.14 10.0 16.7 4.49 400 16.2 29.7 -0.18 12.0 16.7 5.38 450 15.8 28.7 -0.21 15.0 16.5 6.65 500 15.5 27.8 -0.24 20.0 16.1 8.65 550 15.1 27.2 -0.26 25.0 15.7 10.5 30.0 15.2 12.3
15.0 18.9 7.62 400 18.9 25.9 0.00 20.0 18.8 1O.l 500 18.8 23.3 -0.05 25.0 18.8 12.6 600 18.5 21.6 -0.09 30.0 18.4 14.8 700 35.0 17.9 16.8 800 40.0 17.6 18.'9 900 45.0 17.3 20.9 1000 50.0 17.0 22.8 1200 60.0 16.2 26.1 1500 70.0 15.5 29.2 1800
18.2 20.3 -0.12 17.9 19.3 -0.14 17.6 18.5 -0.16 17.3 17.9 -0.17 16.7 16.9 -0.21 15.9 15.9 -0.26 15.1 15.3 -0.30 14.6 15.0 -0.29 13.8 14.2 -0.21 13.4 13.3 -0.14
Reference: 10 80.0 14.8 31.8 2000 90.0 14.2 34.3 2500
100 13.8 37.1 3000 Accuracy: The total error in the experimental data is believed not to exceed +_ 7%. 110 13.5 39.9
Reference: 19
Accuracy: The total error in the experimental data is believed not to exceed +_ 7%.
See page 182 for Explanation of Tables
189
ELLIS, PAL MCDANIEL. MASON, and VIEHLAND Transport Propertie of Gaaeoui Ion5
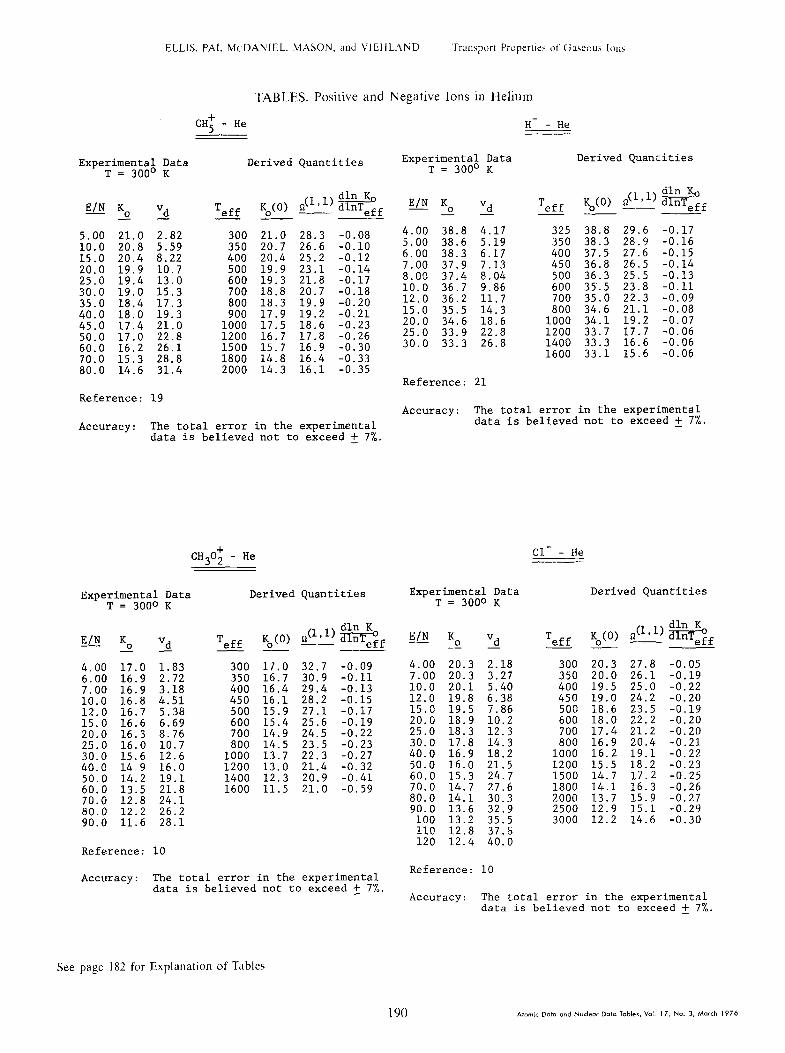
TABLES. Positive and Negative Ions in Helium
CH; - He H- - He
Experimental Data T = 300' K
Derived Quantities Data Derived Quantities K
E/N K Vd T - 0 eff K (0) &>l) e 0 - eff -
5.00 21.0 2.82 300 21.0 28.3 -0.08 10.0 20.8 5.59 350 20.7 26.6 -0.10 15.0 20.4 8.22 400 20.4 25.2 -0.12 20.0 19.9 10.7 500 19.9 23.1 -0.14 25.0 19.4 13.0 600 19.3 21.8 -0.17 30.0 19.0 15.3 700 18.8 20.7 -0.18 35.0 18.4 17.3 800 18.3 19.9 -0.20 40.0 18.0 19.3 900 17.9 19.2 -0.21 45.0 17.4 21.0 1000 17.5 18.6 -0.23 50.0 17.0 22.8 1200 16.7 17.8 -0.26 60.0 16.2 26.1 1500 15.7 16.9 -0.30 70.0 15.3 28.8 1800 14.8 16.4 -0.33 80.0 14.6 31.4 2000 14.3 16.1 -0.35
E/N K Vd T 0 - eff Ko(0) o(L") wff
- -
4.00 38.8 4.17 325 38.8 29.6 -0.17 5.00 38.6 5.19 350 38.3 28.9 -0.16 6.00 38.3 6.17 400 37.5 27.6 -0 7.00 37.9 7.13 450 36.8 26.5 -0 8.00 37.4 8.04 500 36.3 25.5 -0 10.0 36.7 9.86 600 35..5 23.8 -0 12.0 36.2 11.7 700 35.0 22.3 -0 15.0 35.5 14.3 800 34.6 21.1 -0 20.0 34.6 18.6 1000 34.1 19.2 -0.07 25.0 33.9 22.8 1200 33.7 17.7 -0.06 30.0 33.3 26.8 1400 33.3 16.6 -0.06
1600 33.1 15.6 -0.06
Reference: 21 Reference: 19
Accuracy: The total error in the experimental data is believed not to exceed +_ 7%.
Accuracy: The total error in the experimental data is believed not to exceed + 7%.
15 14 13
6 08
CH,O; - He cl- - He
Experimental Data T = 300O K
Derived Quantities Derived Quantities Experimental Data T = 3000 K
E/N K - Vd 0 - 4.00 17.0 1.83 6.00 16.9 2.72 7.00 16.9 3.18 10.0 16.8 4.51 12.0 16.7 5.38 15.0 16.6 6.69 20.0 16.3 8.76 25.0 16.0 10.7 30.0 15.6 12.6 40.0 14.9 16.0 50.0 14.2 19.1 60.0 13.5 21.8 70.0 12.8 24.1 80.0 12.2 26.2 90.0 11.6 28.1
Reference: 10
T K (0) n("') wf eff 0 ___ -- E/N K E/N K - - 0 0 - - "3 "3
4.00 20.3 2.18 4.00 20.3 2.18 7.00 20.3 3.27 7.00 20.3 3.27 10.0 20.1 5.40 10.0 20.1 5.40 12.0 19.8 6.38 12.0 19.8 6.38 15.0 19.5 7.86 15.0 19.5 7.86 20.0 18.9 10.2 20.0 18.9 10.2 25.0 18.3 12.3 25.0 18.3 12.3 30.0 17.8 14.3 30.0 17.8 14.3 40.0 16.9 18.2 40.0 16.9 18.2 50.0 1h.O 21.5 50.0 1h.O 21.5 60.0 15.3 24.7 60.0 15.3 24.7 70.0 14.7 27.6 70.0 14.7 27.6 80.0 14.1 30.3 80.0 14.1 30.3 90.0 13.6 32.9 90.0 13.6 32.9 100 13.2 35.5 100 13.2 35.5 110 12.8 37.6 110 12.8 37.6 120 12.4 40.0 120 12.4 40.0
T eff Ko(o)
300 20.3 27.8 -0.05 350 20.0 26.1 -0.19 400 19.5 25.0 -0.22 450 19.0 24.2 -0.20 500 18.6 23.5 -0.19 600 18.0 22.2 -0.20 700 17.4 21.2 -0.20 800 16.9 20.4 -0.21
loo0 16.2 19.1 -0.22 1200 15.5 18.2 -0.23 1500 14.7 17.2 -0.25 1800 14.1 16.3 -0.26 2000 13.7 15.9 -0.27 2500 12.9 15.1 -0.29 3000 12.2 14.6 -0.30
300 17.0 350 16.7 400 16.4 450 16.1
32.7 -0.09 3019 -0.11 29.4 -0.13 28.2 -0.15
500 15.9 600 15.4 700 14.9 800 14.5
1000 13.7 1200 13.0 1400 12.3 1600 11.5
27.1 -0.17 25.6 -0.19 24.5 -0.22 23.5 -0.23 22.3 -0.27 21.4 -0.32 20.9 -0.41 21.0 -0.59
Reference: 10 Accuracy: The total error in the experimental
data is believed not to exceed +_ 7%. Accuracy: The total error in the experimental
data is believed not to exceed + 7%. -
See page 182 for Explanation of Tables
190 Atomic Doto and Nucleor Dab Tabler, Vol. I,, No. 3, March 1976
ELLIS, PAI, MCDANIEL, MASON,and VIEHLAND Transport Properties of Gaseous Ions
Experimental Data T = 300° K
E/N K. vd T - eff K (0) n(=) eff 0 - - - --
3.00 28.2 2.27 4.00 27.8 2.99 5.00 27.6 3.71 6.00 27.4 4.42 8.00 26.9 5.78 10.0 26.5 7.12 12.0 26.0 8.38 15.0 25.3 10.2 20.0 24.2 13.0 25.0 23.2 30.0 22.3 40.0 20.9
19.8 19.0 17.8 16.8 16.1 15.5
50.0 60.0 80.0
100 120 140 160
15.6 18.0 22.5 26.6 30.6 38.3 45.1 51.9 58.3 64.1 14.9
Reference: 21
TABLES. Negative Ions in Helium
0- - He 0; - He
Derived Quantities
300 28.2 20.1 -0.32 400 26.0 18.9 -0.24 500 24.8 17.7 -0.22 600 23.8 16.8 -0.21 700 23.1 16.1 -0.21 800 22.4 15.5 -0.20
1000 21.4 14.5 -0.21 1200 20.7 13.7 -0.20 1500 19.8 12.8 -0.20 2000 18.7 11.7 -0.21 2500 17.8 11.0 -0.20 3000 17.2 10.4 -0.19 4000 16.3 9.52 -0.17 5000 15.8 8.79 -0.18 6000 15.5 8.18 -0.17 7000 15.3 7.67 -0.14
Experimental Data T = 3000 K
E/N K - 2 Vd -
3.00 21.5 1.73 5.00 21.4 2.88 8.00 21.2 4.56 10.0 21.1 5.67 12.0 20.8 6.71 15.0 20.5 8.26 20.0 19.8 10.6 25.0 19.2 12.9 30.0 18.6 15.0 40.0 17.5 18.8 50.0 16.6 22.3 60.0 15.8 25.5 70.0 15.1 28.4 80.0 14.4 31.0 90.0 13.9 33.6
100 13.3 35.7
Reference: 10
Derived Quantities
T eff Ko(0) n(',') wff --
300 21.5 26.4 -0.15 350 21.0 25.0 -0.17 400 20.5 23.9 -0.18 500 19.7 22.3 -0.19 600 19.0 21.1 -0.21 700 18.4 20.2 -0.22 800 17.8 19.5 -0.22
1000 16.9 18.4 -0.24 1200 16.2 17.5 -0.26 1500 15.3 16.6 -0.28 1800 14.5 16.0 -0.29 2000 14.0 15.7 -0.30 2400 13.3 15.1 -0.32
Accuracy: The total error in the experimental data is believed not to exceed +_ 7%.
Accuracy: The total error in the experimental data is believed not to exceed +_ 7%.
OH- - He O3 - He
Experimental Data T = 300' K
Derived Quantities Experimental Data T = 300° K
Derived Quantities
E/N K - 2 3 T eff K (0) &"l) wf 0 - K EL!!! 0 3
T eff K (0) &')wff 0 -
7.00 24.5 4.611 350 10.0 24.1 6.48 400 15.0 23.3 9.3!) 500 20.0 22.4 12.0 600 30.0 20.9 16.8 800 40.0 19.6 21.1 1000 60.0 i7.7 28.5 80.0 16.4 35..3
100 15.3 41.1 120 14.4 46.4 140 13.7 51.!j
1500 2000 3000 4000 5000
24.3 22.6 23.6 21.8 22.6 20.4 21.8 19.3 20.5 17.7 19.6 16.6 18.0 14.8 16.8 13.7 15.3 12.3 14.2 11.5 13.4 10.9
-0.21 -0.21 -0.21 -0.21 -0.21 -0.21 -0.22 -0.24 -0.25 -0.26 -0.27
3.00 18.6 1.50 5.00 18.6 2.50 8.00 18.3 3.93 10.0 18.2 4.89 12.0 18.0 5.80 15.0 17.8 7.17 20.0 17.3 9.30 25.0 16.7 11.2 30.0 16.2 13.1 40.0 15.3 16.4 50.0 14.5 19.5 60.0 13.8 22.2
300 18.6 29.9 -0.23 350 18.0 28.6 -0.21 400 17.5 27.5 -0.22 450 17.1 26.6 -0.22 500 16.7 25.8 -0.22 600 16.1 24.4 -0.23 700 15.5 23.5 -0.24 800 15.0 22.7 -0.25 900 14.5 22.1 -0.27
1000 14.1 21.6 -0.28 1100 13.7 21.2 -0.29
Reference: 21 Reference: 10
Accuracy: The total error in the experimental data is believed not to exceed +_ 7%. Accuracy: The total error in the experimental
data is believed not to exceed F 7%.
See page 182 for Explanation of Tables
191
TABLES. Negative Ions in Helium
co; - He NO; - He
Experimental Data T = 3000 K
Derived Quantities Experimental Data T = 300° K
Derived Quantities
T eff Ko(o) n(l,l) :::T>f
300 16.9 32.7 -0.38 350 16.1 31.7 -0.23 400 15.7 30.4 -0.21
E/N K - 0 3 E/N K
0
2.00 16.9 5.00 16.7 8.00 16.5 10.0 16.3 12.0 16.2 15.0 16.0 20.0 15.6 25.0 15.2 30.0 14.8 40.0 14.0 50.0 13.3 60.0 12.7 70.0 12.2 80.0 11.7 90.0 11.3
100 10.9 110 10.6 120 10.2
Vd -
0.908 2.24 3.55 4.38 5.22 6.45 8.38 10.2 11.9 15.0 17.9 20.5 22.9 25.2 27.3 29.3 31.3 32.9
4.00 18.6 2.00 7.00 18.4 3.46 10.0 18.3 4.92 12.0 18.2 5.87 15.0 17.9 7.21 20.0 17.4 9.35 25.0 16.9 11.4 30.0 16.4 13.2
300 18.6 29.9 -0.16 350 18.1 28.5 -0.18 400 17.7 27.3 -0.20 450 17.3 26.3 -0.20 500 17.0 25.4 -0.20
450 15.3 29.4 -0.22 500 14.9 28.7 -0.23 600 14.3 27.3 -0.24 600 16.3 24.2 -0.22
700 15.7 23.2 -0.24 800 15.2 22.4 -0.25
1000 14.4 21.2 -0.26 1200 13.7 20.3 -0.26 1500 13.0 19.2 -0.25 1800 12.4 18.3 -0.27 2000 12.0 18.0 -0.26 2500 11.4 16.9 -0.26
700 13.8 26.2 -0.24 800 13.3 25.4 -0.25
1000 12.5 24.2 -0.27 40.0 15.5 16.7 50.0 14.8 19.9 60.0 14.0 22.6
1200 12.0 23.0 -0.27 1400 11.5 22.2 -0.28 1600 11.0 21.7 -0.28 1800 10.7 21.1 -0.29 2000 10.3 20.7 -0.30
70.0 13.4 25.2 80.0 12.9 27.7 90.0 12.5 30.2
100 12.1 32.5 110 11.7 34.6 120 11.4 36.8
Reference: 10 Reference: 10
Accuracy: The total error in the experimental data is believed not to exceed +_ 7%. Accuracy: The total error in the experimental
data is believed not to exceed + 7%.
C2H2 - He S02F- - He
Experimental Data T = 3000 K
Derived Quantities Experimental Data T = 3000 K
E/N K. Vd - -
3.00 14.9 1.20 5.00 14.9 2.00 8.00 14.8 3.18 10.0 14.8 3.98 12.0 14.7 4.74 15.0 14.6 5.88 20.0 14.3 7.68 25.0 14.0 9.40 30.0 13.6 11.0 35.0 13.2 12.4 40.0 12.9 13.9 50.0 12.2 16.4 60.0 11.6 18.7 70.0 11.1 20.9
Reference: 10
Derived Quantities
T eff K (0) &"l) :::TKo 0 - eff E/N K - 0 "3
5.00 17.4 2.34 7.00 17.3 3.25 10.0 17.2 4.62 12.0 17.0 5.48 15.0 16.8 6.77 20.0 16.3 8.76 25.0 15.8 10.6 30.0 15.4 12.4 35.0 14.9 14.0 40.0 14.5 15.6 50.0 13.8 18.5 900 13.6 24.4 -0.30 60.0 13.1 21.1 1000 13.1 24.0 -0.36 70.0 12.3 23.1 1100 12.6 23.8 -0.46
300 17.5 32.8 -0.18 325 17.2 32.1 -0.19 350 17.0 31.3 -0.20 400 16.5 30.1 -0.21 450 16.1 29.1 -0.22 500 15.7 28.3 -0.23 550 15.4 27.5 -0.24 600 15.1 26.9 -0.24 700 14.5 25.9 -0.26 800 14.0 25.1 -0.27
T eff K (0) fi(l'l) :::TKo 0 __ eff
300 14.9 36.7 -0.11 325 14.8 35.5 -0.12 350 14.6 34.7 -0.16 400 14.3 33.1 -0.19 450 13.9 32.1 -0.22 500 13.6 31.2 -0.24 550 13.3 30.4 -0.25 600 13.0 29.8 -0.27 700 12.4 28.9 -0.30 &iO 11.9 28.1 -0.33 900 11.5 27.5 -0.35
1000 11.0 27.2 -0.36
Reference: 10
Accuracy: The total error in the experimental data is believed not to exceed + 7%.
Accuracy: The total error in the experimental data is believed not to exceed A 7%.
See page 182 for Explanation of Tables
192

ELLIS, PAI. MCDANIEL, MASON,and VIEHLAND Transport Properties of Gaseous ions
TABLES. Ions in Helium. Neon
so; - He -- ~-
SF; - He
Experimental Data T = 300' K
Derived Quantities Experimental Data T = 300' K-
Derived Quantities
T eff Ko(o) il(l'l) :::T>f ‘I eff Ko(0) ~(~'1) :::T>f E/N K Vd 2 - E/N K. - - “3
300 15.4 35.6 -0.24 350 14.8 34.2 -0.24 400 14.4 32.9 -0.24 450 14.0 31.9 -0.24 500 13.6 31.2 -0.24 600 13.0 29.8 -0.25 700 12.5 28.7 -0.26 800 12.1 27.7 -0.26
1000 11.4 26.3 -0.27 1200 10.9 25.1 -0.28 1400 10.4 24.4 -0.29 1600 10.0 23.7 -0.29 1800 9.7 23.0 -0.29
4.00 15.4 1.66 7.00 15.3 2.88 10.0 15.1 4.06 12.0 15.0 4.84 15.0 14.8 5.97 20.0 14.5 7.79 25.0 14.1 9.47 30.0 13.8 11.1
2.00 12.9 0.693 4.00 12.8 1.38 7.00 12.7 2.39 10.0 12.6 3.39 12.0 12.4 4.00 15.0 12.3 4.96
300 12.9 42.0 -0.44 325 12.5 41.6 -0.34 350 12.2 41.1 -0.27 400 11.8 39.7 -0.28 450 11.4 38.8 -0.27 500 11.1 37.8 -0.28 550 10.8 37.0 -0.28 600 10.5 36.5 -0.28
20.0 12.i 6.50 25.0 11.8 7.93 40.0 13.0 14.0
50.0 12.3 16.5 60.0 11.8 19.0 70.0 11.3 21.3 80.0 10.9 23.4 90.0 10.6 25.6
100 10.2 27.4 110 9.9 29.3 120 9.6 31.0
30.0 11.5 9.27 35.0 11.2 10.5 40.0 11.0 11.8 50.0 10.5 14.1 60.0 10.0 16.1 70.0 9.6 18.1 80.0 9.2 19.8
700 10.1 35.1 -0.29 800 9.7 34.2 -0.30 900 9.3 33.6 -0.30
1000 9.0 33.0 -0.31
Reference: 10 Reference: 10
Accuracy: The total error in the experimental data is believed not to exceed +_ 7%. Accuracy: The total error in the experimental
data is believed not to exceed t 7%.
SF; - He Ne: - Ne
Experimental Data T = 300° K
Derived Quantities Experimental Data T = 300° K
Derived Quantities
E/N K Vd T _ -2 - K (0) &lJ1) wf eff 0 __ E/N K
- - 0 3 T K (0) &l) :::T'o eff 0 __ eff --
10.0 13.1 3.52 325 13.0 40.1 -0.30 12.0 13.0 4.19 350 12.7 39.6 -0.27 15.0 12.8 5.16 400 12.3 38.2 -0.24 20.0 12.6 6.77 450 12.0 36.9 -0.22 25.0 12.3 8.26 500 11.7 35.9 -0.23 30.0 12.0 9.67 550 11.5 34.8 -0.24 35.0 11.8 11.1 600 11.2 34.3 -0.25 40.0 11.5 12.4 700 10.8 32.9 -0.28 50.0 11.0 14.8 800 10.4 32.0 -0.31 60.0 10.5 16.9 900 10.0 31.3 -0.33 70.0 10.1 19.0 1000 9.6 31.0 -0.33 80.0 9.7 20.9
6.00 6.16 0.993 7.00 6.17 1.16
300 350 400 500 600 700 800
1000 1200
E 1800
6.13 47.5 6.40 42.1 t 6.54 38.6 0
6.71 33.6 6.80 30.3 : 6.84 27.9 0 6.85 26.0 -0
8.00 6.20 10.0 6.26 12.0 6.32 15.0 6.42
1.33 1.68 2.04 2.59
20.0 6.56 3.53 25.0 6.66 4.47 30.0 6.74 5.43
7.34 9.19 10.6 11.9 13.0
6.77 23.6 -0.11 6.58 22.1 -0.17 6.38 21.1 -0.24 6.16 20.5 -0.27 5.97 19.9 -0.26
40.0 6.83 50.0 6.84 60.0 6.58 70.0 6.31 80.0 6.05 Reference: 10
Reference: 5 Accuracy: The total error in the experimental data is believed not to exceed + 7%.
Accuracy: The total error in the experimental data is believed not to exceed + 1%. -
See page 182 for Explanation of Tables
193
ELLIS, PAI, MCDANIEL, MASON,and VIEHLAND Transport Properties of Gaseous Ion>
TABLES. Ions in Neon
H+ - Ne Li+ - Ne
Experimental Data T = 300° K
Derived Quantities Experimental Data T = 300' K
E/N K. vd - - -
3.00 10.7 0.863 4.00 10.7 1.15 6.00 10.7 1.73 8.00 10.8 2.32 10.0 11.0 2.96 12.0 11.2 3.61 15.0 11.8 4.76 20.0 12.8 6.88 25.0 13.8 9.72 30.0 14.5 11.7 40.0 15.1 16.2 50.0 15.0 20.2 60.0 14.9 24.0 80.0 14.5 31.2
100 14.0 37.6 120 13.5 43.5
Derived Quantities
T eff K (0) ~(1~1) eff 0 - K (0) n(',') wff 0 - E/N K - 2 Vd -
3.00 22.2 1.79 4.00 22.1 2.38 5.00 22.0 2.96
T eff
300 10.6 44.2 0.30 400 11.4 35.6 0.27 500 12.0 30.3 0.24 600 12.5 26.5 0.22 800 13.2 21.7 0.18
1000 13.7 18.7 0.16 1200 14.1 16.6 0.14
325 22.2 47.4 -0.05 350 22.1 45.9 -0.05 400 21.9 43.3 -0.06 450 21.8 41.0 -0.06 500 21.6 39.3 -0.07 600 21.3 36.3 -0.08
6.00 22.0 3.55 7.00 21.8 4.10 8.00 21.7 4.66 10.0 21.4 5.75 12.0 21.1 6.80 14.0 20.8 7.82 16.0 20.4 8.77 17.0 20.1 9.18
700 21.1 34.0 -0.09 800 20.8 32.2 -0.11 900 20.5 30.8 -0.15
1000 20.1 29.8 -0.20
1500 14.5 14.5 0.12 2000 14.9 12.2 0.08 2500 15.1 10.8 0.05 3000 15.2 9.75 0.02 4000 15.1 8.50 -0.04 5000 15.0 7.65 -0.06 Reference: 28 6000 14.8 7.08 -0.07 8000 14.4 6.30 -0.09
10000 14.1 5.76 -0.10 12000 13.9 5.33 -0.11 15000 13.5 4.91 -0.13
Accuracy: The total error in the experimental data is believed not to exceed f 3%.
Reference: 1
Accuracy: The total error in the experimental data is believed not to exceed +_2%.
Rb+ - Ne
Experimental Data T = 3000 K
Derived Quantities
Na+ - Ne
T eff K (0) n("l) eff 0 - E/N K - 0
0.524 0.873
1.23 1.76 2.66 3.58 4.51 5.44 7.23 8.95 10.5 13.2 15.6 17.8 21.0 25.7 29.9 33.7 40.4 46.4
Experimental Data T = 300° K
Derived Quantities
3.00 6.50 5.00 6.50 7.00 6.53 10.0 6.55 15.0 6.60 20.0 6.66 25.0 6.72 30.0 6.75 40.0 6.73 50.0 6.66
300 6.50 40.7 0.13 350 6.59 37.2 0.09 400 6.66 34.4 0.06
E/N K Vd T - 0 eff - - Ko(O) SI(~'~) %:T>f
500 6.72 30.5 0.03 600 6.75 27.7 0.01 700 6.74 25.7 -0.02 800 6.71 24.1 -0.04
1000 6.62 21.9 -0.07 1200 6.51 20.3 -0.11
4.00 8.25 0.887 300 400 500 600 800
1000 1200
8.16 39.9 8.69 32.5 9.02 28.0 9.23 25.0 9.48 21.0 9.61 18.6 9.65 16.9 9.64 15.1 9.53 13.2 "9.;; it.;
8:90 1O:O 8.58 9.30 a.29 a.79 7.77 8.12 7.32 7.71 6.92 7.45
0.25 0.19 6.00 8.25 1.33
8.00 8.27 1.78 10.0 a.34 2.24 12.0 8.43 2.72 15.0 8.58 3.46 20.0 8.87 4.77
0.15 0.12 0.07 0.04 0.01
-0.02 -0.05 -0.09 -0.11 -0.14 -0.18 -0.21 -0.25 -0.29 -0.32
1500 6.30 18.8 -0.18 2000 5.96 17.2 -0.19 2500 5.70 16.1 -0.21 3000 5.49 15.2 -0.21
60.0 6.51 80.0 6.12
100 5.79 120 5.53 150 5.20 200 4.78 250 4.45 300 4.18 400 3.76 500 3.45
25.0 9.19 6.17 1500 30.0 9.46 7.63 2000 40.0 9.67 10.4 2500 50.0 9.62 12.9 3000 60.0 9.48 15.3 4000 80.0 9.12 19.6 5000
100 8.68 23.3 6000 120 8.26 26.6 8000
4000 5.16 14.0 -0.22 5000 4.90 13.2 -0.24 6000 4.69 12.6 -0.24 8000 4.36 11.7 -0.27
10000 4.10 11.2 -0.28 12000 3.89 10.8 -0.30 15000 3.63 10.3 -0.32 150 7.65 30.8 10000
200 7.02 37.7 12000 Reference: 33
Reference: 1 Accuracy: The total error in the experimental
data is believed not to exceed + 2%. - Accuracy: The total error in the experimental data is believed not to exceed + 2%.
See page 182 for Explanation of Tables
194
ELLIS, PAL MCDANIEL, MASON. and VIEHLAND Trarnport Properties of Gaseous Ions
TABLES. Ions in Neon
Ne+ - Ne K+ - Ne
Experimental Data T = 300' K
Derived Quantities Experimental Data T = 3000 K
Derived Quantities
sF,l) Wf, T eif K (0) &l) &$o& 0 - E/N - K
0 T eff K (0) o E/N K
0 22
6.00 8.00 10.0 12.0
4.07 4.05 4.04 4.02 3.98 3.91 3.84 3.76
0.656 300 4.08 350 3.84 400 3.67 500 3.40 600 3.21
82.5 -0.36 81.1 -0.37
2.00 7.45 0.400 4.00 7.45 0.801 6.00 7.45 1.20 8.00 7.45 1.60 10.0 7.46 2.00 1.2.0 7.49 2.42 15.0 7.56 3.05 20.0 7.67 4.12 25.0 7.78 5.23 30.0 7.83 6.31 35.0 7.82 7.35 40.0 7.81 8.39 50.0 7.69 10.3
300 7.43 39.5 0.10 400 7.62 33.3 0.08 500 7.75 29.3 0.07 600 7.82 26.5 0.04 800 7.84 22.9 -0.02
1000 7.78 20.6 -0.05
0.871 1.09 1.30
79.4 -0.36 76.6 -0.32
15.0 20.0 25.0
1.60 2.10 2.58 3.03 3.88 4.68 5.40
74.1 70.3
-0.32 -0.31
67.5 -0.32 65.2 -0.33
1500 2.40
800 2.93
2000 2.18 2500 2.01
1000 2.73
3000 1.89 4000 1.69 5000 1.53
1200 2.58
6000 1.41 8000 1.24
10000 1.10 12000 1.00 15000 0.87
1200 7.69 19.1 -0.08 1500 7.53 17.4 -0.11 1800 7.36 16.3 -0.14
30.0 40.0 3.61 50.0 3.48 60.0 3.35
62.7 -0.34 59.8 -0.34 58.0 -0.37 56.3 -0.37 54.5 -0.41 53.9 -0.41
2000 2500 3000 3500 4000 5000 6000 8000
7.25 15.7 -0.15 6.98 14.6 -0.18 6.72 13.8 -0.23 6.48 13.2 -0.24
80.0 100 120
3.13 2.96 2.81 2.61
6.73 7.95 9.06 60.0 7.50 12.1
80.0 7.10 15.3 100 6.72 18.1 120 6.41 20.7 150 6.01 24.2 200 5.47 29.4
6.28 12.8 -0.24 5.94 12.1 -0.24 150
200 250 300 400 500
10.5 12.7 14.6 16.3 19.3 21.9
53.3 -0.47 52.5 -0.51 53.0 -0.53 53.2 -0.61 54.7 -0.70
2.36 2.17
5.70 11.5 -0.23 5.40 10.5 -0.16
2.02 1.80 1.63 1.51 1.32 1.19 1.09 0.99
600 800
1000
24.3 28.4 32.0 35.1 39.9
Reference: 17
1200 1500
Accuracy: The total error in the experimental data is believed not to exceed t 2%.
Reference: 15 and 5
Accuracy: The total error in the experimental data is believed not to exceed + 1% for E/N 2 60 Td. and +_ 3% for ETN > 60 Td.
Hg+ - Ne
Experimental Data T = 300' K
Derived Quantities D+ - Ne
Experimental Data T = 300' K
Derived Quantities E/N K Vd T - 0 - eff K (0) R(l'l) $&& 0 __
T eff K (0) &'l) wff 0 - 9.00 5.96 1.44 325 5.97 40.1 0.06 10.0 5.96 1.60 350 5.99 38.6 0.04
E/N K - Vd -2 - 12.0 5.97 1.92 400 6.00 36.0 0.01 15.0 5.98 2.41 450 6.00 33.9 -0.01 20.0 6.00 3.22 500 5.98 32.3 -0.03 25.0 6.00 4.03 550 5.96 30.9 -0.04
4.00 16.1 1.73 5.00 16.1 2.16 6.00 16.1 2.60 7.00 16.0 3.01 8.00 16.0 3.44 10.0 15.9 4.27 12.0 15.7 5.06 14.0 15.5 5.83 16.0 15.3 6.58 17.0 15.2 6.94
325 16.1 47.3 -0.04 350 16.0 45.8 -0.04 400 16.0 42.9 -0.05 450 15.9 40.7 -0.06 500 15.7 39.1 -0.07 600 15.5 36.1 -0.11 700 15.2 34.1 -0.18
30.0 5.98 4.82 600 5.94 29.7 -0.06 35.0 5.95 5.60 700 5.88 27.8 -0.08 40.0 5.91 6.35 800 5.81 26.3 -0.09 45.0 5.87 7.10 900 5.75 25.0 -0.16 50.0 5.81 7.81 55.0 5.76 8.51
Reference: 8 Reference: 28
Accuracy: The total error in the experimental data is believed not to exceed 2 4%. Accuracy: The total error in the experimental
data i.s believed not to exceed -!-3%. -
See page 181 for Explanation of Tables
195
ELLIS. PAI. MCDANIEL. MASON. and VIEHLAND
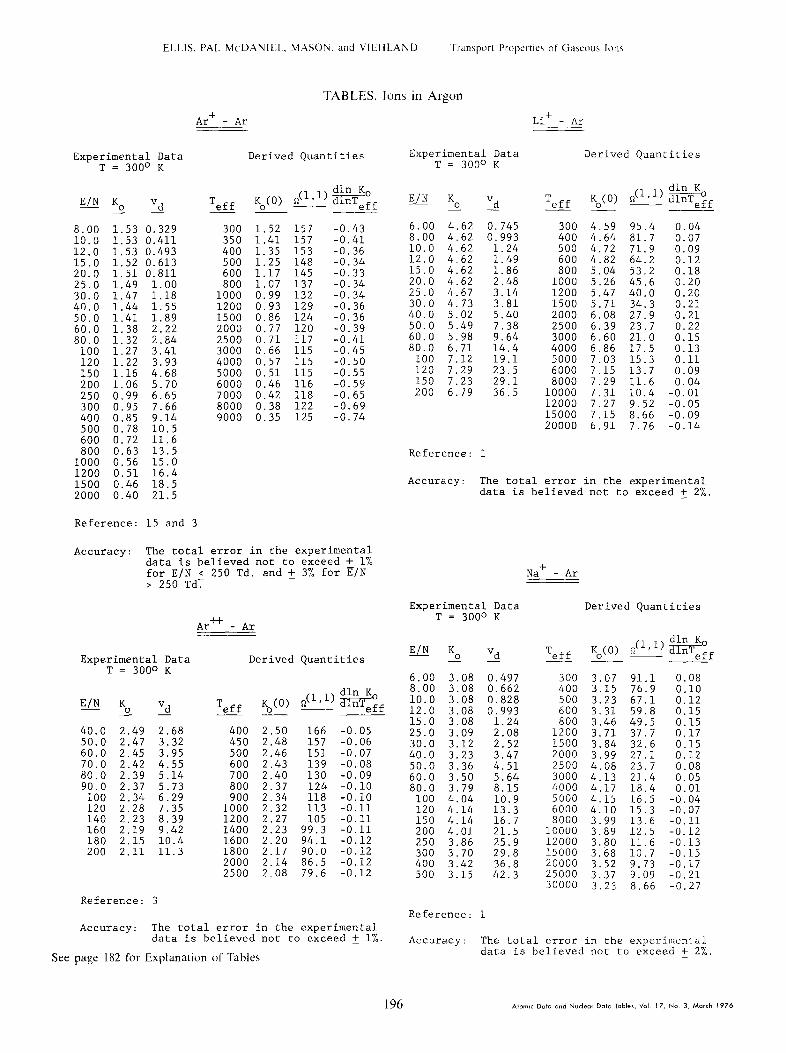
TABLES. Ions in Argon
Ar+ - Ar Li+ - Ar
Experimental Data T = 300° K
Derived Quantities Experimental Data T = 300° K
Derived Quantities
T eff Ko(0) ,(l,l) :::T>f
-- E/N K. "d
T eff K (0) &,l) $&+
- 0 - eff E/N K
0 “d 6.00 4.62 0.745 8.00 4.62 0.993 10.0 4.62 1.24 12.0 4.62 1.49 15.0 4.62 1.86 20.0 4.62 2.48 25.0 4.67 3.14 30.0 4.73 3.81 40.0 5.02 5.40 50.0 5.49 7.38 60.0 5.98 9.64 80.0 6.71 14.4
100 7.12 19.1 120 7.29 23.5 150 7.23 29.1 200 6.79 36.5
8.00 1.53 10.0 1.53 12.0 1.53 15.0 1.52 20.0 1.51 25.0 1.49 30.0 1.47 40.0 1.44 50.0 1.41 60.0 1.38 80.0 1.32
100 1.27 120 1.22 150 1.16 200 1.06 250 0.99 300 0.95 400 0.85 500 0.78 600 0.72 800 0.63
1000 0.56 1200 0.51 1500 0.46 2000 0.40
0.329 0.411 0.493 0.613 0.811
1.00 1.18 1.55 1.89 2.22 2.84 3.41 3.93 4.68 5.70 6.65 7.66 9.14 10.5 11.6 13.5
300 1.52 157 -0.43 350 1.41 157 -0.41 400 1.35 153 -0.36 500 1.25 148 -0.34 600 1.17 145 -0.33 800 1.07 137 -0.34
1000 0.99 132 -0.34 1200 0.93 129 -0.36 1500 0.86 124 -0.36 2000 0.77 120 -0.39 2500 0.71 117 -0.41 3000 0.66 115 -0.45 4000 0.57 115 -0.50 5000 0.51 115 -0.55 6000 0.46 116 -0.59 7000 0.42 118 -0.65 8000 0.38 122 -0.69 9000 0.35 125 -0.74
300 4.59 95.4 0.04 400 4.64 81.7 0.07 500 4.72 71.9 0.09 600 4.82 64.2 0.12 800 5.04 53.2 0.18
1000 5.26 45.6 0.20 1200 5.47 40.0 0.20 1500 5.71 34.3 0.21 2000 6.08 27.9 0.21 2500 6.39 23.7 0.22 3000 6.60 21.0 0.15 4000 6.86 17.5 0.13 5000 7.03 15.3 0.11 6000 7.15 13.7 0.09 8000 7.29 11.6 0.04
10000 7.31 10.4 -0.01 12000 7.27 9.52 -0.05 15000 7.15 8.66 -0.09 20000 6.91 7.76 -0.14
Reference: 1
Accuracy: The total error in the experimental data is believed not to exceed +_ 2%
15.0 16.4 18.5 21.5
Reference: 15 and 3
Accuracy: The total error in the experimental data is believed not to exceed + 1% for E/N c 250 Td. and + 3% for E/N > 250 Td:
- Na+ - Ar
Experimental Data T = 3000 K
Derived Quantities
Ar* - Ar
T eff Ko(0) ,(',') eff -__
E/N K - Vd 0 - Experimental Data T = 3000 K
Derived Quantities
6.00 3.08 0.497 8.00 3.08 0.662 10.0 3.08 0.828 12.0 3.08 0.993 15.0 3.08 1.24 25.0 3.09 2.08
300 3.07 91.1 0.08 400 3.15 76.9 0.10 500 3.23 67.1 0.12 600 3.31 59.8 0.15 800 3.46 49.5 0.15
1200 3.71 37.7 0.17 1500 3.84 32.6 0.15 2000 3.99 27.1 0.12 2500 4.08 23.7 0.08 3000 4.13 21.4 0.05 4000 4.17 18.4 0.01 5000 4.15 16.5 -0.04 6000 4.10 15.3 -0.07 8000 3.99 13.6 -0.11
10000 3.89 12.5 -0.12 12000 3.80 11.6 -0.13 15000 3.68 10.7 -0.15 20000 3.52 9.73 -0.17 25000 3.37 9.09 -0.21 30000 3.23 8.66 -0.27
E/N K - 0 “d T K (0) eff 0
400 2.50 450 2.48 500 2.46 600 2.43 700 2.40 800 2.37
166 -0.05 157 -0.06 151 -0.07
40.0 2.49 50.0 2.47 60.0 2.45 70.0 2.42 80.0 2.39 90.0 2.37
2.68 3.32 3.95
30.0 3.12 2.52 40.0 3.23 3.47 50.0 3.36 4.51 60.0 3.50 5.64 80.0 3.79 8.15
100 4.04 10.9 120 4.14 13.3 150 4.14 16.7
4.55 5.14 5.73
139 -0.08 130 -0.09 124 -0.10 118 -0.10 100 2.34 6.29
120 2.28 7.35 140 2.23 8.39 160 2.19 9.42
900 2.34 1000 2.32 1200 2.27 1400 2.23 1600 2.20 1800 2.17 2000 2.14 2500 2.08
113 -0.11 105 -0.11
99.3 -0.11 94.1 -0.12
200 4.01 21.5 250 3.86 25.9 300 3.70 29.8
180 2.15 10.4 200 2.11 11.3 90.0 -0.12
86.5 -0.12 79.6 -0.12
400 3.42 36.8 500 3.15 42.3
Reference: 3 Reference: 1
Accuracy: The total error in the experimental data is believed not to exceed + 1%.
See page 182 for Explanation of Tables Accuracy: The total error in the experimental
data is believed not to exceed + 2%. -
196

ELLIS, PAI. MCDANIEL. MASON. 2nd VIEHLAND Transport Properties of Gaseous Ions
TABLES. Ions in Argon
K+ - Ar Rb+ - Ar
Experimental Data T = 300' K
Derived Quantities Experimental Data T = 300' K
Derived Quantities
E/N K Vd T -2 - eff K(0) ,(l'l)eff 0 ~ E/N K. vd _
- - T eff
K (0) &l'l) !::TKo __ o- eff
1.00 2.66 0.071
10.0 2.66 0.715
2.00 2.66 0.143
12.0 2.67 0.861
4.00 2.66 0.286 6.00 2.66 0.429
15.0 2.68
8.00 2.66 0.572
1.08
300 2.67 90.1 0.05 400 2.74 76.0 0.13 500 2.85 65.4 0.21
2.00 2.26 0.121 300 2.26 PO.7 0.10 4.00 2.26 0.243 350 2.30 82.5 0.10 7.00 2.26 0.425 400 2.33 76.2 0.10 10.0 2.26 0.607 500 2.38 66.7 0.10 600 2.96 57.4 0.17
800 3.09 47.7 0.14 1000 3.18 41.4 0.11
li:O 2.26 0.911 20.0 2.27 1.22
600 2.12 59.9 0.09 800 2.49 50.4 0.09
1000 2.54 44.2 0.08 1200 2.58 39.7 0.09 1500 2.62 35.0 0.08 20.0 2.70 1.45
25.0 2.72 1.83 30.0 2.74 2.21 40.0 2.80 3.01 50.0 2.90 3.90 60.0 3.02 4.87 80.0 3.18 6.84
100 3.29 8.84 120 3.31 10.7 150 3.24 13.1 200 3.09 16.6 250 2.96 19.9 300 2.84 22.9 400 2.62 28.2 500 2.43 32.6
2000 3.32 28.1 -0.01 2500 3.28 25.4 -0.06
1200 3.23 37.2
3000 3.24 23.5 -0.07 3500 3.21 21.9 -0.08
0.08
4000 3.18 20.7 -0.09 5000 3.10 19.0 -0.13
1500 3.29 32.7
6000 3.03 17.7 -0.14
0.06 1800 3.31 29.7
8000 2.90 16.1 -0.16 10000 2.79 14.9 -0.19
0.02
12000 2.69 14.1 -0.20 15000 2.57 13.2 -0.22 18000 2.47 12.6 -0.23 20000 2.41 12.2 -0.25
25.0 2.28 1.53 30.0 2.29 1.85 40.0 2.32 2.49 50.0 2.36 3.17 60.0 2.41 3.89 80.0 2.49 5.35
100 2.56 6.88 120 2.63 8.48 150 2.67 10.8 200 2.58 13.9 250 2.47 16.6 300 2.38 19.2 350 2.28 21.4 400 2.20 23.6 500 2.05 27.5
2000 2.67 29.7 0.03 2500 2.66 26.7 -0.06 3000 2.62 24.7 -0.09 3500 2.58 23.3 -0.11 4000 2.54 22.1 -0.12 5000 2.47 20.3 -0.15 6000 2.40 19.1 -0.17 7000 2.33 18.2 -0.19 8000 2.27 17.5 -0.22
10000 2.15 16.5 -0.26 12000 2.04 15.9 -0.30
Reference: 33 600 2.32 37.4
Accuracy: The total error in the experimental data is believed not to exceed +_ 2%.
Reference: 16, 9 and 30
Accuracy: The total error in the experimental data is believed not to exceed +_ 2%.
0+ - Ar
Experimental Data T = 300° K
Derived Quantities
Hg+ - Ar
T eff K (0) c$"~) :::TKo 0 - eff - - E/N - KO -
3.43 3.42 3.42 3.42 3.41 3.40 3.39 3.38 3.36 3.34 3.30 3.26 3.22 3.19 3.17 3.22 3.34 3.62 3.82
Vd -
0.461 0.551 0.643 0.735 0.916
1.10 1.37 1.82 2.26 2.69 3.55 4.38 5.19 6.86 8.52 10.4 13.5 19.5 25.7
Experimental Data T = 300' K
Derived Quantities
5.00 6.00 7.00 8.00 10.0 12.0 15.0 20.0 25.0 30.0 40.0 50.0 60.0 80.0
100 120 150 200 250
300 3.43 73.9 -0.10 400 3.35 65.5 -0.07 500 3.30 59.5 -0.07 600 3.26 55.0 -0.06 800 3.21 48.4 -0.05
1000 3.18 43.7 -0.03 1200 3.17 40.0 -0.01 1500 3.17 35.8 0.02 2000 3.22 30.5 0.07 2500 3.28 26.8 0.09 3000 3.33 24.1 0.10
E/N K. vd T eff K (0) 52(111) :::TKo - 0 - eff - - __-
35.0 1.85 1.74 350 1.85 92.7 -0.08 40.0 1.84 1.98 400 1.83 87.6 -0.04 50.0 1.83 2.46 450 1.83 82.6 0.01 60.0 1.83 2.95 500 1.84 77.9 0.03 70.0 1.84 3.46 600 1.85 70.8 0.05 80.0 1.84 1.96 700 1.87 64.8 0.07 90.0 1.86 4.50 800 1.89 60.0 0.08
100 1.87 5.02 1000 1.93 52.5 0.11 4000 3.45 20.1 0.12 5000 3.55 17.5 0.13 6000 3.63 15.6 0.12 7000 3.70 14.2 0.11
120 1.91 6.16 1200 1.97 47.0 0.13 140 1.96 7.37 1400 2.01 42.6 0.13 160 2.03 8.73 1600 2.05 39.1 0.14 180 2.11 10.2 1800 2.08 36.3 0.15
2000 2.11 34.0 0.15 2100 2.13 32.9 0.16
8000 3.75 13.1 0.09 10000 3.81 11.5 0.07
Reference: 8 Reference: 10
Accuracy: The total error in the experimental data is believed not to exceed + 4%. -
Accuracy: The total error in the experimental data is believed not to exceed +_ 7%.
See page 182 for Explanation of Tables
197
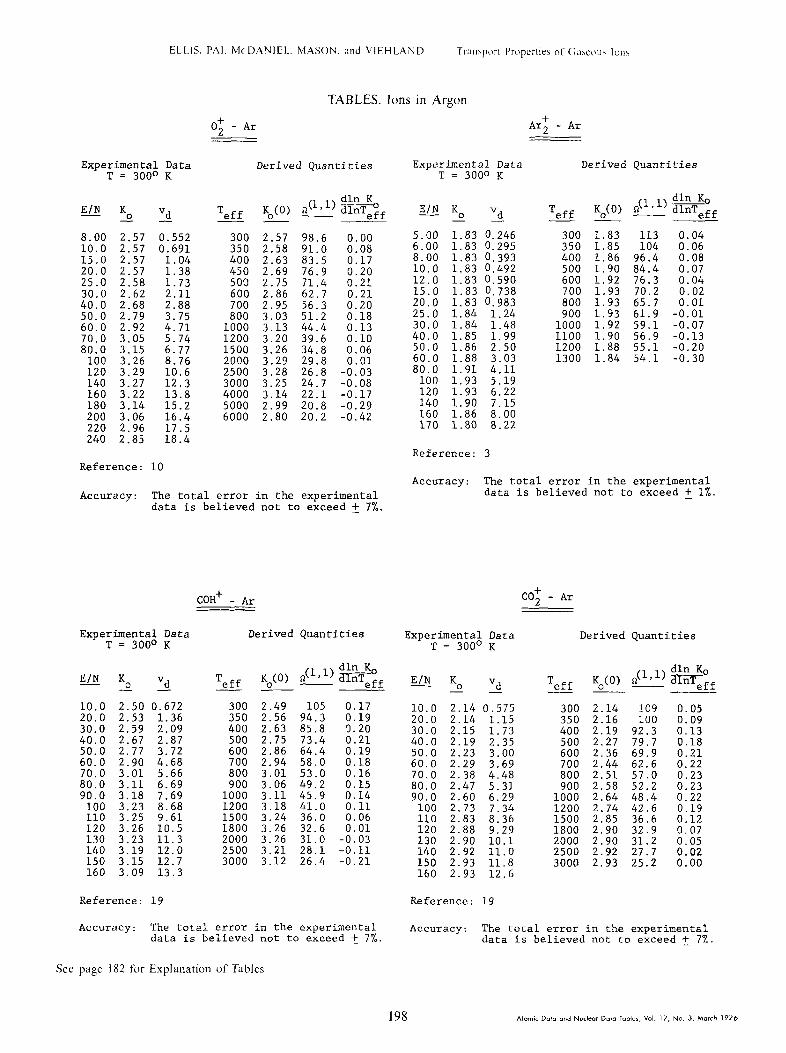
TABLES. Ions in Argon
- AI-
Experimental Data Derived Quantities T = 3000 K
Of 2 - Ar
Experimental Data T = 300° K
Derived Quantities
dln K n(l,l) dlnTeOff I E/N K. vd T eff
K (0) ~(~9~) w 0 - eff - -
E/N K - 2 - "d T eff Ko(o>
300 2.57 350 2.58 400 2.63 450 2.69 500 2.75 600 2.86 700 2.95 800 3.03
1000 3.13 1200 3.20 1500 3.26 2000 3.29 2500 3.28 3000 3.25 4000 3.14 5000 2.99 6000 2.80
5.00 1.83 0.246 300 1 6.00 1.83 0.295 350 1 8.00 1.83 0.393 400 1 10.0 1.83 0.492 500 1 12.0 1.83 0.590 600 1 15.0 1.83 0.738 700 1 20.0 1.83 0.983 800 1
113 0.04 104 0.06
86 96.4 0.08 90 84.4 0.07 92 76.3 0.04 93 70.2 0.02 93 65.7 0.01
8.00 2.57 10.0 2.57
0.552 0.691
1.04 1.38 1.73 2.11 2.88 3.75 4.71 5.74 6.77 8.76 10.6 12.3 13.8 15.2 16.4 17.5 18.4
98.6 0.00 91.0 0.08 83.5 0.17 76.9 0.20
15.0 2.57 20.0 2.57 25.0 30.0 40.0 50.0 60.0 70.0
2.58 2.62 2.68 2.79 2.92 3.05
71.4 0.21 62.7 0.21 56.3 0.20 51.2 0.18 44.4 0.13 39.6 0.10
25.0 1.84 1.24 900 1.93 61.9 -0.01 30.0 1.84 1.48 1000 1.92 59.1 -0.07 40.0 1.85 1.99 1100 1.90 56.9 -0.13 50.0 1.86 2.50 1200 1.88 55.1 -0.20 60.0 1.88 3.03 1300 1.84 54.1 -0.30 80.0 1.91 4.11
100 1.93 5.19 120 1.93 6.22 140 1.90 7.15 160 1.86 8.00 170 1.80 8.22
80.0 3.15 100 3.26 120 3.29
34.8 0.06 29.8 0.01 26.8 -0.03 24.7 -0.08 22.1 -0.17 20.8 -0.29 20.2 -0.42
140 160 180 200 220 240
3.27 3.22 3.14 3.06 2.96 2.85
Reference: 3 Reference: 10
Accuracy: The total error in the experimental data is believed not to exceed + 1%. Accuracy: The total error in the experimental
data is believed not to exceed +_ 7%.
COH+ - Ar CO: - Ar
Experimental Data T = 300° K
Derived Quantities Experimental Data T = 300' K
Derived Quantities
T eff Ko(0) o(l'l) &>f --
T eff K (0) &lP1) :::TKo 0 - eff -__ E/N K Vd 0 -
10.0 2.50 0.672 20.0 2.53 1.36 30.0 2.59 2.09 40.0 2.67 2.87 50.0 2.77 3.72 60.0 2.90 4.68 70.0 3.01 5.66 80.0 3.11 6.69 90.0 3.18 7.69
100 3.23 8.68 110 3.25 9.61 120 3.26 10.5 130 3.23 11.3 140 3.19 12.0 150 3.15 12.7 160 3.09 13.3
E/N K - 0 Vd - -
10.0 2.14 0.575 20.0 2.14 1.15 30.0 2.15 1.73 40.0 2.19 2.35 50.0 2.23 3.00 60.0 2.29 3.69 70.0 2.38 4.48 80.0 2.47 5.31 90.0 2.60 6.29
100 2.73 7.34 110 2.83 8.36 120 2.88 9.29 130 2.90 10.1 140 2.92 11.0 150 2.93 11.8 160 2.93 12.6
300 2.14 109 0.05 0.09 0.13 0.18 0.21 0.22 0.23 0.23 0.22 0.19 0.12 0.07 0.05 0.02 0.00
300 350 400 500 600 700 800 900
1000 1200 1500 1800 2000 2500 3000
2.49 105 0.17 2.56 94.3 0.19 2.63 85.8 3.20 2.75 73.4 0.21 2.86 64.4 0.19 2.94 58.0 0.18 3.01 53.0 0.16
350 2.16 100 400 2.19 92.3 500 2.27 79.7 600 2.36 69.9 700 2.44 62.6 800 2.51 57.0 900 2.58 52.2 5.06 49.2 0.15
3.11 45.9 0.14 3.18 41.0 0.11
1000 2.64 48.4 1200 2.74 42.6 1500 2.85 36.6 3.24 36.0 0.06
3.26 32.6 0.01 3.26 31.0 -0.03 3.21 28.1 -0.11 3.12 26.4 -0.21
1800 2.90 32.9 2000 2.90 31.2 2500 2.92 27.7 3000 2.93 25.2
Reference: 19 Reference: 19
Accuracy: The total error in the experimental data is believed not to exceed + 7%. -
See page 182 for Explanation of Tables
Accuracy: The total error in the experimental data is believed not to exceed +_ 7%.
198 Atomic Dota and Nuclear Data Tobler, Vol. 17, No. 3. March I976

ELLIS,PAI,McDANIEL,MASON, and VIEHLAND Transport Properties of Gaseous Ions
TABLES. Ions in Argon and Krypton
N2Ok - Ar 03 - Ar
Experimental Data T = 300' K
Derived Quantities Experimental Data T = 300° K
E/N K - 0 3
2.00 2.42 0.130 5.00 2.42 0.325 8.00 2.42 0.520 10.0 2.43 0.653 15.0 2.44 0.983 20.0 2.46 1.32 25.0 2.48 1.67 30.0 2.51 2.02 40.0 2.59 2.78 50.0 2.68 3.60 60.0 2.77 4.47 70.0 2.86 5.38 80.0 2.90 6.23 90.0 2.92 7.06 100 2.91 7.82 120 2.84 9.16
Reference: 10
Derived Quantities
E/N K - Vd T 0 _
K (0) n(l*l) :::TKD eff 0 - eff -___ T eff Ko(0) ~("1) :::T>f - -
20.0 2.12 2.15 2.19 2.25 2.31 2.37 2.44 2.53 2.57 2.59 2.60 2.60 2.58 2.56 2.49 2.43 2.36 2.25
1.14 300 2.10 350 2.16 400 2.21 500 2.29 600 2.36 700 2.43 800 2.49 900 2.53
1000 2.56 1200 2.59 1500 2.60 1800 2.59
111 0.19 0.18 0.18 0.17 0.16 0.16
300 2.42 94.6 0.16 325 2.46 89.4 0.18 350 2.49 85.1 0.19 400 2.56 77.4 0.22
30.0 40.0
1.73 2.35 3.02 3.72 4.46
99.5 91.0
50.0 60.0 70.0 80.0 90.0
100
78.5 69.6 62.6 57.1 53.0
450 2.62 71.3 0.20 500 2.68 66.1 0.18 600 2.76 58.6 0.16 700 2.82 53.1 0.14 800 2.87 48.8 0.11
5.25 6.12 6.91
0.15 0.14
49.7 44.8 39.9 36.6
0.12 110 120 130
7.66 8.38 9.08 9.71
0.06 0.00
900 2.90 45.6 0.07 1000 2.91 43.1 0.03 1200 2.92 39.2 -0.02 1400 2.89 36.7 -0.09 1600 2.85 34.8 -0.13 1800 2.80 33.4 -0.18
-0.11 -0.24 -0.85
140 2000 2.54 35.4 2400 2.31 35.5 150
160 170
10.3 10.7 11.1
180 190
11.4 11.5
Reference: 19 Accuracy: The total error in the experimental data is believed not to exceed 2 7%.
Accuracy: The total error in the experimental data is believed not to exceed +_ 7%.
Kr+ - Kr
Experimental Data T = 300° K
Derived Quantities co; - Ar
E/N K - 0 Vd T K (0) ~$1~1) wff eff 0 - - -- Experimental Data T = 300° K
E/N K - Vd 2 - 4.00 2.40 0.258 7.00 2.40 0.451 10.0 2.40 0.645 15.0 2.40 0.967 20.0 2.41 1.30 25.0 2.43 1.63 30.0 2.45 1.97 40.0 2.52 2.71 50.0 2.57 3.45 60.0 2.62 4.22 70.0 2.67 5.02 80.0 2.69 5.78
100 2.68 7.20 120 2.63 8.48 140 2.56 9.63 160 2.47 10.6 180 2.39 11.6
Reference: 10
Derived Quantities go" ;.;m& 0.901 350 0.823 186 -0.32
50:0 0:828 1.01 400 0.789 181 -0.32 1.11 500 0.736 174 -0.31
60.0 0.816 1.32 600 0.696 168 -0.31 70.0 0.803 1.51 800 0.635 159 -0.33 80.0 0.791 1.70 1000 0.591 153 -0.32 100 0.767 2.06 1200 0.557 148 -0.34 120 0.743 2.40 1500 0.515 143 -0.36 150 0.711 2.87 2000 0.463 138 -0.39 200 0.666 3.58 2500 0.423 135 -0.42 250 0.627 4.21 3000 0.391 134 -0.45 300 0.592 4.77 4000 0.342 132 -0.48 400 0.546 5.87 5000 0.308 131 -0.50 500 0.491 6.60 6000 0.280 132 -0.52
T eff Ko(0) n(l,') ,"::T>,
300 2.40 90.9 0.02 350 2.44 82.8 0.17 400 2.50 75.6 0.17 450 2.54 70.1 0.15 500 2.58 65.5 0.13 600 2.64 58.4 0.10 700 2.67 53.5 0.07 800 2.69 49.7 0.04
1000 2.70 44.3 -0.02 1200 2.68 40.7 -0.06 1400 2.64 38.3 -0.10 1600 2.60 36.3 -0.14 1800 2.57 34.7 -0.17 2000 2.50 33.8 -0.21 2200 2.45 32.9 -0.23 2500 2.38 31.8 -0.25
60C' 0.453 7.30 7000 0.260 800 0.398 8.56 8000 0.244
1000 0.359 9.65 10000 0.219 1200 0.329 10.6
131 -0.51 131 -0.52 131 -0.45
1500 0.294 11.8 2000 0.259 13.9 2500 0.234 15.7 3000 0.220 17.7
Reference: 6 and 35
Accuracy: The total error in the experimental Accuracy: The total error in the experimental data is believed not to exceed 2 7%. data is believed not to exceed 5 5%.
See page 182 for Explanation of Tables
199 Afom,c Data and Nuclear Doto Tables, Vol. 17, No. 3. March 1976
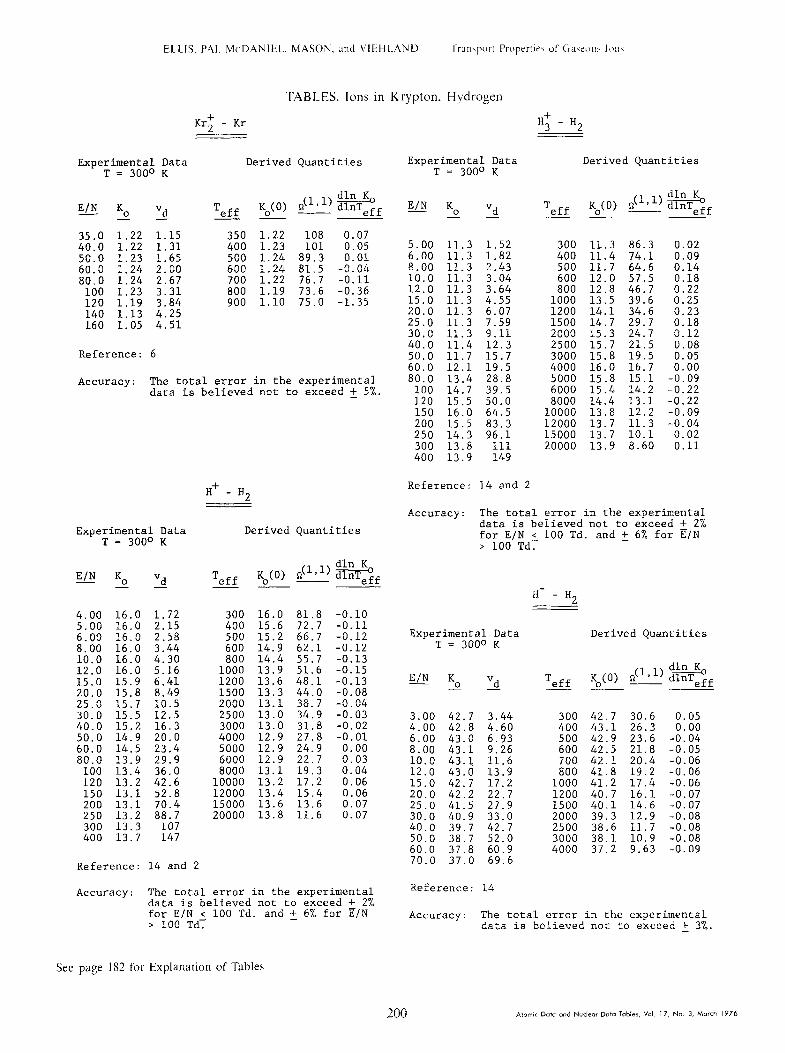
TABLES. Ions in Krypton, Hydrogen
KrT - Kr H; - H2 L
Experimental Data Derived Quantities Experimental Data T = 300° K T = 300° K
Derived Quantities
T eff K (0) ~$1'~) :kTKo 0 - eff E/N K. Vd T K (0) &'l) :::TKo - eff 0 ___ eff - -
E/N K. - Vd -
5.00 11.3 1.52 6.00 11.3 1.82 8.00 11.3 2.43 10.0 11.3 3.04 12.0 11.3 3.64 15.0 11.3 4.55 20.0 11.3 6.07 25.0 11.3 7.59 30.0 11.3 9.11 40.0 11.4 12.3 50.0 11.7 15.7 60.0 12.1 19.5 80.0 13.4 28.8
100 14.7 39.5 120 15.5 50.0 150 16.0 64.5 200 15.5 83.3 250 14.3 96.1 300 13.8 111 400 13.9 149
35.0 1.22 1.15 350 1.22 108 0 40.0 1.22 1.31 400 1.23 101 0 50.0 1.23 1.65 500 1.24 89.3 0 60.0 1.24 2.00 600 1.24 81.5 -0 80.0 1.24 2.67 700 1.22 76.7 -0
100 1.23 3.31 800 1.19 73.6 -0 120 1.19 3.84 900 1.10 75.0 -1 140 1.13 4.25 160 1.05 4.51
07 05 01 04 11
E
300 400 500 600 800
1000 1200 1500 2000 2500 3000 4000 5000 6000 8000
10000 12000 15000 20000
11.3 86.3 0.02 11.4 74.1 0.09 11.7 64.6 0.14 12.0 57.5 0.18 12.8 46.7 0.22 13.5 39.6 0.25 14.1 34.6 0.23 14.7 29.7 0.18 15.3 24.7 0.12 15.7 21.5 0.08 15.8 19.5 0.05 16.0 16.7 0.00 15.8 15.1 -0.09 15.4 14.2 -0.22 14.4 13.1 -0.22 13.8 12.2 -0.09 13.7 11.3 -0.04 13.7 10.1 0.02
Reference: 6
Accuracy: The total error in the experimental data is believed not to exceed +_ 5%.
13.9 8.60 0.11
Reference: 14 and 2 H+ - H 2
Derived Quantities
T K (0) n("') wff eff 0 - --
300 16.0 81.8 -0.10 400 15.6 72.7 -0.11 500 15.2 66.7 -0.12 600 14.9 62.1 -0.12 800 14.4 55.7 -0.13
1000 13.9 51.6 -0.15 1200 13.6 48.1 -0.13 1500 13.3 44.0 -0.08 2000 13.1 38.7 -0.04 2500 13.0 34.9 -0.03 3000 13.0 31.8 -0.02 4000 12.9 27.8 -0.01 5000 12.9 24.9 0.00 6000 12.9 22.7 0.03 8000 13.1 19.3 0.04
10000 13.2 17.2 0.06 12000 13.4 15.4 0.06 15000 13.6 13.6 0.07 20000 13.8 11.6 0.07
The total error in the exDerimenta1 data is believed not to ekeed + 2% for E/N < 100 Td. and f 6% for E/N > 100 Td:
Accuracy:
Experimental Data T = 300° K
E/N K. vd - -
4.00 16.0 1.72 5.00 16.0 2.15 6.00 16.0 2.58 8.00 16.0 3.44 10.0 16.0 4.30 12.0 16.0 5.16 15.0 15.9 6.41 20.0 15.8 8.49 25.0 15.7 10.5 30.0 15.5 12.5 40.0 15.2 16.3 50.0 14.9 20.0 60.0 14.5 23.4 80.0 13.9 29.9
100 13.4 36.0 120 13.2 42.6 150 13.1 52.8 200 13.1 70.4 250 13.2 88.7 300 13.3 107 400 13.7 147
H- - H2
Experimental Data T = 3000 K
Derived Quantities
T eff Ko(a> n(l,l> ::,nTkf E/N K - 0 va
3.00 42.7 3.44 4.00 42.8 4.60 6.00 43.0 6.93 8.00 43.1 9.26
300 400 500 600 700
42.7 30.6 0.05 43.1 26.3 0.00 42.9 23.6 -0.04 42.5 21.8 -0.05 42.1 20.4 -0.06 41.8 19.2 -0.06 41.2 17.4 -0.06 40.7 16.1 -0.07 40.1 14.6 -0.07 39.3 12.9 -0.08 38.6 11.7 -0.08 38.1 10.9 -0.08 37.2 9.63 -0.09
10.0 43.1 11.6 12.0 43.0 13.9 15.0 42.7 17.2 20.0 42.2 22.7 25.0 41.5 27.9 30.0 40.9 33.0 40.0 39.7 42.7 50.0 38.7 52.0 60.0 37.8 60.9 70.0 37.0 69.6
800 1000 1200 1500 2000 2500 3000 4000
Reference: 14 and 2
Accuracy: The total error in the experimental data is believed not to exceed + 2% for E/N c 100 Td. and +_ 6% for E/N > 100 Td:
Reference: 14
Accuracy: The total error in the experimental data is believed not to exceed +_ 3%.
See page 182 for Explanation of Tables
200

ELLIS. PAI. MCDANIEL. MAXIN. and VIEHLAND Transport Properties of Gasrow Ions
Experimental Data T = 300* K
E/N K Vd 0 -
5.00 12 4 1.67 10.0 12 4 3.33 15.0 12 4 5.00 20.0 12 4 6.66 30.0 12 4 10.0 40.0 12 4 13.3 50.0 12 6 16.9 60.0 13.0 21.0 70.0 13.7 25.8 80.0 14.6 31.4 90.0 16.2 39.2
100 18.9 50.8 120 21.6 69.6 140 22.8 85.8 160 23.3 100 180 23.6 114 200 23.8 128 220 23.8 141 240 23.7 153 260 23.4 163 280 23.1 174 300 22.7 183 320 22.4 193 340 22.0 201
TABLES. Ions in Hydrogen, Nitric Oxide
Li+ - H2
Derived Quantities
T eff K (0) a("') :+$ 0 - eff --
300 12.4 69.1 -0.01 400 12.4 59.8 0.00 500 12.6 52.7 0.10 600 12.9 47.0 0.14 800 13.5 38.9 0.20
1000 14.2 33.0 0.24 1200 14.9 28.8 0.28 1500 15.9 24.1 0.32 2000 17.5 19.0 0.35 2500 18.9 15.7 0.31 3000 19.9 13.6 0.27 4000 21.3 11.0 0.20 5000 22.2 9.45 0.16 6000 22.7 8.44 0.03 8000 23.3 7.12 0.16
10000 23.6 6.29 0.04 12000 23.7 5.72 0.02 15000 23.7 5.11 -0.01 20000 23.5 4.47 -0.06 25000 23.1 4.06 -0.10 30000 22.6 3.79 -0.14 35000 22.0 3.61 -0.19
Reference: 12 and 22
Accuracy: The total error in the experimental data is believed not to exceed + 2%.
N20; - NO
Experimental Data T = 300' K
Derived Quantities
E/N K T 0 3 eff K (0) &l'l) :::T"* 0 - eff
8.00 1.78 0.383 300 1.77 135 0.26 9.00 1.78 0.430 310 1.78 132 0.27 10.0 1.78 0.478 320 1.80 129 0.27 12.0 1.78 0.574 330 1.81 126 0.27 15.0 1.78 0,717 340 1.82 123 0.27 20.0 1.78 0.957 350 1.84 120 0.26 25.0 1.79 1.20 30.0 1.80 1.45 35.0 1.82 1.71 40.0 1.84 1.98
Reference: 36
Accuracy: The total error in the experimental data is believed not to exceed +_3%.
Experimental Data T = 300* K
E/N K. vd - -
4.00 12.2 1.31 6.00 12.2 1.97 8.00 12.2 2.62 10.0 12.3 3.31 12.0 12.3 3.97 15.0 12.4 5.00 20.0 12.5 6.72 25.0 12.6 8.46 30.0 12.7 10.2 40.0 13.0 14.0 50.0 13.4 18.0 60.0 14.1 22.7 80.0 16.2 34.8
100 18.5 49.7 120 19.3 62.2 140 19.4 73.0 160 19.2 82.5 180 18.8 90.9 200 18.4 98.9 220 18.1 107 240 17.8 115
Na+ - H2 -___ -~
Derived Quantities
T eff K (0) 0
300 12.2 400 12.6 500 13.1 600 13.6 800 14.5
1000 15.3 1200 16.1 1500 17.0 2000 la.2 2500 19.0 3000 19.4 4000 19.5 5000 19.4 6000 19.0 7000 18.7 8000 la.4 9000 18.0
10000 17.7
&1’1) g+J eff
64.6 0.06 54.1 0.13 46.6 0.18 41.0 0.22 33.3 0.25 28.2 0.26 24.5 0.26 20.7 0.24 16.8 0.21 14.4 0.17 12.8 0.07 11.1 -0.01 9.95 -0.06 9.27 -0.10 a.72 -0.13 8.29 -0.15 7.99 -0.17 7.71 -0.19
Reference: 12 and 22
Accuracy: The total error in the experimental data is believed not to exceed + 2% for E/N < 100 Td. and + 3% for E//N > 100 Td:
-
See page 182 for Explanation of Tables
201 Atomic Data and Nuclear Dota Tables, “01. 17. No. 3, March 1976
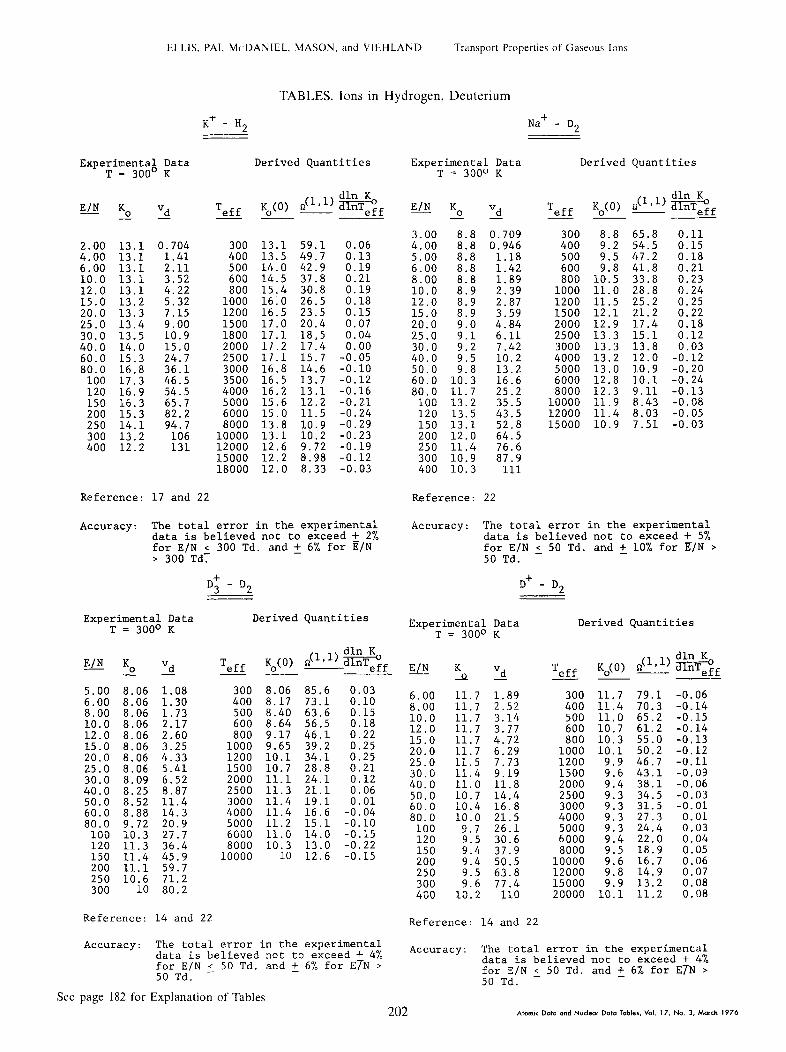
ELLIS. PAI. MCDANIEL, MASON, and VIEHLAND Transport Properties of Gaseous Ions
TABLES. Ions in Hydrogen, Deuterium
K+ - H, Na+ - D2
Experimental Data T = 300' K
Derived Quantities Experimental Data T = 300° K
Derived Quantities
T eff K (0) &l’l) wff 0 - E/N K. - -
T eff Ko(0) --
E/N K. -
0.704 1.41 2.11 3.52 4.22 5.32 7.15 9.00 10.9 15.0 24.7 36.1 46.5 54.5 65.7 82.2 94.7
106 131
2.00 13.1 4.00 13.1 6.00 13.1 10.0 13.1
300 13.1 59.1 0.06 400 13.5 49.7 0.13 500 14.0 42.9 0.19 600 14.5 37.8 0.21 800 15.4 30.8 0.19
3.00 8.8 4.00 8.8 5.00 8.8 6.00 8.8
12.0 13.1 15.0 13.2 20.0 13.3 25.0 13.4 30.0 13.5 40.0 14.0 60.0 15.3 80.0 l.6.8
100 17.3 120 16.9 150 16.3 200 15.3 250 14.1 300 13.2 400 12.2
1000 1610 26.5 0.18 1200 16.5 23.5 0.15 1500 17 0 20.4 0.07 1800 17 1 18,5 0.04 2000 17 2 17.4 0.00 2500 17 1 15.7 -0.05 3000 16 8 14.6 -0.10 3500 16 5 13.7 -0.12 4000 16 2 13.1 -0.16 5000 15 6 12.2 -0.21 6000 15 0 11.5 -0.24 8000 13.8 10.9 -0.29
10000 13.1 10.2 -0.23 12000 12.6 9.72 -0.19 15000 12.2 8.98 -0.12 18000 12.0 8.33 -0.03
8.00 8.8 10.0 8.9 12.0 8.9 15.0 8.9 20.0 9.0 25.0 9.1 30.0 9.2 40.0 9.5 50.0 9.8 60.0 10.3 80.0 11.7
100 13.2 120 13.5 150 13.1 200 12.0 250 11.4 300 10.9 400 10.3
0.709 0.946
1.18 1.42 1.89 2.39 2.87 3.59 4.84 6.11 7.42 10.2 13.2 16.6 25.2 35.5 43.5 52.8 64.5 76.6 87.9
111
Reference: 17 and 22 Reference 22
300 8.8 65.8 0.11 400 9.2 54.5 0.15 500 9.5 47.2 0.18 600 9.8 41.8 0.21 800 10.5 33.8 0.23
1000 11.0 28.8 0.24 1200 11.5 25.2 0.25 1500 12.1 21.2 0.22 2000 12.9 2500 13.3 3000 13.3
17.4 0.18 15.1 0.12 13.8 0.03 12.0 -0.12 10.9 -0.20 10.1 -0.24 9.11 -0.13 8.43 -0.08 8.03 -0.05 7.51 -0.03
4000 13.2 5000 13.0 6000 12.8 8000 12.3
10000 11.9 12000 11.4 15000 10.9
The total error in the experimental data is believed not to exceed +_ 2% for E/N < 300 Td. and +_ 6% for E/N > 300 Td:
Accuracy: The total error in the experimental data is believed not to exceed +_ 5% for E/N 2 50 Td. and + 10% for E/N > 50 Td.
Accuracy:
D+ - D 3 2 D+ - D 2
Experimental Data Derived Quantities T = 300° K Experimental Data Derived Quantities
T = 300° K
E/N K. 32
T eff K (0) ~$1,') :?TKo - 0 - eff - -___ Vd T eff K (0) ~(1~1) wff 0 - - -- --
E/N
6.00 8.00 10.0 12.0 15.0 20.0 25.0 30.0 40.0 50.0 60.0 80.0
100 120 150 200 250 300 400
!L 11.7 11.7 11.7 11.7 11.7 11.7 11.5 11.4 11.0 10.7 10.4 10.0
9.7 9.5 9.4 9.4
z.2 10:2
5.00 6.00 8.00
8.06 8.06 8.06 8.06 8.06 8.06
1.08 1.30 1.73 2.17 2.60 3.25 4.33 5.41 6.52 5.87 11.4 14.3 20.9
300 400 500 600 800
1000 1200
8.06 85.6 0.03 1.89 300 11.7 79.1 -0.06 2.52 400 11.4 70.3 -0.14 3.14 500 11.0 65.2 -0.15 3.77 600 10.7 61.2 -0.14 4.72 800 10.3 55.0 -0.13
8.17 73.1 0.10 8.40 63.6 0.15 8.64 56.5 0.18 10.0
12.0 15.0
9.17 46.1 9.65 39.2 10.1 34.1
0.22 0.25 0.25 0.21 0.12 0.06 0.01
6I29 1000 10.1 50.2 -0.12 7.73 1200 9.9 46.7 -0.11 9.19 1500 9.6 43.1 -0.09
8.06 8.06 8.09
20.0 25.0 30.0 40.0 50.0 60.0 80.0
100 120
8.25 8.52 8.88 9.72 10.3 11.3
150 11.4 200 11.1
1500 10.7 28.8 2000 11.1 24.1 2500 11.3 21.1 il.8 2000 9.4 38.1 -0.06
14.4 2500 9.3 34.5 -0.03 16.8 3000 9.3 31.5 -0.01 3000 11.4
4000 11.4 5000 11.2 6000 11.0 8000 10.3
10000 10
19.1 16.6 15.1 14.0
-0.04 21.5 4000 9.3 27.3 0.01 26.1 5000 9.3 24.4 0.03 30.6 6000 9.4 22.0 0.04 37.9 8000 9.5 18.9 0.05 50.5 10000 9.6 16.7 0.06
-0.10 -0.15 -0.22 -0.15
27.7 36.4 45.9 59.7 71.2
13.0 12.6 - _ .-
63.8 12000 9.8 14.9 0.07 77.4 15000 9.9 13.2 0.08 250 10.6
300 10 80.2 110 20000 10.1 11.2 0.08
Reference: 14 and 22 Reference: .4 and 2
Accuracy: The total error in the experimental data is believed not to exceed + 4% for E/N 5 50 Td. and +_ 6% for ETN > 50 Td.
See page 182 for Explanation of Tables
Accuracy: The total error in the experimental data is believed not to exceed + 4% for E/N 2 50 Td. and + 6% for ETN > 50 Td.
202 Atomic Dam and Nudeor Data Table.. Vol. 17, No. 3, March I976

ELLIS. PAI, MCDANIEL. MASON.and VIEHLAND Transport Properties of Gaseous lona
TABLES. Ions in Deuterium, Nitrogen
K+ - D 2 N+ - N 2 2
Experimental Data T = 3000 K
Derived Quantities Experimental Data T = 300' K
Derived Quantities
T eff K (0) ~(1'1) wff 0 - E/N K "d
T _ -0 eff K (0) ~(1'~) ;::TKo
0 - eff E/N K - 0 32
300 9.35 60.0 0.08 400 9.60 50.6 0.12 500 9.90 43.9 0.17 600 10.3 38.5 0.22 800 11.0 31.2 0.25
1000 11.6 26.5 0.25 1200 12.1 23.2 0.19 1500 12.5 20.1 0.10 1800 12.6 18.2 0.05 2000 12.7 17.1 0.02 2500 12.6 15.4 -0.03 3000 12.5 14.2 -0.07 3500 12.3 13.4 -0.12 4000 12.1 12.7 -0.18 5000 11.5 11.9 -0.25 6000 10.9 11.5 -0.33 8000 9.8 11.1 -0.45
10000 8.8 11.0 -0.47 12000 8.1 11.0 -0.47
6.00 1.90 8.00 1.89 10.0 1.88 12.0 1.88 15.0 1.87 20.0 1.85 25.0 1.84 30.0 1.83 40.0 1.80 50.0 1.76 60.0 1.72 80.0 1.66
100 1.60 120 1.54 150 1.47 200 1.37 250 1.28 300 I..20 400 1.10 500 1.02 600 0.95 800 0.85
0.306 0.406 0.505 0.606 0.754 0.994
1.24 1.48 1.93 2.36 2.77 3.57 4.30 4.97 5.92 7.36 8.60 9.67 11.8 13.7 15.3 18.3
300 1.90 150 -0.44 400 1. 7.0 145 -0.32 500 1.59 139 -0.29 600 1.51 134 -0.28 800 1.40 125 -0.28
1000 1.32 119 -0.28 1200 1.25 114 -0.29 1500 1.17 109 -0.29 2000 1.07 103 -0.31 2500 1.00 98.9 -0.31 3000 0.94 96.1 -0.34 4000 0.86 90.9 -0.37
3.00 9.40 0.758 4.00 9.40 1.01 6100 9.40 1.52 8.00 9.40 2.02 10.0 9.45 2.55 12.0 9.49 3.06 15.0 9.54 3.83 20.0 9.65 5.16 25.0 9.76 6.58 30.0 9.88 7.98 40.0 10.1 10.9 60.0 11.4 18.4 80.0 12.6 27.1
100 12.9 34.7 120 12.8 41.3 150 12.2 49.2 200 10.8 54.8 250 9.7 65.2 300 8.9 71.7 400 8.0 86.0
Reference: 22
Reference: 24 Accuracy: The total error in the experimental data is believed not to exceed + 4% for E/N 2 80 Td. and +_ 6% for ETN > 80 Td.
Accuracy: The total error in the experimental data is believed not to exceed t 3%.
Li+ - D,
Derived Quantities N,H+ - N2 Experimental Data T = 300° K
E/N K. Vd T eff K (0) o(l'l) :::T"o 0 - eff - -
Experimental Data T = 3000 K
Derived Quantities
3.00 9.6 0.774 300 9.6 69.8 0.00 4.00 9.6 1.03 400 9.7 59.8 0.09 E/N K. Vd T eff K (0) n("') ::"nTKo
- - 0 - eff 6.00 9.6 1.55 500 10.0 51.9 0.16 8.00 9.6 2.06 600 10.3 46.0 0.20 10.0 9.6 2.58 800 11.0 37.3 0.24 300 2.12 134 -0.33
325 2.08 131 -0.23 350 2.05 128 -0.11 400 2.04 120 -0.02
6.00 2.12 0.342 8.00 2.12 0.456 10.0 2.12 0.570 15.0 2.12 0.854
12.0 9.6 3.10 1000 11.6 31.6 0.27 15.0
Lx 3.87 1200 12.2 27.4 0.28
20.0 5.16 1500 13.0 23.0 0.26 25.0 9:6 6.45 2000 13.9 18.7 0.23 30.0 9.7 7.82 2500 14.6 15.9 0.21 40.0 9.9 10.6 3000 15.2 13.9 0.19 50.0 10.3 13.8 4000 15.9 11.5 0.16 60.0 10.8 17.4. 5000 16.5 9.94 0.14 80.0 12.9 27.7 6000 16.9 8.86 0.13
100 15.0 40.3 8000 17.5 7.41 0.09 120 16.4 52.9 10000 17.8 6.52 0.05 150 17.4 70.1. 12000 17.8 5.95 -0.02 200 17.8 95.7 15000 17.5 5.41 -0.14 250 16.6 112 20000 16.1 5.10 -0.51
20.0 2.10 1.13 25.0 2.08 1.40 30.0 2.07 1.67
450 2.04 113 0.00 500 2.04 108 0.00 600 2.04 98.1 0.00 700 2.04 90.9 0.01 800 2.04 85.0 0.01 900 2.04 80.1 0.01
1000 2.05 75.6 0.01 1200 2.05 69.1 0.02 1400 2.06 63.6 0.03
40.0 2.04 2.19 50.0 2.04 2.74 60.0 2.04 3.29 80.0 2.04 4.39
100 2.04 5.48 120 2.04 6.58 140 2.04 7.67 160 2.05 8.81 180 2.06 9.96 300 14.5 117
Reference: 22 Reference: 10
Accuracy: The total error in the experimental data is believed not to exceed 2 7%.
Accuracy: The total error in the experimental data is believed not to exceed + 5% for E/'N < 50 Td. and +_ 10% for E/N > 50 Td.-
See page 182 for Explanation of Tables

TABLES. Ions in Nitrogen
K+ - N 2 CO; - N2
Experimental T = 300'
Data K
D.272 0.408 0.544 0.682 D.819
1.02 1.37 1.71 2.06 2.77 3.48 4.22 5.76 7.42 9.16 11.9 16.3 20.5 24.2 30.7 36.4 41.3
Derived Quantities Experimental Data T = 300° K
Derived Quantities
cP,l) Wff T eff Ko(o) n(l,l> ,"::T>f E/N - K. -
4.00 2.53 6.00 2.53 8.00 2.53
T eff K (0) 0 E/N K.
-
6.00 2.15 8.00 2.15 10.0 2.15 15.0 2.15 20.0 2.14 30.0 2.11 40.0 2.10 50.0 2.10 60.0 2.10 70.0 2.12 80.0 2.16
100 2.26 120 2.38 140 2.50 160 2.60 180 2.66 200 2.69 220 2.70 240 2.70
“d 0.347 0.462 0.578 0.867
1.15 1.70 2.26 2.82 3.39 3.99 4.64 6.07 7.67 9.40 11.2 12.9 14.5 16.0 17.4
300 2.15 120 325 2.12 117
-0.28 -0.17 -0.06
0.01 0.08 0.14 0.16 0.17 0.17 0.17 0.17 0.18 0.14 0.08 0.04 0.02 0.00
105 0.07 88.8 0.06 78.3 0.08 70.4 0.08 59.6 0.10 52.1 0.10 46.6 0.10
300 2.53 400 2.58 500 2.62 350 2.10 114
400 2.10 107 450 2.11 100 500 2.14 93.5 600 2.20 83.0 700 2.25 75.2 800 2.30 68.8 900 2.35 63.5
1000 2.39 59.2 1200 2.47 52.3 1500 2.56 45.1 2000 2.64 37.9 2500 2.68 33.4 3000 2.70 30.3 3500 2.70 28.0
10.6 2.54 12.0 2.54 15.0 2.54
600 2.66 800 2.72
1000 2.78 20.0 2.55 25.0 2.55 30.0 2.56 40.0 2.58 50.0 2.59 60.0 2.62
1200 2.84 1500 2.89 1800 2.93 2000 2.95 2500 2.99 3000 3.02 3500 3.03
41.0 0.08 36.9 0.07 34.8 0.07 30.7 0.06 27.7 0.04 25.6 0.04 23.8 0.01 21.3 -0.02 19.5 -0.05 17.3 -0.09 15.9 -0.12 14.8 -0.15
80.0 2.68 100 2.76 120 2.84
4000 3.05 5000 3.04 6000 3.03 8000 2.96
10000 2.89
150 2.95 200 3.04 250 3.05 300 3.00 400 2.86 500 2.71 600 2.56
12000 2.82 15000 2.72 18000 2.63
13.8 -0.17 13.0 -0.21 12.6 -0.22 Reference: 10 20000 2.57
Accuracy: The total error in the experimental data is believed not to exceed + 7%. -
Reference:
he total error in the experimental ata is believed not to exceed +_ 2%.
Accuracy:
N+ - N 9 N+ - N 3
Derived Quantities
T eff K (0) n("') wff 0 ___
300 2.26 115 0.01 350 2.27 106 0.06 400 2.30 98.2 0.10 450 2.33 91.4 0.15 500 2.37 85.2 0.19 600 2.47 74.6 0.23 700 2.56 66.7 0.20 800 2.62 60.9 0.18 900 2.67 56.4 0.15
1000 2.71 52.7 0.13 1200 2.77 47.1 0.10 1500 2.81 41.5 0.07 2000 2.86 35.3 0.03 2500 2.86 31.6 -0.03 3000 2.83 29.1 -0.08 3500 2.78 27.5 -0.13
L
Derived Quantities Experimental Data T = 300° K
Experimental Data T = 300° K
'd
I.121 I.243 I.607 1.21 1.83 2.45 3.10 3.79 4.51 5.33 6.22 7.15 8.93 10.6 12.3 13.8 15.2 16.6 17.7
T eff K (0) n(lP1) eff 0 - E/N K -- 0
E/N K - 0
7.00 3.01 8.00 3.01 10.0 3.01 12.0 3.00 15.0 2.99 20.0 2.98 25.0 2.97 30.0 2.96 40.0 2.94 50.0 2.92 60.0 2.91 80.0 2.89
100 2.88 120 2.87 150 2.87 200 2.86 250 2.86 300 2.86 400 2.83 500 2.79
Vd -
0.566 0.647 0.809 0.967
1.21 1.60 2.00 2.39 3.16 3.92 4.69 6.21 7.74 9.25 11.6 15.4 19.2 23.1 30.4 37.5
300 3.01 116 -0.07 400 2.95 103 -0.05 500 2.92 92.8 -0.05 600 2.90 85.3 -0.03 800 2.88 74.4 -0.02
1000 2.87 66.8 -0.01 1200 2.86 61.2 -0.01 1500 2.86 54.7 0.00 2000 2.86 47.4 0.00 2500 2.86 42.4 0.00
2.00 2.26 4.00 2.26 10.0 2.26
(
2o:o 2126 30.0 2.27 40.0 2.28 50.0 2.31 60.0 2.35 70.0 2.40 80.0 2.48 90.0 2.57
100 2.66 120 2.77 140 2.82 160 2.86 180 2.86 200 2.83 220 2.80 240 2.75
3000 2.86 38.7 0.00 4000 2.86 33.5 0.00 5000 2.86 30.0 -0.01 6000 2.85 27.4 -0.01 8000 2.84 23.9 -0.02
10000 2.83 21.4 -0.02 12000 2.82 19.6 -0.03 15000 2.80 17.7 -0.03 20000 2.77 15.5 -0.03
Reference: 20 and 24
Accuracy: The total error in the experimental data is believed not to exeeed +_ 7%.
Reference: 24
Accuracy: The total error in the experimental data is believed not to exceed + 3%.
See page 182 for Explanation of Tables
204

ELLIS, PA1. MCDANIEL. MASON, and VIEHLAND Tramport Properties of Gaseous Ions
TABLES. Ions in Nitrogen, Oxygen
N; - N2 K+ - 02
Experimental Data T = 300° K
Derived Quantities Experimental Data T = 3000 K
Derived Quantities
E/N K 0 -
2.00 2.31 4.00 2.31 7.00 2.31 10.0 2.32. 12.0 2.33 15.0 2.34 20.0 2.35 25.0 2.36 30.0 2.37 35.0 2.39 40.0 2.41
Vd -
0.124 0.248 0.434 0.623 0.751 0.943
1.26 1.59 1.91 2.25 2.59
Reference: 24
Accuracy: The total error in the experimental data is believed not to exceed t 3%.
T eff K (0) n(lJ1) wff 0 - dln K. &lB1) dlnTeff -~
E/N K. vd - - - T eff Ko(o>
300 2.31 107 0.14 3.00 2.73 0.220 4.00 2.73 0.293 6.00 2.73 0.440 8.00 2.73 0.587 10.0 2.73 0.734 12.0 2.73 0.880 15.0 2.73 1.10 20.0 2.73 1.47
300 2.72 400 2.75 500 2.85 600 2.94 800 3.09
1000 3.20 1200 3.27
93.7 0.04 80.3 0.10
325 2.35 101 0.17 350 2.38 96.2 0.20 375 2.41 91.8 0.21 69.3 0.15
61.3 0.17 50.5 0.16 43.6 0.14 39.0 0.12 34.1 0.08 1500 3.34
1800 3.19 2000 3.42 2500 3.46 3000 3.48 3500 3.49 4000 3.48
25.0 2.71 1.83 30.0 2.75 2.22 40.0 2.80 3.01 50.0 2.87 3.86 60.0 2.94 4.74 80.0 3.12 6.71
30.7 0.07 28.9 0.06 25.5 0.05 23.2 0.03 21.4 -0.01 20.1 -0.03
100 3.31 8.89 120 3.42 11.0 150 3.48 14.0 200 3.44 18.5 250 3.33 22.4 300 3.20 25.8
5000 3.45 6000 3.37 8000 3.24
10000 3.13
18.1 -0.07 16.9 -0.13 15.2 -0.15 14.1 -0.19
Reference: 17
Accuracy: The total error in the experimental data is believed not to exceed +_ 2%. 0; - o2
Derived Quantities Experimental Data T = 300O K
E/N K. vd - -
4.00 2.23 0.240 5.00 2.23 0.300 6.00 2.23 0.360 8.00 2.23 0.479 10.0 2.23 0.599 12.0 2.23 0.719 15.0 2.23 0.899 20.0 2.23 1.20 25.0 2.23 1.50 30.0 2.23 1.80 40.0 2.21 2.38 50.0 2.18 2.93 60.0 2.14 3.45 80.0 2.08 4.47
100 2.02 5.43 120 1.96 6.32 150 1.88 7.58 200 1.77 9.51 250 1.67 11.2 300 1.59 12.8 400 1.45 15.6 500 1.34 18.0
T K (0) SI(~,~) $eff eff 0 -. __ ___
300 2.23 120 -0.12 400 2.17 107 -0.13 500 2.11 98.1 -0.14 600 2.05 92.1 -0.14 800 1.97 83.0 -0.16
1000 1.90 77.0 -0.17 1200 1.84 72.6 -0.18 1500 1.76 67.9 -0.21 2000 1.65 62.7 -0.23 2500 1.56 59.3 -0.26 3000 1.49 56.7 -0.29 4000 1.36 53.8 -0.33
Experimental Data T = 3000 K
E/N K. 3
T eff K (0) n("') wff - 0 -
2.00 2.08 0.17.2 300 2.08 111 0.00 4.00 2.08 0.224 305 2.08 110 0.00 6.00 2.08 0.335 310 2.08 109 Oloo 8.00 2.08 0.447 -0.0 2.08 0.559 12.0 2.08 0.671 15.0 2.08 0.838 20.0 2.08 1.12
Reference: 32 Reference: 23 and 32
Derived Quantities
Accuracy: The total error in the experimental Accuracy: The total error in the experimental data is believed not to exceed +_ 3%. data is believed not to exceed + 4%.
See page 182 for Explanation of Tables
205 Atom,c Data and Nucleor Dota Tables, Vol 17. No. 3, March 1976
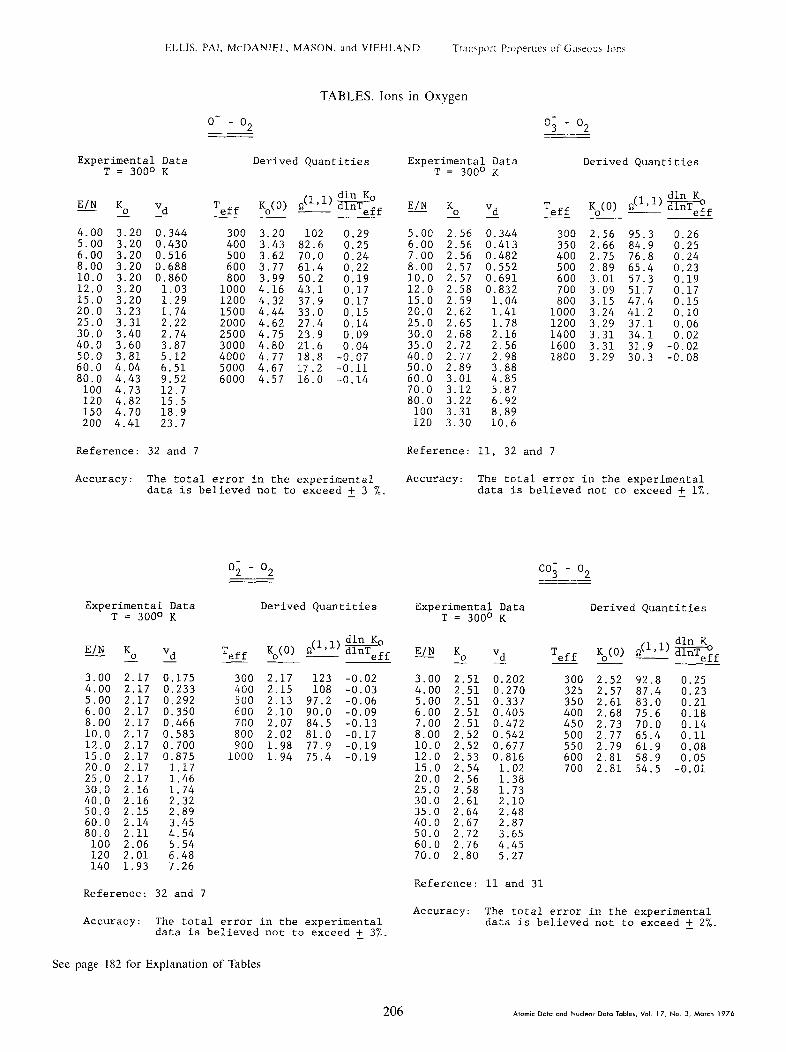
ELLIS. PAL. MCDANIEL, MASON. and VIEHLAND Tran\porl Properties of G3~eous Ion\
TABLES. Ions in Oxygen
o- - o2
Derived Quantit ies
Q3 - O2
Derived Quant Experimental Data T = 3OOo K
Experimental Data T = 300° K
it ies
102 0.29 5.00 2.56 0.344 300 2.56 82.6 0.25 6.00 2.56 0.413 350 2.66 70.0 0.24 7.00 2.56 0.482 400 2.75
dln K &l'l) dlnTezf --
95.3 0.26 84.9 0.25 76.8 0.24 65.4 0.23 57.3 0.19 51.7 0.17 47.4 0.15 41.2 0.10 37.1 0.06 34.1 0.02 31.9 -0.02 30.3 -0.08
E/N K. vd - - -
4.00 3.20 0.344
T eff Ko(O>
3.20 3.43 3.62 3.77 3.99 4.16 4.32 4.44 4.62 4.75 4.80 4.77 4.67 4.57
E/N K -- Vd 0 -- T eff K (0) -e-
300 400 500 600
5.00 3.20 0.430 6.00 3.20 0.516 8.00 3.20 0.688 10.0 3.20 0.860 12.0 3.20 1.03
61.4 0.22 50.2 0.19 43.1 0.17 37.9 0.17 33.0 0.15 27.4 0.14 23.9 0.09 21.6 0.04 18.8 -0.07 17.2 -0.11 16.0 -0.14
8.00 2.57 0.552 10.0 2.57 0.691 12.0 2.58 0.832
500 600 700 800
1000 1200 1400 1600 I.800
2.89 3.01 800
1000 3.09 15.0 3.20 1.29 1200
1500 2000 2500 3000 4000 5000 6000
15.0 2.59 1.04 20.0 2.62 1.41 25.0 2.65 1.78
3.15 3.24 3.29 3.31 3.31
20.0 3.23 1.74 25.0 3.31 2.22 30.0 3.40 2.74 40.0 3.60 3.87 50.0 3.81 5.12 60.0 4.04 6.51 80.0 4.43 9.52
100 4.73 12.7 120 4.82 15.5 150 4.70 18.9 200 4.41 23.7
30.0 2.68 2.16 35.0 2.72 2.56 40.0 2.77 2.98 50.0 2.89 3.88 60.0 3.01 4.85 70.0 3.12 5.87 80.0 3.22 6.92
3.29
100 3.31 8.89 120 3.30 10.6
Reference: 32 and 7 Reference: 11, 32 and 7
Accuracy: The total error in the experimental Accuracy: The total error in the experimental data is believed not to exceed + 3 % data is believed not to exceed t 1%.
co; - o2 __- --- O2 - O2
Derived Quantities
T eff K (0) Q(~,~) w
0 - eff --
300 2.17 123 -0.02 400 2.15 108 -0.03 500 2.13 97.2 -0.06 600 2.10 90.0 -0.09 700 2.07 84.5 -0.13 800 2.02 81.0 -0.17 900 1.98 77.9 -0.19
1000 1.94 75.4 -0.19
Experimental Data T = 300° K
E/N K. vd - - -
3.00 2.17 0.175 4.00 2.17 0.233 5.00 2.17 0.292 6.00 2.17 0.350 8.00 2.17 0.466 10.0 2.17 0.583 12.0 2.17 0.700 15.0 2.17 0.875 20.0 2.17 1.17 25.0 2.17 1.46 30.0 2.16 1.74 40.0 2.16 2.32 50.0 2.15 2.89 60.0 2.14 3.45 80.0 2.11 4.54
100 2.06 5.54 120 2.01 6.48 140 1.93 7.26
Reference: 32 and 7
Experimental Data T = 300' K
Derived Quantities
T eff Ko(o> JIJ1) Wff E/N K - Vd -22 -
3.00 2.51 0.202 4.00 2.51 0.270 5.00 2.51 0.337 6.00 2.51 0.405 7.00 2.51 0.472
300 2.52 92.8 0.25 325 2.57 87.4 0.23 350 2.61 83.0 0.21 400 2.68 75.6 0.18 450 2.73 70.0 0.14 500 2.77 65.4 0.11 550 2.79 61.9 0.08 600 2.81 58.9 0.05 700 2.81 54.5 -0.01
8.00 2.52 0.542 10.0 2.52 0.677 12.0 2.53 0.816 15.0 2.54 1.02 20.0 2.56 1.38 25.0 2.58 1.73 30.0 2.61 2.10 35.0 2.64 2.48 40.0 2.67 2.87 50.0 2.72 3.65 60.0 2.76 4.45 70.0 2.80 5.27
Reference: 11 and 31
Accuracy: The total error in the experimental data is believed not to exceed +_ 2%. Accuracy: The total error in the experimental
data is believed not to exceed +_ 3%.
See page 182 for Explanation of Tables
206
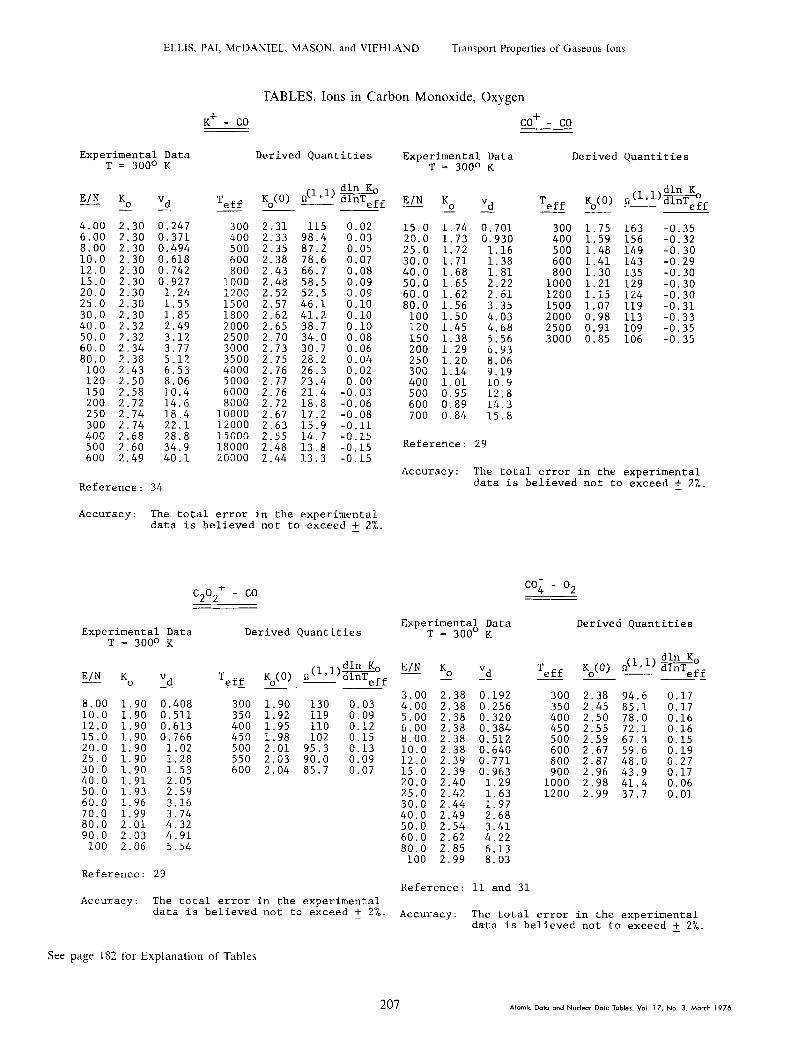
ELLIS, PAI, MCDANIEL, MASON. and VIEHLAND Transport Properties of Gaseous Ions
TABLES. Ions in Carbon Monoxide, Oxygen
K+ - co co+ - co
Experimental Data T = 300° K
Derived Quantities Experimental Data T = 300° K
Derived Quantities
T eff K (0) n(l,l> g+ 0 ___ eff E/N K. vd T __ eff K (0) n(l*')eff
- - 0 - E/N K. vd - - -
4.00 2.30 0.247 6.00 2.30 0.371 8.00 2.30 0.494 10.0 2.30 0.618 12.0 2.30 0.742 15.0 2.30 0.927 20.0 2.30 1.24 25.0 2.30 1.55 30.0 2.30 1.85
300 2.31 115 0.02 400 2.33 98.4 0.03
15.0 1.74 0.701 300 1.75 163 -0.35 20.0 1.73 0.930 400 1.59 156 -0.32 25.0 1.72 1.16 500 1.48 149 -0.30 30.0 1.71 1.38 600 1.41 143 -0.29
500 2.35 87.2 0.05 600 2.38 78.6 0.07 800 2.43 66.7 0.08 40.0 1.68 1.81 800 1.30 135 -0.30
50.0 1.65 2.22 1000 1.21 129 -0.30 60.0 1.62 2.61 1200 1.15 124 -0.30 80.0 1.56 3.35 1500 1.07 119 -0.31
100 1.50 4.03 2000 0.98 113 -0.33
1000 2.48 58.5 0.09 1200 2.52 52.5 0.09 1500 2.57 46.1 0.10 1800 2.62 41.2 0.10 2000 2.65 38.7 0.10 2500 2.70 34.0 0.08 3000 2.73 30.7 0.06 3500 2.75 28.2 0.04 4000 2.76 26.3 0.02 5000 2.77 23.4 0.00
40.0 2.32 2.49 50.0 2.32 3.12 60.0 2.34 3.77
120 1.45 4.68 2500 0.91 109 -0.35 150 1.38 5.56 3000 0.85 106 -0.35 200 1.29 6.93 250 1.20 8.06 300 1.14 9.19
80.0 2.38 5.12 100 2.43 6.53 120 2.50 8.06 150 2.58 10.4 200 2.72 14.6 250 2.74 18.4
400 1.01 10.9 500 0.95 12.8 6000 2.76 21.4 -0.03
8000 2.72 18.8 -0.06 10000 2.67 17.2 -0.08
600 0.89 14.3 700 0.84 15.8
300 2.74 22.1 12000 2.63 15.9 -0.11 15000 2.55 14.7 -0.15 18000 2.48 13.8 -0.15 20000 2.44 13.3 -0.15
400 2.68 28.8 500 2.60 34.9 600 2.49 40.1
Reference: 29
Accuracy: The total error in the experimental data is believed not to exceed +_ 2%. Reference: 34
Accuracy: The total error in the experimental data is believed not to exceed + 2%. -
co, - o2
Derived Quantities
T dln K,
eff Ko(0) n(lgl) qff
c202+ - co q
Derived Quantities Experimental Data
T = 300O K Experimental Data T = 300° K
E/N K. vd - - T eff %(o) WWff
300 1.90 130 0.03 350 1.92 119 0.09 400 1.95 110 0.12
E/N K "3
300 2.38 94.6 0.17 0.17 0.16 0.16 0.15 0.19 0.27 0.17 0.06 0.01
3.00 2.38 0.192 8.00 1.90 0.408 10.0 1.90 0.511 12.0 1.90 0.613 15.0 1.90 0.766 20.0 1.90 1.02 25.0 1.90 1.28 30.0 1.90 1.53
4.00 2.38 0.256 350 2.45 85.1 5.00 2.38 0.320 400 2.50 78.0 6.00 2.38 0.384 450 2.55 72.1 8.00 2.38 0.512 500 2.59 67.3
600 2.67 59.6 800 2.87 48.0 900 2.96 43.9
1000 2.98 41.4 1200 2.99 37.7
450 1.98 102 0.15 500 2.01 95.3 0.13 550 2.03 90.0 0.09 600 2.04 85.7 0.07
10.0 2.38 0.640 12.0 2.39 0.771 15.0 2.39 0.963 20.0 2.40 1.29 40.0 1.91 2.05
50.0 1.93 2.59 60.0 1.96 3.16 70.0 1.99 3.74
25.0 2.42 1.63 30.0 2.44 1.97 40.0 2.49 2.68 50.0 2.54 3.41 80.0 2.61 4.32
90.0 2.03 4.91 100 2.06 5.54
60.0 2.62 L.22 80.0 2.85 6.13
100 2.99 8.03 Reference: 29
Reference: 11 and 3 Accuracy: The total error in the experimental
data i:s believed not to exceed + 2%. - Accuracy: The total error in the experimental data is believed not to exceed +_ 2%.
See page 182 for Explanation of Tables
207 Atomlc Dato and Nuclear Doto Tables, Vol. 17. No. 3, Match 1976
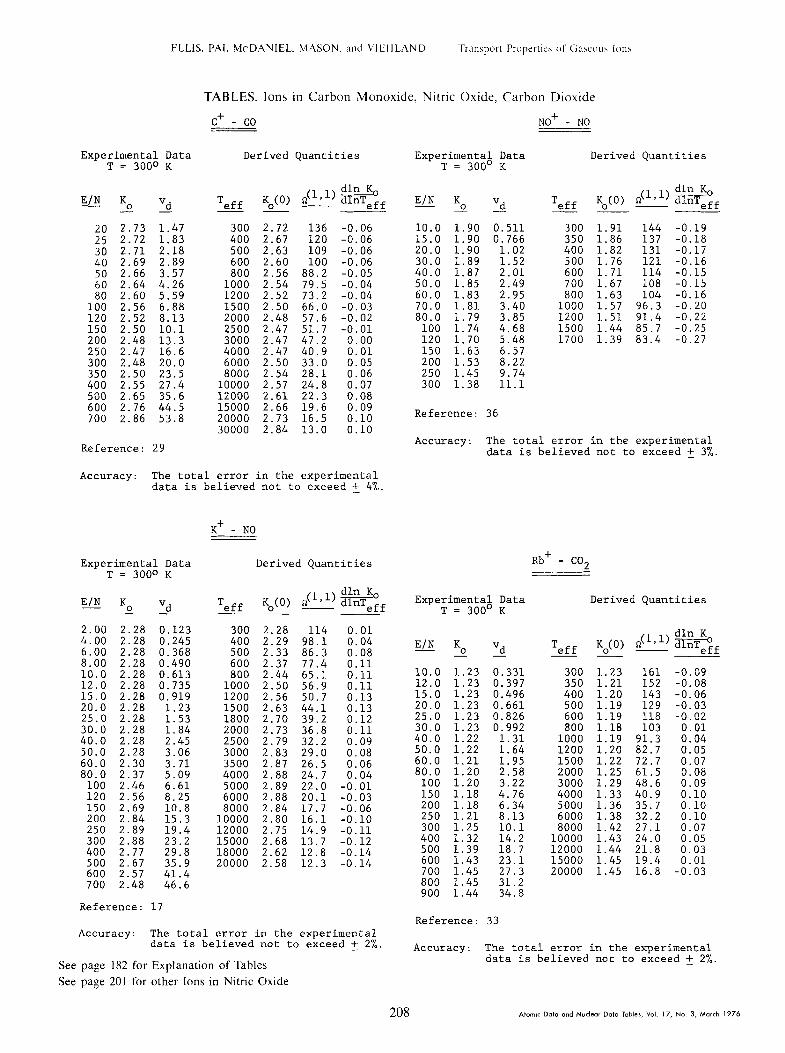
ELLIS. PAI. MCDANIEL. MASON. and VICHLAND Iransport Propertlra of Gaawu\ Ions
TABLES. Ions in Carbon Monoxide, Nitric Oxide, Carbon Dioxide
C+ - co NO+ - NO -___
Experimental Data T = 300° K
Derived Quantities Experimental Data T = 300' K
Derived Quantities
T K (0) &l) eff eff 0 - E/N K "d
T -- 0 eff E/N - Ko Vd -
1.47 1.83 2.18 2.89 3.57 4.26 5.59 6.88 8.13 10.1 13.3 16.6
2.73 2.72 2.71
300 2.72 136 -0.06 400 2.67 120 -0.06 500 2.63 109 -0.06 600 2.60 100 -0.06 800 2.56 88.2 -0.05
1000 2.54 79.5 -0.04
10.0 1.90 0.511 300 1 15.0 1.90 0.766 350 1 20.0 1.90 1.02 400 1 30.0 1.89 1.52 500 1
El 144 137 -0.18 -0.19
82 131 -0.17 76 121 -0.16
;: 114 108 -0.15 -0.15 63 104 -0.16 57 96.3 -0.20 51 91.4 -0.22 44 85.7 -0.25
30 40
;i 80
100 120 150 200 250 300 350 400
2.69 2.66 2.64 2.60 2.56 2.52 2.50 2.48 2.47
40.0 1.87 2.01 600 1 50.0 1.85 2.49 700 1 60.0 1.83 2.95 800 1 1200 2.52 73.2 -0.04
1500 2.50 66.0 -0.03 2000 2.48 57.6 -0.02
70.0 1.81 3.40 1000 1 80.0 1.79 3.85 1200 1
100 1.74 4.68 1500 1 2500 2.47 51.7 -0.01 3000 2.47 47.2 0.00 4000 2.47 40.9 0.01 6000 2.50 33.0 0.05 20.0
23.5 8000 2.54 28.1 0.06 27.4 10000 2.57 24.8 0.07
12000 2.61 22.3 0.08 35.6 44.5 53.8
120 1.70 5.48 1700 1.39 83.4 -0.27 150 1.63 6.57 200 1.53 8.22 2.48
2.50 2.55 2.65
250 1.45 9.74 300 1.38 11.1
500 600 700
2.76 2.86
15000 2.66 19.6 0.09 20000 2.73 16.5 0.10 30000 2.84 13.0 0.10
Reference: 36
Accuracy: The total error in the experimental data is believed not to exceed +_ 3%. Reference: 29
Accuracy: The total error in the experimental data is believed not to exceed +_ 4%.
K+ - NO
Derived Quantities Rb+ - co2
T K (0) p>l) g+ eff 0 - eff - -
300 2.28 114 0.01 400 2.29 98.1 0.04 500 2.33 86.3 0.08 600 2.37 77.4 0.11 800 2.44 65.1 0.11
1000 2.50 56.9 0.11 1200 2.56 50.7 0.13 1500 2.63 44.1 0.13 1800 2.70 39.2 0.12 2000 2.73 36.8 0.11 2500 2.79 32.2 0.09 3000 2.83 29.0 0.08 3500 2.87 26.5 0.06 4000 2.88 24.7 0.04 5000 2.89 22.0 -0.01 6000 2.88 20.1 -0.03 8000 2.84 17.7 -0.06
10000 2.80 16.1 -0.10 12000 2.75 14.9 -0.11 15000 2.68 13.7 -0.12 18000 2.62 12.8 -0.14 20000 2.58 12.3 -0.14
Experimental Data T = 300' K
Derived Quantities
E/N K. Vd T eff - - Ko(O) n(” l) ::tT>,
10.0 1.23 0.331 12.0 1.23 0.397 15.0 1.23 0.496 20.0 1.23 0.661 25.0 1.23 0.826
300 1.23 161 350 1.21 152 400 1.20 143 500 1.19 129 600 1.19 118
30.0 1.23 0.992 800 1.18 103 40.0 1.22 1.31 1000 1.19 91.3 50.0 1.22 1.64 1200 1.20 82.7 60.0 1.21 1.95 80.0 1.20 2.58
100 1.20 3.22 150 1.18 4.76
1500 1 22 72.7 2000 1 25 61.5 3000 1 29 48.6 4000 1.33 40.9
200 1.18 6.34 5000 1.36 35.7 250 1.21 8.13 6000 1.38 32.2 300 1.25 10.1 8000 1.42 27.1 400 1.32 14.2 10000 1.43 24.0 ~~... ~~ 500 1.39 18.7 12000 1.4i 21.8 600 1.43 23.1 15000 1.45 19.4 700 1.45 27.3 800 1.45 31.2 900 1.44 34.8
20000 1.45 16.8
Experimental Data T = 300° K
E/N K. vd - -
2.00 2.28 0.123 4.00 2.28 0.245 6.00 2.28 0.368 8.00 2.28 6.490 10.0 2.28 0.613 12.0 2.28 0.735 15.0 2.28 0.919 20.0 2.28 1.23 25.0 2.28 1.53
-0.09 -0.08 -0.06 -0.03 -0.02
0.01 0.04 0.05 0.07 0.08 0.09 0.10 0.10 0.10 0.07 0.05 0.03 0.01
-0.03
30.0 2 40.0 2 50.0 2 60.0 2 80.0 2
100 2 120 2
28 1.84
2 2.45 3.06
:: 3.71 5.09
46 6.61 56 8.25
150 2.69 10.8 200 2.84 15.3 250 2.89 19.4 300 2.88 23.2 400 2.77 29.8 500 2.67 35.9 600 2.57 41.4 700 2.48 46.6
Reference: 17 Reference: 33
Accuracy: The total error in the experimental data is believed not to exceed + 2%.
See page 182 for Explanation of Tables See page 201 for other Ions in Nitric Oxide
Accuracy: The total error in the experimental data is believed not to exceed 2 2%.
208 ,4tom,r Data and Nvclwr Doto Tobies, Vol. 17. No 3, March 1976
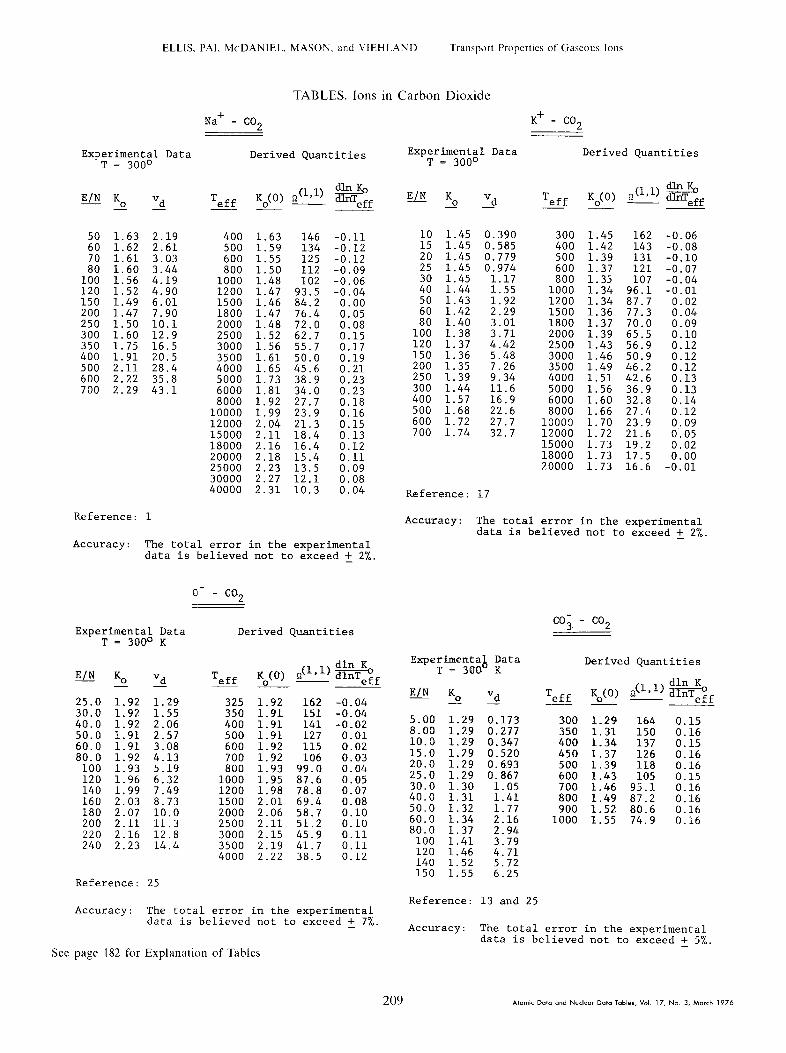
ELLIS, PAI. MCDANIEL. MASON, and VIEHLAND Transport Properties of Gaseous Ions
TABLES. Ions in Carbon Dioxide
k - co2
Derived Quantities
T eff K (0) ~("1) @ 0 - eff
Na+ - co2
Experimental Data T = 300°
Experimental Data T = 300°
Derived Ouantities .
T eff Ko(O) i2(lJl)
-0.11 -0.12 -0.12 -0.09 -0.06 -0.04
0.00 0.05 0.08 0.15 0.17 0.19 0.21 0.23 0.23 0.18 0.16 0.15 0.13 0.12 0.11 0.09 0.08 0.04
E/N K. vd - - - E/N F. “d
50 1.63 2.19 60 1.62 2.61 70 1.61 3.03 80 1.60 3.44
10 1.45 0.390 15 1.45 0.585 20 1.45 0.779 25 1.45 0.974 30 1.45 1.17 40 1.44 1.55 50 1.43 1.92 60 1.42 2.29 80 1.40 3.01
100 1.38 3.71 120 1.37 4.42 150 1.36 5.48 200 1.35 7.26 250 1.39 9.34 300 1.44 11.6 400 1.57 16.9 500 1.68 22.6 600 1.72 27.7 700 1.74 32.7
1.45 162 1.42 143
300 400 500 600 800
1000
1.39 131 1.37 121 1.35 107 1.34 96.1
1200 1.34 87.7 1500 1.36 77.3 1800 1.37 70.0
-0.06 -0.08 -0.10 -0.07 -0.04 -0.01
0.02 0.04 0.09 0.10 0.12 0.12 0.12 0.13 0.13 0.14 0.12 0.09 0105 0.02 0.00
-0.01
400 1.63 146 500 1.59 134 600 1.55 125 800 1.50 112
100 1.56 4.19 120 1.52 4.96
1000 1.48 102 1200 1.47 93.5
150 1.49 6.01 1500 1.46 84.2 200 1.47 7.90 1800 1.47 76.4
2000 1.48 72.0 2500 1.52 62.7 3000 1.56 55.7
250 1.50 10.1 300 1.60 12.9 350 1.75 16.5 400 1.91 20.5 500 2.11 28.1
3500 1.61 50.0 4000 1.65 45.6
600 2.22 35.8 5000 1.73 38.9 700 2.29 43.1 6000 1.81 34.0
8000 1.92 27.7 10000 1.99 23.9 12000 2.04 21.3 15000 2.11 18.4 18000 2.16 16.4 20000 2.18 15.4
2000 2500 3000 3500 4000 5000 6000 8000
10003 12000 15000 18000 20000
1.39 65.5 1.43 56.9 1.46 50.9 1.49 46.2 1.51 42.6 1.56 36.9 1.60 32.8 1.66 27.4 1.70 23.9 1.72 21.6 1.73 19.2 1.73 17.5 1.73 16.6 25000 2.23 i3:5
30000 2.27 12.1 40000 2.31 10.3 Reference: 17
Reference: 1 Accuracy: The total error in the experimental data is believed not to exceed +_ 2%.
Accuracy: The total error in the experimental data is believed not to exceed +_ 2%.
o- - co2 -~ -___
CO3. - co2 Experimental Data
T = 3QOo K Derived Quantities
Experimenta& Data T=300 R
Derived Quantities
E/N K 0 - Vd
5.00 1.29 0.173 8.00 1.29 0.277 10.0 1.29 0.347 15.0 1.29 0.520 20.0 1.29 0.693 25.0 1.29 0.867 30.0 1.30 1.05 40.0 1.31 1.41 50.0 1.32 1.77 60.0 1.34 2.16 80.0 1.37 2.94
100 1.41 3.79 120 1.46 4.71 140 1.52 5.72 150 1.55 6.25
T K (0) ~$1'~) :::T"' eff a - eff - -
300 1.29 164 0.15 350 1.31 150 0.16 400 1.34 137 0.15 450 1.37 126 0.16 500 1.39 118 0.16 600 1.43 105 0.15 700 1.46 95.1 0.16 800 1.49 87.2 0.16 900 1.52 80.6 0.16
1000 1.55 74.9 0.16
E/N K, Vd T eff Ko(0) - -
CJ(~'~) :::T>f
25.0 1.92 1.29 325 1.92 162 -0.04 30.0 1.92 1.55 350 1.91 151 -0.04 40.0 1.92 2.06 400 1.91 141 -0.02 50.0 1.91 2.57 500 1.91 127 0.01 60.0 1.91 3.08 600 1.92 115 0.02 80.0 1.92 4.13 700 1.92 106 0.03
100 1.93 5.19 800 1.93 99.0 0.04 120 1.96 6.32 1000 1.95 87.6 0.05 140 1.99 7.49 1200 1.98 78.8 0.07 160 2.03 8.73 1500 2.01 69.4 0.08 180 2.07 10.0 2000 2.06 58.7 0.10 200 2.11 11.3 2500 2.11 51.2 0.10 220 2.16 12.8 3000 2.15 45.9 0.11 240 2.23 14.4 3500 2.19 41.7 0.11
4000 2.22 38.5 0.12
Reference: 25
Reference: 13 and 2 Accuracy: The total error in the experimental
data is believed not to exceed +_ 7%. Accuracy: The total error in the experimental
data is believed not to exceed t 5%. See page 182 for Explanation of Tables
209

ELLIS, PAI. MCDANIEL, MASON, and VIEHLAND Transport Properties of Gaseous Ions
REFERENCESFORTABLES
1. G. R. Akridge, H. W. Ellis, R. Y. Pai and E. W. McDaniel, J. Chem. Phys. 62, 4578 (1975).
2. D. L. Albritton, T. M. Miller, D. W. Martin and E. W. McDaniel, Phys. Rev. 171, 94 (1968).
3. E. C. Beaty, Proc. Fifth Int. Conf. Ionization Phenomena Gases (Munich, 1961), Vol. 1, p. 183, North Holland, Amsterdam.
4. E. C. Beaty and P. L. Patterson, Phys. Rev. 137, A346 (1965).
5. E. C. Beaty and P. L. Patterson, Phys. Rev. 17p 116 (1968). - -9 6. M. A. Biondi and L. M. Chanin, Phys. Rev. 94, 910 (1954). 7. D. S. Burch and R. Geballe, Phys. Rev. 106, 183 (1957). 8. L. M. Chanin and M. A. Biondi, Phys. Rev. 107, 1219 (1957). 9. R. P. Creaser, J. Phys. B 7, 529 (1974).
10. I. Dotan, W. Lindinger and D. L. Albritton, to be published.
11. M. T. Elford and J. A. Rees, Aust. J. Phys. 3, 333 (1974). 12. H. W. Ellis, R. Y. Pai and E. W. McDaniel, to be published as a note in J. Chem. Phys.
13. H. W. Ellis, R. Y. Pai, E. W. McDaniel, R. Wernlund and M. J. Cohen, to be published in J. Chem. Phys.
14. E. Graham IV, D. R. James, W. C. Keever, Phys. 2, 3477 (1973).
D. L. Albritton and E. W. McDaniel, J. Chem.
15. J. A. Hornbeck, Phys. Rev. 84, 615 (1951). 16. D. R. James, E. Graham, G. M. Thomson,
58, 3652 (1973). I. R. Gatland and E. W. McDaniel, J. Chem Phys.
17. D. R. James, E. Graham, G. R. Akridge and E. W. McDaniel, J. Chem. Phys. 62, 740 (1975). 18. R. Johnsen and M. A. Biondi, J. Chem. Phys. 57, 5292 (1972).
19. W. Lindinger and D. L. Albritton, J. Chem. Phys. 62, 3517 (1975).
20. W. Lindinger, to be published in J. Chem. Phys. 21. M. McFarland, D. L. Albritton, F. C. Fehsenfeld, E. E. Ferguson and A. L. Schmeltekopf,
J. Chem. Phys. 2, 6610 (1973). 22. T. M. Miller, J. T. Moseley, D. W. Martin and E. W. McDaniel, Phys. Rev. 173, 115 (1968).
23. H. B. Milloy, Aust. J. Phys. 2, 307 (1975).
24. J. T. Moseley, R. M. Snuggs, D. W. Martin and E. W. McDaniel, Phys. Rev. 178, 240 (1969). 25. J. T. Moseley, P. C. Cosby and J. R. Peterson, to be published in J. Chem. Phys.
26. 0. J. Orient, J. Phys. B 5, 1257 (1971). 27. 0. J. Orient, J. Phys. B 2, 1056 (1972).
28. 0. J. Orient, J. Phys. D 7, 2266 (1974).
29. J. H. Schummers, G. M. Thomson, D. R. James, A 7, 683 (1973).
I. R. Gatland and E. W. McDaniel, Phys. Rev.
30. H. Skullerud, J. Phys. B 6, 918 (1973). 31. R. M. Snuggs, PhD Thesis, Georgia Institute of Technology (1970).
32. R. M. Snuggs, D. J. Volz, J. H. Schummers, D. W. Martin and E. W. McDaniel, Phys. Rev. A 2, 447 (1971).
33. M. G. Thackston, H. W. Ellis, R. Y. Pai and E. W. McDaniel, to be published. 34. G. M. Thomson, J. H. Schurmners, D. R. James,
E. W. McDaniel, J. Chem. Phys. g, E. Graham, I. R. Gatland, M. R. Flannery and
2402 (1973). 35. R. N. Varney, Phys. Rev. E, 362 (1952). 36. D. J. Volz, J. H. Schummers, R. D. Laser,
1106 (1971). D. W. Martin and E. W. McDaniel, Phys. Rev. A 4,
210 Atomic Doto and Nuclear Dotcl Tobler, Vol. 17, No. 3, Merch 1976