Embed Size (px)
Citation preview
ATP Synthase Repression in Tobacco RestrictsPhotosynthetic Electron Transport, CO2 Assimilation, andPlant Growth by Overacidification of the Thylakoid Lumen OA
Markus Rott,a,1 Nadia F. Martins,a,1 Wolfram Thiele,a Wolfgang Lein,a Ralph Bock,a David M. Kramer,b
and Mark A. Schottlera,2
aMax-Planck-Institut fur Molekulare Pflanzenphysiologie, D-14476 Potsdam-Golm, GermanybMichigan State University–Department of Energy Plant Research Laboratory and Department of Biochemistry and Molecular
Biology, Michigan State University, East Lansing, Michigan 48824
Tobacco (Nicotiana tabacum) plants strictly adjust the contents of both ATP synthase and cytochrome b6f complex to the
metabolic demand for ATP and NADPH. While the cytochrome b6f complex catalyzes the rate-limiting step of photosyn-
thetic electron flux and thereby controls assimilation, the functional significance of the ATP synthase adjustment is
unknown. Here, we reduced ATP synthase accumulation by an antisense approach directed against the essential nuclear-
encoded g-subunit (AtpC) and by the introduction of point mutations into the translation initiation codon of the plastid-
encoded atpB gene (encoding the essential b-subunit) via chloroplast transformation. Both strategies yielded transformants
with ATP synthase contents ranging from 100 to <10% of wild-type levels. While the accumulation of the components of the
linear electron transport chain was largely unaltered, linear electron flux was strongly inhibited due to decreased rates of
plastoquinol reoxidation at the cytochrome b6f complex (photosynthetic control). Also, nonphotochemical quenching was
triggered at very low light intensities, strongly reducing the quantum efficiency of CO2 fixation. We show evidence that this
is due to an increased steady state proton motive force, resulting in strong lumen overacidification, which in turn represses
photosynthesis due to photosynthetic control and dissipation of excitation energy in the antenna bed.
INTRODUCTION
The capacity of the photosynthetic light reactions to provide ATP
and NADPH must be closely adjusted to their metabolic con-
sumption by the Calvin cycle, the subsequent reactions of dark
metabolism such as starch synthesis, and other anabolic path-
ways within the chloroplast. Upon hyperactivity of the light
reactions, the metabolic regeneration of NADP+, ADP, and Pi
will limit photosynthetic electron transport, resulting in detrimen-
tal side reactions. NADP+ limitation would result in electron
transfer to alternative acceptors, such as O2, generating reactive
oxygen species. These can damage the photosynthetic appara-
tus itself and also initiate cell death responses (Kim et al., 2008).
Reduced ADP and Pi regeneration results in substrate limita-
tion of the thylakoid ATP synthase, reducing proton efflux from
the lumen and resulting in an increase of the proton motive force
(pmf) across the thylakoid membrane (Takizawa et al., 2008;
Kiirats et al., 2009). Under standard growth conditions, the pmf is
partitioned into an electrochemical component (DC) and a pro-
ton gradient (DpH) in such away that the pH value of the thylakoid
lumen is usually kept between 7.0 and 6.5 (Takizawa et al., 2007).
However, in response to short-term imbalances between proton
translocation into the lumen by photosynthetic electron transport
and use of the pmf for ATP synthesis, the pH of the thylakoid
lumen can drop below 6.5. This initiates photoprotective feed-
back responses such as nonphotochemical quenching (qN),
which is the thermal dissipation of excess excitation energy in the
photosystem II (PSII) antenna bed in the form of heat (Szabo
et al., 2005). This is achieved through protonation of the PsbS
antenna protein and by activation of the violaxanthin deep-
oxidase, which converts the xanthophyll violaxanthin into ze-
axanthin. Also, plastoquinol (PQ) reoxidation at the cytochrome
b6f complex (cyt-bf) is slowed down when the lumenal pH falls
below 6.5, thereby restricting linear electron flux (reviewed in
Kramer et al., 1999). This mechanism is called photosynthetic
control.
Although both protective mechanisms become active at pH
values below 6.5, they are fully activated only at a lumenal pH
below 6.0, with the cyt-bf response peaking at slightly lower
pH values than qN (Takizawa et al., 2007). In case of a severe
imbalance between light reactions and dark metabolism, a more
pronounced overacidification of the thylakoid lumen can result in
damage to plastocyanin (PC) and disintegration of the oxygen-
evolving complex of PSII (Krieger and Weis, 1993; Kramer et al.,
1999). However, these types of damage were so far only studied
in vitro (Kramer et al., 1999). It is still a matter of debate whether
or not these highly acidic pH values in the lumen can be es-
tablished in vivo or whether they are efficiently avoided by
1 These authors contributed equally to this work.2 Address correspondence to [email protected] author responsible for distribution of materials integral to thefindings presented in this article in accordance with the policy describedin the Instructions for Authors (www.plantcell.org) is: Mark A. Schottler([email protected]).OAOpen Access articles can be viewed online without a subscription.www.plantcell.org/cgi/doi/10.1105/tpc.110.079111
The Plant Cell, Vol. 23: 304–321, January 2011, www.plantcell.org ã 2011 American Society of Plant Biologists
downregulation of linear electron flux by qN and decreased PQ
reoxidation rates. Also, it is still questionable whether plants can
control the lumenal pH by altering the relative pmf partitioning
into DC and DpH. Under nonstressed conditions, the pmf
partitioning can be highly variable between different plant spe-
cies (Takizawa et al., 2007). Therefore, a variable partitioning of
pmf could conceivably enable plants to regulate the onset of
photoprotective mechanisms and avoid photodamage by over-
acidification.
While the short-term responses of plants to an imbalance
between light reactions and dark metabolism are well under-
stood, much less is known about the long-term adjustment of
photosynthetic electron transport and the proton circuit to a
reduced metabolic demand. Long-term changes in assimilation
capacity are known to occur during leaf ontogenesis, when
assimilation declines with leaf age (Schottler et al., 2004, 2007a),
but also in response to several environmental stresses, such as
drought stress (Tezara et al., 1999). Also, light intensities during
growth strongly alter leaf assimilation capacity. Under the ma-
jority of these conditions, photosystem I (PSI) contents are con-
stant (Anderson et al., 1988; Bailey et al., 2001; Schottler et al.,
2004). Also, PSII contents do not change much, except upon
changes in growth light intensity (Bailey et al., 2001). Good indi-
cations exist that the capacity of linear electron flux is predom-
inantly controlled by cyt-bf contents, which are highly variable
and closely correlated with assimilation capacity (Evans, 1988;
Anderson, 1992). This observation is in line with cyt-bf catalyzing
the rate-limiting reaction step of linear electron transport, PQ
reoxidation (Hope, 2000; Kirchhoff et al., 2000). Indeed, a strong
contribution of cyt-bf to photosynthetic flux control has been
shown by antisense repression of its essential Rieske Fe2-S2–
containing subunit (Price et al., 1995, 1998). PC content was also
shown to correlate with photosynthetic flux rates (Burkey, 1993,
1994; Schottler et al., 2004).
Finally, substantial changes in ATP synthase contents in re-
sponse to changes in light intensity (Anderson et al., 1988; Evans,
1988), leaf age (Schottler et al., 2007a), and drought stress
(Tezara et al., 1999; Kohzuma et al., 2009) have been reported,
and these also parallel assimilation capacities. However, the
functional significance of the adjustments of ATP synthase con-
tent has remained unclear, especially because other components
of the photosynthetic apparatus (in particular, cyt-bf) showparallel
changes under most of these conditions, possibly suggesting a
coregulation.
To determine the contribution of the ATP synthase to pho-
tosynthetic flux control, we specifically repressed the ATP
synthase content in tobacco (Nicotiana tabacum) using two
independent approaches. First, we repressed the AtpC gene
encoding the essential g-subunit with an antisense approach. In
Chlamydomonas reinhardtii, it has been shown that AtpC avail-
ability controls the biogenesis of the ATP synthase complex
(Drapier et al., 2007). Downregulation by an antisense strategy
was appropriate because an Arabidopsis thaliana atpC T-DNA
insertion line suffered from destabilization of the entire complex
and degradation of the other ATP synthase subunits, so that
photophosphorylation was entirely abolished (Bosco et al.,
2004). In addition, we repressed the translation initiation effi-
ciency of the essential chloroplast-encoded b-subunit, encoded
by the atpB gene, which forms part of the catalytic center of the
extrinsic CF1 subcomplex of the ATP synthase.
We report here the generation of transgenic and transplas-
tomic tobacco lines that contain ATP synthase contents from
100% to <10% of wild-type levels. Physiological analysis of lines
with greatly reduced ATP synthase revealed a strongly increased
pmf across the thylakoid membrane, leading to the activation of
photoprotective mechanisms and downregulation of linear elec-
tron flux already in low light. This resulted in repressed leaf as-
similation and plant growth, supporting a central role of the ATP
synthase in regulating photosynthesis. Additionally, the analysis
of these mutants enabled the identification of regulated steps of
ATP synthase biogenesis in higher plants.
RESULTS
Generation of AtpC Antisense Lines and Functional
Organization of Their Photosynthetic Apparatus
The AtpC antisense plants were obtained from a large collection
of antisense lines generated from a tobacco leaf cDNA library
(Lein et al., 2008). The tobacco AtpC antisense construct was
generated from an EST covering a 601-bp-long fragment of the
AtpC gene (spanning positions 760 to 1361 of the coding region).
This region is unique to AtpC. Searches of the AtpC EST against
all known tobacco ESTs (in theNational Center for Biotechnology
Information [NCBI]), the complete Arabidopsis genome (in NCBI
and The Institute for Genomic Research [TIGR]), and all Solana-
ceae species (in TIGR) did not reveal any sequence stretches
with more than 18 bp homology. Therefore, off-target effects of
the chosen antisense sequence are unlikely to occur. However,
as the tobacco genome is not yet fully sequenced, they cannot
be entirely excluded (see Discussion).
Transformation of tobacco plants with the antisense construct
yielded several transgenic lines, two of whichwere characterized
in detail. Whereas one line displayed a strong growth retardation
(line atpC1), the other showed only amild growth phenotype (line
atpC2; Figure 1A). Flowering of the atpC2mutant was delayed on
average by 3 to 4 d, while flowering of the atpC1 mutant was
delayed by several weeks in comparison to the wild type. In
general, the strength of the growth phenotypes was somewhat
variable between individual progeny plants. This is typical of
antisense transformants because the underlying epigenetic ef-
fect is reset in meiosis (Kooter et al., 1999).
Transcript accumulation was analyzed by RNA gel blot anal-
ysis and revealed a much stronger repression of the AtpC
transcript abundance in line atpC1, in agreement with the growth
phenotypes (Figure 1B). To analyze adaptive responses of the
photosynthetic apparatus to the AtpC antisense repression, we
determined several physiological parameters using the youngest
fully expanded leaf of plants at the onset of flowering, usually leaf
number six or seven from the top. We measured leaf absorp-
tance and chlorophyll content, chlorophyll a/b ratio, assimilation
and respiration capacities, the quantum efficiency of CO2 as-
similation, maximum quantum efficiency of PSII, and photosyn-
thetic complex contents (Table 1). While chlorophyll content,
chlorophyll a/b ratio, and leaf absorptance were comparable in
ATP Synthase Regulates Photosynthesis 305
the wild type and the weak atpC2 antisense line, the strong
antisense line suffered from a slight reduction in chlorophyll
content, which, however, did not significantly alter leaf absorp-
tance. The most pronounced effect in the strong antisense line
was a clear reduction in leaf assimilation capacity to ;40% of
the levels in the wild type and the atpC2 plants. Respiration was
unaltered. The quantum efficiency of CO2 assimilation, as deter-
mined from the linear ranges of light response curves between 0
and 40mmol photonsm22 s21, was slightly reduced in the strong
antisense line.
Interestingly, the chlorophyll a/b ratio was clearly reduced
in the strong atpC1 mutant, suggesting a remodeling of the
photosynthetic apparatus. Therefore, photosynthetic complex
accumulation was determined spectroscopically. When normal-
ized to chlorophyll content, neither PSII nor cyt-bf contents differ
significantly between the wild type and the antisense lines. Also,
PSII function does not seem to be impaired in the antisense lines,
as indicated by the unaltered Fv/Fm values of dark-adapted
leaves (Table 1). Interestingly, PC accumulationwas increased to
150%of wild-type levels in the strong antisense line, while its PSI
contents were slightly reduced, which concurs with its reduced
chlorophyll a/b ratio (Table 1). These spectroscopic data were
independently confirmed by protein gel blots (Figure 1C). No
changes in the accumulation of PSII (probed with an antibody
directed against the essential reaction center subunit PsbD), cyt-
bf (probed with an antibody against the essential PetA subunit),
and PSI (probed with an antibody against the essential reaction
center subunit PsaA) could be detected. The small decrease of
redox-active PSI determined spectroscopically is below the
resolution of protein gel blots.
The content of ATP synthase, as determined using an antibody
against AtpA, the essential a-subunit of CF1, was clearly dimin-
ished in both antisense lines (Figure 1C). While in the weak
antisense line atpC2, ATP synthase contents ranging between
100 and ;65% of wild-type levels were observed, the ATP
synthase content was much more reduced in the strong anti-
sense line atpC1. In this line, ATP synthase contents ranging
between 25 and 10%of thewild-type contents were determined.
We only probed a single subunit of the ATP synthase, as loss of
all subunits had previously been shown for anAtpC knockout line
in Arabidopsis, indicating that all other subunits are degraded
when they cannot assemble together with AtpC into a stable
complex (Bosco et al., 2004).
The effects of AtpC suppression on antenna complexes was
assessed by 77K chlorophyll-a fluorescence emission spectra
(Figure 1D), which, in the mutants, do not differ from the wild
type, indicating that the strong antisense line can compensate for
the small reduction in PSI reaction center contents by an antenna
redistribution between both photosystems. In summary, these
data suggest that the pronounced growth phenotype of the
strong antisense line is specifically attributable to the reduced
ATP synthase abundance.
Generation and Molecular Characterization of atpB
Translation Initiation Mutants
To test an independent set of ATP synthase mutants that do not
rely on epigenetic suppression of nuclear gene expression, we
also wanted to reduce the expression level of an essential plastid
genome-encoded ATP synthase subunit by generating trans-
plastomic tobacco plants. To this end, point mutations were
introduced into the AUG translation initiation codon of the atpB
mRNA. The translation initiation codon is a major determinant
of the rate of plastid translation initiation (Sugiura et al., 1998;
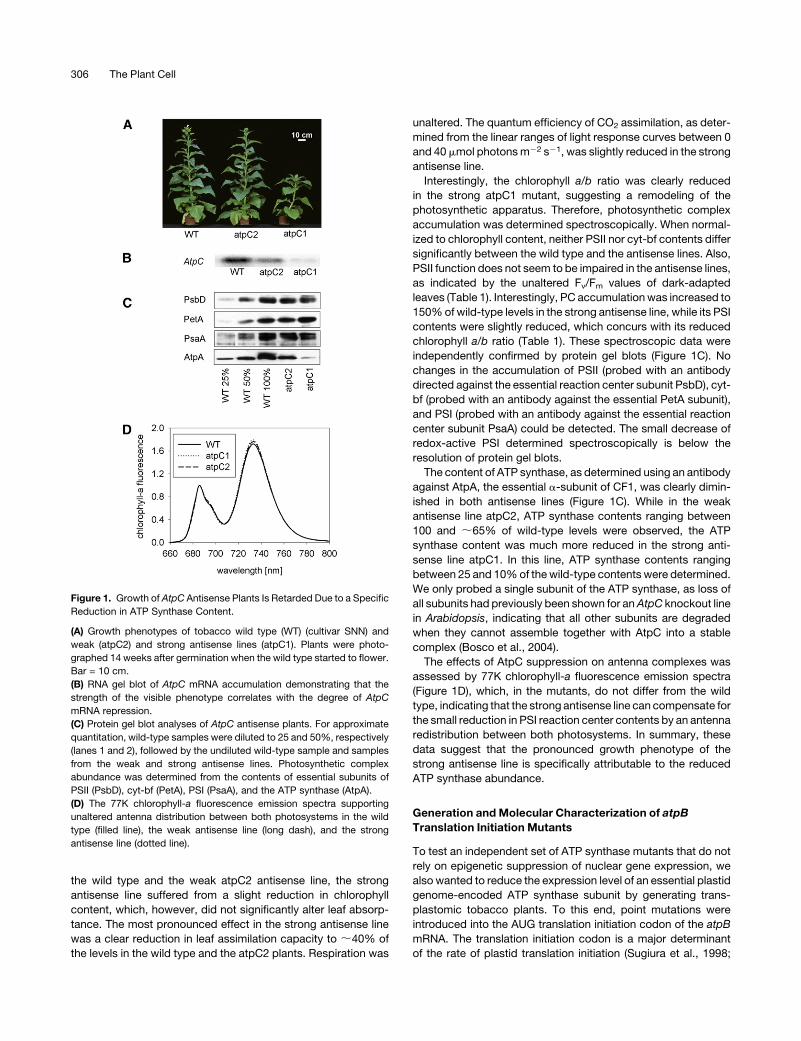
Figure 1. Growth of AtpC Antisense Plants Is Retarded Due to a Specific
Reduction in ATP Synthase Content.
(A) Growth phenotypes of tobacco wild type (WT) (cultivar SNN) and
weak (atpC2) and strong antisense lines (atpC1). Plants were photo-
graphed 14 weeks after germination when the wild type started to flower.
Bar = 10 cm.
(B) RNA gel blot of AtpC mRNA accumulation demonstrating that the
strength of the visible phenotype correlates with the degree of AtpC
mRNA repression.
(C) Protein gel blot analyses of AtpC antisense plants. For approximate
quantitation, wild-type samples were diluted to 25 and 50%, respectively
(lanes 1 and 2), followed by the undiluted wild-type sample and samples
from the weak and strong antisense lines. Photosynthetic complex
abundance was determined from the contents of essential subunits of
PSII (PsbD), cyt-bf (PetA), PSI (PsaA), and the ATP synthase (AtpA).
(D) The 77K chlorophyll-a fluorescence emission spectra supporting
unaltered antenna distribution between both photosystems in the wild
type (filled line), the weak antisense line (long dash), and the strong
antisense line (dotted line).
306 The Plant Cell
Majeran et al., 2000). In addition to the standard translation
initiation codon AUG, two alternative start codons exist in plas-
tids: GUG and UUG. While GUG is used as an initiation codon in
both algae and higher plant chloroplasts, UUG has so far been
found only in eukaryotic algae (Sugiura et al., 1998; Hirose et al.,
1999). In a tobacco in vitro translation system, both alternative
start codons can be recognized as translation initiation codons,
but their translation initiation efficiency is much lower than that of
the standard AUGcodon (Hirose et al., 1999; Hirose and Sugiura,
2004). Therefore, transplastomic plants with these point muta-
tions should accumulate reduced amounts of chloroplast ATP
synthase.
The TTG and GTG mutations were introduced into a cloned
plastid DNA fragment, and a chimeric aadA gene was inserted in
the intergenic spacer between the rbcL gene and atpB (Figure
2A). The aadA confers resistance to spectinomycin and serves as
a selectable marker gene for chloroplast transformation (Svab
and Maliga, 1993). The resulting transformation vectors were
termed aadA-atpB (control construct containing the aadA but no
mutation in the start codon), TTG-atpB, and GTG-atpB (Figure
2A). Chloroplast transformation experiments using the biolistic
protocol yielded several transplastomic lines, which were puri-
fied to homoplasmy by additional selection and regeneration
rounds. Two lines per construct were characterized in detail
(Figures 2B to 2D). First, homoplasmy of the transformants was
confirmed by restriction fragment length polymorphism analysis
(Figure 2B). All mutant lines exclusively gave rise to a single
hybridization signal of 7.2 kb, strongly suggesting that they were
homoplasmic. Subsequently, the homoplasmic presence of the
point mutations in the TTG-atpB and GTG-atpB mutants was
confirmed by DNA sequencing. Finally, inheritance tests were
performed as the most sensitive approach to distinguish homo-
plasmy from heteroplasmy (Svab andMaliga, 1993; Bock, 2001).
Wild-type seeds germinated on spectinomycin were completely
white, while the mutant seedlings were homogeneously green,
confirming the homoplasmic state of the transformants.
To characterize atpB expression in the transplastomic lines,
we first compared transcript accumulation for atpB, rbcL, aadA,
and the nuclear-encoded AtpC gene by RNA gel blot analysis
(Figure 2C). The wild type displayed two similarly abundant
bands for the atpB transcript, which may be attributable to the
presence ofmultiple promoters upstreamof the atpB gene (Chen
et al., 1990). By contrast, all transformants contained only the
shorter atpB transcript, which accumulated to similar levels as in
the wild type. This indicates that the insertion of the aadA
selectablemarker gene has disrupted one of the atpBpromoters.
Accumulation of the rbcL mRNA was unaltered in all transform-
ants, confirming that the insertion of the selectable marker gene
between atpB and rbcL did not interfere with rbcL transcript
accumulation. As expected, the aadA selectable marker gene
was strongly expressed in all mutants and not detectable in the
wild type. Expression of the nuclear AtpC gene was unaltered in
all transformants when compared with the wild type.
To assess the effects of the TTG-atpB and GTG-atpB point
mutations on translation, we determined the degree of polysome
loading of the atpB mRNA as a proxy of translational activity
(Barkan, 1998; Figure 2D). Sucrose gradient ultracentrifugation
was used to separate mRNAs according to their loading with
ribosomes, and six fractions were collected from the gradient
after centrifugation. To distinguish between fractions of the
sucrose gradient containing free atpB mRNA that is not associ-
ated with ribosomes and fractions containing the ribosome-
associated, actively translated mRNAs, a sample was treated
with puromycin, resulting in ribosome dissociation and release of
the mRNA. The puromycin control indicates that free mRNAs are
strongly enriched in fraction 2 of the sucrose gradient, while
almost no signal is obtained for fractions 4 to 6. Therefore,
mRNAs found in fractions 4 to 6 are ribosome associated and
actively translated.
For thewild type, the strongest mRNA signals were obtained in
fractions 4 and 5 (Figure 2D), while considerably weaker signals
were detectable in fractions 3 and 6. Both atpB transcript
species showed the same distribution in the gradient, indicating
that their translation efficiency is comparable. The aadA-atpB
control showed a similar mRNA distribution in the sucrose
gradient as the wild type, suggesting that the translation rates
are very similar to those in the wild type. The TTG-atpBmutation
resulted in a clear shift of the polysome profile toward the
upper fractions, indicating reduced translational efficiency.
However, the strongest signal was still observed in fraction
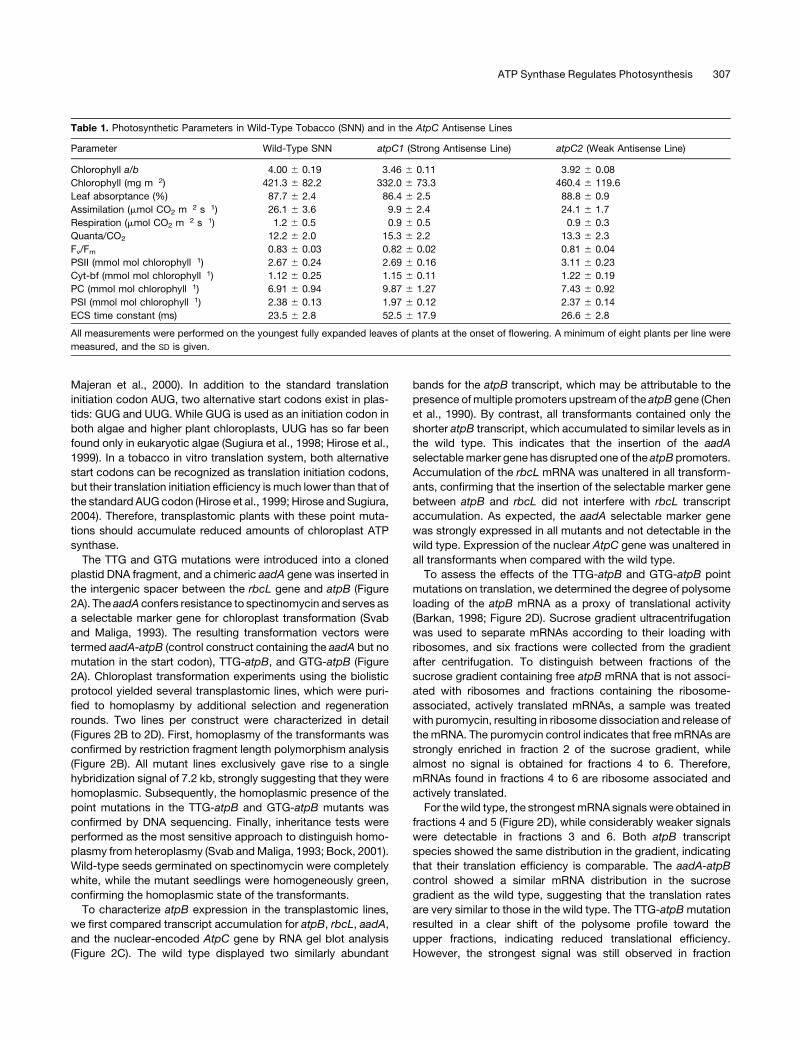
Table 1. Photosynthetic Parameters in Wild-Type Tobacco (SNN) and in the AtpC Antisense Lines
Parameter Wild-Type SNN atpC1 (Strong Antisense Line) atpC2 (Weak Antisense Line)
Chlorophyll a/b 4.00 6 0.19 3.46 6 0.11 3.92 6 0.08
Chlorophyll (mg m�2) 421.3 6 82.2 332.0 6 73.3 460.4 6 119.6
Leaf absorptance (%) 87.7 6 2.4 86.4 6 2.5 88.8 6 0.9
Assimilation (mmol CO2 m�2 s�1) 26.1 6 3.6 9.9 6 2.4 24.1 6 1.7
Respiration (mmol CO2 m�2 s�1) �1.2 6 0.5 �0.9 6 0.5 �0.9 6 0.3
Quanta/CO2 12.2 6 2.0 15.3 6 2.2 13.3 6 2.3
Fv/Fm 0.83 6 0.03 0.82 6 0.02 0.81 6 0.04
PSII (mmol mol chlorophyll�1) 2.67 6 0.24 2.69 6 0.16 3.11 6 0.23
Cyt-bf (mmol mol chlorophyll�1) 1.12 6 0.25 1.15 6 0.11 1.22 6 0.19
PC (mmol mol chlorophyll�1) 6.91 6 0.94 9.87 6 1.27 7.43 6 0.92
PSI (mmol mol chlorophyll�1) 2.38 6 0.13 1.97 6 0.12 2.37 6 0.14
ECS time constant (ms) 23.5 6 2.8 52.5 6 17.9 26.6 6 2.8
All measurements were performed on the youngest fully expanded leaves of plants at the onset of flowering. A minimum of eight plants per line were
measured, and the SD is given.
ATP Synthase Regulates Photosynthesis 307
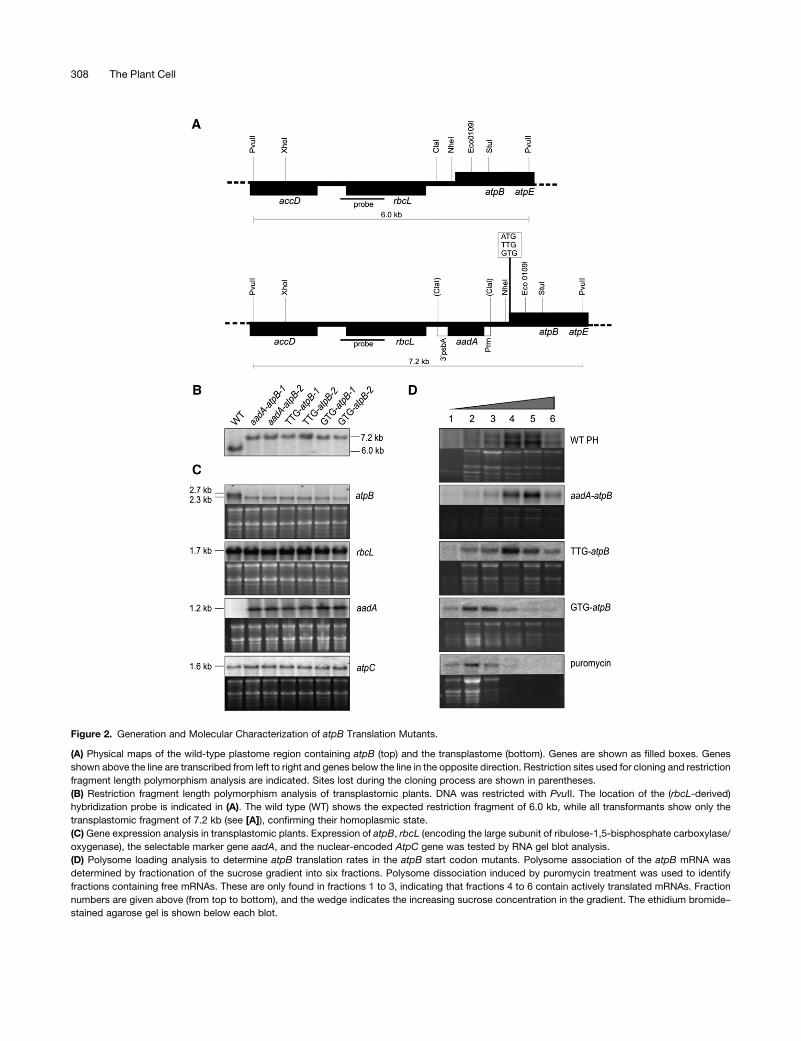
Figure 2. Generation and Molecular Characterization of atpB Translation Mutants.
(A) Physical maps of the wild-type plastome region containing atpB (top) and the transplastome (bottom). Genes are shown as filled boxes. Genes
shown above the line are transcribed from left to right and genes below the line in the opposite direction. Restriction sites used for cloning and restriction
fragment length polymorphism analysis are indicated. Sites lost during the cloning process are shown in parentheses.
(B) Restriction fragment length polymorphism analysis of transplastomic plants. DNA was restricted with PvuII. The location of the (rbcL-derived)
hybridization probe is indicated in (A). The wild type (WT) shows the expected restriction fragment of 6.0 kb, while all transformants show only the
transplastomic fragment of 7.2 kb (see [A]), confirming their homoplasmic state.
(C) Gene expression analysis in transplastomic plants. Expression of atpB, rbcL (encoding the large subunit of ribulose-1,5-bisphosphate carboxylase/
oxygenase), the selectable marker gene aadA, and the nuclear-encoded AtpC gene was tested by RNA gel blot analysis.
(D) Polysome loading analysis to determine atpB translation rates in the atpB start codon mutants. Polysome association of the atpB mRNA was
determined by fractionation of the sucrose gradient into six fractions. Polysome dissociation induced by puromycin treatment was used to identify
fractions containing free mRNAs. These are only found in fractions 1 to 3, indicating that fractions 4 to 6 contain actively translated mRNAs. Fraction
numbers are given above (from top to bottom), and the wedge indicates the increasing sucrose concentration in the gradient. The ethidium bromide–
stained agarose gel is shown below each blot.
308 The Plant Cell
four, suggesting that the majority of the atpB mRNA is still
translated. By contrast, the GTG-atpB mutant showed a severe
alteration of the polysome profile. Similar to the puromycin
control, signals were only obtained for the upper three fractions
(Figure 2D), suggesting that atpB translation was largely abol-
ished in this mutant.
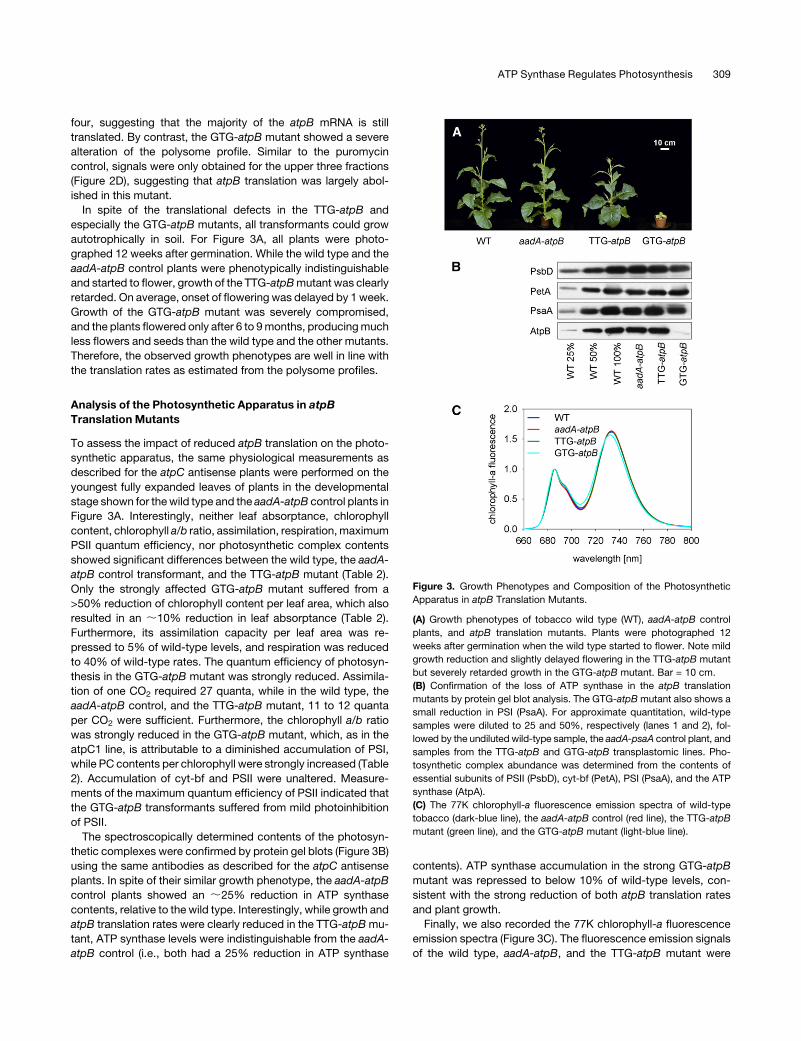
In spite of the translational defects in the TTG-atpB and
especially the GTG-atpB mutants, all transformants could grow
autotrophically in soil. For Figure 3A, all plants were photo-
graphed 12 weeks after germination. While the wild type and the
aadA-atpB control plants were phenotypically indistinguishable
and started to flower, growth of the TTG-atpBmutant was clearly
retarded. On average, onset of flowering was delayed by 1 week.
Growth of the GTG-atpB mutant was severely compromised,
and the plants flowered only after 6 to 9months, producingmuch
less flowers and seeds than the wild type and the other mutants.
Therefore, the observed growth phenotypes are well in line with
the translation rates as estimated from the polysome profiles.
Analysis of the Photosynthetic Apparatus in atpB
Translation Mutants
To assess the impact of reduced atpB translation on the photo-
synthetic apparatus, the same physiological measurements as
described for the atpC antisense plants were performed on the
youngest fully expanded leaves of plants in the developmental
stage shown for thewild type and the aadA-atpB control plants in
Figure 3A. Interestingly, neither leaf absorptance, chlorophyll
content, chlorophyll a/b ratio, assimilation, respiration,maximum
PSII quantum efficiency, nor photosynthetic complex contents
showed significant differences between the wild type, the aadA-
atpB control transformant, and the TTG-atpB mutant (Table 2).
Only the strongly affected GTG-atpB mutant suffered from a
>50% reduction of chlorophyll content per leaf area, which also
resulted in an ;10% reduction in leaf absorptance (Table 2).
Furthermore, its assimilation capacity per leaf area was re-
pressed to 5% of wild-type levels, and respiration was reduced
to 40% of wild-type rates. The quantum efficiency of photosyn-
thesis in the GTG-atpB mutant was strongly reduced. Assimila-
tion of one CO2 required 27 quanta, while in the wild type, the
aadA-atpB control, and the TTG-atpB mutant, 11 to 12 quanta
per CO2 were sufficient. Furthermore, the chlorophyll a/b ratio
was strongly reduced in the GTG-atpB mutant, which, as in the
atpC1 line, is attributable to a diminished accumulation of PSI,
while PC contents per chlorophyll were strongly increased (Table
2). Accumulation of cyt-bf and PSII were unaltered. Measure-
ments of the maximum quantum efficiency of PSII indicated that
the GTG-atpB transformants suffered from mild photoinhibition
of PSII.
The spectroscopically determined contents of the photosyn-
thetic complexes were confirmed by protein gel blots (Figure 3B)
using the same antibodies as described for the atpC antisense
plants. In spite of their similar growth phenotype, the aadA-atpB
control plants showed an ;25% reduction in ATP synthase
contents, relative to the wild type. Interestingly, while growth and
atpB translation rates were clearly reduced in the TTG-atpBmu-
tant, ATP synthase levels were indistinguishable from the aadA-
atpB control (i.e., both had a 25% reduction in ATP synthase
contents). ATP synthase accumulation in the strong GTG-atpB
mutant was repressed to below 10% of wild-type levels, con-
sistent with the strong reduction of both atpB translation rates
and plant growth.
Finally, we also recorded the 77K chlorophyll-a fluorescence
emission spectra (Figure 3C). The fluorescence emission signals
of the wild type, aadA-atpB, and the TTG-atpB mutant were
Figure 3. Growth Phenotypes and Composition of the Photosynthetic
Apparatus in atpB Translation Mutants.
(A) Growth phenotypes of tobacco wild type (WT), aadA-atpB control
plants, and atpB translation mutants. Plants were photographed 12
weeks after germination when the wild type started to flower. Note mild
growth reduction and slightly delayed flowering in the TTG-atpB mutant
but severely retarded growth in the GTG-atpB mutant. Bar = 10 cm.
(B) Confirmation of the loss of ATP synthase in the atpB translation
mutants by protein gel blot analysis. The GTG-atpBmutant also shows a
small reduction in PSI (PsaA). For approximate quantitation, wild-type
samples were diluted to 25 and 50%, respectively (lanes 1 and 2), fol-
lowed by the undiluted wild-type sample, the aadA-psaA control plant, and
samples from the TTG-atpB and GTG-atpB transplastomic lines. Pho-
tosynthetic complex abundance was determined from the contents of
essential subunits of PSII (PsbD), cyt-bf (PetA), PSI (PsaA), and the ATP
synthase (AtpA).
(C) The 77K chlorophyll-a fluorescence emission spectra of wild-type
tobacco (dark-blue line), the aadA-atpB control (red line), the TTG-atpB
mutant (green line), and the GTG-atpB mutant (light-blue line).
ATP Synthase Regulates Photosynthesis 309
indistinguishable, which is consistent with unaltered photosyn-
thetic complex accumulation and chlorophyll a/b ratios, sug-
gesting that also their antenna organization is unaltered. By
contrast, the strongGTG-atpBmutant showed a small shift of the
PSI emission maximum from 733- to 731-nm wavelength. This
shift is indicative of the presence of light-harvesting complex I
proteins uncoupled from PSI, which would be in agreement with
the reduced PSI accumulation and the decreased chlorophyll a/b
ratio (Table 2).
ATP Synthase Activity Strictly Correlates with Linear
Electron Flux and Assimilation Capacity but Not with ATP
Synthase Contents
To understand the strong effect of ATP synthase repression on
growth in both the atpC1 antisense and theGTG-atpB translation
mutant in more detail, we next determined the ATP synthase
activity by means of the fast dark-relaxation kinetics of the
maximum electrochromic absorption shift (ECST), which repre-
sents a measure of the light-induced pmf across the thylakoid
membrane (Cruz et al., 2001; Kramer et al., 2003; Takizawa et al.,
2007). The relaxation of the pmf upon a light–dark transition is
determined mainly by the efflux rate of protons through the ATP
synthase and therefore serves as a measure for ATP synthase
activity. All measurements were performed under steady state
conditions with a fully activated Calvin cycle and in saturating
CO2 to avoid limitation of ATP synthase activity by the metabolic
regeneration of ADP and inorganic phosphate.
The average relaxation halftime was 23.5 ms in the wild-type
cultivar SNN (Table 1) and nearly unaltered in the weak atpC2
antisense line (26.6 ms), indicating that ATP synthase activity
is largely unaffected in fully expanded leaves. In the strong
antisense line, the halftime was increased to 53 ms (i.e., ATP
synthase activity was reduced to <50% of wild-type levels).
Among the atpB translation mutants, only the GTG-atpB mutant
showed a drastic alteration of the pmf relaxation halftime. While
the wild type, the aadA-atpB control, and the TTG-atpB plants all
displayed relaxation half-times of 22 to 24ms, the relaxation half-
time was increased to 90 ms in the GTG-atpB mutant (Table 2),
revealing that thylakoid membrane proton conductivity was
reduced to 25% of wild-type values.
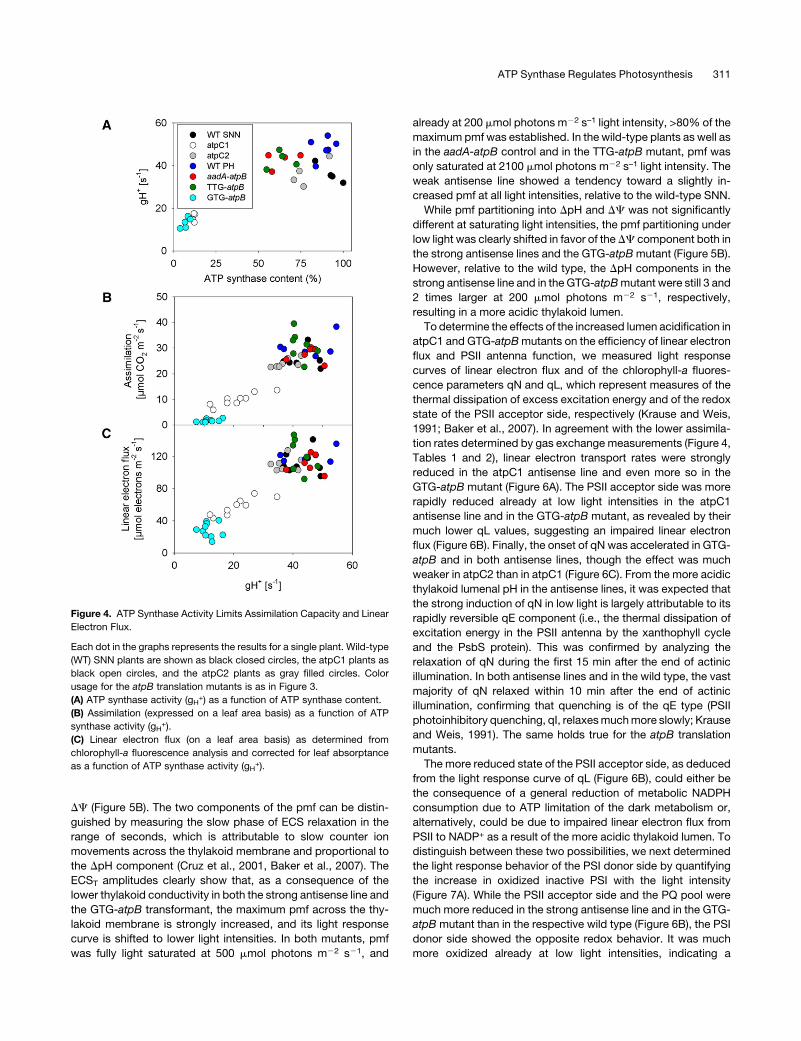
To analyze the dependence of ATP synthase activity on ATP
synthase content in more detail, we performed quantitative
protein gel blots. ATP synthase contents of all samples were
normalized relative to the sample with the highest enzyme
content. The reciprocal values of the relaxation halftime (e.g.,
the conductivity of the thylakoid membrane to protons [gH+],
which is proportional to ATP synthase activity) were then plotted
as a function of ATP synthase content (Figure 4A). An up to 50%
reduction in ATP synthase content does not result in a clear
decrease of ATP synthase activity, strongly indicating a complex
posttranslational regulation of ATP synthase activity. Only for the
atpC1 antisense line and the GTG-atpB translation initiation
mutant was a clear correlation between content and activity
observed.
Next, we analyzed the dependence of assimilation capacities
per leaf area (Figure 4B) and linear electron flux (as determined
from the quantum yield of PSII after correction for leaf absorp-
tance; Figure 4C) on ATP synthase activity (gH+). In theGTG-atpB
mutant and the atpC1 antisense line, a clear correlation between
ATP synthase activity, assimilation capacity, and linear electron
flux was observed, suggesting that ATP synthase activity is
limiting leaf assimilation and controlling electron transport once
ATP synthase is strongly repressed.
ATP Synthase Repression Results in Increased Lumen
Acidification and Accelerated Induction of
Photoprotective Mechanisms
To test if the parallel repression of leaf assimilation and ATP
synthase activity is a consequence of a restricted availability of
ATP to the Calvin cycle or, alternatively, is due to feedback
effects of the reduced thylakoid conductivity on electron trans-
port, we analyzed the responses of linear electron flux and the
proton circuit in detail. First, we determined light response
curves of the pmf (Figure 5A) and its partitioning into DpH and
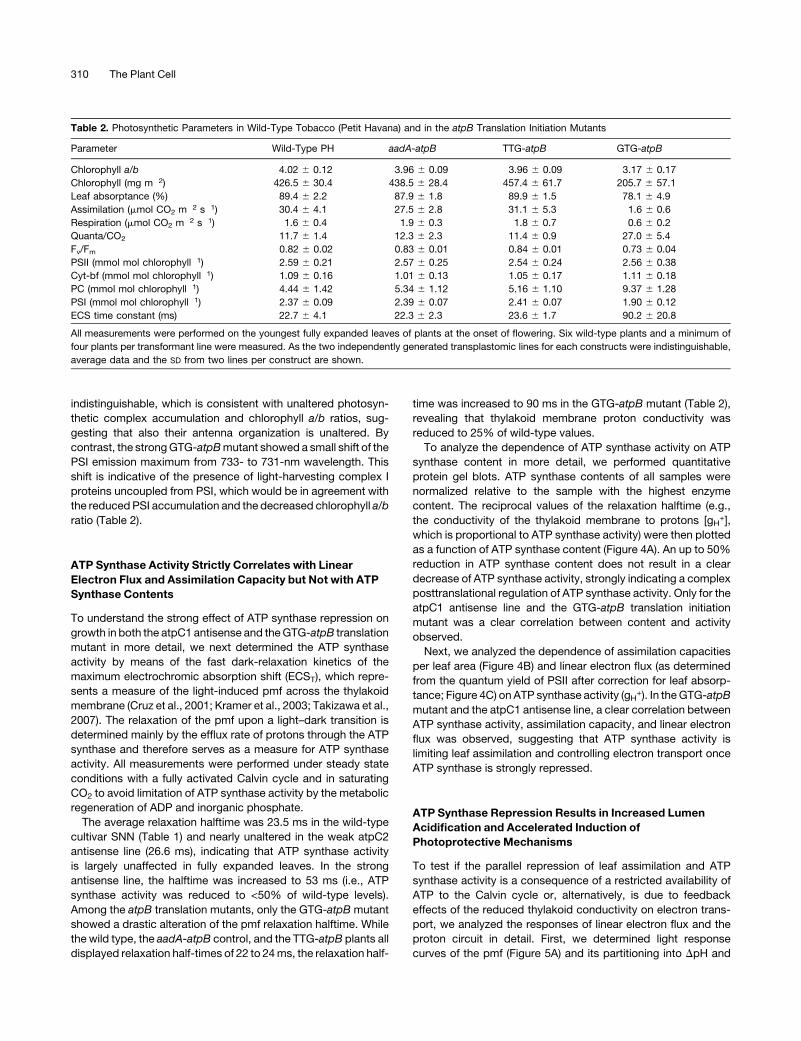
Table 2. Photosynthetic Parameters in Wild-Type Tobacco (Petit Havana) and in the atpB Translation Initiation Mutants
Parameter Wild-Type PH aadA-atpB TTG-atpB GTG-atpB
Chlorophyll a/b 4.02 6 0.12 3.96 6 0.09 3.96 6 0.09 3.17 6 0.17
Chlorophyll (mg m�2) 426.5 6 30.4 438.5 6 28.4 457.4 6 61.7 205.7 6 57.1
Leaf absorptance (%) 89.4 6 2.2 87.9 6 1.8 89.9 6 1.5 78.1 6 4.9
Assimilation (mmol CO2 m�2 s�1) 30.4 6 4.1 27.5 6 2.8 31.1 6 5.3 1.6 6 0.6
Respiration (mmol CO2 m�2 s�1) �1.6 6 0.4 �1.9 6 0.3 �1.8 6 0.7 �0.6 6 0.2
Quanta/CO2 11.7 6 1.4 12.3 6 2.3 11.4 6 0.9 27.0 6 5.4
Fv/Fm 0.82 6 0.02 0.83 6 0.01 0.84 6 0.01 0.73 6 0.04
PSII (mmol mol chlorophyll�1) 2.59 6 0.21 2.57 6 0.25 2.54 6 0.24 2.56 6 0.38
Cyt-bf (mmol mol chlorophyll�1) 1.09 6 0.16 1.01 6 0.13 1.05 6 0.17 1.11 6 0.18
PC (mmol mol chlorophyll�1) 4.44 6 1.42 5.34 6 1.12 5.16 6 1.10 9.37 6 1.28
PSI (mmol mol chlorophyll�1) 2.37 6 0.09 2.39 6 0.07 2.41 6 0.07 1.90 6 0.12
ECS time constant (ms) 22.7 6 4.1 22.3 6 2.3 23.6 6 1.7 90.2 6 20.8
All measurements were performed on the youngest fully expanded leaves of plants at the onset of flowering. Six wild-type plants and a minimum of
four plants per transformant line were measured. As the two independently generated transplastomic lines for each constructs were indistinguishable,
average data and the SD from two lines per construct are shown.
310 The Plant Cell
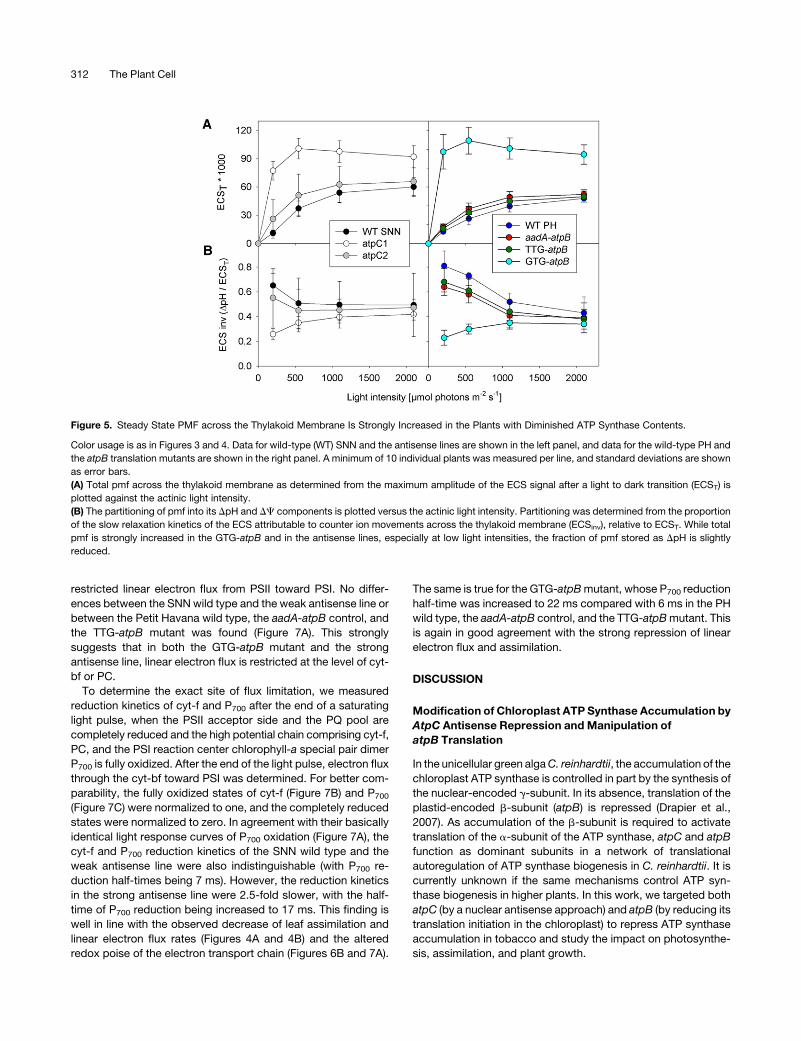
DC (Figure 5B). The two components of the pmf can be distin-
guished by measuring the slow phase of ECS relaxation in the
range of seconds, which is attributable to slow counter ion
movements across the thylakoid membrane and proportional to
the DpH component (Cruz et al., 2001, Baker et al., 2007). The
ECST amplitudes clearly show that, as a consequence of the
lower thylakoid conductivity in both the strong antisense line and
the GTG-atpB transformant, the maximum pmf across the thy-
lakoid membrane is strongly increased, and its light response
curve is shifted to lower light intensities. In both mutants, pmf
was fully light saturated at 500 mmol photons m22 s21, and
already at 200 mmol photons m22 s–1 light intensity, >80% of the
maximum pmf was established. In the wild-type plants as well as
in the aadA-atpB control and in the TTG-atpB mutant, pmf was
only saturated at 2100 mmol photons m22 s–1 light intensity. The
weak antisense line showed a tendency toward a slightly in-
creased pmf at all light intensities, relative to the wild-type SNN.
While pmf partitioning into DpH and DC was not significantly
different at saturating light intensities, the pmf partitioning under
low light was clearly shifted in favor of the DC component both in
the strong antisense lines and the GTG-atpBmutant (Figure 5B).
However, relative to the wild type, the DpH components in the
strong antisense line and in the GTG-atpBmutant were still 3 and
2 times larger at 200 mmol photons m22 s21, respectively,
resulting in a more acidic thylakoid lumen.
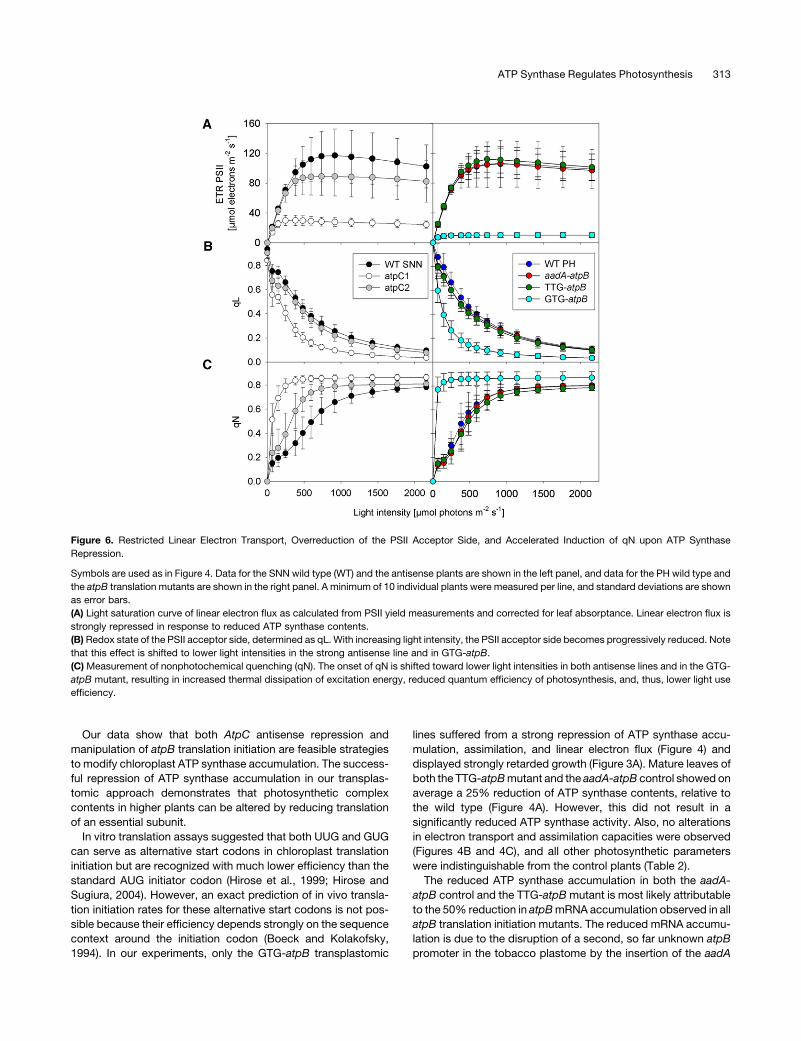
To determine the effects of the increased lumen acidification in
atpC1 and GTG-atpBmutants on the efficiency of linear electron
flux and PSII antenna function, we measured light response
curves of linear electron flux and of the chlorophyll-a fluores-
cence parameters qN and qL, which represent measures of the
thermal dissipation of excess excitation energy and of the redox
state of the PSII acceptor side, respectively (Krause and Weis,
1991; Baker et al., 2007). In agreement with the lower assimila-
tion rates determined by gas exchange measurements (Figure 4,
Tables 1 and 2), linear electron transport rates were strongly
reduced in the atpC1 antisense line and even more so in the
GTG-atpB mutant (Figure 6A). The PSII acceptor side was more
rapidly reduced already at low light intensities in the atpC1
antisense line and in the GTG-atpB mutant, as revealed by their
much lower qL values, suggesting an impaired linear electron
flux (Figure 6B). Finally, the onset of qN was accelerated in GTG-
atpB and in both antisense lines, though the effect was much
weaker in atpC2 than in atpC1 (Figure 6C). From the more acidic
thylakoid lumenal pH in the antisense lines, it was expected that
the strong induction of qN in low light is largely attributable to its
rapidly reversible qE component (i.e., the thermal dissipation of
excitation energy in the PSII antenna by the xanthophyll cycle
and the PsbS protein). This was confirmed by analyzing the
relaxation of qN during the first 15 min after the end of actinic
illumination. In both antisense lines and in the wild type, the vast
majority of qN relaxed within 10 min after the end of actinic
illumination, confirming that quenching is of the qE type (PSII
photoinhibitory quenching, qI, relaxesmuchmore slowly; Krause
and Weis, 1991). The same holds true for the atpB translation
mutants.
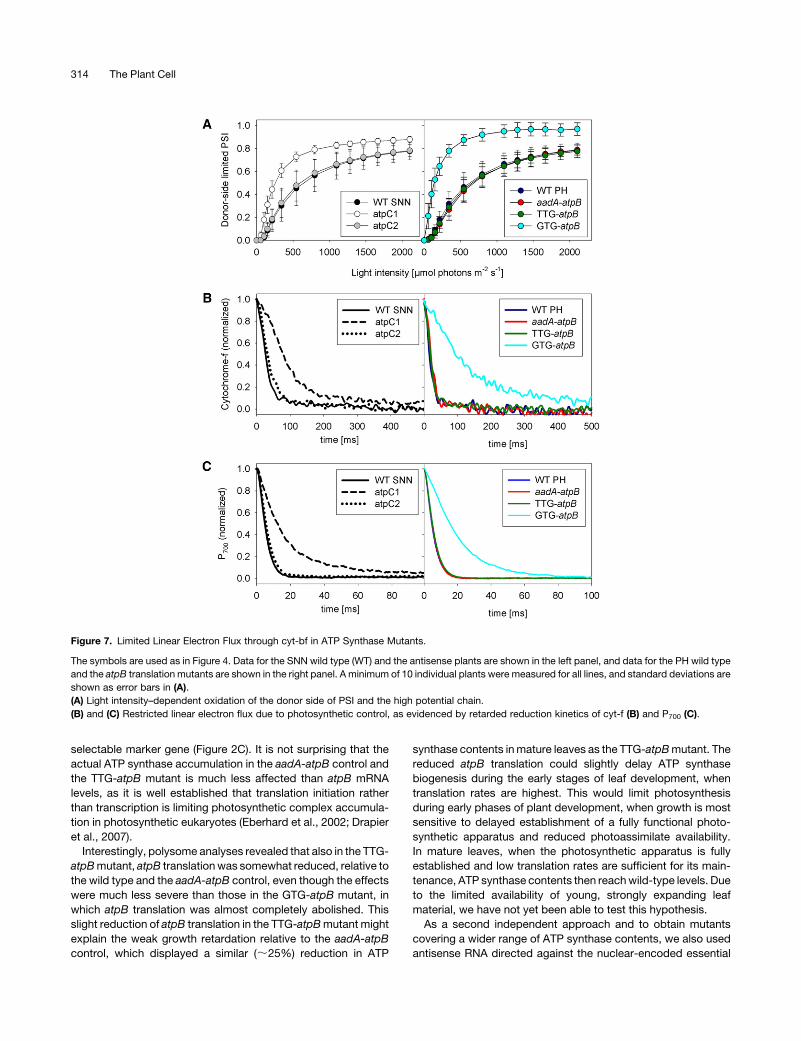
The more reduced state of the PSII acceptor side, as deduced
from the light response curve of qL (Figure 6B), could either be
the consequence of a general reduction of metabolic NADPH
consumption due to ATP limitation of the dark metabolism or,
alternatively, could be due to impaired linear electron flux from
PSII to NADP+ as a result of the more acidic thylakoid lumen. To
distinguish between these two possibilities, we next determined
the light response behavior of the PSI donor side by quantifying
the increase in oxidized inactive PSI with the light intensity
(Figure 7A). While the PSII acceptor side and the PQ pool were
much more reduced in the strong antisense line and in the GTG-
atpB mutant than in the respective wild type (Figure 6B), the PSI
donor side showed the opposite redox behavior. It was much
more oxidized already at low light intensities, indicating a
Figure 4. ATP Synthase Activity Limits Assimilation Capacity and Linear
Electron Flux.
Each dot in the graphs represents the results for a single plant. Wild-type
(WT) SNN plants are shown as black closed circles, the atpC1 plants as
black open circles, and the atpC2 plants as gray filled circles. Color
usage for the atpB translation mutants is as in Figure 3.
(A) ATP synthase activity (gH+) as a function of ATP synthase content.
(B) Assimilation (expressed on a leaf area basis) as a function of ATP
synthase activity (gH+).
(C) Linear electron flux (on a leaf area basis) as determined from
chlorophyll-a fluorescence analysis and corrected for leaf absorptance
as a function of ATP synthase activity (gH+).
ATP Synthase Regulates Photosynthesis 311
restricted linear electron flux from PSII toward PSI. No differ-
ences between the SNNwild type and the weak antisense line or
between the Petit Havana wild type, the aadA-atpB control, and
the TTG-atpB mutant was found (Figure 7A). This strongly
suggests that in both the GTG-atpB mutant and the strong
antisense line, linear electron flux is restricted at the level of cyt-
bf or PC.
To determine the exact site of flux limitation, we measured
reduction kinetics of cyt-f and P700 after the end of a saturating
light pulse, when the PSII acceptor side and the PQ pool are
completely reduced and the high potential chain comprising cyt-f,
PC, and the PSI reaction center chlorophyll-a special pair dimer
P700 is fully oxidized. After the end of the light pulse, electron flux
through the cyt-bf toward PSI was determined. For better com-
parability, the fully oxidized states of cyt-f (Figure 7B) and P700
(Figure 7C) were normalized to one, and the completely reduced
states were normalized to zero. In agreement with their basically
identical light response curves of P700 oxidation (Figure 7A), the
cyt-f and P700 reduction kinetics of the SNN wild type and the
weak antisense line were also indistinguishable (with P700 re-
duction half-times being 7 ms). However, the reduction kinetics
in the strong antisense line were 2.5-fold slower, with the half-
time of P700 reduction being increased to 17 ms. This finding is
well in line with the observed decrease of leaf assimilation and
linear electron flux rates (Figures 4A and 4B) and the altered
redox poise of the electron transport chain (Figures 6B and 7A).
The same is true for the GTG-atpBmutant, whose P700 reduction
half-time was increased to 22 ms compared with 6 ms in the PH
wild type, the aadA-atpB control, and the TTG-atpBmutant. This
is again in good agreement with the strong repression of linear
electron flux and assimilation.
DISCUSSION
Modification of Chloroplast ATP Synthase Accumulation by
AtpC Antisense Repression and Manipulation of
atpB Translation
In the unicellular green algaC. reinhardtii, the accumulation of the
chloroplast ATP synthase is controlled in part by the synthesis of
the nuclear-encoded g-subunit. In its absence, translation of the
plastid-encoded b-subunit (atpB) is repressed (Drapier et al.,
2007). As accumulation of the b-subunit is required to activate
translation of the a-subunit of the ATP synthase, atpC and atpB
function as dominant subunits in a network of translational
autoregulation of ATP synthase biogenesis in C. reinhardtii. It is
currently unknown if the same mechanisms control ATP syn-
thase biogenesis in higher plants. In this work, we targeted both
atpC (by a nuclear antisense approach) and atpB (by reducing its
translation initiation in the chloroplast) to repress ATP synthase
accumulation in tobacco and study the impact on photosynthe-
sis, assimilation, and plant growth.
Figure 5. Steady State PMF across the Thylakoid Membrane Is Strongly Increased in the Plants with Diminished ATP Synthase Contents.
Color usage is as in Figures 3 and 4. Data for wild-type (WT) SNN and the antisense lines are shown in the left panel, and data for the wild-type PH and
the atpB translation mutants are shown in the right panel. A minimum of 10 individual plants was measured per line, and standard deviations are shown
as error bars.
(A) Total pmf across the thylakoid membrane as determined from the maximum amplitude of the ECS signal after a light to dark transition (ECST) is
plotted against the actinic light intensity.
(B) The partitioning of pmf into its DpH and DC components is plotted versus the actinic light intensity. Partitioning was determined from the proportion
of the slow relaxation kinetics of the ECS attributable to counter ion movements across the thylakoid membrane (ECSinv), relative to ECST. While total
pmf is strongly increased in the GTG-atpB and in the antisense lines, especially at low light intensities, the fraction of pmf stored as DpH is slightly
reduced.
312 The Plant Cell
Our data show that both AtpC antisense repression and
manipulation of atpB translation initiation are feasible strategies
to modify chloroplast ATP synthase accumulation. The success-
ful repression of ATP synthase accumulation in our transplas-
tomic approach demonstrates that photosynthetic complex
contents in higher plants can be altered by reducing translation
of an essential subunit.
In vitro translation assays suggested that both UUG and GUG
can serve as alternative start codons in chloroplast translation
initiation but are recognized with much lower efficiency than the
standard AUG initiator codon (Hirose et al., 1999; Hirose and
Sugiura, 2004). However, an exact prediction of in vivo transla-
tion initiation rates for these alternative start codons is not pos-
sible because their efficiency depends strongly on the sequence
context around the initiation codon (Boeck and Kolakofsky,
1994). In our experiments, only the GTG-atpB transplastomic
lines suffered from a strong repression of ATP synthase accu-
mulation, assimilation, and linear electron flux (Figure 4) and
displayed strongly retarded growth (Figure 3A). Mature leaves of
both the TTG-atpBmutant and the aadA-atpB control showed on
average a 25% reduction of ATP synthase contents, relative to
the wild type (Figure 4A). However, this did not result in a
significantly reduced ATP synthase activity. Also, no alterations
in electron transport and assimilation capacities were observed
(Figures 4B and 4C), and all other photosynthetic parameters
were indistinguishable from the control plants (Table 2).
The reduced ATP synthase accumulation in both the aadA-
atpB control and the TTG-atpBmutant is most likely attributable
to the 50% reduction in atpBmRNA accumulation observed in all
atpB translation initiation mutants. The reduced mRNA accumu-
lation is due to the disruption of a second, so far unknown atpB
promoter in the tobacco plastome by the insertion of the aadA
Figure 6. Restricted Linear Electron Transport, Overreduction of the PSII Acceptor Side, and Accelerated Induction of qN upon ATP Synthase
Repression.
Symbols are used as in Figure 4. Data for the SNN wild type (WT) and the antisense plants are shown in the left panel, and data for the PH wild type and
the atpB translation mutants are shown in the right panel. A minimum of 10 individual plants were measured per line, and standard deviations are shown
as error bars.
(A) Light saturation curve of linear electron flux as calculated from PSII yield measurements and corrected for leaf absorptance. Linear electron flux is
strongly repressed in response to reduced ATP synthase contents.
(B) Redox state of the PSII acceptor side, determined as qL. With increasing light intensity, the PSII acceptor side becomes progressively reduced. Note
that this effect is shifted to lower light intensities in the strong antisense line and in GTG-atpB.
(C)Measurement of nonphotochemical quenching (qN). The onset of qN is shifted toward lower light intensities in both antisense lines and in the GTG-
atpB mutant, resulting in increased thermal dissipation of excitation energy, reduced quantum efficiency of photosynthesis, and, thus, lower light use
efficiency.
ATP Synthase Regulates Photosynthesis 313
selectable marker gene (Figure 2C). It is not surprising that the
actual ATP synthase accumulation in the aadA-atpB control and
the TTG-atpB mutant is much less affected than atpB mRNA
levels, as it is well established that translation initiation rather
than transcription is limiting photosynthetic complex accumula-
tion in photosynthetic eukaryotes (Eberhard et al., 2002; Drapier
et al., 2007).
Interestingly, polysome analyses revealed that also in the TTG-
atpBmutant, atpB translationwas somewhat reduced, relative to
the wild type and the aadA-atpB control, even though the effects
were much less severe than those in the GTG-atpB mutant, in
which atpB translation was almost completely abolished. This
slight reduction of atpB translation in the TTG-atpBmutant might
explain the weak growth retardation relative to the aadA-atpB
control, which displayed a similar (;25%) reduction in ATP
synthase contents inmature leaves as the TTG-atpBmutant. The
reduced atpB translation could slightly delay ATP synthase
biogenesis during the early stages of leaf development, when
translation rates are highest. This would limit photosynthesis
during early phases of plant development, when growth is most
sensitive to delayed establishment of a fully functional photo-
synthetic apparatus and reduced photoassimilate availability.
In mature leaves, when the photosynthetic apparatus is fully
established and low translation rates are sufficient for its main-
tenance, ATP synthase contents then reachwild-type levels. Due
to the limited availability of young, strongly expanding leaf
material, we have not yet been able to test this hypothesis.
As a second independent approach and to obtain mutants
covering a wider range of ATP synthase contents, we also used
antisense RNA directed against the nuclear-encoded essential
Figure 7. Limited Linear Electron Flux through cyt-bf in ATP Synthase Mutants.
The symbols are used as in Figure 4. Data for the SNN wild type (WT) and the antisense plants are shown in the left panel, and data for the PH wild type
and the atpB translation mutants are shown in the right panel. A minimum of 10 individual plants were measured for all lines, and standard deviations are
shown as error bars in (A).
(A) Light intensity–dependent oxidation of the donor side of PSI and the high potential chain.
(B) and (C) Restricted linear electron flux due to photosynthetic control, as evidenced by retarded reduction kinetics of cyt-f (B) and P700 (C).
314 The Plant Cell
AtpC subunit. We analyzed two lines suffering from different
degrees of ATP synthase repression in detail. One of the lines
(atpC1) showed a strong growth phenotype and a clear reduc-
tion in ATP synthase accumulation, providing ATP synthase
activities between those of theGTG-atpB translationmutant and
the wild type. The other line (atpC2) showed only a mild reduc-
tion in ATP synthase accumulation, and linear electron flux and
assimilation were largely unaltered relative to the wild type.
Taking the translation initiationmutants and the antisense plants
together, a wide range of ATP synthase contents and activities is
covered.
One concern arising from employing an antisense strategy is
the possibility that the observed phenotypes are not exclusively
related to the repression of the target gene. In theory, other
genes could be affected by so-called off-target effects. These
could be brought about by posttranscriptional silencing of genes
sharing short identical sequence stretches with the gene of
interest. As the tobacco genome is not fully sequenced, it is not
possible to fully exclude such off-target effects. However, two
lines of evidence argue against the presence of off-target effects
in our nuclear-transgenic antisense plants. First, no EST from
tobacco or any other Solanaceous species was found that would
share homologous sequences of >18 bp length with AtpC. More
importantly, comparison of phenotypes and photosynthetic pa-
rameters in nuclear antisense and the plastid translation mutants
provides strong evidence against off-target effects. The GTG-
atpB and atpC1 mutants behave in a very similar manner, as far
as the effects of reduced ATP synthase activity on linear electron
transport and leaf assimilation capacity are concerned (Figures
4B and 4C), with all parameters being slightly more affected in
the GTG-atpB mutant due to its more severe ATP synthase
repression. Both mutants also suffer from an accelerated induc-
tion of qN already at low light intensities (Figure 6C) due to
increased lumen acidification (Figures 5A and 5B), resulting in a
decreased quantum efficiency of CO2 fixation (Tables 1 and 2).
They also suffer from a chronic overreduction of the PSII accep-
tor side (Figure 6B) and an accelerated oxidation of the PSI donor
side (Figure 7A) due to decreased rates of PQ reoxidation at the
cyt-bf (Figures 7B and 7C). Finally, both mutants also show a
reduced PSI accumulation and an upregulation of PC (see
below). Therefore, the observed effects are independent of the
chosen strategy for ATP synthase repression.
Decreasing ATP Synthase Contents Reduces CO2
Assimilation, Electron Transfer, and Plant Growth
ATP synthase repression to <50% of wild-type levels resulted in
a marked reduction of ATP synthase activity. Strikingly, we
observed a strict correlation between the activity of the ATP
synthase, measured by the decay of the ECS signal, and assim-
ilation capacity (Figure 4B) as well as linear electron flow (Figure
4C), establishing ATP synthase activity as a potentially limiting or
governing factor of photosynthesis. This observation is in agree-
ment with the growth phenotypes reported by Price et al. (1995)
for d-subunit antisense lines, although at that time, no analysis of
the molecular mechanisms underlying the growth retardation
was undertaken. It has also been observed that mutations
affected in the reductive activation of the ATP synthase by
thioredoxin (due to amino acid substitutions in the g-subunit)
have an adverse effect on photosynthesis and plant growth
in low light (Wu et al., 2007), although also in this case, the
mechanistic basis has not been explored.
Steady State pmf Is Increased in ATP Synthase Mutants
In vivo probing of both electron and proton transfer allowed us to
follow the effects of reduced ATP synthase expression on the
photosynthetic energy budget. We found that reduced ATP
synthase activity leads to an increased steady state pmf (Figure
5A). Even though the partitioning of pmf into Dc and DpH
components was shifted in favor of DC in both atpC1 and
GTG-atpB, especially at low light intensities (Figure 5B), the
strongly increased pmf led to a higher DpH and thus a more
acidic lumenal pH.
Thus, it appears likely that the growth phenotype of the strong
antisense plant represents an indirect inhibition of linear electron
flux by the increased acidification of the lumen due to restricted
PQ reoxidation, a phenomenon referred to as photosynthetic
control (Figures 7B and 7C). PQ oxidation represents a rate-
limiting step in linear electron flux, even in wild-type plants under
nonstressed conditions (Anderson, 1992; Price et al., 1998), but it
is further slowed down when the pH value in the thylakoid lumen
drops below 6.5. This is because PQ oxidation now works
against a much higher preestablished pmf (Kramer et al., 1999;
Hope, 2000). Supporting this view, ATP synthase repression led
to a more reduced PQ pool (Figure 6B) and a more oxidized high
potential chain (Figure 7A), clearly indicating a restriction in
electron flow at the level of cyt-bf. The colimitation (or coregu-
lation) of proton flow through the ATP synthase and electron flow
through the photosynthetic chain should result in restrictions in
both ATP and NADPH synthesis, which in turn result in down-
regulation of the Calvin cycle.
Excess ATP Synthase Capacity in Wild-Type Plants
Interestingly, neither antisense line atpC2 nor the aadA-atpB
control or the TTG-atpBmutant, which suffer from an up to 40%
reduction in ATP synthase contents, displayed a significant
decrease in ATP synthase activity (Figure 4A) and assimilation
capacity (Figure 4B). Only in theGTG-atpBmutant and the strong
antisense line atpC1, which contain ATP synthase contents
between 20 and <5% of wild-type levels, were clear correlations
between ATP synthase content and activity observed. We con-
clude that ATP synthase activity is not exclusively controlled by
absolute enzyme contents but instead is highly regulated at the
level of enzyme activity. This was previously demonstrated by
Kanazawa and Kramer (2002), showing strong effects of CO2
levels on ATP synthase activity. When CO2 was increased from 0
to 2000 ppm, ATP synthase activity increased by approximately
sixfold, leading to large changes in the regulation of photosyn-
thesis. It is noteworthy that the maximum ATP synthase activity
was not yet reached at 350 ppmCO2, implying that ATP synthase
is partly downregulated at ambient CO2.MaximumATP synthase
activity was established at 500 ppm CO2, followed by a minor
decrease when CO2 contents were further increased up to 2000
ppm (Kiirats et al., 2009). All these data suggest that the ATP
ATP Synthase Regulates Photosynthesis 315
synthase is dynamically regulated, and significant reductions
in complex content can be compensated by upregulating the
enzymatic activity.
The mechanism underlying this dynamic regulation of ATP
synthase activity is still not fully understood. One well-estab-
lished level of ATP synthase regulation is its reductive activation
via the thioredoxin system, which has strong effects on enzyme
activity. The oxidized enzyme operates at <20%of the rate of the
fully activated, reduced form (Wu and Ort, 2008). However, as
quantitative reduction of the g-subunit occurs already after short
illumination at low light intensities (Wu and Ort, 2008), this
reductive activation is unlikely to account for the discrepancy
between ATP synthase content and activity under the light-
saturated conditions measured here.
It has been suggested that stromal inorganic phosphate levels,
modulated by metabolic processes, may regulate ATP synthase
activity (Sharkey and Vanderveer, 1989; Takizawa et al., 2008).
However, our measurements were performed in saturating CO2
and after full activation of the Calvin cycle to ensure rapid
metabolic consumption of ATP and NADPH. Therefore, a phos-
phate limitation is unlikely to significantly contribute to the
downregulation of ATP synthase activity in our experiments.
The catalytic b-subunit of the ATP synthase is known to contain
several phosphorylation sites (del Riego et al., 2006; Reiland
et al., 2009). While two of the sites show strong changes in
phosphorylation between day and night and thus could be
involved in the nocturnal inactivation of ATP synthase, a third
phosphorylation site may be involved in binding of 14-3-3 pro-
teins, which can drastically reduce ATP synthase activity in vitro
(Bunney et al., 2001). Therefore, this site seems to be the
strongest candidate for regulating ATP synthase activity in the
light. However, so far, no direct effect of phosphorylation on ATP
synthase activity has been demonstrated in vivo. Furthermore, a
metabolically controlled dimerization of the C. reinhardtii plastid
ATP synthase has been shown (Schwassmann et al., 2007), but
an effect on enzyme activity has not been demonstrated yet.
Therefore, the reason for the discrepancy between the down-
regulation of the ATP synthase contents and the less pronounced
reduction in activity currently cannot be fully resolved. In this
context, it would be interesting to investigate if phosphorylation
and/or oligomerization of the ATP synthase differ between the
wild type and our transformants with decreased ATP synthase
accumulation.
Sensitivity of the Photosynthetic Apparatus to Increased
Lumenal Acidification
Under the conditions tested here, we observed no strong in-
crease in photosensitivity in our ATP synthase mutants. The
maximum variable PSII fluorescence (Fv/Fm) in the strong anti-
sense line atpC1 was indistinguishable from that in the wild type
(Table 1). Also, the GTG-atpB mutant suffering from the most
pronounced reduction in ATP synthase content and linear elec-
tron flux displayed only a mild reduction of Fv/Fm. These results
imply that neither the increase in QA reduction (Figure 6B) nor the
increased lumenal acidification (Figure 5) result in photodamage
that would exceed the repair capacity of the chloroplast (Aro
et al., 2005).
Lumenal pH values below 5.5 have been observed to dramat-
ically accelerate photodamage in vitro, particularly at the donor
side of PSII (Krieger and Weis, 1993; Kramer et al., 1999). Also,
PC is highly sensitive to pH values below 5.5 (Gross et al., 1994;
Kramer et al., 1999). However, in both the strong antisense line
and the GTG-atpB mutant, the content of redox-active PC
actually increased (Tables 1 and 2). The fact that we observed
neither increased PSII photodamage nor inactivation of PC
suggests that the lumenal pH did not decrease below this
threshold value. Alternatively, the tobacco photosynthetic appa-
ratus might be unusually acid resistant. At present, we favor the
former scenario, noting that the pH sensitivity of cyt-bf should act
as a feedback regulator preventing overacidification by slowing
down electron transfer as pH decreases. Likewise, increased
lumenal acidification also activates photoprotective qE quench-
ing (Figure 6C), thereby at least partly ameliorating the photo-
inhibitory effects of a more reduced PQ pool (Figure 6B).
Therefore, the lack of pronounced photodamage in the strong
ATP synthasemutants is broadly in line with the proposed role of
the ATP synthase in coregulating the light reactions by decreas-
ing electron transfer and triggering antenna downregulation
(Takizawa et al., 2007).
The increase in redox-active PC can most likely be attributed
to the strongly repressed assimilation capacity of the mutants.
PC expression is known to be repressed via sugar sensing when
high amounts of photoassimilate accumulate in source leaves
(Oswald et al., 2001; Schottler et al., 2004). Thus, the strongly
restricted assimilation in both mutants could result in a dere-
pression of PC. Interestingly, while PC accumulation was in-
creased and neither accumulation nor functional integrity of PSII
was strongly affected, both the atpC1 and the GTG-atpB mu-
tants suffered from a 20% reduction of redox-active PSI per
chlorophyll (Tables 1 and 2). This could indicate that PSI repre-
sents the component of the photosynthetic apparatus that is
most sensitive to lumenal acidification.
Alternatively, the observed PSI repression could be due to
retrograde signals elicited by the repression of ATP synthase.
However, the observed repression of PSI cannot be reconciled
with any of the known retrograde signals, which should rather
result in an upregulation of PSI in the mutants because their PQ
pool is chronically overreduced. This should increase PSI con-
tents and repress PSII accumulation because a reduced PQ pool
stimulates transcription of the genes for the PSI reaction center
subunits psaA and psaB and represses the expression of PSII
reaction center subunits to counteract the redox imbalance
(Pfannschmidt et al., 1999, 2009). Likewise, redox signals orig-
inating from the more oxidized stroma or from the altered
metabolic state should rather activate than repress PSI biogen-
esis (Pogson et al., 2008; Pfannschmidt et al., 2009). An attrac-
tive alternative possibility would be direct signaling from the pmf
or the acidified thylakoid lumen. However, no clear evidence for
such a signaling mechanism has been obtained to date, and at
least expression of the nuclear AtpC gene (Figure 2C) would not
be a major target of such a pathway because it was unaltered in
the atpB translation mutants. Future investigations should reveal
if the reduced PSI accumulation is attributable to direct damage
by increased lumenal acidification or rather to altered photosyn-
thetic gene expression.
316 The Plant Cell
The ATP Synthase as a Potent Control Point
for Photosynthesis
Our data establish the ATP synthase as an additional control
point of the photosynthetic light reactions, as previously sug-
gested by Kramer et al. (2003), in addition to cyt-bf (Anderson,
1992; Price et al., 1995; Kirchhoff et al., 2000) and potentially
PC (Schottler et al., 2004). However, while already very small
changes in cyt-bf content and activity linearly affect linear elec-
tron flux and assimilation (Price et al., 1998; Kirchhoff et al.,
2000), an up to 50% decrease in ATP synthase content can be
compensated on a posttranslational level. The relevance of ATP
synthase adjustment is obvious from the fact that an up to
fivefold downregulation of ATP synthase contents occur during
leaf ageing (Schottler et al., 2007a) and in response to drought
stress (Tezara et al., 1999; Kohzuma et al., 2009). Flux control by
such strong changes could be even more efficient than by
downregulation of cyt-bf. While cyt-bf and PC repression would
reduce linear flux directly, ATP synthase regulation would reduce
it indirectly due to increased pmf across the thylakoidmembrane
and photosynthetic control.
However, upon ATP synthase repression, the onset of photo-
protective mechanisms is shifted to lower light intensities be-
cause lower proton influx rates can sufficiently acidify the lumen
to trigger qN. This results in a decrease of the photosynthetic
quantum efficiency and thus reduces plant growth. By contrast,
selective suppression of cyt-bf without a parallel downregulation
of the ATP synthase should have a lower impact on quantum
efficiency because it reduces only the capacity for proton influx
into the lumen, whereas proton efflux through the ATP synthase
would remain high. This should result in a lower steady state pmf
and, consequently, in a less efficient induction of the photo-
protective mechanisms. Evidence for this scenario comes from
our characterization of a DpetL mutant suffering from acceler-
ated leaf age-dependent loss of cyt-bf and reduced electron flux
capacity due to absence of a small subunit of the cyt-bf. As the
ATP synthase is not degraded in parallel with cyt-bf, but instead
maintained at wild-type levels, nonphotochemical quenching in
these mutants is compromised (Schottler et al., 2007b).
By a strict coregulation of ATP synthase and cyt-bf contents
during leaf ageing in tobacco (Schottler et al., 2007a), plants can
balance the rates of proton influx via electron transport and
proton efflux through the ATP synthase in a way that under
nonstressed conditions lumen acidification is kept close to but
above the threshold value for triggering photoprotective mech-
anisms, such as qN and photosynthetic control. In this way,
optimum photosynthesis with a high quantum efficiency is en-
sured. However, when ATP and NADPH consumption by the
Calvin cycle decreases, the reduced proton efflux through the
ATP synthase results in an immediate decrease of the lumenal
pH below the threshold value for activation of the photoprotec-
tive mechanisms, thus enabling a rapid response of the plant to
this disturbance. Therefore, we postulate ATP synthase as a
major control point in the long-term adjustment of the photo-
synthetic light reactions to changing metabolic demands. Fur-
thermore, we suggest that coregulation of linear electron flux (via
cyt-bf and PC contents) with the proton circuit (via ATP synthase
accumulation) is required to maintain an optimum steady state
lumenal pH value under unstressed conditions. Thismechanism
allows the plant to tightly control the induction of photoprotec-
tive mechanisms, thus optimizing photosynthetic quantum
efficiency.
METHODS
Plant Material and Growth Conditions
Tobacco (Nicotiana tabacum) AtpC antisense lines were raised from
seeds germinated on Petri dishes containing Murashige and Skoog
medium supplemented with 2% (w/v) sucrose and 300 mg mL21 kana-
mycin. Wild-type seedlings were grown on the medium without kanamy-
cin. Fourteen days after germination, the seedlings were transferred to a
soil-vermiculite mixture (2:1; Floragard Vertriebs) and grown in a con-
trolled-environment chamber. Transplastomic plants were grown on soil.
All plants were fertilized with Hakaphos Special (Compo Expert) to keep
the soil moist. All measurements were performed on the youngest fully
expanded leaves at the onset of flowering. The actinic light intensity was
300 mmol photons m22 s21 at the level of these leaves. The plants were
illuminated for 16 h at 228C. The growth temperature was reduced to 188C
during the night. Relative humidity was set to 75%.
Generation of Antisense Constructs and Nuclear Transformation
The antisense construct was expressed under the control of the cauli-
flower mosaic virus 35S promoter and assembled in a plasmid vector
described previously (Lein et al., 2008). Correct insertion of the cassette
was verified by PCR with genomic DNA as template and primers 35S
(59-GTGGATTGATGTGATATCTCC-39) and octopine synthase (59-GTA-
AGGATCTGAGCTACACAT-39) followed by direct sequencing of the PCR
products (Lein et al., 2008). Tobacco plants (cv Samsun NN) were trans-
formed with the antisense construct by Agrobacterium tumefaciens–
mediated gene transfer using A. tumefaciens strain C58C1:pGV2260
(Rosahl et al., 1987).
Vector Construction for Plastid Transformation and Generation of
Transplastomic Plants
The region of the tobacco plastid genome containing part of the accD
gene, the large subunit of ribulose-1,5-bisphosphate carboxylase/oxy-
genase (rbcL), and the 59 portion of the atpB gene was isolated as a 5132-
bp XhoI/StuI restriction fragment corresponding to plastome positions
55360 to 60492 (Figure 2A). The fragment was cloned into a pBS SK
vector (Stratagene) cut with XhoI and Ecl136II. To remove the Eco0109I
site from the remaining multiple cloning site, the resulting plasmid was
linearized with Eco0109I, and the recessed ends were filled in using the
Klenow enzyme followed by religation. A chimeric aadA gene fused to
chloroplast-specific expression signals and conferring resistance to the
aminoglycoside antibiotics spectinomycin and streptomycin (Svab and
Maliga, 1993) was cloned into a uniqueClaI site (position 57175) to enable
selection of transplastomic lines. Constructs containing the aadA select-
able marker gene in the same orientation as the rbcL gene were chosen
for all further cloning steps. This construct was called aadA-atpB, as it
contained the selectable marker gene and the atpB gene without any
point mutations in its translation initiation codon.
The aadA-atpB construct was then used to produce the translation
initiation codon mutations by PCR. The region surrounding the ATG start
codon was excised by digestion withNheI and Eco0109I (restriction sites
correspond to nucleotide positions 56844 and 56410, respectively) and
replaced by PCR products carrying the point mutations. The mutations
were introduced with the primer sequences (see below), yielding the final
transformation vectors TTG-atpB and GTG-atpB. Primer oMR1_pMR111_fw
ATP Synthase Regulates Photosynthesis 317
was used to generate the ATG-to-TTG mutation (59-GTGCTAGCGGA-
CATTTATTTTGAATTCGATAATTTTTGCAAAAACATTTCGACATATTTAT-
TTATTTTATTATTTTGAG-39), primer oMR2_pMR112_fwwas used for the
ATG-to-GTG mutation (59-GTGCTAGCGGAATTTATTTTGAATTCGATA-
ATTTTTGCAAAAACATTTCGACATATTTATTTATTTTATTATTGTGAG-39),
and primer oMR8_pMR110_bw was used as the reverse primer for both
PCR amplifications (59-GCGCAGATCTATGAATAGGA-39).
Young sterile leaves of tobacco cultivar PH were bombarded with the
respective transformation vectors bound to gold particles (0.6-mm diam-
eter) using a helium-driven biolistic gun (PDS-1000 He; Bio-Rad). Primary
transformants were selected from 5 3 5-mm leaf pieces on plant
regeneration medium containing 500 mg/L spectinomycin. Several inde-
pendent transplastomic lines were then subjected to a maximum of three
additional rounds of regeneration on spectinomycin-containing medium to
enrich for the transplastome and select against residual copies of the wild-
typeplastome.Spontaneous spectinomycin-resistant lineswere eliminated
via double selection on media containing both spectinomycin and strep-
tomycin in a concentration of 500mg/L each (Svab andMaliga, 1993; Bock
2001). Homoplasmic transplastomic lines were transferred to the green-
house for seedproduction. The presence of the pointmutations in the TTG-
atpB and GTG-atpBmutants was confirmed by DNA sequencing.
DNA Gel Blot and RNA Gel Blot Analyses
Total plant DNA was isolated by a rapid cetyltrimethylammoniumbro-
mide-based miniprep procedure (Doyle and Doyle, 1990). DNA samples
digested with restriction enzymes were separated in 0.8 to 1.0% agarose
gels and blotted onto Hybond-XL nylon membranes (GE Healthcare)
according to the manufacturer’s instructions. RNA was extracted from
leaves using the peqGold Trifast reagent (Peqlab). Samples equivalent to
2.5mgRNAwere separated in 1% formaldehyde-containing agarose gels
and blotted onto Hybond-XL nylon membranes. For hybridization, a[32P]
dCTP-labeled probes were generated by random priming (Multiprime
DNA labeling kit; GE Healthcare). Hybridizations were performed at 658C
in rapid hybridization buffer (GE Healthcare) following the manufacturer’s
protocol. An AtpC-specific probe was generated by PCR amplification
from genomic DNA with the primers OMR14 (59-GAGGCTATGAA-
GCTTGTTGC-39) and OMR15 (59-GGAAGCAGGGTGTGAATCAC-39).
Hybridizations were performed at 658C in Rapid-Hyb buffer (Amersham
Biosciences) following the protocol of the manufacturer. Hybridization
signals were quantified using a Typhoon Trio+ variable mode imager
(Amersham Biosciences) and Image Quant 5.2 software.
Polysome Analysis
Polysome-associatedmRNAswere isolated from leaves and separated in
sucrose gradients as described previously (Rogalski et al., 2008). The
sucrose gradients were fractionated, and the RNA precipitated from each
fraction and dissolved in 30 mL of water. Eight-microliter aliquots were
denaturated for 5 min at 958C and loaded onto formaldehyde-containing
denaturing agarose gels. After electrophoretic separation, RNAs were
transferred to membranes as described above.
Gas Exchange Measurements
Leaf assimilation and linear electron flux were measured using the GFS-
3000FL gas exchange system equipped with the standard measuring
head 3010-S (8-cm2 leaf area) and the LED-Array/PAM fluorometer
module 3055-FL for actinic illumination and chlorophyll-a fluorescence
determination on intact tobacco plants (Heinz Walz). Light response
curves of CO2 fixation were measured at 208C cuvette temperature and
17,500 ppm humidity in 2000 ppm CO2. The light intensity was stepwise
increased from 0 to 2000 mmol photons m22 s21, and at each light
intensity, gas exchange was recorded until a steady state of transpiration
and stomatal responses was achieved (i.e., for between 30 and 45 min).
The quantum efficiency of CO2 fixation was determined in the linear light
response range between 0 and 60 mmol photons m22 s21 (wild type and
weak mutants) or between 0 and 40 mmol photons m22 s21 (strong
mutants). After the end of the gas exchange measurements, leaf absorp-
tance was determined using an integrating sphere (ISV-469; Jasco)
attached to the V550 spectrophotometer (Jasco). The spectral bandwidth
was set to 1 nm, and the scanning speed was 200 nm min21. The trans-
mission and reflectancespectraweremeasuredbetween 700- and 400-nm
wavelength, and leaf absorptancewas calculated as 100%– transmittance
(%) – reflectance (%). Finally, the chlorophyll content of the measured leaf
discs was determined according to Porra et al. (1989). Assimilation rates
were corrected for the dark respiration, assuming comparable respiratory
activities in the light and in darkness (Fernie et al., 2004).
pmf Measurements and ATP Synthase Activity
The electrochromic absorption shift (ECS) was used as an in vivo probe of
the pmf across the thylakoid membrane (Kramer et al., 2003; Takizawa
et al., 2007). The difference transmission signal was measured using a
KLAS-100 LED-array spectrophotometer (Heinz Walz), allowing the si-
multaneous measurement of light-induced difference absorption signals
at eight pairs of wavelengths in the visible range of the spectrum between
505 and 570 nm. The first two wavelength pairs at 505 to 520 and 520 to
535 nm are dominated by the electrochromic shift as well as by the slow
zeaxanthin to violaxanthin conversion (505 to 520 nm) and the scattering
signal most likely arising from PsbS protonation (520 to 535 nm). The
other wavelength pairs (540 to 545 nm, 545 to 550nm, 550 to 554 nm, 554
to 559 nm, 559 to 563nm, and 563 to 570nm) are mainly used for the
measurements of the C550 pheophytin signal and of cytochrome signals.
The ECS was deconvoluted from signals arising from zeaxanthin forma-
tion, scattering effects, the C550 signal, and from redox changes of the
cytochromes f, b6, and b559, essentially as described by Klughammer
et al. (1990). The deconvoluted transmission signals (DI/I) were then
normalized to the chlorophyll content of the measured leaf section.
The maximum amplitude of the ECS (ECST) was used as a measure for
the light-induced pmf across the thylakoid membrane. The measure-
ments were performed at 208C under CO2-saturated conditions (2000
ppm). Leaves were illuminated for 10 min prior to each measurement to
allow photosynthesis to reach steady state. ECST was determined after
illuminating the leaves with saturating light (2100 mmol photons m22 s21),
which then was interrupted by a short interval of darkness (15 s), and the
dark-interval relaxation kinetics of the ECS and of cyt-f (cyt-f) reduction
were measured. Dark intervals (15 s) were sufficient for complete relax-
ation of the pmf. To obtain light saturation curves of the pmf, dark-interval
relaxation kinetics after illumination at subsaturating light intensities
between 200 and 2100 mmol photons m22 s21 were measured. pmf
partitioning into DpH and DC was resolved by analyzing the slowly
relaxing phase of the ECS between 1 and 15 s of darkness as described
by Takizawa et al. (2007).
To determine ATP synthase activity, the fast phase (between 0 and
500 ms after the end of actinic illumination) of the dark-interval relaxation
kinetics measured at saturating light (2100 mmol photons m22 s21) was
fitted with a single exponential decay function. The reciprocal value of the
halftime of the ECS decay, the thylakoid conductivity (gH+), was used as a
measure of ATP synthase activity because fast ECS decay is exclusively
attributable to proton efflux through the ATP synthase (Cruz et al., 2001;
Baker et al., 2007).
Thylakoid Membrane Isolation and Quantitation of
Photosynthetic Complexes
Thylakoid membranes were isolated according to Schottler et al. (2004).
The contents of PSII and cyt-bf were determined from difference
318 The Plant Cell
absorption signals of cyt-b559 (PSII) and cyt-f and b6 (cyt-bf). Thylakoids
equivalent to 50 mg chlorophyll mL21 were destacked in a low salt
medium to improve the optical properties of the probe (Kirchhoff et al.,
2002). All cytochromes were oxidized by the addition of 1 mM potassium
ferricyanide (+III) and subsequently reduced by addition of 10mMsodium
ascorbate and dithionite, resulting in the reduction of cyt-f and the high-
potential form of cyt-b559 (ascorbate-ferricyanide difference spectrum)
and of cyt-b6 and the low-potential form of cyt-b559, respectively. At each
redox potential, absorption spectra were measured between 575- and
540-nm wavelength with a V-550 spectrophotometer (Jasco) equipped
with a head-on photomultiplier. The spectral bandwidth was 1 nm, and
the scanning speed was 100 nm min21. Difference absorption spectra
were deconvoluted using reference spectra and difference extinction
coefficients as by Kirchhoff et al. (2002). PSII contents were calculated
from the sum of the high- and low-potential difference absorption signals
of cyt-b559 (Lamkemeyer et al., 2006).
The content of redox-active PSI was determined from light-induced
difference absorption changes of P700, the PSI reaction center chloro-
phyll-a special pair dimer. Isolated thylakoids equivalent to 50 mg chlo-
rophyll mL21 were solubilized with 0.2% (w/v) b-dodecylmaltoside in the
presence of 100 mMparaquat as electron acceptor and of 10 mM sodium
ascorbate as electron donor. P700 was oxidized by the application of a
saturating light pulse (2000 mmol photons m22 s21 red light, 200-ms
duration). Measurements were done using the Dual-PAM instrument
(Heinz Walz) in its PC-P700 version (see below).
PC contents, relative to P700, were determined by in vivo difference
absorption spectroscopy in the far-red range of the spectrum and then
recalculated based on the absolute P700 quantification in isolated thyla-
koids (see above). Light-induced absorption changes at 800-to 870-nm
wavelength (where the contribution of P700 is predominant) and at 870- to
950-nm wavelength (predominantly arising from PC) were measured on
preilluminated leaves with a fully activated Calvin cycle to avoid acceptor
side limitation of PSI (Schottler et al., 2007a). To determine the maximum
difference absorption signals of PC and PSI, preilluminated leaves were
transferred into darkness for a few seconds to fully reduce both compo-
nents, and this was followed by 8 s of illumination with far-red light (715-
nm wavelength) to selectively excite PSI. Then, a saturating pulse of red
light was applied (635-nm wavelength, 5000 mmol photons m22 s21,
200-ms duration), to completely oxidize PC and PSI and reduce the PSII
side of the electron transport chain. At the end of the actinic light pulse, all
light sources were switched off, and PC and PSI reduction kinetics were
determined.
Chlorophyll-a Fluorescence
The 77K chlorophyll-a fluorescence emission was determined on freshly
isolated thylakoids equivalent to 10 mg chlorophyll mL21 using an F-6500
fluorometer (Jasco). The sample was excited at 430-nm wavelength (10-
nm bandwidth). The emission spectra between 655 and 800 nm were
recorded with a bandwidth of 1 nm. Chlorophyll-a fluorescence of intact
leaves was measured at room temperature using a Dual-PAM-100
instrument (Heinz Walz). Light-response curves of linear electron flux
and of nonphotochemical quenching as well as of the redox state of the
PQ pool were recorded on intact leaves after 30 min of dark adaptation.
The redox state of the PSII acceptor side was calculated from the qL
parameter (Kramer et al., 2004), while qN was determined according to
Krause and Weis (1991). Electron transport rates were corrected for leaf
absorptance (see above).
Protein Gel Electrophoresis and Protein Gel Blots
Thylakoid proteins separated by SDS-PAGE (Perfect Blue twin gel
system; Peqlab) were transferred to a polyvinylidene difluoride mem-
brane (Hybond P) using a tank blotting system (Perfect Blue Web M;
PeqLab). Specific polyclonal antibodies produced in rabbit against PsbD,
PetA, PsaA, AtpA, and AtpB were purchased from AgriSera. As second-
ary antibody, an anti-rabbit IgG peroxidize conjugate was used (Sigma-
Aldrich). Immunochemical detection was performed with the ECL system
(GE Healthcare) according to the instructions of the manufacturer. Signal
intensities of the x-ray films were quantified using the ImageQuant
software (GE Healthcare) as described (Drechsel and Bock, 2010).
Accession Numbers
Sequence data from this article can be found in the GenBank/EMBL data
libraries under the following accession numbers: N. tabacum chloroplast
genome DNA containing the annotated genes of accD, rbcL, atpB, and
atpE (Z00044.2); aadA selectable marker gene for chloroplast transfor-
mation (AJ312391.1), and N. tabacum atpC EST (X63606.1).
ACKNOWLEDGMENTS
We thank Stephanie Ruf and Yvonne Weber for chloroplast transfor-
mation, selection, and plant regeneration and Britta Hausmann for plant
cultivation. This project was supported by a grant from the Deutsche
Forschungsgemeinschaft to M.A.S. and R.B. (SFB 429, Project A12).
Received August 27, 2010; revised December 13, 2010; accepted Jan-
uary 5, 2011; published January 28, 2011.
REFERENCES
Anderson, J.M. (1992). Cytochrome b6f complex: Dynamic molecular
organization, function and acclimation. Photosynth. Res. 34: 341–357.
Anderson, J.M., Chow, W.S., and Goodchild, D.J. (1988). Thylakoid
membrane organisation in sun/shade acclimation. Aust. J. Plant
Physiol. 15: 11–26.
Aro, E.M., Suorsa, M., Rokka, A., Allahverdiyeva, Y., Paakkarinen,
V., Saleem, A., Battchikova, N., and Rintamaki, E. (2005). Dynamics
of photosystem II: A proteomic approach to thylakoid protein com-
plexes. J. Exp. Bot. 56: 347–356.
Bailey, S., Walters, R.G., Jansson, S., and Horton, P. (2001). Accli-
mation of Arabidopsis thaliana to the light environment: The existence
of separate low light and high light responses. Planta 213: 794–801.
Baker, N.R., Harbinson, J., and Kramer, D.M. (2007). Determining the
limitations and regulation of photosynthetic energy transduction in
leaves. Plant Cell Environ. 30: 1107–1125.
Barkan, A. (1998). Approaches to investigating nuclear genes that
function in chloroplast biogenesis in land plants. Methods Enzymol.
297: 38–57.
Bock, R. (2001). Transgenic plastids in basic research and plant
biotechnology. J. Mol. Biol. 312: 425–438.
Boeck, R., and Kolakofsky, D. (1994). Positions +5 and +6 can be
major determinants of the efficiency of non-AUG initiation codons for
protein synthesis. EMBO J. 13: 3608–3617.
Bosco, C.D., Lezhneva, L., Biehl, A., Leister, D., Strotmann, H.,
Wanner, G., and Meurer, J. (2004). Inactivation of the chloroplast
ATP synthase gamma subunit results in high non-photochemical
fluorescence quenching and altered nuclear gene expression in
Arabidopsis thaliana. J. Biol. Chem. 279: 1060–1069.
Bunney, T.D., van Walraven, H.S., and de Boer, A.H. (2001). 14-3-3
protein is a regulator of the mitochondrial and chloroplast ATP
synthase. Proc. Natl. Acad. Sci. USA 98: 4249–4254.
Burkey, K.O. (1993). Effect of growth irradiance on plastocyanin levels
in barley. Photosynth. Res. 36: 103–110.
ATP Synthase Regulates Photosynthesis 319
Burkey, K.O. (1994). Genetic variation of electron transport in barley:
Identification of plastocyanin as potential limiting factor. Plant Sci. 98:
177–187.
Chen, L.J., Rogers, S.A., Bennett, D.C., Hu, M.C., and Orozco, E.M.,
Jr. (1990). An in vitro transcription termination system to analyze
chloroplast promoters: Identification of multiple promoters for the
spinach atpB gene. Curr. Genet. 17: 55–64.
Cruz, J.A., Sacksteder, C.A., Kanazawa, A., and Kramer, D.M. (2001).
Contribution of electric field (Delta psi) to steady-state transthylakoid
proton motive force (pmf) in vitro and in vivo. control of pmf parsing
into Delta psi and Delta pH by ionic strength. Biochemistry 40: 1226–
1237.
del Riego, G., Casano, L.M., Martın, M., and Sabater, B. (2006).
Multiple phosphorylation sites in the b subunit of thylakoid ATP
synthase. Photosynth. Res. 89: 11–18.
Doyle, J.J., and Doyle, J.L. (1990). Isolation of plant DNA from fresh
tissue. Focus 12: 13–15.
Drapier, D., Rimbault, B., Vallon, O., Wollman, F.A., and Choquet, Y.
(2007). Intertwined translational regulations set uneven stoichiometry
of chloroplast ATP synthase subunits. EMBO J. 26: 3581–3591.
Drechsel, O., and Bock, R. (2011). Selection of Shine-Dalgarno se-
quences in plastids. Nucleic Acids Res., in press.
Eberhard, S., Drapier, D., and Wollman, F.A. (2002). Searching limiting
steps in the expression of chloroplast-encoded proteins: Relations
between gene copy number, transcription, transcript abundance and
translation rate in the chloroplast of Chlamydomonas reinhardtii. Plant
J. 31: 149–160.
Evans, J.R. (1988). Acclimation by the thylakoid membranes to growth
irradiance and the partitioning of nitrogen between soluble and
thylakoid proteins. Aust. J. Plant Physiol. 15: 93–106.
Fernie, A.R., Carrari, F., and Sweetlove, L.J. (2004). Respiratory
metabolism: Glycolysis, the TCA cycle and mitochondrial electron
transport. Curr. Opin. Plant Biol. 7: 254–261.
Gross, E.L., Pan, B., Li, B., and Brown, L. (1994). Stability of plasto-
cyanin to acid pH. Biophys. J. 66: 272.
Hirose, T., Ideue, T., Wakasugi, T., and Sugiura, M. (1999). The
chloroplast infA gene with a functional UUG initiation codon. FEBS
Lett. 445: 169–172.
Hirose, T., and Sugiura, M. (2004). Multiple elements required for
translation of plastid atpB mRNA lacking the Shine-Dalgarno se-
quence. Nucleic Acids Res. 32: 3503–3510.
Hope, A.B. (2000). Electron transfers amongst cytochrome f, plastocy-
anin and photosystem I: Kinetics and mechanisms. Biochim. Biophys.
Acta 1456: 5–26.
Kanazawa, A., and Kramer, D.M. (2002). In vivo modulation of non-
photochemical exciton quenching (NPQ) by regulation of the chloro-
plast ATP synthase. Proc. Natl. Acad. Sci. USA 99: 12789–12794.
Kiirats, O., Cruz, J.A., Edwards, G.E., and Kramer, D.M. (2009).
Feedback limitation of photosynthesis at high CO2 acts by modulating
the activity of the chloroplast ATP synthase. Funct. Plant Biol. 36:
893–901.
Kim, C., Meskauskiene, R., Apel, K., and Laloi, C. (2008). No single
way to understand singlet oxygen signalling in plants. EMBO Rep. 9:
435–439.
Kirchhoff, H., Horstmann, S., and Weis, E. (2000). Control of the
photosynthetic electron transport by PQ diffusion microdomains in
thylakoids of higher plants. Biochim. Biophys. Acta 1459: 148–168.
Kirchhoff, H., Mukherjee, U., and Galla, H.J. (2002). Molecular archi-
tecture of the thylakoid membrane: Lipid diffusion space for plasto-
quinone. Biochemistry 41: 4872–4882.
Klughammer, C., Kolbowski, J., and Schreiber, U. (1990). LED array
spectrophotometer for measurement of time resolved difference spectra
in the 530–600 nm wavelength region. Photosynth. Res. 25: 317–327.
Kohzuma, K., Cruz, J.A., Akashi, K., Hoshiyasu, S., Munekage, Y.N.,
Yokota, A., and Kramer, D.M. (2009). The long-term responses of
the photosynthetic proton circuit to drought. Plant Cell Environ. 32:
209–219.
Kooter, J.M., Matzke, M.A., and Meyer, P. (1999). Listening to the
silent genes: Transgene silencing, gene regulation and pathogen
control. Trends Plant Sci. 4: 340–347.
Kramer, D.M., Cruz, J.A., and Kanazawa, A. (2003). Balancing the
central roles of the thylakoid proton gradient. Trends Plant Sci. 8: 27–32.
Kramer, D.M., Johnson, G., Kiirats, O., and Edwards, G.E. (2004).
New fluorescence parameters for the determination of q(a) redox
state and excitation energy fluxes. Photosynth. Res. 79: 209–218.
Kramer, D.M., Sacksteder, C.A., and Cruz, J. (1999). How acidic is the
lumen? Photosynth. Res. 60: 151–163.
Krause, G.H., and Weis, E. (1991). Chlorophyll-a fluorescence and
photosynthesis: The basics. Annu. Rev. Plant Physiol. Plant Mol. Biol.
42: 313–349.
Krieger, A., and Weis, E. (1993). The role of calcium in the pH-
dependent control of photosystem II. Photosynth. Res. 37: 117–130.
Lamkemeyer, P., et al. (2006). Peroxiredoxin Q of Arabidopsis thaliana
is attached to the thylakoids and functions in context of photosyn-
thesis. Plant J. 45: 968–981.
Lein, W., Usadel, B., Stitt, M., Reindl, A., Ehrhardt, T., Sonnewald,
U., and Bornke, F. (2008). Large-scale phenotyping of transgenic
tobacco plants (Nicotiana tabacum) to identify essential leaf functions.
Plant Biotechnol. J. 6: 246–263.
Majeran, W., Wollman, F.-A., and Vallon, O. (2000). Evidence for a role
of ClpP in the degradation of the chloroplast cytochrome b(6)f
complex. Plant Cell 12: 137–150.
Oswald, O., Martin, T., Dominy, P.J., and Graham, I.A. (2001). Plastid
redox state and sugars: interactive regulators of nuclear-encoded
photosynthetic gene expression. Proc. Natl. Acad. Sci. USA 98: 2047–
2052.
Pfannschmidt, T., Brautigam, K., Wagner, R., Dietzel, L., Schroter,
Y., Steiner, S., and Nykytenko, A. (2009). Potential regulation of
gene expression in photosynthetic cells by redox and energy state:
Approaches towards better understanding. Ann. Bot. (Lond.) 103:
599–607.
Pfannschmidt, T., Nilsson, A., and Allen, J.F. (1999). Photosynthetic
control of chloroplast gene expression. Nature 397: 625–628.
Pogson, B.J., Woo, N.S., Forster, B., and Small, I.D. (2008). Plastid
signalling to the nucleus and beyond. Trends Plant Sci. 13: 602–609.
Porra, R.J., Thompson, W.A., and Kriedermann, P.E. (1989). Deter-
mination of accurate extinction coefficient and simultaneous equa-
tions for essaying chlorophylls a and b extracted with four different
solvents: Verification of the concentration of chlorophyll standards
by atomic absorption spectroscopy. Biochim. Biophys. Acta 975:
384–394.
Price, G.D., von Caemmerer, S., Evans, J.R., Siebke, K., Anderson,
J.M., and Badger, M.R. (1998). Photosynthesis is strongly reduced
by antisense suppression of chloroplastic cytochrome bf complex in
transgenic tobacco. Aust. J. Plant Physiol. 25: 445–452.
Price, G.D., Yu, J.W., von Caemmerer, S., Evans, J.R., Chow, W.S.,
Anderson, J.M., Hurry, V., and Badger, M.R. (1995). Chloroplast
cytochrome b6/f and ATP synthase complexes in tobacco: Transfor-
mation with antisense RNA against nuclear-encoded transcripts for
the Rieske FeS and ATPd polypeptides. Aust. J. Plant Physiol. 22:
285–297.
Reiland, S., Messerli, G., Baerenfaller, K., Gerrits, B., Endler, A.,
Grossmann, J., Gruissem, W., and Baginsky, S. (2009). Large-scale
Arabidopsis phosphoproteome profiling reveals novel chloroplast
kinase substrates and phosphorylation networks. Plant Physiol. 150:
889–903.
320 The Plant Cell
Rogalski, M., Schottler, M.A., Thiele, W., Schulze, W.X., and Bock,
R. (2008). Rpl33, a nonessential plastid-encoded ribosomal protein in
tobacco, is required under cold stress conditions. Plant Cell 20: 2221–
2237.
Rosahl, S., Schell, J., and Willmitzer, L. (1987). Expression of a tuber-
specific storage protein in transgenic tobacco plants: demonstration
of an esterase activity. EMBO J. 6: 1155–1159.
Schottler, M.A., Flugel, C., Thiele, W., and Bock, R. (2007b). Knock-
out of the plastid-encoded PetL subunit results in reduced stability
and accelerated leaf age-dependent loss of the cytochrome b6f
complex. J. Biol. Chem. 282: 976–985.
Schottler, M.A., Flugel, C., Thiele, W., Stegemann, S., and Bock, R.
(2007a). The plastome-encoded PsaJ subunit is required for efficient
Photosystem I excitation, but not for plastocyanin oxidation in to-
bacco. Biochem. J. 403: 251–260.
Schottler, M.A., Kirchhoff, H., and Weis, E. (2004). The role of plasto-
cyanin in the adjustment of the photosynthetic electron transport to the
carbon metabolism in tobacco. Plant Physiol. 136: 4265–4274.
Schwassmann, H.J., Rexroth, S., Seelert, H., and Dencher, N.A.
(2007). Metabolism controls dimerization of the chloroplast FoF1 ATP
synthase in Chlamydomonas reinhardtii. FEBS Lett. 581: 1391–1396.
Sharkey, T.D., and Vanderveer, P.J. (1989). Stromal phosphate con-
centration is low during feedback limited photosynthesis. Plant
Physiol. 91: 679–684.
Sugiura, M., Hirose, T., and Sugita, M. (1998). Evolution and mech-
anism of translation in chloroplasts. Annu. Rev. Genet. 32: 437–459.
Svab, Z., and Maliga, P. (1993). High-frequency plastid transformation
in tobacco by selection for a chimeric aadA gene. Proc. Natl. Acad.
Sci. USA 90: 913–917.
Szabo, I., Bergantino, E., and Giacometti, G.M. (2005). Light and
oxygenic photosynthesis: Energy dissipation as a protection mecha-
nism against photo-oxidation. EMBO Rep. 6: 629–634.
Takizawa, K., Cruz, J.A., Kanazawa, A., and Kramer, D.M. (2007). The
thylakoid proton motive force in vivo. Quantitative, non-invasive
probes, energetics, and regulatory consequences of light-induced
pmf. Biochim. Biophys. Acta 1767: 1233–1244.
Takizawa, K., Kanazawa, A., and Kramer, D.M. (2008). Depletion
of stromal P(i) induces high ‘energy-dependent’ antenna exciton
quenching (q(E)) by decreasing proton conductivity at CF(O)-CF(1)
ATP synthase. Plant Cell Environ. 31: 235–243.
Tezara, W., Mitchell, V.J., Driscoll, S.D., and Lawlor, D.W. (1999).
Water stress inhibits plant photosynthesis by decreasing coupling
factor and ATP. Nature 401: 914–917.
Wu, G., and Ort, D.R. (2008). Mutation in the cysteine bridge domain of
the gamma-subunit affects light regulation of the ATP synthase but
not photosynthesis or growth in Arabidopsis. Photosynth. Res. 97:
185–193.
Wu, G., Ortiz-Flores, G., Ortiz-Lopez, A., and Ort, D.R. (2007). A point
mutation in atpC1 raises the redox potential of the Arabidopsis
chloroplast ATP synthase gamma-subunit regulatory disulfide above
the range of thioredoxin modulation. J. Biol. Chem. 282: 36782–
36789.
ATP Synthase Regulates Photosynthesis 321
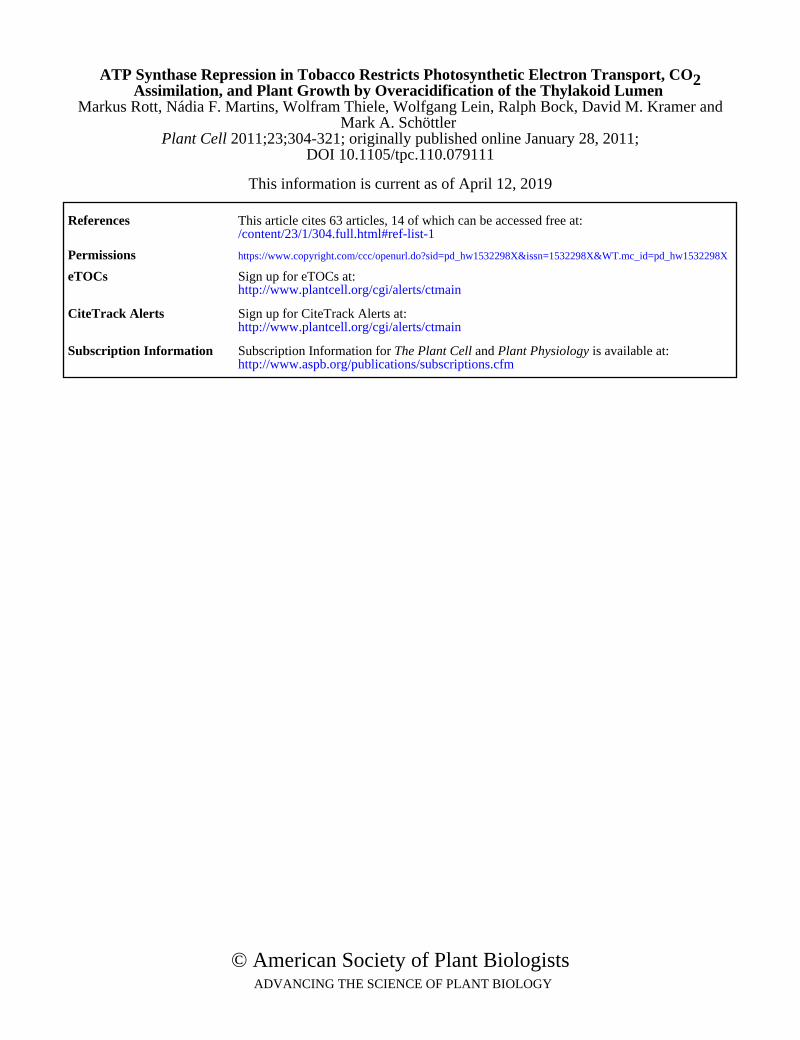
DOI 10.1105/tpc.110.079111; originally published online January 28, 2011; 2011;23;304-321Plant CellMark A. Schöttler
Markus Rott, Nádia F. Martins, Wolfram Thiele, Wolfgang Lein, Ralph Bock, David M. Kramer andAssimilation, and Plant Growth by Overacidification of the Thylakoid Lumen
2ATP Synthase Repression in Tobacco Restricts Photosynthetic Electron Transport, CO
This information is current as of April 12, 2019
References /content/23/1/304.full.html#ref-list-1
This article cites 63 articles, 14 of which can be accessed free at:
Permissions https://www.copyright.com/ccc/openurl.do?sid=pd_hw1532298X&issn=1532298X&WT.mc_id=pd_hw1532298X
eTOCs http://www.plantcell.org/cgi/alerts/ctmain
Sign up for eTOCs at:
CiteTrack Alerts http://www.plantcell.org/cgi/alerts/ctmain
Sign up for CiteTrack Alerts at:
Subscription Information http://www.aspb.org/publications/subscriptions.cfm
is available at:Plant Physiology and The Plant CellSubscription Information for
ADVANCING THE SCIENCE OF PLANT BIOLOGY © American Society of Plant Biologists