Embed Size (px)
Citation preview
ATRF Conference Perth - TravelSmart
C:\Users\mbouverie\Desktop\ATRF Papers for Impact\081 (Freer, David).docx
13 September 2012 1
Smart Evaluation leads to Smarter Travel Delivery - understanding the what and why
Abstract
In 2009 the Queensland Government commissioned the world’s largest travel behaviour change
project, targeting 324,000 households in Brisbane, the Gold Coast and the Sunshine Coast. The aim
was to reduce vehicle kilometres travelled by 10%, reduce CO2 emissions and increase sustainable
transport use.
This program had a number of firsts. Rather than providing all of the commission to their previous
provider Queensland Government split up the delivery between three teams. They also did
something else new. After ten years of receiving glowing evaluations of the success of the program
they commissioned an independent evaluation of the program from beginning to end. And not just
the end of the implementation as is normally done but over 6 months after the implementation had
been completed, so as to determine if any change had been sustained.
For the 2010 ATRF conference we submitted our paper “324,000 people can't be wrong - evaluating
the world's largest individualised marketing project” where we detailed our approach and presented
some preliminary findings. The final evaluation report was submitted to Queensland Government in
May 2012 including a substantial database on travel behaviour and attitudes. This paper presents
the outcomes and recommendations on best practice.
Faced with an ever growing and challenging transport task and a constrained fiscal environment
Australia needs to travel smarter. The best practice principles recommended here apply not just to
governments but industry, operators and users. Australia has a car culture second only to the USA.
Demonising and penalising the car driver is not the solution. The key finding of our evaluation is that
we need to better understand the demand, not just the numbers but why people travel the way they
do. Get this right and you can plan and deliver to meet needs of operators and users in a more cost
effective and efficient way.
ATRF Conference Perth - TravelSmart
C:\Users\mbouverie\Desktop\ATRF Papers for Impact\081 (Freer, David).docx
13 September 2012 2
1. Introduction
There is a high level of scepticism amongst the wider professional and political audience on the
reported benefits of TravelSmart programs. I can appreciate this. Some of the published reports
have made grand claims on changes in behaviour that we intuitively question as we do not see
significant improvements in traffic congestion that should occur if these were true. I think we have
all experienced the weather forecast that tells us it is a beautiful sunny day and at the same time we
are looking out of the window at a wet miserable day. We need to be convinced that TravelSmart
works beyond being told how good it is, especially if this message is coming from those who are
implementing the program.
We therefore need to get smarter in how we look at travel behaviour, why we chose the actions we
do to address identified issues and how we are justifying their effectiveness. This paper looks at how
we reviewed a recent TravelSmart program, the outcomes we reported and what improvements
could be made in developing best practice.
2. The Project
The aim of this project was to encourage a change in travel patterns as part of an overall objective to
reduce dependency on the car, and where possible encourage the use of public or active (walking /
cycling) transport options as an alternative mode of transport.
The project was made up of two components
• Component 1 – Implementation: The implementation of travel behaviour initiatives that
sought to change the travel behaviour of household members by removing the perceived
barriers for using sustainable travel modes, by raising awareness of the availability of these
travel options and promoting the associated benefits of their use.
• Component 2 – Evaluation: The department sought professional services to assess, evaluate
and report on the level of travel behaviour change within each of the three project areas in
terms of meeting key program objectives.
With almost 300,000 households engaged, the Queensland Government TravelSmart Communities
Project it is the largest such program undertaken in the world.
ATRF Conference Perth - TravelSmart
C:\Users\mbouverie\Desktop\ATRF Papers for Impact\081 (Freer, David).docx
13 September 2012 3
2.1 Project Objectives
The initial project objectives focused on reducing Vehicle Kilometres Travelled (VKT) by 10%. The
evaluation team further refined this into a series of Key Performance Indicators (KPIs). These were
split into two areas to be assessed:
• Behavioural Outcomes: actual changes in existing travel patterns.
• Attitudinal Outcomes: householders’ awareness, understanding and
perceptions regarding alternative transport options to the private car.
In addition a series of KPIs for Implementation Outputs were developed for the implementation
teams in terms of meeting contractual commitments, contacting households and delivering tools
and services. However, as there was not the opportunity to develop KPIs before contracts were
awarded these served as reporting indicators only rather than strict targets for implementation
effectiveness.
2.2 Study Areas
Three study areas were chosen with three different companies retained to implement the program.
These are shown in Figure 1 overleaf.
Each study presented opportunities and constraints to the implementation teams.
• Brisbane South contained a range of different land use types – inner city suburbs with relatively high density living and a good level of public and active transport provision, and lower density outer suburbs with much more limited travel options.
• The Gold Coast is a rapidly growing and evolving urban area centred around the tourism industry but with few other employment options. There is a high level of car use and limited alternative travel options for many journeys.
• The Sunshine Coast has a history of TravelSmart projects and strong support from the local council. There is however an older demographic, a lower density urban pattern than the two other study areas and limited public transport options, alongside a high level of car dependence.
ATRF Conference Perth - TravelSmart
C:\Users\mbouverie\Desktop\ATRF Papers for Impact\081 (Freer, David).docx
13 September 2012 4
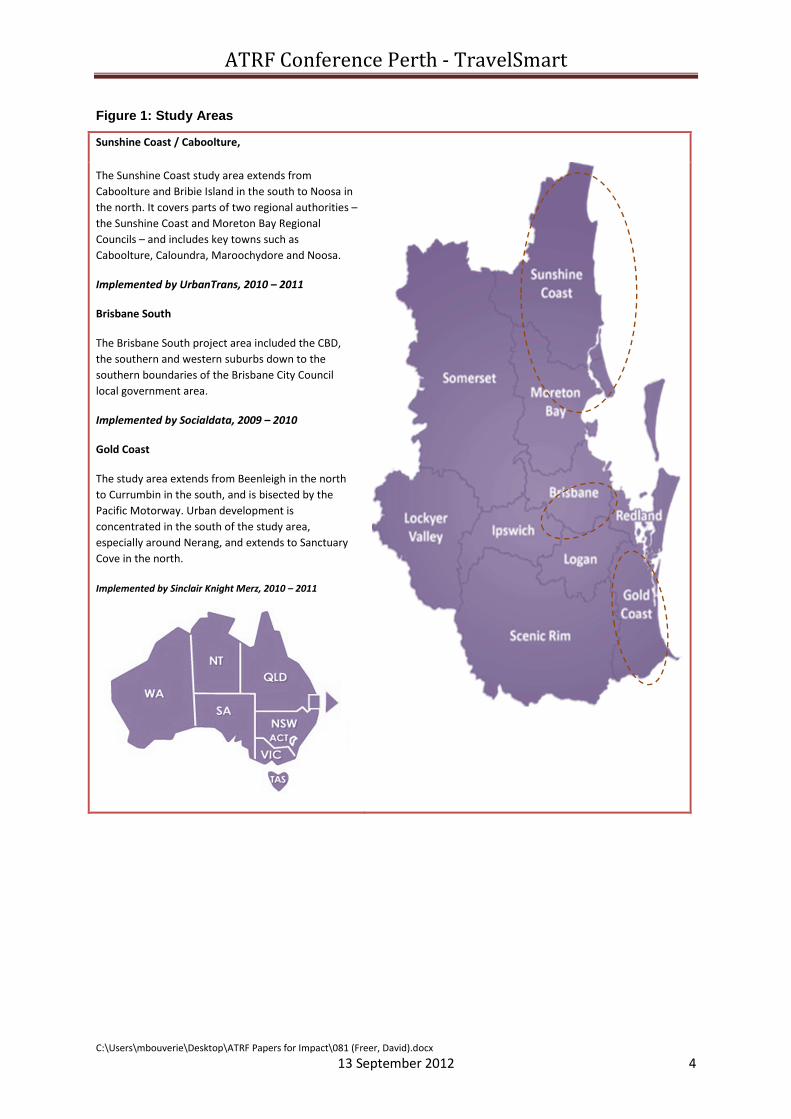
Figure 1: Study Areas
Sunshine Coast / Caboolture,
The Sunshine Coast study area extends from
Caboolture and Bribie Island in the south to Noosa in
the north. It covers parts of two regional authorities –
the Sunshine Coast and Moreton Bay Regional
Councils – and includes key towns such as
Caboolture, Caloundra, Maroochydore and Noosa.
Implemented by UrbanTrans, 2010 – 2011
Brisbane South
The Brisbane South project area included the CBD,
the southern and western suburbs down to the
southern boundaries of the Brisbane City Council
local government area.
Implemented by Socialdata, 2009 – 2010
Gold Coast
The study area extends from Beenleigh in the north
to Currumbin in the south, and is bisected by the
Pacific Motorway. Urban development is
concentrated in the south of the study area,
especially around Nerang, and extends to Sanctuary
Cove in the north.
Implemented by Sinclair Knight Merz, 2010 – 2011
ATRF Conference Perth - TravelSmart
C:\Users\mbouverie\Desktop\ATRF Papers for Impact\081 (Freer, David).docx
13 September 2012 5
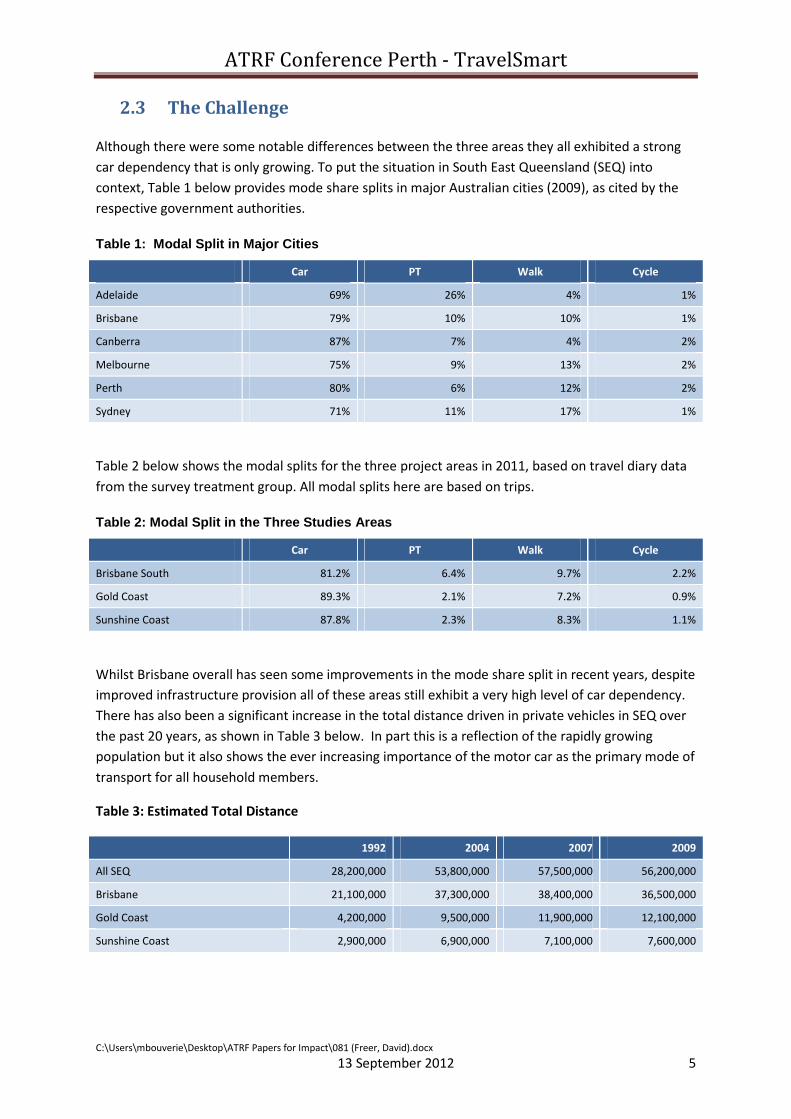
2.3 The Challenge
Although there were some notable differences between the three areas they all exhibited a strong
car dependency that is only growing. To put the situation in South East Queensland (SEQ) into
context, Table 1 below provides mode share splits in major Australian cities (2009), as cited by the
respective government authorities.
Table 1: Modal Split in Major Cities
Car PT Walk Cycle
Adelaide 69% 26% 4% 1%
Brisbane 79% 10% 10% 1%
Canberra 87% 7% 4% 2%
Melbourne 75% 9% 13% 2%
Perth 80% 6% 12% 2%
Sydney 71% 11% 17% 1%
Table 2 below shows the modal splits for the three project areas in 2011, based on travel diary data
from the survey treatment group. All modal splits here are based on trips.
Table 2: Modal Split in the Three Studies Areas
Car PT Walk Cycle
Brisbane South 81.2% 6.4% 9.7% 2.2%
Gold Coast 89.3% 2.1% 7.2% 0.9%
Sunshine Coast 87.8% 2.3% 8.3% 1.1%
Whilst Brisbane overall has seen some improvements in the mode share split in recent years, despite
improved infrastructure provision all of these areas still exhibit a very high level of car dependency.
There has also been a significant increase in the total distance driven in private vehicles in SEQ over
the past 20 years, as shown in Table 3 below. In part this is a reflection of the rapidly growing
population but it also shows the ever increasing importance of the motor car as the primary mode of
transport for all household members.
Table 3: Estimated Total Distance
1992 2004 2007 2009
All SEQ 28,200,000 53,800,000 57,500,000 56,200,000
Brisbane 21,100,000 37,300,000 38,400,000 36,500,000
Gold Coast 4,200,000 9,500,000 11,900,000 12,100,000
Sunshine Coast 2,900,000 6,900,000 7,100,000 7,600,000
ATRF Conference Perth - TravelSmart
C:\Users\mbouverie\Desktop\ATRF Papers for Impact\081 (Freer, David).docx
13 September 2012 6
3. Component 1 – Implementation
The implementation phase of the project was undertaken by three separate teams.
• Socialdata - Brisbane South
• SKM – Gold Coast
• UrbanTrans – Sunshine Coast
Socialdata had traditionally undertaken all of the previous studies, both implementation and
evaluation in Queensland
Each of the three implementation teams adopted a geographical wave approach to meet their key
objective of contacting a set number of households. Socialdata and SKM both adopted a linear
process (east-west and south-north respectively), while UrbanTrans adopted more of a figure-of-
eight approach up and down their project area.
Each methodology was based on established travel behaviour implementation principles of
segmenting households by current travel behaviour and willingness to become engaged in the
program. Each of the teams also had a set of agreed support materials that they could use. There
were however significant differences in their specific approaches. All three teams had to adapt their
engagement and delivery processes during the project planning stage to comply with Queensland
Government protocols, and this issue was identified by both the implementation and evaluation
teams as having an impact on the effectiveness of the program.
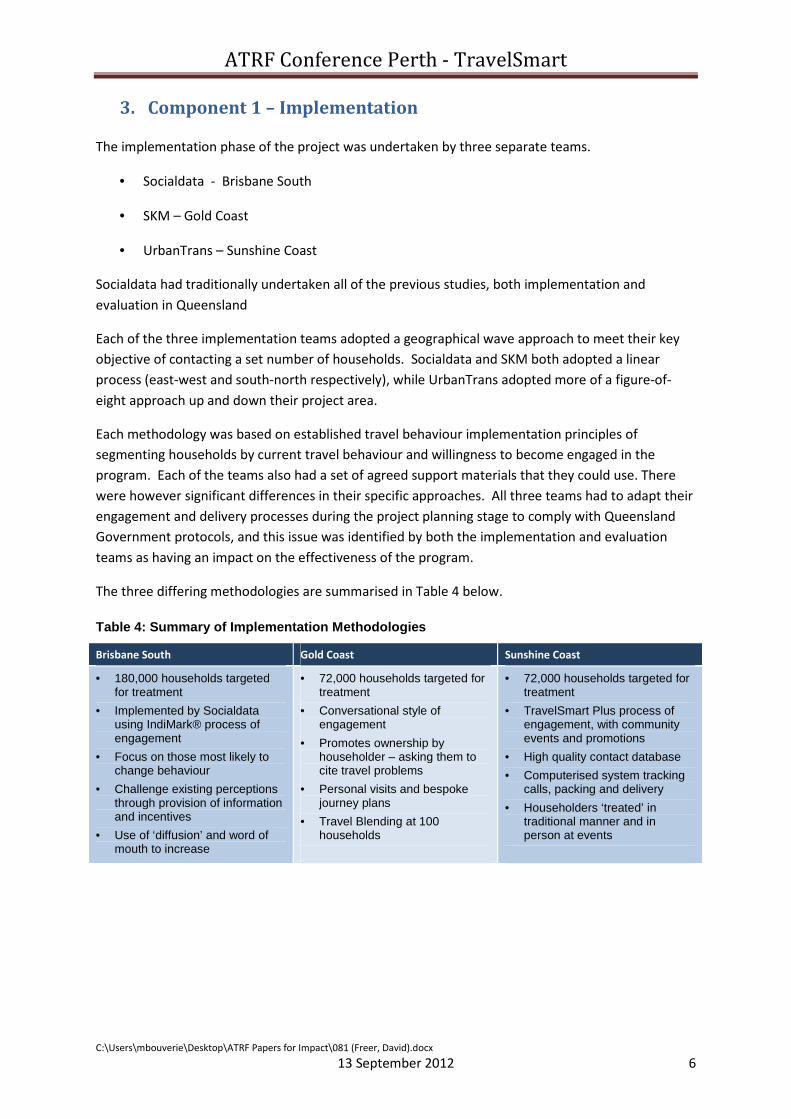
The three differing methodologies are summarised in Table 4 below.
Table 4: Summary of Implementation Methodologies
Brisbane South Gold Coast Sunshine Coast
• 180,000 households targeted for treatment
• Implemented by Socialdata using IndiMark® process of engagement
• Focus on those most likely to change behaviour
• Challenge existing perceptions through provision of information and incentives
• Use of ‘diffusion’ and word of mouth to increase
• 72,000 households targeted for treatment
• Conversational style of engagement
• Promotes ownership by householder – asking them to cite travel problems
• Personal visits and bespoke journey plans
• Travel Blending at 100 households
• 72,000 households targeted for treatment
• TravelSmart Plus process of engagement, with community events and promotions
• High quality contact database
• Computerised system tracking calls, packing and delivery
• Householders ‘treated’ in traditional manner and in person at events
ATRF Conference Perth - TravelSmart
C:\Users\mbouverie\Desktop\ATRF Papers for Impact\081 (Freer, David).docx
13 September 2012 7
4. Component 2 – Evaluation
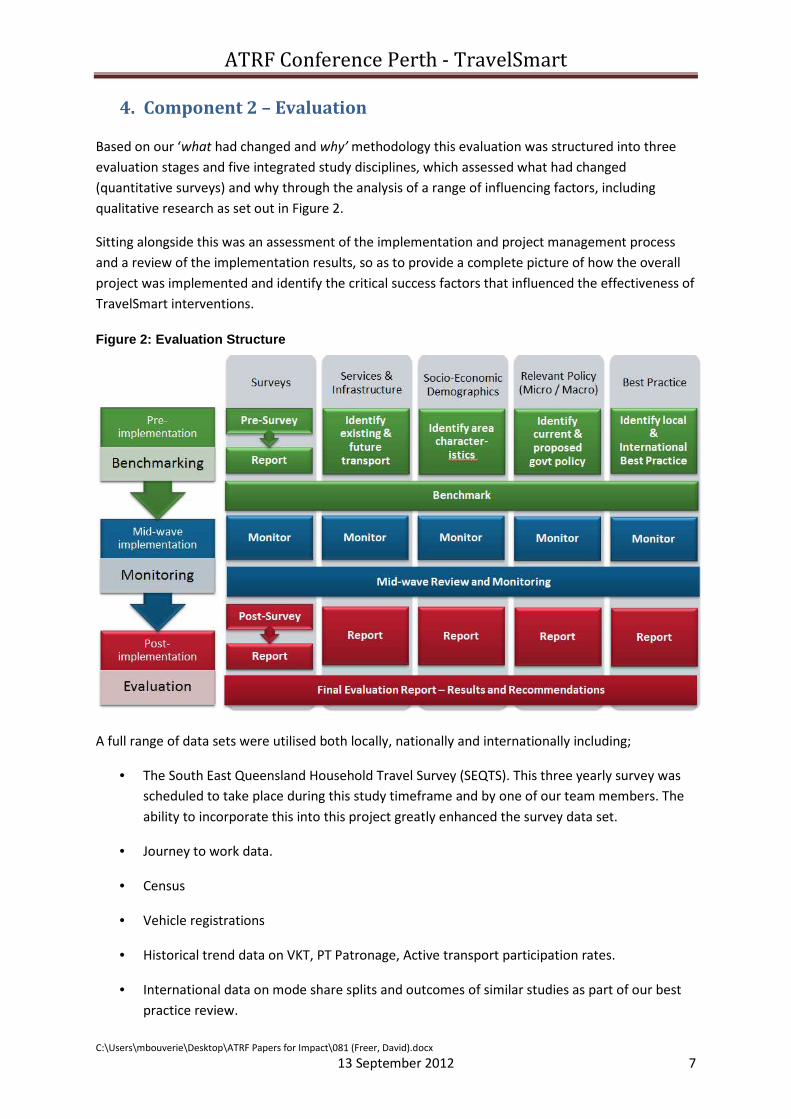
Based on our ‘what had changed and why’ methodology this evaluation was structured into three
evaluation stages and five integrated study disciplines, which assessed what had changed
(quantitative surveys) and why through the analysis of a range of influencing factors, including
qualitative research as set out in Figure 2.
Sitting alongside this was an assessment of the implementation and project management process
and a review of the implementation results, so as to provide a complete picture of how the overall
project was implemented and identify the critical success factors that influenced the effectiveness of
TravelSmart interventions.
Figure 2: Evaluation Structure
A full range of data sets were utilised both locally, nationally and internationally including;
• The South East Queensland Household Travel Survey (SEQTS). This three yearly survey was
scheduled to take place during this study timeframe and by one of our team members. The
ability to incorporate this into this project greatly enhanced the survey data set.
• Journey to work data.
• Census
• Vehicle registrations
• Historical trend data on VKT, PT Patronage, Active transport participation rates.
• International data on mode share splits and outcomes of similar studies as part of our best
practice review.
ATRF Conference Perth - TravelSmart
C:\Users\mbouverie\Desktop\ATRF Papers for Impact\081 (Freer, David).docx
13 September 2012 8
• Economic costs of congestion.
• Accessibility to PT – new data collected by the evaluation team.
• Demographic and socio-economic data on households in the study areas.
• Existing and planned transport infrastructure.
• Published government reports, polices and strategies that could impact on travel behaviour.
A detailed longitudinal survey of households was undertaken. A panel of households were recruited
from the SEQTS to allow us to quantify changes not just in reported and actual travel behaviour but
also in attitudes to travel behaviour. This was supported by qualitative group discussions that
investigated the reasons behind people’s perception of travel options. Travel diaries and detailed
travel surveys were undertaken for households within the Treatment area, a prescribed area
containing households that were targeted for engagement through the TravelSmart Communities
project, and Control areas – a designated part (or parts) of the overall project area where
households were deliberately not party to the TravelSmart Communities interventions, in order to
measure normal changes in behaviour during project period. The survey included participants and
non-participants of the TravelSmart program.
4.1 The What and Why
When developing the methodology for this evaluation the underlying premise was that we needed
to better understand what travel patterns are currently occurring and why. This provides the
reference point from which to fully measure not just what has changed but help explain why this
may have occurred.
Current transport planning makes assumptions about what travel is occurring and why. Neither of
these is consistent by geographical location or time period. For example, as was evident in this
project, travel patterns varied considerably within each of the study areas depending on where you
lived and the corresponding accessibility to your travel destination and availability of travel options.
Additionally, travel patterns vary over the course of a week and year. Simply look at your own travel
patterns over time and think of all of the factors that have influenced your travel patterns. They are
likely to include a change of job or home location, need to get fit, parenthood, increased wealth,
weather, peer pressure, availability of travel options, cost, after work activities and so on.
The previous approach within Queensland was for the implementation team to also undertake the
evaluation of the projects effectiveness. These methodologies appeared to adopt the standard
industry practice of using a representative sample of control and treatment groups, recording their
travel behaviour immediately before and after implementation.
Any reported changes in travel behaviours within the treatment group not found in the control
group were simply attributed to the success of the project, as opposed to also considering the
impact that external factors may have had on travel patterns.
There were a number of fundamental flaws to this approach:
ATRF Conference Perth - TravelSmart
C:\Users\mbouverie\Desktop\ATRF Papers for Impact\081 (Freer, David).docx
13 September 2012 9
• There was no independent verification of the data.
• The data was collected immediately after the implementation program. This is the point at
which the likelihood of any person trying a new travel pattern will be at its highest but fails
to address if this change is sustained, a major criticism of such programs.
• There was no targeting of approach to suit local conditions. A generic implementation
methodology is applied to all households irrespective of their accessibility to public and
active transport and household characteristics.
• It attributes all of the (unsubstantiated) benefits of the project to TravelSmart. However,
there is a range of influencing factors to an individual’s travel patterns of which TravelSmart
will always be one of many. In the case of this project we also know there were other
government sponsored initiatives taking place such as big health campaign which also
claimed success in changing behaviours. There were also reported changes in travel
behaviour from trend data that showed VKT per person was reducing before the
TravelSmart implementation began.
So what is fact and what is fiction? To help us to determine this there were four core principles to
our methodology;
• Independent
• Comprehensive
• Statistically robust
• Understanding the reasons for travel
4.2 Independent
In an ideal world we would all mark our own exams, undertake our own work performance reviews
and surprise, surprise get top marks. In the real world our performance is judged and ranked by
others and so our work can be validated.
Too many evaluations are undertaken by those with a vested interest in the outcomes so in effect it
is simply a review of their own work.
Therefore, first and foremost the evaluation needs to be independent of the implementation.
ATRF Conference Perth - TravelSmart
C:\Users\mbouverie\Desktop\ATRF Papers for Impact\081 (Freer, David).docx
13 September 2012 10
4.3 Comprehensive
Based on the commonly accepted fact that travel behaviour is complex we need to cover all the
bases on possible influences to travel behaviour. Survey data is an important aspect to this process
but will not provide all the answers and should not be relied upon to do so. There are a range of
factors and some will be of more important to some than others. For instance, climate – the further
north into tropical Australia you go the more air conditioning becomes a necessity rather than a
luxury. So active transport rates for non-leisure trips can be lower.
Culture is another major determining factor. Whilst some communities in the world have a long
history and acceptance of using public transport, despite good disposable incomes that provide the
opportunity of using a car, others such as in Australia do not.
Therefore, we need to look beyond the obvious performance measures for evaluation travel
behaviour programs and delve deeper to understand why a person chooses to travel.
Prior to any implementation we need to understand the drivers and barriers to travel behaviour.
Prior includes not only the benchmarking of the here and now but also trend. A primary objective of
the TravelSmart Communities project was a reduction of 10% in VKT. But, as in these study areas
historically VKT was growing every year over the last 15 so the program would have to reverse this
trend before achieving any reduction. Interesting to note here was that the latest data showed VKT
reducing just prior to the implementation raising the question did any reported reduction in VKT
represent trend or an actual change?
Events occurring outside the control of the program during the implementation can impact on
outcomes. During this TravelSmart Communities project there was a prolonged bus strike in one of
the study areas, a new rail link in another, the wettest summer in decades, and project wide PT fare
increases in addition to ongoing global financial uncertainty.
Many evaluations take a snap shot record of events immediately after the implementation. A big
criticism of TravelSmart is that change is not sustained once the program finishes and old travel
behaviours return. Our approach took a longitudinal approach to see if any change was sustained or
just a short-term response to stimuli.
Therefore, we took a comprehensive approach to measuring change and why.
4.4 Statistically Robust
Even for the most statistically challenged of us, the notion of the number of people using a bicycle
increasing from two to three does not represent a 50% increase in cycling across a whole study area.
As transport plays such a dominate role in all of our lives the sheer quantum of the transport task
makes percentage changes in mode difficult to achieve. A transfer of tens of thousands of daily car
trips would have to occur for the mode split to be even very slightly reduced.
Collecting the relevant data, asking the right questions, performing defendable and transparent
analysis using robust statistical methods was a key fact of our methodology.
ATRF Conference Perth - TravelSmart
C:\Users\mbouverie\Desktop\ATRF Papers for Impact\081 (Freer, David).docx
13 September 2012 11
4.5 Understanding the reasons for travel
As we do not live in an authoritarian country where we are told how and when to travel, we make
our own choices. These choices are influenced by a range of factors and despite what traffic models
try to tell us, our decisions are not always based on logic. I am sure many of us have sat in traffic
congestion where, if we had been purely objective, we would have caught the bus instead which was
quicker and cheaper. The reasons we do not are complex and we need to understand people’s
perceptions and attitudes to travel.
On this point I would also challenge the view held by some travel behaviour practitioners that
people do not change from using the car simply because of a lack of knowledge on alternatives. I do
not believe that the provision of timetables maps and of course the obligatory bag and water bottle
by themselves encourage a change. It is much more complex than that. The focus needs to be more
on meeting their needs than just providing information – what are the tangible benefits for them as
an individual? The aim should be to provide the opportunity for an individual to think about their
options in an informed and supportive way.
Further details on our methodology are included in our 2010 ATRF conference paper “324,000
people can't be wrong - evaluating the world's largest individualised marketing project”.
ATRF Conference Perth - TravelSmart
C:\Users\mbouverie\Desktop\ATRF Papers for Impact\081 (Freer, David).docx
13 September 2012 12
5. Project Outcomes
At the time of writing this paper no decision had been made by Queensland Government on the
dissemination of the results as submitted in our final report in May 2012. The text below identifies
broad outcomes of the project. It is hoped by the time of the conference full data sets will be
available for publication.
5.1 Behavioural Outcomes – Private Vehicle Use
The core objective was a 10% reduction in VKT per person – both project wide and for each of the
three study areas. There was an encouraging level of reduction in VKT in each of the three project
areas, although the overall project-wide figure was slightly below the 10% target. Brisbane South
did manage to achieve this figure, closely followed by the Sunshine Coast and the Gold Coast.
Approximately half of the reduction in VKT came during the peak hours for Brisbane South but on
the two coastal areas it mostly occurred during off-peak hours.
The biggest change in travel time was achieved in Brisbane South, with a modest decrease for the
Gold Coast and a slight increase for the Sunshine Coast
5.2 Behavioural Outcomes – Public & Active Transport Use
The most significant change in active and public transport use was in the amount of ‘new users’ to
each mode. Looking at those persons in the Benchmark survey who stated that they ‘never used’
each of these modes, the data showed an increase in the proportion that have now tried that mode
– even if it just once or twice. There has been a considerable increase across the board, particularly
in terms of cycle use in all three areas and public transport use in the coastal areas.
Although this was a positive outcome for active and public transport use, since this reflects users
who are trying these modes for the first time, it did not necessarily translate immediately into trip
numbers. It will take time for this experimental behaviour to be turned into habitual use.
5.3 Attitudinal Outcomes
There was a high level of brand recognition for TravelSmart in all three project areas and overall
participants improved their rating of how convenient they thought public transport was. For many
attitudinal outcomes, such as the barriers to using specific modes, there were both positive and
negative changes recorded.
In terms of how informed participants felt there were about routes and timetables, there were some
increases and some decreases amongst those who were ‘totally informed’ (ranking it 9 or 10 out of
10). More significant changes were seen at the bottom end of this scale where the proportion of
people who were ‘totally uninformed’ was reduced. This indicates that TravelSmart had improved
the level of knowledge of those who had little or no experience of public or active transport options,
which can result in new users trying different transport modes for the first time.
ATRF Conference Perth - TravelSmart
C:\Users\mbouverie\Desktop\ATRF Papers for Impact\081 (Freer, David).docx
13 September 2012 13
6. Conclusions
The evaluation results led us to the conclusion that the program has been successful in engaging
households, providing them with an appropriate and suitable level of information and encouraging
them to think (and in some cases actually make) a change in their travel behaviour. Further survey
data suggested that this change is just the first step on the way to a habitual shift in travel behaviour
– plenty of people are trying new ways to get around but this has not yet been translated into
regular usage and a noticeable shift in mode share.
Each of the three study areas recorded a positive change in travel behaviour as referenced against
the project performance indicators. Whilst the Brisbane South study area recorded the highest level
of change the opportunity to change was at its greatest in this area. Conversely the two coastal
areas had significant constraints in terms of the availability of options and having an established
culture of car use. The changes recorded on the Gold Coast and Sunshine Coast are therefore
perhaps more notable. The greatest challenge to these types of programs is breaking the habit of
picking up the car keys when heading out.
Were all of these changes a direct result of the TravelSmart program? No. It is clear that travel
behaviour is influenced by a wide range of factors as confirmed in our analysis. Certainly
TravelSmart plays a positive role and there was evidence in our research that showed the program
played a major contributing role in a change. There were other factors at play as well though, with
personal health and changed working / living arrangements often cited as key motivators to change.
6.1 Factors influencing travel choice
Our review of a range of travel influencing factors has suggested that the following issues would all
have had a significant impact on individual travel choice:
• Personnel considerations
o A concern about health was a major motivator for those changing from car use to
other modes of transport.
o A change in job circumstances or living arrangements, which have the knock on
effect of changing travel patterns.
o Financial issues, which may have reduced non-essential activities and therefore the
number of trips undertaken.
o Car culture. There is an established pattern of car use that will take time to change,
especially in the coastal areas.
• Alternative options
o A viable alternative to the car is not always available for some households and for
some trips, both in terms of the availability of public transport routes or services and
the competitiveness of different options in terms of time or cost.
ATRF Conference Perth - TravelSmart
C:\Users\mbouverie\Desktop\ATRF Papers for Impact\081 (Freer, David).docx
13 September 2012 14
o Personal circumstances, such as the need to travel with / pick up children or having
to use a vehicle for work purposes can preclude alternative transport options.
• Implementation and program delivery
o The study areas were not homogenous with considerable differences in household
composition and proximity to alternative travel options other than the car. The mass
marketing approach did not fit all although attempts were made to tailor the
approach.
o A range of perceived and actual barriers to change was cited by residents over and
above knowledge of PT and cycle routes which was the focus of the program.
o Confused message. Multiple state and local agencies are implementing programs
that impact on travel behaviour but without any long-term or coordinated program.
What is clear from the evaluation process – which most likely confirms individual personal
experience and an intuitive understanding of the situation – is that there are a range of factors that
compel an individual or household to make a travel choice and these will change over the course of
the year and throughout a person’s life cycle. This large scale TravelSmart program, whilst an
important factor in affecting behaviour change, is nevertheless just one factor amongst many that
influence an individual’s travel choice.
6.2 Lessons learnt
The three-year project evaluation resulted in a wealth of quantitative and qualitative data regarding
travel habits and attitudes, as well as providing a unique opportunity to compare the methodologies
of three different implementation teams and observe project management issues throughout the
lifecycle of the program.
The Final Report provided to Queensland Government includes a series of ‘critical success factors’
that were noted to have had a positive impact on the success of the project, as well as 28
recommendations setting out how to maximise the chances of success for smarter travel programs
in the future. These recommendations cover program set-up, evaluation methodology,
implementation methodology and project legacy, and it is hoped that Queensland Government will
publish these for the benefit of the wider transport community.
In terms of the overall impact of the program, the key changes for future programs would include:
• Benchmarking prior to project design and implementation.
• Targeted approach at those most able to change – those with available alternatives to car
use.
• Work with stakeholders (transport operators, local councils etc) to develop materials /
services and refine project design.
ATRF Conference Perth - TravelSmart
C:\Users\mbouverie\Desktop\ATRF Papers for Impact\081 (Freer, David).docx
13 September 2012 15
6.3 Issues for the future
Whilst the comprehensive evaluation found neither a ‘smoking gun’ nor ‘silver bullet’ upon which to
base future programs, it did show that TravelSmart played a valuable role in influencing travel
behaviour and contributed to an environment in which individuals were able to make a positive
change to their travel habits.
TravelSmart is a cost effective and efficient method of delivering a sustainable transport message. It
is still, however, viewed as a ‘fringe science’ by many practitioners and politicians can consider it to
be an anti-car policy that is not acceptable to their support base. There is therefore a need to keep
learning from experiences and keep tailoring smarter travel projects to the needs of decision makers
as well as the needs of the community.
If TravelSmart and similar programs are to be progressed on both a local and national scale, so that
level of development, implementation and integration of smarter travel initiatives in Australia is
comparable to that seen in Europe and North America, some key issues need to be addressed:
• Ensuring cross-party political buy-in to the aims of smarter travel programs – this study has
shown that there are numerous motivators behind travel choice and the benefits include
personal health, economic, social and environmental factors.
• Integrating TravelSmart style projects into broader community-orientated initiatives, such as
health promotion, household waste and recycling, and energy and water use, to ensure
added value and a better use of resources.
• Ensuring an open line of regular communication between stakeholders – including different
levels of government, transport operators and user groups, business, education and health
providers as well as the local communities themselves – structured working groups and
regular two-way exchanges of information and experience can lend critical support to the
successful implementation of such projects.
• Instigating a level of national coordination to aid acceptance of smarter travel as an effective
policy tool and increase knowledge and capacity within the industry – crucially through
establishing guidelines, networking and the sharing of best practice.
It is hoped that the Queensland Government will have released the TravelSmart Communities
Evaluation Report for publication by the time of the ATRF conference and the key results and
recommendations of the report will be able to be presented, addressing these and other key
findings of the evaluation.