Embed Size (px)
Citation preview
Attached is a research report on CBA PERLS VI produced by Morningstar Australasia Pty Limited (Morningstar). Morningstar is not affiliated with Commonwealth Bank of Australia (CBA). The research report is the property of Morningstar. The views and opinions expressed in the research report are those of Morningstar and have not been reviewed by CBA. You are permitted to use the research report only in Australia and New Zealand for your research and analysis of CBA PERLS VI and subject to the terms set out by Morningstar in the research report. If you redistribute the report to any other person in Australia and New Zealand you must ensure the report is used solely for that person’s research and analysis of CBA PERLS VI and for no other purpose and subject to the terms set out by Morningstar in the research report.
3 September 2012
OverviewCommonwealth Bank (CBA) will raise $750m via an ASX-listed hybrid issue, Perpetual Exchangeable Resaleable Securities VI (PERLS VI) (ASX Code: CBAPC). This is another mandatory converting hybrid. CBAPC are perpetual, exchangeable, unsecured, subordinated notes with a mandatory exchange date of 15 December 2020, subject to conditions unless they are redeemed or exchanged earlier following specific events (see key terms) or CBA exercising an option to call the security two years early. Face value is $100. Fully franked dividends are discretionary and non-cumulative payable quarterly, based on the 90-day BBSW rate plus a margin. CBA has not provided an indicative margin range. This issue will fund the redemption of PERLS IV (CBAPB), which are approaching their mandatory conversion date of 31 October 2012.
Summary and RecommendationWe recommend investors subscribe. On an absolute basis the security is undervalued as we expect it to offer a margin comfortably above our fair margin of 3.15%. We point out however that similar securities (ANZ’s ANZPC and Westpac’s WBCPC) are currently trading at margins around 3.80% so we would prefer CBAPC to have a margin of 3.80% or more.
The security potentially offers attractive distributions backed by a business with strong competitive advantages. However, the additional terms such as the mandatory conversion trigger conditions make CBAPC the most equity-like of the major bank hybrids on issue and therefore the riskiest in that relatively low risk group. Investors need to be comfortable with this. We would have preferred CBA issue a higher ranking, pure debt security such as the subordinated note issues by the other major banks (ANZHA, NABHA,
WBCHA) though the margin on CBAPC will be higher to compensate for the higher risk.
We assign CBA a low business risk and are comfortable with an investment in CBA. As such CBAPC falls into the lower risk group of our income securities coverage universe but note that in terms of the major bank hybrids, it is more risky. Investors also need to appreciate CBAPC is an unsecured and subordinated investment, so in a wind-up scenario, investors could potentially lose all their investment. Put simply, it is riskier than a bank deposit. To be very clear though, we don’t forecast financial distress for CBA. Investors are also exposed to the possibility of a fall in CBA’s share price to below the minimum conversion price, in which case the security would not be converted and would roll over until the share price recovers. But we think this unlikely and have a fair value estimate of $60.00 on CBA shares, which is above where they currently trade. There is also the risk investors could get less than $100 worth of shares on conversion following specific trigger events. Compared to a recent share price for CBA of $54, the price of CBA shares would have to fall to around $10.80 for CBAPC securityholders to receive CBA ordinary shares worth less than $100. We think this too is unlikely as that price is well below our $44 bear-case fair value estimate for CBA ordinary shares.
We remind potential investors to weigh up alternative investment options, depending on their individual preferences: bank deposits, bank equity, or bank debt such as this security. Yields on major bank equities still look attractive though they carry more risk and prices are more volatile than hybrids. For example, Morningstar has a forecast FY13 maximum gross yield of around 9.1% for CBA based on the recent share price of $54 and 8.2% on our $60.00 fair value estimate.
ValuationWhile all the CBA hybrids have the same underlying exposure, being the CBA group, the terms of CBAPC are less attractive than CBAPA and CBAPB so we assign a higher fair margin of 3.15% versus 2.40% for CBAPA and CBAPB. The fair margin is calculated using a credit spread of 1.80%, an illiquidity cost of 0.10% and an additional 1.25% to account
CBA PERLS VI (CBAPC) : Looks attractive at the right margin though not quite a black PERL
Recommendation: Subscribe Prefer margin of at least 3.80%.
Contact Details
AustraliaCall +61 2 9276 [email protected]
New ZealandCall +64 9 915 [email protected]
© 2012 Morningstar, Inc. All rights reserved. Neither Morningstar, nor its affiliates nor their content providers guarantee the data or content contained herein to be accurate, complete or timely nor will they have any liability for its use or distribution. Any general advice has been prepared by Morningstar Australasia Pty Ltd (ABN: 95 090 665 544, AFSL: 240892) and/or Morningstar Research Limited, subsidiaries of Morningstar, Inc, without reference to your objectives, financial situation or needs. You should consider the advice in light of these matters and, if applicable, the relevant Product Disclosure Statement (in respect of Australian products) or Investment Statement (in respect of New Zealand products) before making any decision to invest. Neither Morningstar, nor Morningstar’s subsidiaries, nor Morningstar’s employees can provide you with personalised financial advice. To obtain advice tailored to your particular circumstances, please contact a professional financial adviser. DISCLOSURE: Morningstar employees may have an interest in the securities discussed in this report. Please refer to Morningstar’s Financial Services Guide (FSG) for more information www.morningstar.com.au/s/fsg.pdf. Note: Some material is copyright and published under licence from ASX Operations Pty Limited ACN 004 523 782 ("ASXO").
Ravi ReddyCredit Analyst
About Morningstar
Morningstar, Inc. is a leading provider of independent investment research in North America, Europe, Australia, and Asia. The company offers an extensive line of products and services for individuals, financial advisers, and institutions.
3 September 2012 2
rogue trader losses or a massive increase in bad debts. Put in context, such an event would have to erase around $8bn of capital or slightly more than one year’s profits - not impossible, but highly unlikely. If this ratio did fall below 5.125%, CBAPC holders would likely suffer a capital loss due to maximum conversion conditions, unlike holders of CBAPA, which doesn’t have this condition. However in such a scenario the price of other CBA hybrids would likely trade like equity and be adversely impacted. So if CBAPA and CBAPC were trading at similar margins our preference would be CBAPA given its superior terms.
CBAPC has inferior dividend stopper conditions, similar to ANZPC and WBCPC. CBA could potentially keep paying distributions on CBAPA and PCAPA while not paying on CBAPC. This situation is unlikely but possible.
CBAPC is the first major bank hybrid with a Non-Viability Trigger, which is now required by the prudential regulator, APRA, as part of Basel III global financial industry reforms. The Non-Viability Trigger essentially gives APRA the discretion to require some or all of CBAPC to be converted into CBA ordinary shares. Similar to a conversion following a Capital Trigger event, holders could potentially receive ordinary shares worth less than $100.
A Non-Viability Trigger Event occurs if APRA believes that CBA would become non-viable without an exchange of some or all of CBAPC or a public sector injection of capital or equivalent support. The use of this trigger event by APRA is at its discretion so may not be limited to its concerns about CBA’s capital levels and could extend to concerns about the bank’s funding and liquidity. CBA’s metrics for capital funding and liquidity are strong. However, being a qualitative trigger, assessing the Non-Viability Trigger is more complex than a quantitative benchmark like the Capital Trigger. This makes CBAPC the most equity-like of the major bank hybrids on issue and therefore riskier. These terms are imposed by APRA and effectively make CBAPC subordinate to other CBA hybrids on issue. It must be remembered APRA is trying to protect policyholders and depositholders. We consider securityholders’ prospective interests in our analysis.
Other security risks include:
33 CBAPC are on unsecured, subordinated investment, so in a wind-up scenario noteholders could potentially lose all of their investment.33 CBA could default on the payment of distributions.
Missed distributions do not have to made up.33 CBA could issue more equal or higher-ranking
securities, which may reduce the ability of CBAPC
for non-cumulative distributions, the maximum number of shares on conversion conditions, Capital and Non-Viability Trigger events, subordinate dividend stopper conditions and risk of substantial share price movement.
CBAPC is a ‘true’ hybrid with debt and equity like characteristics as it can be converted into ordinary equity. It is of similar ilk to the most recent hybrid issues by ANZ and Westpac (WBC) (ANZPC and WBCPC), which have been issued under stricter rules imposed by the prudential regulator, Australian Prudential Regulation Authority (APRA). ANZPC and WBCPC are the closest listed major bank hybrids to CBAPC, however, the terms of CBAPC are less favourable than these two securities.
Our fair margin of 3.15% on CBAPC is higher than our 2.65% fair margin for ANZPC and WBCPC and 2.40% for CBAPA and CBAPB. ANZPC and WBCPC pay margins of 3.10% and 3.25% above the 180-Day BBSW rate. If we exclude notional accrued distributions, ANZPC and WBCPC were trading below face value as at 30 August 2012. Consequently they have been trading on market at higher margins, averaging around 3.8% recently.
On an absolute valuation basis, if the margin on CBAPC is set above our fair margin of 3.15% the security would look attractive. However for an investor with a dollar to invest, the choice is between the CBAPC offer or one of the securities currently on issue. Therefore on a relative valuation basis we prefer CBAPC to have a margin of 3.80% or above, which is where ANZPC and WBCPC currently trade. If the margin is set below the trading margins on ANZPC and WBCPC it is reasonable to expect CBAPC to trade on market below face value. So there may be a better entry point into CBAPC once it lists.
Security RisksSimilar to ANZPC and WBCPC, CBAPC has a Capital Trigger event clause which requires immediate conversion of some or all securities into ordinary equity if the bank’s core capital ratio falls below 5.125%. In such a scenario CBAPC security holders would receive ordinary shares worth less than $100 if the CBA share price at the time was less than the relevant amount due to a maximum number of shares on conversion condition.
CBA’s Common Equity Tier 1 ratio on a Basel III basis ratio was 7.5% as at 30 June 2012. This provides a healthy buffer of around $8b over the 5.125% minimum. This ratio is not likely to trickle down to 5.125%. Any fall below 5.125% would probably be sudden, through a major operational failure such as
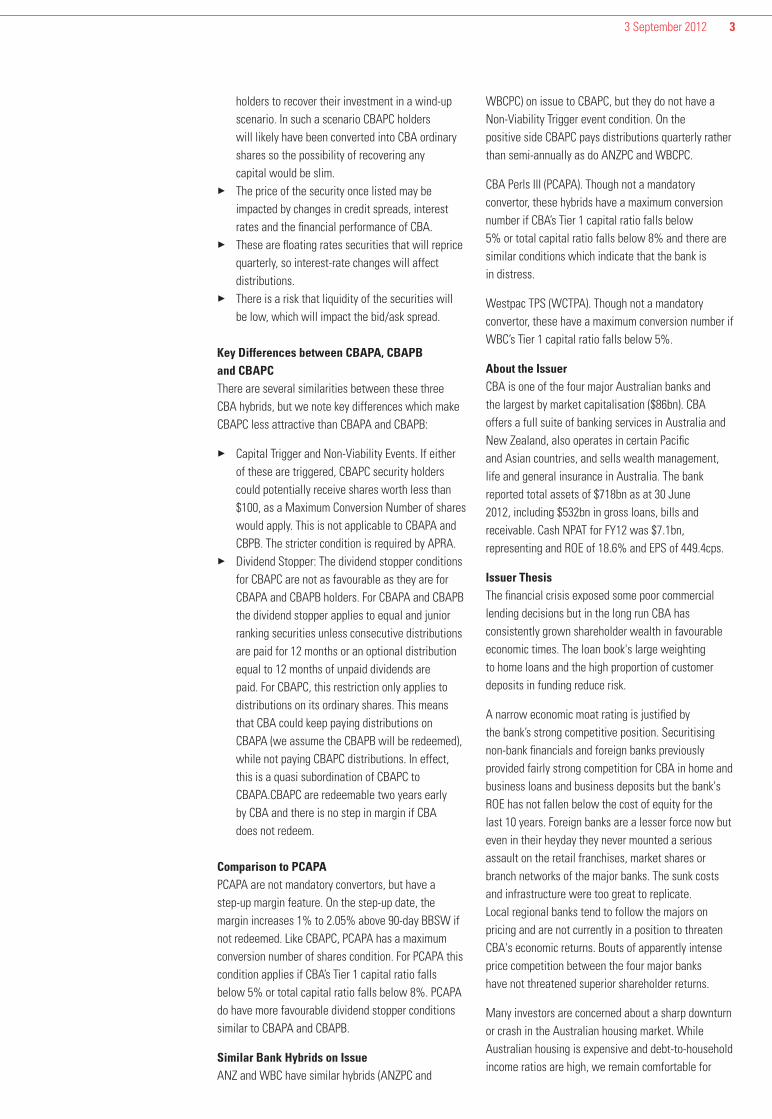
Source: Morningstar 20 August 2012
ASX Morningstar Gross Code FY13 Forecast Yield
ANZ 8.9%
CBA 9.1%
NAB 10.8%
WBC 9.9%
Major Bank Dividends Yields
3 September 2012 3
holders to recover their investment in a wind-up scenario. In such a scenario CBAPC holders will likely have been converted into CBA ordinary shares so the possibility of recovering any capital would be slim.33 The price of the security once listed may be
impacted by changes in credit spreads, interest rates and the financial performance of CBA.33 These are floating rates securities that will reprice
quarterly, so interest-rate changes will affect distributions.33 There is a risk that liquidity of the securities will
be low, which will impact the bid/ask spread. Key Differences between CBAPA, CBAPB and CBAPCThere are several similarities between these three CBA hybrids, but we note key differences which make CBAPC less attractive than CBAPA and CBAPB:
33 Capital Trigger and Non-Viability Events. If either of these are triggered, CBAPC security holders could potentially receive shares worth less than $100, as a Maximum Conversion Number of shares would apply. This is not applicable to CBAPA and CBPB. The stricter condition is required by APRA. 33 Dividend Stopper: The dividend stopper conditions
for CBAPC are not as favourable as they are for CBAPA and CBAPB holders. For CBAPA and CBAPB the dividend stopper applies to equal and junior ranking securities unless consecutive distributions are paid for 12 months or an optional distribution equal to 12 months of unpaid dividends are paid. For CBAPC, this restriction only applies to distributions on its ordinary shares. This means that CBA could keep paying distributions on CBAPA (we assume the CBAPB will be redeemed), while not paying CBAPC distributions. In effect, this is a quasi subordination of CBAPC to CBAPA.CBAPC are redeemable two years early by CBA and there is no step in margin if CBA does not redeem.
Comparison to PCAPAPCAPA are not mandatory convertors, but have a step-up margin feature. On the step-up date, the margin increases 1% to 2.05% above 90-day BBSW if not redeemed. Like CBAPC, PCAPA has a maximum conversion number of shares condition. For PCAPA this condition applies if CBA’s Tier 1 capital ratio falls below 5% or total capital ratio falls below 8%. PCAPA do have more favourable dividend stopper conditions similar to CBAPA and CBAPB.
Similar Bank Hybrids on IssueANZ and WBC have similar hybrids (ANZPC and
WBCPC) on issue to CBAPC, but they do not have a Non-Viability Trigger event condition. On the positive side CBAPC pays distributions quarterly rather than semi-annually as do ANZPC and WBCPC.
CBA Perls III (PCAPA). Though not a mandatory convertor, these hybrids have a maximum conversion number if CBA’s Tier 1 capital ratio falls below 5% or total capital ratio falls below 8% and there are similar conditions which indicate that the bank is in distress.
Westpac TPS (WCTPA). Though not a mandatory convertor, these have a maximum conversion number if WBC’s Tier 1 capital ratio falls below 5%.
About the IssuerCBA is one of the four major Australian banks and the largest by market capitalisation ($86bn). CBA offers a full suite of banking services in Australia and New Zealand, also operates in certain Pacific and Asian countries, and sells wealth management, life and general insurance in Australia. The bank reported total assets of $718bn as at 30 June 2012, including $532bn in gross loans, bills and receivable. Cash NPAT for FY12 was $7.1bn, representing and ROE of 18.6% and EPS of 449.4cps.
Issuer ThesisThe financial crisis exposed some poor commercial lending decisions but in the long run CBA has consistently grown shareholder wealth in favourable economic times. The loan book's large weighting to home loans and the high proportion of customer deposits in funding reduce risk.
A narrow economic moat rating is justified by the bank’s strong competitive position. Securitising non-bank financials and foreign banks previously provided fairly strong competition for CBA in home and business loans and business deposits but the bank's ROE has not fallen below the cost of equity for the last 10 years. Foreign banks are a lesser force now but even in their heyday they never mounted a serious assault on the retail franchises, market shares or branch networks of the major banks. The sunk costs and infrastructure were too great to replicate. Local regional banks tend to follow the majors on pricing and are not currently in a position to threaten CBA's economic returns. Bouts of apparently intense price competition between the four major banks have not threatened superior shareholder returns.
Many investors are concerned about a sharp downturn or crash in the Australian housing market. While Australian housing is expensive and debt-to-household income ratios are high, we remain comfortable for

3 September 2012 4
economic conditions. Higher interest rates, inflation and unemployment can reduce loan growth and increase bad and doubtful debts expense, while exchange rate volatility can affect certain sectors. In a severe recession CBA might not be adequately provisioned for the resulting bad debts. A substantial loss of market share in any major segment, coupled with contraction in net interest margins, would diminish net interest income. Wealth management earnings depend on the levels and direction of equity markets. Banks are tightly regulated and are thus exposed to adverse regulatory changes.
Some 20% of total funding is from offshore wholesale funding markets, exposing CBA to higher wholesale funding costs flowing from the European credit crisis. Since the 2008 global financial crisis CBA has mitigated this risk by increasing the maturity of its wholesale funding. The bank also retains the option to reprice the loan book, though this would be unpopular with customers.
Economic MoatWe assign a narrow moat rating to CBA, mainly due to sustainable structural characteristics of the Australian and New Zealand banking industries. The other three major banks also have narrow moat ratings.
Banking in Australia is largely an oligopoly, with the four major banks controlling over 90% of the business and consumer lending markets, plus the vast majority of bank deposits. Pricing is rational. New Zealand is similar. The concentrated industry benefits from high barriers to entry across most segments, making it hard for new entrants to gain any sort of foothold, particularly in retail and business banking. Foreign banks have not made a serious dent in the domestic majors' market share, while the smaller regional banks compete on service and local brand recognition but face higher wholesale funding costs than the majors and are unable to undercut on price. They tend to follow the majors in pricing.
Well-managed scale begets more scale. CBA leverages its large branch network to increase cross-sell, for example, of wealth management and insurance products. CBA's large scale generates substantial cost advantages over smaller banks and non-banks. This enables CBA to price competitively but still at levels which generate current ROEs.
In common with the other majors CBA has pricing power from brand strength, an intangible asset. Australians and New Zealanders have a cultural preference for large financial institutions with heritage brands due to perceived greater financial security.
several reasons. Tight underwriting standards, lender's mortgage insurance, low average loan-to-valuation ratios, a high incidence of loan pre-payment, full recourse lending, a high proportion of variable rate home loans and the scope for interest rate cuts by the Reserve Bank of Australia (RBA) combine to mitigate potential losses from mortgage lending. We cannot rule out falling home prices but investors who readily compare the Australian residential real estate market to that of the U.S. and other markets are ignoring fundamental differences.
CBA's Core Banking Modernisation (CBM) program is a major transformation project replacing antiquated, unreliable and inefficient 40 year-old IT systems. CBM should drive competitive advantage by enabling faster and targeted marketing campaigns, real- time banking and a smoother, more efficient customer experience.
The main current influence on earnings growth is weak credit growth, a product of household risk aversion and deleveraging, and delays to business plans for capital expenditure. Funding cost pressures are constraining interest margins.
Bad and doubtful debts expense peaked in first half fiscal 2009 and normalised by the end of fiscal 2011. Writebacks of the economic overlay, a general provision for higher bad debts in case the economy deteriorates sharply, are on hold during the current patchy economic conditions. Wealth management earnings will struggle while equity markets trend sideways or downwards. In addition cost control will be necessary for earnings growth in an environment of weak revenue growth.
CBA's narrow economic moat should enable it to grow profitably at the rate of system credit growth despite the headwinds. The four major banks have a powerful grip on lending markets and are also the first choice of depositors seeking capital security. CBA has one of the most recognised and trusted bank brands in Australia, the advertising and marketing budget, and customer fulfilment capacity (branches, systems, funding capacity) to increase this brand equity. CBA has proven it can increase cross-sell ratios and we expect further improvement as the CBM project rolls out. Excellent cost efficiency and room for further incremental improvement facilitate profitable growth even during periods of pricing pressure.
Business RisksIssuer RiskWe assign CBA a low business risk. CBA is a leveraged financial group lending to all segments of the economy. It is therefore exposed to deteriorating
3 September 2012 5
This preference exists even when the customer is a borrower.
A combination of scale, for example CBA accounts of 25% of the banking system's loans, and years of relentless management attention to costs make CBA one of the most cost-efficient banks in its industry, with a cost/income ratio of 46% in fiscal 2012 (banking sector average 47.0%). This enables the bank to price competitively while maintaining superior shareholder returns.
ManagementWe rate management highly. CEO Ralph Norris retired in late 2011 after six exemplary years of shareholder capital stewardship, including steering CBA through the global financial crisis with relatively little damage to earnings. His tenure was marked by few operational, execution and strategic missteps and many successes, especially a resilient strategy which continues to this day.
New CEO Ian Narev is a talented executive who got the job because he demonstrated understanding of the rapidly changing world of banking. He does, however, have relatively little experience as a banker, having headed CBA's Business & Private Banking Division only from 2009 to 2011. Before 2009 he was Group Head of Strategy and led the acquisition of Bankwest in 2008, as well as the investment in Aussie Home Loans. Before joining CBA, Ian Narev was a partner of McKinsey & Company, the global consulting firm, and before then a lawyer specialising in mergers and acquisitions.
Banking is a specialised and risky business and we normally prefer experienced career bankers as CEOs. Ian Narev demonstrates potential as a farsighted leader in the changing world of banking but has relatively little experience at loan underwriting and is untested at the CEO level
EarningsCBA delivered a record result with FY12 cash NPAT coming in at $7.1bn, up 4% on FY11 in line with Morningstar’s forecast. There were no major surprises and Morningstar retained its positive view on the narrow moat bank. The full year dividend was a record $3.34ps fully franked representing a 75% pay out. Earnings were supported by moderate loan growth (up 5%), strong customer deposit growth (up 8%), better than expected bad debts (down 15%) and solid cost control (up 3%). Divisional composition was strong with all divisions except Wealth Management increasing earnings. Business Banking, Institutional Banking and Bankwest all delivered impressive results.
In terms of income mix, banking represented 85%, fund management 10% and insurance 5% of total operating income. Net interest income, the most stable revenue line accounted for a healthy 66% of total operating income. Other banking fee income represented just below 20% and trading income, one of the most volatile revenue components, contributed less than 3%. By region the majority of CBA’s income is sourced from Australia (88.6% in FY12) with New Zealand making the next highest contribution of 7.9%
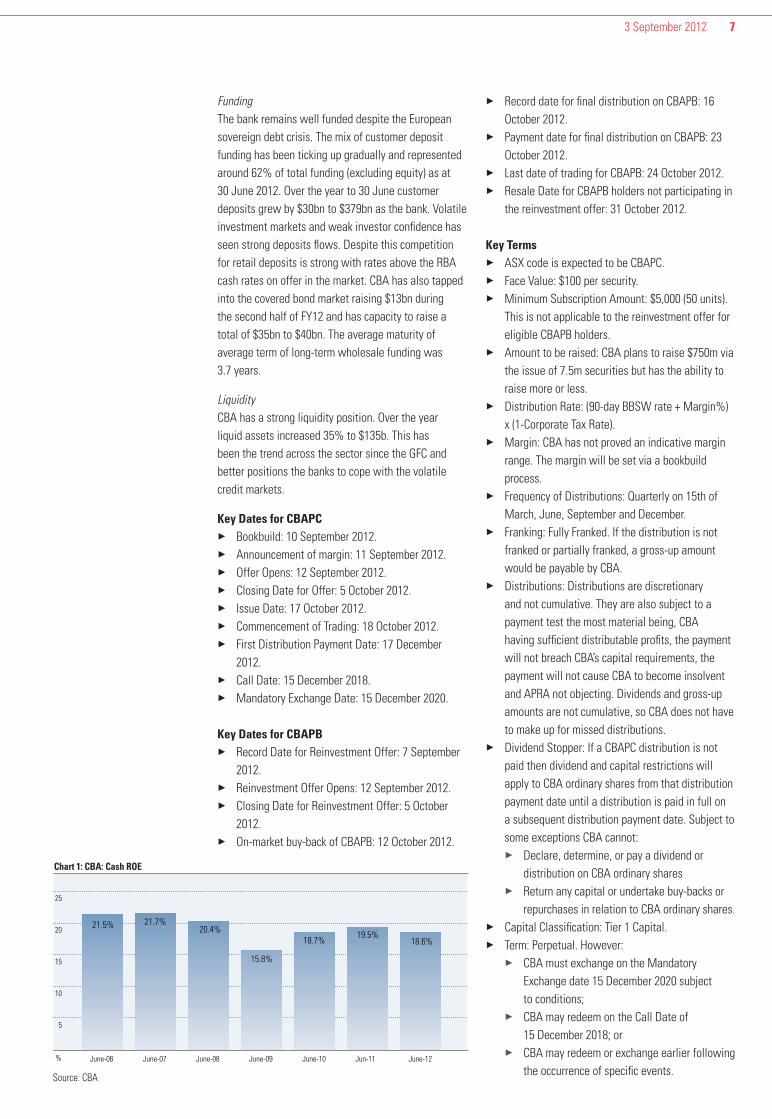
CapitalCBA has a strong capital position well above APRA and Board minimum requirements, even allowing for the soon to start tougher Basel III regulatory changes. The downside of increasing capital levels is pressure on ROE’s and we saw CBA’s sector leading ROE suffer from a 90bp fall to 18.6%. High absolute profitability, moderate loan growth and DRP take- up combine to boost capital levels enabling an increase in the dividend payout from 73% to 75%.
On a Basell II basis CBA’s Common Equity Tier 1 ratio was 7.82%. On a draft Basel III basis CBA's Common
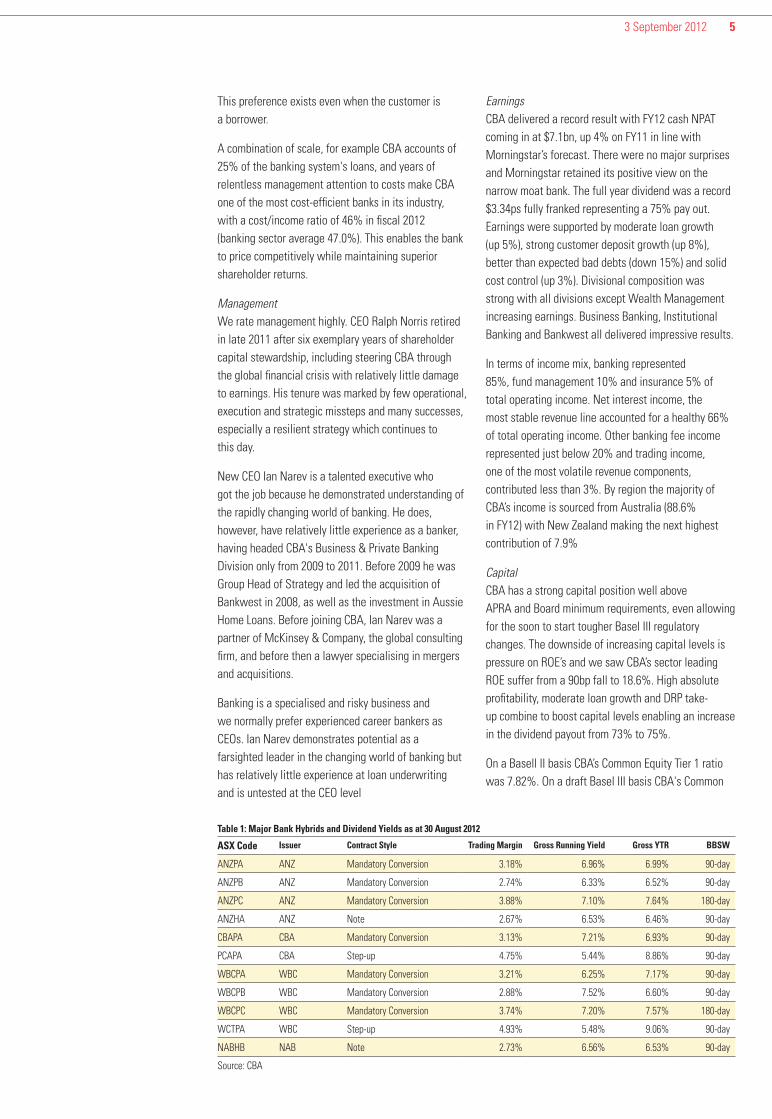
ASX Code Issuer Contract Style Trading Margin Gross Running Yield Gross YTR BBSW
ANZPA ANZ Mandatory Conversion 3.18% 6.96% 6.99% 90-day
ANZPB ANZ Mandatory Conversion 2.74% 6.33% 6.52% 90-day
ANZPC ANZ Mandatory Conversion 3.88% 7.10% 7.64% 180-day
ANZHA ANZ Note 2.67% 6.53% 6.46% 90-day
CBAPA CBA Mandatory Conversion 3.13% 7.21% 6.93% 90-day
PCAPA CBA Step-up 4.75% 5.44% 8.86% 90-day
WBCPA WBC Mandatory Conversion 3.21% 6.25% 7.17% 90-day
WBCPB WBC Mandatory Conversion 2.88% 7.52% 6.60% 90-day
WBCPC WBC Mandatory Conversion 3.74% 7.20% 7.57% 180-day
WCTPA WBC Step-up 4.93% 5.48% 9.06% 90-day
NABHB NAB Note 2.73% 6.56% 6.53% 90-day
Source: CBA
Table 1: Major Bank Hybrids and Dividend Yields as at 30 August 2012
3 September 2012 6
Equity ratio was 7.5% as at 30 June 2012, up from 7.3% as at 30 June 2011 and above the minimum requirement of 4.5% effective 1 January 2013. An additional buffer of 2.5% comes into effect on 1 January 2016, bringing the minimum requirement to 7.0%. APRA has not yet finalised the revised calculation but is proposing to adopt stricter rules than global standards. On a Basel III fully harmonised global basis, as at 30 June 2012 CBA estimates the ratio would have been 9.8%, above the CBA’s Board target of 9.0%. CBA is well positioned to meet the new requirements.
All deposit taking institutions such as CBA are regulated by APRA, the prudential regulator, and one of the requirements is to hold certain levels of regulatory capital to protect deposit holders from losses. The most equity like or most loss absorbing type of regulatory capital is Common Equity which includes ordinary equity, retained earnings and certain other items. The next layer of regulatory capital is Tier 1 capital, which is Common Equity plus certain other securities such as CBAPC. Total comprises Tier 1 capital plus certain other securities. Under Basell II principles, banks are required to hold a minimum amount of Tier 1 and Total capital, Under the tougher Basel III principles effective 1 January 2013
banks are also required to hold a minimum amount of
Common Equity.
Assets
CBA is Australia’s largest home lender. Home
loans and total loans made up 52% and 79% of the
balance sheet as at 30 June 2012. Trading securities
and other fair value assets comprised 12%. Credit
exposures by region is heavily skewed towards
Australia. Australia represents 79.7% of gross credit
exposures, with New Zealand accounting for
8.1%. The remaining exposures are small; Europe
(5.2%), Americas (4.5%) and Asia (2.4%).
Asset quality is sound. CBA’s bad debt expense to
total loans is sector leading at a low 21bps with a
$1.1bn bad debt charge in FY12. The $202m decline in
the economic overlay provision assisted the bad
debt performance and the remaining provision stands
at $847m at June 2012. Lower than expected home
loan arrears dispel concerns of an impending blow-out
in bad debts. CBA again demonstrated the strength
of its $350bn mortgage book and at this stage there
are no material signs of mortgage stress for Australia’s
biggest mortgage lender. Mortgage quality indictors
continue to improve.
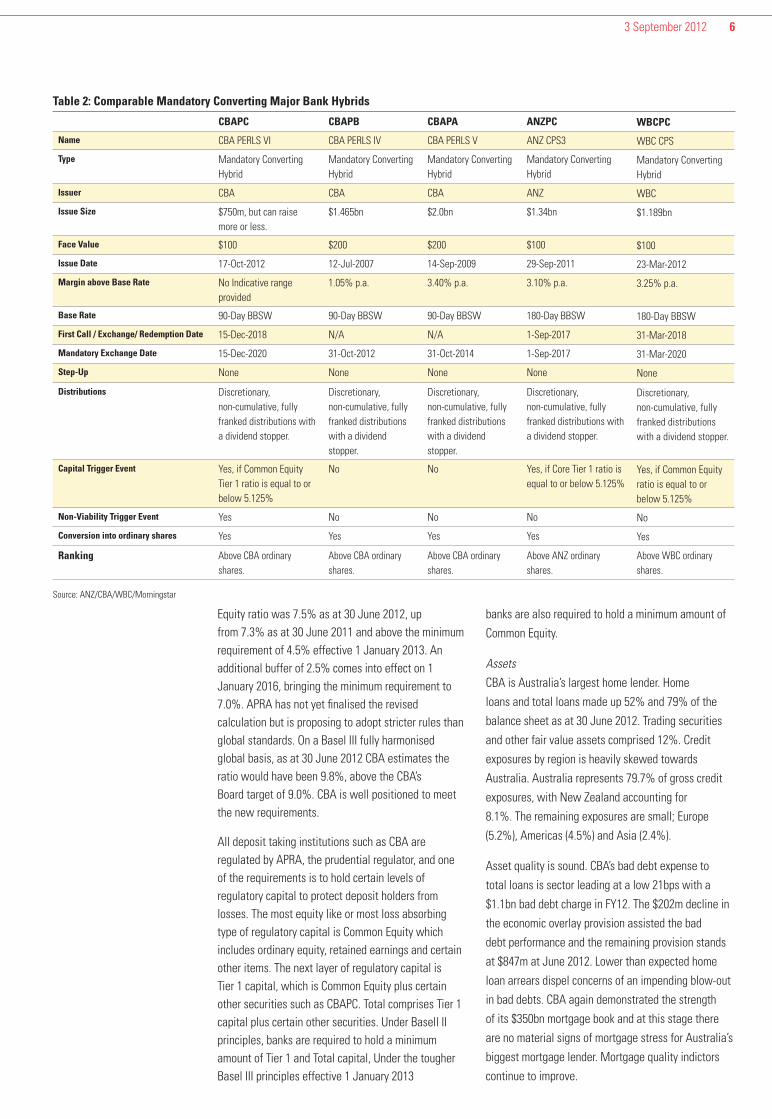
CBAPC CBAPB CBAPA ANZPC WBCPC
Name CBA PERLS VI CBA PERLS IV CBA PERLS V ANZ CPS3 WBC CPS
Type Mandatory Converting Hybrid
Mandatory Converting Hybrid
Mandatory Converting Hybrid
Mandatory Converting Hybrid
Mandatory Converting Hybrid
Issuer CBA CBA CBA ANZ WBC
Issue Size $750m, but can raise more or less.
$1.465bn $2.0bn $1.34bn $1.189bn
Face Value $100 $200 $200 $100 $100
Issue Date 17-Oct-2012 12-Jul-2007 14-Sep-2009 29-Sep-2011 23-Mar-2012
Margin above Base Rate No Indicative range provided
1.05% p.a. 3.40% p.a. 3.10% p.a. 3.25% p.a.
Base Rate 90-Day BBSW 90-Day BBSW 90-Day BBSW 180-Day BBSW 180-Day BBSW
First Call / Exchange/ Redemption Date 15-Dec-2018 N/A N/A 1-Sep-2017 31-Mar-2018
Mandatory Exchange Date 15-Dec-2020 31-Oct-2012 31-Oct-2014 1-Sep-2017 31-Mar-2020
Step-Up None None None None None
Distributions Discretionary, non-cumulative, fully franked distributions with a dividend stopper.
Discretionary, non-cumulative, fully franked distributions with a dividend stopper.
Discretionary, non-cumulative, fully franked distributions with a dividend stopper.
Discretionary, non-cumulative, fully franked distributions with a dividend stopper.
Discretionary, non-cumulative, fully franked distributions with a dividend stopper.
Capital Trigger Event Yes, if Common Equity Tier 1 ratio is equal to or below 5.125%
No No Yes, if Core Tier 1 ratio is equal to or below 5.125%
Yes, if Common Equity ratio is equal to or below 5.125%
Non-Viability Trigger Event Yes No No No No
Conversion into ordinary shares Yes Yes Yes Yes Yes
Ranking Above CBA ordinary shares.
Above CBA ordinary shares.
Above CBA ordinary shares.
Above ANZ ordinary shares.
Above WBC ordinary shares.
Table 2: Comparable Mandatory Converting Major Bank Hybrids
Source: ANZ/CBA/WBC/Morningstar
3 September 2012 7
33 Record date for final distribution on CBAPB: 16 October 2012.33 Payment date for final distribution on CBAPB: 23
October 2012.33 Last date of trading for CBAPB: 24 October 2012.33 Resale Date for CBAPB holders not participating in
the reinvestment offer: 31 October 2012.
Key Terms33 ASX code is expected to be CBAPC.33 Face Value: $100 per security.33 Minimum Subscription Amount: $5,000 (50 units).
This is not applicable to the reinvestment offer for eligible CBAPB holders.33 Amount to be raised: CBA plans to raise $750m via
the issue of 7.5m securities but has the ability to raise more or less.33 Distribution Rate: (90-day BBSW rate + Margin%)
x (1-Corporate Tax Rate).33 Margin: CBA has not proved an indicative margin
range. The margin will be set via a bookbuild process.33 Frequency of Distributions: Quarterly on 15th of
March, June, September and December.33 Franking: Fully Franked. If the distribution is not
franked or partially franked, a gross-up amount would be payable by CBA.33 Distributions: Distributions are discretionary
and not cumulative. They are also subject to a payment test the most material being, CBA having sufficient distributable profits, the payment will not breach CBA’s capital requirements, the payment will not cause CBA to become insolvent and APRA not objecting. Dividends and gross-up amounts are not cumulative, so CBA does not have to make up for missed distributions.33 Dividend Stopper: If a CBAPC distribution is not
paid then dividend and capital restrictions will apply to CBA ordinary shares from that distribution payment date until a distribution is paid in full on a subsequent distribution payment date. Subject to some exceptions CBA cannot:33 Declare, determine, or pay a dividend or
distribution on CBA ordinary shares33 Return any capital or undertake buy-backs or
repurchases in relation to CBA ordinary shares.33 Capital Classification: Tier 1 Capital.33 Term: Perpetual. However:33 CBA must exchange on the Mandatory
Exchange date 15 December 2020 subject to conditions;33 CBA may redeem on the Call Date of
15 December 2018; or33 CBA may redeem or exchange earlier following
the occurrence of specific events.
FundingThe bank remains well funded despite the European sovereign debt crisis. The mix of customer deposit funding has been ticking up gradually and represented around 62% of total funding (excluding equity) as at 30 June 2012. Over the year to 30 June customer deposits grew by $30bn to $379bn as the bank. Volatile investment markets and weak investor confidence has seen strong deposits flows. Despite this competition for retail deposits is strong with rates above the RBA cash rates on offer in the market. CBA has also tapped into the covered bond market raising $13bn during the second half of FY12 and has capacity to raise a total of $35bn to $40bn. The average maturity of average term of long-term wholesale funding was 3.7 years.
LiquidityCBA has a strong liquidity position. Over the year liquid assets increased 35% to $135b. This has been the trend across the sector since the GFC and better positions the banks to cope with the volatile credit markets.
Key Dates for CBAPC33 Bookbuild: 10 September 2012.33 Announcement of margin: 11 September 2012.33 Offer Opens: 12 September 2012.33 Closing Date for Offer: 5 October 2012.33 Issue Date: 17 October 2012.33 Commencement of Trading: 18 October 2012.33 First Distribution Payment Date: 17 December
2012.33 Call Date: 15 December 2018.33 Mandatory Exchange Date: 15 December 2020.
Key Dates for CBAPB33 Record Date for Reinvestment Offer: 7 September
2012.33 Reinvestment Offer Opens: 12 September 2012.33 Closing Date for Reinvestment Offer: 5 October
2012.33 On-market buy-back of CBAPB: 12 October 2012.
% June-06 June-07 June-08 June-09 June-10 Jun-11 June-12
5
10
15
20
25
21.5% 21.7%20.4%
15.8%
18.7%19.5%
18.6%
Source: CBA
Chart 1: CBA: Cash ROE

3 September 2012 8
33 Mandatory Exchange: On 15 December 2020, CBAPC will be:33 Exchanged into a variable number of CBA
ordinary shares worth approximately $101.01 at a 1% discount to the VWAP of CBA ordinary shares 20 business days before the Mandatory Exchange Date. This is subject to conversion conditions or unless they are exchanged or redeemed earlier due to various specific trigger events or redeemed at the Call Date. If the conditions are not satisfied, then exchange will be deferred until the next distribution payment date after 15 December 2020 that the conditions are met. There is no resale or redemption for cash on the Mandatory Exchange Date.
33 The Mandatory Exchange Conditions are:33 First Condition: The VWAP of CBA ordinary
shares on the 25th business day before (but not including) the Mandatory Exchange Date (15 December 2020) is equal to or greater than 56% of the Issue Date VWAP of CBA ordinary shares.33 Second Condition: The VWAP of CBA
ordinary shares during the 20 business days before (but not including) a possible Mandatory Exchange Date is equal to or greater than 50.51% of the Issue Date VWAP of CBA ordinary shares.33 Third Condition: CBA ordinary shares are
listed or admitted to trade on the ASX. The intent of these conditions is to protect CBAPC holders from the maximum number of shares on exchange condition i.e. protect them from receiving CBA ordinary shares worth less than $101.01.
33 Early Exchange following trigger events: CBA must exchange CBAPC into CBA ordinary shares following the occurrence of a Capital Trigger Event, Non-Viability Trigger Event or Change of Control Event.33 A Capital Trigger Event occurs if CBA
determines or APRA notifies CBA that either or both CBA’s Level 1 Common Equity Tier 1 Capital Ratio or Level 2 Common Equity Tier 1 Capital Ratio is equal to or less than 5.125%, then CBA is required to immediately exchange such number of CBAPC securities that is sufficient to return the Common Equity Tier 1 ratio to above 5.125%. Exchange following this event is not subject to Mandatory Exchange conditions being satisfied. Therefore, a Maximum Exchange Number of
Chart 5: CBA: Provision Coverage
Total Provisions as % of Credit Risk Weighted Assets (LHS) Specific Provisions as % of Gross Impaired Assets (RHS)
Source: CBA
Source: CBA
Source: CBA
Review of Bankwest Pre acquisition business book
Flood and earthquake related overaly
% June-07 June-08 June-09 June-10 Jun-11 June-12
5
10
2.4%2.4%
4.5%5.0%
2.1%
5.6%
2.1%
6.6%
2.3%
7.5%
7.3%
2.3%
bps Jun-08 Dec-08 Jun-09 Dec-09 Jun-10 Dec-10 Jun-11 Dec-11 Jun-12Proforma Proforma Proforma Proforma
20
40
60
80
100
32
85
5561
28 24
40
28
21 2022
bps
20
40
60
80
100
120
86
96102 102 102
8883
Jun-09 Dec-09 Jun-10 Dec-10 Jun-11 Dec-11 Jun-12
36%
38%
40%
42%
44%
46%
0.5
1.0
1.5
2.0
2.5
Dec-09 Jun-10 Dec-10 Jun-11 Dec-11 Jun-12Times
Chart 4: CBA: Gross Impaireds to Gross Loans
Source: CBA
Chart 3: CBA: Impairment Expense to Gross Loans
Chart 2: CBA: Basel III Common Equity Capital Ratio
Common Equity-Basel III APRA basist Total Common Equity-Basel III on an International basis
3 September 2012 9
shares on exchange will apply i.e. calculated using 20% of the Issue Date VWAP. For example, if the Issue date VWAP of CBA ordinary shares was $54.00, the Maximum Exchange Number of Shares will equal 9.25926 ($100/($54.00x20%)). So, if the CBA share price on conversion was $5.00, then CBAPC securityholders would receive CBA shares worth approximately $46.30 (9.25926x$5.00) for each security. This means CBAPC securityholders could potentially receive CBA ordinary shares worth less than $100. In this example the CBA share price on conversion would need to be less than $10.80 for CBAPC securityholders to receive CBA ordinary shares worth less than $100. 33 A Non-Viability Trigger Event occurs if APRA
notifies CBA that it believes: that exchange of some or all CBAPC (or some action in relation to other CBA capital instruments) is required because without it CBA would become non-viable; or a public sector injection of capital is required because without it CBA would become non-viable. Following such an event CBA must immediately exchange such number of CBAPC securities that is specified by APRA or necessary to satisfy APRA that CBA will no longer be non-viable. Exchange following this event is not subject to Mandatory Exchange conditions being satisfied. Similar to exchange following a Capital Trigger Event, CBAPC securityholders could potentially receive CBA ordinary shares worth less than $100.
33 Non-viability is a relatively new type of trigger event and occurs at the discretion of APRA.
% Jun-11 June-12
61% 62%
19% 18%
4% 4%
13% 12% 2% 2% 1%
1% 1%
10
20
30
40
50
60
70
80
90
100
%
54
55
56
57
58
59
60
61
62
63
Jun-09 Dec-09 Jun-10 Dec-10 Jun-11 Dec-11 Jun-12
56% 56%
58%
60%
61%
62% 62%
$bn Jun-11Jun-10 June-12
19 31 44
26 30
33 41
40
58 86
101
135
50
100
150
Actual Morningstar Analyst Forecasts
FY10 FY11 FY12 FY13 FY14 FY15F
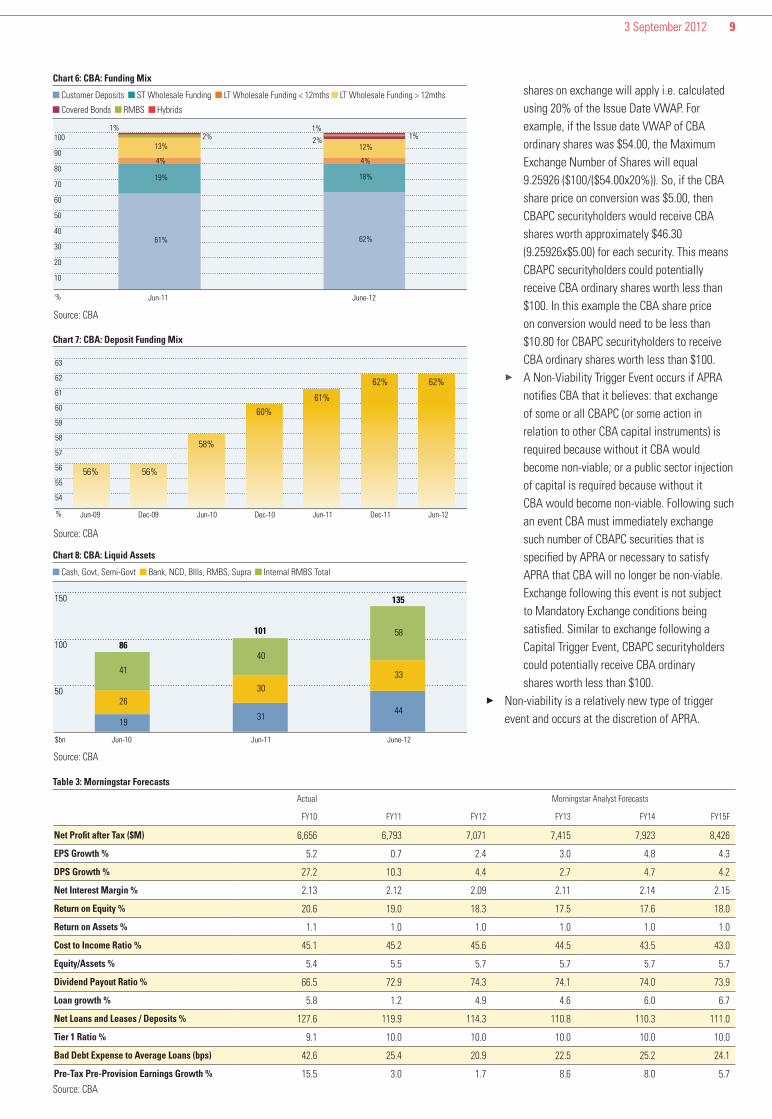
Net Profit after Tax ($M) 6,656 6,793 7,071 7,415 7,923 8,426
EPS Growth % 5.2 0.7 2.4 3.0 4.8 4.3
DPS Growth % 27.2 10.3 4.4 2.7 4.7 4.2
Net Interest Margin % 2.13 2.12 2.09 2.11 2.14 2.15
Return on Equity % 20.6 19.0 18.3 17.5 17.6 18.0
Return on Assets % 1.1 1.0 1.0 1.0 1.0 1.0
Cost to Income Ratio % 45.1 45.2 45.6 44.5 43.5 43.0
Equity/Assets % 5.4 5.5 5.7 5.7 5.7 5.7
Dividend Payout Ratio % 66.5 72.9 74.3 74.1 74.0 73.9
Loan growth % 5.8 1.2 4.9 4.6 6.0 6.7
Net Loans and Leases / Deposits % 127.6 119.9 114.3 110.8 110.3 111.0
Tier 1 Ratio % 9.1 10.0 10.0 10.0 10.0 10.0
Bad Debt Expense to Average Loans (bps) 42.6 25.4 20.9 22.5 25.2 24.1
Pre-Tax Pre-Provision Earnings Growth % 15.5 3.0 1.7 8.6 8.0 5.7Source: CBA
Source: CBA
Source: CBA
Table 3: Morningstar Forecasts
Chart 8: CBA: Liquid Assets
Cash, Govt, Semi-Govt Bank, NCD, BIlls, RMBS, Supra Internal RMBS Total
Chart 7: CBA: Deposit Funding Mix
Chart 6: CBA: Funding Mix
Customer Deposits ST Wholesale Funding LT Wholesale Funding < 12mths LT Wholesale Funding > 12mths
Covered Bonds RMBS Hybrids
Source: CBA
3 September 2012 10
The prospectus states that circumstances where APRA may exercise its discretion may not be limited to its concerns about the bank’s capital levels, but could extend to concerns about the bank’s funding and liquidity. 33 A Change of Control Event occurs if a takeover
bid for CBA ordinary shares is made and certain conditions are satisfied or a scheme of arrangement is proposed and certain conditions are satisfied. Exchange following this event is subject to the second and third Mandatory Exchange Conditions being satisfied. This means CBAPC securityholders are protected from receiving CBA ordinary shares worth less than $101.01 (which represents $100 face value converted at 1% discount).
33 Early Redemption: CBA can redeem CBAPC early for cash at face value for tax or regulatory reasons subject to approval by APRA.33 A tax reason occurs if as a result of a change
in law or change in application or interpretation of law CBA is unable to fully frank distributions on CBAPC; or if CBA receives opinion that there is a material risk that it would face a material adverse tax consequence in relation to CBAPC. These exclude changes or consequences already expected by CBA at the issue date.33 A regulatory reason occurs if CBAPC no longer
qualifies as Tier 1 capital other than as a result of a change already expected by CBA at the issue date.
33 Call Date: On the Call date (15 December 2018) CBA can exercise its call and redeem PERLS VI for cash (subject to APRA approval) or elect that resale occur such that a third party purchases the PERLS VI for cash.33 Ranking in wind-up: CBAPC rank ahead of junior
ranking securities (such as CBA ordinary shares), equally with equal ranking capital securities (such as PERLS V (CBAPA), behind senior ranking obligations (such as CBA Retail Bonds (CBAHA) and deposits), liabilities preferred by law (such as employee entitlements and secured debt (covered bonds).33 CBAPC holders have no right to request early
exchange or redemption.
We have only presented a summary of the material terms. Investors should examine the prospectus in detail.
Options available for CBAPB security holdersWhat are the options available to CBAPB security holders?
1. Participate in the Reinvestment Offer. Via this offer CBAPB holders can sell all or part of their holdings through the on-market buy-back facility for face value ($200) and automatically reinvest in CBAPC. This offer is only available to CBAPB holders who are registered holders on the record date of 7 September 2012 with a registered address in Australia. Applications received under this offer will be given priority allocation.
2. Sell on market. CBAPB holders can sell on market for cash by the last trading date which is expected to be 24 October 2012.
3. Hold on for resale. This is effectively a redemption for cash at face value ($200) with all remaining CBAPB securities being automatically acquired by the resale broker.
Final Distribution for CBAPB security holders1. For CBAPB holders participating in the reinvestment
offer, the final distribution will paid on 23 October 2012, for period up to and including 16 October 2012.
2. For CBAPB holders that don’t participate in the reinvestment offer and don’t sell on market after the ex-distribution date, the final distribution will paid on 23 October 2012, for relevant period up to and including 16 October 2012. If they continue to hold CBAPB until 31 October 2012, they will be paid a distribution for the relevant period up to and including 30 October 2012.

Limited Financial Services Guide Morningstar Australasia Pty Limited (‘Morningstar’) ABN: 95 090 665 544, AFSL: 240 892 (a subsidiary of Morningstar, Inc.) of Level 36 Australia Square, 264 George Street Sydney NSW 2000 is the provider of the general advice ('the service') provided in this report. The service is provided through research including the profiling and rating of companies and the securities they issue. Morningstar does not receive commissions for the service and does not charge companies to be rated. Morningstar is remunerated for the service by subscribers paying a subscription fee. This fee is variable depending on the individual subscriber's specific requirements. Morningstar has no debt or equity relationship with any issuers of any securities. Morningstar may provide a licence for the use and distribution of the service to issuers of securities which are the subject of a research report. Morningstar representatives are remunerated by salary and do not directly receive any commissions or fees. They may be eligible for an annual performance payment which is discretionary and based on reaching agreed performance levels. Please refer to our Financial Services Guide (FSG) for more information www.morningstar.com.au/fsg.asp. Listed corporate income securities Morningstar covers around 30 listed income securities. Our methodology is forward looking, based on our expectations of future cash flows. Analysis is carried out by our income securities team, which is a subset of the equities research team and thereby utilising the equity analysts’ expert knowledge and cash flow models of the underlying businesses.
The focus of Morningstar’s analysis is to assess the degree to which the underlying business is capable of supporting the commitments required by the securities. We analyse the following factors to place the security in one of the security risk categories of: Excellent, Investment Grade, Speculative or Distressed:
33 Business Risk – comprising an assessment of whether there is an economic moat (presence of sustainable competitive advantages), the strength of management and how uncertain future cash flows are; and33 Financial Risk – based on testing the company under a
series of leverage and cash low ratios.
We then calculate the yield that is justified by the risk of the security based on a transition model which identifies a range of credit spreads, primarily based on historic default rates. We add a spread to account for transaction costs associated with illiquidity, and small additional spreads to represent the inconvenience or risks associated with non-cumulative dividends or the security being a perpetual.
Listed Income Securities coverage criteriaCoverage of around 30 listed income securities is based on client demand, determined on a set of guidelines, which include issue size being at least AUD 200 million, the underlying corporate or its listed parent being covered by Morningstar’s equity research team, Morningstar’s judgement of the investment merit of the security and the strength of existing and likely demand from our retail investor, broker, financial adviser, and institutional clients.
Timing and frequency of income security research reports
33 Pre-IPO research reports on securities that meet the coverage criteria are published in the first week after the launch of the issue.33 Ongoing research reports are updated at least six
monthly or sooner in the case of a major event.33 Income Securities Monthly reports provide a roundup of
current pricing and recommendations and an outlook for the market.33 An archive of income securities research reports is
available on Morningstar’s Adviser Research Centre platform and Morningstar’s retail investor website.
Research report contentIncome securities research reports contain detailed issuer analysis and an investment recommendation on the security. Reports contain the following content:
33 Recommendations – Subscribe/Don’t Subscribe for IPO reports. Buy, Accumulate, Hold, Reduce, Sell or Avoid once security is trading.33 Investment Rating – overview of the risk and
investment appeal of the security33 Analyst Note – analysis of a key event and implications
on the investment appeal of the security33 Thesis – analysis of the business risk and financial risk
of the underlying business33 Contract Summary – description of the specific
characteristics of the security33 Security Valuation – key inputs to the valuation of the
security33 Risks – analysis of potential risks to the underlying
business and security33 Investment Perspective of underlying business –
Investment Rating, Risk, Growth, Profitability and Financial Health of the underlying company33 Forecasts and key ratios of the underlying business33 Note: Morningstar Australasia does not provide credit
ratings.
Morningstar’s income securities analysis builds on the modelling expertise of the equities research team, including:
33 At least five years of detailed pro-forma financial statements33 Extensive analysis of free cashflow and return on
invested capital33 Uncertainty and scenario analysis, including upside and
downside cases33 Forecasts of leverage, coverage and liquidity ratios33 Estimates of off-balance sheet liabilities
Economic MoatsJust as moats protected castles from invaders in medieval times, businesses with economic moats have strong defences against their profits being competed away. We ascribe a moat rating to each stock researched: Wide, Narrow or None. The moat is the competitive advantage that one company has over other companies in the same industry. Moat firms have unique skills or assets, allowing them to stay ahead of the competition and earn above-average profits for many years. Returns on their invested capital will exceed the cost of that capital. Without a moat, highly profitable firms can have their profits competed away as
other companies see how attractive the market is and try to move in to reap some of the rewards themselves.
Across our research, we have discovered five economic moat sources: Intangible assets, switching costs, network effects, cost advantage and efficient scale. Intangible assets include strong brands which encourage repeat sales and support price rises over time. Intellectual property rights like patents, trademarks, copyrights and government approvals are other intangible assets that can lead to moats. Switching costs make it too expensive or time-consuming to shift to an alternative supplier. The network effect is a virtuous cycle allowing strong companies to get even stronger. It occurs when the value of a particular good or service grows as the number of users grows. Cost advantage can derive from increased scale and efficiency, allowing the company to increase margins. Efficient scale occurs when a limited market is effectively served by existing players and the profit opportunity does not justify entry by others.
Business RiskBusiness risk captures the fundamental uncertainty around a firm’s business operations and the cash flow generated by those operations. The following factors are key to determining business risk:
33 diversity of revenue sources – a company with diverse revenue stream should have more reliable revenues as weakness in one area may be offset by strength in others. 33 cyclicality of revenues – for example revenues
of a housing products supplier will be tied to cyclical property demand cycles and will be more volatile than a supermarket retailer which should have more ongoing demand.33 the firm’s fixed-cost structure – companies with high
levels of fixed costs will have greater swings in earnings as revenues move up and down.33 financial leverage – companies with
excessive debt levels may run in to troubles should conditions deteriorate, potentially causing unwanted asset sales, dilutive equities issues or even bankruptcy.33 contingent events – examples include outstanding
litigation, risk of aggressive acquisitions at high prices, asbestos liabilities etc.
DeclarationDeclaration of personal shareholdings, disclosure list. These positions can change at any time and are not additional recommendations
AAO,ABC,ACG,ACL,ACR,AFI,AGK,AGS,AGX,AKF,ALL,ALS,AMP,ANO,ANP,ANZ,APA,APN,ARD,ARG,ASB,ASZ,ATI,AVX,BEN,BFG,BHP,BKI,BKN,BLY,BND,BNO,BOL,BOQ,BSL,BTU,BWP,BXB,CAB,CBA,CCL,CDD,CGS,CIF,CND,COF,COH,CPA,CRK,CRZ,CSL,CSS,CTN,DOW,DTE,DUE,EGP,EPX,EQT,ERA,ESV,EVZ,FMG,FXJ,GBG,GFF,GMG,GPT,GWA,HIL,HSN,IAG,IFL,IGR,IIN,ILU,IPD,JMB,KAR,KCN,KEY,KMD,LEG,LEI,LLC,MBN,MCR,MFF,MIO,MPO,MQG,MSB,MTS,MUN,MYR,NAB,NEU,NHC,NMS,NUF,NUP,NVT,NWS,OSH,PBG,PBT,PGM,PMV,PNR,PPT,PRG,PRY,PTS,QBE,QFX,QUB,RCR,REX,RFE,RHC,RHG,RIO,RKN,RQL,SAKHA,SEK,SFW,SGP,SGT,SHV,SMX,SOL,SRH,SRX,STS,SUN,SVW,SWM,TAH,TCL,TEN,TLS,TOL,TPM,TRF,TRS,TSE,UGL,UXC,WAL,WAM,WBB,WBC,WCB,WDC,WES,WHC,WHG,WOW,WPL, ZGL,
Disclosure and Research MethodologyPage 11 of 11 | Investment Detail | Print date 9 September 2012