Embed Size (px)
Citation preview

ATTACHMENT B TRIP GENERATION CHARACTERISTICS

Philip Habib & Associates
Engineers and Planners • 226 West 26th Street • New York, NY 10001 • 212 929 5656 • 212 929 5605 (fax)
1
M E M O R A N D U M
To: Project Files
From: PHA
Project: Brooklyn Bridge Park (PHA #0324)
Re: Brooklyn Bridge Park - General Park Trip Generation Characteristics
Date: March 21, 2005
1. Introduction and Summary
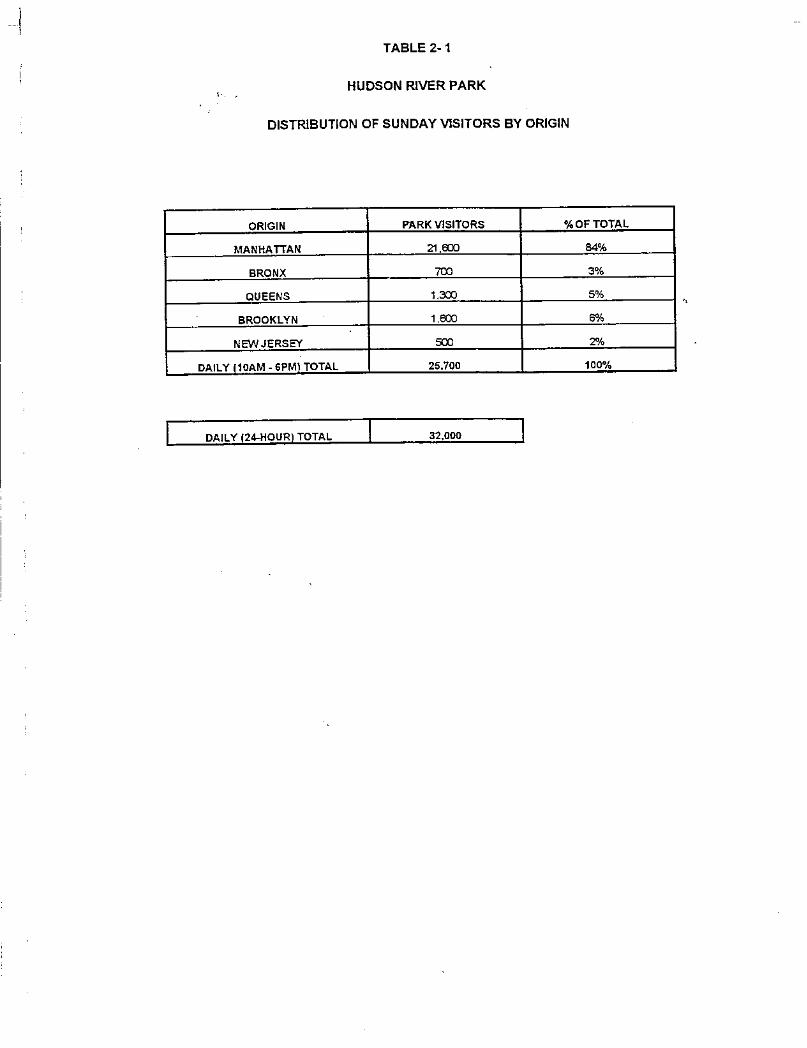
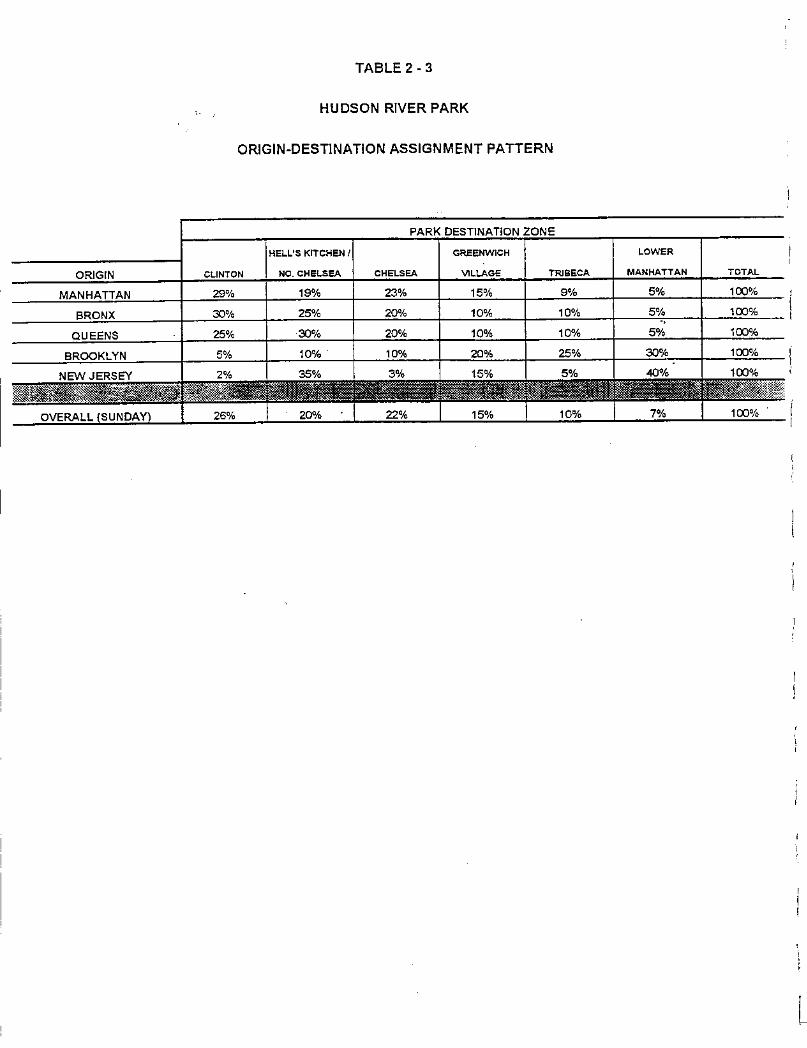
The following memorandum describes the forecast methodology for the active and passive parkcomponents of the proposed 70-acre Brooklyn Bridge Park. This forecasting was based primarilyon surveys of the Brooklyn Heights Promenade as well as from the Hudson River Park EIS. Theresults of these studies are included in this memorandum. This forecast only considers typicalpark usage and does not consider special park events that may periodically occur, such asconcerts, or a marina, which may generate additional park trips.
As described in the following memorandum, the proposed park is expected to generateapproximately 27,000 trips during a typical summer Sunday and 15,000 trips during a typicalsummer weekday. Brooklyn Heights Promenade park user survey data was utilized to determinethe modal split of park users based on distance to the park. As shown, the number of walk tripsare expected to decrease as the distance from the park increases, while the number of auto tripsare expected to increase as the distance from the park increases. Based on the aggregate modalsplit for park users, approximately 53% of park trips are expected to be walk oriented, 21%auto/taxi oriented, and 26% transit oriented (subway, bus and water taxi trips).
Parking demand was also determined for the park based on the total number of auto tripsgenerated by the park. By assuming that the Brooklyn Bridge Park will have a destinationorientation similar to the Riverbank State Park facility, a 41% parking accumulation rate wasassumed for Brooklyn Bridge Park. With consideration for park staff and maintenance workers,the park would require 233 spaces during summer weekdays and 420 spaces during a summerSunday.
2. Park User Surveys
As part of the Brooklyn Bridge Park data collection effort, selected park user data was collectedat the Brooklyn Heights Promenade Park and at Fulton Ferry Landing. The Promenade and

2
Fulton Ferry Landing locations were chosen due to their proximity to the proposed BrooklynBridge Park and due to the unique features of these existing facilities. Both the Promenade andFulton Ferry Landing have views of the waterfront and the lower Manhattan skyline, which isexpected to be one of the draws to the future Brooklyn Bridge Park. Figure 1 shows the locationsof these facilities and the locations of the user surveys and gate counts. The Promenade usersurvey provides a level of guidance for the expected travel patterns for the proposed BrooklynBridge Park. The Fulton Ferry Landing visitors were not park oriented uses and the data fromthat facility is not used herein. Studies at the Riverbank State Park and North Park in Manhattanshow similar park user characteristics to those found for the Promenade and Fulton Ferry parks.Therefore, the travel patterns for the proposed park are not expected to be radically differentfrom other urban waterfront parks surveyed in Manhattan.
Park user data was collected on Sunday, August 3, 2003 from 12:00 PM to 2:30 PM. Interviewsand gate counts were conducted at the Promenade during this period. Interview questionsfocused on transportation related topics, including: trip origin, mode of transportation, group size(visiting park), household size and number of children. Summer data was collected in order tobetter capture the peak usage characteristics of these parks. Appendix A shows the interviewform that was used in the survey. A total of 256 interviews were collected at the Promenade.Gate counts were collected concurrently with the park interviews in order to identify the totaluser population at the park.
In analyzing the interview data, it was assumed that all members of an interviewed group arrivedfrom the same origin and via the same mode of transportation. Group data was therefore used todetermine expected origin and mode of transportation statistics for the park. Accounting forgroup size, a total of 446 individuals were surveyed at the Promenade.
Gate Counts
In addition to the user surveys that were conducted at the Promenade entrances, gate counts werealso performed. These counts were performed at the locations identified in Figure 1. At thePromenade, 1,226 individuals were counted entering the park during the data collection period.
Trip Origins
Table 1 shows the trip origin characteristics that were collected in the user study at thePromenade. As shown, the vast majority of trips to these facilities are expected to originate inBrooklyn; 71.3% of the surveyed users came from Brooklyn, while 10.8% came from Manhattanand 17.9% came from other regions.
As part of the planning for the future Hudson River Park in Manhattan, similar surveys wereconducted at Riverbank State Park and at North Park in Manhattan. Table 1 also includes theresults of these surveys. As shown in Table 1, the principal origin of each park is its borough,however, the closest neighboring borough (Brooklyn for North Park and the Bronx forRiverbank State Park) also contribute to the user population of these major parks.


3
Table 1:Trip Origin
Origin Promenade1 Riverbank2 North Park2
Brooklyn 71.3% 2% 7%
Manhattan 10.8% 77% 84%
Bronx 0% 15% 1%
Queens 2.5% 5% 3%
Staten Island 0% 0% 0%
New Jersey 2.9% 0% 4%
Other* 12.6% 1% 1%
TOTAL 100% 100% 100%Notes:* Other includes tourist population and visitors from Long Island, Connecticut
and Westchester for Promenade user survey.Source:1. Park User Survey, PHA, 20032. Hudson River Park EIS
Brooklyn Trip Origins
In order to better correlate the expected relationship between park users and proximity to thepark, interviewees who began their trip in Brooklyn were also asked to identify the nearest streetintersection to their trip origin. The corresponding zip code was then determined for eachinterviewee. Figure 2 shows the Brooklyn zip codes in relation to the surveyed parks.
Table 2 shows the breakdown in zip code origins for the surveyed park. The zip codes were thenarranged based on proximity to the surveyed park. As expected from studies of regional parks,the majority of Brooklyn based trips originated within the zip codes closest to the surveyedparks. At the Promenade, 49.8% of the surveyed park users originated within the 11201 zip code,which includes the Promenade facility and is mostly within walking distance. In addition,approximately 8.7% of park users began their trips within the surrounding 11217, 11205 and11231 zip codes (located within 2 miles of the surveyed park). Therefore, approximately 58.5%of the total 70.9% Brooklyn based trips originated within 2 miles of the surveyed park.
Figures 3 and 4 show the percentage of park users based on proximity to the park that werefound at the Riverbank and North Parks, respectively. As shown, the greatest percentage of parkusers was found in those areas closest to these parks. Based on the Promenade survey data, it isexpected that similar user patterns will be present for the Brooklyn Bridge Park.
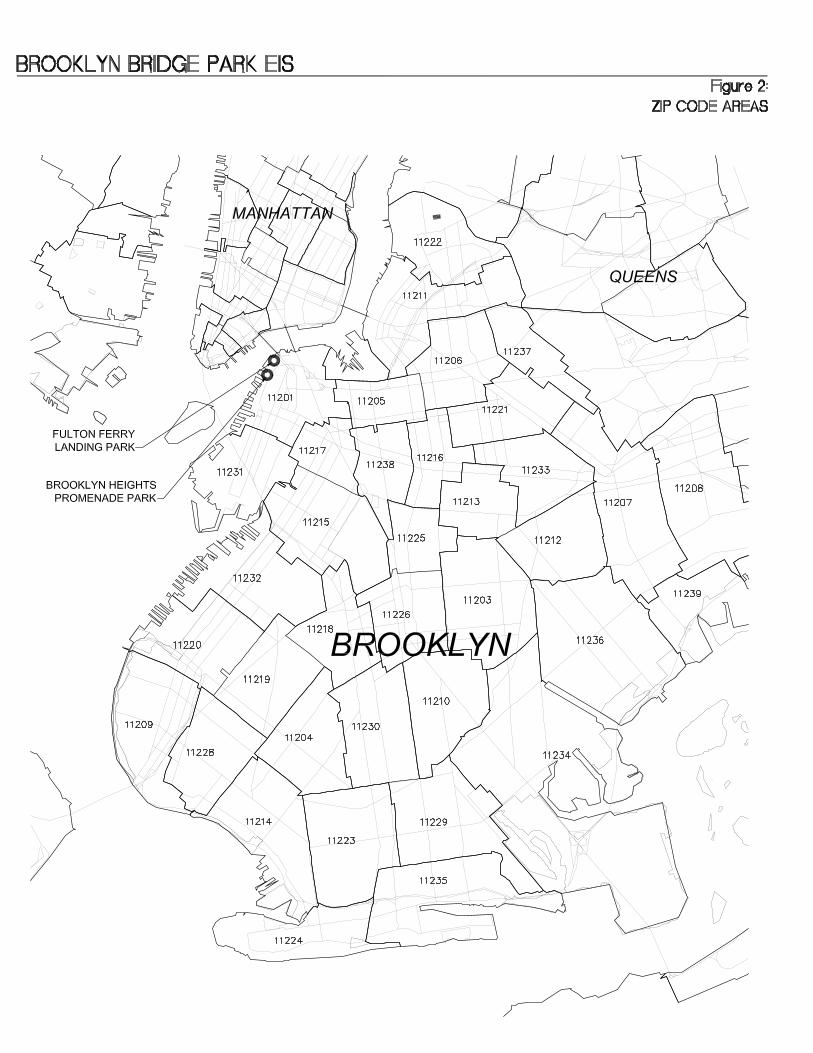

Table 2:Brooklyn Trip Origins
Distance from Zip Code Zip Code to Park (Miles) PROMENADE
11201 0.2 49.8%11217 1.5 2.9%11205 1.7 1.8%11231 1.8 4.0%11238 2.2 0.9%11211 2.4 0.7%11215 2.5 1.3%11216 2.8 0.0%11222 3.1 1.1%11225 3.3 1.3%11221 3.5 0.7%11237 3.6 0.4%11213 3.6 0.9%11220 4.1 0.0%11218 4.1 0.2%11204 5.5 0.2%11230 5.5 1.1%11209 5.6 0.7%11207 5.7 0.0%11208 6.5 0.2%11214 6.8 1.3%11229 7.1 0.2%11239 7.2 0.7%11234 7.4 0.2%
Total 70.9%
SOURCE: BROOKLYN HEIGHTS PROMENADE,
PARK USER SURVEY, PHA, 2003.


4
Modal Split
As part of the user survey, park interviewees were asked about their means of transportation tothe park. This data was broken down into the following categories: walk, run/jog, bike, skate,bus, subway, auto, taxi, and water taxi. Table 3 shows the modal splits for the Promenade, aswell as the Riverbank and North Park facilities.
As shown in Table 3, at the Promenade, 58.8% of interviewees walked/ran/jogged to the park,1.6% biked/skated to the park, 16.0% came by bus/subway/water taxi to the park and 23.5%drove/came by taxi to the park.
Table 3:Mode of Transportation
Origin Promenade1 Riverbank2 North Park2
Walk/Run/Jog 58.8% 50% 39%
Bike 1.4% 4% 3%
Skate 0.2% 1% 6%
Bus 2.7% 11% 2%
Subway 13.3% 8% 17%
Auto 21.5% 24% 23%
Taxi 2.0% 2% 8%
Water Taxi(Ferry)
0.0% 0% 3%
TOTAL 100% 100% 100%
Source:1. Park User Survey, PHA, 20032. Hudson River Park EIS
Modal Split by Distance
Modal split data from the Brooklyn Heights Promenade park user survey was grouped bydistance from the park in order to provide a distribution of modal split consistent with the tripgeneration model, which is discussed in the following sections of the memorandum. Figure 5shows a graph of modal split values based on distance from the proposed park. As shown, thenumber of walk trips are expected to decrease as the distance from the park increases, while thenumber of auto trips are expected to increase as the distance from the park increases. Forexample, at a 1/4 mile distance from the park, 100% of park trips are expected to be walkoriented (including run, bike/skate trips), while at 1-1/2 miles from the park, 54% of park tripsare expected to be walk oriented, 18% auto and 28% transit (bus and subway).

FIG
UR
E 5:
PR
OM
ENA
DE
USE
R S
UR
VEY
DA
TA-M
OD
E SP
LIT
DIS
TRIB
UTI
ON
100%
94%
86%
78%
67%
54%
42%
31%
22%
13%
5%
0%0%
2%5%
8%
12%
17%
22%
24%
23%
18%
12%
8%
0%2%
4%6%
8%11
%14
%17
%20
%
25%
30%
33%
0%2%
5%8%
13%
18%
22%
28%
35%
44%
53%
58%
0%25%
50%
75%
100%
00.
51
1.5
22.
53
3.5
DIS
TAN
CE
TO P
AR
K (M
ILES
)
PERCENT BY MODE (%)
WAL
KBU
SSU
BWAY
AUTO
SOU
RC
E: B
RO
OKL
YN H
EIG
HTS
PR
OM
ENAD
E,PA
RK
USE
R S
UR
VEY,
PH
A, 2
003
5
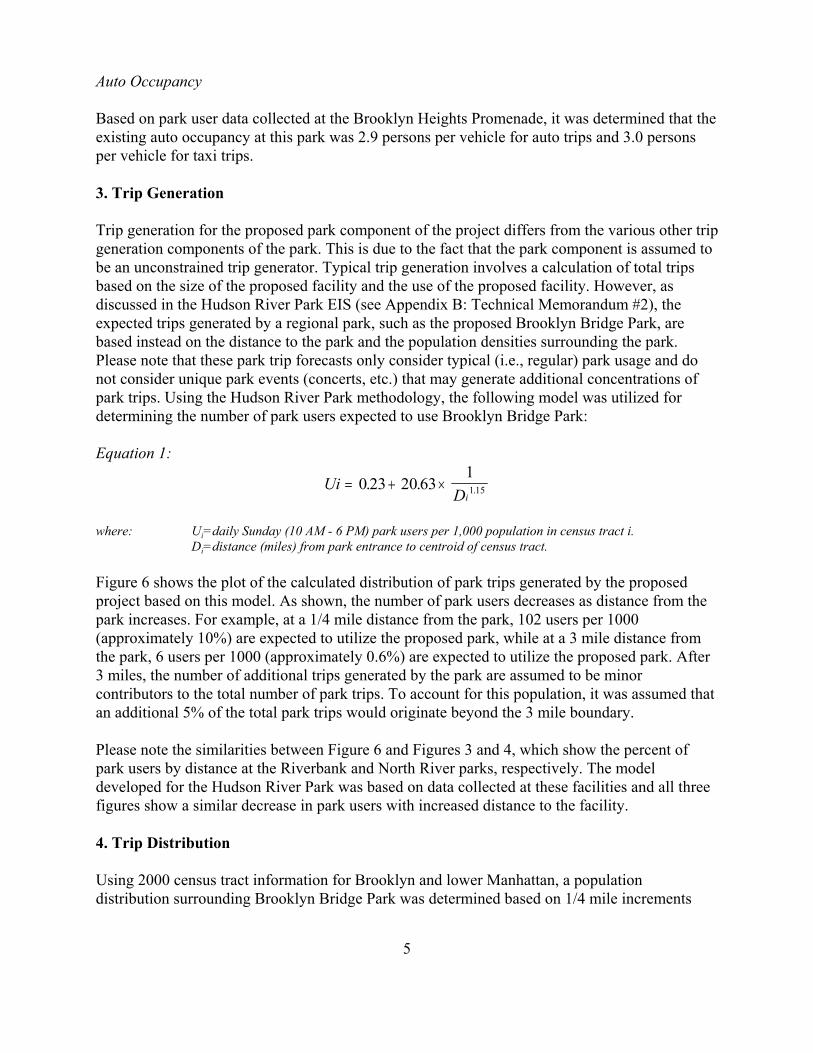
Auto Occupancy
Based on park user data collected at the Brooklyn Heights Promenade, it was determined that theexisting auto occupancy at this park was 2.9 persons per vehicle for auto trips and 3.0 personsper vehicle for taxi trips.
3. Trip Generation
Trip generation for the proposed park component of the project differs from the various other tripgeneration components of the park. This is due to the fact that the park component is assumed tobe an unconstrained trip generator. Typical trip generation involves a calculation of total tripsbased on the size of the proposed facility and the use of the proposed facility. However, asdiscussed in the Hudson River Park EIS (see Appendix B: Technical Memorandum #2), theexpected trips generated by a regional park, such as the proposed Brooklyn Bridge Park, arebased instead on the distance to the park and the population densities surrounding the park.Please note that these park trip forecasts only consider typical (i.e., regular) park usage and donot consider unique park events (concerts, etc.) that may generate additional concentrations ofpark trips. Using the Hudson River Park methodology, the following model was utilized fordetermining the number of park users expected to use Brooklyn Bridge Park:
Equation 1:
UiDi
= + ×0 23 20 6311 15. . .
where: Ui=daily Sunday (10 AM - 6 PM) park users per 1,000 population in census tract i.Di=distance (miles) from park entrance to centroid of census tract.
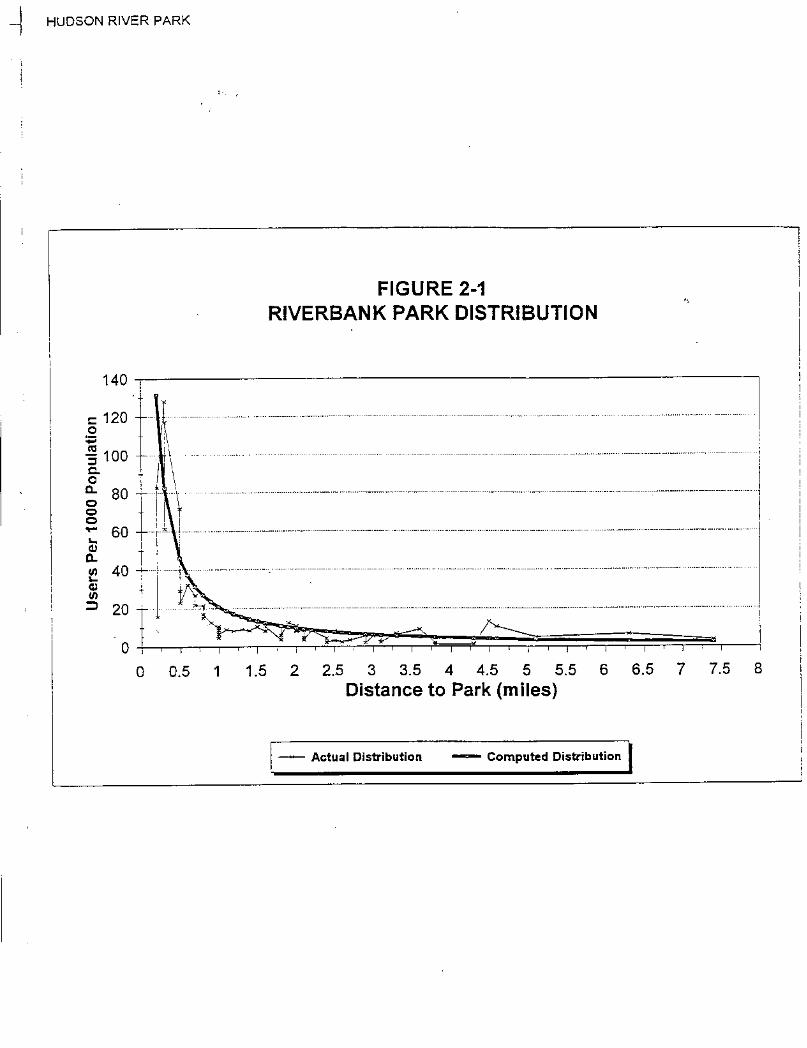
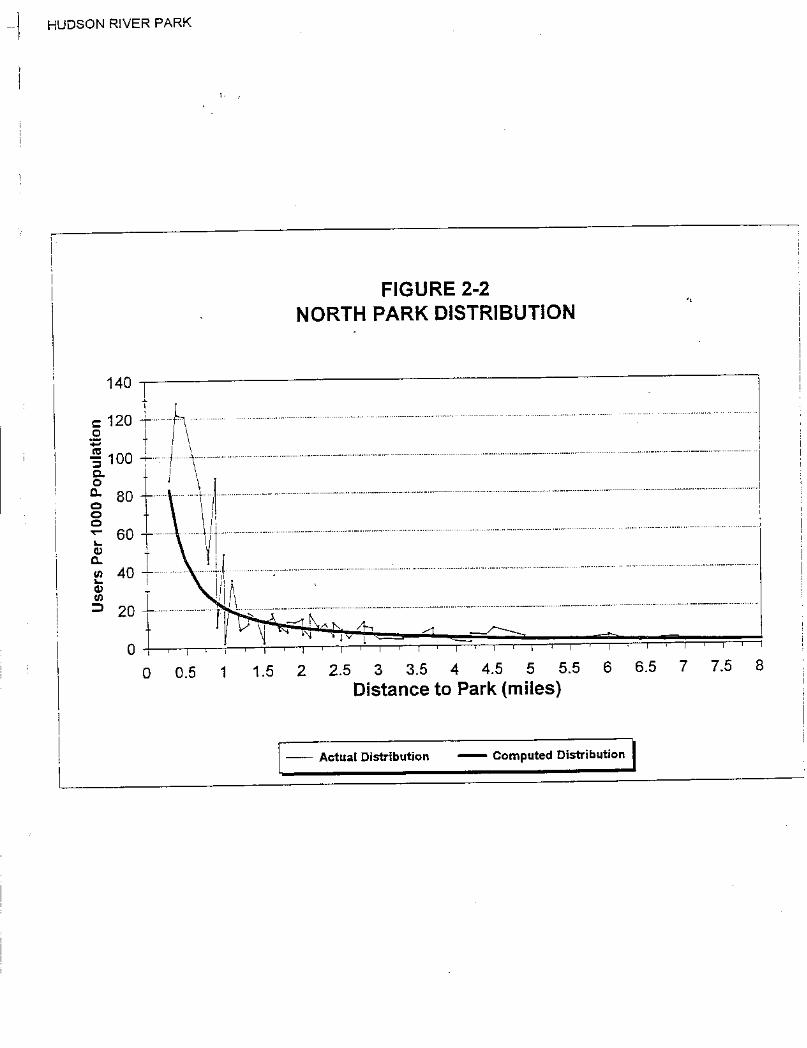
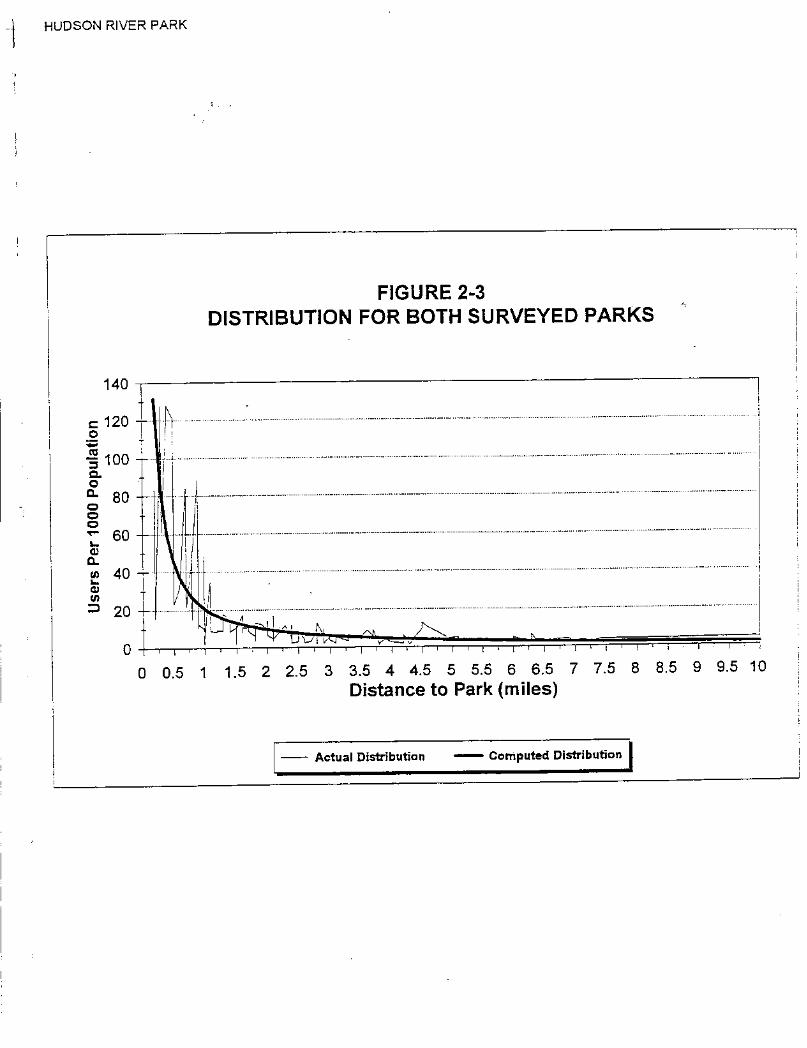
Figure 6 shows the plot of the calculated distribution of park trips generated by the proposedproject based on this model. As shown, the number of park users decreases as distance from thepark increases. For example, at a 1/4 mile distance from the park, 102 users per 1000(approximately 10%) are expected to utilize the proposed park, while at a 3 mile distance fromthe park, 6 users per 1000 (approximately 0.6%) are expected to utilize the proposed park. After3 miles, the number of additional trips generated by the park are assumed to be minorcontributors to the total number of park trips. To account for this population, it was assumed thatan additional 5% of the total park trips would originate beyond the 3 mile boundary.
Please note the similarities between Figure 6 and Figures 3 and 4, which show the percent ofpark users by distance at the Riverbank and North River parks, respectively. The modeldeveloped for the Hudson River Park was based on data collected at these facilities and all threefigures show a similar decrease in park users with increased distance to the facility.
4. Trip Distribution
Using 2000 census tract information for Brooklyn and lower Manhattan, a populationdistribution surrounding Brooklyn Bridge Park was determined based on 1/4 mile increments

FIG
UR
E 6:
BR
OO
KLY
N B
RID
GE
PAR
K T
RIP
GEN
ERA
TIO
N
020406080100
120
00.
51
1.5
22.
53
3.5
DIS
TAN
CE
TO P
AR
K (M
ILES
)
USERS PER 1000 POPULATION
PAR
K U
SER
SSO
UR
CE:
HU
DSO
N R
IVER
PAR
K EI
S

6
from the park. These populations were then grown by 0.5% per year to 2012 to determine futurepopulation densities surrounding the project site. Table 4 shows the estimated future populationssurrounding Brooklyn Bridge Park. The above park user model was then applied to thispopulation distribution to determine the expected number of park trips based on proximity to thepark. Please note that the modal split for the population beyond the 3 mile boundary wasassumed to be the same as that for the 3 mile population (see Figure 5).
Based on the park user survey data that was collected at the Brooklyn Heights Promenade, over70% of park trips are expected to originate in Brooklyn. Based on this survey and surveysperformed for the Hudson River Park, it is expected that approximately 75% of Brooklyn BridgePark trips will originate in Brooklyn. In order to be consistent with this distribution, a factor wasapplied to the Manhattan population densities to reduce the overall number of trips expected tooriginate from these Manhattan census tracts. It should be noted that for the purposes of tripforecasting, these Manhattan populations also represent the various other non-Brooklyn triporigins for the future park.
The distribution of populations surrounding the project site (see Table 4) were then applied tothe trip generation model shown in Figure 6. This provided a total number of daily Sunday parkusers (10 AM to 6 PM) generated by the proposed park during a typical summer Sunday. Thetotal number of trips generated by the park is twice this number to account for both inbound andoutbound trips generated by the proposed facility. This number was also adjusted to reflect thetotal 24 hour trips generated by the park (i.e., not only the 10 AM to 6 PM period). Based on thisforecasting, it is expected that the proposed park will generate approximately 27,000 daily tripson a summer Sunday. Based on the Hudson River Park EIS, it was determined that summerweekday users generated about 56% of summer Sunday demand, while summer Saturday usersgenerated approximately 68% of summer Sunday demand.
5. Travel Demand Forecast
The modal split distribution shown in Figure 5 was then applied to the park user model describedin Equation 1 to determine the overall modal split characteristics of the proposed park. Thissurveyed modal split was then slightly adjusted to account for the limited taxi and water taxitrips generated by the proposed park in the future (approximately 1% and 3% of the total trips,respectively).
Table 5 shows the forecasting assumptions that were applied to Brooklyn Bridge Park. This tablealso shows the aggregate modal split distribution for the park. As shown, the proposed park isexpected to generate approximately 27,000 trips during a typical summer Sunday and 15,000trips during a typical summer weekday. During a typical summer Sunday, approximately 14,300(53%) of these trips are expected to be walk oriented, while approximately 5,400 (20%) areexpected to be auto oriented. Based on the auto occupancy data collected during the Promenadeuser survey (2.9 persons per auto), 1,034 autos would be generated by the park on a summerweekday, while 1,862 autos would be generated by the park on a summer Sunday (24 hour total).
Table 6 shows the expected peak hour park trips generated by the Brooklyn Bridge Park using

TABLE 4:POPULATION TABLE
BROOKLYN MANHATTAN3
0.00 - 0.25 MILES 16029 0
0.25 - 0.50 MILES 15255 21411
0.50 - 0.75 MILES 14665 34264
0.75 - 1.00 MILES 26765 44659
1.00 - 1.25 MILES 36106 33709
1.25 - 1.50 MILES 44003 29826
1.50 - 1.75 MILES 42643 37132
1.75 - 2.00 MILES 68468 38798
2.00 - 2.25 MILES 60526 32205
2.25 - 2.50 MILES 57178 32522
2.50 - 2.75 MILES 97580 31239
2.75 - 3.00 MILES 56767 19417
NOTES:
1. Estimated future populations are based on 2000 Census Tract data grown by 0.5% per year to 2012.
2. Census Tract populations were grouped based on distance to the park for estimating park trip generation.
3. Manhattan 'Estimated Future Populations' were adjusted (unadjusted populations are shown above) based on 2003 PHA Park User Survey data collected.This adjustment assumed that 75% of the park user trips would originate in Brooklyn.
ESTIMATED FUTURE POPULATIONS1
DISTANCE TO PARK2

TABLE 5:BROOKLYN BRIDGE PARKTRAVEL DEMAND FORECAST ASSUMPTIONS
WEEKDAY SUNDAY
DAILY PARK VISITORS: 15,000 27,000
HOURLY DISTRIBUTION (1):MD: 17% 15%PM: 14%
DIRECTIONAL SPLIT (IN/OUT) (1):MD: 50% / 50% 55% / 45%PM: 45% / 55%
VEHICLE OCCUPANCY (2):AUTO: 2.9 2.9TAXI: 3.0 3.0
MODAL SPLIT: VARIES BY DISTANCE(SEE FIGURE 5)
WEEKDAY SUNDAYTOTAL PERSON TRIPS BY MODE:
Walk: 7950 53% 14310 53%Bus: 1650 11% 2970 11%Subway: 1800 12% 3240 12%Auto: 3000 20% 5400 20%Taxi: 150 1% 270 1%Water Taxi: 450 3% 810 3%
TOTAL VEHICLES TRIPS:Auto: 1034 1862Taxi: 50 90
NOTES:(1) Hudson River Park EIS(2) Brooklyn Heights Promenade, Park User Survey, PHA, 2003
GENERAL PARK USE

TABLE 6:BROOKLYN BRIDGE PARKTRIP GENERATION
PEAK HOUR TRIPS:
WALK: IN OUT TOTAL
MD: 676 676 1352PM: 501 612 1113SUN MD: 1181 966 2147
BUS:
MD: 140 140 281PM: 104 127 231SUN MD: 245 200 446
SUBWAY:
MD: 153 153 306PM: 113 139 252SUN MD: 267 219 486
AUTO VEHICLE TRIPS:
MD: 88 88 176PM: 65 80 145SUN MD: 154 126 279
TAXI VEHICLE TRIPS:
MD: 4 4 9PM: 3 4 7SUN MD: 7 6 14
WATER TAXI:
MD: 38 38 77PM: 28 35 63SUN MD: 67 55 122

TABLE 7:BROOKLYN BRIDGE PARKPARKING FORECAST ASSUMPTIONS
GENERAL PARK USE
WEEKDAY SUNDAY
DAILY AUTO TRIPS: 1,034 1,862
INBOUND AUTO TRIPS: 517 931 (ASSUME 50% INBOUND)
ACCUMULATION FACTOR (1): 0.41 0.41
REQUIRED PARKING SPACES: 212 382
STAFF/MAINTENANCE WORKER ADJUSTMENT: 21 38(FOR PLANNING, ASSUME 10% OF USER DEMAND)
TOTAL 233 420
Source:(1) Hudson River Park EIS
7
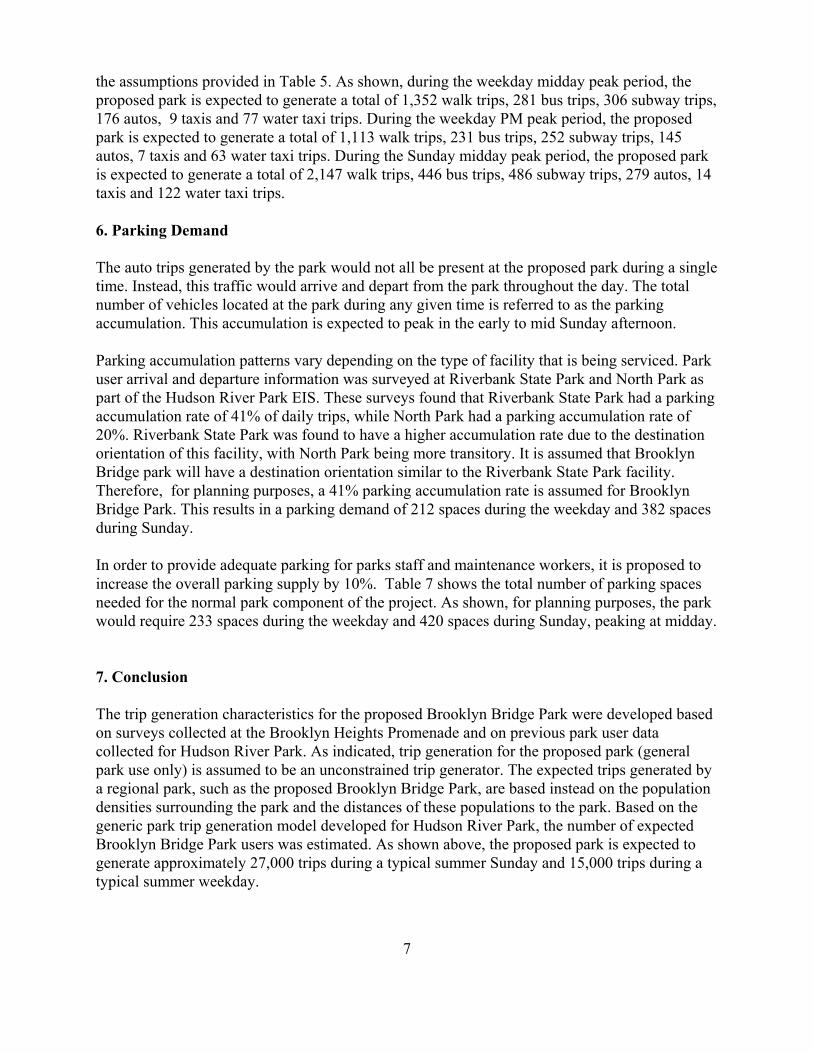
the assumptions provided in Table 5. As shown, during the weekday midday peak period, theproposed park is expected to generate a total of 1,352 walk trips, 281 bus trips, 306 subway trips,176 autos, 9 taxis and 77 water taxi trips. During the weekday PM peak period, the proposedpark is expected to generate a total of 1,113 walk trips, 231 bus trips, 252 subway trips, 145autos, 7 taxis and 63 water taxi trips. During the Sunday midday peak period, the proposed parkis expected to generate a total of 2,147 walk trips, 446 bus trips, 486 subway trips, 279 autos, 14taxis and 122 water taxi trips.
6. Parking Demand
The auto trips generated by the park would not all be present at the proposed park during a singletime. Instead, this traffic would arrive and depart from the park throughout the day. The totalnumber of vehicles located at the park during any given time is referred to as the parkingaccumulation. This accumulation is expected to peak in the early to mid Sunday afternoon.
Parking accumulation patterns vary depending on the type of facility that is being serviced. Parkuser arrival and departure information was surveyed at Riverbank State Park and North Park aspart of the Hudson River Park EIS. These surveys found that Riverbank State Park had a parkingaccumulation rate of 41% of daily trips, while North Park had a parking accumulation rate of20%. Riverbank State Park was found to have a higher accumulation rate due to the destinationorientation of this facility, with North Park being more transitory. It is assumed that BrooklynBridge park will have a destination orientation similar to the Riverbank State Park facility.Therefore, for planning purposes, a 41% parking accumulation rate is assumed for BrooklynBridge Park. This results in a parking demand of 212 spaces during the weekday and 382 spacesduring Sunday.
In order to provide adequate parking for parks staff and maintenance workers, it is proposed toincrease the overall parking supply by 10%. Table 7 shows the total number of parking spacesneeded for the normal park component of the project. As shown, for planning purposes, the parkwould require 233 spaces during the weekday and 420 spaces during Sunday, peaking at midday.
7. Conclusion
The trip generation characteristics for the proposed Brooklyn Bridge Park were developed basedon surveys collected at the Brooklyn Heights Promenade and on previous park user datacollected for Hudson River Park. As indicated, trip generation for the proposed park (generalpark use only) is assumed to be an unconstrained trip generator. The expected trips generated bya regional park, such as the proposed Brooklyn Bridge Park, are based instead on the populationdensities surrounding the park and the distances of these populations to the park. Based on thegeneric park trip generation model developed for Hudson River Park, the number of expectedBrooklyn Bridge Park users was estimated. As shown above, the proposed park is expected togenerate approximately 27,000 trips during a typical summer Sunday and 15,000 trips during atypical summer weekday.

8
Brooklyn Heights Promenade park user survey data was utilized to assist in determining themodal split of park users based on distance to the park. As shown, the number of walk trips areexpected to decrease as the distance from the park increases, while the number of auto trips areexpected to increase as the distance from the park increases. Based on the aggregate modal splitfor park users generated by the project, approximately 53% of park trips are expected to be walkoriented, 21% auto/taxi oriented and 26% transit oriented (subway, bus and water taxi trips).
Parking demand was also determined for the park. With consideration for park staff andmaintenance workers, the park would require 233 spaces during summer weekdays and 420spaces during a summer Sunday to accommodate the normal park user demand for each day.

Appendix A: Park User Survey
Brooklyn Bridge Park (PHA #0324)Park User Interview
Name:_____________________________ Date:___________
Location:____________________________________ Time: From_______ to _________
A. User Category
1. Male adult alone 4. Adult Couple 7.Child / Teen group of friends 2.
Female adult alone 5. Adult / Family with Children 8. Other (Specify)
3. Child / Teen alone 6. Adult group of Friends
B. If group, record number in group
C. How did you come to the park today?
1. Walk 4. Skate 7. Auto (See section D)
2. Run, Jog 5. Bus 8. Taxi (See section D)
3. Bike 6. Subway 9. Water Taxi
D. If by Auto or Taxi, please specify number of people in vehicle.
E. Did you begin your trip in Brooklyn or from another borough or state?
1. Brooklyn 4. Queens 7. Other (Specify)
2. Manhattan 5. Staten Island
3. Bronx 6. New Jersey
F. If in Brooklyn, what are the nearest cross-streets?
G. Did you begin your trip from home? (Yes or No)
H. How many people live in your household?
I. How many children under age 12 are living in your household?
A B C D E F G H I
User # in
Group
Trans. # in
car
Location Origin in Brooklyn Home
Origin
People in
HSHLD
Child in
HSHLD
1
2
3
4
6
7
8
9
10

Appendix B:
Hudson River Park
Technical Memorandum #2