Embed Size (px)
Citation preview
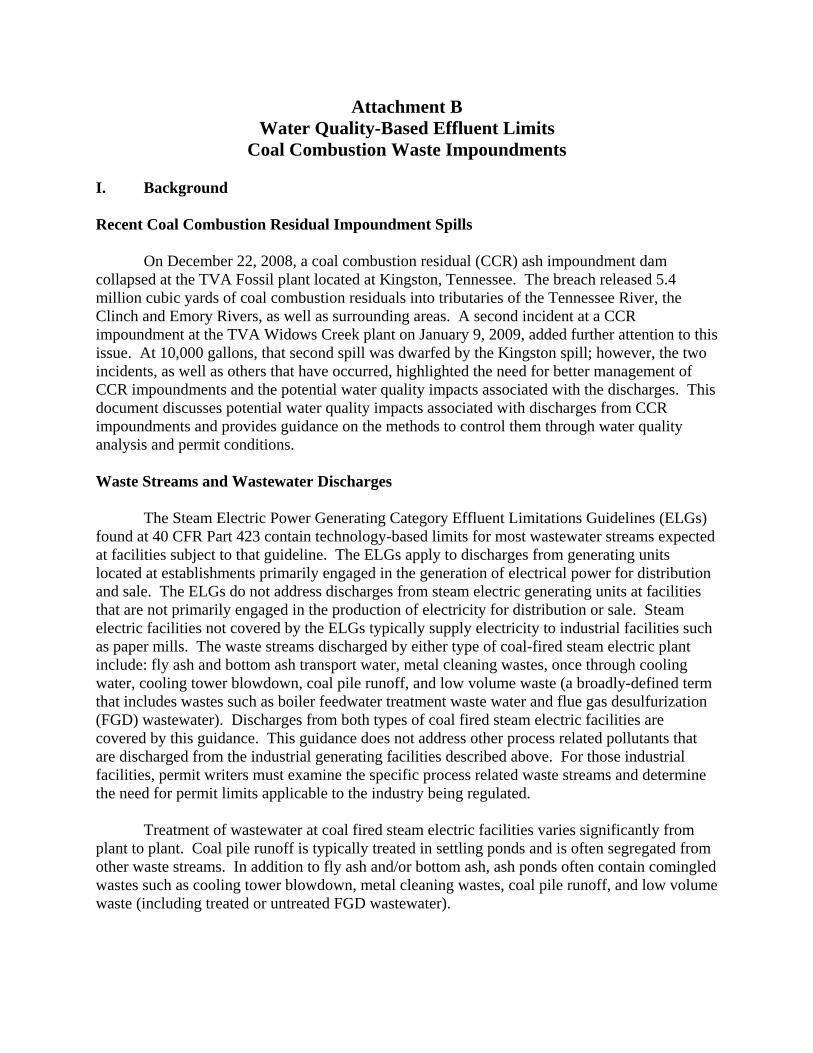
Attachment B Water Quality-Based Effluent Limits
Coal Combustion Waste Impoundments
I. Background
Recent Coal Combustion Residual Impoundment Spills
On December 22, 2008, a coal combustion residual (CCR) ash impoundment dam collapsed at the TVA Fossil plant located at Kingston, Tennessee. The breach released 5.4 million cubic yards of coal combustion residuals into tributaries of the Tennessee River, the Clinch and Emory Rivers, as well as surrounding areas. A second incident at a CCR impoundment at the TVA Widows Creek plant on January 9, 2009, added further attention to this issue. At 10,000 gallons, that second spill was dwarfed by the Kingston spill; however, the two incidents, as well as others that have occurred, highlighted the need for better management of CCR impoundments and the potential water quality impacts associated with the discharges. This document discusses potential water quality impacts associated with discharges from CCR impoundments and provides guidance on the methods to control them through water quality analysis and permit conditions.
Waste Streams and Wastewater Discharges
The Steam Electric Power Generating Category Effluent Limitations Guidelines (ELGs) found at 40 CFR Part 423 contain technology-based limits for most wastewater streams expected at facilities subject to that guideline. The ELGs apply to discharges from generating units located at establishments primarily engaged in the generation of electrical power for distribution and sale. The ELGs do not address discharges from steam electric generating units at facilities that are not primarily engaged in the production of electricity for distribution or sale. Steam electric facilities not covered by the ELGs typically supply electricity to industrial facilities such as paper mills. The waste streams discharged by either type of coal-fired steam electric plant include: fly ash and bottom ash transport water, metal cleaning wastes, once through cooling water, cooling tower blowdown, coal pile runoff, and low volume waste (a broadly-defined term that includes wastes such as boiler feedwater treatment waste water and flue gas desulfurization (FGD) wastewater). Discharges from both types of coal fired steam electric facilities are covered by this guidance. This guidance does not address other process related pollutants that are discharged from the industrial generating facilities described above. For those industrial facilities, permit writers must examine the specific process related waste streams and determine the need for permit limits applicable to the industry being regulated.
Treatment of wastewater at coal fired steam electric facilities varies significantly from plant to plant. Coal pile runoff is typically treated in settling ponds and is often segregated from other waste streams. In addition to fly ash and/or bottom ash, ash ponds often contain comingled wastes such as cooling tower blowdown, metal cleaning wastes, coal pile runoff, and low volume waste (including treated or untreated FGD wastewater).
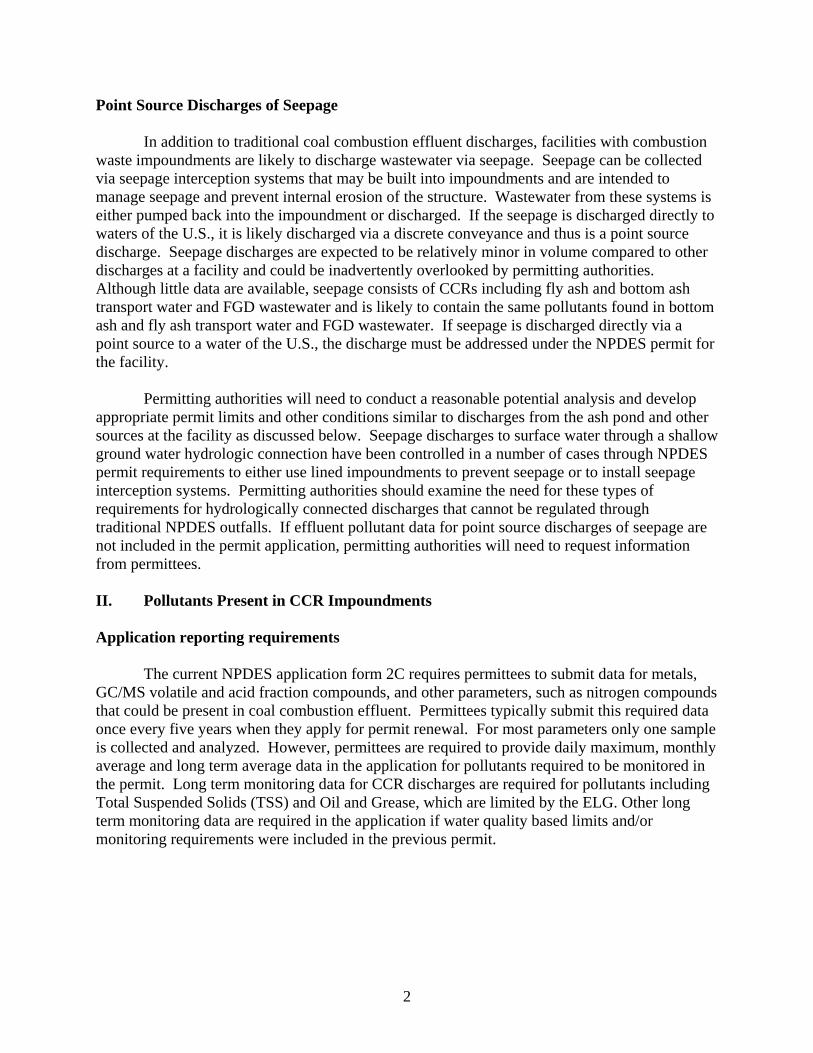
Point Source Discharges of Seepage
In addition to traditional coal combustion effluent discharges, facilities with combustion waste impoundments are likely to discharge wastewater via seepage. Seepage can be collected via seepage interception systems that may be built into impoundments and are intended to manage seepage and prevent internal erosion of the structure. Wastewater from these systems is either pumped back into the impoundment or discharged. If the seepage is discharged directly to waters of the U.S., it is likely discharged via a discrete conveyance and thus is a point source discharge. Seepage discharges are expected to be relatively minor in volume compared to other discharges at a facility and could be inadvertently overlooked by permitting authorities. Although little data are available, seepage consists of CCRs including fly ash and bottom ash transport water and FGD wastewater and is likely to contain the same pollutants found in bottom ash and fly ash transport water and FGD wastewater. If seepage is discharged directly via a point source to a water of the U.S., the discharge must be addressed under the NPDES permit for the facility.
Permitting authorities will need to conduct a reasonable potential analysis and develop appropriate permit limits and other conditions similar to discharges from the ash pond and other sources at the facility as discussed below. Seepage discharges to surface water through a shallow ground water hydrologic connection have been controlled in a number of cases through NPDES permit requirements to either use lined impoundments to prevent seepage or to install seepage interception systems. Permitting authorities should examine the need for these types of requirements for hydrologically connected discharges that cannot be regulated through traditional NPDES outfalls. If effluent pollutant data for point source discharges of seepage are not included in the permit application, permitting authorities will need to request information from permittees.
II. Pollutants Present in CCR Impoundments
Application reporting requirements
The current NPDES application form 2C requires permittees to submit data for metals, GC/MS volatile and acid fraction compounds, and other parameters, such as nitrogen compounds that could be present in coal combustion effluent. Permittees typically submit this required data once every five years when they apply for permit renewal. For most parameters only one sample is collected and analyzed. However, permittees are required to provide daily maximum, monthly average and long term average data in the application for pollutants required to be monitored in the permit. Long term monitoring data for CCR discharges are required for pollutants including Total Suspended Solids (TSS) and Oil and Grease, which are limited by the ELG. Other long term monitoring data are required in the application if water quality based limits and/or monitoring requirements were included in the previous permit.
2
Effluent data
Effluent data shown below in Appendix A were collected by EPA as part of the ELG detailed study of steam electric plants. EPA began a detailed review of steam electric facilities in 2005 as a result of the Clean Water Act section 304(m) review process.
Effluent Variability and Pollutants of Concern
As shown below in Appendix A, effluent pollutant concentrations vary significantly between dischargers. The pollutant concentration variability is the result of factors such as the type of coal used. Note that none of the plants listed in Table 1 utilizes air emissions controls specific for mercury. Implementation of additional emissions controls for mercury or other pollutants would likely result in increased concentrations of those pollutants in CCR and the associated discharges. The current degree of effluent variability and the increasing use of emissions controls provide additional evidence supporting the need for permitting authorities to require site specific effluent data as part of permit applications.
III. Water Quality Permitting Issues
Pollutants Potentially Exceeding Water Quality Criteria
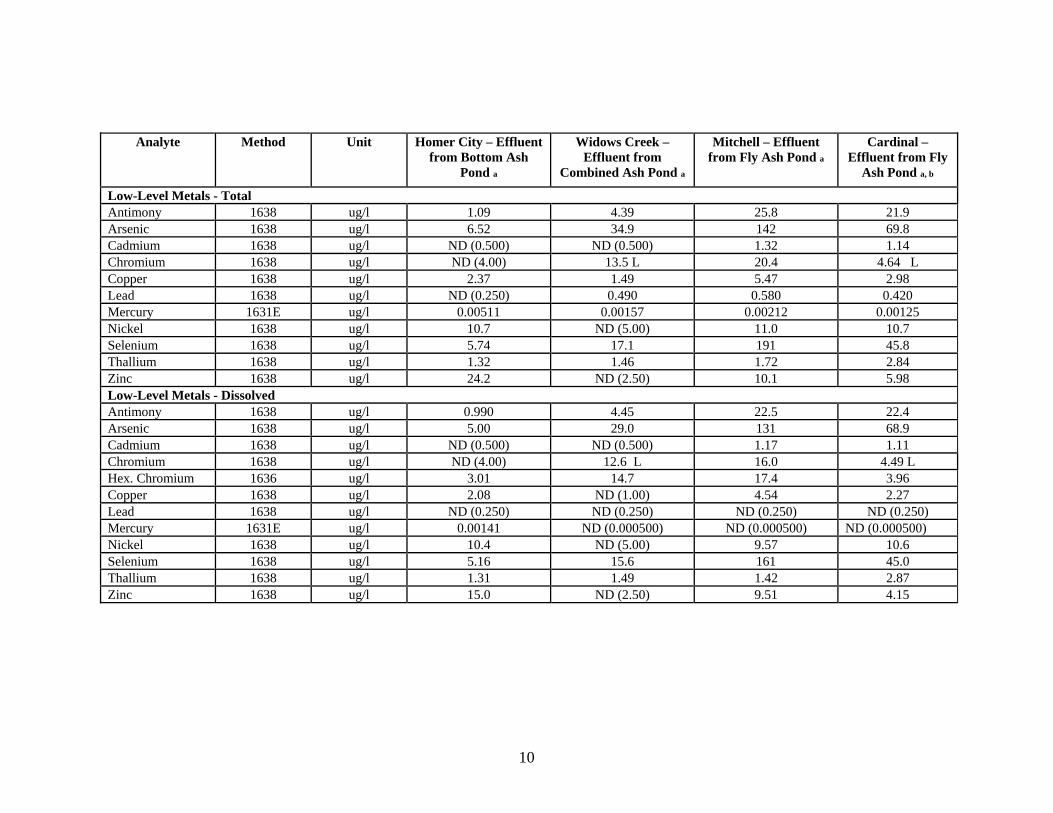
Appendix A shows that metals in CCR effluent are variable and have the potential to exist in relatively high concentrations. For reference, selected national recommended water quality criteria are shown in Appendix A. Based on information presented in Table 1, the following pollutants may be expected to be found in CCR effluent at concentrations that are greater than water quality criteria: Aluminum, Arsenic, Cadmium, Chromium, Copper, Iron, Manganese, Nickel, Selenium, Thallium, Chloride, and Nitrate/Nitrite. Barium, Lead, Mercury, and Silver also can exceed water quality criteria as measured at internal outfalls; however, due to dilution received through mixing the CCR waste stream with other effluents, they do not appear to exceed the criteria at the final outfall. Although water quality criteria were shown to be exceeded, the reasonable potential for a discharge to cause or contribute to an excursion of applicable Water Quality Standards in the receiving water will depend on site-specific conditions, the amount of in-stream dilution available, and the in-stream ambient pollutant concentration, as discussed below. While this comparison does not indicate that there is reasonable potential to exceed applicable water quality standards for each such discharge, it does demonstrate the need to collect data required by the application form 2C and to conduct a reasonable potential analysis for such discharges and establish water quality-based effluent limits where appropriate.
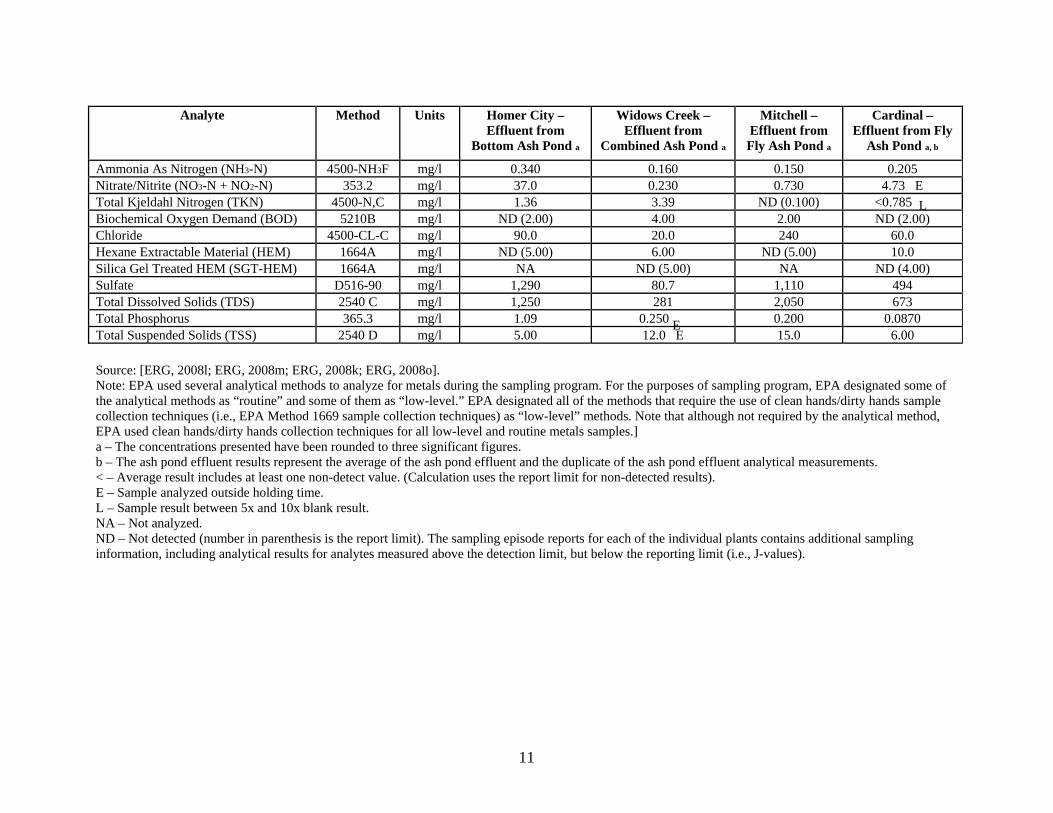
Other parameters shown in Table 1, such as Total Dissolved Solids and Sulfate are present in concentrations which could potentially cause or contribute to water quality impacts. Those parameters are not required to be monitored for the permit application Form 2C. Many states have not established numeric water quality criteria for parameters such as Total Dissolved Solids or Sulfate. Permit writers should be aware of this potential impact on the achievement of applicable narrative water quality criteria and may need to require that effluent data are submitted so that such impacts can be appropriately addressed by the permit. While permitting
3
authorities have the option of requiring monitoring in the permit to obtain such data, it is preferable to request the information during the permit reissuance process. In cases where the reissued permit requires data to be collected, actions to address impairments may be unnecessarily delayed until the subsequent permit is issued. In cases where the previous permit did not require whole effluent toxicity testing, the permitting authority should consider requesting that data also be submitted with the application.
Determining the Need for Water Quality Based Permit Limits
Permitting authorities need to examine the impacts of a discharge relative to both numeric and narrative criteria. Most States have adopted implementation guidance to address the reasonable potential (RP) for a discharge to cause or contribute to an exceedance of numeric criteria. That guidance includes statistical tools and methods for permit writers to determine the RP for a discharge to exceed Water Quality Standards (WQS). A reasonable potential determination as to whether a discharge causes or contributes to an excursion of applicable water quality criteria is required for every discharge (see 40 CFR 122.44(d)).
Most State permitting authorities derived their specific implementation plan for determining RP and establishing water quality based permit limits using EPA’s Technical Support Document for Water Quality Based Toxics Control (TSD) (EPA 1991). In general, RP analysis compares the reasonable maximum in-stream pollutant concentration with water quality criteria to determine the need for effluent limits.
An initial part of the RP process is the determination of available in-stream dilution. Methods used to determine dilution in the mixing zone vary by state and are prescribed by WQS and the State’s mixing zone policy.
Using the available dilution, permitting authorities make a statistical comparison of in-stream effluent pollutant concentrations after mixing and water quality criteria to determine whether there is a reasonable potential to exceed the criteria. This is typically done by comparing the calculated 95th or 99th percentile of the effluent data with criteria. The TSD includes methodology that can be used to conduct that analysis and to derive the resulting permit limits.
Examination of the potential for a discharge to exceed the narrative criteria is a more difficult task that is complicated by a lack of clearly prescribed implementation guidance. CCR can contain fairly high concentrations of parameters that have the potential to impact water quality, such as Total Dissolved Solids, Sulfate, and Calcium that can cause excursions of narrative water quality standards. Since most states have not established numeric criteria for those parameters, permit writers must rely on narrative criteria when addressing potential water quality impacts. One tool states commonly use to address narrative criteria is whole effluent toxicity (WET) monitoring and limits. Chronic WET testing, which include measurement of sub-lethal effects of growth and fecundity, is used in most cases. However, in situations where a discharge is made to a larger waterbody permitting authorities often require acute WET testing based on an acute to chronic ratio. Most states have adopted procedures to determine which test methods and species are used as part of their implementation plans. The TSD also includes
4
guidance that is intended to assist with implementation of water quality based permit limits. WET testing measures the toxic effects of the complete mix of pollutants in a discharge and is a useful tool for measuring the impacts to aquatic life. Permit writers also have the option of requiring bioassessments to determine whether discharges are causing impacts and understand the specific causes. Another option is for the permitting authority to target CCR discharges in their stream surveillance activities and address impacts under the Total Maximum Daily Load program. State stream assessment programs may also utilize other tools to analyze the water quality of surface waters. State established tools that are used to translate narrative standards based on numeric data may be useful to permit writers attempting to protect water quality.
Use of Ambient Pollutant Data
Permit limits that fully protect water quality cannot be developed without taking into account the ambient pollutant concentration, also known as the background concentration. However, permit writers typically do not have access to defensible ambient pollutant data. In the absence of data, permit writers have often established water quality based permit limits using the assumption that the background concentration is zero.
The equation used to calculate waste load allocations for water quality based limits follows, as shown in the NPDES permit Writers Manual (EPA 1996)
(QdCd + QsCs) / Qr = Cr
Where:
Qd = waste discharge flow in million gallons per day (mgd) or cubic feet per second (cfs)
Cd = pollutant concentration in waste discharge in milligrams per liter (mg/l) Qs = background stream flow in mgd or cfs above point of discharge Cs = background in-stream pollutant concentration in mg/l Qr = resultant in-stream flow, after discharge in mgd or cfs Cr = resultant in-stream pollutant concentration in mg/l in the stream reach (after
complete mixing occurs)
This equation or a variation thereof is used by permitting authorities as part of the process to derive water quality based limits. If a value of zero is used for the ambient concentration for a pollutant (Cs) in the equation, the permit writer would be able to establish a limit that would give the entire pollutant allocation to the discharger. The resulting limit would not account for any upstream discharges or any natural background concentration of the pollutant, and it would not protect the Water Quality Standard. Since it is highly unlikely that the background concentration is ever zero, the limit would not prevent an in-stream excursion of criteria.
Since it is not realistic to assume that the ambient pollutant concentration is zero, permit writers must develop a method to adequately protect water quality. A number of options exist for that task. Some states have adopted a policy of assuming that the ambient concentration is equal to one half of the water quality criteria when no ambient data exist. While this is a
5
somewhat conservative approach, the permittee could be given the opportunity to collect data during the comment period for the permit if they believed that the approach resulted in an overly stringent limit. Other options available to the permitting authority include requiring submittal of ambient data with permit applications, developing permit requirements to collect data, or establishing default ambient concentrations using literature values. Any approach chosen by the permitting authority to estimate background pollutant concentrations will result in more realistic water quality based limits and improved compliance with state standards.
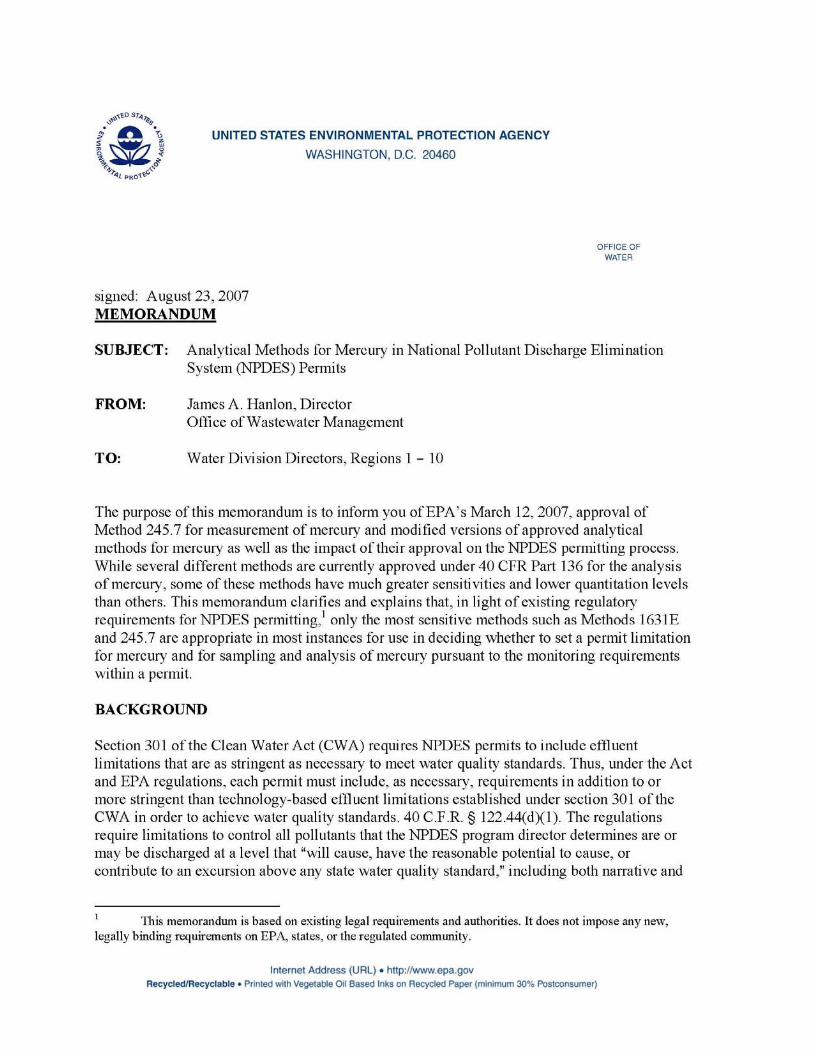
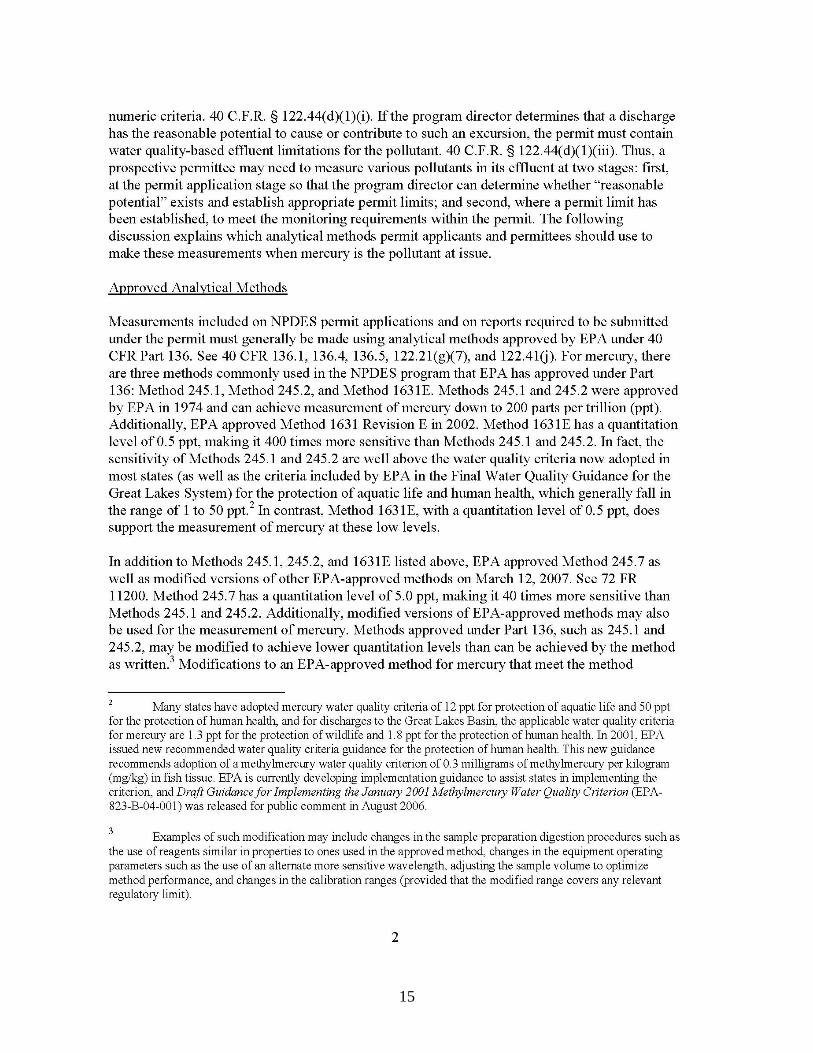
IV. Use of Sufficiently Sensitive Analytical Test Methods
The use of sufficiently sensitive analytical methods is critically important to detecting, identifying and measuring the concentrations of pollutants in CCW wastestreams. For further discussion of sufficiently sensitive methods, see Part V of Attachment A of this memo, and the memo on Analytical Methods for Mercury in NPDES Permit, dated August 23, 2007 in Appendix C.
V. Disclaimer
This guidance document does not change or substitute for any legal requirements, though it does provide clarification of some regulatory requirements. While EPA has made every effort to ensure the accuracy of the discussion in this document, the obligations of the regulated community are determined by the relevant statutes, regulations, or other legally binding requirements. This guidance document is not legally enforceable and does not confer legal rights or impose legal obligations upon any member of the public, EPA, states, or any other agency. In the event of a conflict between the discussion in this document and any statute or regulation, this document would not be controlling. The word “should” as used in this guidance document does not connote a requirement, but does indicate EPA’s strongly preferred approach to assure effective implementation of legal requirements. This guidance may not apply in a particular situation based upon the circumstances, and EPA, states and Tribes retain the discretion to adopt approaches on a case-by-case basis that differ from the recommendations of this guidance document where appropriate. Permitting authorities will make each permitting decision on a case-by-case basis and will be guided by the applicable requirements of the CWA and implementing regulations, taking into account comments and information presented at that time by interested persons regarding the appropriateness of applying these recommendations to the particular situation. In addition, EPA may decide to revise this guidance document to reflect changes in EPA’s approach to implementing the regulations or to clarify and update text.
VI. References
USEPA. 2009. Steam Electric Power Generating Point Source Category: Final Detailed Study Report. USEPA Engineering and Analysis Division, Office of Water. EPA 821-R-09-008. Washington, DC. October, 2009. Available online at: http://www.epa.gov/waterscience/guide/steam/finalreport.pdf
USEPA. 1996. USEPA NPDES Permit Writers Manual. USEPA Office of Water. EPA 833-B-96-003. Washington, DC. December, 1996. Available online at: http://cfpub.epa.gov/npdes/writermanual.cfm?program_id=45
6

USEPA. 1991. Technical Support Document for Water Quality Based Toxics Control. USEPA Office of Water Enforcement and Permits. Washington, DC. March, 1991. Available online at: http://www.epa.gov/npdes/pubs/owm0264.pdf
7
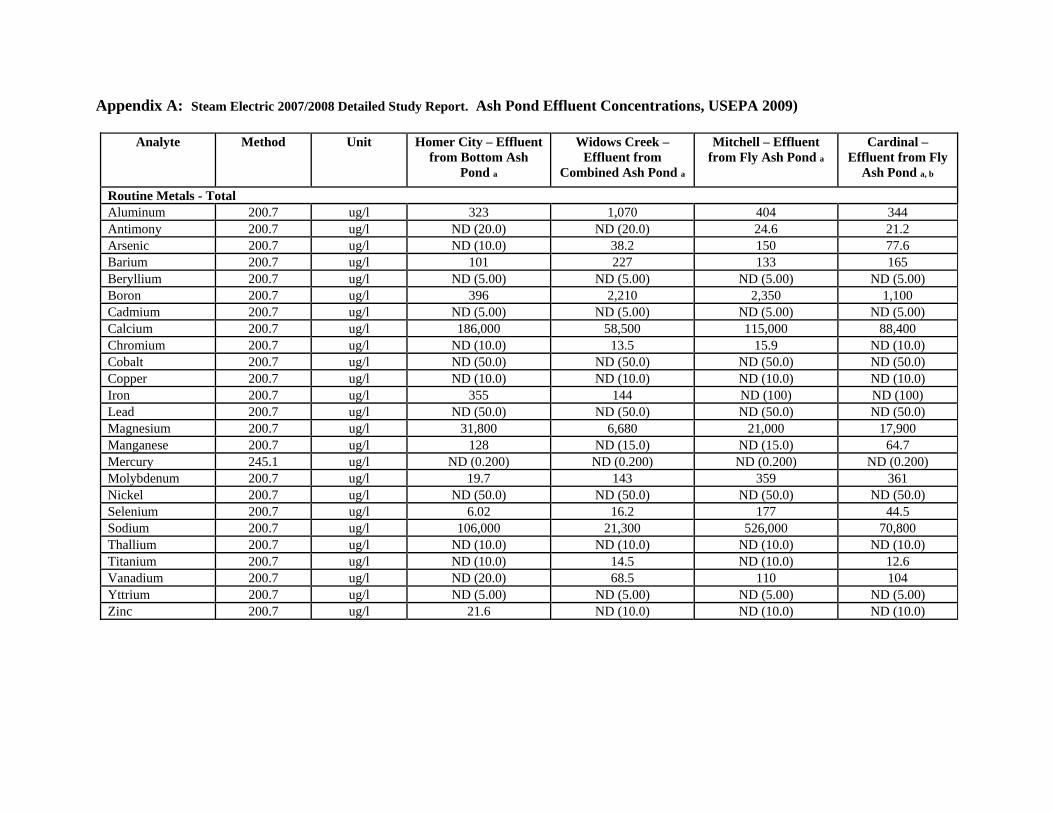
Appendix A: Steam Electric 2007/2008 Detailed Study Report. Ash Pond Effluent Concentrations, USEPA 2009)
Analyte Method Unit Homer City – Effluent from Bottom Ash
Pond a
Widows Creek – Effluent from
Combined Ash Pond a
Mitchell – Effluent from Fly Ash Pond a
Cardinal – Effluent from Fly
Ash Pond a, b
Routine Metals - Total Aluminum 200.7 ug/l 323 1,070 404 344 Antimony 200.7 ug/l ND (20.0) ND (20.0) 24.6 21.2 Arsenic 200.7 ug/l ND (10.0) 38.2 150 77.6 Barium 200.7 ug/l 101 227 133 165 Beryllium 200.7 ug/l ND (5.00) ND (5.00) ND (5.00) ND (5.00) Boron 200.7 ug/l 396 2,210 2,350 1,100 Cadmium 200.7 ug/l ND (5.00) ND (5.00) ND (5.00) ND (5.00) Calcium 200.7 ug/l 186,000 58,500 115,000 88,400 Chromium 200.7 ug/l ND (10.0) 13.5 15.9 ND (10.0) Cobalt 200.7 ug/l ND (50.0) ND (50.0) ND (50.0) ND (50.0) Copper 200.7 ug/l ND (10.0) ND (10.0) ND (10.0) ND (10.0) Iron 200.7 ug/l 355 144 ND (100) ND (100) Lead 200.7 ug/l ND (50.0) ND (50.0) ND (50.0) ND (50.0) Magnesium 200.7 ug/l 31,800 6,680 21,000 17,900 Manganese 200.7 ug/l 128 ND (15.0) ND (15.0) 64.7 Mercury 245.1 ug/l ND (0.200) ND (0.200) ND (0.200) ND (0.200) Molybdenum 200.7 ug/l 19.7 143 359 361 Nickel 200.7 ug/l ND (50.0) ND (50.0) ND (50.0) ND (50.0) Selenium 200.7 ug/l 6.02 16.2 177 44.5 Sodium 200.7 ug/l 106,000 21,300 526,000 70,800 Thallium 200.7 ug/l ND (10.0) ND (10.0) ND (10.0) ND (10.0) Titanium 200.7 ug/l ND (10.0) 14.5 ND (10.0) 12.6 Vanadium 200.7 ug/l ND (20.0) 68.5 110 104 Yttrium 200.7 ug/l ND (5.00) ND (5.00) ND (5.00) ND (5.00) Zinc 200.7 ug/l 21.6 ND (10.0) ND (10.0) ND (10.0)
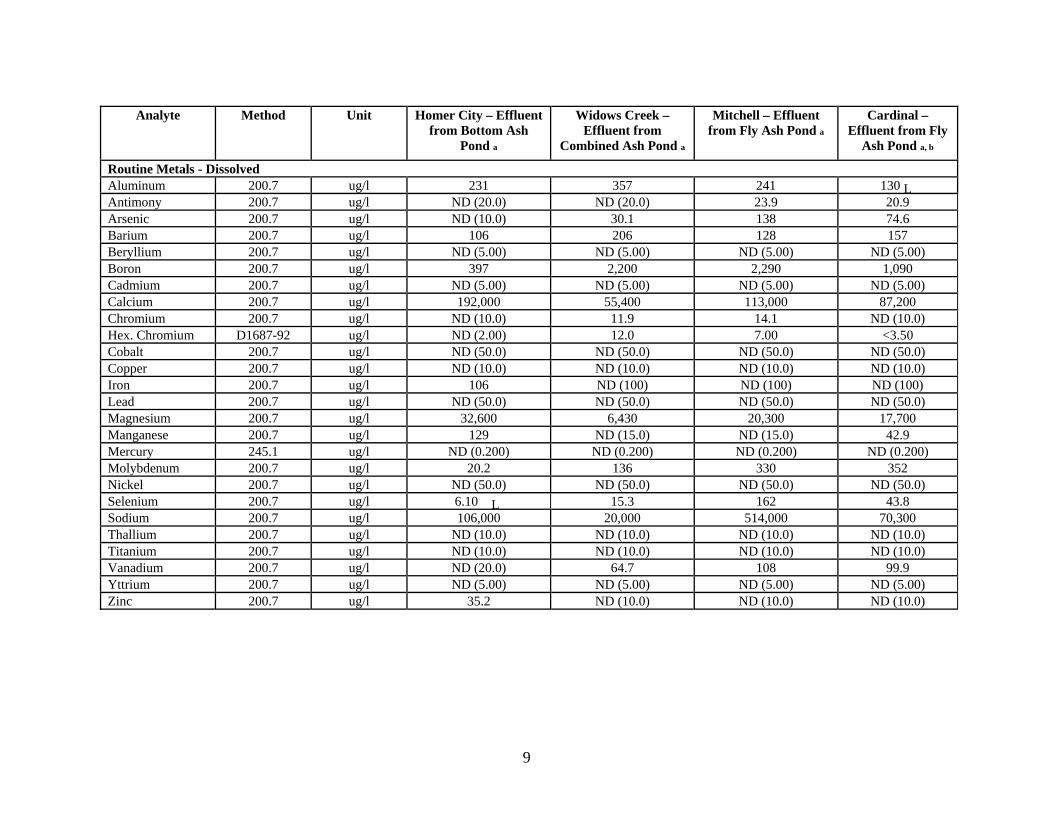
Analyte Method Unit Homer City – Effluent from Bottom Ash
Pond a
Widows Creek – Effluent from
Combined Ash Pond a
Mitchell – Effluent from Fly Ash Pond a
Cardinal – Effluent from Fly
Ash Pond a, b
Routine Metals - Dissolved Aluminum 200.7 ug/l 231 357 241 130 L Antimony 200.7 ug/l ND (20.0) ND (20.0) 23.9 20.9 Arsenic 200.7 ug/l ND (10.0) 30.1 138 74.6 Barium 200.7 ug/l 106 206 128 157 Beryllium 200.7 ug/l ND (5.00) ND (5.00) ND (5.00) ND (5.00) Boron 200.7 ug/l 397 2,200 2,290 1,090 Cadmium 200.7 ug/l ND (5.00) ND (5.00) ND (5.00) ND (5.00) Calcium 200.7 ug/l 192,000 55,400 113,000 87,200 Chromium 200.7 ug/l ND (10.0) 11.9 14.1 ND (10.0) Hex. Chromium D1687-92 ug/l ND (2.00) 12.0 7.00 <3.50 Cobalt 200.7 ug/l ND (50.0) ND (50.0) ND (50.0) ND (50.0) Copper 200.7 ug/l ND (10.0) ND (10.0) ND (10.0) ND (10.0) Iron 200.7 ug/l 106 ND (100) ND (100) ND (100) Lead 200.7 ug/l ND (50.0) ND (50.0) ND (50.0) ND (50.0) Magnesium 200.7 ug/l 32,600 6,430 20,300 17,700 Manganese 200.7 ug/l 129 ND (15.0) ND (15.0) 42.9 Mercury 245.1 ug/l ND (0.200) ND (0.200) ND (0.200) ND (0.200) Molybdenum 200.7 ug/l 20.2 136 330 352 Nickel 200.7 ug/l ND (50.0) ND (50.0) ND (50.0) ND (50.0) Selenium 200.7 ug/l 6.10 L 15.3 162 43.8 Sodium 200.7 ug/l 106,000 20,000 514,000 70,300 Thallium 200.7 ug/l ND (10.0) ND (10.0) ND (10.0) ND (10.0) Titanium 200.7 ug/l ND (10.0) ND (10.0) ND (10.0) ND (10.0) Vanadium 200.7 ug/l ND (20.0) 64.7 108 99.9 Yttrium 200.7 ug/l ND (5.00) ND (5.00) ND (5.00) ND (5.00) Zinc 200.7 ug/l 35.2 ND (10.0) ND (10.0) ND (10.0)
9
Analyte Method Unit Homer City – Effluent from Bottom Ash
Pond a
Widows Creek – Effluent from
Combined Ash Pond a
Mitchell – Effluent from Fly Ash Pond a
Cardinal – Effluent from Fly
Ash Pond a, b
Low-Level Metals - Total Antimony 1638 ug/l 1.09 4.39 25.8 21.9 Arsenic 1638 ug/l 6.52 34.9 142 69.8 Cadmium 1638 ug/l ND (0.500) ND (0.500) 1.32 1.14 Chromium 1638 ug/l ND (4.00) 13.5 L 20.4 4.64 L Copper 1638 ug/l 2.37 1.49 5.47 2.98 Lead 1638 ug/l ND (0.250) 0.490 0.580 0.420 Mercury 1631E ug/l 0.00511 0.00157 0.00212 0.00125 Nickel 1638 ug/l 10.7 ND (5.00) 11.0 10.7 Selenium 1638 ug/l 5.74 17.1 191 45.8 Thallium 1638 ug/l 1.32 1.46 1.72 2.84 Zinc 1638 ug/l 24.2 ND (2.50) 10.1 5.98 Low-Level Metals - Dissolved Antimony 1638 ug/l 0.990 4.45 22.5 22.4 Arsenic 1638 ug/l 5.00 29.0 131 68.9 Cadmium 1638 ug/l ND (0.500) ND (0.500) 1.17 1.11 Chromium 1638 ug/l ND (4.00) 12.6 L 16.0 4.49 L Hex. Chromium 1636 ug/l 3.01 14.7 17.4 3.96 Copper 1638 ug/l 2.08 ND (1.00) 4.54 2.27 Lead 1638 ug/l ND (0.250) ND (0.250) ND (0.250) ND (0.250) Mercury 1631E ug/l 0.00141 ND (0.000500) ND (0.000500) ND (0.000500) Nickel 1638 ug/l 10.4 ND (5.00) 9.57 10.6 Selenium 1638 ug/l 5.16 15.6 161 45.0 Thallium 1638 ug/l 1.31 1.49 1.42 2.87 Zinc 1638 ug/l 15.0 ND (2.50) 9.51 4.15
10
Analyte Method Units Homer City – Effluent from
Bottom Ash Pond a
Widows Creek – Effluent from
Combined Ash Pond a
Mitchell – Effluent from Fly Ash Pond a
Cardinal – Effluent from Fly
Ash Pond a, b
Ammonia As Nitrogen (NH3-N) 4500-NH3F mg/l 0.340 0.160 0.150 0.205 Nitrate/Nitrite (NO3-N + NO2-N) 353.2 mg/l 37.0 0.230 0.730 4.73 E Total Kjeldahl Nitrogen (TKN) 4500-N,C mg/l 1.36 3.39 ND (0.100) <0.785 L Biochemical Oxygen Demand (BOD) 5210B mg/l ND (2.00) 4.00 2.00 ND (2.00) Chloride 4500-CL-C mg/l 90.0 20.0 240 60.0 Hexane Extractable Material (HEM) 1664A mg/l ND (5.00) 6.00 ND (5.00) 10.0 Silica Gel Treated HEM (SGT-HEM) 1664A mg/l NA ND (5.00) NA ND (4.00) Sulfate D516-90 mg/l 1,290 80.7 1,110 494 Total Dissolved Solids (TDS) 2540 C mg/l 1,250 281 2,050 673 Total Phosphorus 365.3 mg/l 1.09 0.250 E 0.200 0.0870 Total Suspended Solids (TSS) 2540 D mg/l 5.00 12.0 E 15.0 6.00
Source: [ERG, 2008l; ERG, 2008m; ERG, 2008k; ERG, 2008o]. Note: EPA used several analytical methods to analyze for metals during the sampling program. For the purposes of sampling program, EPA designated some of the analytical methods as “routine” and some of them as “low-level.” EPA designated all of the methods that require the use of clean hands/dirty hands sample collection techniques (i.e., EPA Method 1669 sample collection techniques) as “low-level” methods. Note that although not required by the analytical method, EPA used clean hands/dirty hands collection techniques for all low-level and routine metals samples.] a – The concentrations presented have been rounded to three significant figures. b – The ash pond effluent results represent the average of the ash pond effluent and the duplicate of the ash pond effluent analytical measurements. < – Average result includes at least one non-detect value. (Calculation uses the report limit for non-detected results). E – Sample analyzed outside holding time. L – Sample result between 5x and 10x blank result. NA – Not analyzed. ND – Not detected (number in parenthesis is the report limit). The sampling episode reports for each of the individual plants contains additional sampling information, including analytical results for analytes measured above the detection limit, but below the reporting limit (i.e., J-values).
11
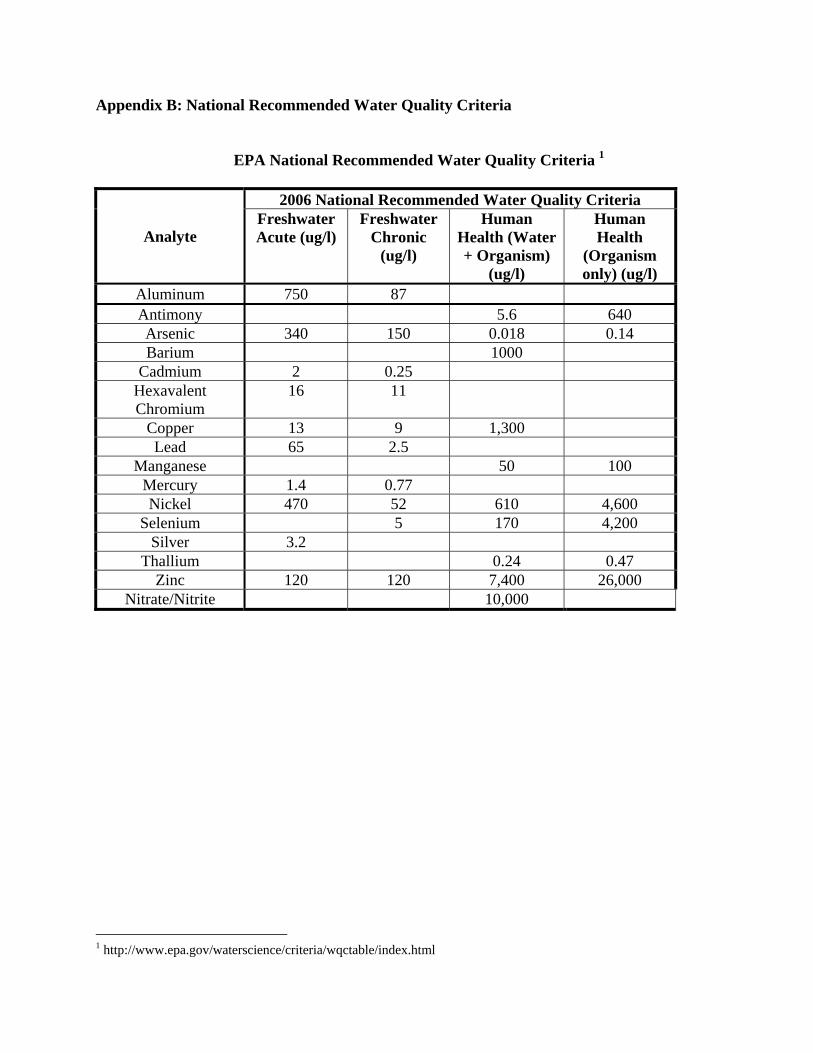
Appendix B: National Recommended Water Quality Criteria
EPA National Recommended Water Quality Criteria 1
Analyte
2006 National Recommended Water Quality Criteria Freshwater Acute (ug/l)
Freshwater Chronic
(ug/l)
Human Health (Water + Organism)
(ug/l)
Human Health
(Organism only) (ug/l)
Aluminum 750 87 Antimony 5.6 640 Arsenic 340 150 0.018 0.14 Barium 1000
Cadmium 2 0.25 Hexavalent Chromium
16 11
Copper 13 9 1,300 Lead 65 2.5
Manganese 50 100 Mercury 1.4 0.77 Nickel 470 52 610 4,600
Selenium 5 170 4,200 Silver 3.2
Thallium 0.24 0.47 Zinc 120 120 7,400 26,000
Nitrate/Nitrite 10,000
1 http://www.epa.gov/waterscience/criteria/wqctable/index.html
Appendix C: Mercury Analytic Test Method Memorandum
13
14
15
16
17