Embed Size (px)
Citation preview
WEB
APP
LIC
ATIO
N
ATTA
CK S
TATI
STIC
SQ
1 20
17
WEB APPLICATION ATTACK STATISTICS Q1 2017
2
CONTENTS
Introduction ....................................................................................................................................................................................................................3
Results at a glance ......................................................................................................................................................................................................4
Web application attacks: statistics ....................................................................................................................................................................5
Attack types ........................................................................................................................................................................................................5
Attack trends ......................................................................................................................................................................................................8
Conclusions .................................................................................................................................................................................................................. 11
WEB APPLICATION ATTACK STATISTICS Q1 2017
3
INTRODUCTION
This report provides statistics on attacks performed against web applications during the first quar-ter of 2017. Sources of data are pilot projects involving deployment of PT Application Firewall, as well as Positive Technologies’ own PT AF installations.
Priorities included determining the most common types of attacks, objectives, intensity, and time distribution of attacks. In addition, we discuss the attacks most frequently encountered by clients in different sectors.
With this up-to-date picture of attacks, companies and organizations can track trends in web ap-plication security, identify the most important threats, and focus their efforts during web applica-tion development and subsequent protection.
Automated vulnerability scanners (such as Acunetix) have been excluded from the data used here. The example attacks presented in this report have been manually verified to rule out false positives.
Protection data for Positive Technologies itself has been classified under the IT sector for reporting purposes.
WEB APPLICATION ATTACK STATISTICS Q1 2017
4
0%
OS Commanding
Local File Inclusion
Path Traversal
Cross-Site Scripting
SQL Injection
10% 20% 30% 40% 50%
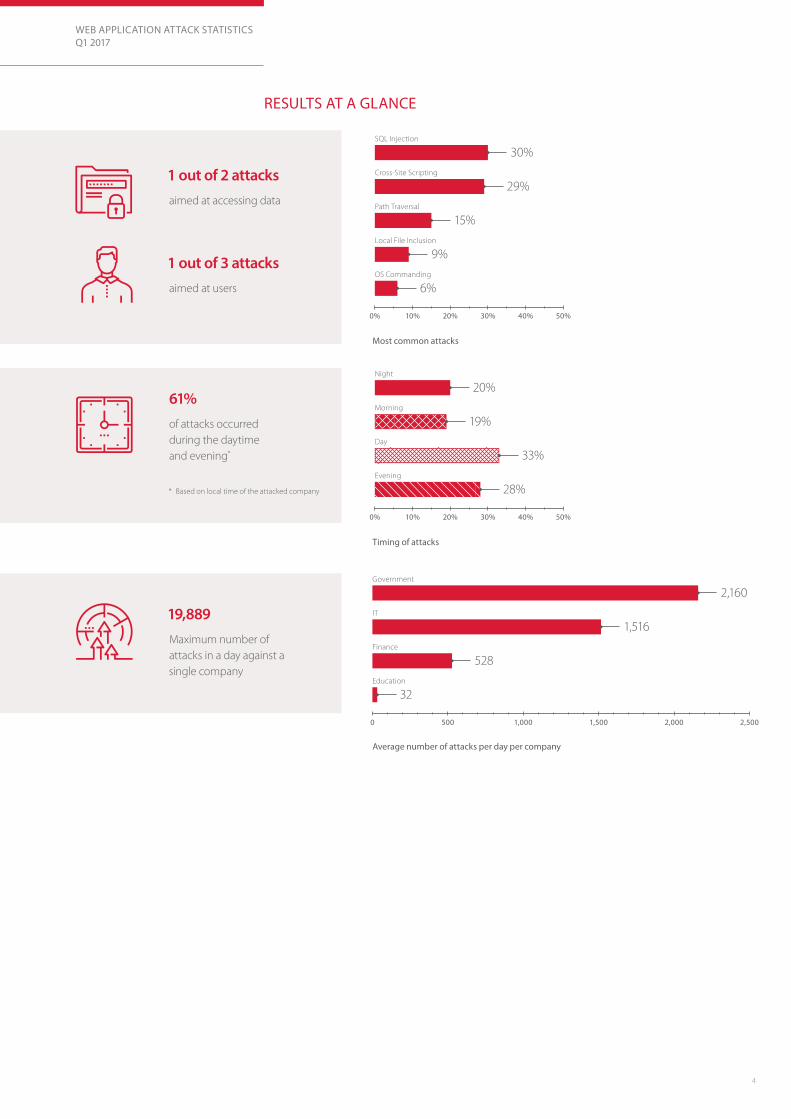
6%
9%
15%
29%
30%
0%
Evening
Day
Morning
Night
10% 20% 30% 40% 50%
28%
33%
19%
20%
RESULTS AT A GLANCE
1 out of 2 attacksaimed at accessing data
19,889Maximum number of attacks in a day against a single company
61%of attacks occurred during the daytime and evening*
1 out of 3 attacks aimed at users
Most common attacks
Timing of attacks
Average number of attacks per day per company
* Based on local time of the attacked company
0 500 1,000 1,500 2,000 2,500
Education
Finance
32
528
IT
1,516
Government
2,160
WEB APPLICATION ATTACK STATISTICS Q1 2017
5
WEB APPLICATION ATTACKS: STATISTICS
Attack types
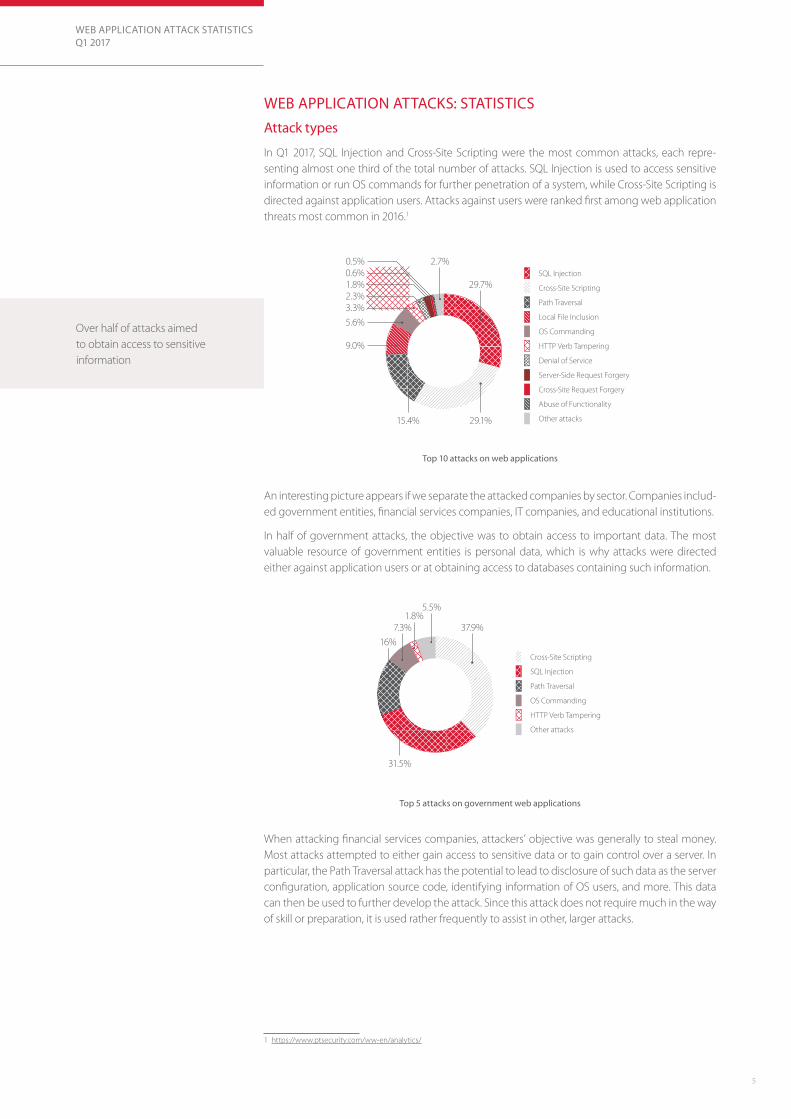
In Q1 2017, SQL Injection and Cross-Site Scripting were the most common attacks, each repre-senting almost one third of the total number of attacks. SQL Injection is used to access sensitive information or run OS commands for further penetration of a system, while Cross-Site Scripting is directed against application users. Attacks against users were ranked first among web application threats most common in 2016.1
An interesting picture appears if we separate the attacked companies by sector. Companies includ-ed government entities, financial services companies, IT companies, and educational institutions.
In half of government attacks, the objective was to obtain access to important data. The most valuable resource of government entities is personal data, which is why attacks were directed either against application users or at obtaining access to databases containing such information.
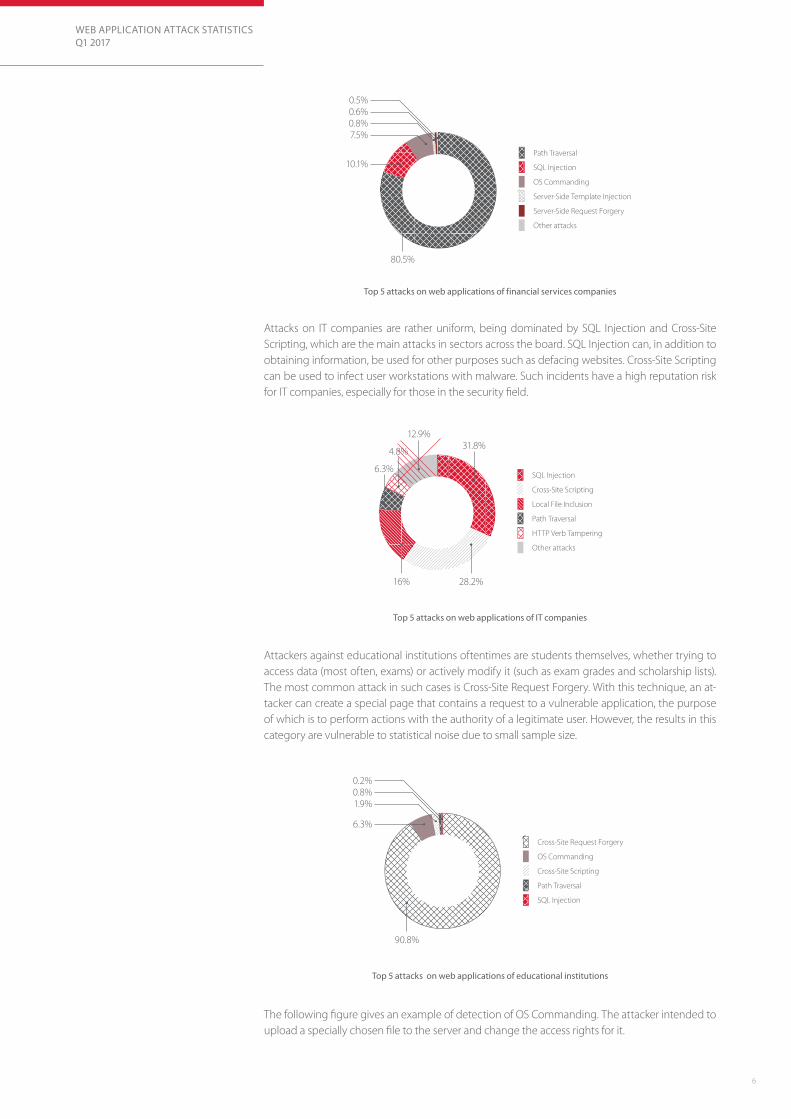
When attacking financial services companies, attackers’ objective was generally to steal money. Most attacks attempted to either gain access to sensitive data or to gain control over a server. In particular, the Path Traversal attack has the potential to lead to disclosure of such data as the server configuration, application source code, identifying information of OS users, and more. This data can then be used to further develop the attack. Since this attack does not require much in the way of skill or preparation, it is used rather frequently to assist in other, larger attacks.
1 https://www.ptsecurity.com/ww-en/analytics/
Over half of attacks aimed to obtain access to sensitive information
15.4% 29.1%
29.7%
2.7%
9.0%
5.6%
SQL Injection
Cross-Site Scripting
Path Traversal
Local File Inclusion
OS Commanding
HTTP Verb Tampering
Denial of Service
Server-Side Request Forgery
Cross-Site Request Forgery
Abuse of Functionality
Other attacks
3.3%2.3%1.8%0.6%0.5%
31.5%
37.9%
16%
5.5%1.8%
7.3%
SQL Injection
Cross-Site Scripting
Path Traversal
OS Commanding
HTTP Verb Tampering
Other attacks
Top 10 attacks on web applications
Top 5 attacks on government web applications
WEB APPLICATION ATTACK STATISTICS Q1 2017
6
Attacks on IT companies are rather uniform, being dominated by SQL Injection and Cross-Site Scripting, which are the main attacks in sectors across the board. SQL Injection can, in addition to obtaining information, be used for other purposes such as defacing websites. Cross-Site Scripting can be used to infect user workstations with malware. Such incidents have a high reputation risk for IT companies, especially for those in the security field.
80.5%
SQL Injection
Server-Side Template Injection
Path Traversal
OS Commanding
Other attacks
Server-Side Request Forgery
10.1%
7.5%0.8%0.6%0.5%
Top 5 attacks on web applications of financial services companies
Attackers against educational institutions oftentimes are students themselves, whether trying to access data (most often, exams) or actively modify it (such as exam grades and scholarship lists). The most common attack in such cases is Cross-Site Request Forgery. With this technique, an at-tacker can create a special page that contains a request to a vulnerable application, the purpose of which is to perform actions with the authority of a legitimate user. However, the results in this category are vulnerable to statistical noise due to small sample size.
16% 28.2%
31.8%12.9%
4.8%
6.3%SQL Injection
Cross-Site Scripting
Path Traversal
HTTP Verb Tampering
Other attacks
Local File Inclusion
90.8%
6.3%
1.9%0.8%0.2%
Cross-Site Request Forgery
OS Commanding
Cross-Site Scripting
Path Traversal
SQL Injection
Top 5 attacks on web applications of IT companies
Top 5 attacks on web applications of educational institutions
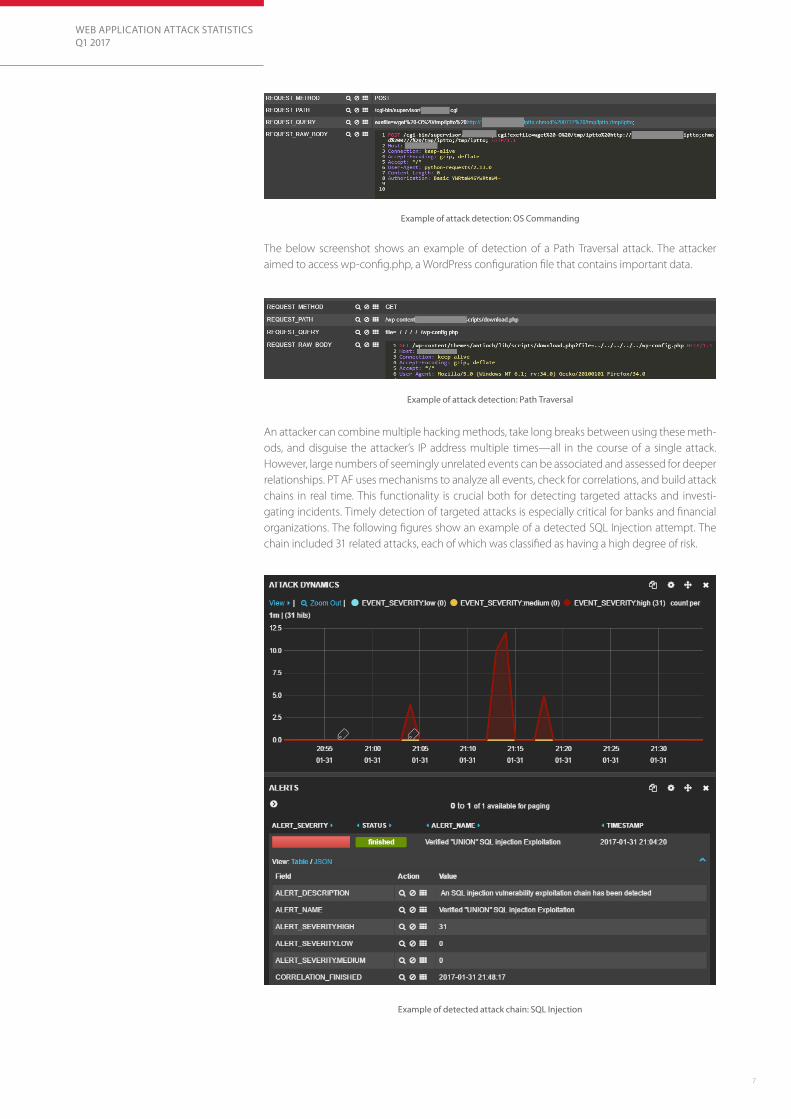
The following figure gives an example of detection of OS Commanding. The attacker intended to upload a specially chosen file to the server and change the access rights for it.
WEB APPLICATION ATTACK STATISTICS Q1 2017
7
Example of attack detection: OS Commanding
Example of attack detection: Path Traversal
Example of detected attack chain: SQL Injection
The below screenshot shows an example of detection of a Path Traversal attack. The attacker aimed to access wp-config.php, a WordPress configuration file that contains important data.
An attacker can combine multiple hacking methods, take long breaks between using these meth-ods, and disguise the attacker’s IP address multiple times—all in the course of a single attack. However, large numbers of seemingly unrelated events can be associated and assessed for deeper relationships. PT AF uses mechanisms to analyze all events, check for correlations, and build attack chains in real time. This functionality is crucial both for detecting targeted attacks and investi-gating incidents. Timely detection of targeted attacks is especially critical for banks and financial organizations. The following figures show an example of a detected SQL Injection attempt. The chain included 31 related attacks, each of which was classified as having a high degree of risk.
WEB APPLICATION ATTACK STATISTICS Q1 2017
8
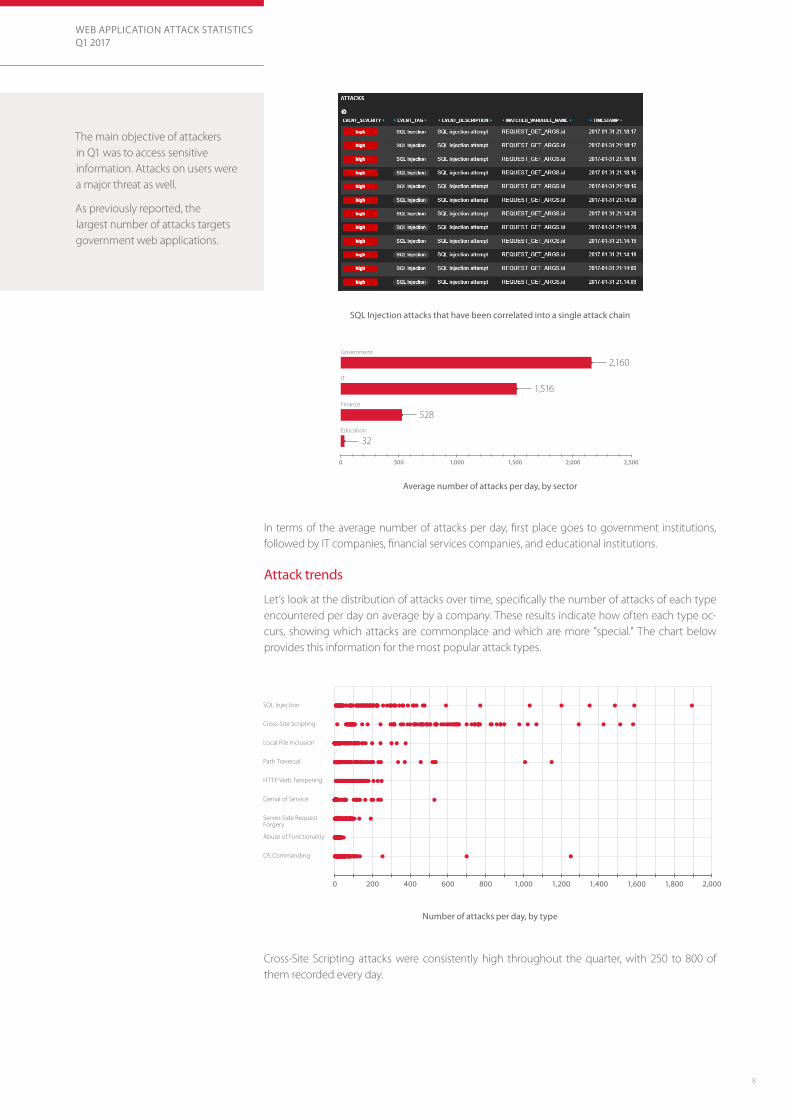
SQL Injection attacks that have been correlated into a single attack chain
Average number of attacks per day, by sector
0 500 1,000 1,500 2,000 2,500
Education
Finance
32
528
IT
1,516
Government
2,160
The main objective of attackers in Q1 was to access sensitive information. Attacks on users were a major threat as well.
As previously reported, the largest number of attacks targets government web applications.
In terms of the average number of attacks per day, first place goes to government institutions, followed by IT companies, financial services companies, and educational institutions.
Attack trends
Let’s look at the distribution of attacks over time, specifically the number of attacks of each type encountered per day on average by a company. These results indicate how often each type oc-curs, showing which attacks are commonplace and which are more "special." The chart below provides this information for the most popular attack types.
Cross-Site Scripting attacks were consistently high throughout the quarter, with 250 to 800 of them recorded every day.
Number of attacks per day, by type
0 200 400 600 800 1,000 1,200 1,400 1,600 1,800 2,000
OS Commanding
Abuse of Functionality
Server-Side Request Forgery
Denial of Service
HTTP Verb Tampering
Path Traversal
Local File Inclusion
Cross-Site Scripting
SQL Injection
WEB APPLICATION ATTACK STATISTICS Q1 2017
9
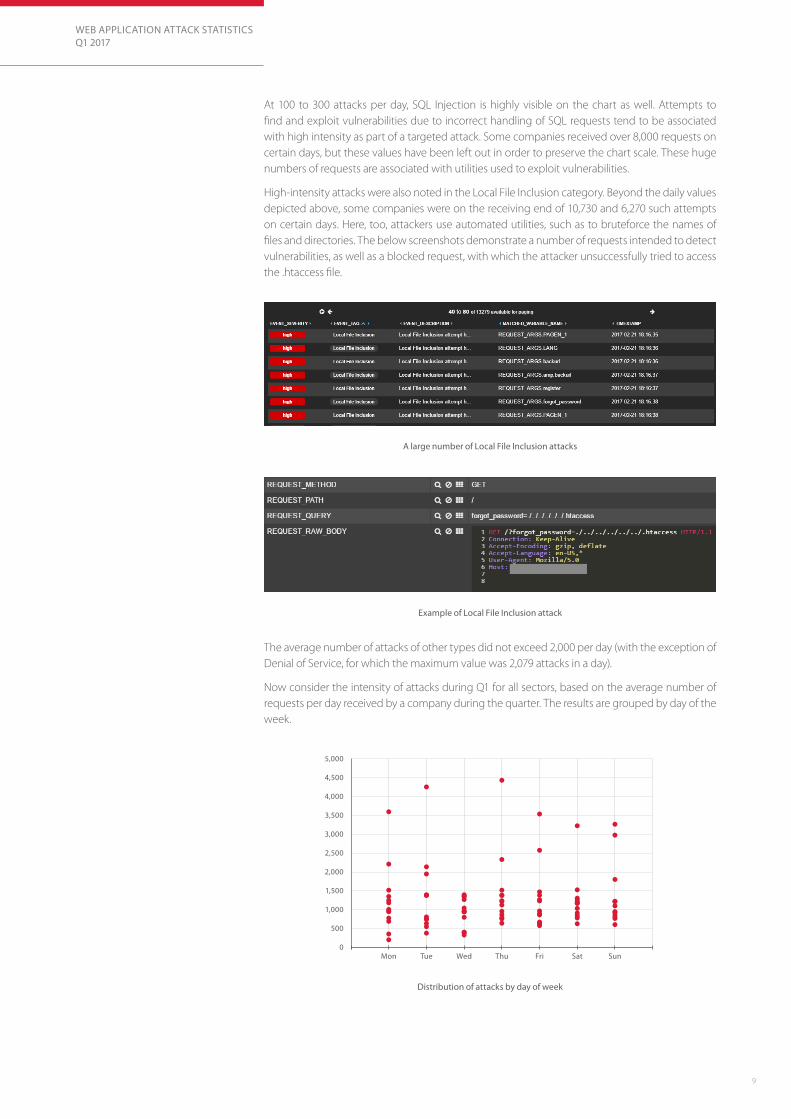
At 100 to 300 attacks per day, SQL Injection is highly visible on the chart as well. Attempts to find and exploit vulnerabilities due to incorrect handling of SQL requests tend to be associated with high intensity as part of a targeted attack. Some companies received over 8,000 requests on certain days, but these values have been left out in order to preserve the chart scale. These huge numbers of requests are associated with utilities used to exploit vulnerabilities.
High-intensity attacks were also noted in the Local File Inclusion category. Beyond the daily values depicted above, some companies were on the receiving end of 10,730 and 6,270 such attempts on certain days. Here, too, attackers use automated utilities, such as to bruteforce the names of files and directories. The below screenshots demonstrate a number of requests intended to detect vulnerabilities, as well as a blocked request, with which the attacker unsuccessfully tried to access the .htaccess file.
A large number of Local File Inclusion attacks
Example of Local File Inclusion attack
Distribution of attacks by day of week
The average number of attacks of other types did not exceed 2,000 per day (with the exception of Denial of Service, for which the maximum value was 2,079 attacks in a day).
Now consider the intensity of attacks during Q1 for all sectors, based on the average number of requests per day received by a company during the quarter. The results are grouped by day of the week.
0
500
1,000
1,500
2,000
2,500
3,000
3,500
4,000
4,500
5,000
Mon Tue Wed Thu Fri Sat Sun
WEB APPLICATION ATTACK STATISTICS Q1 2017
10
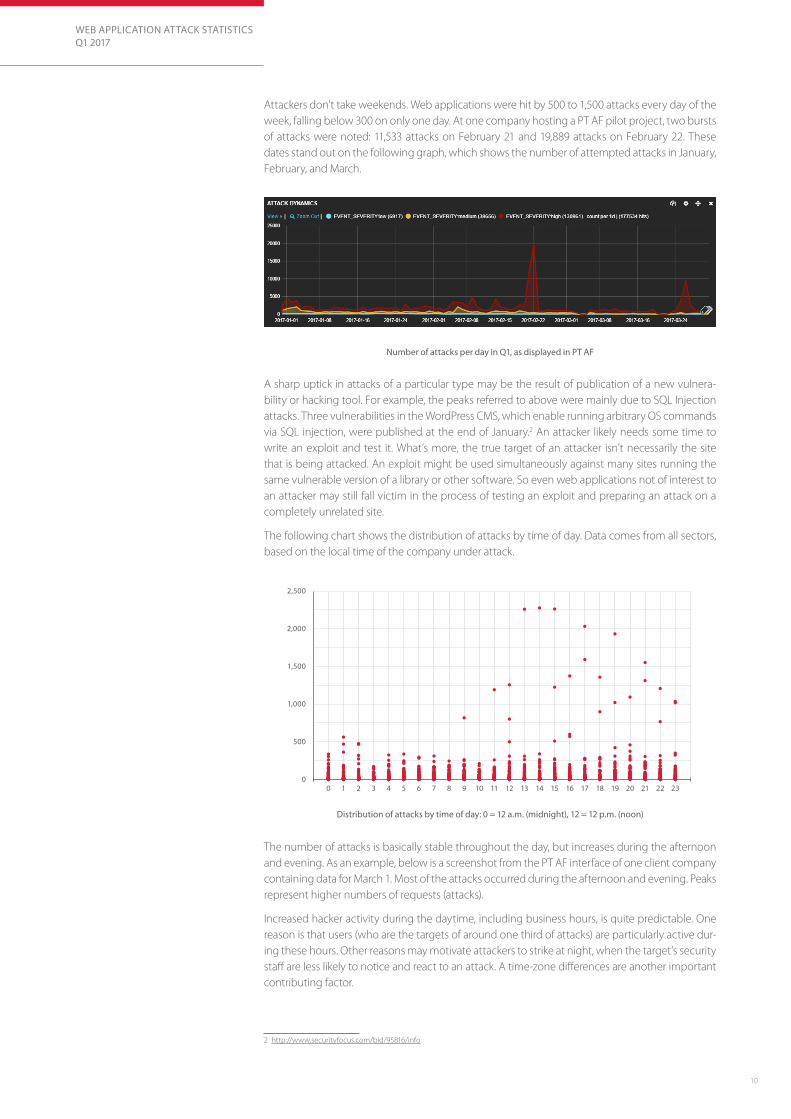
A sharp uptick in attacks of a particular type may be the result of publication of a new vulnera-bility or hacking tool. For example, the peaks referred to above were mainly due to SQL Injection attacks. Three vulnerabilities in the WordPress CMS, which enable running arbitrary OS commands via SQL injection, were published at the end of January.2 An attacker likely needs some time to write an exploit and test it. What’s more, the true target of an attacker isn’t necessarily the site that is being attacked. An exploit might be used simultaneously against many sites running the same vulnerable version of a library or other software. So even web applications not of interest to an attacker may still fall victim in the process of testing an exploit and preparing an attack on a completely unrelated site.
The following chart shows the distribution of attacks by time of day. Data comes from all sectors, based on the local time of the company under attack.
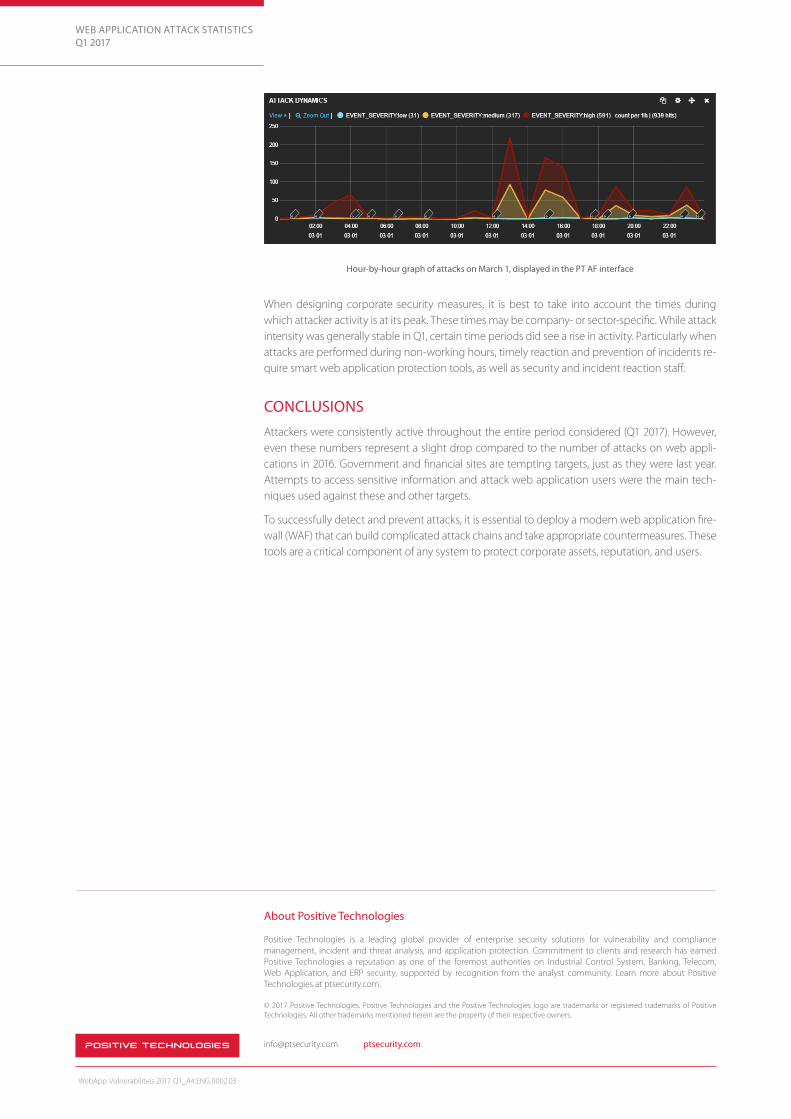
The number of attacks is basically stable throughout the day, but increases during the afternoon and evening. As an example, below is a screenshot from the PT AF interface of one client company containing data for March 1. Most of the attacks occurred during the afternoon and evening. Peaks represent higher numbers of requests (attacks).
Increased hacker activity during the daytime, including business hours, is quite predictable. One reason is that users (who are the targets of around one third of attacks) are particularly active dur-ing these hours. Other reasons may motivate attackers to strike at night, when the target’s security staff are less likely to notice and react to an attack. A time-zone differences are another important contributing factor.
2 http://www.securityfocus.com/bid/95816/info
Attackers don’t take weekends. Web applications were hit by 500 to 1,500 attacks every day of the week, falling below 300 on only one day. At one company hosting a PT AF pilot project, two bursts of attacks were noted: 11,533 attacks on February 21 and 19,889 attacks on February 22. These dates stand out on the following graph, which shows the number of attempted attacks in January, February, and March.
Number of attacks per day in Q1, as displayed in PT AF
Distribution of attacks by time of day: 0 = 12 a.m. (midnight), 12 = 12 p.m. (noon)
0
500
1,000
1,500
2,000
2,500
0 1 2 3 4 5 6 7 8 9 10 11 12 13 14 15 16 17 18 19 20 21 22 23
WEB APPLICATION ATTACK STATISTICS Q1 2017
WebApp-Vulnerabilities-2017-Q1_A4.ENG.0002.03
Hour-by-hour graph of attacks on March 1, displayed in the PT AF interface
When designing corporate security measures, it is best to take into account the times during which attacker activity is at its peak. These times may be company- or sector-specific. While attack intensity was generally stable in Q1, certain time periods did see a rise in activity. Particularly when attacks are performed during non-working hours, timely reaction and prevention of incidents re-quire smart web application protection tools, as well as security and incident reaction staff.
CONCLUSIONS
Attackers were consistently active throughout the entire period considered (Q1 2017). However, even these numbers represent a slight drop compared to the number of attacks on web appli-cations in 2016. Government and financial sites are tempting targets, just as they were last year. Attempts to access sensitive information and attack web application users were the main tech-niques used against these and other targets.
To successfully detect and prevent attacks, it is essential to deploy a modern web application fire-wall (WAF) that can build complicated attack chains and take appropriate countermeasures. These tools are a critical component of any system to protect corporate assets, reputation, and users.
[email protected] ptsecurity.com
About Positive Technologies
Positive Technologies is a leading global provider of enterprise security solutions for vulnerability and compliance management, incident and threat analysis, and application protection. Commitment to clients and research has earned Positive Technologies a reputation as one of the foremost authorities on Industrial Control System, Banking, Telecom, Web Application, and ERP security, supported by recognition from the analyst community. Learn more about Positive Technologies at ptsecurity.com.
© 2017 Positive Technologies. Positive Technologies and the Positive Technologies logo are trademarks or registered trademarks of Positive Technologies. All other trademarks mentioned herein are the property of their respective owners.