Embed Size (px)
Citation preview
Attentional Road Safety NetworksSonu GuptaIIIT-Delhi
Deepak SrivatsavIIIT-Delhi
A. V. SubramanyamIIIT-Delhi
Ponnurangam KumaraguruIIIT-Delhi, IIIT-Hyderabad
[email protected],[email protected]
ABSTRACTRoad safety mapping using satellite images is a cost-effective but achallenging problem for smart city planning. The scarcity of labeleddata, misalignment and ambiguitymakes it hard for supervised deepnetworks to learn efficient embeddings in order to classify betweensafe and dangerous road segments. In this paper, we address thechallenges using a region guided attention network. In our model,we extract global features from a base network and augment it withlocal features obtained using the region guided attention network.In addition, we perform domain adaptation for unlabeled target data.In order to bridge the gap between safe samples and dangeroussamples from source and target respectively, we propose a lossfunction based on within and between class covariance matrices.We conduct experiments on a public dataset of London to show thatthe algorithm achieves significant results with the classificationaccuracy of 86.21%. We obtain an increase of 4% accuracy for NYCusing domain adaptation network. Besides, we perform a user studyand demonstrate that our proposed algorithm achieves 23.12% betteraccuracy compared to subjective analysis.
KEYWORDSRoad safety, Region guided network, Domain Adaptation
1 INTRODUCTIONRoad accidents remain one of the pressing communal welfare con-cerns. Regardless of notable advancements in the field of vehicletechnology and road engineering, on a global scale, traffic accidentsare one of the leading causes of premature death and injury. Ac-cording to official statistics from the World Health Organization(WHO), more than 1.25 million people die every year due to trafficaccidents. Besides, traffic accidents cost many countries up to 3%of their GDP [21]. Therefore, minimizing the road accidents is aworldwide challenge and can benefit a majority of the nations indifferent ways. Towards this, it is important to understand whichroad segments are potentially dangerous or safe.
Few works have shown the influence of environmental factorslike weather, light condition on road accidents [4, 7, 25]. However,gathering such data is costly and laborious. Further, due to lackof resources and technology, such data is not maintained properlyin most low and middle-income nations and unfortunately, theseare the nations which suffer dreadfully from traffic accidents [23].Hence, there is a need for an efficient approach which can workwell with easily available and affordable data. To this end, satelliteimages are used for road safety mapping [19]. However, the datasetis mostly imbalanced, and percentage of the safe class is far more
compared to the dangerous class. Further, the images are misaligned.Thus, using such data for training efficient supervised models isanother challenge.
Domain A Domain B
Satellite Image Satellite Image
Dan
gero
us Safe
Reg
ion
Gui
ded
Att
entio
n N
etw
ork
Learned Model - I
Learned Model - I
Predictionsfor
Domain APs
eudo
Dan
gero
us PseudoSafe
Region G
uidedA
ttention Netw
ork+ D
omain A
daptation L
oss Function
Learned Model - II
Predictionsfor
Domain B
Figure 1: A deep learning framework to predict city-scalesafetymaps using raw satellite images forDomainA (Sourcecity) and Domain B (Target city) such that labels are avail-able only for Domain A.
In addition, it has been observed that models trained using clas-sical machine learning techniques for one region do not performwell if tested on regions that differ immensely in terms of trafficregulations, city planning, architecture, etc. [19]. Also, it is quite in-convenient to obtain traffic accident data for every different regionand train a model for the same. Therefore, the difference in domainsis yet another challenge in the effective road safety mapping.
To address these challenges, we propose a deep region guidedattention network as shown in Figure 1. We use a base network
arX
iv:1
812.
0486
0v2
[cs
.CV
] 2
6 Ja
n 20
19
(ResNet-50) to extract global features. We further use a sub-networkwhich can attend to individual subregions. Towards this, we extractthe conv 2 layer features and divide them into N non-overlappingregions. Region or part based networks have shown good accuracyin re-identification tasks [30]. We further augment this networkto adapt to different domains. We use a loss function based on thecovariance matrix to minimize the gap between the source andtarget domains. Our contributions are:
• We propose a deep learning framework that uses the regionguided attention network to predict accurate city-scale safetymaps from satellite images.
• We propose a domain adaptation network with a trainingloss which minimizes the Frobenius norm of the differenceof within class covariance matrices of source and target, aswell as the difference of between class covariance matricesof source and target.
The rest of this paper is organized as follows. The related workis discussed in section 2. Section 3 presents the data sources andcollection technique and also introduces the formulation of theproblem. Our approach is explained in section 4. Section 5 shows auser-study followed by Section 6, which describes our experiments.Finally, the paper is concluded in section 7.
2 RELATEDWORKIn this section, we briefly outline an overview of studies on accidenthotspot detection (also known as, black spots and black zones),understanding road accidents, and lastly, the city-scale road-safetymapping that exploits recent advancements in the field of deeplearning.
There are few studies on the detection of high-density accidenthotspots. Kernel density estimation and clustering have been usedto create classifiers to identify accident hotspots [1, 3]. Anotherinteresting work includes the use of Bayesian statistics to predictaccidents [10]. Fawcett et al. presented a Bayesian hierarchicalmodel to rank accident hotspots in line with their possibility tosurpass a threshold accident count in some future time period.Researchers have developed models to estimate the total number ofcrashes, the number of injury crashes, and the number of propertydamages and proved that the models are statistically meaningfuland closer to real-world data [22]. In addition, association ruleshave been used for the identification of accident situations thatfrequently occur together [9, 14, 15]. Gomes proposed a model foraccident frequency estimation which takes the influence of the roadcharacteristics into account.
In the recent past, the remarkable progress in deep learning hascontributed significantly to the field of computer vision. Spatio-temporal data have been used by researchers to predict the numberof accidents in a given area with the help of ConvLSTM [28]. Chenet al. developed a Stacked Denoising Autoencoder for prediction oftraffic accident risk level at the city-scale using real-time GPS dataof users. In a similar study, Najjar et al. demonstrate that visualattributes captured in satellite image can be used as a proxy sig-nal of road safety. They proposed a deep-learning based mappingframework that exploits open data to predict city-scale safety mapsat bearable costs. However, the distinction among the above frame-works resides in their application itself. Both [6, 28] are interested in
the real-time prediction of traffic accidents, whereas [19] is inclinedtowards assisting in informed decision-making for city-planningand policy formulation when heterogeneous data is not accessibleor bearable. Our work is closer in spirit to Najjar et al.; however,there are three major differences. First, we only consider safe anddangerous classes compared to an additional neutral class definedby Najjar et al. This is because a neutral road segment may not as-sert a strong decision making during road safety planning. Second,the authors extract features from AlexNet, whereas, we propose anovel architecture. Third, we also perform domain adaptation forthe unlabeled target domain. Our two major goals are as follows.First, we propose a region guided attention network to generatea city-scale safety map. Second, we propose a domain adaptationtechnique to generate safety maps where traffic accident data is notavailable.
Domain Adaptation is a branch of machine learning in which weaim at learning a well performing network from a source data thatcan generalize well on a different but related target data distribution[2]. It has been widely studied in visual applications [8, 27]. Oneof the popular class of algorithms is discrepancy based methods[18, 24, 26]. In particular, Sun and Saenko propose to minimizethe Frobenius norm of the difference between the feature covari-ance matrix of source and target. In our case, we also make useof the labels available for source and pseudo-labels for the target.These pseudo-labels are determined by the model trained on thesource data. We then compute the feature covariance matrix forsafe and dangerous classes respectively. Further, we compute ourdomain adaptation loss function based on within and between classcovariance matrices of source and target.
3 OVERVIEWIn this section, we present the data that we use at various stages ofthe work. We also introduce the formulation of our problem.
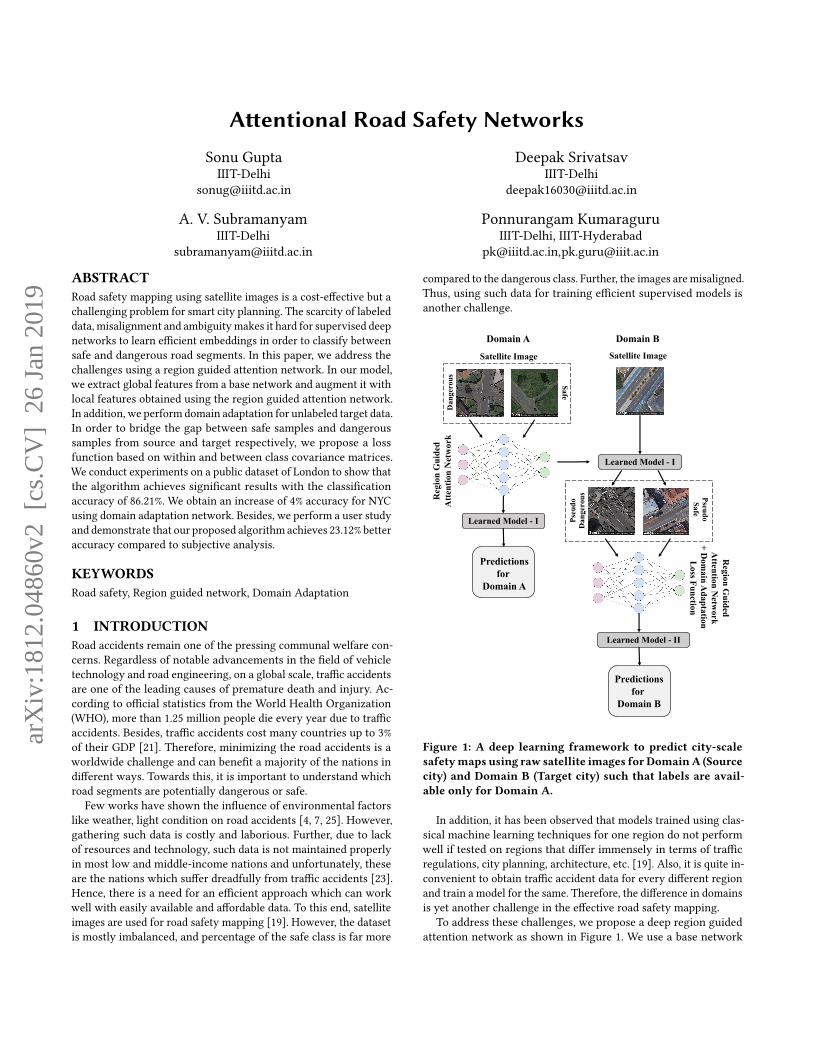
3.1 DataWe select two cities, London (UK) and New York City (USA) forthe purpose of this study. Our reason for selecting these two citiesis two-fold. First, the availability of sufficient data to work on andsecond, the extreme difference in traffic regulations, city planning,architecture etc. Figure 2 shows the difference in the street networkorientation of both the cities [5]. All the data that we use in this workare available as open data. Open data is the scheme under whichsome datasets are freely available to use and republish, without anyrestrictions [11]. We also present results for Denver (USA) whichis altogether a different domain.
Traffic Accident Data: We collected 99,516 traffic accidentrecords for London from 2013 to 2016.1 We gathered 1,256,205 traf-fic accident reports for New York City (NYC) from 2012 to 2017.2Similarly, we collected 143,776 traffic accident reports for Denverfrom 2013 to 2017.3 Each record has numerous attributes such aslatitude, longitude, date, time, vehicle type etc. However, there isa difference in the datasets. Table 1 presents sample records from
1https://www.europeandataportal.eu/data/en/dataset/road-accidents-safety-data
2https://opendata.cityofnewyork.us3https://www.denvergov.org/opendata/dataset/city-and-county-of-denver-
traffic-accidents
2
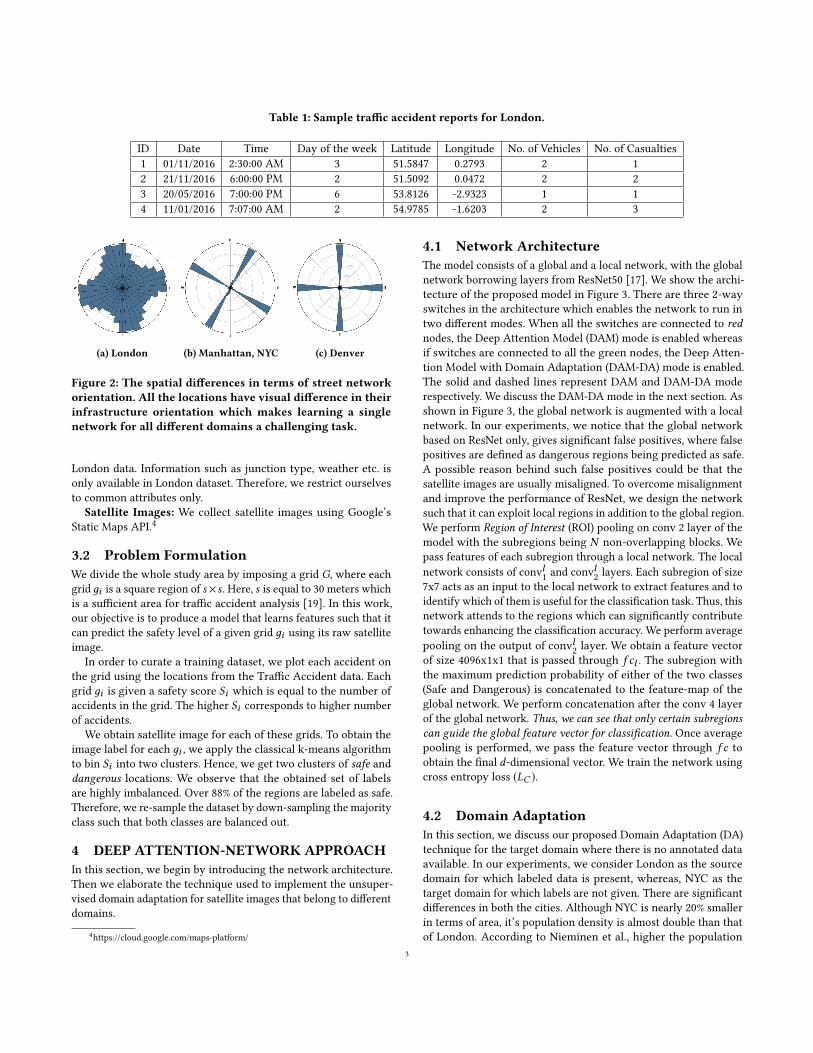
Table 1: Sample traffic accident reports for London.
ID Date Time Day of the week Latitude Longitude No. of Vehicles No. of Casualties1 01/11/2016 2:30:00 AM 3 51.5847 0.2793 2 12 21/11/2016 6:00:00 PM 2 51.5092 0.0472 2 23 20/05/2016 7:00:00 PM 6 53.8126 -2.9323 1 14 11/01/2016 7:07:00 AM 2 54.9785 -1.6203 2 3
(a) London (b) Manhattan, NYC (c) Denver
Figure 2: The spatial differences in terms of street networkorientation. All the locations have visual difference in theirinfrastructure orientation which makes learning a singlenetwork for all different domains a challenging task.
London data. Information such as junction type, weather etc. isonly available in London dataset. Therefore, we restrict ourselvesto common attributes only.
Satellite Images: We collect satellite images using Google’sStatic Maps API.4
3.2 Problem FormulationWe divide the whole study area by imposing a grid G, where eachgrid дi is a square region of s×s . Here, s is equal to 30meters whichis a sufficient area for traffic accident analysis [19]. In this work,our objective is to produce a model that learns features such that itcan predict the safety level of a given grid дi using its raw satelliteimage.
In order to curate a training dataset, we plot each accident onthe grid using the locations from the Traffic Accident data. Eachgrid дi is given a safety score Si which is equal to the number ofaccidents in the grid. The higher Si corresponds to higher numberof accidents.
We obtain satellite image for each of these grids. To obtain theimage label for each дi , we apply the classical k-means algorithmto bin Si into two clusters. Hence, we get two clusters of safe anddangerous locations. We observe that the obtained set of labelsare highly imbalanced. Over 88% of the regions are labeled as safe.Therefore, we re-sample the dataset by down-sampling the majorityclass such that both classes are balanced out.
4 DEEP ATTENTION-NETWORK APPROACHIn this section, we begin by introducing the network architecture.Then we elaborate the technique used to implement the unsuper-vised domain adaptation for satellite images that belong to differentdomains.
4https://cloud.google.com/maps-platform/
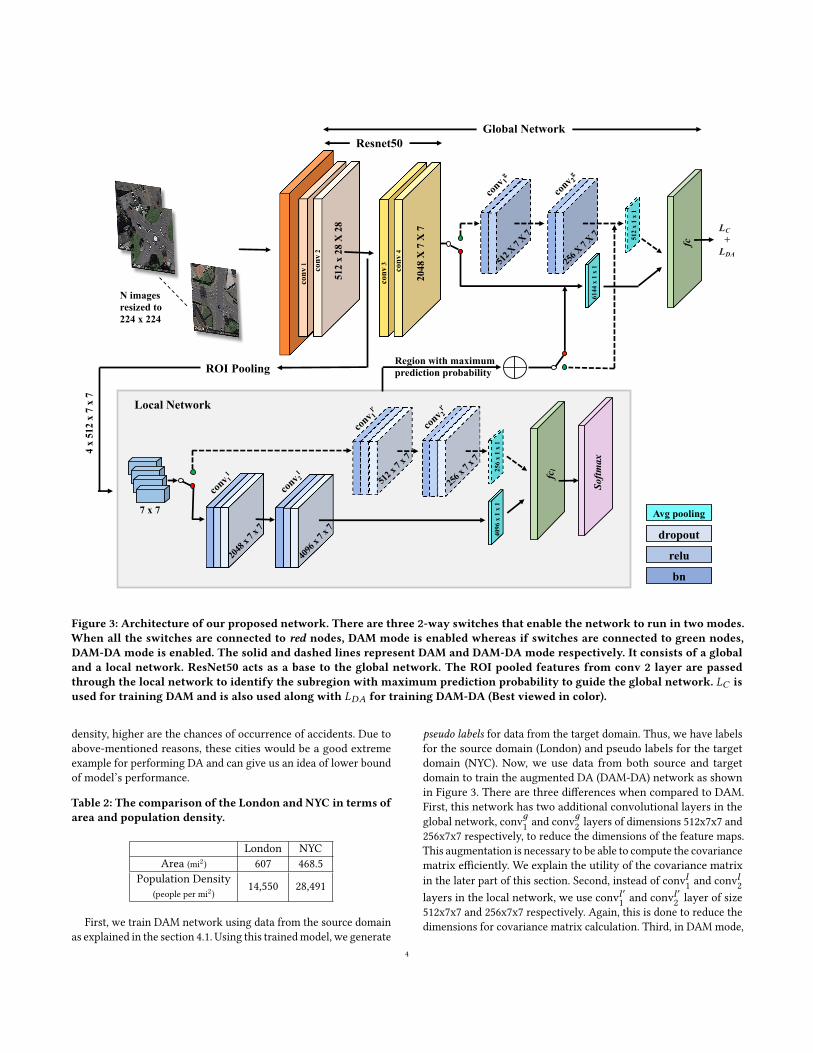
4.1 Network ArchitectureThe model consists of a global and a local network, with the globalnetwork borrowing layers from ResNet50 [17]. We show the archi-tecture of the proposed model in Figure 3. There are three 2-wayswitches in the architecture which enables the network to run intwo different modes. When all the switches are connected to rednodes, the Deep Attention Model (DAM) mode is enabled whereasif switches are connected to all the green nodes, the Deep Atten-tion Model with Domain Adaptation (DAM-DA) mode is enabled.The solid and dashed lines represent DAM and DAM-DA moderespectively. We discuss the DAM-DA mode in the next section. Asshown in Figure 3, the global network is augmented with a localnetwork. In our experiments, we notice that the global networkbased on ResNet only, gives significant false positives, where falsepositives are defined as dangerous regions being predicted as safe.A possible reason behind such false positives could be that thesatellite images are usually misaligned. To overcome misalignmentand improve the performance of ResNet, we design the networksuch that it can exploit local regions in addition to the global region.We perform Region of Interest (ROI) pooling on conv 2 layer of themodel with the subregions being N non-overlapping blocks. Wepass features of each subregion through a local network. The localnetwork consists of convl1 and convl2 layers. Each subregion of size7x7 acts as an input to the local network to extract features and toidentify which of them is useful for the classification task. Thus, thisnetwork attends to the regions which can significantly contributetowards enhancing the classification accuracy. We perform averagepooling on the output of convl2 layer. We obtain a feature vectorof size 4096x1x1 that is passed through f cl . The subregion withthe maximum prediction probability of either of the two classes(Safe and Dangerous) is concatenated to the feature-map of theglobal network. We perform concatenation after the conv 4 layerof the global network. Thus, we can see that only certain subregionscan guide the global feature vector for classification. Once averagepooling is performed, we pass the feature vector through f c toobtain the final d-dimensional vector. We train the network usingcross entropy loss (LC ).
4.2 Domain AdaptationIn this section, we discuss our proposed Domain Adaptation (DA)technique for the target domain where there is no annotated dataavailable. In our experiments, we consider London as the sourcedomain for which labeled data is present, whereas, NYC as thetarget domain for which labels are not given. There are significantdifferences in both the cities. Although NYC is nearly 20% smallerin terms of area, it’s population density is almost double than thatof London. According to Nieminen et al., higher the population
3
N imagesresized to224 x 224
conv
1
conv
2
conv
3
conv
4
512
x 28
X 2
8
2048
X 7
X 7
fc
7 x 7
512
x 1
x 1
6144
x 1
x 1
fcl25
6 x
1 x
140
96 x
1 x
1
Softmax
ROI Pooling
4 x
512
x 7
x 7
bn
relu
dropout
LC+LDA
Region with maximumprediction probability
Avg pooling
Local Network
Resnet50Global Network
Figure 3: Architecture of our proposed network. There are three 2-way switches that enable the network to run in two modes.When all the switches are connected to red nodes, DAM mode is enabled whereas if switches are connected to green nodes,DAM-DA mode is enabled. The solid and dashed lines represent DAM and DAM-DA mode respectively. It consists of a globaland a local network. ResNet50 acts as a base to the global network. The ROI pooled features from conv 2 layer are passedthrough the local network to identify the subregion with maximum prediction probability to guide the global network. LC isused for training DAM and is also used along with LDA for training DAM-DA (Best viewed in color).
density, higher are the chances of occurrence of accidents. Due toabove-mentioned reasons, these cities would be a good extremeexample for performing DA and can give us an idea of lower boundof model’s performance.
Table 2: The comparison of the London and NYC in terms ofarea and population density.
London NYCArea (mi2) 607 468.5
Population Density(people per mi2)
14,550 28,491
First, we train DAM network using data from the source domainas explained in the section 4.1. Using this trainedmodel, we generate
pseudo labels for data from the target domain. Thus, we have labelsfor the source domain (London) and pseudo labels for the targetdomain (NYC). Now, we use data from both source and targetdomain to train the augmented DA (DAM-DA) network as shownin Figure 3. There are three differences when compared to DAM.First, this network has two additional convolutional layers in theglobal network, convд1 and convд2 layers of dimensions 512x7x7 and256x7x7 respectively, to reduce the dimensions of the feature maps.This augmentation is necessary to be able to compute the covariancematrix efficiently. We explain the utility of the covariance matrixin the later part of this section. Second, instead of convl1 and convl2layers in the local network, we use convl
′1 and convl
′2 layer of size
512x7x7 and 256x7x7 respectively. Again, this is done to reduce thedimensions for covariance matrix calculation. Third, in DAM mode,
4
we train the network using LC only, but in DAM-DA mode we usedomain adaptation loss (LDA) along with LC . We explain LDA next.
Let xi denote the feature for i-th sample classified as dangerousin source domain. Similarly, let yi be the feature for i-th sampleclassified as safe in source domain. These features are obtainedfrom the final layer (f c) of the network as shown in Figure 3. Now,we can obtain the within class covariance matrix
∑SW ∈ Rd×d as,∑
SW=∑
i, j,i(xi − x j )(xi − x j )T
+∑
i, j,i(yi − yj )(yi − yj )T
(1)
Similarly, we can compute the between class covariance matrix∑SB ∈ Rd×d as,∑
SB=∑
i, j(xi − yj )(xi − yj )T (2)
We can compute thewithin and between class covariancematricesfor target domain in a similar manner. Let these be denoted by
∑TW
and∑T B respectively. Then, we use the following loss function to
adapt to the target domain,
LDA = ∑
SW−∑
TW
2F+
∑SB
−∑
T B
2F
(3)
where ∥.∥F denotes the Frobenius norm. Though the pseudo labelsare noisy, it is still beneficial to use them. In our experiments, wedemonstrate that using the loss to minimize the distance betweenfeature covariance matrices between source and target, which isagnostic of source labels, achieves sub-par performance when com-pared to LDA.
5 USER STUDYWe conduct a study with an aim to observe that how accuratelyhumans can classify raw satellite images as safe or dangerous. It’sfirst of its kind user study. We develop an annotation portal andprovide the raw satellite images from our test-data to the users.The portal has two sections. In the first section, we provide foursample images from each category. In the second section, an imageis presented to the user along with three options to choose from.A user can mark an image as dangerous, safe or unsure. We showthe same image to three different users and record their responseto maintain the confidence in the user’s response. We also addsixteen more sample images from each class to help the user. Werecord users’ response for 1,000 images having 500 images fromeach category, i.e., safe and dangerous classes.
In this study, 38 users participated. All the participants are above18 years of age. To check inter-annotator agreement, we computeFleiss’ kappa [13]. We achieve 0.2743 which depicts a fair agree-ment. To assign a final label to the image, we calculate the mode ofall three responses. If all the responses are different, we discard thatresponse. In our study, we found 0.03% of such responses and dis-carded them. Finally, 67.22%, 27.94%, and 4.84% images are markedas safe, dangerous, and unsure respectively by users. In Table 3,we provide a complete description of the user-study results. With80.32% accuracy, users are able to detect safe images whereas theaccuracy drops to 45.02% for dangerous images. Therefore, in thiscase, we find that humans can identify safe locations with betteraccuracy than dangerous locations.
Table 3: The complete description of the user-study outcome(in %).
PredictedSafe Dangerous Unsure
Actual Safe 40.41 05.56 4.32
Dangerous 26.80 22.37 0.51
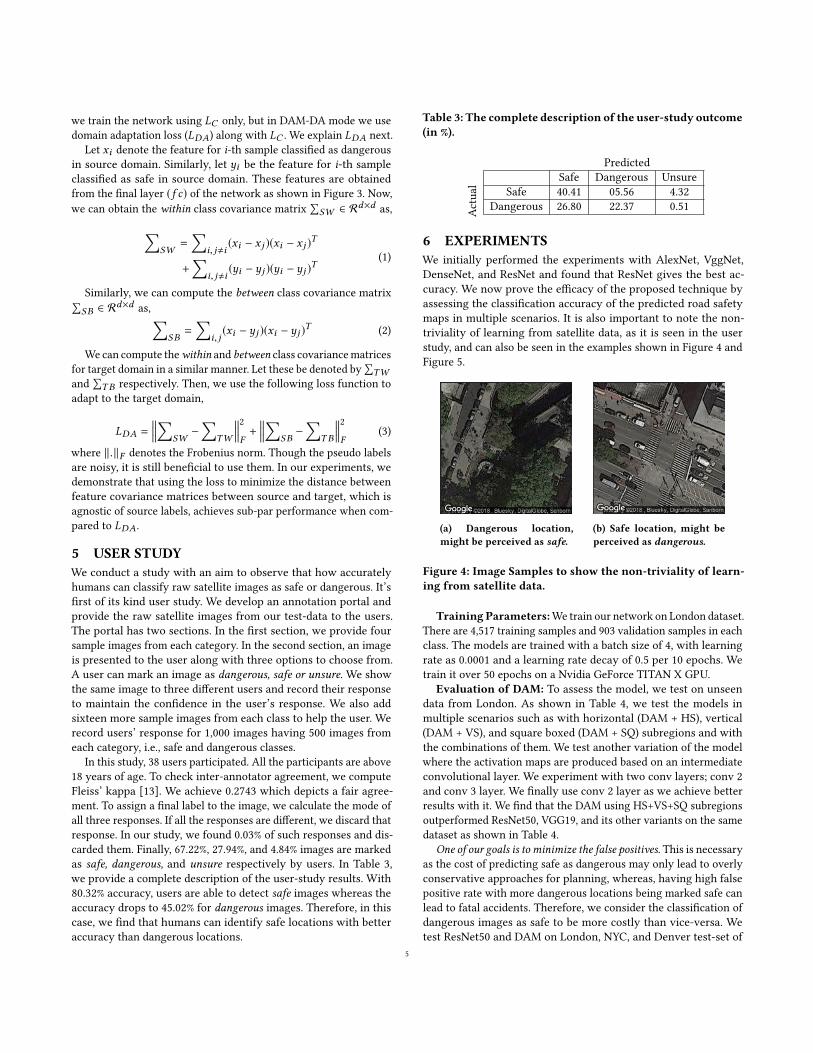
6 EXPERIMENTSWe initially performed the experiments with AlexNet, VggNet,DenseNet, and ResNet and found that ResNet gives the best ac-curacy. We now prove the efficacy of the proposed technique byassessing the classification accuracy of the predicted road safetymaps in multiple scenarios. It is also important to note the non-triviality of learning from satellite data, as it is seen in the userstudy, and can also be seen in the examples shown in Figure 4 andFigure 5.
(a) Dangerous location,might be perceived as safe.
(b) Safe location, might beperceived as dangerous.
Figure 4: Image Samples to show the non-triviality of learn-ing from satellite data.
Training Parameters:We train our network on London dataset.There are 4,517 training samples and 903 validation samples in eachclass. The models are trained with a batch size of 4, with learningrate as 0.0001 and a learning rate decay of 0.5 per 10 epochs. Wetrain it over 50 epochs on a Nvidia GeForce TITAN X GPU.
Evaluation of DAM: To assess the model, we test on unseendata from London. As shown in Table 4, we test the models inmultiple scenarios such as with horizontal (DAM + HS), vertical(DAM + VS), and square boxed (DAM + SQ) subregions and withthe combinations of them. We test another variation of the modelwhere the activation maps are produced based on an intermediateconvolutional layer. We experiment with two conv layers; conv 2and conv 3 layer. We finally use conv 2 layer as we achieve betterresults with it. We find that the DAM using HS+VS+SQ subregionsoutperformed ResNet50, VGG19, and its other variants on the samedataset as shown in Table 4.
One of our goals is to minimize the false positives. This is necessaryas the cost of predicting safe as dangerous may only lead to overlyconservative approaches for planning, whereas, having high falsepositive rate with more dangerous locations being marked safe canlead to fatal accidents. Therefore, we consider the classification ofdangerous images as safe to be more costly than vice-versa. Wetest ResNet50 and DAM on London, NYC, and Denver test-set of
5
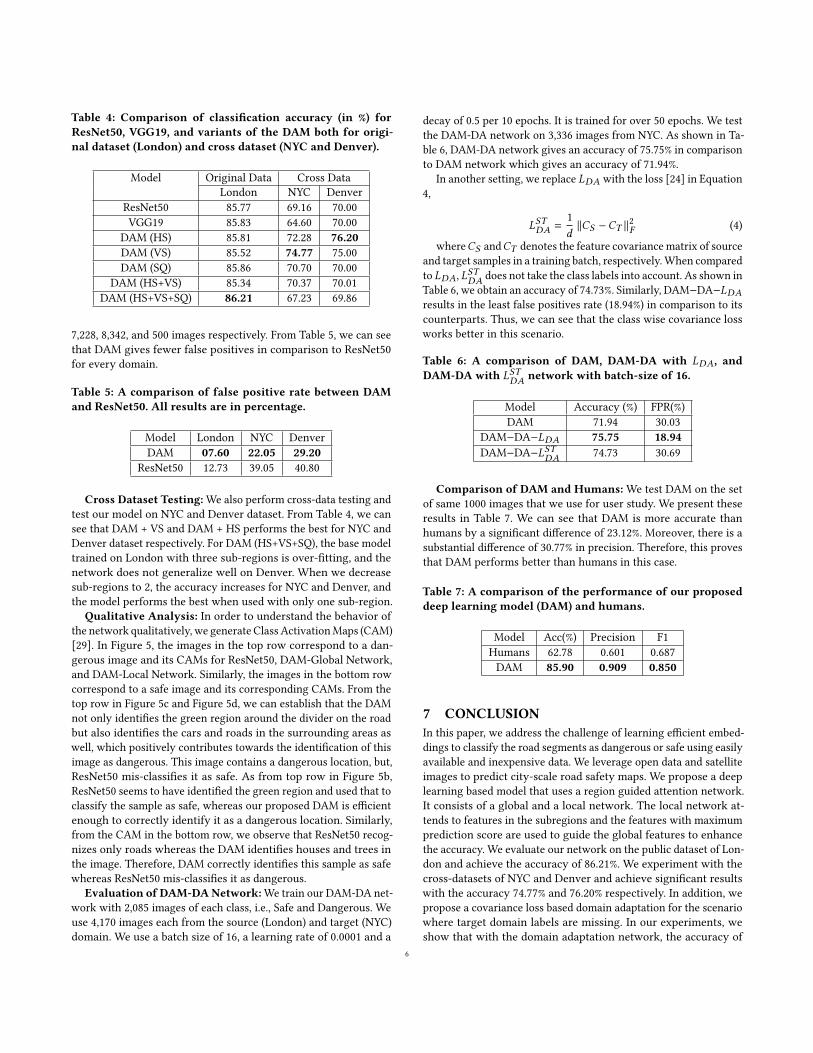
Table 4: Comparison of classification accuracy (in %) forResNet50, VGG19, and variants of the DAM both for origi-nal dataset (London) and cross dataset (NYC and Denver).
Model Original Data Cross DataLondon NYC Denver
ResNet50 85.77 69.16 70.00VGG19 85.83 64.60 70.00
DAM (HS) 85.81 72.28 76.20DAM (VS) 85.52 74.77 75.00DAM (SQ) 85.86 70.70 70.00
DAM (HS+VS) 85.34 70.37 70.01DAM (HS+VS+SQ) 86.21 67.23 69.86
7,228, 8,342, and 500 images respectively. From Table 5, we can seethat DAM gives fewer false positives in comparison to ResNet50for every domain.
Table 5: A comparison of false positive rate between DAMand ResNet50. All results are in percentage.
Model London NYC DenverDAM 07.60 22.05 29.20
ResNet50 12.73 39.05 40.80
Cross Dataset Testing:We also perform cross-data testing andtest our model on NYC and Denver dataset. From Table 4, we cansee that DAM + VS and DAM + HS performs the best for NYC andDenver dataset respectively. For DAM (HS+VS+SQ), the base modeltrained on London with three sub-regions is over-fitting, and thenetwork does not generalize well on Denver. When we decreasesub-regions to 2, the accuracy increases for NYC and Denver, andthe model performs the best when used with only one sub-region.
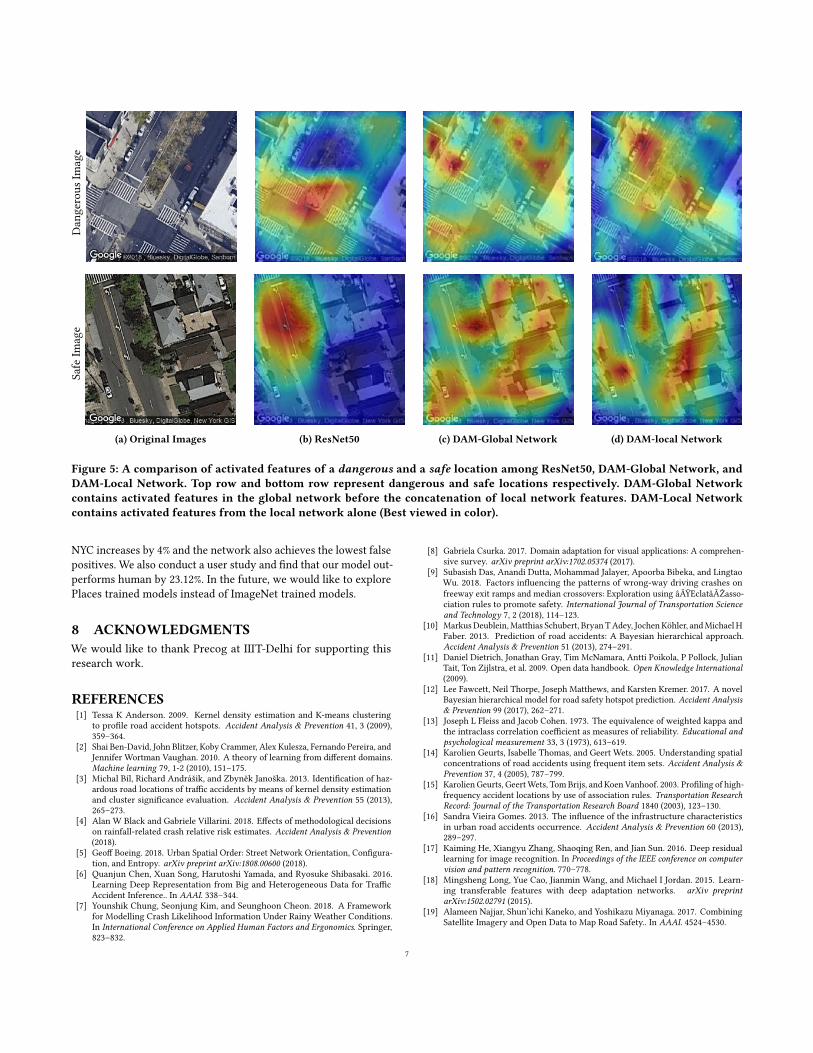
Qualitative Analysis: In order to understand the behavior ofthe network qualitatively, we generate Class ActivationMaps (CAM)[29]. In Figure 5, the images in the top row correspond to a dan-gerous image and its CAMs for ResNet50, DAM-Global Network,and DAM-Local Network. Similarly, the images in the bottom rowcorrespond to a safe image and its corresponding CAMs. From thetop row in Figure 5c and Figure 5d, we can establish that the DAMnot only identifies the green region around the divider on the roadbut also identifies the cars and roads in the surrounding areas aswell, which positively contributes towards the identification of thisimage as dangerous. This image contains a dangerous location, but,ResNet50 mis-classifies it as safe. As from top row in Figure 5b,ResNet50 seems to have identified the green region and used that toclassify the sample as safe, whereas our proposed DAM is efficientenough to correctly identify it as a dangerous location. Similarly,from the CAM in the bottom row, we observe that ResNet50 recog-nizes only roads whereas the DAM identifies houses and trees inthe image. Therefore, DAM correctly identifies this sample as safewhereas ResNet50 mis-classifies it as dangerous.
Evaluation of DAM-DANetwork:We train our DAM-DA net-work with 2,085 images of each class, i.e., Safe and Dangerous. Weuse 4,170 images each from the source (London) and target (NYC)domain. We use a batch size of 16, a learning rate of 0.0001 and a
decay of 0.5 per 10 epochs. It is trained for over 50 epochs. We testthe DAM-DA network on 3,336 images from NYC. As shown in Ta-ble 6, DAM-DA network gives an accuracy of 75.75% in comparisonto DAM network which gives an accuracy of 71.94%.
In another setting, we replace LDA with the loss [24] in Equation4,
LSTDA =1d∥CS −CT ∥2F (4)
whereCS andCT denotes the feature covariance matrix of sourceand target samples in a training batch, respectively.When comparedto LDA, LSTDA does not take the class labels into account. As shown inTable 6, we obtain an accuracy of 74.73%. Similarly, DAM−DA−LDAresults in the least false positives rate (18.94%) in comparison to itscounterparts. Thus, we can see that the class wise covariance lossworks better in this scenario.
Table 6: A comparison of DAM, DAM-DA with LDA, andDAM-DA with LSTDA network with batch-size of 16.
Model Accuracy (%) FPR(%)DAM 71.94 30.03
DAM−DA−LDA 75.75 18.94DAM−DA−LSTDA 74.73 30.69
Comparison of DAM and Humans: We test DAM on the setof same 1000 images that we use for user study. We present theseresults in Table 7. We can see that DAM is more accurate thanhumans by a significant difference of 23.12%. Moreover, there is asubstantial difference of 30.77% in precision. Therefore, this provesthat DAM performs better than humans in this case.
Table 7: A comparison of the performance of our proposeddeep learning model (DAM) and humans.
Model Acc(%) Precision F1Humans 62.78 0.601 0.687DAM 85.90 0.909 0.850
7 CONCLUSIONIn this paper, we address the challenge of learning efficient embed-dings to classify the road segments as dangerous or safe using easilyavailable and inexpensive data. We leverage open data and satelliteimages to predict city-scale road safety maps. We propose a deeplearning based model that uses a region guided attention network.It consists of a global and a local network. The local network at-tends to features in the subregions and the features with maximumprediction score are used to guide the global features to enhancethe accuracy. We evaluate our network on the public dataset of Lon-don and achieve the accuracy of 86.21%. We experiment with thecross-datasets of NYC and Denver and achieve significant resultswith the accuracy 74.77% and 76.20% respectively. In addition, wepropose a covariance loss based domain adaptation for the scenariowhere target domain labels are missing. In our experiments, weshow that with the domain adaptation network, the accuracy of
6
Dangerous
Image
Safe
Image
(a) Original Images (b) ResNet50 (c) DAM-Global Network (d) DAM-local Network
Figure 5: A comparison of activated features of a dangerous and a safe location among ResNet50, DAM-Global Network, andDAM-Local Network. Top row and bottom row represent dangerous and safe locations respectively. DAM-Global Networkcontains activated features in the global network before the concatenation of local network features. DAM-Local Networkcontains activated features from the local network alone (Best viewed in color).
NYC increases by 4% and the network also achieves the lowest falsepositives. We also conduct a user study and find that our model out-performs human by 23.12%. In the future, we would like to explorePlaces trained models instead of ImageNet trained models.
8 ACKNOWLEDGMENTSWe would like to thank Precog at IIIT-Delhi for supporting thisresearch work.
REFERENCES[1] Tessa K Anderson. 2009. Kernel density estimation and K-means clustering
to profile road accident hotspots. Accident Analysis & Prevention 41, 3 (2009),359–364.
[2] Shai Ben-David, John Blitzer, Koby Crammer, Alex Kulesza, Fernando Pereira, andJennifer Wortman Vaughan. 2010. A theory of learning from different domains.Machine learning 79, 1-2 (2010), 151–175.
[3] Michal Bíl, Richard Andrášik, and Zbyněk Janoška. 2013. Identification of haz-ardous road locations of traffic accidents by means of kernel density estimationand cluster significance evaluation. Accident Analysis & Prevention 55 (2013),265–273.
[4] Alan W Black and Gabriele Villarini. 2018. Effects of methodological decisionson rainfall-related crash relative risk estimates. Accident Analysis & Prevention(2018).
[5] Geoff Boeing. 2018. Urban Spatial Order: Street Network Orientation, Configura-tion, and Entropy. arXiv preprint arXiv:1808.00600 (2018).
[6] Quanjun Chen, Xuan Song, Harutoshi Yamada, and Ryosuke Shibasaki. 2016.Learning Deep Representation from Big and Heterogeneous Data for TrafficAccident Inference.. In AAAI. 338–344.
[7] Younshik Chung, Seonjung Kim, and Seunghoon Cheon. 2018. A Frameworkfor Modelling Crash Likelihood Information Under Rainy Weather Conditions.In International Conference on Applied Human Factors and Ergonomics. Springer,823–832.
[8] Gabriela Csurka. 2017. Domain adaptation for visual applications: A comprehen-sive survey. arXiv preprint arXiv:1702.05374 (2017).
[9] Subasish Das, Anandi Dutta, Mohammad Jalayer, Apoorba Bibeka, and LingtaoWu. 2018. Factors influencing the patterns of wrong-way driving crashes onfreeway exit ramps and median crossovers: Exploration using âĂŸEclatâĂŹasso-ciation rules to promote safety. International Journal of Transportation Scienceand Technology 7, 2 (2018), 114–123.
[10] MarkusDeublein,Matthias Schubert, Bryan TAdey, JochenKöhler, andMichael HFaber. 2013. Prediction of road accidents: A Bayesian hierarchical approach.Accident Analysis & Prevention 51 (2013), 274–291.
[11] Daniel Dietrich, Jonathan Gray, Tim McNamara, Antti Poikola, P Pollock, JulianTait, Ton Zijlstra, et al. 2009. Open data handbook. Open Knowledge International(2009).
[12] Lee Fawcett, Neil Thorpe, Joseph Matthews, and Karsten Kremer. 2017. A novelBayesian hierarchical model for road safety hotspot prediction. Accident Analysis& Prevention 99 (2017), 262–271.
[13] Joseph L Fleiss and Jacob Cohen. 1973. The equivalence of weighted kappa andthe intraclass correlation coefficient as measures of reliability. Educational andpsychological measurement 33, 3 (1973), 613–619.
[14] Karolien Geurts, Isabelle Thomas, and Geert Wets. 2005. Understanding spatialconcentrations of road accidents using frequent item sets. Accident Analysis &Prevention 37, 4 (2005), 787–799.
[15] Karolien Geurts, GeertWets, TomBrijs, and Koen Vanhoof. 2003. Profiling of high-frequency accident locations by use of association rules. Transportation ResearchRecord: Journal of the Transportation Research Board 1840 (2003), 123–130.
[16] Sandra Vieira Gomes. 2013. The influence of the infrastructure characteristicsin urban road accidents occurrence. Accident Analysis & Prevention 60 (2013),289–297.
[17] Kaiming He, Xiangyu Zhang, Shaoqing Ren, and Jian Sun. 2016. Deep residuallearning for image recognition. In Proceedings of the IEEE conference on computervision and pattern recognition. 770–778.
[18] Mingsheng Long, Yue Cao, Jianmin Wang, and Michael I Jordan. 2015. Learn-ing transferable features with deep adaptation networks. arXiv preprintarXiv:1502.02791 (2015).
[19] Alameen Najjar, Shun’ichi Kaneko, and Yoshikazu Miyanaga. 2017. CombiningSatellite Imagery and Open Data to Map Road Safety.. In AAAI. 4524–4530.
7
[20] Seppo Nieminen, Olli-Pekka Lehtonen, and Miika Linna. 2002. Population densityand occurrence of accidents in finland. Prehospital and disaster medicine 17, 4(2002), 206–208.
[21] World Health Organization. 2015. Global status report on road safety 2015. WorldHealth Organization.
[22] Srinivas S Pulugurtha, Venkata Ramana Duddu, and Yashaswi Kotagiri. 2013. Traf-fic analysis zone level crash estimation models based on land use characteristics.Accident Analysis & Prevention 50 (2013), 678–687.
[23] Uli Schmucker, J Seifert, Dirk Stengel, Gerrit Matthes, Caspar Ottersbach, andAxel Ekkernkamp. 2010. Road traffic crashes in developing countries. DerUnfallchirurg 113, 5 (2010), 373–377.
[24] Baochen Sun and Kate Saenko. 2016. Deep coral: Correlation alignment fordeep domain adaptation. In European Conference on Computer Vision. Springer,443–450.
[25] JD Tamerius, X Zhou, R Mantilla, and T Greenfield-Huitt. 2016. PrecipitationEffects on Motor Vehicle Crashes Vary by Space, Time, and EnvironmentalConditions. Weather, Climate, and Society 8, 4 (2016), 399–407.
[26] Eric Tzeng, Judy Hoffman, Ning Zhang, Kate Saenko, and Trevor Darrell. 2014.Deep domain confusion: Maximizing for domain invariance. arXiv preprintarXiv:1412.3474 (2014).
[27] Zuxuan Wu, Xintong Han, Yen-Liang Lin, Mustafa Gkhan Uzunbas, Tom Gold-stein, Ser Nam Lim, and Larry S Davis. 2018. DCAN: Dual Channel-wiseAlignment Networks for Unsupervised Scene Adaptation. arXiv preprintarXiv:1804.05827 (2018).
[28] Zhuoning Yuan, Xun Zhou, and Tianbao Yang. 2018. Hetero-ConvLSTM: A DeepLearning Approach to Traffic Accident Prediction on Heterogeneous Spatio-Temporal Data. In Proceedings of the 24th ACM SIGKDD International Conferenceon Knowledge Discovery & Data Mining. ACM, 984–992.
[29] Bolei Zhou, Aditya Khosla, Agata Lapedriza, Aude Oliva, and Antonio Torralba.2016. Learning deep features for discriminative localization. In Proceedings of theIEEE Conference on Computer Vision and Pattern Recognition. 2921–2929.
[30] Fuqing Zhu, Xiangwei Kong, Liang Zheng, Haiyan Fu, and Qi Tian. 2017. Part-based deep hashing for large-scale person re-identification. IEEE Transactions onImage Processing 26, 10 (2017), 4806–4817.
8


![IIIT admision poster V2 · INFORMATION TECHNOLOGY HYDERABAD [A University u/s 3 of the UGC Act, 1956] ... Email IDs: For M. Tech/M.S./Ph.D: pgadmissions@iiit.ac.in I For Lateral Entry:](https://img.pdfslide.net/doc/110x75/5b0cd4417f8b9a8b038cc575/iiit-admision-poster-v2-technology-hyderabad-a-university-us-3-of-the-ugc-act.jpg)


![Abstract arXiv:1712.08714v1 [cs.CV] 23 Dec 2017 · Anurag Ghosh Suriya Singh C.V.Jawahar CVIT, KCIS, IIIT Hyderabad fanurag.ghosh, suriya.singhg@research.iiit.ac.in, jawahar@iiit.ac.in](https://img.pdfslide.net/doc/110x75/5f50f753f6cce243404b000d/abstract-arxiv171208714v1-cscv-23-dec-2017-anurag-ghosh-suriya-singh-cvjawahar.jpg)


![arXiv:2006.08696v1 [cs.CV] 15 Jun 2020 · Prashant Pandey?, Aayush Kumar Tyagi , Sameer Ambekar, and Prathosh AP Indian Institute of Technology Delhi getprashant57@gmail.com, aayush16081@iiitd.ac.in,](https://img.pdfslide.net/doc/110x75/5f6b2417cc24456ac85cde46/arxiv200608696v1-cscv-15-jun-2020-prashant-pandey-aayush-kumar-tyagi-sameer.jpg)