Embed Size (px)
Citation preview
San Jose State University San Jose State University
SJSU ScholarWorks SJSU ScholarWorks
Doctoral Projects Master's Theses and Graduate Research
Spring 5-2017
Attitudes and Perceptions of Advanced Practice Nurses towards Attitudes and Perceptions of Advanced Practice Nurses towards
Health Information Technology and Its Effects on Caring Health Information Technology and Its Effects on Caring
Debbie Ramos Shih California State University, Northern California Consortium Doctor of Nursing Practice
Follow this and additional works at: https://scholarworks.sjsu.edu/etd_doctoral
Part of the Family Practice Nursing Commons
Recommended Citation Recommended Citation Shih, Debbie Ramos, "Attitudes and Perceptions of Advanced Practice Nurses towards Health Information Technology and Its Effects on Caring" (2017). Doctoral Projects. 59. DOI: https://doi.org/10.31979/etd.feqg-6esk https://scholarworks.sjsu.edu/etd_doctoral/59
This Doctoral Project is brought to you for free and open access by the Master's Theses and Graduate Research at SJSU ScholarWorks. It has been accepted for inclusion in Doctoral Projects by an authorized administrator of SJSU ScholarWorks. For more information, please contact [email protected].
ABSTRACT ATTITUDES AND PERCEPTIONS OF ADVANCED PRACTICE NURSES
TOWARDS HEALTH INFORMATION TECHNOLOGY AND ITS EFFECTS ON CARING
Technology is rapidly, constantly evolving, and affecting healthcare. While
it has the ability to improve healthcare outcomes, it is important to realize the
impact this technology has on the relationships between patients and nurses
(Korhonen, et al., 2015). Interactions with patients are increasing through
computer technology and decreasing by physical presence and touch, potentially
compromising the development of a trusting relationship and thus affecting patient
quality outcomes (Sandelowski, 2002).
This cross sectional study explored the attitudes and perceptions of APRNs
towards HIT and its effects on caring. 150 Advanced Practice Clinicians in a
Northern California healthcare was surveyed, using the Information Technology
Attitude Scales for Health (ITASH). Age, educational level, gender and ethnicity
did not contribute any significant differences in the attitudes toward care value of
information communication technology (ICT), training of ICT skills, ICT
confidence or workload value. However, NPs compared to CNMs and PAs, had
higher care value ICT score. Primary Care department also scored higher than
Specialty Departments in the care value of ICT factor.
Debbie Ramos Shih
May 2017
ATTITUDES AND PERCEPTIONS OF ADVANCED PRACTICE NURSES TOWARDS HEALTH INFORMATION TECHNOLOGY AND ITS EFFECTS
ON CARING
by
Debbie Ramos Shih
A project
submitted in partial
fulfillment of the requirements for the degree of
Doctor of Nursing Practice
California State University, Northern Consortium
Doctor of Nursing Practice
May 2017
APPROVED
For the California State University, Northern Consortium Doctor of Nursing Practice:
We, the undersigned, certify that the project of the following student meets the required standards of scholarship, format, and style of the university and the student's graduate degree program for the awarding of the master's degree.
____________Debbie Ramos Shih_________ Project Author

AUTHORIZATION FOR REPRODUCTION
OF DOCTORAL PROJECT X I grant permission for the reproduction of this project in part or in
its entirety without further authorization from me, on the condition that the person or agency requesting reproduction absorbs the cost and provides proper acknowledgment of authorship.
Permission to reproduce this project in part or in its entirety must
be obtained from me.

ACKNOWLEDGMENTS
Thank you for this opportunity to give thanks to God, who has constantly blessed
me with opportunities to expand my nursing education and career; To my
husband, Mason and children, Nathan and Elizabeth who have been very patient
over the last 2 years of my "absence" when school needed to go first, and whose
support and unconditional love I could not have done without; To my parents and
family members who's encouragement and support helped me manage all the
travels back and forth to China and California; To my Committee members: Dr.
Ruth Rosenblum (Advisor and Project Chair), Dr. Olga Libova and Ms. Kathy
Rowan, who’s experience, feedback and support through this academic program
helped me learn and grow both personally and professionally, well beyond what I
expected; To my classmates, especially the Wonder Twins & The Post It Laters,
whose constant availability and support on Wechat allowed me to survive the
program from China! To my friends and family in Shanghai, Northern California
and Palo Alto Medical Foundation, who’s presence and support in my life allowed
this milestone to happen. I could not have done this without each and everyone of
you behind me to push through! WE did it!
TABLE OF CONTENTS Page
CHAPTER 1: INTRODUCTION ............................................................................. 1
Key Terms and Definitions ……………………………………………….. 1
Significance ……………………………………………………………… 2
Purpose …………………………………………………………………… 3
Theoretical Framework ………………………………………………….... 4
CHAPTER 2: LITERATURE REVIEW .................................................................. 8
Gaps in the Literature …………………………………………………… 15
Information Technology Attitude Scales for Health (ITASH) …………. 16
CHAPTER 3: METHODOLOGY .......................................................................... 18
General Study Design ………………………………………………… 18
Methodology ………………………………………………………….. 19
Risk/Benefits ………………………………………………………….. 20
CHAPTER 4: RESULTS AND DISCUSSION ..................................................... 21
Data Analysis …………………………………………………………. 21
Descriptive Statistics ………………………………………………… 22
Summary ……………………………………………………………… 24
CHAPTER 5: CONCLUSION ............................................................................... 26
Outcomes/Discussion ………………………………………………..... 26
Limitations …………………………………………………………... 27
Implications for Nursing Practice …………………………………….. 27
Recommendations for Further Study ………………………………… 27
APPENDICES ........................................................................................................ 38
APPENDIX A: DEMOGRAPHICS/ITASH SURVEY ......................................... 39
APPENDIX B: OCCUPATION AND FACTOR 1 ANOVA .………………. 45
APPENDIX C: OCCUPATION AND FACTOR 2 ANOVA ………………… 50
APPENDIX D: OCCUPATION AND FACTOR 4 ANOVA ………………… 55
APPENDIX E: DEPARTMENT AND FACTOR 1 ANOVA ………………... 60
CHAPTER 1: INTRODUCTION
Health Information Technology (HIT) and Communication Technology
(CT) have proven to greatly impact health care in many different ways. They have
increased efficiency in communication of information to other members of the
healthcare team as well as to patients. There have been documented evidence of
benefits from HIT and CT, such as greater adherence to health maintenance and
preventive care guidelines, reduction in in-patient medication errors, and a
decrease in cost of care (Hsu, 2005).
Caring is essential, if not the crux, of the nursing profession (Leininger,
1984; Watson, 1979). With the evolution of communication by technology, and
health information technology used predominantly in today’s health care system,
one cannot help but question, if the sense of caring is compromised by this same
technology (Sandelowski, 2002). By this, are we compromising the meaning of
our nursing profession? Joanne Duffy, a nursing theorist, observed, that the
foundation of caring behavior, skills and attitudes of professional nursing has been
depreciated as the focus in health care today shifted to procedures and tasks,
technology and cost containment (Duffy 2015). It is therefore important to
consider how caring is impacted by this technology.
Key Terms/Definitions
APC- Advanced Practice Clinician
Physician Assistant, any APRN (Advanced Practice Registered Nurse)
2 2 APN/APRN- Advanced Practice Nurse/Advanced Practice Registered Nurse
Nurse Practitioner (NP)
Clinical Nurse Specialist (CNS)
Certified Nurse Midwife (CNM)
Certified Nurse Anesthetist (CNA)
Health information Technology (HIT)- is a broad concept that encompasses an
array of technologies to store, share, and analyze health information (EMR, PHI,
e-tools, e-prescribing, Meaningful use).
Information/Communication Technology (ICT/CT)- ICT (information and
communications technology - or technologies) is an umbrella term that includes
any communication device or application, encompassing: radio, television, cellular
phones, computer and network hardware and software, satellite systems and so on,
as well as the various services and applications.
Significance
In today’s world of healthcare and technology, it has become increasingly
difficult to give patient undivided attention when some of the attention is on the
computer screen. Often, health care providers have felt pressured by demands to
be productive and yet deliver quality care without making the patient feel uncared
for or ignored due to technology (Nagel, Pomerleau, & Penner, 2013). Demands
increase with patients wanting answers to questions by online messaging and
explanation of their test results and prescriptions filled in a timely manner
3 3 (Liederman, Lee, Baquero, & Seites, 2005).
Much of the interaction with the patient is increasing through computer
technology and decreasing by way of physical presence and touch (Sandelowski,
2002). Nursing and caring requires physical presence and touch in order for
relationships to occur and it is through building these relationships that quality
health outcomes happen (Korhonen, Nordman & Eriksson, 2015; Malone, 2003;
Nagel et al., 2013; Sandelowski, 2002). Technology is evolving rapidly and while
it has the ability to improve healthcare outcomes, it is important to realize the
impact this technology has on the relationships between patients and nurses
(Korhonen, et al., 2015). Caring is changing in the face of technology for which
creativity and innovation are indeed needed to continue the expression of genuine
care and concern, not only by means of human contact, but now also by means of
this technology (Hawkins, 2012; Nagel, et al., 2013).
Purpose
The purpose of this project is to explore and increase awareness regarding
communication and expression of care in outpatient interactions while using
computer technology. Further review of the literature is warranted to explore
effects of HIT on advanced nursing practice and quality outcomes.
Research Question(s)
1) What are the perceptions and attitudes of Advanced Practice Nurses towards
health information technology and its effect on caring?
4 4 2) How has health information technology impacted the way Advanced Practice
Nurses care for their served population?
Implications
Research has been done on hospital RNs’, nursing students’ and patients’
perception and attitudes of technology and its effect on caring but not specifically
to APNs. There is one study in the literature (Varghese, 2009), a naturalistic
inquiry on caring and telehealth that explored attitudes and perceptions of APNs
no quantitative studies for caring and technology. This study adds to the nursing
literature and encourages further study. Results of this study can also guide
nursing students in the understanding of caring and the influence of technology.
Theoretical Framework
Joanne R. Duffy developed the quality caring model in 2003. The purpose
of this model was to expose the hidden work of nursing and support the link
between nurse caring and quality health outcomes (Duffy, 2003). Duffy states that
nurses have contributed much to the success of patient outcomes and increased
patient satisfaction but that work is sometimes hidden or undocumented as to how
much and what nurses actually do to achieve patient satisfaction and improved
outcomes. Nurses have provided care around the clock across many settings, age
and health continuum and it is time to quantify and expose the value of these
services (Duffy, 2005; Duffy, 2013).
Concepts and Propositions of Theory
5 5 The four major concepts representing this theory include: Participants,
caring relationships, feeling cared for and health. Participants are the patients,
providers, the organization itself or anyone else that may be involved in the
healthcare experience. Individuals are considered to have behaviors, attitudes,
characteristics and life experiences that contribute or influence the meaning of
their experiences, namely in health and illness (Duffy, 2015).
The four types of caring relationships encompassed in this theory are: self,
patients and their families, each other, and communities. Caring relationships
result in feeling care, leading then to self-advancement. This concept of self-
advancement was also later added to the revised quality caring model (Duffy,
2009).
Feeling cared for in turn is manifested by eight caring factors: attentive
reassurance, basic human needs, encouraging manner, mutual problem solving,
affiliation needs, healing environment, human respect, and appreciation of unique
meanings (Duffy, 2009). Feeling cared for stimulates patients and their families to
participate, learn and persevere toward better health outcome goals (Duffy, 2015).
These caring relationships make nurses’ work more meaningful and
satisfying and thus congruent with professional nursing values (Duffy, 2015). Job
satisfaction influences productivity and performance and directly related to nurses’
desire to work and provide quality health care (De Milt, Fitzpatrick, & McNulty,
2011; Shea, 2008; Wild, Parsons, & Dietz, 2006).
6 6 Theory Assumptions
Assumptions of the revised Quality-Caring Model include:
1) Humans are multidimensional beings capable of growth and change.
2) Humans exist in relation to themselves, others, communities or groups, nature (or
the environment), and the universe.
3) Humans evolve over time and in space.
4) Humans are inherently worthy.
5) Caring is embedded in the daily work of nursing.
6) Caring is a tangible concept that can be measured.
7) Caring relationship benefit both the carer and the one being cared for.
8) Caring relationships benefit society.
9) Caring is done “in relationship.”
10) Feeling “cared for” is a positive emotion (Duffy, 2009, pp. 197-198).
The first four assumptions are regarding humans: Humans are higher,
intelligent beings capable of evolving or growing by the process of learning.
Humans are able to grow socially as well, in relationships with our communities
and environment. According to monotheistic religions, humans beings are
inherently worthy because we were created in the likeness and image of God.
Caring has been a very well studied topic in relation to nursing. Humans
have the natural ability to care (Benner & Wrubel, 1989; Edwards, 2001) and that
caring is unique and central to nursing (Benner & Wrubel, 1989; Leininger, 1984;
Watson, 1979). Nursing cannot occur effectively without caring and it has been
7 7 shown that relationships that develop between patient and healthcare provider, not
only have measurable quality outcomes but also reciprocity in that the healthcare
provider feels job satisfaction and professional growth (De Milt, et al., 2011;
Duffy, 2015; Shea, 2008; Wild, et al., 2006). Caring can also extend to care of the
community. Together, the community can grow together to support one another
and build cohesion so that together they can contribute to one another’s welfare
and growth (Duffy, 2015). When one feels cared for, there is a contentment and
ease and natural tendency to share this with others who are in need of this comfort.
Humans have a natural desire to be cared for (Leininger, 1984).
CHAPTER 2: LITERATURE REVIEW
Introduction
Existing studies that explore the attitudes of APRNs toward information
technology are limited in that most studies are limited to registered nurses and not
advanced practice nurses. These studies encompass attitudes of nurses as students
or that of a specific specialty such as Intensive Care, Emergency Room, Surgical
or Psychiatric. While some may be outdated, they were included here because of
the study was important to include pertaining to the study of attitudes of APRNs
toward technology and caring. The studies exploring caring and technology are
also two very large topics and the literature is full of controversy surrounding how
one should measure caring.
Review of the Literature
Brodel (2015) conducted a pre and post-test survey, examining nursing
students’ perceptions on caring, technology as caring, and technological influences
on caring practice. Caring Attributes, Professional Self-concept Technological
Influences (CAPSTI) Scale (Arthur et al., 1998;Watson, 2002) and the
Technology Confidence Survey (Hess & Heuer, 2003) were used to survey 80-90
students enrolled at Minot State University's Nursing Program during the fall of
2008 and spring of 2009 semesters. Significant correlations were found between
and among the different parts of the CAPSTI. The designers established the
Technology Confidence Survey validity through a process of expert reviews of the
9 9 items and subsequent revisions. Results showed that students’ perception of caring
was high during the pretest and there was a minimal increase on the post-test. The
students’ perception of caring as a tool for technology suggests a need for more
education on connecting technology and caring. Students also perceived that
technology did not give them more time, but that it enhanced patient care and
increased the professional status of nurses. This study was limited by convenience
sampling and cannot be generalized to other nursing programs. However, the
results of this study indicate a need to integrate technology and caring in nursing
programs to prepare nurses for clinical practice.
In clinical practice, technology has posed some barriers to frontline nurses
in adopting telehealth, as seen in the slow adoption rate of telehealth in the United
Kingdom. Telehealth has been defined as, the remote exchange of data and
information between patient and healthcare professional(s) to assist in diagnosis
and management of health conditions (Sanders et al. 2012). Taylor (2014)
conducted a thematic analysis of qualitative interviews to identify barriers to
successful adoption of telehealth semi-structured interviews were conducted with
105 Registered Nurses located in 4 community clinics in the United Kingdom.
Data was collected May 2012–June 2013 and included those RNs that used
telehealth in chronic diseases, including Chronic Obstructive Pulmonary Disease
and Chronic Heart Failure. The quality of the research was ensured using the
criteria of dependability, credibility and authenticity. Framework analysis
10 10 (Spencer et al. 2003) was used to structure and explore interview data. Face-to-
face interviews with audio-recordings were done at nurses’ workplaces. Results of
the study indicated that frontline staff acceptance of telehealth was fragile and
uncertain and was hindered by organizational, professional, and technological
barriers. This study added depth to the current understanding of factors affecting
staff acceptance of telehealth but was limited in that findings were based on
retrospective and somewhat partial accounts of implementation.
Using a quantitative, descriptive study design, Kinchen (2014)
aimed to explore the development and testing of a new instrument designed to
measure patients’ perceptions of the holistic quality of nurse practitioner care. The
Nurse Practitioner Holistic Caring Instrument (NPHCI), a 19-item, Likert-type
scale and Swanson’s (2002) Caring Professional Scale (CPS), were distributed by
email to a convenience sample of adults recruited from the faculty and staff of
seven academic colleges at Florida Atlantic University. Using selected strategies
to establish preliminary validity and reliability levels of the instrument, Kinchen
assessed psychometric soundness of the NPHCI. Cronbach’s alpha was used to
determine reliability of the instruments. 159 responses were included in the
analysis. Data analysis, including sample demographics, exploratory factor
analysis, reliability estimates, and correlations, was performed using SPSS
(v.21.0). IBM Amos (v.21) was used for confirmatory factor analysis. Reliability
estimates for the NPHCI were quite high; well over the suggested threshold of .70
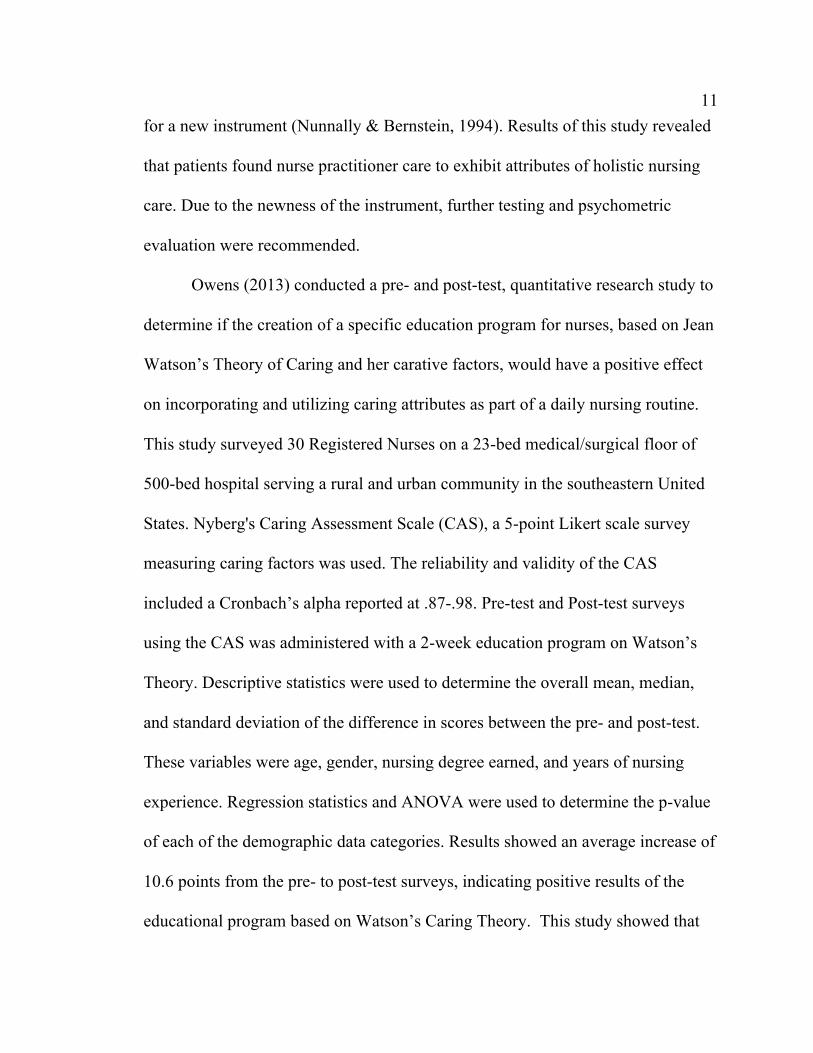
11 11 for a new instrument (Nunnally & Bernstein, 1994). Results of this study revealed
that patients found nurse practitioner care to exhibit attributes of holistic nursing
care. Due to the newness of the instrument, further testing and psychometric
evaluation were recommended.
Owens (2013) conducted a pre- and post-test, quantitative research study to
determine if the creation of a specific education program for nurses, based on Jean
Watson’s Theory of Caring and her carative factors, would have a positive effect
on incorporating and utilizing caring attributes as part of a daily nursing routine.
This study surveyed 30 Registered Nurses on a 23-bed medical/surgical floor of
500-bed hospital serving a rural and urban community in the southeastern United
States. Nyberg's Caring Assessment Scale (CAS), a 5-point Likert scale survey
measuring caring factors was used. The reliability and validity of the CAS
included a Cronbach’s alpha reported at .87-.98. Pre-test and Post-test surveys
using the CAS was administered with a 2-week education program on Watson’s
Theory. Descriptive statistics were used to determine the overall mean, median,
and standard deviation of the difference in scores between the pre- and post-test.
These variables were age, gender, nursing degree earned, and years of nursing
experience. Regression statistics and ANOVA were used to determine the p-value
of each of the demographic data categories. Results showed an average increase of
10.6 points from the pre- to post-test surveys, indicating positive results of the
educational program based on Watson’s Caring Theory. This study showed that
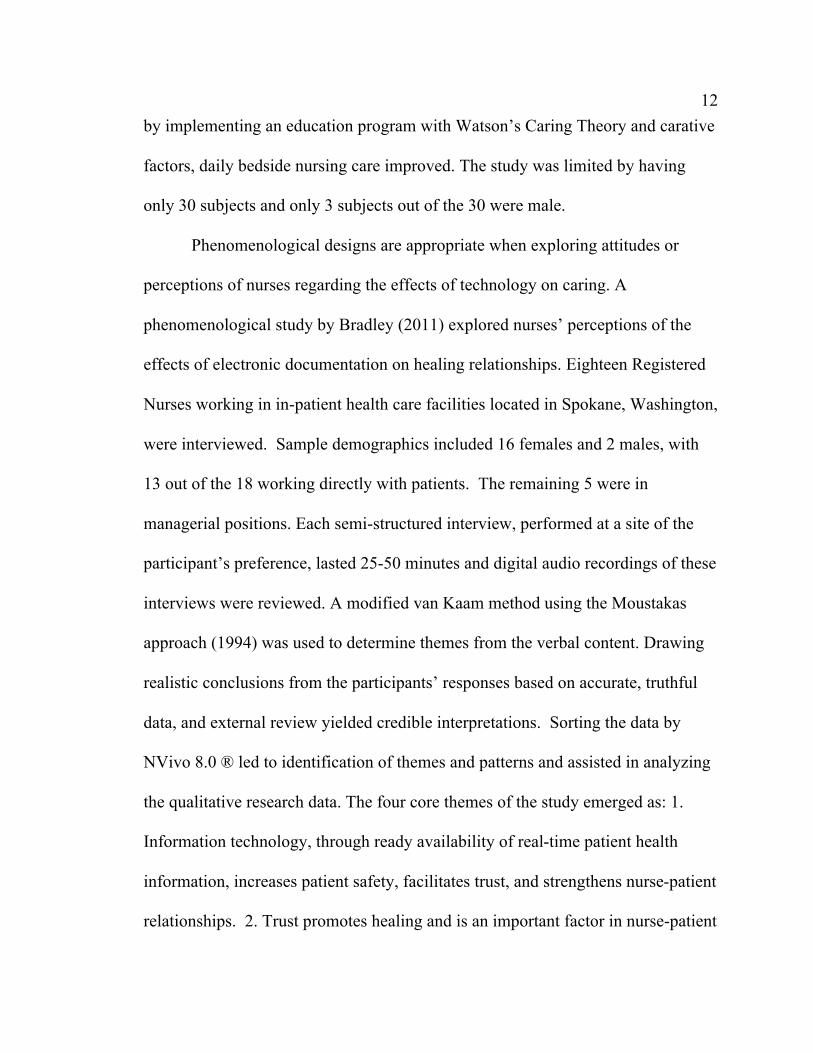
12 12 by implementing an education program with Watson’s Caring Theory and carative
factors, daily bedside nursing care improved. The study was limited by having
only 30 subjects and only 3 subjects out of the 30 were male.
Phenomenological designs are appropriate when exploring attitudes or
perceptions of nurses regarding the effects of technology on caring. A
phenomenological study by Bradley (2011) explored nurses’ perceptions of the
effects of electronic documentation on healing relationships. Eighteen Registered
Nurses working in in-patient health care facilities located in Spokane, Washington,
were interviewed. Sample demographics included 16 females and 2 males, with
13 out of the 18 working directly with patients. The remaining 5 were in
managerial positions. Each semi-structured interview, performed at a site of the
participant’s preference, lasted 25-50 minutes and digital audio recordings of these
interviews were reviewed. A modified van Kaam method using the Moustakas
approach (1994) was used to determine themes from the verbal content. Drawing
realistic conclusions from the participants’ responses based on accurate, truthful
data, and external review yielded credible interpretations. Sorting the data by
NVivo 8.0 ® led to identification of themes and patterns and assisted in analyzing
the qualitative research data. The four core themes of the study emerged as: 1.
Information technology, through ready availability of real-time patient health
information, increases patient safety, facilitates trust, and strengthens nurse-patient
relationships. 2. Trust promotes healing and is an important factor in nurse-patient
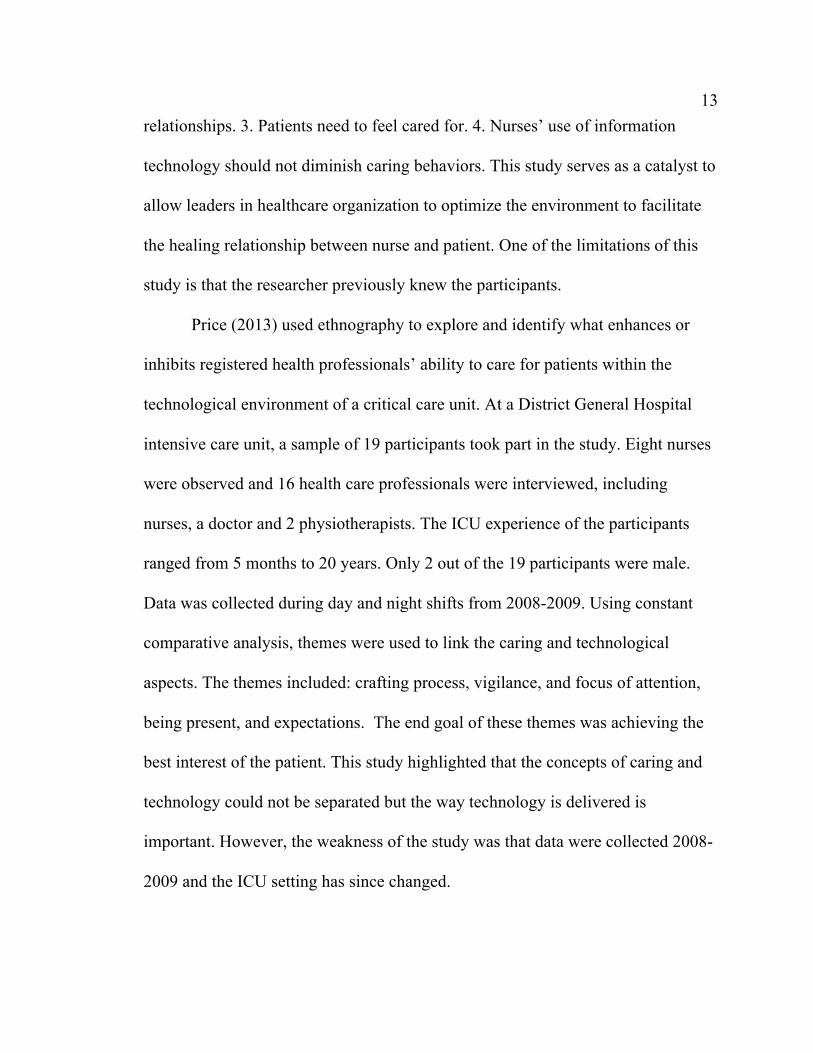
13 13 relationships. 3. Patients need to feel cared for. 4. Nurses’ use of information
technology should not diminish caring behaviors. This study serves as a catalyst to
allow leaders in healthcare organization to optimize the environment to facilitate
the healing relationship between nurse and patient. One of the limitations of this
study is that the researcher previously knew the participants.
Price (2013) used ethnography to explore and identify what enhances or
inhibits registered health professionals’ ability to care for patients within the
technological environment of a critical care unit. At a District General Hospital
intensive care unit, a sample of 19 participants took part in the study. Eight nurses
were observed and 16 health care professionals were interviewed, including
nurses, a doctor and 2 physiotherapists. The ICU experience of the participants
ranged from 5 months to 20 years. Only 2 out of the 19 participants were male.
Data was collected during day and night shifts from 2008-2009. Using constant
comparative analysis, themes were used to link the caring and technological
aspects. The themes included: crafting process, vigilance, and focus of attention,
being present, and expectations. The end goal of these themes was achieving the
best interest of the patient. This study highlighted that the concepts of caring and
technology could not be separated but the way technology is delivered is
important. However, the weakness of the study was that data were collected 2008-
2009 and the ICU setting has since changed.
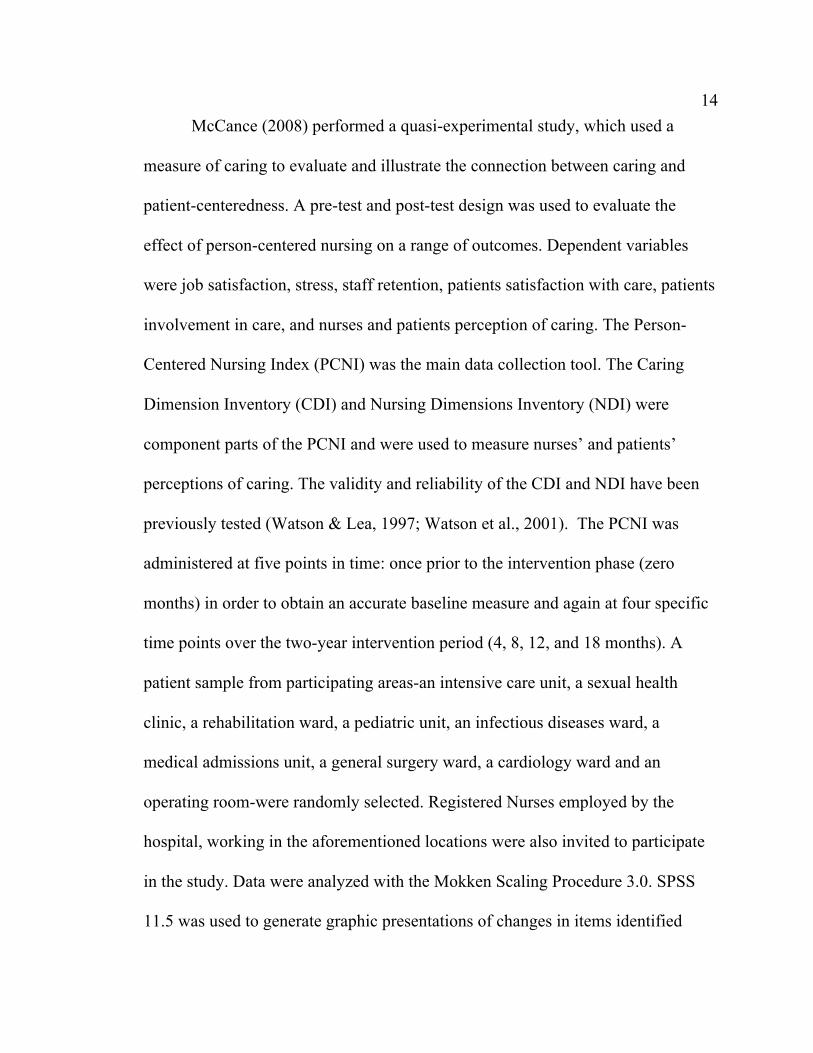
14 14 McCance (2008) performed a quasi-experimental study, which used a
measure of caring to evaluate and illustrate the connection between caring and
patient-centeredness. A pre-test and post-test design was used to evaluate the
effect of person-centered nursing on a range of outcomes. Dependent variables
were job satisfaction, stress, staff retention, patients satisfaction with care, patients
involvement in care, and nurses and patients perception of caring. The Person-
Centered Nursing Index (PCNI) was the main data collection tool. The Caring
Dimension Inventory (CDI) and Nursing Dimensions Inventory (NDI) were
component parts of the PCNI and were used to measure nurses’ and patients’
perceptions of caring. The validity and reliability of the CDI and NDI have been
previously tested (Watson & Lea, 1997; Watson et al., 2001). The PCNI was
administered at five points in time: once prior to the intervention phase (zero
months) in order to obtain an accurate baseline measure and again at four specific
time points over the two-year intervention period (4, 8, 12, and 18 months). A
patient sample from participating areas-an intensive care unit, a sexual health
clinic, a rehabilitation ward, a pediatric unit, an infectious diseases ward, a
medical admissions unit, a general surgery ward, a cardiology ward and an
operating room-were randomly selected. Registered Nurses employed by the
hospital, working in the aforementioned locations were also invited to participate
in the study. Data were analyzed with the Mokken Scaling Procedure 3.0. SPSS
11.5 was used to generate graphic presentations of changes in items identified
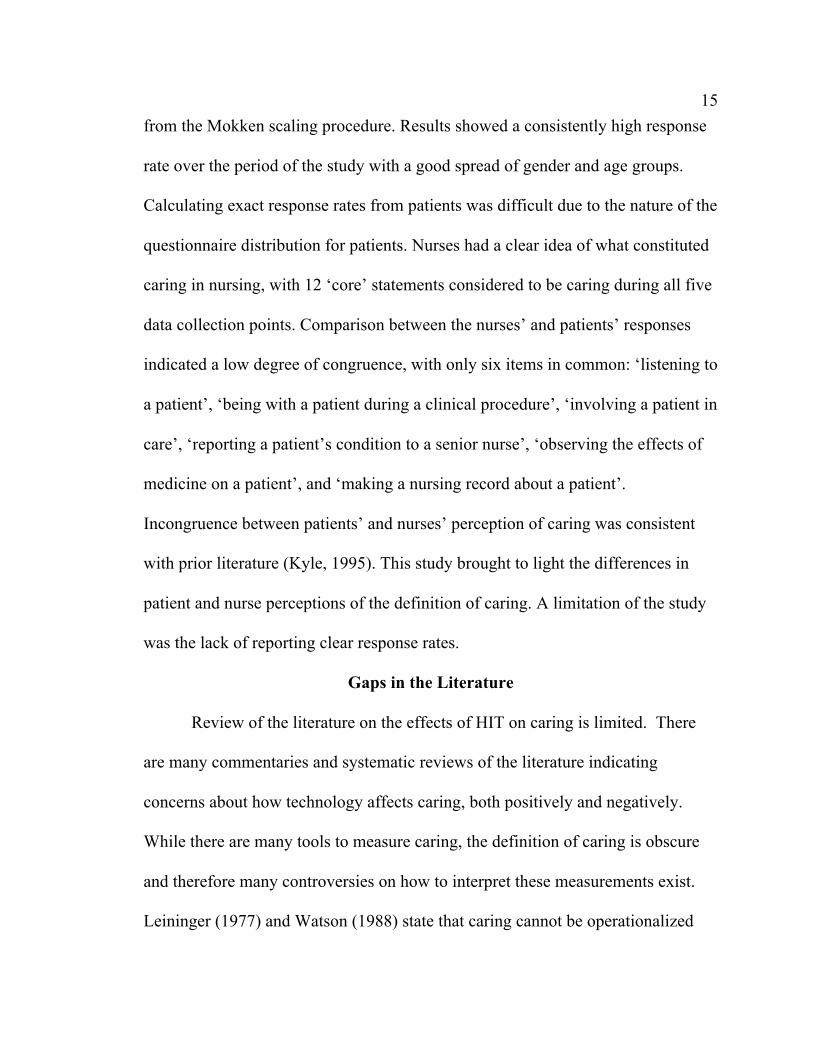
15 15 from the Mokken scaling procedure. Results showed a consistently high response
rate over the period of the study with a good spread of gender and age groups.
Calculating exact response rates from patients was difficult due to the nature of the
questionnaire distribution for patients. Nurses had a clear idea of what constituted
caring in nursing, with 12 ‘core’ statements considered to be caring during all five
data collection points. Comparison between the nurses’ and patients’ responses
indicated a low degree of congruence, with only six items in common: ‘listening to
a patient’, ‘being with a patient during a clinical procedure’, ‘involving a patient in
care’, ‘reporting a patient’s condition to a senior nurse’, ‘observing the effects of
medicine on a patient’, and ‘making a nursing record about a patient’.
Incongruence between patients’ and nurses’ perception of caring was consistent
with prior literature (Kyle, 1995). This study brought to light the differences in
patient and nurse perceptions of the definition of caring. A limitation of the study
was the lack of reporting clear response rates.
Gaps in the Literature
Review of the literature on the effects of HIT on caring is limited. There
are many commentaries and systematic reviews of the literature indicating
concerns about how technology affects caring, both positively and negatively.
While there are many tools to measure caring, the definition of caring is obscure
and therefore many controversies on how to interpret these measurements exist.
Leininger (1977) and Watson (1988) state that caring cannot be operationalized
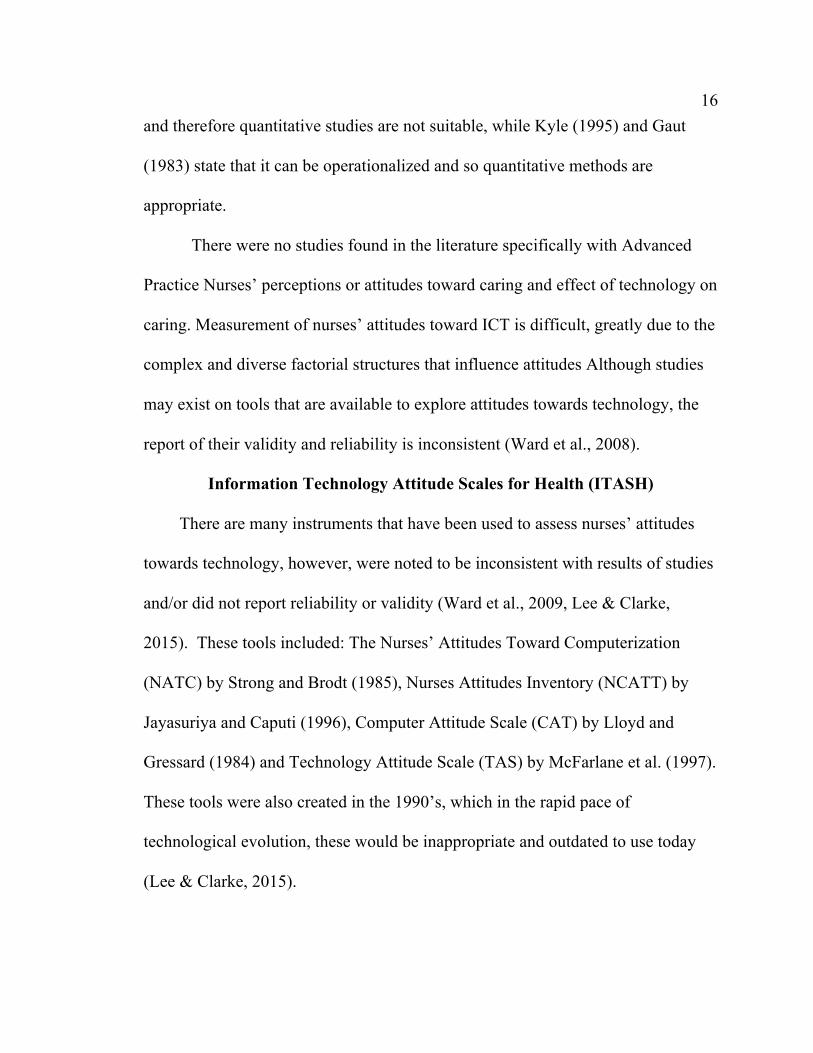
16 16 and therefore quantitative studies are not suitable, while Kyle (1995) and Gaut
(1983) state that it can be operationalized and so quantitative methods are
appropriate.
There were no studies found in the literature specifically with Advanced
Practice Nurses’ perceptions or attitudes toward caring and effect of technology on
caring. Measurement of nurses’ attitudes toward ICT is difficult, greatly due to the
complex and diverse factorial structures that influence attitudes Although studies
may exist on tools that are available to explore attitudes towards technology, the
report of their validity and reliability is inconsistent (Ward et al., 2008).
Information Technology Attitude Scales for Health (ITASH)
There are many instruments that have been used to assess nurses’ attitudes
towards technology, however, were noted to be inconsistent with results of studies
and/or did not report reliability or validity (Ward et al., 2009, Lee & Clarke,
2015). These tools included: The Nurses’ Attitudes Toward Computerization
(NATC) by Strong and Brodt (1985), Nurses Attitudes Inventory (NCATT) by
Jayasuriya and Caputi (1996), Computer Attitude Scale (CAT) by Lloyd and
Gressard (1984) and Technology Attitude Scale (TAS) by McFarlane et al. (1997).
These tools were also created in the 1990’s, which in the rapid pace of
technological evolution, these would be inappropriate and outdated to use today
(Lee & Clarke, 2015).
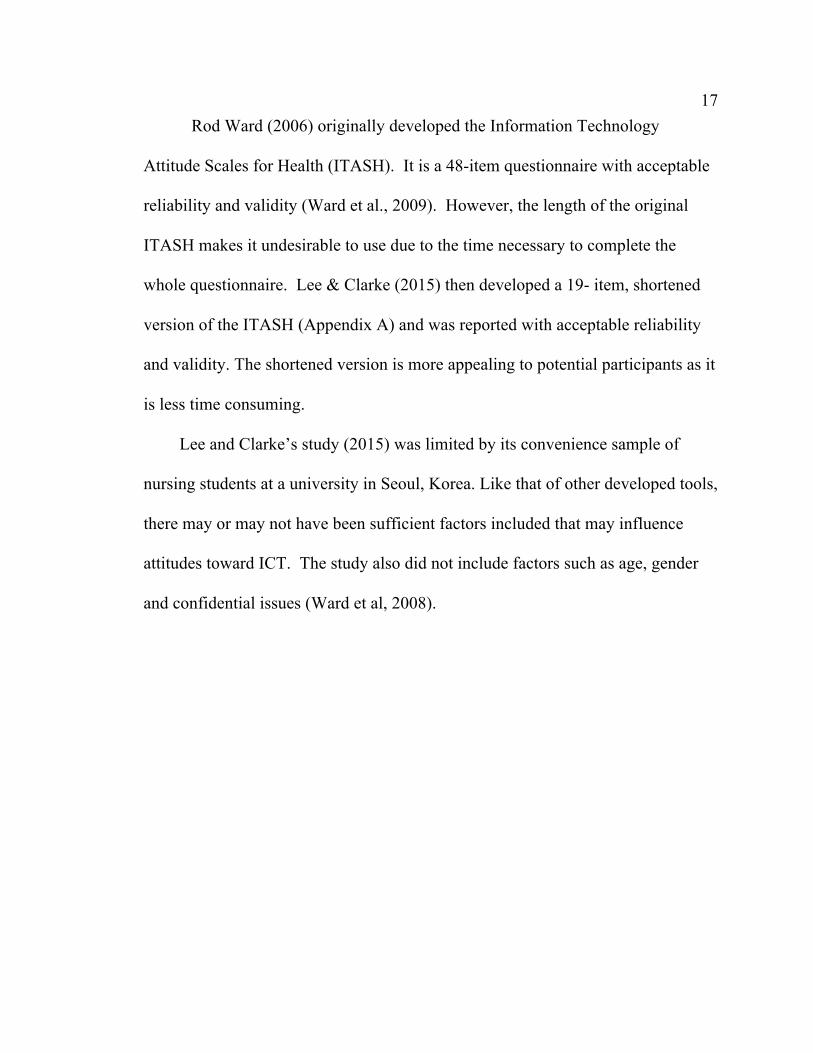
17 17 Rod Ward (2006) originally developed the Information Technology
Attitude Scales for Health (ITASH). It is a 48-item questionnaire with acceptable
reliability and validity (Ward et al., 2009). However, the length of the original
ITASH makes it undesirable to use due to the time necessary to complete the
whole questionnaire. Lee & Clarke (2015) then developed a 19- item, shortened
version of the ITASH (Appendix A) and was reported with acceptable reliability
and validity. The shortened version is more appealing to potential participants as it
is less time consuming.
Lee and Clarke’s study (2015) was limited by its convenience sample of
nursing students at a university in Seoul, Korea. Like that of other developed tools,
there may or may not have been sufficient factors included that may influence
attitudes toward ICT. The study also did not include factors such as age, gender
and confidential issues (Ward et al, 2008).
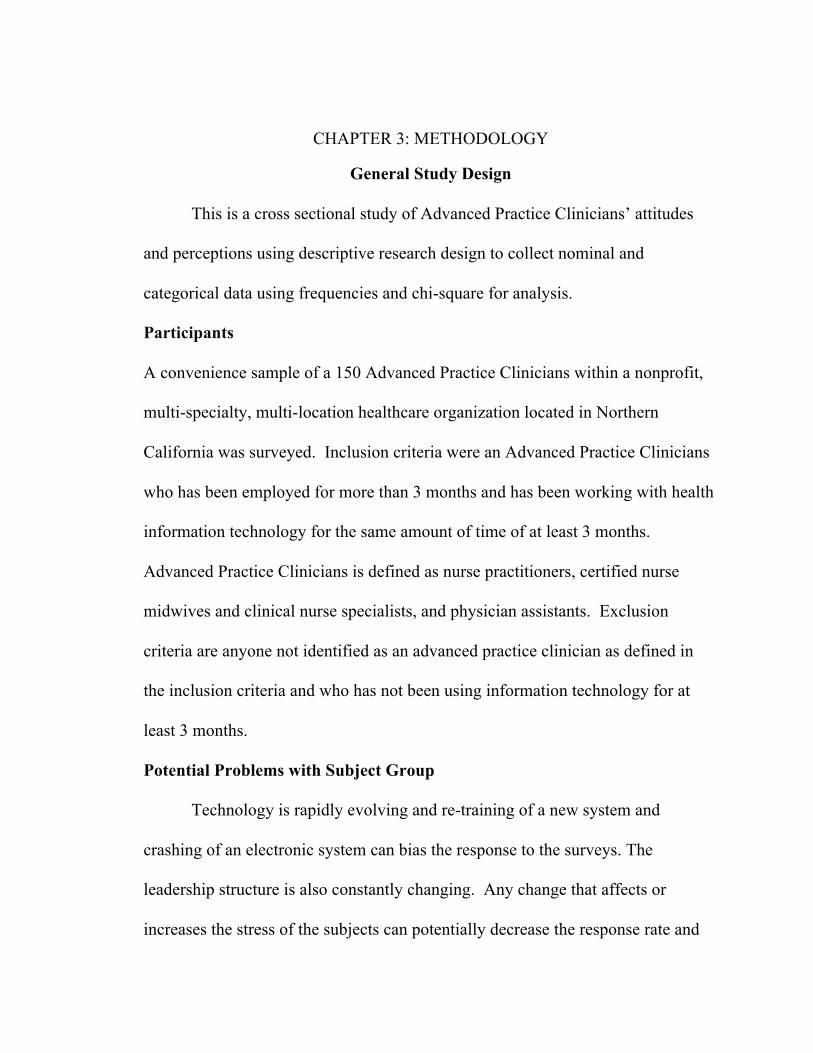
CHAPTER 3: METHODOLOGY
General Study Design
This is a cross sectional study of Advanced Practice Clinicians’ attitudes
and perceptions using descriptive research design to collect nominal and
categorical data using frequencies and chi-square for analysis.
Participants
A convenience sample of a 150 Advanced Practice Clinicians within a nonprofit,
multi-specialty, multi-location healthcare organization located in Northern
California was surveyed. Inclusion criteria were an Advanced Practice Clinicians
who has been employed for more than 3 months and has been working with health
information technology for the same amount of time of at least 3 months.
Advanced Practice Clinicians is defined as nurse practitioners, certified nurse
midwives and clinical nurse specialists, and physician assistants. Exclusion
criteria are anyone not identified as an advanced practice clinician as defined in
the inclusion criteria and who has not been using information technology for at
least 3 months.
Potential Problems with Subject Group
Technology is rapidly evolving and re-training of a new system and
crashing of an electronic system can bias the response to the surveys. The
leadership structure is also constantly changing. Any change that affects or
increases the stress of the subjects can potentially decrease the response rate and
19 19 or influence the response to the survey. These are potential limitations to the study
that are not within the control of the researcher.
Methodology
Information Technology Attitudes Scales for Health (ITASH), developed
by Ward, et al., (2006) was disseminated to the 150-180 APCs via Survey Monkey
(Appendix A). This method was chosen because PAMF is multi specialty and
multi location and electronic means is more convenient for dissemination and
return of the survey. Permission to use and adapt the ITASH (the shortened
version) for the purposes of this study was granted by the author. (Survey
attached as Appendix A).
A cover letter/consent form explained the importance and significance of
the study and that participation is voluntary and confidential. This contained the
link to survey monkey, which had demographic questions and ITASH survey.
The Survey Monkey was used not only for data collection but also its quantitative
analysis. Electronic survey and any other communication from the researcher to
the participants occurred within the PAMF network using employee email
addresses. Reminders were sent 2 weeks later to encourage increased participation.
There was no labeling by name or number to provide confidentiality. The survey
was disseminated directly to the APC by the primary investigator while the
Associate VP of Organizational Effectiveness encouraged participation in the
study.
20 20 Risks/Benefits
There were no risks noted to the participants, however, participating in any
study can potentially cause stress or anxiety while filling out survey.
Confidentiality was maintained by not linking any results to the participants
through surveys disseminated by Survey Monkey. Only group results will be
reported. There was no compensation offered to the participants volunteering to
fill out the survey.
CHAPTER 4: RESULTS AND DISCUSSION
Results
Out of a possible 150-180 Advanced Practice Clinicians, 64 responded (35-
44%). The majority of the participants’ age ranged 51-60 years of age was the
highest (36%), 41-50 years (28%) and 31-40 years old at 20%. The 61-70 year old
at 11 % and 20-30 year old group was 5% of the participants.
Highest level of education was 75% having a Master’s degree, 16% having
a Bachelor’s degree, 8% with an Associates Degree, and 1% having a Doctoral
Degree. The sample size consisted mostly of females (84%) and 16% males. 50%
of the participants were Nurse Practitioners, 44% Physician Assistants, 5%
Certified Nurse Midwife and 1% other, was noted to be a Nurse Educator. The
Nurse Educator did not meet the inclusion criteria and had omitted the rest of
survey, only answering the demographics questions. 65% of the participants
worked in Specialty Areas, 19% worked in Primary Care and 16% other. Sample
size consisted of mostly White (73%), Asian/Pacific Islander (11%), 5%
Hispanic/Latino, 2% Native American Indian and 9% other.
Data Analysis
SPSS version 23 was used for data analysis. The first part included
demographic descriptive statistics followed by comparing the mean factor scores
between ages, educational levels, genders, occupations, departments, and
ethnicities. All of these were one-way ANOVA for each factor score, except for
22 22 gender, which was a two-sample t-test for each factor score. If an ANOVA was
statistically significant, Tukey's post hoc tests were applied to determine exactly
which groups differed. A significant ANOVA only indicates that there is a
difference somewhere between the groups, and the post hoc tests are needed to
determine exactly which means differ. Descriptive statistics and power for each
analysis were also performed.
Descriptive Statistics
The 4 factors in the ITASH survey assessed were: 1) Care Value of
Information Communication Technology (ICT), 2) Training of ICT Skills, 3) ICT
Confidence and 4) Workload Value of ICT. The four factors describe the
conceptual domain: ‘care value of ICT’ that is a subscale measuring how APCs
regard the contribution of ICT towards care; ‘training of ICT skills,’ which
investigates the attitudes of APCs towards their ICT training and their desire for
further ICT training; ‘ICT confidence,’ a subscale assessing APCs confidence in
dealing with ICT; and the subscale, ‘workload value of ICT’ that examines their
attitudes towards work efficiency in using ICT (Lee & Clarke, 2015).
A separate analysis of variance (ANOVA) was done for each factor.
Analysis of variance (ANOVA) on age compared each factor score between the
age groups. The ANOVA compares the mean factor score between these age
groups: 20-30 years, 31-40 years, 41-50 years, 51-60 years, and 61-70 years. The
means and standard deviations for the factor score are first given, and then the
23 23 ANOVA results. For factor 1, Care Value of ICT, the statistical result is F (4, 54)
= 2.007, p = 0.107. Since the p-value is greater than 0.05, the result is not
statistically significant, meaning that the mean factor score does not differ between
ages. Lack of a significant difference between ages is seen for factors 2-4 as well.
The next set of results evaluates whether factor scores differ between
educational levels (Associates Degree, Bachelors Degree, Doctoral Degree, and
Masters Degree). Again, ANOVA determined that there were no statistically
significant differences in factor 1-4 scores with the different educational levels.
While the majority of APCs are educated at the Master’s Level, there are programs
for both NPs and PAs that are offered as a bridge from an AA/ADN (Associates of
Arts/ Associate Diploma Nurse) to the Master’s level for the NP program and
Associates/Bachelor’s and Master’s degrees exist for the PA. These programs,
although few, do still exist in the hopes of gaining a Master’s level of education
for all APCs.
Two-sample t-test is used instead of ANOVA to compare the differences in
gender, female vs. males against factors 1-4. The p-values were greater than 0.05,
which means there were no noted difference in factor 1-4 score when comparing
males and females.
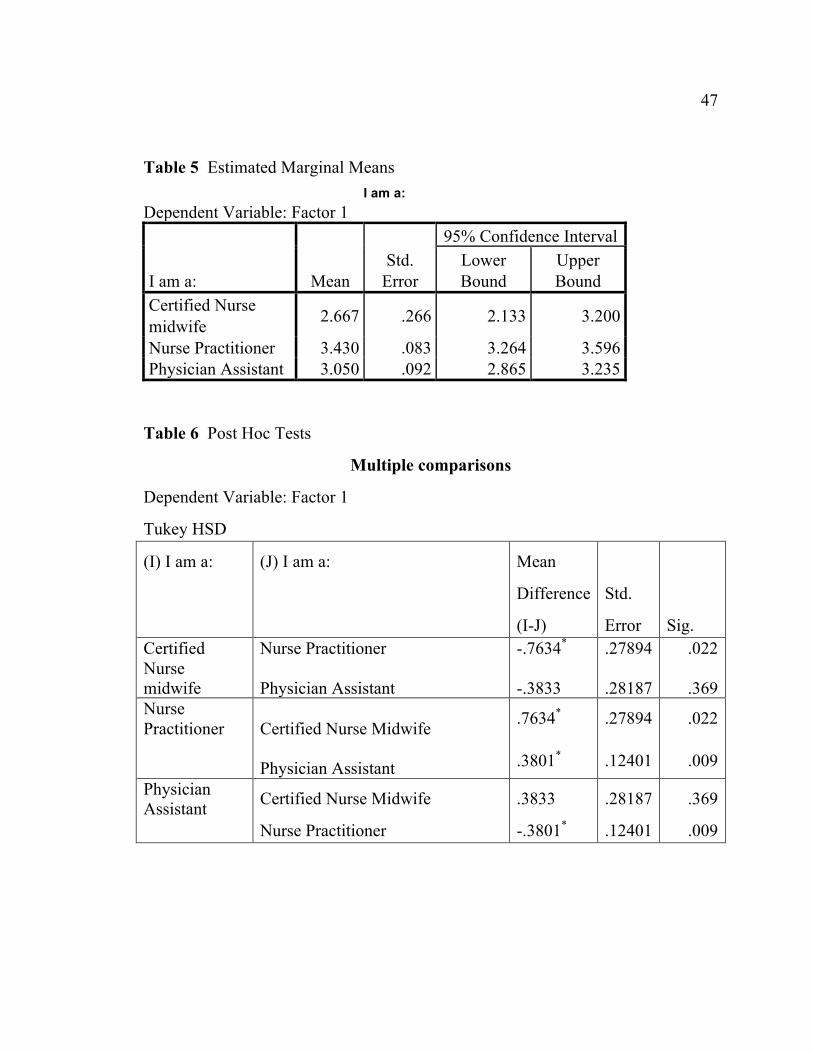
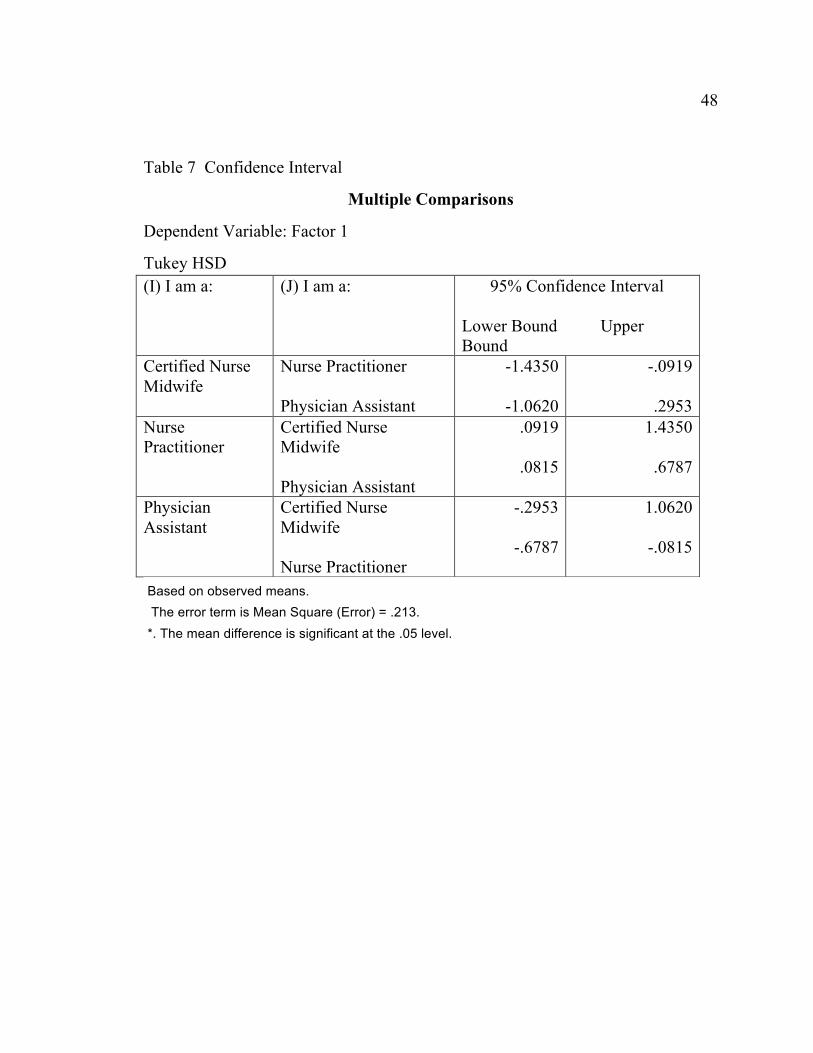
Factor scores were compared between occupations using ANOVA. The
comparison of Certified Nurse Midwives (CNMs) to Nurse Practitioners (NPs), p
= 0.022, differ on factor 1. The mean factor 1 score is 2.667 for CNMs and 3.430
24 24 for NPs, and the difference is statistically significant based on the p-value of
0.022. CNMs do not differ from PAs (p = 0.369), and NP differs from PA (p =
0.009) with NP having a higher factor 1 score on average (Appendix B). Factor 3,
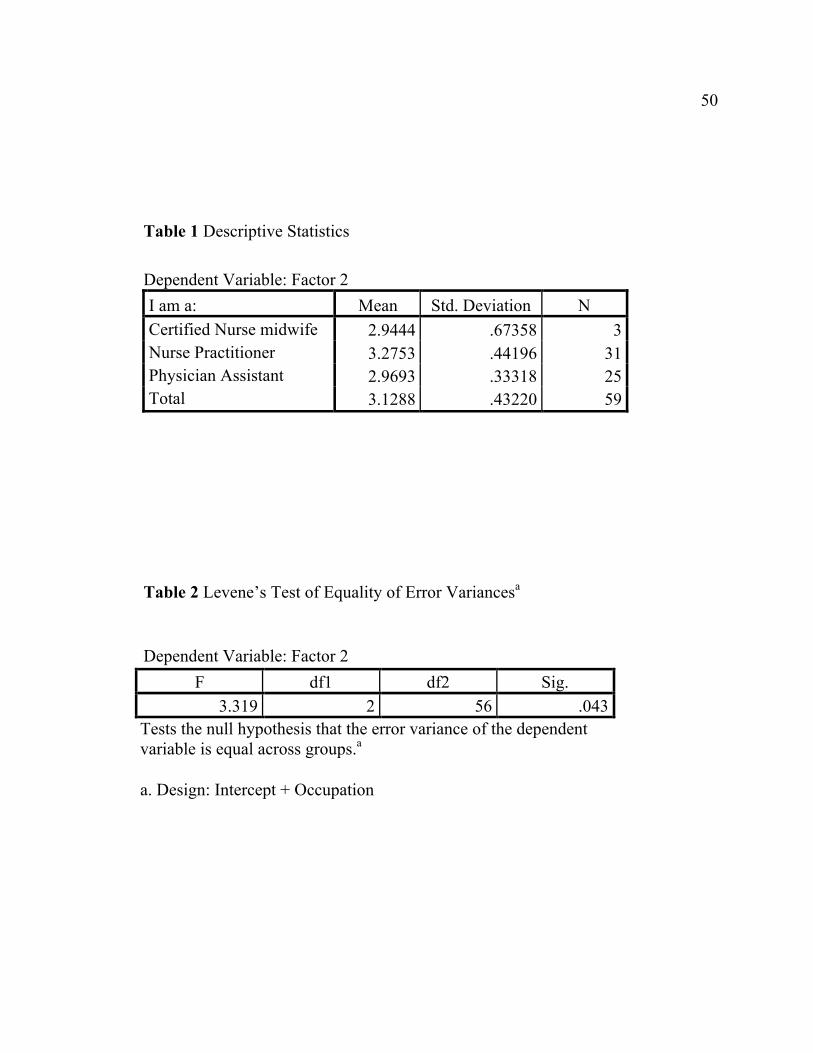
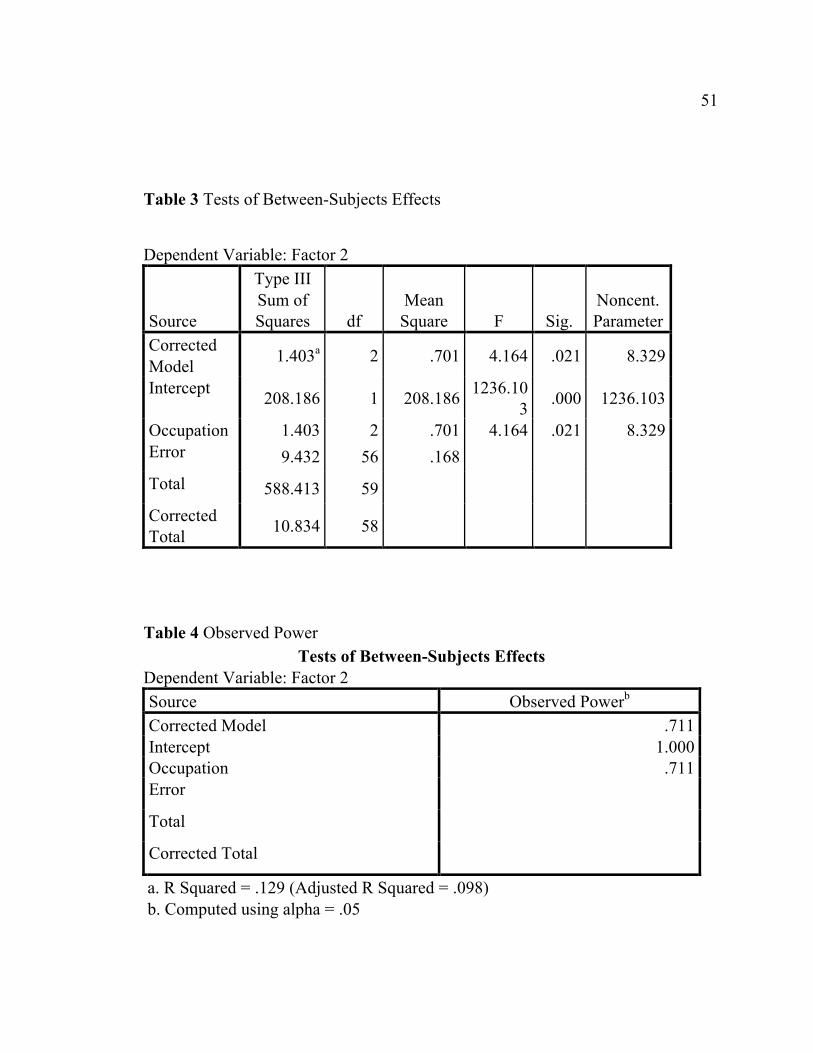
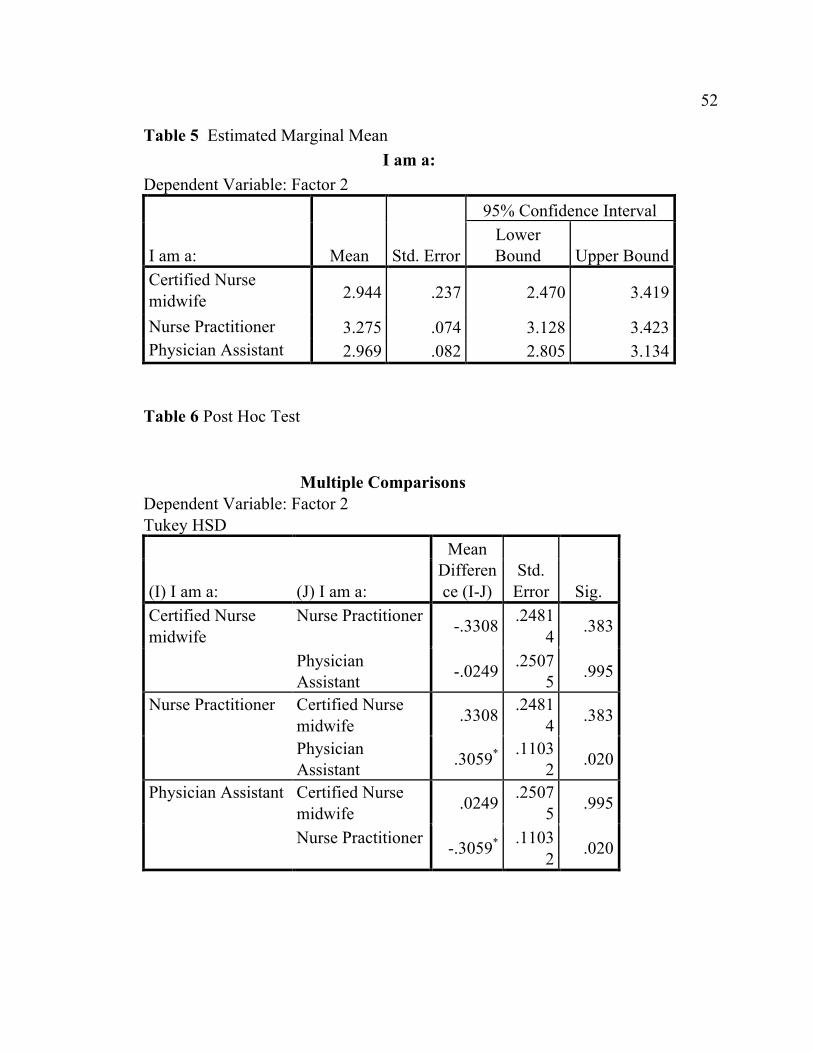
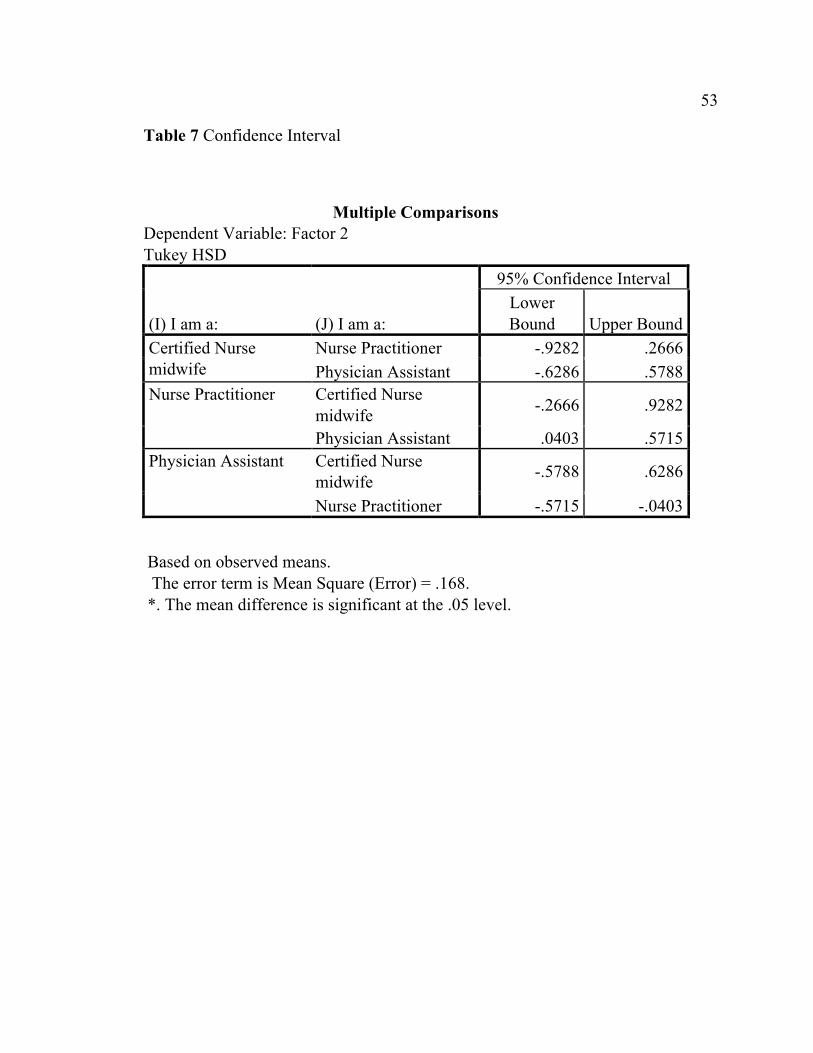
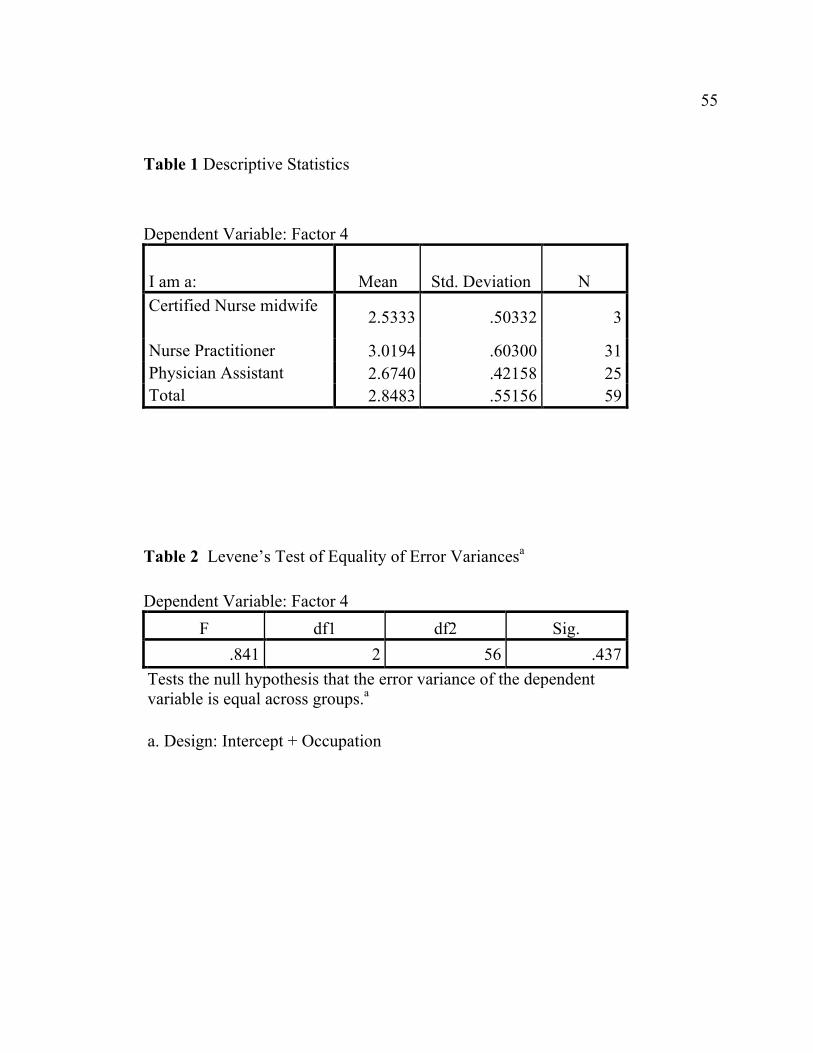
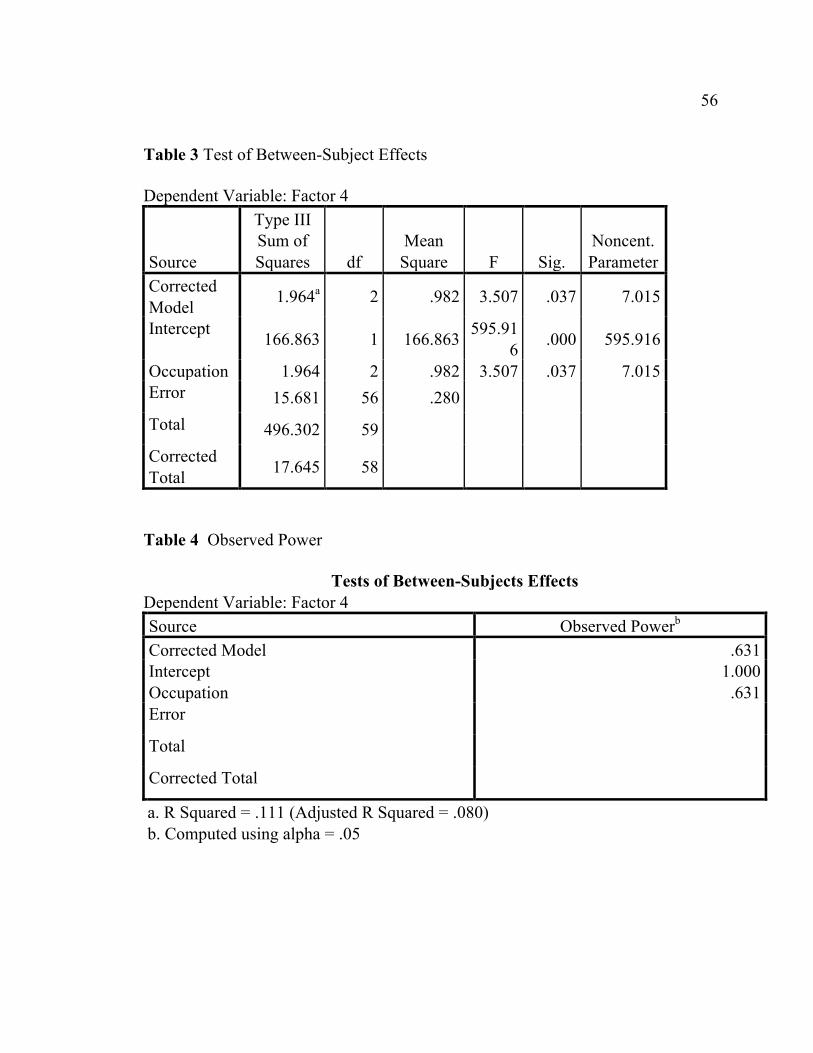
scores do not differ between occupations, but they do for factors 2 (Appendix C)
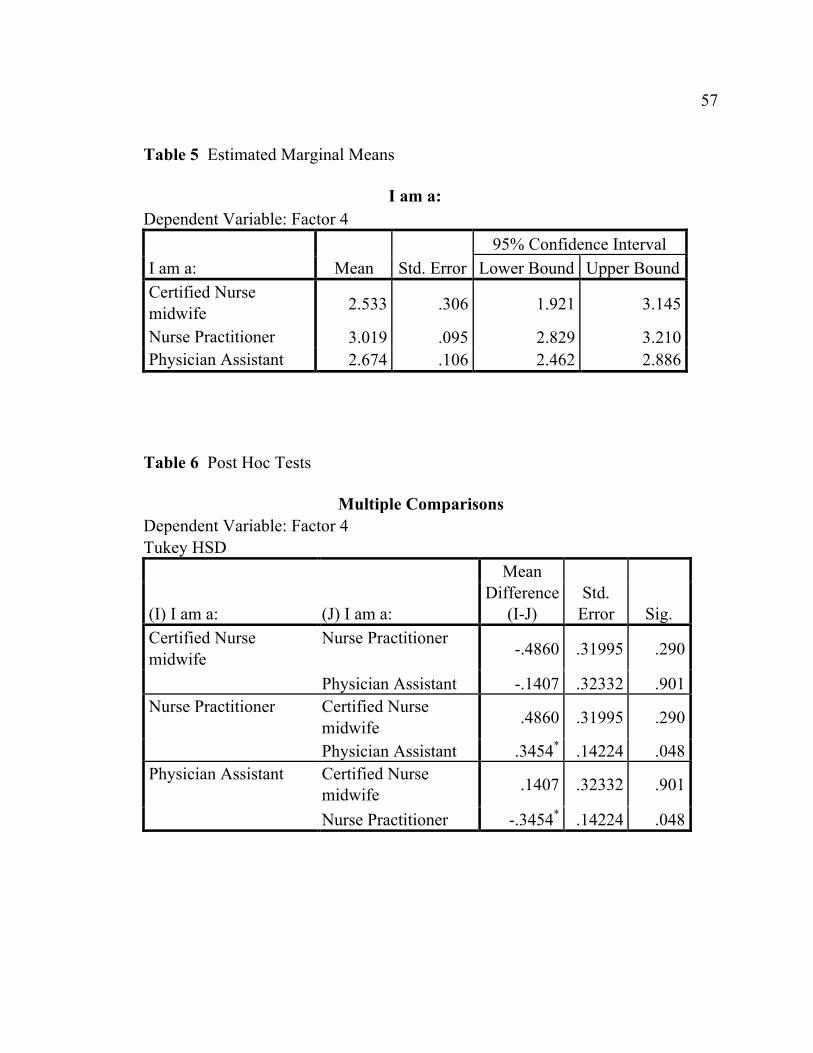
and 4 (Appendix D). Factor 2 score is 3.28 for NPs and 2.97 for PAs (p=0.020)
and Factor 4 score of 3.03 for NPs and 2.67 for PAs (p=0.037).
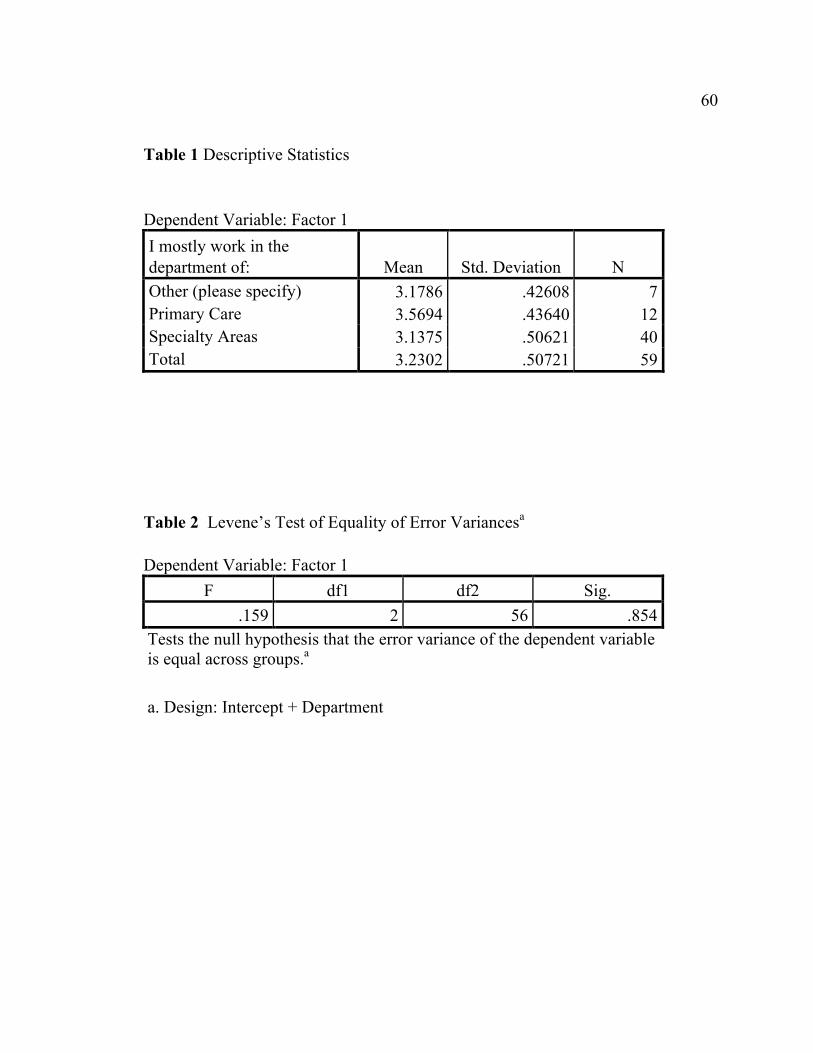
Factor 1 scores differ between departments (p = 0.031), but factor 2, 3, and
4 scores do not differ between departments (p > 0.05 for each ANOVA). Primary
care department scored a factor 1 score of 3.57, higher than Specialty department
factor 1 score of 3.14 (Appendix E).
For ethnicity variable associated with factor 1-4, there are no statistical
differences between ethnicities in any of the factors 1-4 indicated by a p>0.05.
Summary
There are no significant differences in Factors 1-4 scores (Factor 1: Care
Value of Information Communication Technology (ICT); Factor 2: Training of
ICT Skills; Factor 3: ICT Confidence; Factor 4: Workload Value of ICT) with
respect to age, educational level, gender and ethnicity. There were noted
significant differences in Factor 1, 2, and 4 scores in the occupational category
between CNM and NPs and between NP and PAs. NPs had higher factor 1 scores
than both CNMs and PAs. NPs also scored higher than PAs in Factor 2 and 4

25 25 scores. By departments, Primary Care department scored higher than Specialty
departments in Factor 1 score.
CHAPTER 5: CONCLUSION
Outcomes/Discussion
Literature suggests that there may be influences of gender, age and
educational level to attitudes toward ICT. This study did not show any significant
influence, which is consistent with the systemic literature review conducted by
Ward et al. (2008). Workload factor in this study was also not affected by age,
educational level, gender, ethnicity, specialty department or profession which is
inconsistent with literature (Infinedo, 2016; Moody et al., 2004) in which,
educational level and computer knowledge had positive effects on attitudes toward
ICT. Infinedo (2016) also found that number of years nursing experience and age
did not have meaningful results. Interestingly, Primary Care physicians felt an
increased workload due to ICT in prior studies (Ward et al., 2008) whereas in this
study, the workload was not affected or influenced by the different types of APCs
(CNM, NP or PAs). However, by specialty departments, primary care department
had higher care value ICT score than any other department.
The outcomes of this study suggests that NPs overall have a positive
attitude regarding care value of ICT, training of ICT skills and workload value of
ICT when compare to CNM and PAs. Health information technology, overall, has
a positive impact on their served population and thus improved quality of care.
This result is similar to the study by Moody, et al. (2004) in that medical errors
due to order entry and legible charting improved healthcare outcomes.
27 27 Limitations
This study has several limitations. This was a convenient sample of APCs
in a healthcare organization located in Northern California. The results, therefore,
cannot be generalized to any other location that may not have the same
demographics or level of experience with health information technology.
Moreover, the population may have been self selected to those interested in the
topic of health information and communication technology, and due to location in
Silicon Valley where technology is more advanced, the participants are heavily
biased compared to the general population. The shortened version of the ITASH
was also first used to evaluate attitudes of nursing students (Lee & Clarke, 2014)
and not advanced practice nurses in which the duties and experiences between
them are quite different.
Upon further analysis, there seems to have been confusion as to what
department they belonged in with regards to primary care, specialty or other.
There were 10 responses to the “other” (indicating other departments not
mentioned) and consisted of orthopedics, cardiovascular, behavioral health,
palliative medicine, internal medicine, administrative, education, OB/GYN and
urgent care departments. Definition of which department were considered
specialty clinics could have been specified. Definition of what was considered
ICT could have been included in the introduction as there may have been
confusion on how technology pertained in their area of specialty.
28 28
Implications for Nursing Practice
Technology and its increased use in the health care field is constantly
evolving and changing. The attitudes of the end-users, such as advanced practice
nurses, can impact the successful use of that technology (McGonigle & Mastrian,
2014, Ward et al., 2008) and therefore need of constant monitoring. In so doing,
educational and training needs of advanced practice nurses can be identified and
addressed thus improving not only competency, but also job satisfaction, quality
of care, and improved collaboration/team work (Ancker et al., 2013; De
Milt, Fitzpatrick, & McNulty, 2011; Jennings et al., 2014; Koivunen et al., 2015;
Korhonen, Nordman, & Eriksson, 2015).
Recommendations for Further Study
Due to the limitations mentioned, it is recommended that more research on
attitudes towards information technology be conducted to identify other factors,
educational needs that can strongly influence nursing practice and the healthcare
industry as a whole. Further research can also place the new concept of nursing
informatics more strongly in healthcare organizations creating a stronger voice for
the nursing profession as a whole (McGonigle & Mastrian, 2014). This study also
occurred in Silicon Valley where most healthcare professionals have already been
impacted by ICT. It would be interesting to see how attitudes may differ in more
rural areas where technology in healthcare has not yet evolved rapidly or is just
29 29 starting to be accepted as part of the healthcare industry. Most importantly, the
rapidly evolving technology drives the need for constant assessment and
evaluation of attitudes of end users in the healthcare industry to not only have that
technology succeed but also improve patient quality outcomes.
REFERENCES
Ancker, J., Silver, M., Miller, M., & Kaushal, R. (2013). Consumer experience
with and attitudes toward health information technology: a nationwide
survey. Journal of the American Medical Informatics Association (20),
152–156.
Arthur, D., Pang, S., & Wong, T. (2001). The effect of technology on the caring
attributes of an International sample of nurses. International Journal of
Nursing Studies, 38(1), 37-43.
Arthur, D., Pang, S., Wong, T., Alexander, M., Drury, J., et al. (1999). Caring
attributes, professional self-concept and technological influences in a
sample of registered nurses in eleven countries. International Journal of
Nursing Studies, 36(5), 387-396.
Benner P., & Wrubel J. (1989) The primacy of caring, stress and coping in health
and illness. Addison-Wesley Menlo Park, California.
Bornstein, M., Jager, J., & Putnick, D. (2013). Sampling in developmental science:
Situations, shortcomings, solutions, and standards. Developmental Review,
33(4), 357-370.
Bradley, S. (2012). A phenomenological exploration of nurses’ perceptions of the
effects of electronic documentation on healing relationships. Retrieved
from ProQuest Dissertations and Theses database. (UMI No. 3506882).
31 31 Brodell, E. (2009). Views of student nurses on caring and technology in nursing
(Doctoral dissertation). Retrieved from ProQuest Dissertations and Theses
database. (UMI No. 3406182).
De Milt, D., Fitzpatrick, J., & McNulty, S. (2011). Nurse practitioners’ job
satisfaction and intent to leave current positions, the nursing profession, and
the nurse practitioner role as a direct care provider. Journal of the American
Academy of Nurse Practitioners, 23(1), 42-50.
Dextras-Gauthier, J., Marchand, A., & Haines, V. (2012). Organizational culture,
work organization conditions, and mental health: A proposed integration.
International Journal of Stress Management, 19(2), 81-104.
Duffy, J. (2005). Implementing the quality-caring model© in acute care. JONA:
The Journal of Nursing Administration, 35(1), 4-6.
Duffy, J. (2005). Chapter 4: Want to graduate nurses who care? assessing nursing
students' caring competencies. Annual Review of Nursing Education, 3, 59-
77.
Duffy, J. (2009). Quality caring in nursing : Applying theory to clinical practice,
education, and leadership. New York: Springer Pub.
Duffy, J. (2015). Theories focused on caring. In J.B. Butts & K.L. Rich,
Philosophies and theories for advanced nursing practice (2nd Ed), (pp.506-
513). Burlington, MA: Jones and Bartlett Learning.
32 32 Edwards, S. (2001). Benner and Wrubel on caring in nursing. Journal of Advanced
Nursing, 33(2), 167-171.
Eggenberger, T., Keller, K., Chase, S., & Payne, L. (2012). A quantitative
approach to evaluating caring in nursing simulation. Nursing Education
Perspectives, 33(6), 406.
Ferguson, L. (2004). External validity, generalizability, and knowledge utilization.
Journal of Nursing Scholarship, 36(1), 16-22.
Gaut, D. A. (1983). Development of a theoretical adequate description of caring.
Western Journal of Nursing Research, 5, 313-323.
Hawkins, S. (2012). Telehealth nurse practitioner student clinical experiences: An
essential educational component for today's health care setting. Nurse
Education Today, 32(8), 842-845
Hess, C., & Heuer, L. (2003) Technology confidence survey. (Available from HB
Consultation & Evaluation Associates, 1506 South 15th Street, Grand
Forks, ND 58201)
Hsu, J., Huang, J., Fung, V., Robertson, N., Jimison, H., et al. (2005). Health
information technology and physician-patient interactions: Impact of
computers on communication during outpatient primary care visits.
Journal of the American Medical Informatics Association, 12(4), 474-480.
Huston, C. (2013). The impact of emerging technology on nursing care: Warp
speed ahead. Online Journal of Issues in Nursing, 18(2), 108.
33 33 Infinedo, P. (2016). The moderating of demographic and individual
characteristics on nurses’ acceptance of information systems: a Canadian
Study. International Journal of Medical Informatics, 87. 27-35.
Jayasuriya R, Caputi P (1996) Computer attitude and computer anxiety in nursing:
validation of an instrument using an Australian sample. Computers in
Nursing. 14, 6, 340-345.
Jennings, N., Clifford, S., Fox, A., O’Connell, J., Gardner, D. (2014). The impact
of nurse practitioner services on cost, quality of care, satisfaction and
waiting times in the emergency department: A systematic review.
International Journal of Nursing Studies 52, 421-435.
Kinchen, E. (2015). Development of a quantitative measure of holistic nursing
care. Journal of Holistic Nursing: Official Journal of the American Holistic
Nurses' Association, 33(3), 238.
Koivunen, M., Anttila, M., Kuosmanen, L., Katajisto, J., & Valimaki, M. (2015).
Team climate and attitudes toward information and communication
technology among nurses on acute psychiatric wards. Informatics for
Health and Social Care, 40(1): 79–90.
Korhonen, E., Nordman, T., & Eriksson, K. (2015). Technology and its ethics in
nursing and caring journals. Nursing Ethics, 22(5), 561.
Kyle TV (1995) The concept of caring: a review of the literature. Journal of
Advanced Nursing 21, 506–514.
34 34 Lee, J., & Clarke, C. (2015). Nursing students' attitudes towards information and
communication technology: An exploratory and confirmatory factor
analytic approach. Journal of Advanced Nursing, 71(5), 1181-1193.
Leininger, M. (1977). The phenomenon of caring. Part V. Caring: The essence and
central focus of nursing. Nursing Research Report, 12, 2-14.
Leininger, M. M., ed. (1984) Care: The essence of nursing and health. Slack, New
York.
Liederman, E., Lee, J., Baquero, V., & Seites, P. (2005). Patient-physician web
messaging: The impact on message volume and satisfaction. Journal of
General Internal Medicine, 20(1), 52-57.
Loyd, B. & Gressard, C. (1984) Reliability and factorial validity of computer
attitude scales. Educational and Psychological Measurement. 44. 501-505.
Malone, R. (2003). Distal nursing. Social Science & Medicine, 56(11), 2317.
McFarlane, T.,Green, K., & Hoffman, E. (1997) Teachers’ attitudes toward
technology: Psychometric evaluation of the Technology Attitude Survey.
Paper presented at the Annual Meeting of the American Educational
Research Association in Chicago, IL. March 1997.
McGonigle, D., & Mastrian, K. (2014). Nursing Informatics and the Foundation of
Knowledge (3rd Edition). Sudbury, MA: Jones & Bartlett Learning.
Moody, L., Slocumb, E., Berg, B. & Jackson, D. (2004). Electronic records
documentation in nursing. Computers, Informatics, Nursing 2, 337–44.
35 35 Nagel, D., Pomerleau, S., & Penner, J. (2013). Knowing, caring, and telehealth
technology: “going the distance” in nursing practice. Journal of Holistic
Nursing, 31(2), 104-112.
Nunnally, J., & Bernstein, I. (1994). Psychometric theory (3rd ed.). New York,
NY: McGraw Hill.
Owens, M. (2013). The effects of Watson’s theory of caring and the nurse
utilization of caring attributes (Master’s thesis). Retrieved from ProQuest
Dissertations and Theses database. (UMI No. 1548397).
Sandelowski, M. (2000). Combining qualitative and quantitative sampling, data
collection, and analysis techniques in mixed�method studies. Research in
Nursing & Health, 23(3), 246-255.
Sanders, C., Rogers, A., Bowen, R., Bower, P., Hirani S., Cartwright, M.,
Fitzpatrick, R., Knapp,M., Barlow J., Hendy, J., Chrysanthaki, T., Bardsley,
M. & Newman, S. (2012) Exploring barriers to participation and adoption
of telehealth and telecare within the Whole System Demonstrator trial: a
qualitative study. BMC Health Services Research 12, 220.
doi:10.1186/1472-6963-12-220.
Shea, M. (2008). Determined persistence: Achieving and sustaining job satisfaction
among nurse practitioners. n.p.: ProQuest Dissertations Publishing.
Spencer L., Ritchie J. & O’Connor W. (2003) Analysis: practices, principles and
processes. In Qualitative research practice: A guide for social science
36 36 students and researchers (Ritchie J. & Lewis J., eds), Sage, London, pp.
199–218.
Stronge, J. & Brodt, A. (1985) Assessment of nurses’ attitudes toward
computerization. Computers in Nursing 3(4), 154–158.
Taylor, J., Coates, E., Brewster, L., Mountain, G., Wessels, B., Hawley, M.
(2015). Examining the use of telehealth in community nursing: Identifying
the factors affecting frontline staff acceptance and telehealth adoption.
Journal of Advanced Nursing, 71(2), 326-337.
Varghese, S. (2009). A naturalistic inquiry on caring in telehealth (Doctoral
dissertation). Retrieved from ProQuest Dissertations and Theses database.
(UMI No. 3367485).
Ward, R., Glogowska, M., Pollard, K. & Moule, P. (2006) Information technology
attitude scales for health (ITASH): Project Report. University of the West
of England, Bristol.
Ward, R., Glogowska, M., Pollard, K. & Moule, P. (2009) Developing and testing
attitude scales around IT. Nurse Researcher 17(1), 77-87
Ward, R., Stevens C., Brentnall P. & Briddon J. (2008) The attitudes of health care
staff to information technology: a comprehensive review of the research
literature. Health Information & Libraries Journal 25(2), 81–97.
Watson J. (1979) Nursing: The philosophy and science of caring. University Press
of Colorado, Boulder.
37 37 Watson, J. (2002). Assessing and measuring caring in nursing and health science.
NewYork: Springer.
Watson, R., & Lea., A. (1997). The caring dimensions inventory (CDI): content
validity, reliability and scaling. Journal of Advanced Nursing 25, 87–94.
Watson, R., Deary, I., & Hoogbruin, A. (2001) A 35-item version of the caring
dimensions inventory (CDI – 35): multivariate analysis and application to a
longitudinal study involving student nurses. International Journal of
Nursing Studies 38, 511–521.
Wild, P., Parsons, V., & Dietz, E. (2006). Nurse practitioner's characteristics and
job satisfaction. Journal of the American Academy of Nurse Practitioners,
18(11), 544-549.

38 38
APPENDICES

APPENDIX A: DEMOGRAPHICS/ITASH SURVEY
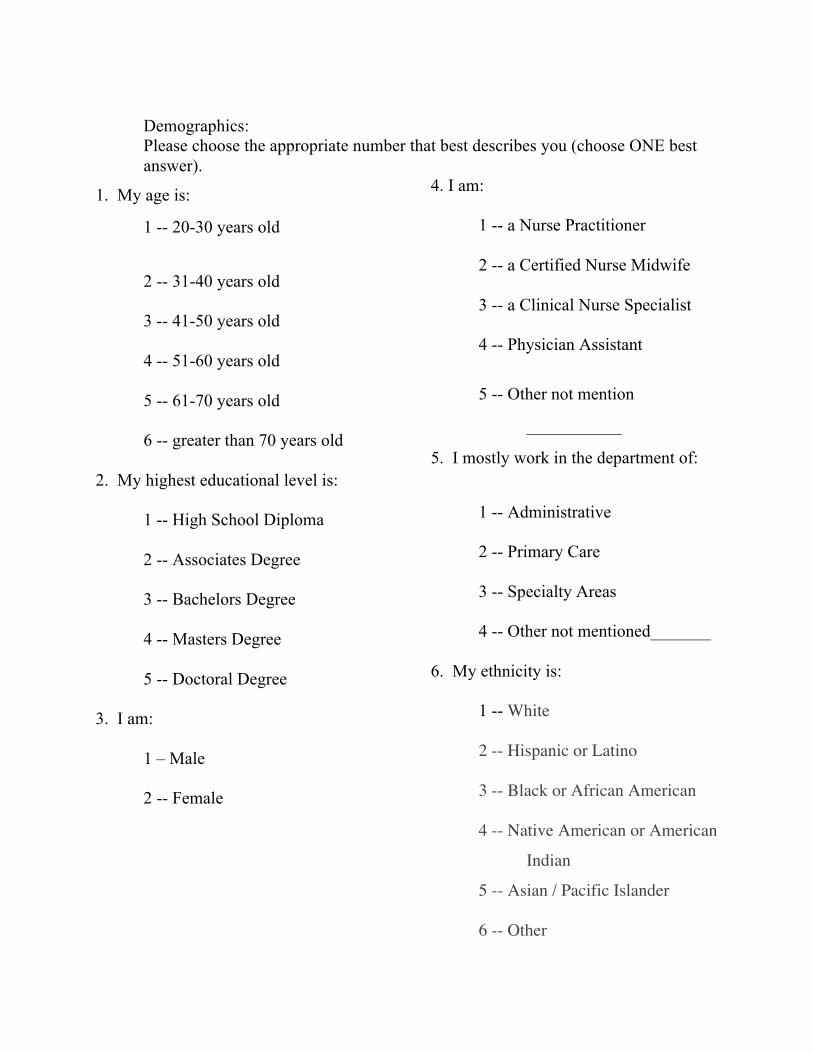
Demographics: Please choose the appropriate number that best describes you (choose ONE best answer).
1. My age is:
1 -- 20-30 years old
2 -- 31-40 years old
3 -- 41-50 years old
4 -- 51-60 years old
5 -- 61-70 years old
6 -- greater than 70 years old
2. My highest educational level is:
1 -- High School Diploma
2 -- Associates Degree
3 -- Bachelors Degree
4 -- Masters Degree
5 -- Doctoral Degree
3. I am:
1 – Male
2 -- Female
4. I am:
1 -- a Nurse Practitioner
2 -- a Certified Nurse Midwife
3 -- a Clinical Nurse Specialist
4 -- Physician Assistant
5 -- Other not mention
___________
5. I mostly work in the department of:
1 -- Administrative
2 -- Primary Care
3 -- Specialty Areas
4 -- Other not mentioned_______
6. My ethnicity is:
1 -- White
2 -- Hispanic or Latino
3 -- Black or African American
4 -- Native American or American
Indian
5 -- Asian / Pacific Islander
6 -- Other
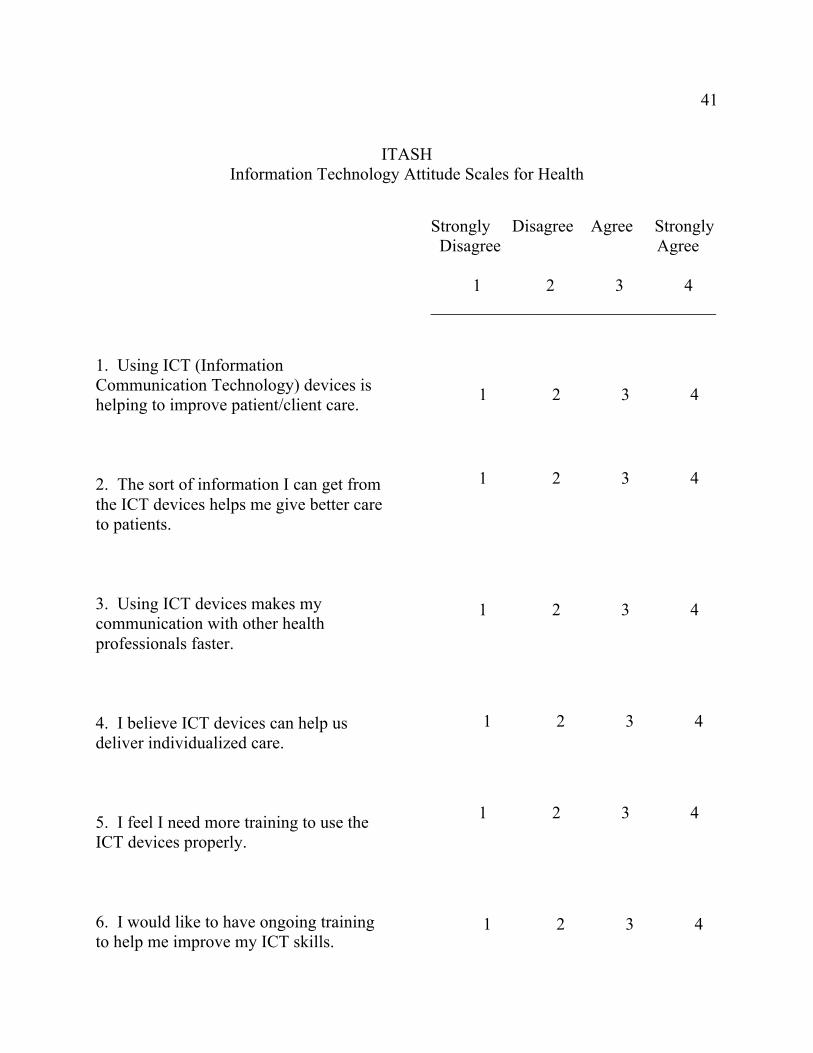
41
ITASH Information Technology Attitude Scales for Health
1. Using ICT (Information Communication Technology) devices is helping to improve patient/client care. 2. The sort of information I can get from the ICT devices helps me give better care to patients. 3. Using ICT devices makes my communication with other health professionals faster. 4. I believe ICT devices can help us deliver individualized care. 5. I feel I need more training to use the ICT devices properly. 6. I would like to have ongoing training to help me improve my ICT skills.
Strongly Disagree Agree Strongly Disagree Agree 1 2 3 4 _________________________________
1 2 3 4
1 2 3 4
1 2 3 4
1 2 3 4
1 2 3 4
1 2 3 4
42
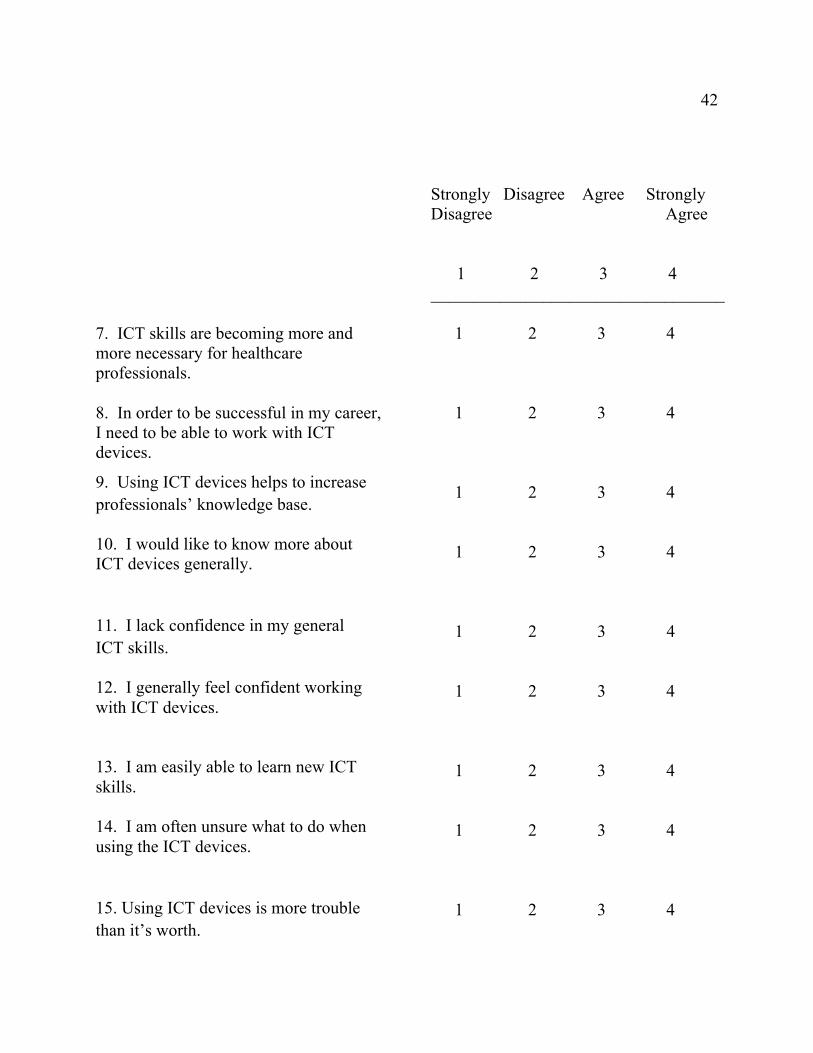
7. ICT skills are becoming more and more necessary for healthcare professionals. 8. In order to be successful in my career, I need to be able to work with ICT devices.
9. Using ICT devices helps to increase professionals’ knowledge base. 10. I would like to know more about ICT devices generally.
11. I lack confidence in my general ICT skills. 12. I generally feel confident working with ICT devices. 13. I am easily able to learn new ICT skills. 14. I am often unsure what to do when using the ICT devices.
15. Using ICT devices is more trouble than it’s worth.
Strongly Disagree Agree Strongly Disagree Agree 1 2 3 4 __________________________________ 1 2 3 4 __________________________________
1 2 3 4 1 2 3 4 1 2 3 4 1 2 3 4 1 2 3 4 1 2 3 4 1 2 3 4 1 2 3 4 1 2 3 4
43
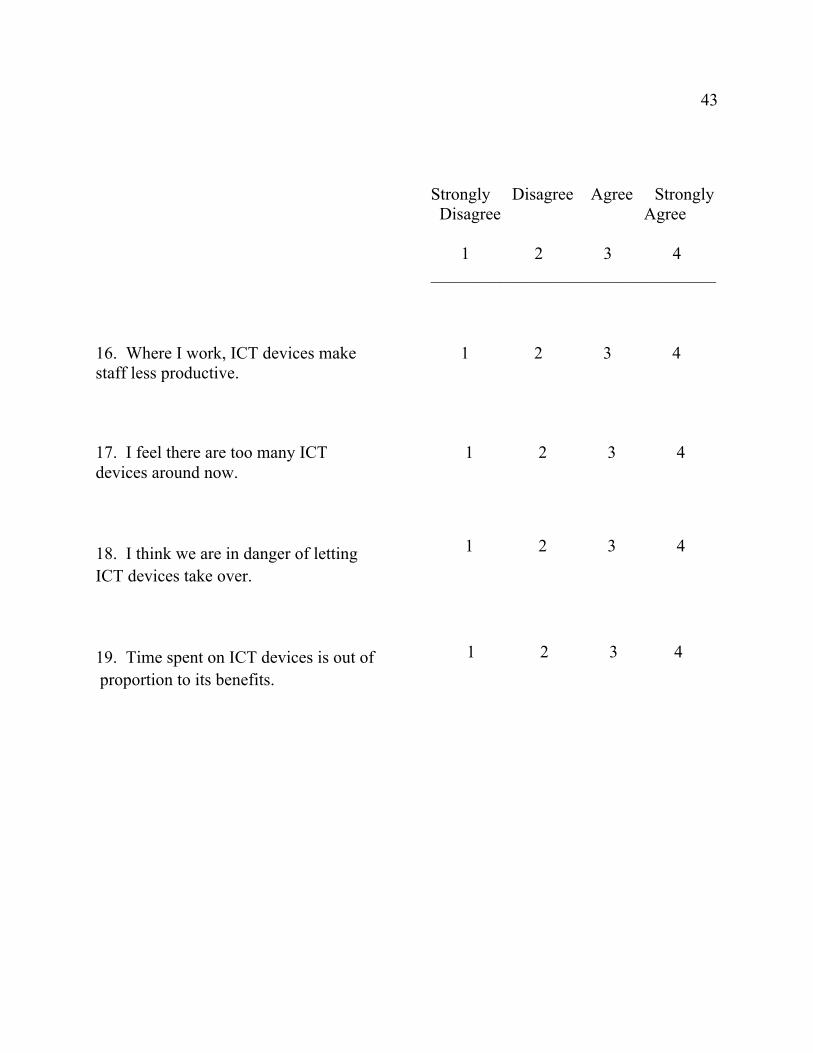
16. Where I work, ICT devices make staff less productive. 17. I feel there are too many ICT devices around now.
18. I think we are in danger of letting ICT devices take over.
19. Time spent on ICT devices is out of proportion to its benefits.
Strongly Disagree Agree Strongly Disagree Agree 1 2 3 4 _________________________________
1 2 3 4 1 2 3 4
1 2 3 4
1 2 3 4

APPENDIX B: OCCUPATION AND FACTOR 1 ANOVA
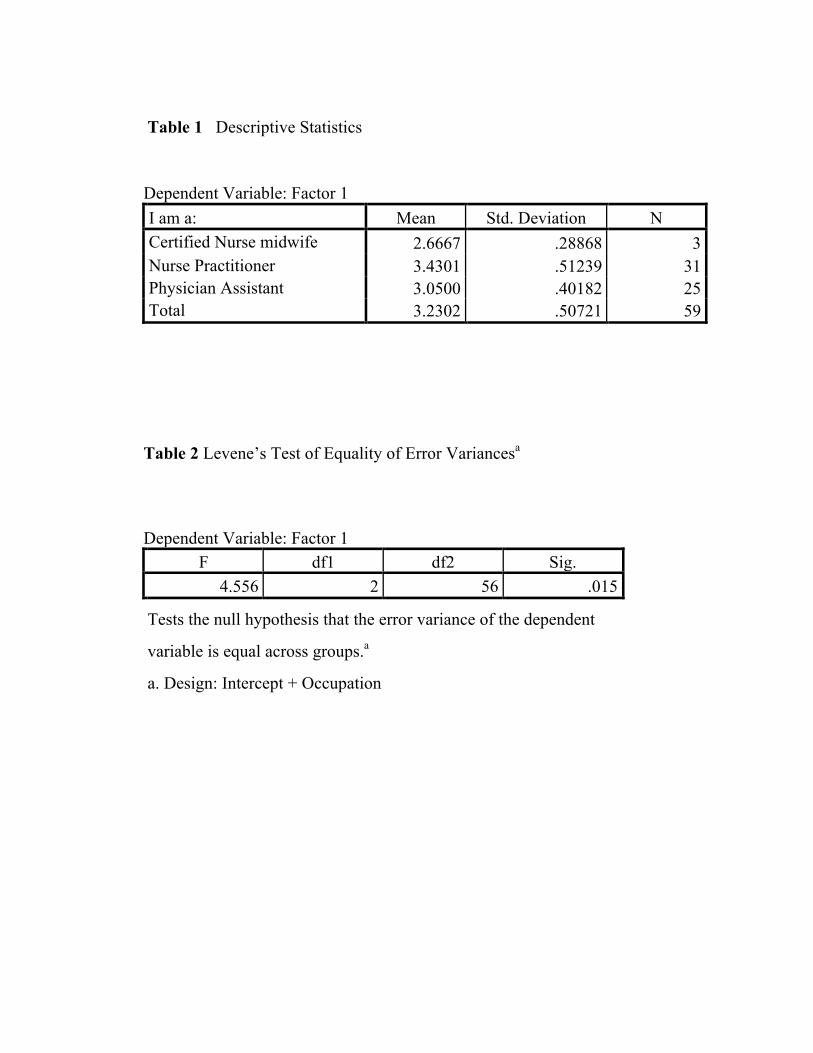
Table 1 Descriptive Statistics
Dependent Variable: Factor 1 I am a: Mean Std. Deviation N Certified Nurse midwife 2.6667 .28868 3 Nurse Practitioner 3.4301 .51239 31 Physician Assistant 3.0500 .40182 25 Total 3.2302 .50721 59
Table 2 Levene’s Test of Equality of Error Variancesa
Dependent Variable: Factor 1 F df1 df2 Sig.
4.556 2 56 .015
Tests the null hypothesis that the error variance of the dependent
variable is equal across groups.a
a. Design: Intercept + Occupation
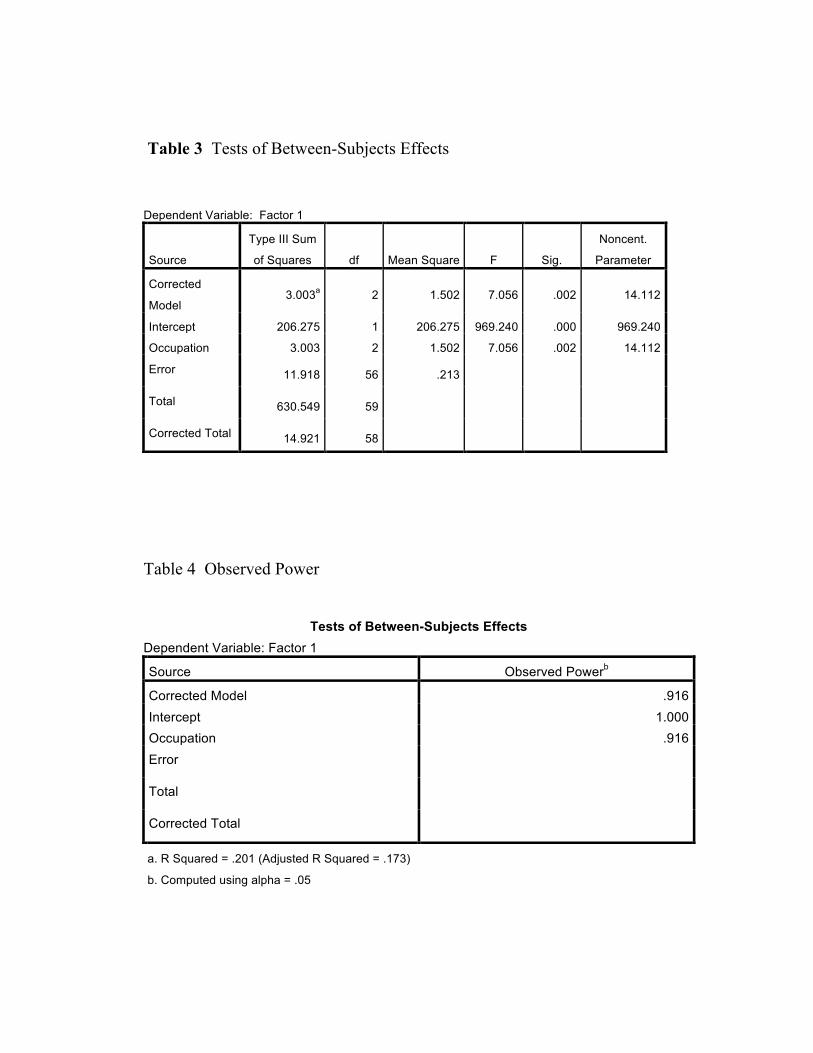
Table 3 Tests of Between-Subjects Effects
Dependent Variable: Factor 1
Source
Type III Sum
of Squares df Mean Square F Sig.
Noncent.
Parameter
Corrected
Model 3.003a 2 1.502 7.056 .002 14.112
Intercept 206.275 1 206.275 969.240 .000 969.240
Occupation 3.003 2 1.502 7.056 .002 14.112
Error 11.918 56 .213 Total 630.549 59 Corrected Total 14.921 58
Table 4 Observed Power
Tests of Between-Subjects Effects
Dependent Variable: Factor 1
Source Observed Powerb
Corrected Model .916 Intercept 1.000 Occupation .916 Error
Total
Corrected Total
a. R Squared = .201 (Adjusted R Squared = .173)
b. Computed using alpha = .05
47 47
Table 5 Estimated Marginal Means I am a:
Dependent Variable: Factor 1
I am a: Mean Std.
Error
95% Confidence Interval Lower Bound
Upper Bound
Certified Nurse midwife 2.667 .266 2.133 3.200
Nurse Practitioner 3.430 .083 3.264 3.596 Physician Assistant 3.050 .092 2.865 3.235
Table 6 Post Hoc Tests
Multiple comparisons
Dependent Variable: Factor 1
Tukey HSD
(I) I am a: (J) I am a: Mean
Difference
(I-J)
Std.
Error
Sig. Certified Nurse midwife
Nurse Practitioner Physician Assistant
-.7634* -.3833
.27894 .28187
.022
.369 Nurse Practitioner
Certified Nurse Midwife Physician Assistant
.7634*
.3801*
.27894 .12401
.022
.009
Physician Assistant Certified Nurse Midwife
Nurse Practitioner
.3833
-.3801*
.28187
.12401
.369
.009
48 48
Table 7 Confidence Interval
Multiple Comparisons
Dependent Variable: Factor 1
Tukey HSD (I) I am a: (J) I am a: 95% Confidence Interval
Lower Bound Upper Bound
Certified Nurse Midwife
Nurse Practitioner Physician Assistant
-1.4350
-1.0620
-.0919
.2953 Nurse Practitioner
Certified Nurse Midwife Physician Assistant
.0919
.0815
1.4350
.6787
Physician Assistant
Certified Nurse Midwife Nurse Practitioner
-.2953
-.6787
1.0620
-.0815
Based on observed means. The error term is Mean Square (Error) = .213. *. The mean difference is significant at the .05 level.

49 49
APPENDIX C: OCCUPATION AND FACTOR 2 ANOVA
50 50
Table 1 Descriptive Statistics
Dependent Variable: Factor 2 I am a: Mean Std. Deviation N Certified Nurse midwife 2.9444 .67358 3 Nurse Practitioner 3.2753 .44196 31 Physician Assistant 2.9693 .33318 25 Total 3.1288 .43220 59
Table 2 Levene’s Test of Equality of Error Variancesa
Dependent Variable: Factor 2 F df1 df2 Sig.
3.319 2 56 .043 Tests the null hypothesis that the error variance of the dependent variable is equal across groups.a
a. Design: Intercept + Occupation
51 51
Table 3 Tests of Between-Subjects Effects
Dependent Variable: Factor 2
Source
Type III Sum of Squares df
Mean Square F Sig.
Noncent. Parameter
Corrected Model 1.403a 2 .701 4.164 .021 8.329
Intercept 208.186 1 208.186 1236.103 .000 1236.103
Occupation 1.403 2 .701 4.164 .021 8.329 Error 9.432 56 .168 Total 588.413 59 Corrected Total 10.834 58
Table 4 Observed Power Tests of Between-Subjects Effects
Dependent Variable: Factor 2 Source Observed Powerb Corrected Model .711 Intercept 1.000 Occupation .711 Error Total Corrected Total a. R Squared = .129 (Adjusted R Squared = .098) b. Computed using alpha = .05
52 52
Table 5 Estimated Marginal Mean I am a:
Dependent Variable: Factor 2
I am a: Mean Std. Error
95% Confidence Interval Lower Bound Upper Bound
Certified Nurse midwife 2.944 .237 2.470 3.419
Nurse Practitioner 3.275 .074 3.128 3.423 Physician Assistant 2.969 .082 2.805 3.134
Table 6 Post Hoc Test
Multiple Comparisons Dependent Variable: Factor 2 Tukey HSD
(I) I am a: (J) I am a:
Mean Difference (I-J)
Std. Error Sig.
Certified Nurse midwife
Nurse Practitioner -.3308 .24814 .383
Physician Assistant -.0249 .2507
5 .995
Nurse Practitioner Certified Nurse midwife .3308 .2481
4 .383
Physician Assistant .3059* .1103
2 .020
Physician Assistant Certified Nurse midwife .0249 .2507
5 .995
Nurse Practitioner -.3059* .11032 .020
53 53
Table 7 Confidence Interval
Multiple Comparisons Dependent Variable: Factor 2 Tukey HSD
(I) I am a: (J) I am a:
95% Confidence Interval Lower Bound Upper Bound
Certified Nurse midwife
Nurse Practitioner -.9282 .2666 Physician Assistant -.6286 .5788
Nurse Practitioner Certified Nurse midwife -.2666 .9282
Physician Assistant .0403 .5715 Physician Assistant Certified Nurse
midwife -.5788 .6286
Nurse Practitioner -.5715 -.0403
Based on observed means. The error term is Mean Square (Error) = .168. *. The mean difference is significant at the .05 level.

APPENDIX D: OCCUPATION AND FACTOR 4 ANOVA
55 55
Table 1 Descriptive Statistics
Dependent Variable: Factor 4
I am a: Mean Std. Deviation N Certified Nurse midwife
2.5333 .50332 3
Nurse Practitioner 3.0194 .60300 31 Physician Assistant 2.6740 .42158 25 Total 2.8483 .55156 59
Table 2 Levene’s Test of Equality of Error Variancesa
Dependent Variable: Factor 4 F df1 df2 Sig.
.841 2 56 .437 Tests the null hypothesis that the error variance of the dependent variable is equal across groups.a
a. Design: Intercept + Occupation
56 56
Table 3 Test of Between-Subject Effects Dependent Variable: Factor 4
Source
Type III Sum of Squares df
Mean Square F Sig.
Noncent. Parameter
Corrected Model 1.964a 2 .982 3.507 .037 7.015
Intercept 166.863 1 166.863 595.916 .000 595.916
Occupation 1.964 2 .982 3.507 .037 7.015 Error 15.681 56 .280 Total 496.302 59 Corrected Total 17.645 58
Table 4 Observed Power
Tests of Between-Subjects Effects Dependent Variable: Factor 4 Source Observed Powerb Corrected Model .631 Intercept 1.000 Occupation .631 Error Total Corrected Total a. R Squared = .111 (Adjusted R Squared = .080) b. Computed using alpha = .05
57 57
Table 5 Estimated Marginal Means
I am a: Dependent Variable: Factor 4
I am a: Mean Std. Error 95% Confidence Interval
Lower Bound Upper Bound Certified Nurse midwife 2.533 .306 1.921 3.145
Nurse Practitioner 3.019 .095 2.829 3.210 Physician Assistant 2.674 .106 2.462 2.886
Table 6 Post Hoc Tests
Multiple Comparisons Dependent Variable: Factor 4 Tukey HSD
(I) I am a: (J) I am a:
Mean Difference
(I-J) Std.
Error Sig. Certified Nurse midwife
Nurse Practitioner -.4860 .31995 .290
Physician Assistant -.1407 .32332 .901 Nurse Practitioner Certified Nurse
midwife .4860 .31995 .290
Physician Assistant .3454* .14224 .048 Physician Assistant Certified Nurse
midwife .1407 .32332 .901
Nurse Practitioner -.3454* .14224 .048
58 58
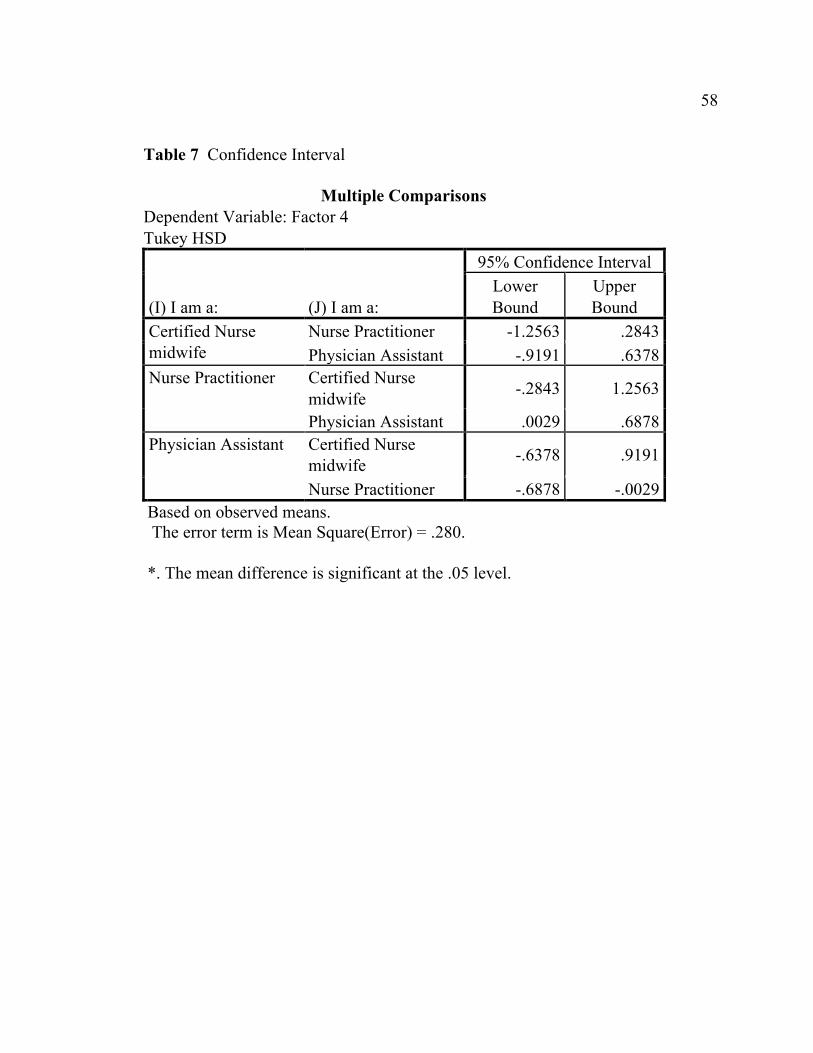
Table 7 Confidence Interval
Multiple Comparisons Dependent Variable: Factor 4 Tukey HSD
(I) I am a: (J) I am a:
95% Confidence Interval Lower Bound
Upper Bound
Certified Nurse midwife
Nurse Practitioner -1.2563 .2843 Physician Assistant -.9191 .6378
Nurse Practitioner Certified Nurse midwife -.2843 1.2563
Physician Assistant .0029 .6878 Physician Assistant Certified Nurse
midwife -.6378 .9191
Nurse Practitioner -.6878 -.0029 Based on observed means. The error term is Mean Square(Error) = .280.
*. The mean difference is significant at the .05 level.

59 59
APPENDIX E: DEPARTMENT AND FACTOR 1 ANOVA
60 60
Table 1 Descriptive Statistics
Dependent Variable: Factor 1 I mostly work in the department of: Mean Std. Deviation N Other (please specify) 3.1786 .42608 7 Primary Care 3.5694 .43640 12 Specialty Areas 3.1375 .50621 40 Total 3.2302 .50721 59
Table 2 Levene’s Test of Equality of Error Variancesa
Dependent Variable: Factor 1 F df1 df2 Sig.
.159 2 56 .854 Tests the null hypothesis that the error variance of the dependent variable is equal across groups.a
a. Design: Intercept + Department
61 61
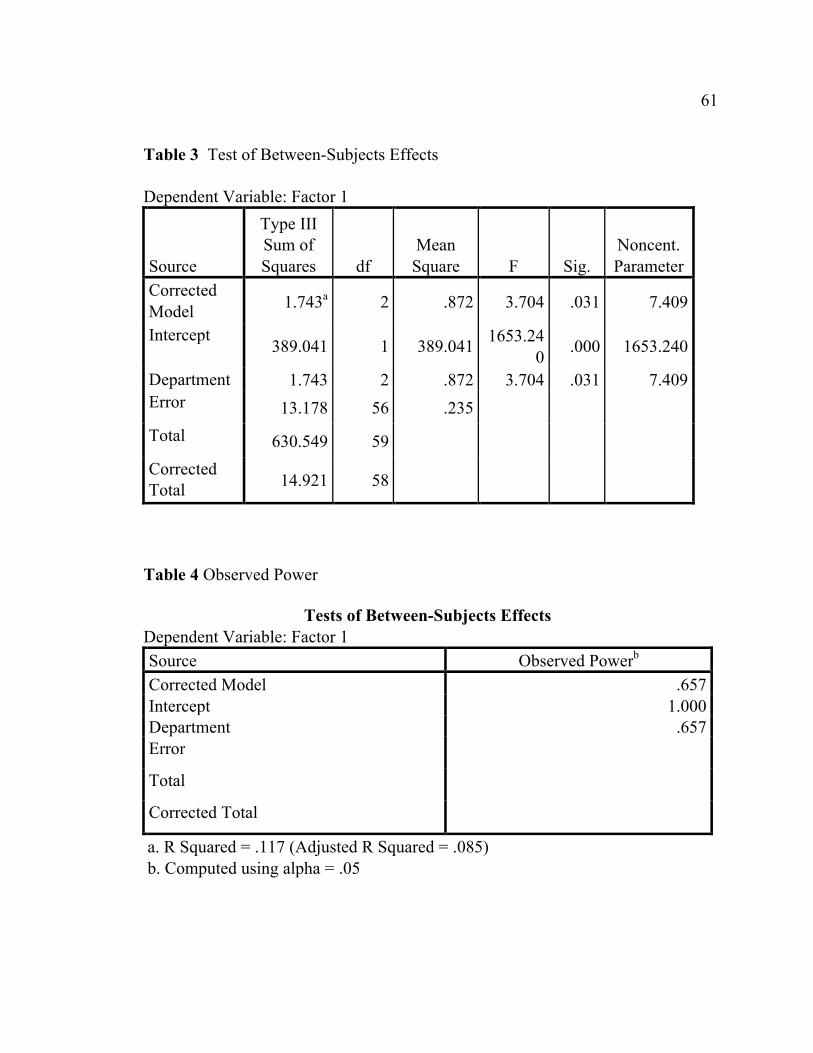
Table 3 Test of Between-Subjects Effects Dependent Variable: Factor 1
Source
Type III Sum of Squares df
Mean Square F Sig.
Noncent. Parameter
Corrected Model 1.743a 2 .872 3.704 .031 7.409
Intercept 389.041 1 389.041 1653.24
0 .000 1653.240
Department 1.743 2 .872 3.704 .031 7.409 Error 13.178 56 .235 Total 630.549 59 Corrected Total 14.921 58
Table 4 Observed Power
Tests of Between-Subjects Effects Dependent Variable: Factor 1 Source Observed Powerb Corrected Model .657 Intercept 1.000 Department .657 Error Total Corrected Total a. R Squared = .117 (Adjusted R Squared = .085) b. Computed using alpha = .05
62 62
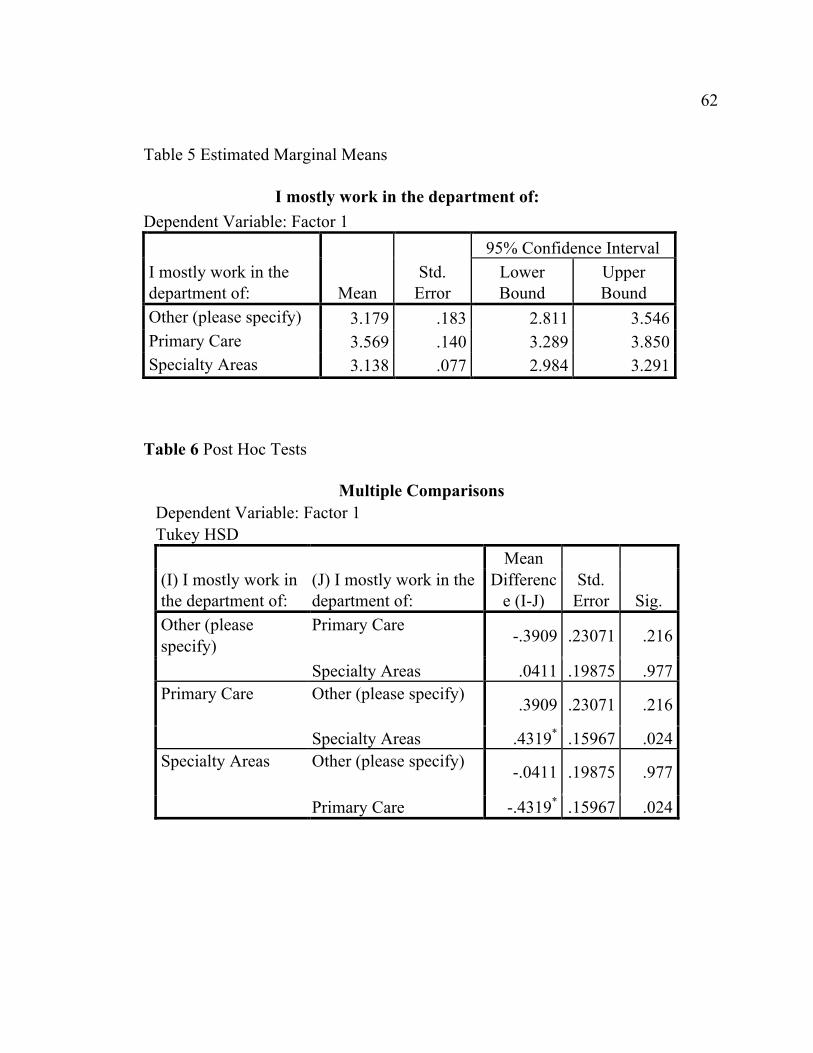
Table 5 Estimated Marginal Means
I mostly work in the department of: Dependent Variable: Factor 1
I mostly work in the department of: Mean
Std. Error
95% Confidence Interval Lower Bound
Upper Bound
Other (please specify) 3.179 .183 2.811 3.546 Primary Care 3.569 .140 3.289 3.850 Specialty Areas 3.138 .077 2.984 3.291
Table 6 Post Hoc Tests
Multiple Comparisons Dependent Variable: Factor 1 Tukey HSD
(I) I mostly work in the department of:
(J) I mostly work in the department of:
Mean Differenc
e (I-J) Std.
Error Sig. Other (please specify)
Primary Care -.3909 .23071 .216
Specialty Areas .0411 .19875 .977 Primary Care Other (please specify) .3909 .23071 .216
Specialty Areas .4319* .15967 .024 Specialty Areas Other (please specify) -.0411 .19875 .977
Primary Care -.4319* .15967 .024
63 63
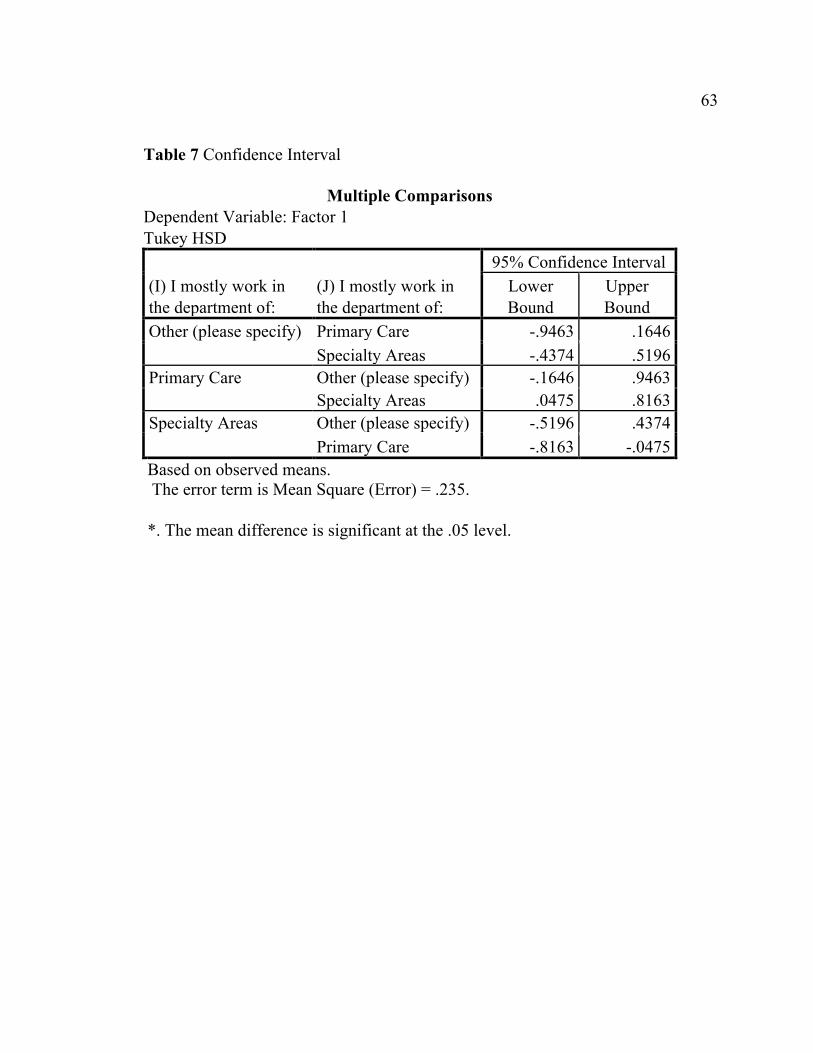
Table 7 Confidence Interval
Multiple Comparisons Dependent Variable: Factor 1 Tukey HSD
(I) I mostly work in the department of:
(J) I mostly work in the department of:
95% Confidence Interval Lower Bound
Upper Bound
Other (please specify) Primary Care -.9463 .1646 Specialty Areas -.4374 .5196
Primary Care Other (please specify) -.1646 .9463 Specialty Areas .0475 .8163
Specialty Areas Other (please specify) -.5196 .4374 Primary Care -.8163 -.0475
Based on observed means. The error term is Mean Square (Error) = .235.
*. The mean difference is significant at the .05 level.