Embed Size (px)
Citation preview

Page | 1
Attitudes of Electoral Agents on the Administration of the 2015 General Election Final Report
Justin Fisher (Brunel University London), David Cutts (University of Bath), Edward Fieldhouse (University of Manchester) & Bettina Rottweiler (Brunel University London)
Executive Summary
Levels of satisfaction with administration of the general election among electoral agents were high. Seven in ten (71%) were satisfied, with 12% dissatisfied.
Agents expressed only very limited levels of concern about electoral fraud. Only 10% perceived there to be A Little or A Lot at elections in their area.
Agents expressed high levels of satisfaction with all aspects of the nominations
process. For example, 85% of agents found the nomination forms easy to complete.
Most agents (87%) said they received sufficient information from the RO/election
staff to help them manage their responsibilities.
Most agents agreed it was clear what was happening during the verification and count (81%), but there was less satisfaction with the efficiency of this process (73%).
There are improving levels of satisfaction in respect of clarity of the rules on election spending and donations.
There was a notable improvement in the rating of the Electoral Commission as a useful source of advice and guidance. Around two-thirds (65%) agreed it was a useful source during the campaign; a rise of twelve percentage points compared with 2010.
Those agents who contacted the Electoral Commission directly were generally satisfied with their experience, though more on matters of electoral administration than on party and election finance.
August 14th 2015
Page | 2
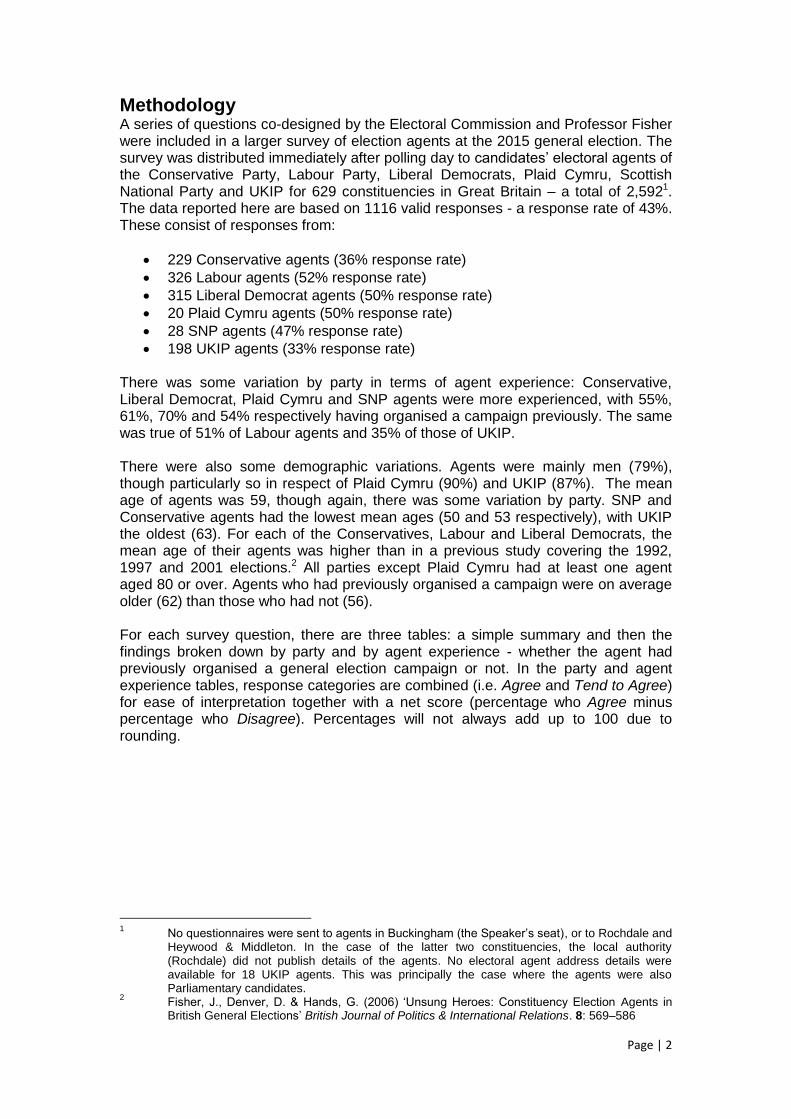
Methodology A series of questions co-designed by the Electoral Commission and Professor Fisher were included in a larger survey of election agents at the 2015 general election. The survey was distributed immediately after polling day to candidates’ electoral agents of the Conservative Party, Labour Party, Liberal Democrats, Plaid Cymru, Scottish National Party and UKIP for 629 constituencies in Great Britain – a total of 2,5921. The data reported here are based on 1116 valid responses - a response rate of 43%. These consist of responses from:
229 Conservative agents (36% response rate)
326 Labour agents (52% response rate)
315 Liberal Democrat agents (50% response rate)
20 Plaid Cymru agents (50% response rate)
28 SNP agents (47% response rate)
198 UKIP agents (33% response rate) There was some variation by party in terms of agent experience: Conservative, Liberal Democrat, Plaid Cymru and SNP agents were more experienced, with 55%, 61%, 70% and 54% respectively having organised a campaign previously. The same was true of 51% of Labour agents and 35% of those of UKIP. There were also some demographic variations. Agents were mainly men (79%), though particularly so in respect of Plaid Cymru (90%) and UKIP (87%). The mean age of agents was 59, though again, there was some variation by party. SNP and Conservative agents had the lowest mean ages (50 and 53 respectively), with UKIP the oldest (63). For each of the Conservatives, Labour and Liberal Democrats, the mean age of their agents was higher than in a previous study covering the 1992, 1997 and 2001 elections.2 All parties except Plaid Cymru had at least one agent aged 80 or over. Agents who had previously organised a campaign were on average older (62) than those who had not (56). For each survey question, there are three tables: a simple summary and then the findings broken down by party and by agent experience - whether the agent had previously organised a general election campaign or not. In the party and agent experience tables, response categories are combined (i.e. Agree and Tend to Agree) for ease of interpretation together with a net score (percentage who Agree minus percentage who Disagree). Percentages will not always add up to 100 due to rounding.
1 No questionnaires were sent to agents in Buckingham (the Speaker’s seat), or to Rochdale and
Heywood & Middleton. In the case of the latter two constituencies, the local authority (Rochdale) did not publish details of the agents. No electoral agent address details were available for 18 UKIP agents. This was principally the case where the agents were also Parliamentary candidates.
2 Fisher, J., Denver, D. & Hands, G. (2006) ‘Unsung Heroes: Constituency Election Agents in
British General Elections’ British Journal of Politics & International Relations. 8: 569–586

Page | 3
Results The Administration of the Election There were good levels of satisfaction with the administration of the general election (Tables 1a, 1b & 1c). Some 71% were satisfied overall, with 12% dissatisfied. This represented a drop from 2010, when 83% of agents reported satisfaction.3 The lowest levels of satisfaction were found amongst Liberal Democrat (57%) and UKIP (65%) agents. 15% of Liberal Democrat agents and 17% of UKIP agents were dissatisfied. By way of contrast, Conservative, Plaid Cymru and SNP agents were particularly satisfied. Agents with previous experience of organising a general election campaign were slightly more satisfied, with a net score (percentage of those satisfied minus the percentage dissatisfied) of +64 compared with +53 for agents with no prior experience. Among the 12% of respondents who expressed dissatisfaction, the most prevalent reason given for dissatisfaction was the organisation of the election count, followed by concerns in respect of postal voting and verification, the nomination process and the organisation of polling stations.
Table 1a. Administration of the election
How satisfied were you with the administration of the general election in your constituency?
%
Very Satisfied 31 Fairly Satisfied 40 Neither 17 Fairy Dissatisfied 9 Very Dissatisfied 3
Table 1b. Administration of the election by party
% Satisfied Neither Dissatisfied Net
Conservative 82 10 8 +74 Labour 79 11 11 +68 Liberal Democrat 57 28 15 +42 Plaid Cymru 80 15 5 +75 SNP 93 4 4 +89 UKIP 65 18 17 +48
Table 1c. Administration of the election by experience of organising a general election campaign
% Satisfied Neither Dissatisfied Net
Previous Experience 74 16 10 +64 No Experience 68 17 15 +53
3 Fisher, J., Cutts, D. & Fieldhouse, E (2010) Attitudes of Electoral Agents on the Administration
of the 2010 General Election

Page | 4
Perceptions of Electoral Fraud Overall, there was a low level of perception of electoral fraud (Tables 2a, 2b & 2c). Only 10% perceived there to be A Little or A Lot. 44% were of the view that there was None at All, and if Don’t Knows are excluded, that figure rises to 61%. Analysing these data by party shows that UKIP agents were most likely to perceive there to be fraud, with 28% responding A Little or A Lot. Agents without prior experience of organising a general election campaign were slightly more likely to perceive some electoral fraud than those with previous experience, but 59% still felt that hardly any or no election fraud took place. Table 2a. Perceptions of electoral fraud
How much, if at all, do you think that electoral fraud took place at elections in your area?
%
A Lot 3 A Little 7 Hardly at All 19 None at All 44 Don’t Know 28
Table 2b. Perceptions of electoral fraud by party
% A Lot A Little Hardly at All
None at All
Don’t Know
Conservative 5 5 18 52 20 Labour 0 3 16 56 24 Liberal Democrat 0 4 20 43 32 Plaid Cymru 0 0 30 35 35 SNP 0 4 39 46 11 UKIP 8 20 19 16 37
Table 2c. Perceptions of electoral fraud by experience of organising a general election campaign
% A Lot A Little Hardly at All
None at All
Don’t Know
Previous Experience 2 5 19 48 26 No Experience 4 8 20 39 29
The Nomination Process 85% of agents found the nomination forms easy to complete. There was minor variation by party, with Labour, Liberal Democrat and UKIP agents least likely to agree. Conservative and agents with prior experience of organising a general election campaign were particularly satisfied with the forms (Tables 3a, 3b & 3c). Agents were also of the view that they received sufficient information on the nomination process (Tables 4a, 4b & 4c). Fully 89% felt that they had received sufficient information from the RO/election staff, with little variation by party; SNP and UKIP agents being least likely to agree. Agents with previous experience of organising a general election campaign were more likely to be of the view that that they had received sufficient information.

Page | 5
Finally, there were also strong levels of satisfaction (89%) with the running of the nomination process (Tables 5a, 5b & 5c) with only minor variation by party or agent experience; UKIP (82%) and agents with no prior experience of organising a general election campaign (86%) being least satisfied. Although the overall satisfaction level with the running of the nomination process was strong, this represented a small decline from the 2010 figure, when 95% of agents reported overall satisfaction.4 Table 3a. Ease of completion of nomination forms
Nomination forms were easy to complete %
Agree 58 Tend to Agree 27 Neither 6 Tend to Disagree 4 Disagree 5
Table 3b. Ease of completion of nomination forms by party
% Agree Neither Disagree Net
Conservative 92 2 6 +86 Labour 83 9 8 +75 Liberal Democrat 84 6 11 +73 Plaid Cymru 90 0 10 +80 SNP 89 0 11 +78 UKIP 84 7 10 +74
Table 3c. Ease of completion of nomination forms by experience of organising a general election campaign
% Agree Neither Disagree Net
Previous Experience 92 3 6 +86 No Experience 79 10 12 +67
4 Fisher, J., Cutts, D. & Fieldhouse, E (2010) Attitudes of Electoral Agents on the Administration
of the 2010 General Election

Page | 6
Table 4a. Receipt of sufficient information on the nomination process
I received sufficient information from the RO/election staff on the nomination process
%
Agree 70 Tend to Agree 19 Neither 5 Tend to Disagree 3 Disagree 3
Table 4b. Received sufficient information on the nomination process by party
% Agree Neither Disagree Net
Conservative 92 5 4 +88 Labour 90 4 6 +84 Liberal Democrat 90 3 7 +83 Plaid Cymru 95 5 0 +95 SNP 86 7 7 +79 UKIP 83 10 7 +76
Table 4c. Received sufficient information on the nomination process by experience of organising a general election campaign
% Agree Neither Disagree Net
Previous Experience 93 3 4 +89 No Experience 86 7 7 +79
Table 5a. The running of the nomination process
The nomination process was well run %
Agree 68 Tend to Agree 21 Neither 6 Tend to Disagree 3 Disagree 3
Table 5b. The running of the nomination process by party
% Agree Neither Disagree Net
Conservative 93 4 3 +90 Labour 88 6 5 +83 Liberal Democrat 89 5 7 +82 Plaid Cymru 100 0 0 +100 SNP 96 4 0 +96 UKIP 82 9 9 +73
Table 5c. The running of the nomination process by experience of organising a general election campaign
% Agree Neither Disagree Net
Previous Experience 92 4 4 +88 No Experience 86 7 7 +79
Page | 7
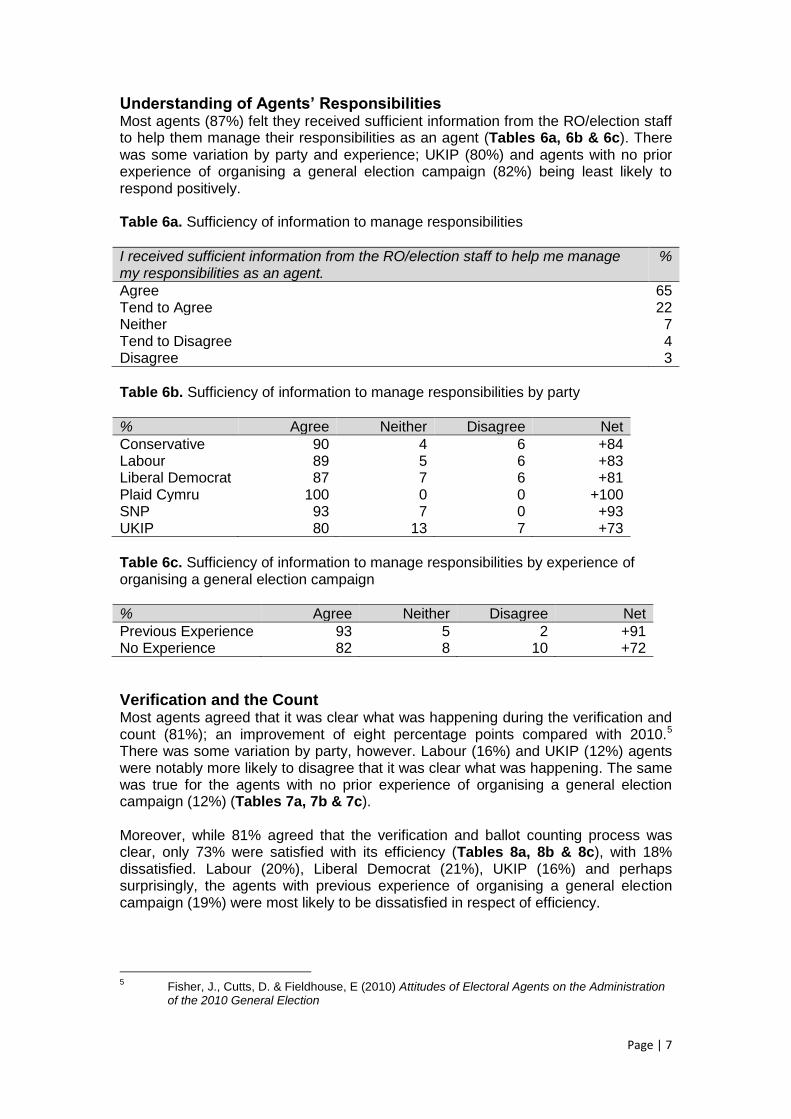
Understanding of Agents’ Responsibilities Most agents (87%) felt they received sufficient information from the RO/election staff to help them manage their responsibilities as an agent (Tables 6a, 6b & 6c). There was some variation by party and experience; UKIP (80%) and agents with no prior experience of organising a general election campaign (82%) being least likely to respond positively. Table 6a. Sufficiency of information to manage responsibilities
I received sufficient information from the RO/election staff to help me manage my responsibilities as an agent.
%
Agree 65 Tend to Agree 22 Neither 7 Tend to Disagree 4 Disagree 3
Table 6b. Sufficiency of information to manage responsibilities by party
% Agree Neither Disagree Net
Conservative 90 4 6 +84 Labour 89 5 6 +83 Liberal Democrat 87 7 6 +81 Plaid Cymru 100 0 0 +100 SNP 93 7 0 +93 UKIP 80 13 7 +73
Table 6c. Sufficiency of information to manage responsibilities by experience of organising a general election campaign
% Agree Neither Disagree Net
Previous Experience 93 5 2 +91 No Experience 82 8 10 +72
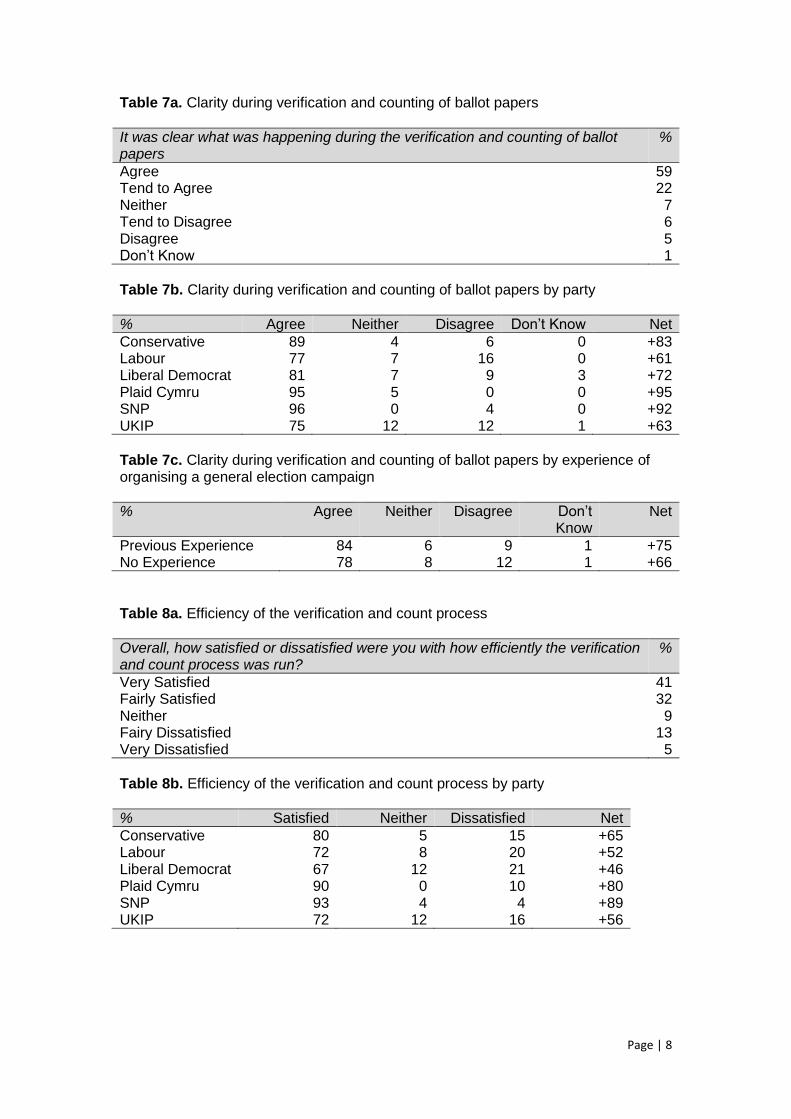
Verification and the Count Most agents agreed that it was clear what was happening during the verification and count (81%); an improvement of eight percentage points compared with 2010.5 There was some variation by party, however. Labour (16%) and UKIP (12%) agents were notably more likely to disagree that it was clear what was happening. The same was true for the agents with no prior experience of organising a general election campaign (12%) (Tables 7a, 7b & 7c). Moreover, while 81% agreed that the verification and ballot counting process was clear, only 73% were satisfied with its efficiency (Tables 8a, 8b & 8c), with 18% dissatisfied. Labour (20%), Liberal Democrat (21%), UKIP (16%) and perhaps surprisingly, the agents with previous experience of organising a general election campaign (19%) were most likely to be dissatisfied in respect of efficiency.
5 Fisher, J., Cutts, D. & Fieldhouse, E (2010) Attitudes of Electoral Agents on the Administration
of the 2010 General Election
Page | 8
Table 7a. Clarity during verification and counting of ballot papers
It was clear what was happening during the verification and counting of ballot papers
%
Agree 59 Tend to Agree 22 Neither 7 Tend to Disagree 6 Disagree 5 Don’t Know 1
Table 7b. Clarity during verification and counting of ballot papers by party
% Agree Neither Disagree Don’t Know Net
Conservative 89 4 6 0 +83 Labour 77 7 16 0 +61 Liberal Democrat 81 7 9 3 +72 Plaid Cymru 95 5 0 0 +95 SNP 96 0 4 0 +92 UKIP 75 12 12 1 +63
Table 7c. Clarity during verification and counting of ballot papers by experience of organising a general election campaign
% Agree Neither Disagree Don’t Know
Net
Previous Experience 84 6 9 1 +75 No Experience 78 8 12 1 +66
Table 8a. Efficiency of the verification and count process
Overall, how satisfied or dissatisfied were you with how efficiently the verification and count process was run?
%
Very Satisfied 41 Fairly Satisfied 32 Neither 9 Fairy Dissatisfied 13 Very Dissatisfied 5
Table 8b. Efficiency of the verification and count process by party
% Satisfied Neither Dissatisfied Net
Conservative 80 5 15 +65 Labour 72 8 20 +52 Liberal Democrat 67 12 21 +46 Plaid Cymru 90 0 10 +80 SNP 93 4 4 +89 UKIP 72 12 16 +56

Page | 9
Table 8c. Efficiency of the verification and count process by experience of organising a general election campaign
% Satisfied Neither Dissatisfied Net
Previous Experience 73 9 19 +54 No Experience 73 10 17 +56
Rules on Election Spending and Donations In respect of election spending and donations, 77% of agents agreed that the rules were clear; an improvement of four percentage points compared with 20106 (Tables 9a, 9b & 9c). Again, there was some variation by party and agent experience. Conservative and Labour agents were most likely to find the rules clear, while SNP and UKIP agents were least likely to do so. 17% of UKIP agents were of the view that the rules were unclear; a view also shared by 17% of agents with no prior experience of organising a general election campaign. Table 9a. Clarity of rules on election spending and donations
I found the rules on election spending and donations clear %
Agree 48 Tend to Agree 29 Neither 11 Tend to Disagree 8 Disagree 5
Table 9b. Clarity of rules on election spending and donations by party
% Agree Neither Disagree Net
Conservative 80 9 11 +69 Labour 80 10 10 +70 Liberal Democrat 75 13 13 +62 Plaid Cymru 75 15 10 +65 SNP 71 14 14 +57 UKIP 71 12 17 +54
Table 9c. Clarity of rules on election spending and donations by experience of organising a general election campaign
% Agree Neither Disagree Net
Previous Experience 83 9 8 +75 No Experience 70 14 17 +53
6 Fisher, J., Cutts, D. & Fieldhouse, E (2010) Attitudes of Electoral Agents on the Administration
of the 2010 General Election

Page | 10
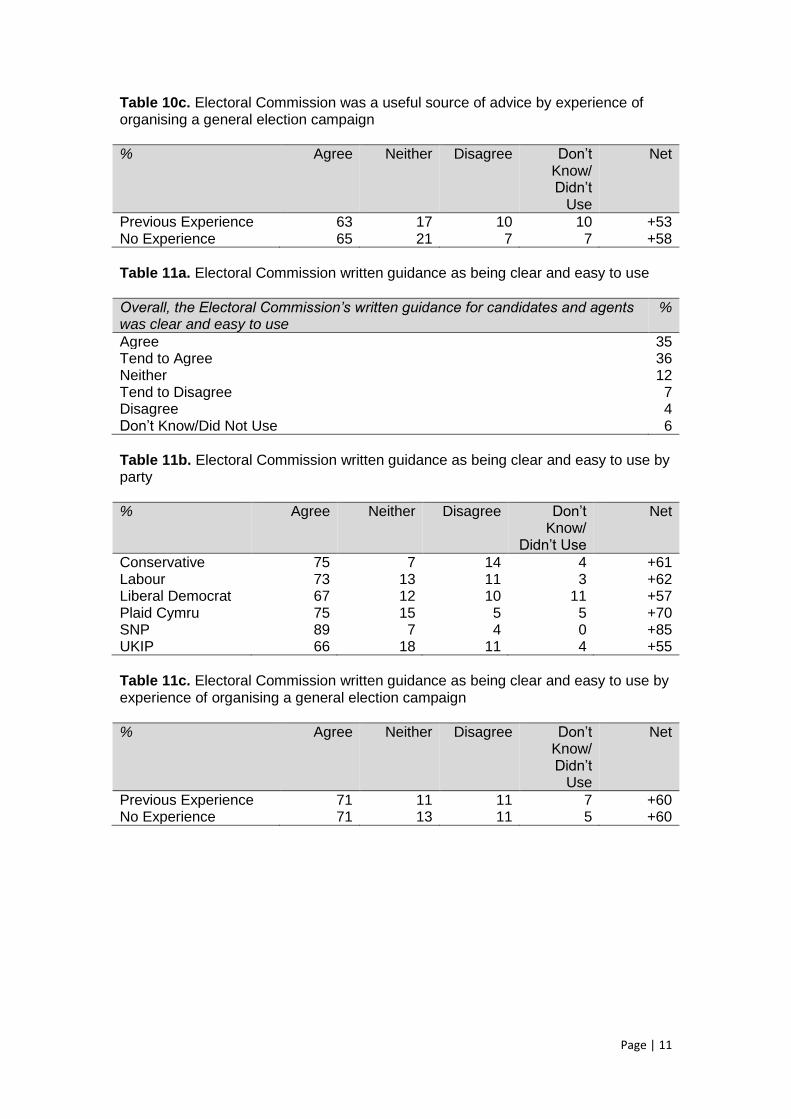
The Usefulness of Electoral Commission Advice, Guidance and Information Overall, 65% viewed the Electoral Commission as a useful source of advice during the campaign; an improvement of twelve percentage points compared with 20107 (Table 10a). 71% thought Electoral Commission written guidance for candidates and agents was clear and easy to use (Table 11a) and 61% thought Electoral Commission written information on what to expect at the verification and count was clear and easy to use (Table 12a). There was some variation by party. Liberal Democrat and UKIP agents were least likely to view the Electoral Commission as a useful source of advice (Table 10b). Agents from the two national parties (SNP and Plaid Cymru) were most likely to find the Commission to be a useful source of advice. In terms of written guidance, Liberal Democrat and UKIP agents were again less likely to find the Commission’s work to be useful (Table 11b). Finally, there was also variation in respect of attitudes towards the Commission’s written information on the verification and count (Table 12b). Labour, Liberal Democrat and UKIP agents were least likely to find it clear and easy to use. In terms of agent experience, there was no systematic variation. However, the responses in the Don’t/Know/Didn’t Use category suggest that the agents with no prior experience of organising a general election campaign were slightly more likely to seek advice, written guidance and written information from the Electoral Commission (Tables 10c, 11c & 12c). Table 10a. Electoral Commission as a useful source of advice
Overall, the Electoral Commission was a useful source of advice and guidance during the campaign
%
Agree 32 Tend to Agree 33 Neither 19 Tend to Disagree 5 Disagree 4 Don’t Know/Did Not Use 9
Table 10b. Electoral Commission was a useful source of advice by party
% Agree Neither Disagree Don’t Know/
Didn’t Use
Net
Conservative 68 16 11 6 +57 Labour 65 21 7 7 +58 Liberal Democrat 60 17 9 14 +51 Plaid Cymru 79 21 0 0 +79 SNP 79 14 4 4 +75 UKIP 61 22 9 8 +53
7 Fisher, J., Cutts, D. & Fieldhouse, E (2010) Attitudes of Electoral Agents on the Administration
of the 2010 General Election
Page | 11
Table 10c. Electoral Commission was a useful source of advice by experience of organising a general election campaign
% Agree Neither Disagree Don’t Know/ Didn’t
Use
Net
Previous Experience 63 17 10 10 +53 No Experience 65 21 7 7 +58
Table 11a. Electoral Commission written guidance as being clear and easy to use
Overall, the Electoral Commission’s written guidance for candidates and agents was clear and easy to use
%
Agree 35 Tend to Agree 36 Neither 12 Tend to Disagree 7 Disagree 4 Don’t Know/Did Not Use 6
Table 11b. Electoral Commission written guidance as being clear and easy to use by party
% Agree Neither Disagree Don’t Know/
Didn’t Use
Net
Conservative 75 7 14 4 +61 Labour 73 13 11 3 +62 Liberal Democrat 67 12 10 11 +57 Plaid Cymru 75 15 5 5 +70 SNP 89 7 4 0 +85 UKIP 66 18 11 4 +55
Table 11c. Electoral Commission written guidance as being clear and easy to use by experience of organising a general election campaign
% Agree Neither Disagree Don’t Know/ Didn’t
Use
Net
Previous Experience 71 11 11 7 +60 No Experience 71 13 11 5 +60

Page | 12
Table 12a. Electoral Commission written information in respect of the verification and count as being clear and easy to use
The Electoral Commission’s written information on what to expect at the verification and count was clear and easy to use
%
Agree 30 Tend to Agree 31 Neither 17 Tend to Disagree 3 Disagree 3 Don’t Know/Did Not Use 16
Table 12b. Electoral Commission written information in respect of the verification and count as being clear and easy to use by party
% Agree Neither Disagree Don’t Know/
Didn’t Use
Net
Conservative 68 11 8 13 +60 Labour 55 20 8 17 +47 Liberal Democrat 58 17 3 22 +55 Plaid Cymru 70 15 0 15 +70 SNP 64 21 4 11 +60 UKIP 63 20 8 9 +55
Table 12c. Electoral Commission written information in respect of the verification and count as being clear and easy to use by experience of organising a general election campaign
% Agree Neither Disagree Don’t Know/ Didn’t
Use
Net
Previous Experience 60 15 6 20 +54 No Experience 62 20 6 12 +56
Experience of Contacting the Commission Around a third of agents had cause to contact the Commission personally by telephone or email. Their experience was largely positive, though more so in respect of electoral administration than on party and election finance matters (Tables 13a & 14a). Surprisingly, over a third of respondents to both questions answered Don’t Know. If those respondents are removed from the analyses, some 70% were satisfied in respect of the Commission’s guidance and advice on electoral administration and some 61% on donations and spending. When broken down by party (Tables 13b & 14b), there are few patterns of note,8 except that Liberal Democrat agents were least likely to be satisfied overall. It’s also worth noting that in both areas, Liberal Democrats were disproportionately likely to respond Don’t Know.
8 Low numbers of respondents for SNP and Plaid Cymru agents for these questions mean that
percentages for these parties need to be treated with caution

Page | 13
In respect of agent experience (Tables 13c & 14c), there was variation in respect of advice and guidance on electoral administration, with inexperienced agents responding more positively. However, in respect of advice and guidance on spending and donations, there was no variation. Table 13a. The clarity of Electoral Commission advice and guidance on electoral administration
Direct advice or guidance on electoral administration was clear and easy to understand
%
Agree 27 Tend to Agree 19 Neither 14 Tend to Disagree 3 Disagree 2 Don’t Know 34
Table 13b. The clarity of Electoral Commission advice and guidance on electoral administration by party
% Agree Neither Disagree Don’t Know
Net
Conservative 47 14 9 30 +38 Labour 44 14 4 38 +40 Liberal Democrat 32 13 4 52 +28 Plaid Cymru 50 25 0 25 +50 SNP 73 9 0 18 +73 UKIP 57 15 6 21 +51
Table 13c. The clarity of Electoral Commission advice and guidance on electoral administration by experience of organising a general election campaign
% Agree Neither Disagree Don’t Know
Net
Previous Experience 42 13 7 39 +35 No Experience 50 15 4 31 +46
Table 14a. The clarity of Electoral Commission advice and guidance on spending and donations
Direct advice or guidance on spending and donations was clear and easy to understand
%
Agree 23 Tend to Agree 16 Neither 15 Tend to Disagree 5 Disagree 5 Don’t Know 36

Page | 14
Table 14b. The clarity of Electoral Commission advice and guidance on spending and donations by party
% Agree Neither Disagree Don’t Know
Net
Conservative 38 15 14 33 +24 Labour 37 17 8 38 +29 Liberal Democrat 29 11 7 52 +22 Plaid Cymru 56 22 0 22 +56 SNP 55 9 9 27 +46 UKIP 47 17 11 25 +36
Table 14c. The clarity of Electoral Commission advice and guidance on spending and donations by experience of organising a general election campaign
% Agree Neither Disagree Don’t Know
Net
Previous Experience 39 13 8 40 +31 No Experience 39 17 11 33 +28