Embed Size (px)
Citation preview
Special Eurobarometer
Attitudes of Europeans towards tobacco
Fieldwork September – December 2005
Publication January 2006
Spe
cial
Eur
obar
omet
er 2
39 /
Wav
es 6
4.1
– 64
.3 –
TN
S O
pini
on &
Soc
ial
This survey was requested by Health and Consumer Protection Directorate General and coordinated by Directorate General Press and Communication
This document does not represent the point of view of the European Commission. The interpretations and opinions contained in it are solely those of the authors.
European Commission

SPECIAL EUROBAROMETRE 239 Attitudes of Europeans towards tobacco
- 1 -
Table of contents
PRESENTATION .........................................................................................2
1. Smoking in the European Union ..........................................................3 1.1. Tobacco consumption in the European Union ........................................ 3
1.1.1. People who have never smoked .................................................... 4 1.1.2. Smokers of packed cigarettes ....................................................... 6 1.1.3. People who have stopped smoking ................................................ 9
1.2. Frequency of tobacco consumption.................................................... 12 1.2.1. Regularity of tobacco consumption .............................................. 12 1.2.2. Frequency and quantity of cigarettes smoked per day .................... 14
2. Places where people smoke tobacco .................................................18 2.1. Smoking at home ........................................................................... 18 2.2. Smoking in the car ......................................................................... 19
2.2.1. Smoking when alone in the car ................................................... 20 2.2.2. Smoking in the car in the company of non-smokers ....................... 22 2.2.3. Smoking in the car in the company of children .............................. 24
2.3. Banning smoking in public places...................................................... 26 2.3.1. Banning smoking in restaurants .................................................. 27 2.3.2. Banning smoking in bars and pubs .............................................. 29 2.3.3. Banning smoking in offices and other indoor workplaces ................. 31 2.3.4. Banning smoking in any indoor public space (metro, airports, shops, etc.)................................................................................................. 33
3. Exposure to tobacco smoke...............................................................35 3.1. The nuisance of tobacco smoke ........................................................ 35 3.2. Why are people bothered by tobacco smoke? ..................................... 38 3.3. Asking smokers not to smoke........................................................... 41 3.4. The discomfort and harm caused by tobacco smoke to non-smokers...... 43 3.5. The dangers of tobacco smoke for pregnant women ............................ 45
4. Combining tobacco with other harmful products ...............................48 4.1. Tobacco and alcohol........................................................................ 49 4.2. Tobacco and medicines ................................................................... 52 4.3. Tobacco and drugs ......................................................................... 55
5. Anti-tobacco campaigns....................................................................57 5.1. The impact of anti-tobacco campaigns .......................................... 57 5.2. The effectiveness of anti-tobacco campaigns ...................................... 59
6. Conclusion ........................................................................................61 ANNEXES Tables Technical note Questionnaire

SPECIAL EUROBAROMETRE 239 Attitudes of Europeans towards tobacco
- 2 -
PRESENTATION
Tobacco is the single largest cause of avoidable death in the European Union, accounting for more than half a million deaths every year and more than a million in Europe as a whole. It is estimated that 25% of all cancer deaths and 15% of all deaths in the European Union could be attributed to smoking. In order to curb this epidemic, the European Union is actively developing a comprehensive tobacco control policy, based on legislative measures, prevention and cessation activities, and mainstreaming tobacco control into a range of other Community policies.
There is considerable media focus on tobacco consumption and its dangers, and numerous international anti-tobacco campaigns have been organised in recent years. The aim of this survey, commissioned by the Directorate-General Health and Consumer Protection of the European Commission is to assess the attitude of Europeans to tobacco. It is not the first survey on this subject. The last such survey was carried out in autumn 2002. The current questionnaire has, however, been considerably redrafted in relation to the previous survey and only a few questions can be used to draw comparisons. The main themes addressed in this survey are:
- the level and frequency of tobacco consumption, - the behaviour and opinion of smokers and non-smokers with regard to
places where people smoke, - the attitude and opinion of Europeans to tobacco smoke and its harmful
effects, - the extent to which smokers combine tobacco with other substances, - and, finally, the impact and effectiveness of anti-tobacco campaigns on
smokers and those who have given up smoking. This survey was carried out in two stages:
- in September and October 2005 in the 25 European Union Member States, - in November and December 2005 in the two accession countries (Bulgaria
and Rumania), the two candidate countries (Croatia and Turkey) and the Turkish Cypriot Community.
It was commissioned by thee Directorate-General Health and Consumer Protection of the European Commission and carried out by TNS Opinion & Social, a consortium formed by TNS and EOS Gallup Europe. The methodology used was that of the Standard Eurobarometer surveys of the Directorate-General Press and Communication (“Opinion Polls, Press Reviews, Europe Direct” unit). A technical note concerning the interviews carried out by the institutes of the TNS Opinion & Social network is annexed to this report. That note specifies the interview method used, as well as the intervals of confidence1.
1 The results tables are included in the annex. The totals indicated may show a one point difference with the sum of the individual figures because of the rounding of certain results. It should also be noted that the total of the percentages in the tables of this report may exceed 100% when the people interviewed have the possibility to give several answers to a question.

SPECIAL EUROBAROMETRE 239 Attitudes of Europeans towards tobacco
- 3 -
Q1 Which of the following applies to you?
5%
19%
33%
42%
2%
6%
22%
26%
47%
5%
21%
27%
47%
1%
1%
0% 50%
You smoke cigars or apipe
You smoke roll-upcigarettes
You used to smoke butyou have stopped
You smoke packedcigarettes
You have neversmoked
Aut. 2002/ EU15 (EB58.2) Aut. 2005/ EU15 Aut. 2005/ UE25
1. Smoking in the European Union 1.1. Tobacco consumption in the European Union Questionnaire source: Q1
-A clear majority of European Union citizens do not smoke- In the autumn 2005 survey, almost half (47%) of European Union citizens declared that they have never smoked and one in five (21%) admits having stopped smoking. Packed cigarettes are the most attractive product for smokers and more than a quarter (27%) of respondents seems to smoke them. The consumption of other products is far more marginal: only 5% of the people interviewed smoke roll-up cigarettes and 1% smoke cigars.
-The number of smokers has fallen considerably over the last three years-
The scores in the 2005 survey are similar between the enlarged European Union and the 15 old Member States. In the 15 old Member States, compared with autumn 2002, there has been a significant fall in the number of smokers of packed cigarettes (-7 points). On the other hand, the number of respondents declaring that they have never smoked has increased considerably (+5 points). Are the younger generations less attracted by tobacco? In addition, the number of people who have stopped smoking has increased.

SPECIAL EUROBAROMETRE 239 Attitudes of Europeans towards tobacco
- 4 -
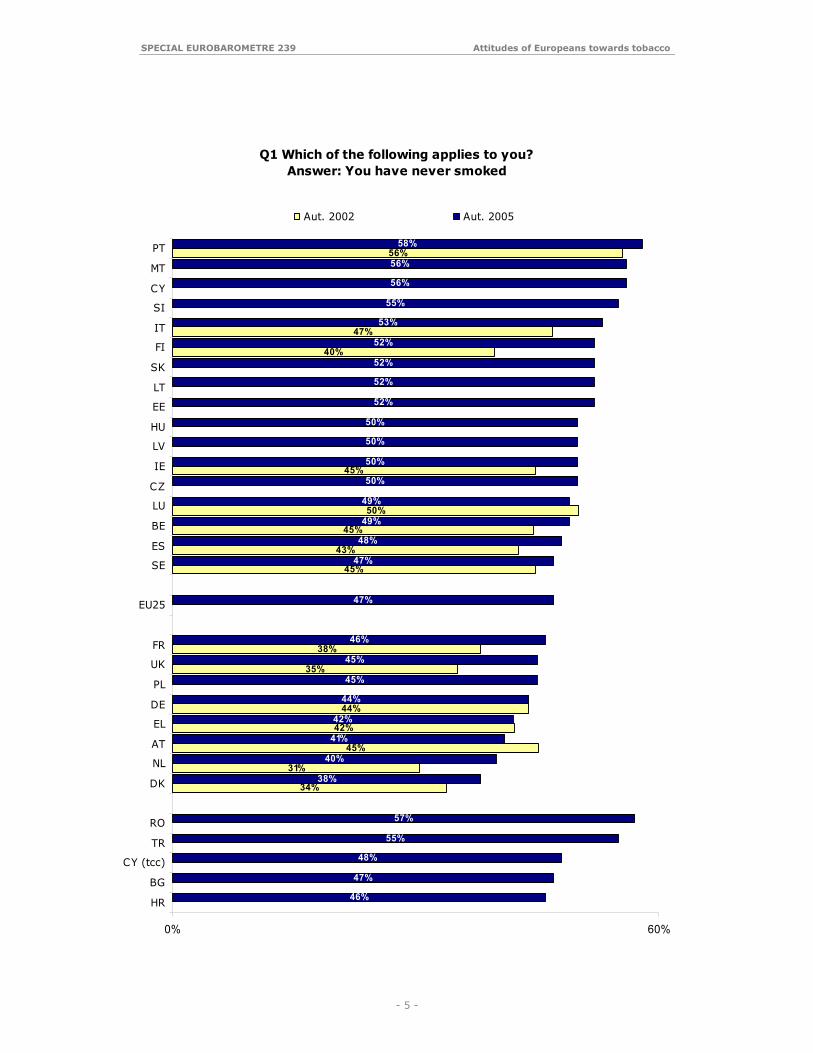
1.1.1. People who have never smoked An analysis of the results by country shows that levels of consumption vary considerably between the Member States. In roughly half the Member States, more than one out of two people interviewed declared that they have never smoked. The highest scores in this group of people were recorded in several Mediterranean countries, notably Portugal (58%), Malta (56%) and Cyprus (56%). On the other hand, the Danes (38%) and the Dutch (40%) have the highest scores in terms of those who have already smoked. In the accession and candidate countries, Rumania (57%) and Turkey (55%) have the highest levels of consumption.
-Compared with 2002 a larger number of respondents have never smoked-
Compared with the last survey in 2002, the number of respondents declaring that they have never smoked has increased in 11 of the 15 countries which participated in the survey at that time. This increase in particularly striking in Finland (+12 points), the United Kingdom (+10 points) and the Netherlands (+9 points). The number of people who declare that they have never smoked has also increased in Denmark (+4 points).
-A majority of women declare that they have never smoked-
An analysis of the socio-demographic variables reveals that women smoke less than men: 57% of women state that they have never smoked, compared with only 36% of men. The youngest (56%) and oldest (52%) respondents also seem to have been less tempted by tobacco, as well as people looking after the home (61%) and students (63%).
SPECIAL EUROBAROMETRE 239 Attitudes of Europeans towards tobacco
- 5 -
Q1 Which of the following applies to you?Answer: You have never smoked
34%
31%
45%
44%
35%
38%
45%
43%
45%
50%
45%
40%
47%
56%
46%
47%
48%
55%
57%
38%
40%
41%
42%
44%
45%
45%
46%
47%
47%
48%
49%
49%
50%
50%
50%
50%
52%
52%
52%
52%
53%
55%
56%
56%
58%
42%
0% 60%
HR
BG
CY (tcc)
TR
RO
DK
NL
AT
EL
DE
PL
UK
FR
EU25
SE
ES
BE
LU
CZ
IE
LV
HU
EE
LT
SK
FI
IT
SI
CY
MT
PT
Aut. 2002 Aut. 2005
SPECIAL EUROBAROMETRE 239 Attitudes of Europeans towards tobacco
- 6 -
1.1.2. Smokers of packed cigarettes
-Contrasting results in consumption, with a very sharp drop in several Member States-
The level of consumption of packed cigarettes also varies considerably between Member States. Greeks (40%) and Austrians (37%) are the biggest consumers of packed cigarettes, closely followed by citizens of a majority of the new Member States (6 countries where at least 30% of the respondents smoke packed cigarettes). On the other hand, barley one citizen in five in Sweden (18%), the Netherlands (19%) and Belgium (20%) smokes this type of product. The scores recorded in the accession and candidate countries are higher than those of the European Union countries, notably in the Turkish Cypriot Community (44%) and Bulgaria (38%).
-There has been a marked fall in the consumption of packed cigarettes since 2002-
Compared with the survey carried out in 2002, there has been a very noticeable fall in the consumption of packed cigarettes in a majority of the 15 old Member States, in particular in the United Kingdom (-11 points), France (-11 points) and Spain (-10 points). On the other hand, consumption levels have even increased slightly in Austria and Greece (+1 point).

SPECIAL EUROBAROMETRE 239 Attitudes of Europeans towards tobacco
- 7 -
Q1 Which of the following applies to you? Answer: You smoke packed cigarettes
22%
23%
25%
33%
32%
36%
34%
29%
28%
39%
32%
31%
36%
39%
31%
36%
37%
38%
44%
18%
19%
20%
21%
22%
25%
25%
25%
26%
27%
27%
27%
27%
28%
28%
29%
29%
29%
30%
30%
31%
32%
35%
35%
37%
40%
29%
0% 40%
RO
HR
TR
BG
CY (tcc)
SE
NL
BE
FI
UK
DE
FR
MT
SI
EU25
IT
PT
SK
DK
CY
ES
IE
LU
EE
HU
CZ
LT
LV
PL
AT
EL
Aut. 2002 Aut. 2005

SPECIAL EUROBAROMETRE 239 Attitudes of Europeans towards tobacco
- 8 -
Q1 Which of the following applies to you? Answer: You smoke packed cigarettes
31%23%
33%
35%31%
14%
24%
29%38%
20%45%
15%24%
24%
27%30%
33%
0% 50%
SEXMale
FemaleAGE
15-2425-3940-5455 +
RESPONDANT OCCUPATION SCALESelf- employed
ManagersOther white collars
Manual workersHouse persons
UnemployedRetired
StudentsSUBJECTIVE URBANISATION
Rural villageSmall/ mid size town
Large town
An analysis of socio-demographic variables reveals that 31% of men smoke packed cigarettes compared with 23% of women. On the other hand, tobacco consumption seems to be far lower among the oldest respondents (55 and over) than among age groups (over fifty percent fewer). Unemployed people (45%) and manual workers (38%) also have noticeably higher levels of consumption than the other socio-professional categories.

SPECIAL EUROBAROMETRE 239 Attitudes of Europeans towards tobacco
- 9 -
1.1.3. People who have stopped smoking
-The situation varies from one Member State to another- The proportion of respondents who declare that they have stopped smoking varies considerably between Member States (see next page). Although just over one in ten respondents seems to have given up smoking in Cyprus (12%) and Portugal (13%), at least one in four has given up smoking in the Netherlands (30%), Denmark (27%) and the United Kingdom (25%).
-The number of smokers who have stopped smoking has increased since 2002-
In a majority of the 15 old Member States, the proportion of respondents who have stopped smoking has increased since autumn 2002. The highest increases in this regard were recorded in the United Kingdom (+6 points), Germany (+5 points), Luxembourg (+4 points) and France (+4 points). The percentage of respondents who state that they have stopped smoking in the accession and candidate countries is below the European average. This percentage is particularly low in Turkey (8%) and the Turkish Cypriot Community.

SPECIAL EUROBAROMETRE 239 Attitudes of Europeans towards tobacco
- 10 -
Q1 Which of the following applies to you? You used to smoke but you have stopped
14%
18%
15%
19%
17%
16%
17%
19%
21%
19%
22%
19%
23%
27%
6%
8%
11%
15%
18%
12%
13%
14%
15%
16%
17%
17%
17%
17%
17%
18%
18%
19%
19%
19%
20%
20%
21%
21%
22%
23%
24%
24%
25%
27%
30%
16%
0% 40%
TR
CY (tcc)
RO
BG
HR
CY
PT
LV
EL
LT
IT
HU
MT
AT
SK
EE
SI
CZ
IE
PL
ES
LU
EU25
FR
FI
BE
DE
SE
UK
DK
NL
Aut. 2002 Aut. 2005

SPECIAL EUROBAROMETRE 239 Attitudes of Europeans towards tobacco
- 11 -
Q1 Which of the following applies to you? You used to smoke but you have stopped
25%
17%
7%
17%
23%
30%
23%
19%
20%
15%
15%
32%
8%
20%
0% 40%
SEX
Male
Female
AGE
15-24
25-39
40-54
55 +
RESPONDANT OCCUPATION SCALE
Self- employed
Managers
Other white collars
Manual workers
House persons
Unemployed
Retired
Students
In 2005, a large percentage of men (25%) seem to have stopped smoking. Older people also seem more likely to have stopped smoking. While 7% of the 15-24 age group declare that they have stopped smoking, the corresponding percentage is almost 23% among 40-54 year olds and 30% in the oldest group (55 and over). From a socio-professional point of view, retired people have the highest score (32%) among people having giving up smoking, with a score that is twice as high as that of unemployed people and people looking after the home (15%).
SPECIAL EUROBAROMETRE 239 Attitudes of Europeans towards tobacco
- 12 -
Q2 Do you smoke regularly, or occasionally?
84%
85%
88%
16%
15%
12%
0% 100%
Aut. 2005./ EU25
Aut. 2005/ EU15
Aut. 2002/ EU15(EB58.2)
Regularly Occasionally
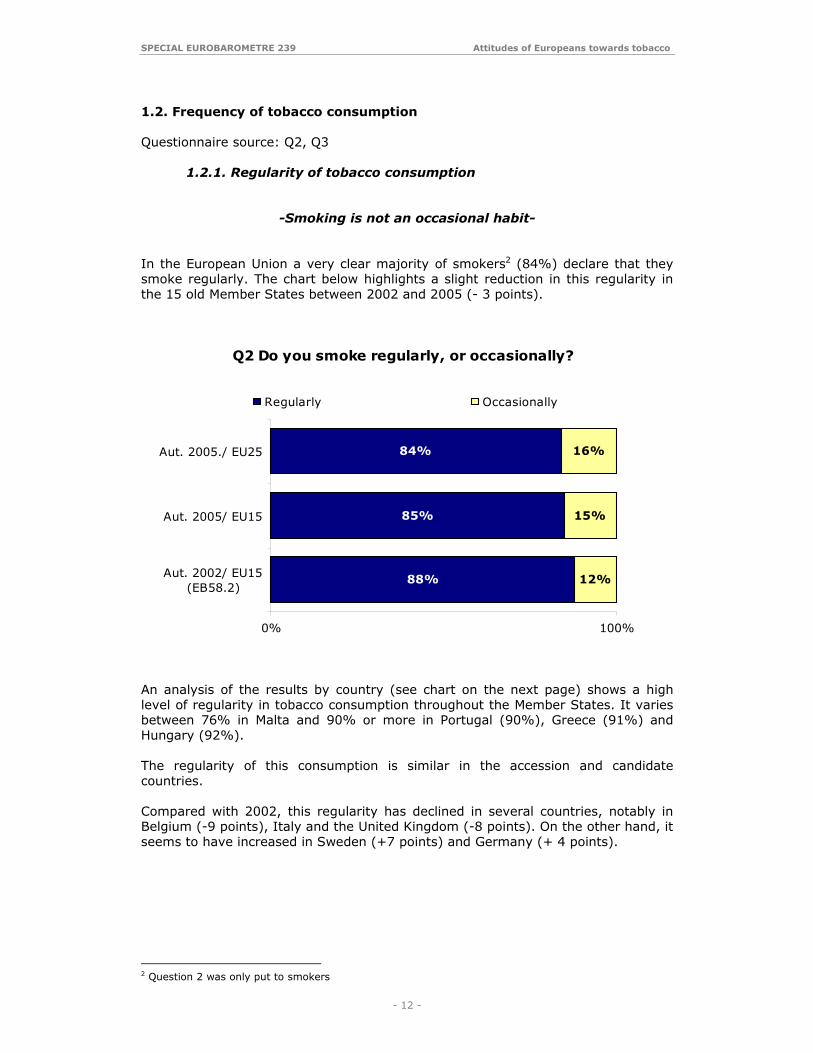
1.2. Frequency of tobacco consumption Questionnaire source: Q2, Q3 1.2.1. Regularity of tobacco consumption
-Smoking is not an occasional habit- In the European Union a very clear majority of smokers2 (84%) declare that they smoke regularly. The chart below highlights a slight reduction in this regularity in the 15 old Member States between 2002 and 2005 (- 3 points). An analysis of the results by country (see chart on the next page) shows a high level of regularity in tobacco consumption throughout the Member States. It varies between 76% in Malta and 90% or more in Portugal (90%), Greece (91%) and Hungary (92%). The regularity of this consumption is similar in the accession and candidate countries. Compared with 2002, this regularity has declined in several countries, notably in Belgium (-9 points), Italy and the United Kingdom (-8 points). On the other hand, it seems to have increased in Sweden (+7 points) and Germany (+ 4 points).
2 Question 2 was only put to smokers

SPECIAL EUROBAROMETRE 239 Attitudes of Europeans towards tobacco
- 13 -
Q2 Do you smoke regularly, or occasionally?Answer: Regularly
87%
82%
90%
75%
84%
91%
84%
88%
86%
89%
91%
84%
89%
91%
76%
78%
78%
79%
79%
80%
82%
82%
82%
82%
83%
83%
84%
84%
84%
85%
85%
86%
86%
87%
88%
88%
90%
90%
91%
92%
90%
MT
BE
PL
LT
NL
SI
IT
SK
SE
UK
CZ
FI
UE25
IE
AT
LV
LU
DK
ES
FR
DE
CY
EE
PT
EL
HU
Aut.2002/EU15 (EB 58,2) Aut.2005
An analysis of the results from a socio-demographic point of view does not reveal any significant differences between the categories studied. It is to be noted, however, that the youngest respondents, students and managers seem to be more occasional smokers than the others categories.

SPECIAL EUROBAROMETRE 239 Attitudes of Europeans towards tobacco
- 14 -
1.2.2. Frequency and quantity of cigarettes smoked per day
-Cigarette smokers smoke every day- In all Member States, more than 90% of cigarette smokers3 declare that they smoke every day, except in Sweden (87%). The percentage is even almost 100% in Cyprus (99%) and Portugal (98%).
Q3 Do you smoke every day? (IF YES) How many cigarettes a day do you smoke?
(Answers "no, do not smoke every day" and "DK" are not represented on this graph.)
3%
4%
3%
4%
12%
16%
3%
4%
4%
7%
8%
8%
3%
3%
6%
4%
6%
8%
5%
9%
3%
5%
7%
8%
4%
5%
5%
4%
10%
7%
14%
16%
20%
20%
27%
12%
13%
14%
15%
17%
17%
15%
21%
19%
21%
19%
20%
20%
15%
20%
17%
20%
21%
22%
21%
25%
24%
27%
29%
20%
28%
25%
24%
24%
25%
22%
21%
23%
20%
21%
21%
16%
17%
21%
16%
26%
21%
18%
19%
16%
19%
22%
14%
12%
19%
12%
16%
26%
15%
20%
9%
9%
23%
20%
17%
15%
10%
23%
29%
25%
24%
24%
25%
23%
24%
22%
16%
18%
21%
21%
17%
25%
22%
17%
26%
22%
20%
13%
16%
23%
11%
12%
11%
17%
14%
13%
13%
8%
22%
19%
18%
16%
17%
17%
16%
14%
16%
12%
17%
15%
15%
19%
15%
15%
17%
17%
12%
17%
14%
12%
11%
10%
11%
7%
10%
14%
9%
11%
14%
11%
8%
10%
12%
13%
8%
14%
10%
12%
11%
7%
11%
9%
12%
8%
5%
12%
10%
6%
11%
18%
8%
8%
11%
11%
6%
2%
3%
5%
3%
10%
5%
3%
4%
4%
3%
4%
3%
3%
3%
3%
4%
3%
8%
4%
3%
3%
6%
4%
0% 100%
RO
BG
HR
TR
CY (tcc)
SK
EE
LTCZ
IT
SE
FR
LV
NL
PL
FI
UE25
SI
BE
DE
AT
MT
UKDK
LU
ES
HU
IE
PT
CY
EL
Yes, 40 or more cigarettes a day Yes, 35 to 39 cigarettes a day Yes, 30 to 34 cigarettes a day
Yes, 25 to 29 cigarettes a day Yes, 20 to 24 cigarettes a day Yes, 15 to 19 cigarettes a dayYes, 10 to 14 cigarettes a day Yes, 5 to 9 cigarettes a day Yes, less than 5 cigarettes a day
3 Question 3 was only put to cigarette smokers

SPECIAL EUROBAROMETRE 239 Attitudes of Europeans towards tobacco
- 15 -
-Mixed levels of consumption in Europe- As regards the number of cigarettes smoked on a daily basis, the chart shown above highlights that there are clear differences in levels of consumption between the various countries. Based on, for example, the categories of replies of more than 20 cigarettes a day, it is clear that a majority of Cypriots and Greeks smoke more than 20 cigarettes a day, while this percentage is less than 20% in Slovakia, Estonia and Lithuania. These differences are also highlighted by the calculation of the average number of cigarettes smoked daily. Consumption varies among cigarette smokers and can be nearly twice as high, for example between Cyprus (23.2 cigarettes a day) and Slovakia (12.2). In comparison to the results of the survey carried out in autumn 2002, the average number of cigarettes smoked daily has fallen in a majority of countries, notably in Belgium (-3.4), France (-2.2) and Luxembourg (-2.2). However, these changes are not significant on the whole. Finally, Swedish citizens stand out by the increase (+1.7) in the average number of cigarettes smoked every day.

SPECIAL EUROBAROMETRE 239 Attitudes of Europeans towards tobacco
- 16 -
Q3 Do you smoke every day? (IF YES) How many cigarettes a day do you smoke?
Average number of cigarettes per day
10.9
14.5
15.8
14.3
18.1
14.4
15.9
15.9
16.6
17.6
15.8
17.2
17.3
17.8
23
14
14.3
16.1
17
18.8
12.2
12.6
13
13.3
13.3
13.4
13.6
13.8
13.8
14.7
14.7
14.8
14.9
15
15
15.1
15.1
15.4
15.4
15.9
16
16.3
16.7
18
21.3
23.2
0 25
RO
BG
HR
TR
CY (tcc)
SK
SE
LT
CZ
IT
EE
FR
LV
NL
BE
FI
SI
EU25(2005)/EU15 (2002)
ES
PL
MT
UK
DE
LU
DK
AT
HU
IE
PT
CY
EL
Aut.2002 Aut.2005

SPECIAL EUROBAROMETRE 239 Attitudes of Europeans towards tobacco
- 17 -
Q3 Do you smoke every day? (IF YES) How many cigarettes a day do you smoke?
Average number of cigarettes per day
14.9
16.2
13.3
12.1
14.4
16.9
15.6
17.3
15.4
13.8
10.3
15.9
14.3
14.1
15.8
14
16.3
16
10.3
17.1
14.6
13.4
16.1
17.3
16.2
17.4
16.8
14.2
11
17.8
15.6
14.5
16.9
15.5
17.8
15.7
10.6
0 25
UE25
SEX
Male
Female
AGE
15-24
25-39
40-54
55 +
EDUCATION (END OF)
15
16-19
20+
Still Studying
RESPONDANT OCCUPATION SCALE
Self- employed
Managers
Other white collars
Manual workers
House persons
Unemployed
Retired
Students
Autumn 2005 Autumn 2002
A socio-demographic analysis of the average number of cigarettes smoked reveals significant differences.
-Women and young people smoke less and their consumption has fallen the most since 2002-
Women (13.3 cigarettes a day) smoke less than men (16.2) and the level of their consumption has fallen more sharply than that of men. People aged over 40 smoke more than the youngest respondents and their consumption has fallen less than that of the youngest age group. It seems that the earlier the respondents finished their full-time education, the higher their daily consumption of cigarettes. Compared with 2002, this consumption does not seem to have fallen among respondents who stopped full-time education the earliest (before or at the age of 15). Finally, it seems that students smoke less than others.

SPECIAL EUROBAROMETRE 239 Attitudes of Europeans towards tobacco
- 18 -
Q6 Do you smoke at home?
92%
90%
86%
86%
85%
83%
82%
82%
82%
82%
81%
80%
80%
79%
78%
77%
75%
75%
73%
73%
72%
70%
64%
60%
50%
91%
87%
81%
80%
79%
8%
10%
13%
14%
14%
15%
17%
18%
18%
18%
18%
19%
20%
20%
21%
20%
23%
25%
25%
27%
26%
26%
30%
36%
40%
50%
8%
9%
14%
17%
21%
87%
4%
6%
0% 100%
HU
DK
NL
EL
AT
IE
DE
BE
ES
CY
UK
PL
EU25
EE
SI
LU
FR
MT
SE
LV
PT
IT
SK
CZ
LT
FI
RO
HR
BG
TR
CY (tcc)
Yes No DK
2. Places where people smoke tobacco Questionnaire source: Q6, Q7, Q8 2.1. Smoking at home Questionnaire source: Q6 – Filtered question
-Four out of five Europeans smoke at home- Some 80% of smokers4 in the European Union declare that they smoke at home. This percentage varies considerably from one Member State to another: from 50% in Finland to 92% in Hungary. In most countries, this percentage exceeds 70%, and only Finland (50%), Lithuania (60%) and the Czech Republic (64%) stand out by lower percentage of people who smoke at home.
4 Question 6 was only put to smokers

SPECIAL EUROBAROMETRE 239 Attitudes of Europeans towards tobacco
- 19 -
Q7 Do you smoke when you are in a car…? (EU25)
54%
28%
14%
40%
58%
78%
5%
13%
7%
0% 100%
When you are alone
In the company ofnon-smokers
In the company ofchildren
Yes No It depends (SPONTANEOUS) DK
2.2. Smoking in the car Questionnaire source: Q7 – Filtered question
-A certain consideration for non-smokers and children as regards smoking in the car-
Almost 80% of smokers5 in the European Union declare that they do not smoke in the car when they are in the company of children. A majority (58%) of them also do not smoke when they are in the company of non-smokers. On the other hand, more than half of smokers declare that they smoke in the car when they are on their own.
5 Question 7 was only put to smokers
SPECIAL EUROBAROMETRE 239 Attitudes of Europeans towards tobacco
- 20 -
Q7 Do you smoke when you are in a car…? When you are alone
54%
57%
59%
70%
71%
37%
38%
39%
39%
43%
45%
45%
46%
46%
47%
48%
49%
53%
54%
54%
56%
57%
58%
60%
62%
65%
67%
71%
71%
73%
73%
41%
32%
30%
24%
23%
58%
58%
52%
57%
54%
50%
52%
51%
52%
49%
37%
45%
41%
40%
39%
32%
40%
38%
31%
27%
30%
29%
25%
25%
21%
19%
3%
8%
6%
5%
4%
3%
3%
7%
4%
4%
3%
3%
9%
6%
5%
5%
4%
6%
3%
3%
8%
12%
4%
3%
4%
3%
4%
7%
3%
5%
3%
6%
6%
0% 100%
HRRO
BGCY (tcc)
TR
SEDKHU
SINLCZPL
BELUSKEE
UKDE
EU25
LTLVFI
FRITAT
ESCYMTPT
ELIE
Yes No It depends (SPONTANEOUS) DK
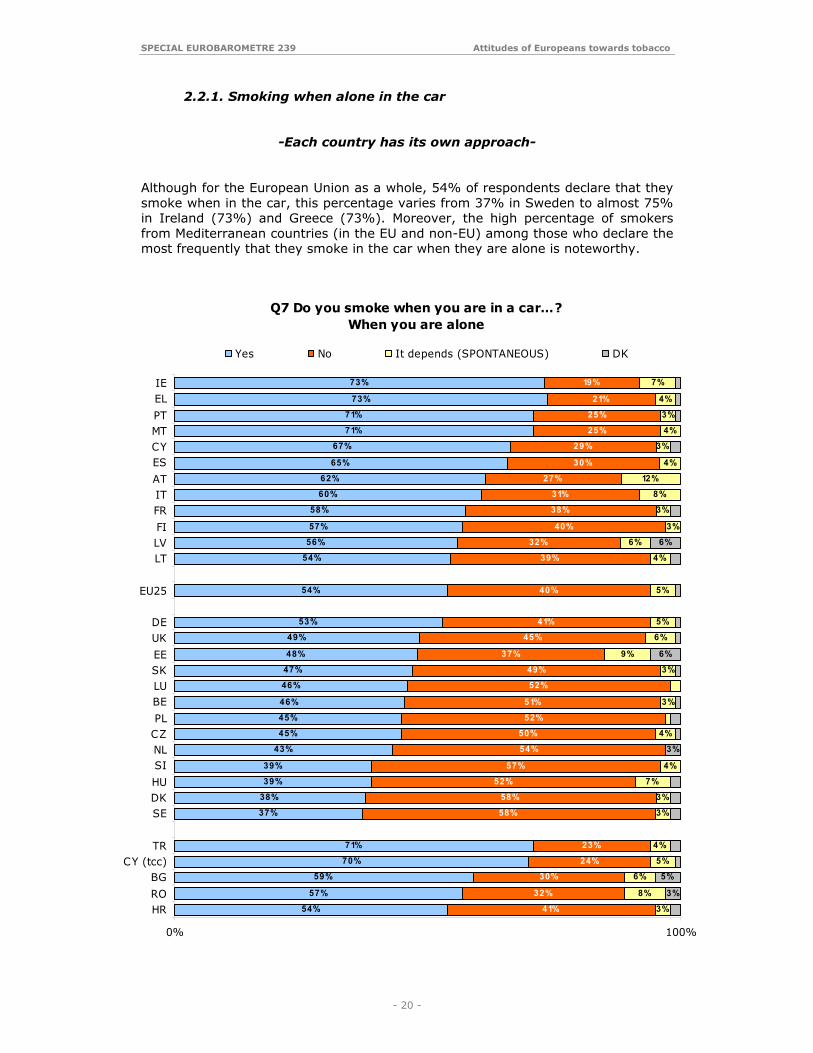
2.2.1. Smoking when alone in the car
-Each country has its own approach- Although for the European Union as a whole, 54% of respondents declare that they smoke when in the car, this percentage varies from 37% in Sweden to almost 75% in Ireland (73%) and Greece (73%). Moreover, the high percentage of smokers from Mediterranean countries (in the EU and non-EU) among those who declare the most frequently that they smoke in the car when they are alone is noteworthy.

SPECIAL EUROBAROMETRE 239 Attitudes of Europeans towards tobacco
- 21 -
An analysis of the results by socio-demographic variables shows clearly that among smokers, women (47%) smoke less than men (60%) when they are alone in the car. That also applies to the oldest age group (39%) and in particular is true among respondents who declare that they are occasional smokers (23%).
Q7 Do you smoke when you are in a car…? When you are alone
54%
60%
47%
54%
60%
57%
39%
67%
55%
58%
61%
49%
58%
37%
46%
55%
56%
46%
54%
60%
23%
0% 70%
EU25
SEX
Male
Female
AGE
15-24
25-39
40-54
55 +
OCCUPATIONAL SCALE
Self- employed
Managers
Other white collars
Manual workers
House persons
Unemployed
Retired
Students
SMOKE
Packeted cigarettes
Roll-your-own cigaret.
Cigars or a pipe
Total smoker
Regularly
Occasionally

SPECIAL EUROBAROMETRE 239 Attitudes of Europeans towards tobacco
- 22 -
Q7.2 Do you smoke when you are in a car in the company of non-smokers?
34%
39%
42%
46%
49%
39%
40%
40%
42%
45%
54%
54%
55%
56%
57%
58%
58%
58%
61%
61%
62%
66%
68%
68%
68%
69%
74%
76%
77%
80%
82%
43%
38%
46%
40%
43%
35%
47%
49%
46%
41%
22%
28%
42%
27%
29%
28%
32%
34%
18%
28%
30%
19%
14%
23%
24%
18%
16%
19%
16%
16%
13%
18%
20%
11%
12%
6%
25%
12%
11%
12%
14%
20%
17%
4%
17%
14%
13%
7%
6%
19%
11%
8%
15%
18%
8%
7%
13%
10%
4%
6%
4%
5%
0% 100%
BG
RO
CY (tcc)
TR
HR
AT
IE
EL
ES
PT
LV
DE
CY
IT
MT
EU25
LT
PL
EE
FI
BE
UK
HU
SK
FR
SI
CZ
LU
DK
SE
NL
No Yes It depends (SPONTANEOUS) DK
2.2.2. Smoking in the car in the company of non-smokers
-The consideration shown to non-smokers is fairly inconsistent between countries -
In 20 of the 25 Member States, a majority of respondents declare that they do not smoke in the car in the company of non-smokers. The proportion is as high as almost four out of five respondents in the Netherlands (82%) and Sweden (80%). On the other hand, citizens in Ireland (47%) and Greece (49%) seem, as with the previous point, to be the most likely to declare that they smoke in the car, even if, in this case, the circumstances are different.
SPECIAL EUROBAROMETRE 239 Attitudes of Europeans towards tobacco
- 23 -
Q7.2 Do you smoke when you are in a car in the company of non-smokers? Answer: yes
28%
31%25%
35%31%
28%19%
31%29%
24%29%
35%25%25%
31%27%
34%20%
29%
29%28%
24%28%
31%14%
0% 40%
EU25
SEX
Male
Female
AGE
15-24
25-39
40-54
55 +
EDUCATION (END OF)
15
16-19
20+
Still Studying
RESPONDANT OCCUPATION SCALE
Self- employed
Managers
Other white collars
Manual workers
House persons
Unemployed
Retired
Students
SMOKE
Packeted cigarettes
Roll-your-own cigaret.
Cigars or a pipe
Total smoker
Regularly
Occasionally
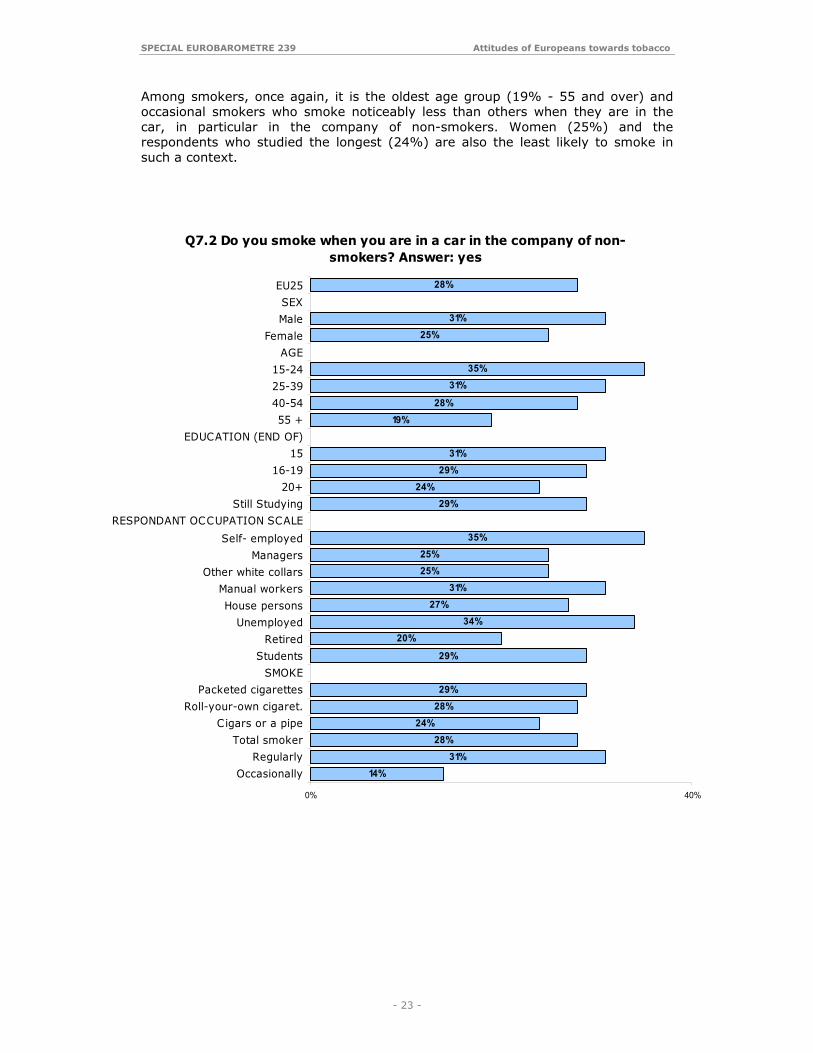
Among smokers, once again, it is the oldest age group (19% - 55 and over) and occasional smokers who smoke noticeably less than others when they are in the car, in particular in the company of non-smokers. Women (25%) and the respondents who studied the longest (24%) are also the least likely to smoke in such a context.

SPECIAL EUROBAROMETRE 239 Attitudes of Europeans towards tobacco
- 24 -
Q7.3 Do you smoke when you are in the company of childrens ?
62%
63%
64%
66%
68%
63%
66%
69%
69%
71%
73%
76%
76%
78%
78%
78%
80%
81%
81%
82%
82%
83%
83%
85%
86%
86%
86%
87%
88%
91%
91%
18%
17%
25%
26%
19%
16%
24%
21%
18%
13%
15%
18%
18%
14%
16%
13%
12%
15%
8%
4%
8%
10%
7%
7%
10%
10%
9%
8%
10%
5%
6%
16%
16%
7%
6%
12%
20%
9%
11%
12%
15%
11%
5%
5%
7%
5%
9%
7%
4%
8%
11%
10%
8%
3%
3%
5%
3%
3%
4%
10%
0% 100%
BG
RO
TR
HR
CY (tcc)
AT
ES
EL
IE
PT
DE
BE
PL
EU25
CY
MT
IT
FR
LV
EE
HU
LT
FI
SI
DK
LU
UK
CZ
NL
SK
SE
No Yes It depends (SPONTANEOUS) DK
2.2.3. Smoking in the car in the company of children
-Widespread consideration for children-
As regards smoking in the car in the presence of children, a strong majority of smokers declare that they do not smoke in such circumstances. In 15 of the 25 Member States, more than four out of five respondents seem to follow this rule. That percentage is as high as 91% in Sweden and Slovakia. On the other hand, more than 20% of Spaniards (24%) and Greeks (21%) continue to smoke in the car in the company of children. It is also noteworthy that in the candidate countries, a higher percentage of people smoke in the company of children in Croatia (26%) and Turkey (25%).

SPECIAL EUROBAROMETRE 239 Attitudes of Europeans towards tobacco
- 25 -
Q7.3 Do you smoke when you are in the company of childrens ? Answer: yes
14%
14%14%
12%15%
17%10%
17%15%
11%9%
16%11%
15%13%
21%20%
11%9%
14%17%
12%14%
16%5%
0% 25%
EU25
SEXMale
Female
AGE15-2425-39
40-5455 +
EDUCATION (END OF)
1516-19
20+
Still StudyingRESPONDANT OCCUPATION SCALE
Self- employed
ManagersOther white collars
Manual workers
House personsUnemployed
Retired
StudentsSMOKE
Packeted cigarettes
Roll-your-own cigaret.Cigars or a pipe
Total smoker
RegularlyOccasionally
Smokers with the highest level of education (11%), retired people (11%), students (9%) and mangers (11%) smoke less often than others when there are children in the car. Occasional smokers (5%) are the least likely to smoke in such circumstances.

SPECIAL EUROBAROMETRE 239 Attitudes of Europeans towards tobacco
- 26 -
Q8. Are you in favour of smoking bans in the following places?(EU25)
66%
63%
56%
40%
20%
21%
21%
21%
7%
9%
13%
20%
5%
6%
9%
16%
0% 100%
Offices, and other indoorworkplaces
Any indoor public space(metro, airports, shops,
etc.)
Restaurants
Bars or Pubs
Totally in favour Somewhat in favour Somewhat opposed Totally opposed DK
2.3. Banning smoking in public places Questionnaire source: Q8
-A strong majority of European citizens are in favour of a ban on smoking in public places-
On the whole, a majority of European Union citizens seem to be in favour of banning smoking in public places. More than four out of five respondents take that view as regards smoking in offices and other indoor workplaces (86%), as well as in any indoor public spaces (84%). For those places, more than 60% of the people interviewed are even totally in favour of a ban. Support for a ban seems to be less clear-cut in the case of restaurants, bars and pubs. Although, in the case of restaurants, a majority of respondents (56%) are once again fully in favour of such a ban, the corresponding percentage is only 40% in the case of bars and pubs. For the latter, just over a third of the people interviewed seem to be against such a ban.

SPECIAL EUROBAROMETRE 239 Attitudes of Europeans towards tobacco
- 27 -
Q8.1 Are you in favour of smoking bans in the following places? Answer: Restaurants
41%
41%
44%
72%
71%
27%
33%
37%
44%
49%
47%
45%
48%
53%
52%
56%
57%
57%
58%
47%
69%
50%
62%
63%
62%
70%
78%
70%
62%
79%
84%
17%
24%
23%
7%
10%
22%
29%
27%
24%
18%
22%
25%
22%
22%
23%
21%
21%
20%
21%
31%
11%
28%
19%
20%
21%
14%
11%
20%
29%
14%
9%
17%
17%
13%
6%
4%
26%
22%
18%
12%
15%
17%
15%
15%
14%
15%
13%
15%
12%
13%
12%
9%
12%
8%
7%
5%
5%
5%
4%
2%
17%
13%
15%
8%
13%
24%
14%
17%
20%
14%
11%
15%
13%
8%
9%
9%
7%
10%
8%
7%
7%
7%
10%
5%
8%
7%
6%
4%
4%
2%
3%
12%
14%
0% 100%
RO
BG
HR
CY (tcc)
TR
CZ
AT
DK
NL
LT
DE
EL
ES
PL
SK
EU25
FR
LU
BE
EE
CY
FI
PT
HU
LV
UK
SE
IT
SI
IE
MT
Totally in favour Somewhat in favour Somewhat opposed
Totally opposed DK
2.3.1. Banning smoking in restaurants
-A general consensus in most countries in favour of a ban on smoking in restaurants-
In almost all the Member States, European Union citizens are in favour of banning smoking in restaurants. This proportion is in excess of 90% in Malta (93%), Ireland (93%) and Slovenia (91%). In a majority of Member States, more than half of the respondents are even very much in favour of such a ban on smoking. The Czech Republic is the only country where a majority of citizens (50%) are opposed to a ban on smoking on restaurants.

SPECIAL EUROBAROMETRE 239 Attitudes of Europeans towards tobacco
- 28 -
Q8.1 Are you in favour of smoking bans in the following places? Answer: Restaurants
48%
55%
55%
59%
83%
88%
51%
43%
44%
40%
16%
10%
0% 100%
Roll-your-own cigaret.
Packeted cigarettes
Total smoker
Cigars or a pipe
Smoked but have stopped
Never smoke
In favour Opposed DK
-More than eight of ten non-smokers are in favour of a ban on smoking in restaurants-
Almost 88% of people who have never smoked, as well as 83% of those who have stopped smoking are in favour of a ban on smoking in restaurants, compared with 55% of smokers. People who smoke roll-up cigarettes (48%) seem to be the least in favour to such a ban. A socio-demographic analysis reveals that support for a ban on smoking in restaurants is highest among women (79% versus 74% for men), the oldest respondents (83%) and people looking after the home (81%).

SPECIAL EUROBAROMETRE 239 Attitudes of Europeans towards tobacco
- 29 -
Q8.2 Are you in favour of smoking bans in the following places? Answer: Bars or Pubs
26%
31%
37%
63%
66%
16%
21%
25%
23%
23%
30%
27%
31%
34%
37%
38%
40%
40%
42%
39%
43%
50%
56%
39%
40%
41%
49%
64%
71%
64%
69%
19%
19%
23%
7%
7%
19%
21%
21%
23%
25%
21%
26%
25%
22%
22%
21%
20%
21%
20%
24%
24%
19%
14%
34%
34%
33%
27%
17%
11%
18%
19%
20%
19%
19%
7%
8%
36%
30%
30%
17%
21%
30%
22%
28%
21%
24%
24%
20%
20%
17%
24%
16%
14%
14%
15%
10%
9%
10%
9%
7%
30%
21%
16%
18%
10%
28%
23%
22%
36%
28%
17%
24%
16%
22%
13%
15%
17%
16%
18%
11%
17%
16%
12%
13%
10%
10%
12%
10%
7%
9%
5%
12%
14%
0% 100%
HR
RO
BG
TR
CY (tcc)
CZ
AT
DE
NL
DK
SK
LU
BE
EL
PL
FR
LT
EU25
ES
HU
UK
PT
CY
SI
EE
FI
LV
MT
IE
SE
IT
Totally in favour Somewhat in favour Somewhat opposed
Totally opposed DK
2.3.2. Banning smoking in bars and pubs
-Opinions are more divided on a ban on smoking in bars and pubs- Opinions of Europeans are far more divided on the question of introducing a ban on smoking in bars and pubs. Although more than 80% of citizens in Italy (88%), Sweden (82%) and Ireland (82%) are in favour of such a ban, the level of support is only 35% in the Czech Republic, 42% in Austria and 46% in Germany.

SPECIAL EUROBAROMETRE 239 Attitudes of Europeans towards tobacco
- 30 -
Q8.2 Are you in favour of smoking bans in the following places? Answer: Bars or Pubs
21%
35%
37%
39%
67%
77%
77%
63%
62%
59%
31%
20%
0% 100%
Roll-your-own cigaret.
Total smoker
Packeted cigarettes
Cigars or a pipe
Smoked but have stopped
Never smoke
In favour Opposed DK
Once again, women (66%) are more likely than men (57%) to support a ban on smoking in bars and pubs. The older the respondents, the more they seem to support such a ban. Finally, it is noteworthy that students (54%), manual workers (54%) and unemployed people (47%), and people living in large cities are among those that are the least in favour of this measure. Although a majority of non-smokers are in favour of a ban on smoking in bars and pubs, a minority (35%) of smokers support such a ban. People who smoke roll-up cigarettes (21%) seem to be the least receptive to these measures.

SPECIAL EUROBAROMETRE 239 Attitudes of Europeans towards tobacco
- 31 -
Q8.3 Are you in favour of smoking bans in the following places? Answer: Offices, and other indoor workplaces
53%
64%
77%
63%
78%
47%
43%
58%
60%
57%
60%
63%
64%
71%
66%
65%
62%
67%
72%
71%
66%
78%
78%
77%
67%
69%
72%
76%
90%
86%
84%
15%
18%
5%
21%
7%
20%
28%
21%
19%
23%
23%
20%
22%
15%
20%
22%
25%
20%
16%
18%
23%
12%
12%
14%
23%
22%
19%
18%
5%
8%
13%
10%
7%
5%
7%
3%
12%
16%
12%
9%
10%
9%
7%
9%
6%
7%
7%
6%
8%
6%
4%
4%
6%
5%
3%
3%
14%
8%
9%
7%
10%
20%
10%
7%
10%
9%
6%
8%
5%
6%
5%
4%
4%
3%
5%
6%
3%
3%
3%
4%
5%
5%
7%
5%
3%
4%
3%
3%
0% 100%
RO
HR
CY (tcc)
BG
TR
CZ
AT
ES
LT
EL
DK
PT
BE
UK
EU25
PL
DE
HU
NL
EE
LU
IE
CY
LV
SK
FR
IT
SI
SE
FI
MT
Totally in favour Somewhat in favour Somewhat opposed
Totally opposed DK
2.3.3. Banning smoking in offices and other indoor workplaces
-All Member States are strongly in favour of a ban on smoking in offices and other indoor workplaces-
There is a general consensus in all Member States on the subject of banning smoking in offices and other indoor workplaces. In all countries, more than two-thirds of citizens are in favour of such a ban. In 23 of the 25 EU Member States, and in all the accession and candidate countries, a majority of respondents are very much in favour of such a ban. More than four out of five respondents in Sweden (90%), Finland (86%) and Malta (84%) are totally in favour of a ban on smoking in offices and other indoor workplaces.

SPECIAL EUROBAROMETRE 239 Attitudes of Europeans towards tobacco
- 32 -
Q8.3 Are you in favour of smoking bans in the following places? Answer: Offices, and other indoor workplaces
69%
72%
75%
76%
90%
93%
26%
26%
23%
23%
9%
6%
0% 100%
Cigars or a pipe
Roll-your-own cigaret.
Total smoker
Packeted cigarettes
Smoked but have stopped
Never smoke
In favour Opposed DK
The socio-demographic results do not reveal any particular divisions on this question. However, it is to be noted, once gain, that women (89%) are more in favour than men (84%) of banning smoking. The same is true as regards the oldest age group.
-A strong majority of smokers in favour of banning smoking in offices and other indoor workplaces-
Three-quarters of smokers (75%) and almost more than 90% of non-smokers are in favour of banning smoking in offices and other indoor workplaces.

SPECIAL EUROBAROMETRE 239 Attitudes of Europeans towards tobacco
- 33 -
Q8.4 Are you in favour of smoking bans in the following places? Answer:
Any indoor public space (metro, airports, shops, etc.)
56%
63%
77%
67%
80%
37%
50%
61%
53%
53%
59%
60%
60%
62%
62%
57%
63%
64%
63%
64%
74%
65%
75%
75%
61%
76%
73%
68%
85%
79%
83%
16%
19%
6%
17%
5%
28%
18%
16%
26%
26%
21%
21%
22%
20%
22%
26%
21%
21%
21%
22%
15%
23%
13%
13%
27%
14%
18%
24%
8%
13%
10%
9%
7%
4%
6%
19%
11%
10%
15%
12%
10%
10%
9%
8%
10%
9%
9%
9%
10%
8%
7%
6%
6%
5%
6%
4%
4%
5%
4%
13%
7%
10%
6%
10%
13%
20%
11%
6%
8%
8%
9%
8%
9%
5%
5%
6%
5%
5%
4%
6%
3%
4%
4%
4%
5%
3%
4%
5%
8%
3%
0% 100%
RO
HR
CY (tcc)
BG
TR
AT
CZ
LT
BE
DK
ES
EL
NL
PT
DE
PL
EU25
UK
LU
HU
EE
FR
IE
CY
SK
LV
IT
SI
SE
MT
FI
Totally in favour Somewhat in favour Somewhat opposedTotally opposed DK
2.3.4. Banning smoking in any indoor public space (metro, airports, shops, etc.)
-A majority of citizens in all countries are in favour of banning smoking in all indoor public spaces -
Although the proportion is not as high in this case as for indoor workplaces, a majority of citizens in all the countries participating in the survey are in favour of banning smoking in all public places. Once again, citizens in Sweden (85%), Finland (83%) and Malta (79%) tend to be the most in favour of such a ban. Likewise, citizens in the Czech Republic (50%) and above all in Austria (37%) seem, as was the case for indoor workplaces, slightly less favourable than the others to such a ban. Resistance to such a measure is the strongest in the Czech Republic (20% of respondents are totally against the idea).

SPECIAL EUROBAROMETRE 239 Attitudes of Europeans towards tobacco
- 34 -
Q8.4 Are you in favour of smoking bans in the following places? Answer:
Any indoor public space (metro, airports, shops, etc.)
65%
69%
72%
73%
88%
91%
33%
31%
26%
26%
11%
8%
0% 100%
Roll-your-own cigaret.
Cigars or a pipe
Total smoker
Packeted cigarettes
Smoked but have stopped
Never smoke
In favour Opposed DK
Women (87% versus 82% of men) and older people (87% among people aged 55 and over) tend once again to be slightly more in favour of such a ban. On the other hand, unemployed people (79%) are slightly less so. On the whole, the results reveal no significant differences in socio-demographic terms. The fact of being a smoker or a non-smoker seems, on the other hand, to be a more cleaving aspect. Although overall a majority or respondents are in favour of a ban on smoking in indoor public spaces, such as metros, airports and shops, as the chart below shows, 91% of people who have never smoked are in favour of such measures compared with 72% of smokers. These results are fairly similar to those noted with regard to workplaces, with however slightly lower “in favour” rates of replies (by approximately 3 points) for each category of replies.

SPECIAL EUROBAROMETRE 239 Attitudes of Europeans towards tobacco
- 35 -
3. Exposure to tobacco smoke Questionnaire source: Q9, Q10, Q4, Q5 and Q12.1 3.1. The nuisance of tobacco smoke Questionnaire source: Q9
-Respondents are divided on the question of the bother caused by exposure to tobacco smoke-
On the question of the bother caused by exposure to tobacco smoke, a majority of European Union Citizens (57%) declare that they are rarely (30%) or never (27%) bothered by it (see the chart on the next page). There are however particularly marked cleavages of opinion from one Member State to another. Citizens in Malta (64%), Cyprus, Italy and Slovakia (54%) seem to be the most bothered by exposure to tobacco smoke. On the other hand, respondents in the Nordic countries do not seem to be bothered by tobacco smoke. Approximately a quarter of citizens in Finland (25%) and Sweden (24%) declare that they are sometimes or very often bothered by such exposure. It is also noteworthy that almost four out of ten citizens (39%) in France, Luxembourg and Ireland declare that they have never been bothered by cigarette smoke. In the candidate and accession countries, citizens in Turkey (62%) and Rumania (54%) notably seem to be particularly averse to the nuisance of tobacco smoke.

SPECIAL EUROBAROMETRE 239 Attitudes of Europeans towards tobacco
- 36 -
Q9 How often are you bothered by exposure to tobacco smoke in your daily life?
14%
21%
15%
20%
38%
7%
7%
10%
11%
9%
11%
12%
9%
14%
15%
18%
13%
16%
12%
16%
18%
20%
20%
13%
15%
18%
20%
24%
22%
26%
39%
26%
21%
28%
34%
24%
17%
18%
22%
23%
24%
25%
26%
30%
27%
27%
26%
29%
28%
32%
29%
28%
28%
29%
36%
34%
32%
32%
30%
32%
28%
25%
29%
20%
28%
23%
15%
43%
42%
38%
41%
27%
25%
23%
29%
31%
30%
26%
34%
25%
29%
33%
27%
25%
24%
22%
32%
24%
24%
26%
27%
20%
19%
29%
34%
29%
22%
22%
34%
33%
29%
25%
39%
39%
39%
32%
27%
27%
31%
23%
30%
26%
22%
26%
26%
27%
28%
18%
26%
23%
19%
19%
26%
15%
0% 100%
BG
CY (tcc)
HR
RO
TR
SE
FI
DK
DE
IE
LU
FR
NL
UK
EU25
EL
PT
LV
BE
SI
ES
PL
HU
AT
CZ
EE
LT
SK
IT
CY
MT
Very often Sometimes Rarely Never DK

SPECIAL EUROBAROMETRE 239 Attitudes of Europeans towards tobacco
- 37 -
An analysis of the socio-demographic variables reveals significant differences in the replies to this question.
-The younger the respondents the more they seem to be bothered by tobacco smoke
Women (45%) seem to be slightly more bothered than men by tobacco smoke in their daily life. However, the age of respondents seems to be a significant factor in terms of difference in the reaction to tobacco smoke: the youngest respondents seem to be the most bothered by tobacco smoke in their daily life (53% in the 15-24 age group). This aversion of young people to tobacco smoke is confirmed by the particularly high rate of positive replies (57%) among students. The respondent’s level of education and socio-professional category also translate certain differences of opinion, but to a lesser extent. The following categories also seem to be less bothered by tobacco smoke: retired people (33%), unemployed people (37%) and people who left school at an early age (38%). Finally, it is to be noted that people who have never smoked (53%) are twice as likely as smokers (26%) to admit to being bothered by tobacco smoke. In addition, those who have stopped smoking (44%) seem to be frequently bothered by other people’s smoke.
Q9 How often are you bothered by exposure to tobacco smoke in your daily life?
Answer: yes (very often + sometimes)
42%
40%
45%
53%
45%
42%
35%
38%
40%
44%
57%
43%
44%
48%
44%
44%
37%
33%
57%
26%
27%
26%
44%
53%
26%
0% 60%
EU25
SEX
M ale
Female
AGE
15-24
25-39
40-54
55 +
EDUCATION (END OF)
15
16-19
20+
Still Studying
OCCUPATIONAL SCALE
Self- employed
M anagers
Other white co llars
M anual workers
House persons
Unemployed
Retired
Students
SM OKE
Packeted cigarettes
Roll-your-own cigaret.
Cigars or a pipe
Smoked but have stopped
Never smoked
Total smoker
SPECIAL EUROBAROMETRE 239 Attitudes of Europeans towards tobacco
- 38 -
Q10 Why does this exposure to tobacco bother you ?
40%
52%
54%
60%
61%
57%
25%
43%
43%
48%
48%
49%
50%
52%
53%
53%
53%
56%
57%
58%
59%
60%
63%
63%
64%
64%
65%
68%
68%
73%
79%
52%
31%
35%
26%
33%
27%
55%
46%
42%
34%
36%
38%
31%
36%
31%
36%
27%
27%
28%
28%
26%
18%
24%
26%
24%
23%
23%
22%
24%
19%
15%
7%
10%
7%
8%
3%
9%
15%
10%
9%
12%
12%
11%
9%
8%
9%
7%
16%
9%
8%
10%
12%
5%
7%
6%
9%
6%
4%
5%
5%
3%
5%
4%
3%
4%
3%
8%
4%
6%
4%
5%
3%
3%
5%
6%
3%
3%
9%
3%
4%
3%
4%
12%
0% 100%
TR
HR
BG
RO
CY (tcc)
EU25
MT
EL
PT
DK
CY
SK
AT
BE
IT
SE
UK
IE
ES
NL
FR
DE
CZ
LU
HU
SI
FI
EE
PL
LT
LV
You find it annoying because it makes your clothes\hair smell but it causes noparticular physical symptoms
You have never been diagnosed with a health condition but tobacco smokecauses some physical symptoms
You have a recognised health condition and tobacco smoke makes the symptomsworse
Other (SPONTANEOUS)
DK
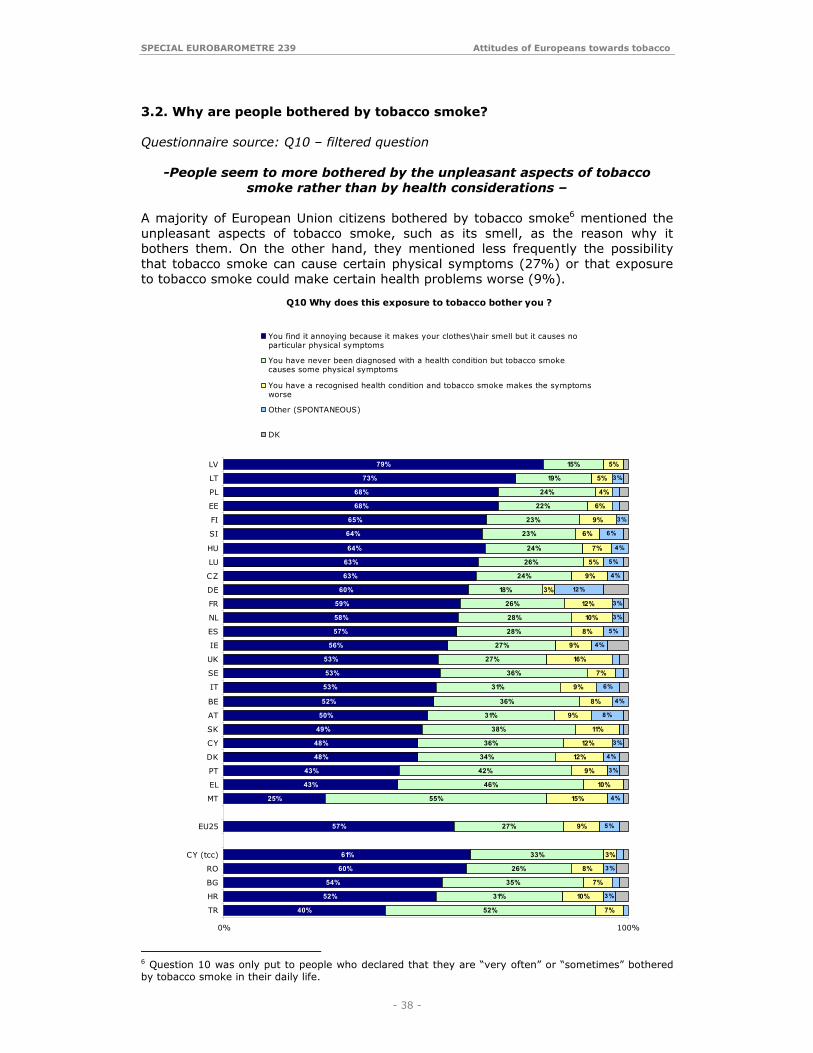
3.2. Why are people bothered by tobacco smoke? Questionnaire source: Q10 – filtered question
-People seem to more bothered by the unpleasant aspects of tobacco smoke rather than by health considerations –
A majority of European Union citizens bothered by tobacco smoke6 mentioned the unpleasant aspects of tobacco smoke, such as its smell, as the reason why it bothers them. On the other hand, they mentioned less frequently the possibility that tobacco smoke can cause certain physical symptoms (27%) or that exposure to tobacco smoke could make certain health problems worse (9%).
6 Question 10 was only put to people who declared that they are “very often” or “sometimes” bothered by tobacco smoke in their daily life.

SPECIAL EUROBAROMETRE 239 Attitudes of Europeans towards tobacco
- 39 -
In most countries, the fact that people are bothered by exposure to tobacco smoke in their daily life is explained in the majority of cases by the unpleasant aspects of such smoke. The physical symptoms caused by tobacco smoke are mentioned slightly less frequently. In the Baltic countries and Poland (68%), more than two-thirds of the people interviewed mentioned the unpleasant aspects of tobacco smoke to explain why they object to it. On the other hand, in Greece (46%), Turkey (52%) and Malta (55%), the physical symptoms are the most frequently mentioned reason.
-The unpleasant aspects of tobacco smoke are more frequently mentioned by young people-
An analysis of the descriptive variables (see chart on the next page) shows that the unpleasant aspects of tobacco smoke are more often mentioned by young people (60%), students (62%) and managers (62%). On the other hand, such aspects are less frequently mentioned by the oldest respondents (52% among those aged 55 and over) and consequently by retired people (50%), people who place themselves on the left of the political spectrum (54%), smokers (54%) and above all smokers who roll their own cigarettes (42%).
-Health related problems more frequently mentioned by the oldest respondents-
The physical symptoms caused by tobacco smoke seem, on the other hand, to be more mentioned by women (29%), the oldest respondents (30%) and retired people (32%), people who place themselves on the left of the political spectrum (31%), and above all by cigar or pipe smokers (37%). The respondents who mentioned a recognised health problem are logically the oldest respondents and retired people (14%), as well as, to a lesser extent, people who have stopped smoking (11%).

SPECIAL EUROBAROMETRE 239 Attitudes of Europeans towards tobacco
- 40 -
Q10 Why does this exposure to tobacco bother you ?
57%
58%
56%
60%
58%
59%
52%
54%
58%
56%
62%
54%
58%
60%
58%
63%
57%
58%
55%
57%
50%
62%
55%
42%
58%
59%
57%
54%
27%
25%
29%
26%
27%
26%
30%
28%
25%
29%
26%
31%
26%
24%
24%
24%
29%
24%
29%
28%
32%
26%
21%
26%
37%
24%
30%
22%
9%
8%
9%
7%
7%
8%
13%
11%
8%
8%
7%
8%
10%
8%
9%
6%
7%
8%
14%
7%
5%
7%
11%
9%
6%
5%
5%
5%
5%
4%
5%
6%
4%
4%
5%
5%
5%
5%
4%
5%
7%
4%
12%
18%
4%
4%
13%
3%
3%
3%
3%
3%
3%
6%8%
6%
9%
7%
4%
5%
4%
6%
4%
4%
0% 100%
EU25
SEXMale
FemaleAGE
15-24
25-3940-54
55 +EDUCATION (END OF)
1516-19
20+Still Studying
LEFT-RIGHT SCALE
(1-4) Left(5-6) Centre
(7-10) RightOCCUPATIONAL SCALE
Self- employedManagers
Other white collars
Manual workersHouse persons
UnemployedRetired
StudentsSMOKE
Packeted cigarettesRoll-your-own cigaret.
Cigars or a pipe
Smoked but have stoppedNever smoke
Total smoker
You find it annoying because it makes your clothes\hair smell but it causes noparticular physical symptoms
You have never been diagnosed with a health condition but tobacco smokecauses some physical symptoms
You have a recognised health condition and tobacco smoke makes the symptomsworse
Other (SPONTANEOUS)
DK

SPECIAL EUROBAROMETRE 239 Attitudes of Europeans towards tobacco
- 41 -
Q4 Do you ever ask a smoker not to smoke near you because it bothers you? ... ?
28%
19%
12%
7%
10%
18%
15%
11%
17%
11%
16%
15%
9%
4%
9%
7%
4%
17%
6%
8%
8%
9%
8%
9%
5%
8%
5%
5%
10%
5%
6%
18%
17%
17%
15%
9%
16%
18%
16%
13%
20%
15%
12%
21%
13%
13%
11%
12%
15%
10%
13%
14%
13%
12%
12%
9%
12%
9%
9%
8%
8%
7%
24%
30%
33%
32%
24%
32%
28%
34%
27%
27%
27%
30%
27%
35%
31%
35%
37%
22%
37%
32%
31%
30%
31%
30%
33%
27%
31%
30%
26%
28%
21%
26%
33%
36%
43%
57%
34%
38%
38%
41%
41%
42%
43%
44%
44%
45%
45%
45%
46%
47%
47%
47%
48%
49%
50%
52%
53%
54%
55%
56%
58%
64%
2%
0% 100%
TR
CY (tcc)RO
BGHR
MTIT
SKEE
PLLV
LTELPT
BECZ
ATCY
DELUHU
EU25
ES
SISE
FRDKNL
UKFI
IE
Always Often Sometimes Never DK
3.3. Asking smokers not to smoke Questionnaire source: Q4
-Approximately one in two Europeans asks smokers not to smoke near them-
European Union citizens seem fairly divided on the question of asking smokers not to smoke in front of them. Although 48% never ask a smoker not to smoke near them, 52% do so, at least sometimes. Approximately one in five European Union citizens (22%) often or always makes such a request.

SPECIAL EUROBAROMETRE 239 Attitudes of Europeans towards tobacco
- 42 -
-Tolerance towards smokers varies considerably from one country to another-
In two-thirds of the Member States, a majority of respondents declare that they ask smokers not to smoke in their presence. Citizens in Turkey (70%), Malta (66%), the Turkish Cypriot Community (66%) and Italy (61%) are the most likely to react in this way. On the other hand, a majority of citizens in Ireland (64%), Finland (58%) and the United Kingdom (56%) never make such a request. If we add together the number of “sometimes” and “never” replies, it is clear that a clear majority of respondents in all the countries either do not react or react only to a limited extent, and demonstrate a certain tolerance towards smokers. Women (55%) are more likely than men (48%) to ask smokers not to smoke. That reaction is also slightly more frequent among students and those who studied the longest (57%). Managers (59%), people who look after the home (57%) and other white collar employees are also more inclined to adopt this reaction.
Q4 Do you ever ask a smoker not to smoke near you because it bothers you?
Answer: Yes
52%
48%
55%
54%
54%
50%
50%
47%
51%
57%
57%
54%
59%
56%
47%
57%
48%
47%
57%
0% 70%
EU25
SEX
M ale
Female
AGE
15-24
25-39
40-54
55 +
EDUCATION (END OF)
15
16-19
20+
Still Studying
OCCUPATIONAL SCALE
Self- employed
M anagers
Other white co llars
M anual workers
House persons
Unemployed
Retired
Students

SPECIAL EUROBAROMETRE 239 Attitudes of Europeans towards tobacco
- 43 -
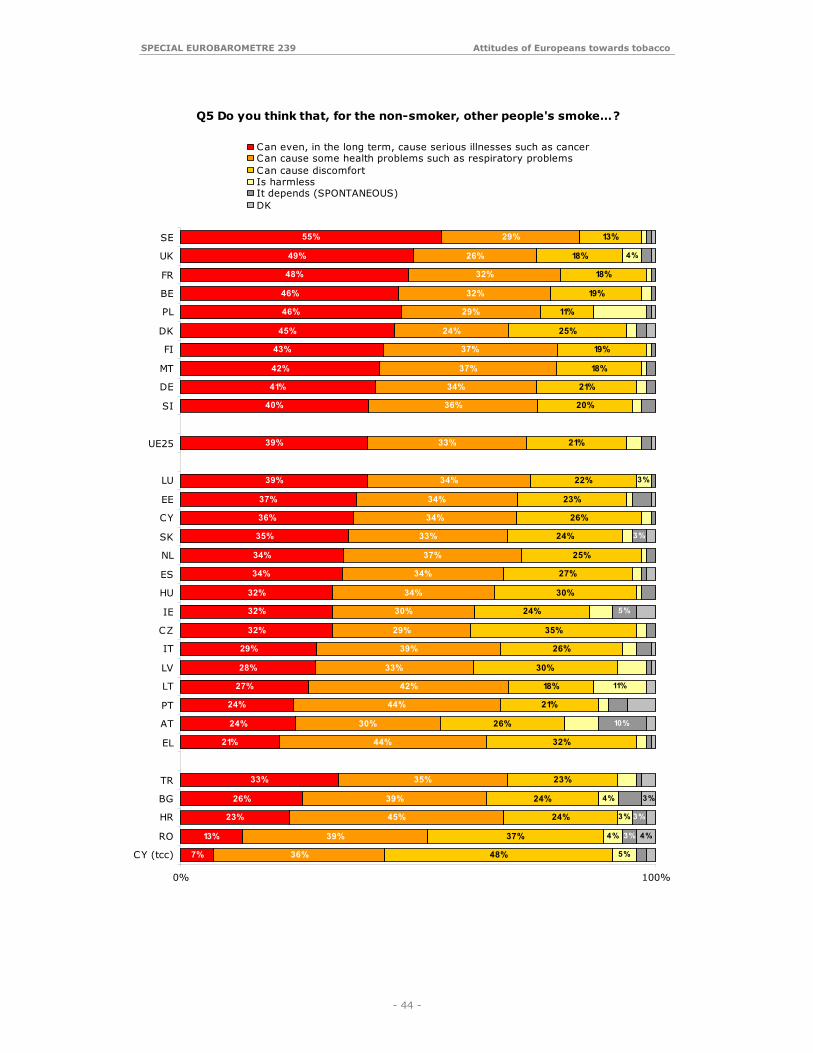
3.4. The discomfort and harm caused by tobacco smoke to non-smokers Questionnaire source: Q5
-3/4 of EU citizens are aware that tobacco smoke can be harmful for non-smokers-
Approximately three-quarters of European Union citizens think that other people’s smoke can be a health risk, either by causing serious illnesses such as cancer (39%) or by causing health problems such as respiratory problems (33%). Although the danger of other people’s smoke is not always perceived, it seems that in all the Member States, a majority of respondents are aware of the dangers of passive smoking. Although one respondent in five believes that tobacco smoke can disturb other people, only 3% seem not to be aware of the dangers of tobacco smoke. An analysis by country reveals significant differences of opinion between Member States. In Sweden 84% of citizens think that tobacco smoke can cause either serious illnesses such as cancer (55%), or respiratory problems (29%). That point of view is shared by 80% of respondents in Finland and France. On the other hand, only a small majority of Austrians (54%) see second-hand smoke as a health risk. Moreover, less than a quarter of respondents in Portugal (24%), Austria (24%) and Greece (21%) believe that other people’s smoke can lead in the long term to serious illnesses such as cancer. In the accession and candidate countries, citizens in Rumania and above all the Turkish Cypriot Community seem particularly badly-informed about the health risks of other people’s smoke. The results obtained reveal no significant differences in socio-demographic terms. It is to be noted, however, than women (76%) seem more aware than men (69%) of the health risks of other people’s smoke.
SPECIAL EUROBAROMETRE 239 Attitudes of Europeans towards tobacco
- 44 -
Q5 Do you think that, for the non-smoker, other people's smoke…?
7%
13%
23%
26%
33%
21%
24%
24%
27%
28%
29%
32%
32%
32%
34%
34%
35%
36%
37%
39%
39%
40%
41%
42%
43%
45%
46%
46%
48%
49%
55%
36%
39%
45%
39%
35%
44%
30%
44%
42%
33%
39%
29%
30%
34%
34%
37%
33%
34%
34%
34%
33%
36%
34%
37%
37%
24%
29%
32%
32%
26%
29%
48%
37%
24%
24%
23%
32%
26%
21%
18%
30%
26%
35%
24%
30%
27%
25%
24%
26%
23%
22%
21%
20%
21%
18%
19%
25%
11%
19%
18%
18%
13%
4%
3%
4%
11%
5%
4%
3%
10%
3%
5%
3%
3%
3%
4%
0% 100%
CY (tcc)
RO
HR
BG
TR
EL
AT
PT
LT
LV
IT
CZ
IE
HU
ES
NL
SK
CY
EE
LU
UE25
SI
DE
MT
FI
DK
PL
BE
FR
UK
SE
Can even, in the long term, cause serious illnesses such as cancer Can cause some health problems such as respiratory problemsCan cause discomfortIs harmlessIt depends (SPONTANEOUS)DK

SPECIAL EUROBAROMETRE 239 Attitudes of Europeans towards tobacco
- 45 -
3.5. The dangers of tobacco smoke for pregnant women Questionnaire source: Q12.1. et Q12.2.
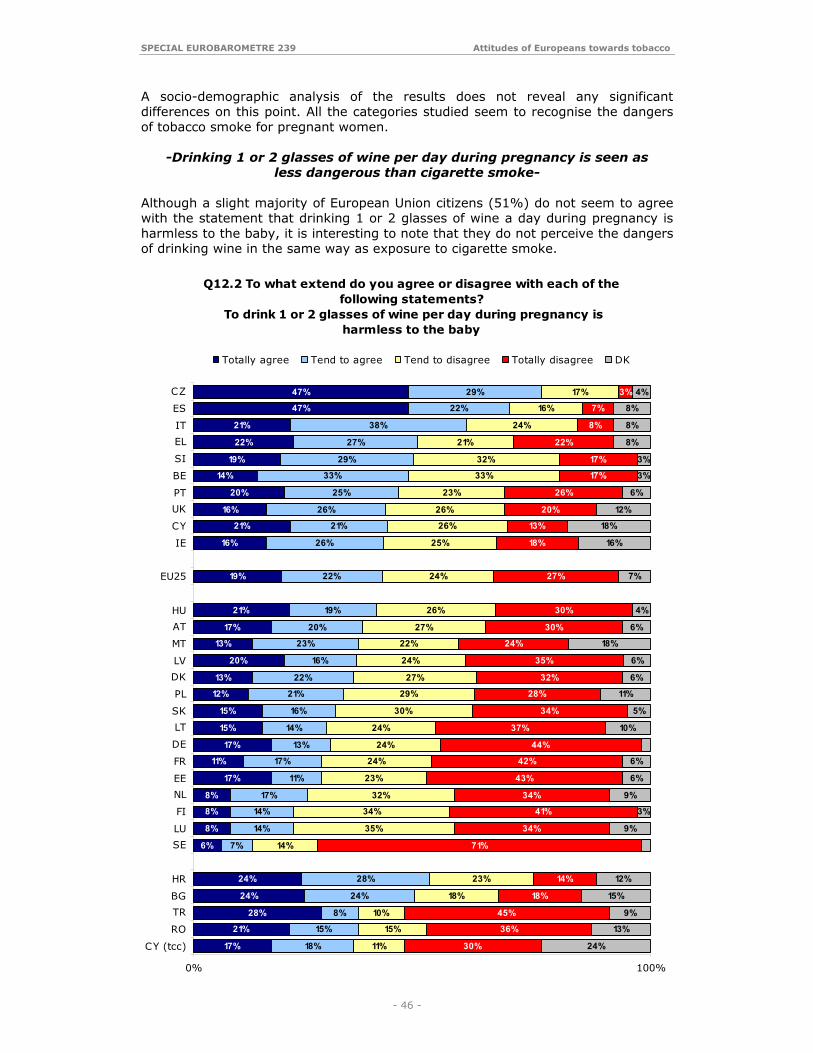
-95% of EU citizens believe that smoking in the presence of pregnant women can be very dangerous for the baby-
Almost 95% of European Union citizens seem to agree with the statement that smoking in the presence of a pregnant woman can be very dangerous for the baby. Almost three-quarters (74%) of respondents even declared that they totally agree with this statement. More than 80% of respondents in all the countries which participated in the survey are aware of this danger. There are, however, significant differences of opinion when only the “totally agree” category of answers are taken into consideration. The scores in this category vary from 55% in Austria and the Netherlands to 86% in Cyprus and Hungary, 87% in the Turkish Cypriot Community and 92% in Turkey.
Q12.1 Dans quelle m esure êtes-vous d'accord avec les a ffirm ations suivantes ?
Réponse: Fum er en présence d’une fem m e enceinte peut être très dangereux pour le bébé
8 6 %
8 6 %
8 5 %
8 4 %
82 %
81%
8 1%
7 9%
7 9%
7 8 %
7 8 %
7 7 %
7 7 %
7 5 %
7 4 %
7 3 %
7 2 %
7 1%
69 %
69 %
6 5 %
6 3 %
6 2 %
6 0 %
5 5%
5 5 %
9 2%
8 7 %
7 1%
8 0 %
6 3 %
11%
10 %
12 %
12 %
13 %
15 %
15 %
18 %
14 %
18 %
14 %
2 1%
19 %
2 1%
2 1%
2 1%
21%
2 4 %
2 7 %
2 4%
2 9 %
2 5 %
29 %
2 6 %
2 9 %
3 0%
3 %
7 %
2 1%
10 %
2 5 %
3 %
2 %
4 %
3 %
5 %
5 %
7 %
3 %
8 %
10 %
9 %
3 %
2 %
6 %
3 %
3 %
3 %
3 %
5 %
3 %
4 %
3 %
3 %
4%
6 %
3 %
3 %
3 %
5 %
4 %
4 %
0% 100%
HU
C Y
MT
LV
LT
FR
EL
SK
EE
PL
LU
C Z
D E
S I
UE25
PT
UK
ES
IT
BE
FI
SE
IE
D K
NL
AT
TR
C Y (tcc)
BG
RO
HR
Tout à fa it d’a ccord P lutô t d ’a ccord P lutô t pas d’accord
Pas du tout d ’a ccord NSP
SPECIAL EUROBAROMETRE 239 Attitudes of Europeans towards tobacco
- 46 -
Q12.2 To what extend do you agree or disagree with each of the following statements?
To drink 1 or 2 glasses of wine per day during pregnancy is harmless to the baby
17%
21%
28%
24%
24%
6%
8%
8%
8%
17%
11%
17%
15%
15%
12%
13%
20%
13%
17%
21%
19%
16%
21%
16%
20%
14%
19%
22%
21%
47%
47%
18%
15%
8%
24%
28%
7%
14%
14%
17%
11%
17%
13%
14%
16%
21%
22%
16%
23%
20%
19%
22%
26%
21%
26%
25%
33%
29%
27%
38%
22%
29%
11%
15%
10%
18%
23%
14%
35%
34%
32%
23%
24%
24%
24%
30%
29%
27%
24%
22%
27%
26%
24%
25%
26%
26%
23%
33%
32%
21%
24%
16%
17%
30%
36%
45%
18%
14%
71%
34%
41%
34%
43%
42%
44%
37%
34%
28%
32%
35%
24%
30%
30%
27%
18%
13%
20%
26%
17%
17%
22%
8%
7%
3%
24%
13%
9%
15%
12%
9%
3%
9%
6%
6%
10%
5%
11%
6%
6%
18%
6%
4%
7%
16%
18%
12%
6%
3%
3%
8%
8%
8%
4%
0% 100%
CY (tcc)
RO
TR
BG
HR
SE
LU
FI
NL
EE
FR
DE
LT
SK
PL
DK
LV
MT
AT
HU
EU25
IE
CY
UK
PT
BE
SI
EL
IT
ES
CZ
Totally agree Tend to agree Tend to disagree Totally disagree DK
A socio-demographic analysis of the results does not reveal any significant differences on this point. All the categories studied seem to recognise the dangers of tobacco smoke for pregnant women.
-Drinking 1 or 2 glasses of wine per day during pregnancy is seen as less dangerous than cigarette smoke-
Although a slight majority of European Union citizens (51%) do not seem to agree with the statement that drinking 1 or 2 glasses of wine a day during pregnancy is harmless to the baby, it is interesting to note that they do not perceive the dangers of drinking wine in the same way as exposure to cigarette smoke.

SPECIAL EUROBAROMETRE 239 Attitudes of Europeans towards tobacco
- 47 -
-The harmful effects of wine are perceived very differently from one European country to another-
Unlike tobacco smoke, the harmful effects of wine are perceived very differently from one Member State to another. Although more than three-quarters of citizens in the Czech Republic (76%) and a majority of Spaniards (69%) and Italians (59%) believe that wine tends to be harmless, only 13% of Swedish citizens take that view. More than 71% of the latter totally disagree with the statement that drinking one or two glasses of wine a day during pregnancy is harmless. In the same way, three-quarters of Finnish citizens and more than two-thirds of citizens in Luxembourg (69%) and Germany (68%) do not agree with that statement.
-The youngest respondents and those having the highest level of education are the most sensitive to the dangers of drinking
wine for pregnant women - There seem to be fairly clear cleavages depending on the respondent’s age and level of studies. Older people and those who left school at a fairly early age seem more inclined to support the view that drinking wine on a regular basis is harmless to the baby.
Q12.2 To drink 1 or 2 glasses of wine per day during pregnancy is harmless to the baby
Answer: agree
41%
42%
41%
35%
40%
42%
45%
48%
40%
37%
34%
0% 50%
EU25
SEX
Male
Female
AGE
15-24
25-39
40-54
55 +
EDUCATION (END OF)
15
16-19
20+
Still Studying
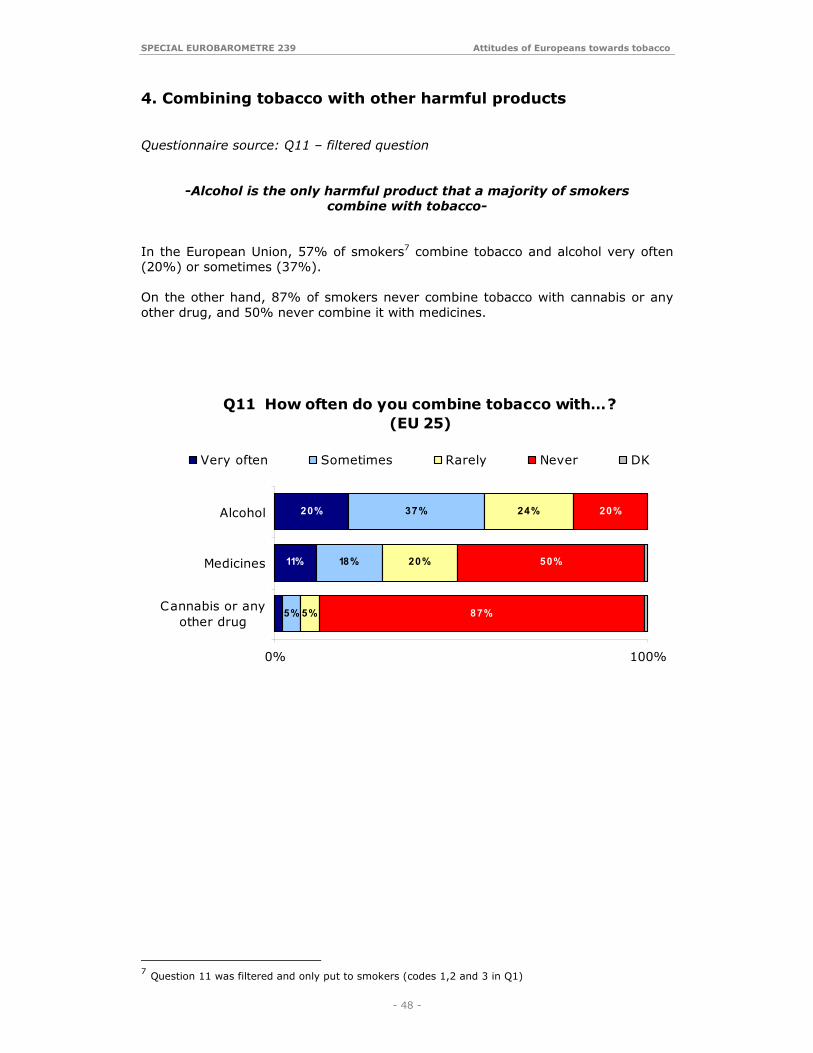
SPECIAL EUROBAROMETRE 239 Attitudes of Europeans towards tobacco
- 48 -
Q11 How often do you combine tobacco with…? (EU 25)
20%
11%
37%
18%
5%
24%
20%
5%
20%
50%
87%
0% 100%
Alcohol
Medicines
Cannabis or anyother drug
Very often Sometimes Rarely Never DK
4. Combining tobacco with other harmful products Questionnaire source: Q11 – filtered question
-Alcohol is the only harmful product that a majority of smokers combine with tobacco-
In the European Union, 57% of smokers7 combine tobacco and alcohol very often (20%) or sometimes (37%). On the other hand, 87% of smokers never combine tobacco with cannabis or any other drug, and 50% never combine it with medicines.
7 Question 11 was filtered and only put to smokers (codes 1,2 and 3 in Q1)

SPECIAL EUROBAROMETRE 239 Attitudes of Europeans towards tobacco
- 49 -
4.1. Tobacco and alcohol
-Frequently combined in a majority of Member States- In 23 of the 25 Member States, a majority of smokers combine tobacco and alcohol sometimes or very often. This combination varies considerably from one Member State to another. More than 80% of citizens in Finland (82%) and Ireland (81%) sometimes combine alcohol with tobacco and 51% and 43% respectively of them do so very often. On the other hand, less than 10% of Italians (9%) and Hungarians (8%) declare that they very often mix alcohol and tobacco. In the accession and candidate countries, citizens seem to combine tobacco with alcohol the least frequently in the Turkish Cypriot Community (43%) and above all in Turkey (31%). This result is probably linked to the culture of those two countries. The particularly high percentage of “never” answers in Turkey is undoubtedly due to the less frequent use of alcohol in what is predominantly a Muslim country.

SPECIAL EUROBAROMETRE 239 Attitudes of Europeans towards tobacco
- 50 -
Q11.1 How often do you combine tobacco with … ?Answer: Alcohol
16%
18%
11%
12%
21%
9%
8%
11%
13%
20%
19%
17%
20%
13%
28%
21%
14%
23%
18%
15%
18%
30%
25%
22%
32%
19%
40%
38%
32%
43%
51%
15%
25%
33%
37%
33%
28%
28%
39%
38%
32%
33%
37%
37%
43%
30%
36%
45%
37%
42%
47%
46%
34%
41%
44%
34%
49%
30%
32%
39%
38%
31%
11%
15%
22%
18%
28%
26%
33%
32%
26%
25%
30%
19%
24%
28%
20%
20%
26%
20%
21%
31%
20%
11%
18%
21%
18%
19%
21%
10%
14%
56%
42%
28%
33%
17%
36%
30%
18%
23%
21%
17%
27%
20%
16%
22%
22%
15%
19%
17%
7%
13%
15%
13%
22%
16%
11%
12%
11%
8%
9%
5%
23%
21%
6%
0% 100%
TR
CY (tcc)
RO
HR
BG
IT
HU
SK
FR
LU
PL
BE
EU25
SI
CY
PT
DE
ES
LV
AT
EE
UK
DK
MT
NL
CZ
EL
SE
LT
IE
FI
Very often Sometimes Rarely Never DK
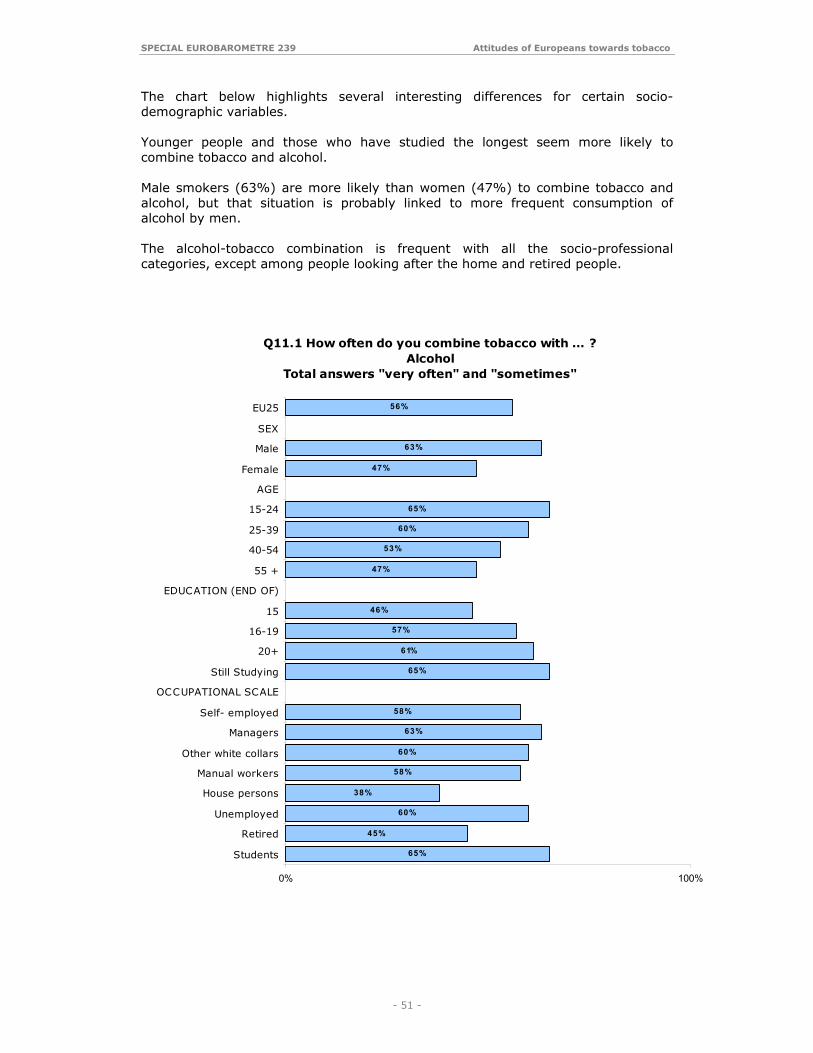
SPECIAL EUROBAROMETRE 239 Attitudes of Europeans towards tobacco
- 51 -
The chart below highlights several interesting differences for certain socio-demographic variables. Younger people and those who have studied the longest seem more likely to combine tobacco and alcohol. Male smokers (63%) are more likely than women (47%) to combine tobacco and alcohol, but that situation is probably linked to more frequent consumption of alcohol by men. The alcohol-tobacco combination is frequent with all the socio-professional categories, except among people looking after the home and retired people.
Q11.1 How often do you combine tobacco with … ? Alcohol
Total answers "very often" and "sometimes"
56%
63%
47%
65%
60%
53%
47%
46%
57%
61%
65%
58%
63%
60%
58%
38%
60%
45%
65%
0% 100%
EU25
SEX
Male
Female
AGE
15-24
25-39
40-54
55 +
EDUCATION (END OF)
15
16-19
20+
Still Studying
OCCUPATIONAL SCALE
Self- employed
Managers
Other white collars
Manual workers
House persons
Unemployed
Retired
Students

SPECIAL EUROBAROMETRE 239 Attitudes of Europeans towards tobacco
- 52 -
4.2. Tobacco and medicines
-A majority of smokers never or only rarely combine tobacco and medicines-
If the percentage of answers in the “never” and “rarely” categories are taken into account, it appears that a majority of smokers do not combine these two substances in most countries. The medicine-tobacco combination varies very appreciably from one country to the next. More than 70% of citizens in Hungary (76%), Slovakia (72%) and Luxembourg (71%) never combine tobacco and medicines. On the other hand, 62% of Irish citizens, 60% of Spanish citizens and 59% of British citizens declare that they combine tobacco and medicines, even if only rarely. Moreover, at least 20% of citizens in Sweden (21%) and Malta (20%) combine these two substances very frequently. In the candidate and accession countries, a strong majority of Turkish citizens (78%), inhabitants of the Turkish Cypriot Community (74%), and Rumanians (67%) declare that they never mix medicines and tobacco. The frequency of this combination is undoubtedly linked to the level of the consumption of medicines in each of these countries.

SPECIAL EUROBAROMETRE 239 Attitudes of Europeans towards tobacco
- 53 -
Q11.2 How often do you combine tobacco with … ?Answer: Medicines
10%
8%
3%
7%
3%
13%
14%
18%
14%
13%
20%
3%
6%
21%
9%
17%
17%
11%
11%
11%
7%
6%
8%
11%
7%
11%
7%
6%
8%
4%
7%
20%
17%
8%
8%
9%
27%
24%
22%
20%
22%
15%
18%
21%
17%
22%
17%
13%
25%
18%
21%
16%
17%
16%
15%
12%
12%
11%
15%
10%
12%
5%
24%
18%
12%
8%
7%
22%
22%
19%
25%
22%
21%
32%
28%
14%
21%
18%
23%
13%
20%
17%
15%
14%
19%
15%
18%
14%
9%
12%
11%
44%
56%
67%
74%
78%
36%
38%
39%
40%
42%
44%
45%
45%
46%
47%
47%
48%
48%
50%
50%
54%
54%
58%
59%
60%
61%
63%
63%
71%
72%
76%
21%
22%
10%
0% 100%
BG
HR
RO
CY (tcc)
TR
IE
ES
UK
PL
PT
MT
AT
SI
SE
CZ
DK
NL
LT
EU25
FR
BE
IT
EE
CY
EL
FI
DE
LV
LU
SK
HU
Very often Sometimes Rarely Never DK

SPECIAL EUROBAROMETRE 239 Attitudes of Europeans towards tobacco
- 54 -
The chart below highlights a significantly more important combination of medicines and tobacco among the oldest respondents and retired people, which is logical given the latter’s very strong consumption of medicines. As a corollary it is not surprising that this combination is less frequent among the youngest respondents and students. Finally, there is no difference between men and women on this point.
Q11.2 How often do you combine tobacco with … ? Medicines
Total answers "very often" and "sometimes"
29%
29%
29%
22%29%
28%36%
34%
27%32%
19%
21%25%
29%27%
30%32%
40%19%
28%
36%32%
29%
0% 60%
EU25SEXMale
FemaleAGE
15-2425-3940-5455 +
EDUCATION (END OF)15
16-1920+
Still StudyingOCCUPATIONAL SCALE
Self- employedManagers
Other white collarsManual workersHouse persons
UnemployedRetired
StudentsSMOKE
Packeted cigarettesRoll-your-own cigaret.
Cigars or a pipeTotal smoker

SPECIAL EUROBAROMETRE 239 Attitudes of Europeans towards tobacco
- 55 -
4.3. Tobacco and drugs
-A rare combination in most Member States- A strong majority of smokers in all the countries participating in this survey declare that they never combine tobacco with drugs. However, it is to be noted that one in four Italian smokers and one in five Spanish smokers combine these two substances, even if only rarely. Approximately 5% of smokers in Spain (6%), Italy (4%), the United Kingdom (4%) and Belgium (4%) declare that they combine these two substances very often. It would be interesting to compare these results with the use of cannabis or other drugs in those countries.
Q11.3 How often do you combine tobacco with … ?Answer: Cannabis or any other drug
88%
93%
95%
95%
96%
97%
97%
97%
100%
11%
7%
5%
4%
10%
6%
5%
79%
85%
95%
95%
95%
94%
92%
91%
91%
91%
90%
90%
88%
87%
87%
85%
85%
84%
82%
73%
97%
96%
9%
6%
6%
5%
4%
4%
6%
5%
5%
7%
6%
8%
4%
4%
4%
4%
7%
6%
6%
4%
4%
6%
4%
5%
10%
0% 100%
RO
HRTRBG
CY (tcc)
IT
ESUKAT
FRIEBE
EU25
DKPT
LUNLMT
SIFILV
DELTPL
HUCZSE
EEELSK
CY
Never Rarely Sometimes Very often DK

SPECIAL EUROBAROMETRE 239 Attitudes of Europeans towards tobacco
- 56 -
Q11.3 How often do you combine tobacco with … ? Cannabis or any other drug.
Answer : Never
87%
84%
90%
77%
82%
94%
92%
90%
89%
82%
78%
88%
76%
85%
87%
0% 100%
EU25
SEX
Male
Female
AGE
15-24
25-39
40-54
55 +
EDUCATION (END OF)
15
16-19
20+
Still Studying
SMOKE
Packeted cigarettes
Roll-your-own cigaret.
Cigars or a pipe
Total smoker
The chart below, representing the levels of “never” replies, highlights perceptible differences with regard to this combination in the different categories studied. The lowest scores (that is to say in the categories combining most frequently these substances) are to be found among men, the youngest respondents, students and finally those who roll their own cigarettes. Once again, these results should be examined in the light of the use of cannabis by these categories.

SPECIAL EUROBAROMETRE 239 Attitudes of Europeans towards tobacco
- 57 -
Q13 Do you remember hearing or seeing any tobacco campaign encouraging people to quit smoking?
94%
94%
89%
89%
89%
88%
87%
87%
86%
84%
83%
83%
82%
82%
80%
79%
78%
78%
77%
76%
73%
72%
69%
69%
51%
43%
81%
79%
74%
69%
45%
6%
6%
11%
11%
11%
12%
13%
13%
14%
16%
17%
17%
18%
18%
20%
21%
22%
22%
23%
24%
27%
28%
31%
31%
49%
57%
19%
21%
26%
31%
55%
0% 100%
DK
FI
ES
FR
MT
PT
IE
UK
IT
LV
EU25
CY
BE
DE
NL
SE
HU
PL
CZ
SK
AT
LU
EL
SI
LT
EE
HR
TR
CY (tcc)
RO
BG
Yes No
5. Anti-tobacco campaigns 5.1. The impact of anti-tobacco campaigns
Questionnaire source: Q13- filtered question
-More than 80% of smokers or former smokers can recall an anti-tobacco campaign-
In the European Union, more than eight8 out of ten respondents (83%) declare that they remember an anti-tobacco campaign encouraging people to stop smoking. In 23 of the 25 European Union Member States, the percentage is close to or exceeds 70% and is almost 95% in Denmark and Finland. On the other hand, Lithuania (51%) and Estonia (43%) stand out by the lower percentage of citizens who remember having heard or seen an anti-tobacco campaign. Except in Bulgaria (45%), a clear majority of the people interviewed in the candidate and accession countries declare that they remember hearing or seeing an anti-tobacco campaign.
8 Question 13 was put only to smokers and former smokers
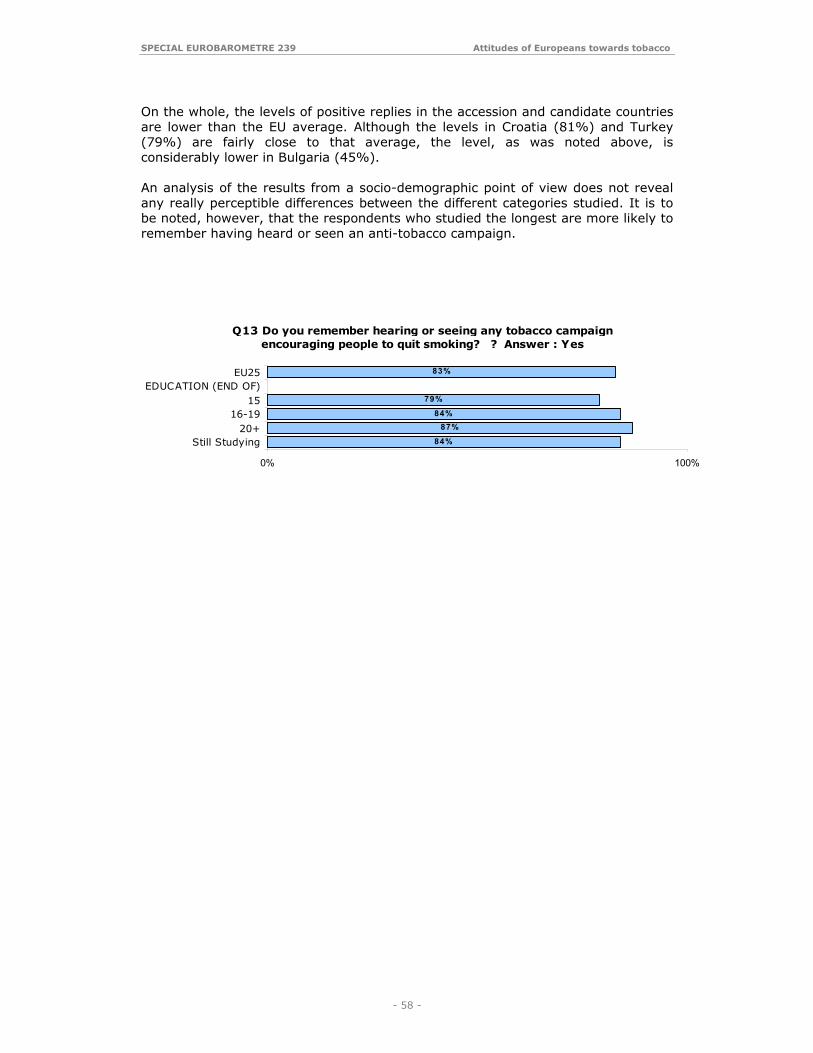
SPECIAL EUROBAROMETRE 239 Attitudes of Europeans towards tobacco
- 58 -
Q13 Do you remember hearing or seeing any tobacco campaign encouraging people to quit smoking? ? Answer : Yes
83%
79%
84%87%
84%
0% 100%
EU25EDUCATION (END OF)
1516-19
20+Still Studying
On the whole, the levels of positive replies in the accession and candidate countries are lower than the EU average. Although the levels in Croatia (81%) and Turkey (79%) are fairly close to that average, the level, as was noted above, is considerably lower in Bulgaria (45%). An analysis of the results from a socio-demographic point of view does not reveal any really perceptible differences between the different categories studied. It is to be noted, however, that the respondents who studied the longest are more likely to remember having heard or seen an anti-tobacco campaign.

SPECIAL EUROBAROMETRE 239 Attitudes of Europeans towards tobacco
- 59 -
Q14 Did any of these tobacco campaigns make you want to quit smoking?
17%
14%
13%
10%
10%
7%
7%
11%
4%
9%
8%
8%
4%
7%
9%
7%
7%
7%
3%
7%
6%
4%
5%
3%
17%
6%
6%
9%
3%
34%
30%
30%
27%
26%
27%
27%
26%
21%
28%
22%
21%
21%
25%
21%
20%
20%
18%
17%
19%
20%
10%
12%
12%
9%
9%
27%
28%
23%
20%
16%
26%
28%
18%
13%
17%
25%
22%
35%
25%
25%
21%
24%
24%
26%
17%
26%
21%
26%
32%
29%
33%
30%
22%
31%
23%
27%
15%
26%
28%
36%
26%
21%
26%
35%
48%
42%
40%
42%
31%
42%
36%
41%
44%
44%
42%
51%
43%
51%
46%
42%
45%
44%
49%
60%
50%
61%
60%
41%
38%
41%
34%
52%
4%
6%
3%
3%
3%
3%
3%
3%
3%
6%
5%
6%
0% 100%
IE
MT
UK
CY
PL
PT
FI
SK
BE
EE
LT
EU25
FR
LV
DK
IT
EL
DE
HU
ES
AT
CZ
LU
SI
SE
NL
TR
RO
HR
CY (tcc)
BG
Yes, very much so Yes, to some extent No, not really No, not at all DK
5.2. The effectiveness of anti-tobacco campaigns Questionnaire source: Q14 – filtered question The aim of the last question was to measure the opinion of respondents who remember having heard or seen an anti-tobacco campaign – either smokers or former smokers – regarding the effectiveness of those campaigns as regards their personal tobacco consumption.
-Neither smokers nor former smokers have been really convinced by anti-tobacco campaigns-
At European level, 68% of respondents declare that anti-tobacco campaigns have not made them want to give up smoking.

SPECIAL EUROBAROMETRE 239 Attitudes of Europeans towards tobacco
- 60 -
In almost all the Member States, as well as in the accession and candidate countries, the various anti-tobacco campaigns do not seem to have made either smokers or former smokers want to give up smoking. Ireland is the only country where a majority of respondents declare that anti-tobacco campaigns have encouraged them to quit smoking. Citizens in the Netherlands (87%) and Sweden (84%) are the most sceptical about the effectiveness of the various campaigns. The socio-demographic variables do not reveal any appreciable differences on this question. It is to be noted, however, that people who smoke cigars or a pipe seem less sensitive than other smokers to anti-tobacco campaigns.
Q14 Did any of these tobacco campaigns make you want to quit smoking? Answer: No
68%
69%
68%
78%
69%
0% 80%
EU25
SMOKE
Packeted cigarettes
Roll-your-own cigaret.
Cigars or a pipe
Total smoker

SPECIAL EUROBAROMETRE 239 Attitudes of Europeans towards tobacco
- 61 -
6. Conclusion The number of smokers in the European Union has fallen sharply over the last three years. The results of the survey carried out in 30 countries or territories in autumn 2005 show that in the 15 old European Union Member States, the percentage of smokers has fallen appreciably since the previous survey in 2002 (carried out only in the EU15). The number of smokers of packed cigarettes has fallen by 7 points (33%), the number of citizens declaring that they have never smoked has increased by 5 points (47%) and the proportion of smokers who declare that they have stopped smoking has also increased by 3 points (22%). As in 2002, there are still very significant differences in tobacco consumption across Europe. Changes in consumption patterns vary considerably from one Member State to another. Although in a majority of countries, consumption has fallen, in others it has changed relatively little. The answers of smokers to the questions regarding their smoking habits reveal that most smokers are regular smokers as opposed to occasional smokers. In all the Member States, more than 90% of smokers declare that they smoke every day. On the other hand, the quantity of cigarettes smoked varies considerably in Europe. In the European Union, the number varies, for example, from 12.2 cigarettes in Slovakia to more than 23 in Greece. In comparison to 2002, this quantity has fallen in a majority of the 15 old Member States. This reduction is also more perceptible among women and young people. Among the places where people smoke, four out of five European smokers smoke at home and a small majority smoke when they are alone in their car. On the other hand, at European level smokers tend to show a certain consideration to non-smokers and children by not smoking in their company in the car. More than three-quarters of smokers declare that they do not smoke in the company of children and almost 60% refrain from smoking in the company of non-smokers in the car. However, the level of consideration varies considerably from one country to the next. Three-quarters of European Union citizens are aware of the health risks of tobacco smoke for non-smokers. Moreover, for 95% of EU citizens, smoking in the company of pregnant women can be very dangerous for the baby. Although a majority of European Union citizens declare that they are rarely or never bothered by exposure to tobacco smoke in their daily life, this situation again varies considerably from one Member State to the next. It is interesting to note that the younger the respondents the more they seem to be bothered by tobacco smoke. If young people seem particularly sensitive to this unpleasant aspect, on the other hand the oldest respondents mentioned more frequently the physical symptoms or a recognised health condition caused by exposure to tobacco smoke. Overall, approximately one in two Europeans asks smokers not to smoke near them. However, once gain the level of tolerance towards smokers varies between countries.

SPECIAL EUROBAROMETRE 239 Attitudes of Europeans towards tobacco
- 62 -
More than 80% of European Union citizens are in favour of banning smoking in public places, both in workplaces and any other indoor public places. A majority of Europeans are also in favour of a ban on smoking in restaurants, bars and pubs. However, these opinions are less clear-cut and vary considerably from one country to another. Although a majority of smokers are in favour of a ban on smoking in restaurants, almost two-thirds of them seem to be against a ban on smoking in bars and pubs. Students and manual workers also stand out by their rejection of such a measure. Finally, the measure of the visibility and effectiveness of anti-tobacco campaigns shows that in the European Union, more than 80% of smokers and former smokers remember having heard or seen an anti-tobacco campaign. However, two-thirds of smokers and former smokers who remember such a campaign declare that they did not find it convincing. Moreover, the perceived effectiveness of such campaigns varies very sharply from one European Union Member State to another; while only one in ten smokers or former smokers in the Netherlands declares having been convinced at least to some extent by such campaigns, a majority of Irish citizens declare that they were convinced by them.

ANNEXES

Tables

TOTALYou smoke packed
cigarettesYou smoke roll-up
cigarettesYou smoke cigars
or a pipeYou chew tobacco
or take snuff
You used to smoke but you have
stopped
You have never smoked
Other (SPONTANEOUS)
DK
EU25 24642 27% 5% 1% 0% 21% 47% 0% 0%BE 1047 20% 7% 2% - 23% 49% 0% 0%CZ 1011 31% 1% 1% - 19% 50% 0% - DK 1011 28% 6% 5% 0% 27% 38% 0% 0%D-W 1018 24% 7% 1% 0% 25% 45% 0% - DE 1528 25% 7% 1% 0% 24% 44% 0% - D-E 510 29% 8% 2% - 23% 41% - - EE 1009 30% 0% 1% - 18% 52% 0% 0%EL 1000 40% 3% 0% 0% 15% 42% - - ES 1016 29% 2% 1% - 20% 48% 0% - FR 1014 25% 10% 3% - 21% 46% 0% 0%IE 1000 29% 2% 1% - 19% 50% 1% 0%IT 1000 27% 2% 1% 0% 17% 53% 0% 0%CY 502 28% 3% 1% - 12% 56% 0% 0%LV 1049 35% 1% 1% - 14% 50% - 0%LT 1002 32% - 0% - 16% 52% 0% 0%LU 500 29% 4% 2% - 20% 49% 0% - HU 1012 30% 4% 0% - 17% 50% 0% - MT 500 25% 3% 1% - 17% 56% - 0%NL 1000 19% 12% 3% - 30% 40% 1% 0%AT 1012 37% 3% 2% 0% 17% 41% 0% 0%PL 999 35% 2% 0% 0% 19% 45% 0% 0%PT 1000 27% 2% 0% - 13% 58% 0% 0%SI 1037 26% 1% 0% - 18% 55% 1% - SK 1056 27% 2% 1% - 17% 52% 2% 1%FI 1003 21% 4% 2% 1% 22% 52% 0% - SE 1000 18% 2% 1% 10% 24% 47% 1% - UK 1334 22% 7% 1% - 25% 45% 0% 0%SexMale 11882 31% 7% 3% 1% 25% 36% 0% 0%Female 12760 23% 3% 0% 0% 17% 57% 0% 0%Age15-24 3758 33% 7% 1% 0% 7% 56% 0% 0%25-39 6538 35% 7% 1% 0% 17% 42% 0% 0%40-54 6299 31% 6% 2% 0% 23% 40% 0% 0%55 + 8047 14% 3% 2% 0% 30% 52% 0% 0%Education (End of)15 5879 23% 4% 1% 0% 24% 49% 0% 0%16-19 9871 32% 7% 1% 0% 22% 41% 0% 0%20+ 5753 24% 4% 2% 0% 24% 47% 1% 0%Still Studying 2560 24% 5% 1% 0% 8% 63% 1% 0%Household composition1 4662 26% 7% 2% 0% 20% 47% 0% 0%2 7495 23% 5% 2% 0% 27% 45% 0% 0%3 4865 30% 5% 1% 0% 20% 45% 0% 0%4+ 7619 29% 5% 1% 0% 16% 50% 0% 0%Place of birthSurveyed country 23083 27% 5% 1% 0% 21% 47% 0% 0%EU 604 28% 2% 2% 0% 22% 48% 0% - Europe outside EU 361 24% 3% 0% - 24% 50% - 0%Outside Europe 581 25% 5% 1% 1% 18% 52% 0% - Parents' birth2 born country 21903 27% 5% 1% 0% 21% 47% 0% 0%1 country EU 828 30% 6% 3% 0% 18% 45% 1% - 2EU 816 32% 3% 1% 0% 18% 47% 0% - At least 1 outside EU 1052 25% 4% 0% 0% 20% 52% 1% 0%Left-Right scale(1-4) Left 6474 29% 7% 2% 1% 22% 42% 0% 0%(5-6) Centre 7800 26% 5% 1% 0% 22% 47% 0% 0%(7-10) Right 4593 25% 4% 1% 0% 24% 46% 1% 0%Respondant occupation scaleSelf- employed 1937 33% 6% 1% 0% 20% 42% 0% 0%Managers 2320 24% 2% 2% 0% 23% 49% 1% 0%Other white collars 2622 29% 4% 1% 1% 19% 47% 0% 0%Manual workers 4743 38% 7% 1% 0% 20% 37% 0% 0%House persons 2519 20% 5% 0% 0% 15% 61% 0% 0%Unemployed 1758 45% 12% 1% 0% 15% 31% 1% 0%Retired 6184 15% 3% 2% 0% 32% 48% 0% 0%Students 2560 24% 5% 1% 0% 8% 63% 1% 0%Subjective urbanisationRural village 8632 24% 4% 2% 0% 22% 48% 0% 0%Small/ mid size town 9822 27% 5% 1% 0% 20% 48% 0% 0%Large town 6159 30% 7% 1% 0% 21% 43% 1% 0%SmokeRegularly 6513 86% 17% 4% 0% - - - - Occasionally 1198 85% 10% 8% 0% - - - -
QC1 Which of the following applies to you? (MULTIPLE ANSWERS POSSIBLE FOR CODES 1, 2, 3 AND 4)
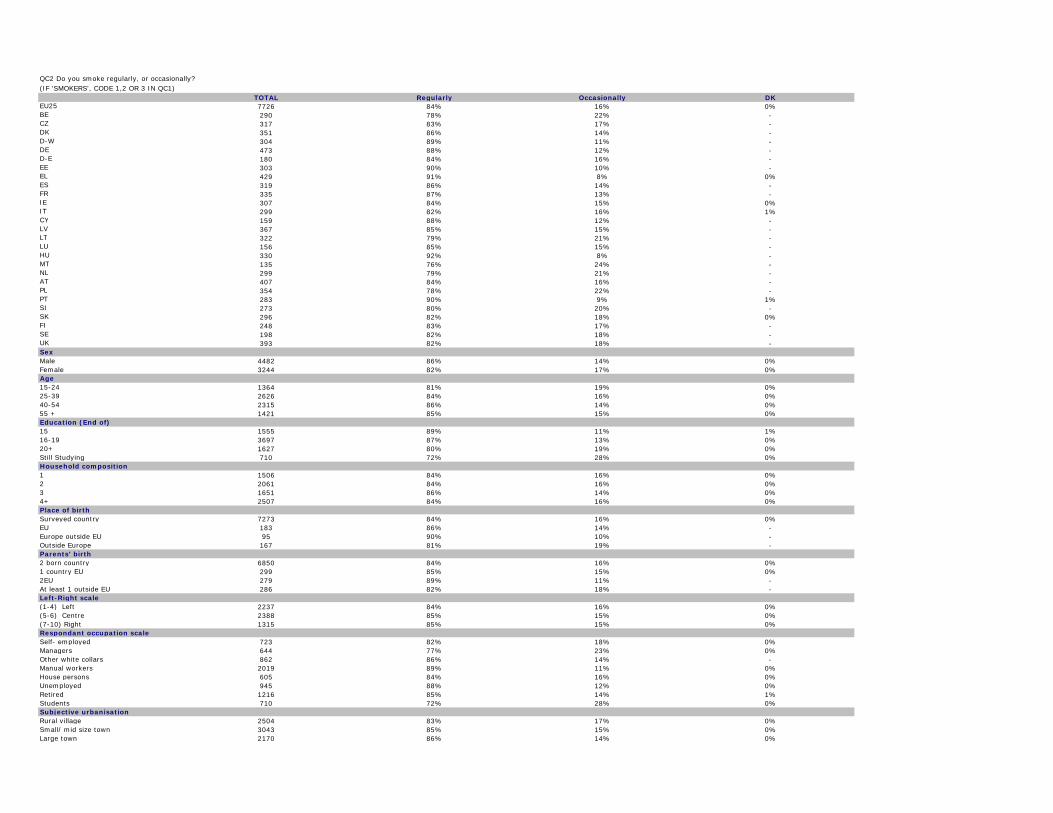
TOTAL Regularly Occasionally DKEU25 7726 84% 16% 0%BE 290 78% 22% - CZ 317 83% 17% - DK 351 86% 14% - D-W 304 89% 11% - DE 473 88% 12% - D-E 180 84% 16% - EE 303 90% 10% - EL 429 91% 8% 0%ES 319 86% 14% - FR 335 87% 13% - IE 307 84% 15% 0%IT 299 82% 16% 1%CY 159 88% 12% - LV 367 85% 15% - LT 322 79% 21% - LU 156 85% 15% - HU 330 92% 8% - MT 135 76% 24% - NL 299 79% 21% - AT 407 84% 16% - PL 354 78% 22% - PT 283 90% 9% 1%SI 273 80% 20% - SK 296 82% 18% 0%FI 248 83% 17% - SE 198 82% 18% - UK 393 82% 18% - SexMale 4482 86% 14% 0%Female 3244 82% 17% 0%Age15-24 1364 81% 19% 0%25-39 2626 84% 16% 0%40-54 2315 86% 14% 0%55 + 1421 85% 15% 0%Education (End of)15 1555 89% 11% 1%16-19 3697 87% 13% 0%20+ 1627 80% 19% 0%Still Studying 710 72% 28% 0%Household composition1 1506 84% 16% 0%2 2061 84% 16% 0%3 1651 86% 14% 0%4+ 2507 84% 16% 0%Place of birthSurveyed country 7273 84% 16% 0%EU 183 86% 14% - Europe outside EU 95 90% 10% - Outside Europe 167 81% 19% - Parents' birth2 born country 6850 84% 16% 0%1 country EU 299 85% 15% 0%2EU 279 89% 11% - At least 1 outside EU 286 82% 18% - Left-Right scale(1-4) Left 2237 84% 16% 0%(5-6) Centre 2388 85% 15% 0%(7-10) Right 1315 85% 15% 0%Respondant occupation scaleSelf- employed 723 82% 18% 0%Managers 644 77% 23% 0%Other white collars 862 86% 14% - Manual workers 2019 89% 11% 0%House persons 605 84% 16% 0%Unemployed 945 88% 12% 0%Retired 1216 85% 14% 1%Students 710 72% 28% 0%Subjective urbanisationRural village 2504 83% 17% 0%Small/ mid size town 3043 85% 15% 0%Large town 2170 86% 14% 0%
(IF 'SMOKERS', CODE 1,2 OR 3 IN QC1)QC2 Do you smoke regularly, or occasionally?

TOTAL
Yes, less than 5
cigarettes a day
Yes, 5 to 9 cigarettes a
day
Yes, 10 to 14 cigarettes a
day
Yes, 15 to 19 cigarettes a
day
Yes, 20 to 24 cigarettes a
day
Yes, 25 to 29 cigarettes a
day
Yes, 30 to 34 cigarettes a
day
Yes, 35 to 39 cigarettes a
day
Yes, 40 or more
cigarettes a day
No, do not smoke every
dayDK Yes
EU25 7501 11% 15% 21% 18% 20% 4% 3% 1% 2% 4% 0% 96%BE 273 12% 19% 17% 16% 15% 8% 3% 2% 3% 6% - 94%CZ 314 12% 16% 24% 21% 15% 2% 2% 0% 1% 6% 0% 94%DK 320 6% 12% 22% 19% 22% 7% 2% 1% 3% 6% 0% 93%D-W 296 7% 14% 23% 20% 20% 6% 4% 1% 2% 3% 0% 97%DE 460 8% 15% 25% 19% 20% 5% 3% 1% 2% 2% 0% 97%D-E 174 11% 17% 30% 16% 20% 2% 1% 0% 1% 1% - 99%EE 300 8% 19% 29% 23% 13% 3% 1% 0% 1% 3% - 97%EL 429 6% 7% 11% 9% 28% 7% 8% 5% 16% 3% 0% 97%ES 309 18% 14% 13% 16% 25% 4% 3% 2% 2% 3% 0% 97%FR 320 14% 16% 23% 17% 15% 3% 2% 1% 2% 5% - 95%IE 301 8% 11% 23% 15% 27% 5% 4% 1% 3% 3% 1% 96%IT 288 13% 17% 24% 21% 17% 2% 2% 0% 0% 3% 0% 97%CY 156 11% 11% 12% 9% 20% 10% 8% 6% 12% 1% - 99%LV 367 10% 14% 24% 21% 21% 2% 1% 1% 1% 6% - 94%LT 321 10% 18% 25% 20% 14% 3% 0% 1% 1% 8% - 92%LU 149 11% 17% 20% 12% 21% 8% 1% 1% 4% 5% - 95%HU 328 8% 12% 16% 26% 24% 5% 4% 1% 2% 3% - 97%MT 133 12% 17% 17% 14% 20% 3% 4% 1% 5% 7% - 93%NL 275 12% 16% 22% 16% 19% 6% 1% 0% 1% 5% - 95%AT 394 5% 15% 22% 22% 17% 9% 3% 2% 1% 3% - 97%PL 354 11% 12% 16% 26% 21% 4% 1% 2% 1% 5% - 95%PT 280 11% 10% 11% 20% 29% 4% 7% 2% 4% 2% 0% 98%SI 272 9% 15% 21% 19% 20% 6% 1% 1% 2% 6% 0% 94%SK 292 11% 22% 23% 21% 12% 1% 1% 1% 1% 8% - 92%FI 235 7% 17% 18% 21% 19% 6% 2% 1% 1% 7% - 93%SE 194 8% 17% 25% 16% 17% 2% 1% 1% 1% 13% - 87%UK 383 10% 17% 26% 12% 21% 5% 3% 1% 3% 2% 1% 97%SexMale 4267 10% 12% 20% 20% 22% 5% 3% 1% 3% 3% 0% 97%Female 3234 13% 19% 23% 16% 17% 3% 2% 1% 1% 5% 0% 95%Age15-24 1358 16% 22% 25% 15% 15% 1% 1% 1% 1% 4% 0% 96%25-39 2586 11% 15% 23% 18% 19% 4% 2% 1% 1% 4% 0% 96%40-54 2248 9% 11% 17% 22% 23% 5% 4% 1% 4% 3% 0% 96%55 + 1309 11% 15% 21% 17% 20% 6% 3% 2% 3% 3% 0% 96%Education (End of)15 1495 10% 12% 18% 18% 24% 6% 4% 2% 5% 2% 0% 98%16-19 3630 9% 14% 22% 19% 22% 4% 3% 1% 2% 3% 0% 97%20+ 1547 12% 16% 20% 22% 17% 4% 2% 1% 1% 6% 0% 94%Still Studying 700 20% 24% 25% 11% 9% 1% 1% 1% 0% 7% 0% 92%Household composition1 1445 10% 15% 19% 18% 21% 5% 3% 1% 2% 5% 1% 95%2 1975 13% 14% 23% 18% 19% 4% 3% 1% 2% 3% 0% 97%3 1619 11% 15% 20% 19% 20% 4% 3% 1% 2% 4% 0% 96%4+ 2462 11% 16% 22% 18% 19% 4% 3% 1% 2% 4% 0% 96%Place of birthSurveyed country 7062 11% 15% 21% 19% 20% 4% 3% 1% 2% 4% 0% 96%EU 173 10% 9% 24% 12% 25% 6% 7% 0% 3% 2% 1% 97%Europe outside EU 95 7% 12% 21% 27% 14% 6% 2% 1% 7% 1% 1% 98%Outside Europe 163 20% 15% 26% 15% 15% 4% 0% 0% 1% 3% - 97%Parents' birth2 born country 6651 11% 15% 21% 19% 20% 4% 3% 1% 2% 4% 0% 96%1 country EU 281 8% 12% 33% 15% 12% 9% 2% 0% 3% 6% 0% 94%2EU 274 12% 11% 18% 16% 26% 5% 4% 1% 2% 2% 2% 96%At least 1 outside EU 284 18% 18% 26% 16% 15% 3% 0% 0% 1% 1% - 99%Left-Right scale(1-4) Left 2153 12% 14% 22% 20% 19% 4% 3% 1% 1% 4% 0% 96%(5-6) Centre 2325 10% 18% 21% 18% 20% 4% 2% 1% 3% 3% 0% 96%(7-10) Right 1266 9% 14% 21% 17% 21% 5% 3% 2% 2% 4% 0% 96%Respondant occupation scaleSelf- employed 710 10% 13% 18% 19% 24% 4% 4% 1% 3% 4% 0% 95%Managers 601 16% 13% 20% 16% 19% 4% 2% 1% 3% 6% 0% 94%Other white collars 843 11% 15% 25% 18% 20% 3% 2% 1% 1% 4% - 96%Manual workers 1989 8% 13% 22% 21% 21% 5% 3% 1% 2% 3% - 97%House persons 604 13% 19% 22% 17% 16% 4% 2% 2% 2% 3% 2% 95%Unemployed 940 9% 12% 19% 20% 25% 4% 3% 2% 3% 3% - 97%Retired 1115 10% 15% 19% 19% 20% 7% 4% 1% 3% 3% 0% 97%Students 700 20% 24% 25% 11% 9% 1% 1% 1% 0% 7% 0% 92%Subjective urbanisationRural village 2391 11% 15% 20% 17% 21% 4% 2% 1% 3% 4% 0% 96%Small/ mid size town 2983 12% 15% 21% 19% 19% 5% 2% 1% 2% 4% 0% 96%Large town 2120 11% 15% 22% 18% 20% 4% 4% 1% 2% 3% 0% 97%SmokePacketed cigarettes 6601 11% 15% 21% 18% 20% 4% 3% 1% 2% 4% 0% 96%Roll-your-own cigaret. 1265 8% 15% 24% 18% 18% 7% 3% 1% 3% 1% 1% 98%Cigars or a pipe 112 1% 8% 20% 17% 23% 6% 5% 0% 2% 12% 4% 83%Total smoker 7501 11% 15% 21% 18% 20% 4% 3% 1% 2% 4% 0% 96%Regularly 6374 5% 13% 24% 22% 23% 5% 3% 1% 3% 0% 0% 100%Occasio-nally 1115 44% 24% 5% 1% 0% 0% - - - 25% 0% 75%
(IF 'CIGARETTE SMOKERS, INCLUDING ROLL-UP', CODE 1 OR 2 IN QC1)
QC3 Do you smoke every day? (IF YES) How many cigarettes a day do you smoke?

TOTAL Always Often Sometimes Never DKEU25 24642 9% 13% 30% 48% 0%BE 1047 9% 13% 31% 45% 0%CZ 1011 7% 11% 35% 45% 1%DK 1011 5% 9% 31% 54% 0%D-W 1018 6% 9% 38% 47% - DE 1528 6% 10% 37% 47% 0%D-E 510 7% 10% 36% 46% 0%EE 1009 17% 13% 27% 41% 2%EL 1000 9% 21% 27% 44% - ES 1016 8% 12% 31% 49% 0%FR 1014 8% 12% 27% 53% 0%IE 1000 6% 7% 21% 64% 2%IT 1000 15% 18% 28% 38% 1%CY 502 17% 15% 22% 46% - LV 1049 16% 15% 27% 42% 1%LT 1002 15% 12% 30% 43% 1%LU 500 8% 13% 32% 47% 1%HU 1012 8% 14% 31% 47% - MT 500 18% 16% 32% 34% - NL 1000 5% 9% 30% 55% 0%AT 1012 4% 12% 37% 45% 2%PL 999 11% 20% 27% 41% 1%PT 1000 4% 13% 35% 44% 4%SI 1037 9% 12% 30% 50% 0%SK 1056 11% 16% 34% 38% 2%FI 1003 5% 8% 28% 58% 0%SE 1000 5% 9% 33% 52% 1%UK 1334 10% 8% 26% 56% 0%SexMale 11882 8% 11% 29% 52% 0%Female 12760 10% 14% 31% 44% 0%Age15-24 3758 8% 14% 32% 45% 1%25-39 6538 7% 14% 33% 45% 0%40-54 6299 8% 11% 31% 50% 0%55 + 8047 11% 12% 27% 49% 0%Education (End of)15 5879 10% 11% 26% 52% 1%16-19 9871 9% 12% 30% 49% 0%20+ 5753 8% 15% 34% 43% 0%Still Studying 2560 9% 14% 34% 42% 1%Household composition1 4662 10% 10% 26% 52% 0%2 7495 9% 12% 31% 48% 0%3 4865 9% 14% 30% 47% 0%4+ 7619 9% 13% 33% 45% 1%Place of birthSurveyed country 23083 9% 13% 30% 48% 0%EU 604 10% 11% 33% 45% 1%Europe outside EU 361 12% 18% 31% 39% 0%Outside Europe 581 11% 13% 33% 43% 0%Parents' birth2 born country 21903 9% 13% 30% 48% 0%1 country EU 828 9% 14% 28% 49% 0%2EU 816 8% 14% 33% 44% 1%At least 1 outside EU 1052 10% 12% 35% 43% 0%Left-Right scale(1-4) Left 6474 7% 13% 31% 49% 0%(5-6) Centre 7800 9% 12% 31% 48% 0%(7-10) Right 4593 9% 12% 31% 47% 1%Respondant occupation scaleSelf- employed 1937 10% 12% 32% 46% 0%Managers 2320 8% 14% 37% 41% 0%Other white collars 2622 8% 14% 34% 43% 0%Manual workers 4743 7% 11% 29% 53% 0%House persons 2519 11% 16% 30% 42% 1%Unemployed 1758 7% 12% 29% 52% 0%Retired 6184 10% 11% 26% 52% 0%Students 2560 9% 14% 34% 42% 1%Subjective urbanisationRural village 8632 9% 12% 30% 48% 0%Small/ mid size town 9822 9% 13% 30% 47% 0%Large town 6159 9% 12% 30% 48% 0%
QC4 Do you ever ask a smoker not to smoke near you because it bothers you?

TOTAL Is harmless Can cause discomfortCan cause some health
problems such as respiratory problems
Can even, in the long term, cause serious
illnesses such as cancer
It depends (SPONTANEOUS)
DK
EU25 24642 3% 21% 33% 39% 2% 1%BE 1047 2% 19% 32% 46% 1% - CZ 1011 2% 35% 29% 32% 2% 0%DK 1011 2% 25% 24% 45% 2% 2%D-W 1018 2% 20% 36% 40% 2% 0%DE 1528 2% 21% 34% 41% 2% 0%D-E 510 1% 23% 29% 44% 2% - EE 1009 1% 23% 34% 37% 4% 1%EL 1000 2% 32% 44% 21% 1% 1%ES 1016 2% 27% 34% 34% 1% 2%FR 1014 1% 18% 32% 48% 1% 0%IE 1000 5% 24% 30% 32% 5% 4%IT 1000 3% 26% 39% 29% 3% 1%CY 502 2% 26% 34% 36% 1% 0%LV 1049 6% 30% 33% 28% 1% 1%LT 1002 11% 18% 42% 27% 0% 2%LU 500 3% 22% 34% 39% 1% 0%HU 1012 1% 30% 34% 32% 3% 0%MT 500 1% 18% 37% 42% 2% 0%NL 1000 1% 25% 37% 34% 2% 0%AT 1012 7% 26% 30% 24% 10% 2%PL 999 11% 11% 29% 46% 1% 1%PT 1000 2% 21% 44% 24% 4% 6%SI 1037 2% 20% 36% 40% 3% 0%SK 1056 2% 24% 33% 35% 3% 2%FI 1003 1% 19% 37% 43% 1% 0%SE 1000 1% 13% 29% 55% 1% 1%UK 1334 4% 18% 26% 49% 2% 1%SexMale 11882 4% 24% 32% 37% 2% 1%Female 12760 3% 19% 34% 42% 2% 1%Age15-24 3758 3% 22% 34% 38% 3% 1%25-39 6538 3% 22% 32% 40% 2% 1%40-54 6299 3% 22% 31% 40% 2% 1%55 + 8047 3% 20% 35% 38% 2% 1%Education (End of)15 5879 3% 23% 36% 35% 2% 1%16-19 9871 3% 22% 32% 40% 2% 1%20+ 5753 3% 19% 31% 45% 2% 1%Still Studying 2560 2% 22% 36% 37% 2% 1%Household composition1 4662 3% 23% 33% 37% 3% 1%2 7495 3% 20% 35% 39% 2% 1%3 4865 3% 22% 33% 40% 2% 1%4+ 7619 3% 22% 32% 40% 2% 1%Place of birthSurveyed country 23083 3% 22% 33% 39% 2% 1%EU 604 5% 25% 31% 36% 2% 1%Europe outside EU 361 4% 21% 38% 35% 1% 1%Outside Europe 581 3% 15% 36% 45% 1% 1%Parents' birth2 born country 21903 3% 22% 33% 39% 2% 1%1 country EU 828 3% 21% 36% 37% 3% 1%2EU 816 3% 23% 34% 38% 2% 1%At least 1 outside EU 1052 3% 15% 33% 47% 1% 1%Left-Right scale(1-4) Left 6474 2% 21% 32% 42% 2% 0%(5-6) Centre 7800 3% 21% 33% 41% 1% 1%(7-10) Right 4593 4% 23% 33% 38% 2% 1%Respondant occupation scaleSelf- employed 1937 4% 24% 32% 38% 2% 1%Managers 2320 2% 18% 30% 47% 2% 1%Other white collars 2622 2% 22% 32% 41% 2% 1%Manual workers 4743 3% 23% 32% 38% 2% 1%House persons 2519 2% 21% 36% 37% 1% 1%Unemployed 1758 5% 23% 32% 36% 3% 2%Retired 6184 4% 19% 34% 39% 2% 1%Students 2560 2% 22% 36% 37% 2% 1%Subjective urbanisationRural village 8632 4% 21% 32% 40% 2% 1%Small/ mid size town 9822 2% 21% 35% 39% 2% 1%Large town 6159 3% 23% 32% 38% 2% 1%Smoke-don't smokePacketed cigarettes 6601 4% 29% 32% 30% 3% 1%Roll-your-own cigaret. 1265 4% 33% 31% 28% 3% 1%Cigars or a pipe 337 3% 36% 28% 26% 5% 2%Smoked but have stopped 5185 3% 19% 33% 43% 1% 1%Never smoke 11559 3% 17% 34% 44% 2% 1%Total smoker 7726 4% 30% 32% 30% 3% 1%
QC5 Do you think that, for the non-smoker, other people's smoke…?

TOTAL Yes No DKEU25 7726 80% 20% 0%BE 290 82% 18% - CZ 317 64% 36% - DK 351 90% 10% - D-W 304 85% 15% - DE 473 83% 17% - D-E 180 75% 25% - EE 303 80% 20% 0%EL 429 86% 14% 0%ES 319 82% 18% 0%FR 335 77% 23% - IE 307 85% 15% 1%IT 299 72% 26% 2%CY 159 82% 18% - LV 367 73% 27% - LT 322 60% 40% 0%LU 156 78% 20% 2%HU 330 92% 8% 1%MT 135 75% 25% - NL 299 87% 13% - AT 407 86% 14% 0%PL 354 81% 19% 0%PT 283 73% 26% 1%SI 273 79% 21% - SK 296 70% 30% - FI 248 50% 50% - SE 198 75% 25% - UK 393 82% 18% 1%SexMale 4482 78% 22% 0%Female 3244 82% 18% 1%Age15-24 1364 74% 25% 1%25-39 2626 76% 24% 0%40-54 2315 84% 15% 0%55 + 1421 84% 16% 0%Education (End of)15 1555 87% 13% 0%16-19 3697 81% 19% 0%20+ 1627 74% 25% 1%Still Studying 710 67% 33% 0%Household composition1 1506 90% 10% 1%2 2061 83% 16% 0%3 1651 74% 25% 0%4+ 2507 74% 26% 0%Place of birthSurveyed country 7273 80% 20% 0%EU 183 79% 21% - Europe outside EU 95 73% 27% - Outside Europe 167 73% 26% 1%Parents' birth2 born country 6850 80% 20% 0%1 country EU 299 77% 23% 0%2EU 279 78% 22% - At least 1 outside EU 286 75% 25% - Left-Right scale(1-4) Left 2237 80% 19% 0%(5-6) Centre 2388 81% 19% 0%(7-10) Right 1315 78% 22% 0%Respondant occupation scaleSelf- employed 723 78% 22% 0%Managers 644 69% 31% 1%Other white collars 862 77% 22% 0%Manual workers 2019 81% 18% 1%House persons 605 87% 13% 1%Unemployed 945 85% 15% - Retired 1216 85% 15% 0%Students 710 67% 33% 0%Subjective urbanisationRural village 2504 76% 23% 0%Small/ mid size town 3043 80% 20% 0%Large town 2170 83% 17% 0%SmokePacketed cigarettes 6601 79% 21% 0%Roll-your-own cigaret. 1265 86% 14% 0%Cigars or a pipe 337 74% 26% - Total smoker 7726 80% 20% 0%Regularly 6513 85% 15% 0%Occasio-nally 1198 53% 47% 1%
(IF 'SMOKERS', CODE 1,2 OR 3 IN QC1)QC6 Do you smoke at home?

TOTAL Yes No It depends (SPONTANEOUS) DKEU25 7726 54% 40% 5% 1%BE 290 46% 51% 3% 1%CZ 317 45% 50% 4% 1%DK 351 38% 58% 3% 2%D-W 304 52% 42% 5% 1%DE 473 53% 41% 5% 1%D-E 180 57% 37% 5% 1%EE 303 48% 37% 9% 6%EL 429 73% 21% 4% 1%ES 319 65% 30% 4% 0%FR 335 58% 38% 3% 2%IE 307 73% 19% 7% 1%IT 299 60% 31% 8% 0%CY 159 67% 29% 3% 2%LV 367 56% 32% 6% 6%LT 322 54% 39% 4% 2%LU 156 46% 52% 2% - HU 330 39% 52% 7% 2%MT 135 71% 25% 4% - NL 299 43% 54% - 3%AT 407 62% 27% 12% - PL 354 45% 52% 1% 2%PT 283 71% 25% 3% 1%SI 273 39% 57% 4% - SK 296 47% 49% 3% 1%FI 248 57% 40% 3% - SE 198 37% 58% 3% 2%UK 393 49% 45% 6% 1%SexMale 4482 60% 35% 4% 1%Female 3244 47% 47% 5% 1%Age15-24 1364 54% 37% 7% 2%25-39 2626 60% 35% 5% 1%40-54 2315 57% 38% 4% 1%55 + 1421 39% 55% 4% 2%Education (End of)15 1555 54% 42% 3% 1%16-19 3697 56% 39% 4% 1%20+ 1627 54% 39% 6% 1%Still Studying 710 46% 45% 6% 3%Household composition1 1506 48% 43% 7% 2%2 2061 54% 42% 3% 1%3 1651 56% 39% 4% 1%4+ 2507 57% 37% 5% 1%Place of birthSurveyed country 7273 54% 40% 5% 1%EU 183 53% 39% 6% 2%Europe outside EU 95 60% 39% 1% 0%Outside Europe 167 58% 34% 6% 2%Parents' birth2 born country 6850 55% 40% 5% 1%1 country EU 299 48% 42% 7% 3%2EU 279 56% 38% 5% 1%At least 1 outside EU 286 55% 38% 5% 1%Left-Right scale(1-4) Left 2237 54% 40% 4% 2%(5-6) Centre 2388 53% 41% 5% 1%(7-10) Right 1315 59% 36% 4% 0%Respondant occupation scaleSelf- employed 723 67% 27% 5% 0%Managers 644 55% 40% 5% - Other white collars 862 58% 37% 4% 0%Manual workers 2019 61% 34% 4% 1%House persons 605 49% 45% 5% 1%Unemployed 945 58% 35% 5% 1%Retired 1216 37% 57% 4% 2%Students 710 46% 45% 6% 3%Subjective urbanisationRural village 2504 52% 44% 4% 1%Small/ mid size town 3043 57% 36% 5% 1%Large town 2170 53% 40% 5% 2%SmokePacketed cigarettes 6601 55% 39% 5% 1%Roll-your-own cigaret. 1265 56% 37% 4% 3%Cigars or a pipe 337 46% 47% 6% 1%Total smoker 7726 54% 40% 5% 1%Regularly 6513 60% 34% 5% 1%Occasio-nally 1198 23% 70% 5% 1%
When you are alone(IF 'SMOKERS', CODE 1,2 OR 3 IN QC1)
QC7.1 Do you smoke when you are in a car…?

TOTAL Yes No It depends (SPONTANEOUS) DKEU25 7726 28% 58% 13% 1%BE 290 30% 62% 8% - CZ 317 16% 74% 10% 1%DK 351 16% 77% 6% 1%D-W 304 29% 54% 16% 1%DE 473 28% 54% 17% 1%D-E 180 26% 55% 18% 1%EE 303 18% 61% 19% 2%EL 429 49% 40% 11% 0%ES 319 46% 42% 12% 0%FR 335 24% 68% 7% 1%IE 307 47% 40% 12% 1%IT 299 27% 56% 17% - CY 159 42% 55% 4% - LV 367 22% 54% 20% 3%LT 322 32% 58% 7% 3%LU 156 19% 76% 4% - HU 330 14% 68% 18% 0%MT 135 29% 57% 14% - NL 299 13% 82% 5% - AT 407 35% 39% 25% 0%PL 354 34% 58% 6% 2%PT 283 41% 45% 14% 1%SI 273 18% 69% 13% - SK 296 23% 68% 8% - FI 248 28% 61% 11% - SE 198 16% 80% 4% - UK 393 19% 66% 15% 0%SexMale 4482 31% 55% 14% 1%Female 3244 25% 63% 11% 1%Age15-24 1364 35% 48% 17% 0%25-39 2626 31% 56% 13% 0%40-54 2315 28% 60% 11% 1%55 + 1421 19% 70% 10% 1%Education (End of)15 1555 31% 57% 12% 1%16-19 3697 29% 59% 12% 0%20+ 1627 24% 63% 12% 1%Still Studying 710 29% 54% 16% 1%Household composition1 1506 27% 59% 13% 1%2 2061 28% 58% 13% 1%3 1651 27% 59% 13% 0%4+ 2507 30% 58% 11% 0%Place of birthSurveyed country 7273 29% 58% 13% 1%EU 183 29% 59% 11% 0%Europe outside EU 95 14% 84% 3% 0%Outside Europe 167 16% 69% 13% 1%Parents' birth2 born country 6850 29% 58% 12% 1%1 country EU 299 24% 60% 14% 2%2EU 279 26% 63% 11% 0%At least 1 outside EU 286 21% 66% 13% 0%Left-Right scale(1-4) Left 2237 27% 59% 13% 1%(5-6) Centre 2388 26% 62% 11% 1%(7-10) Right 1315 32% 56% 12% 0%Respondant occupation scaleSelf- employed 723 35% 53% 12% 0%Managers 644 25% 65% 10% 0%Other white collars 862 25% 60% 15% 0%Manual workers 2019 31% 57% 12% 0%House persons 605 27% 62% 11% 0%Unemployed 945 34% 50% 15% 1%Retired 1216 20% 68% 10% 2%Students 710 29% 54% 16% 1%Subjective urbanisationRural village 2504 28% 60% 11% 0%Small/ mid size town 3043 30% 57% 13% 1%Large town 2170 27% 58% 14% 1%SmokePacketed cigarettes 6601 29% 58% 12% 0%Roll-your-own cigaret. 1265 28% 56% 15% 1%Cigars or a pipe 337 24% 64% 11% 1%Total smoker 7726 28% 58% 13% 1%Regularly 6513 31% 55% 13% 1%Occasio-nally 1198 14% 79% 7% 1%
In the company of non-smokers(IF 'SMOKERS', CODE 1,2 OR 3 IN QC1)
QC7.2 Do you smoke when you are in a car…?
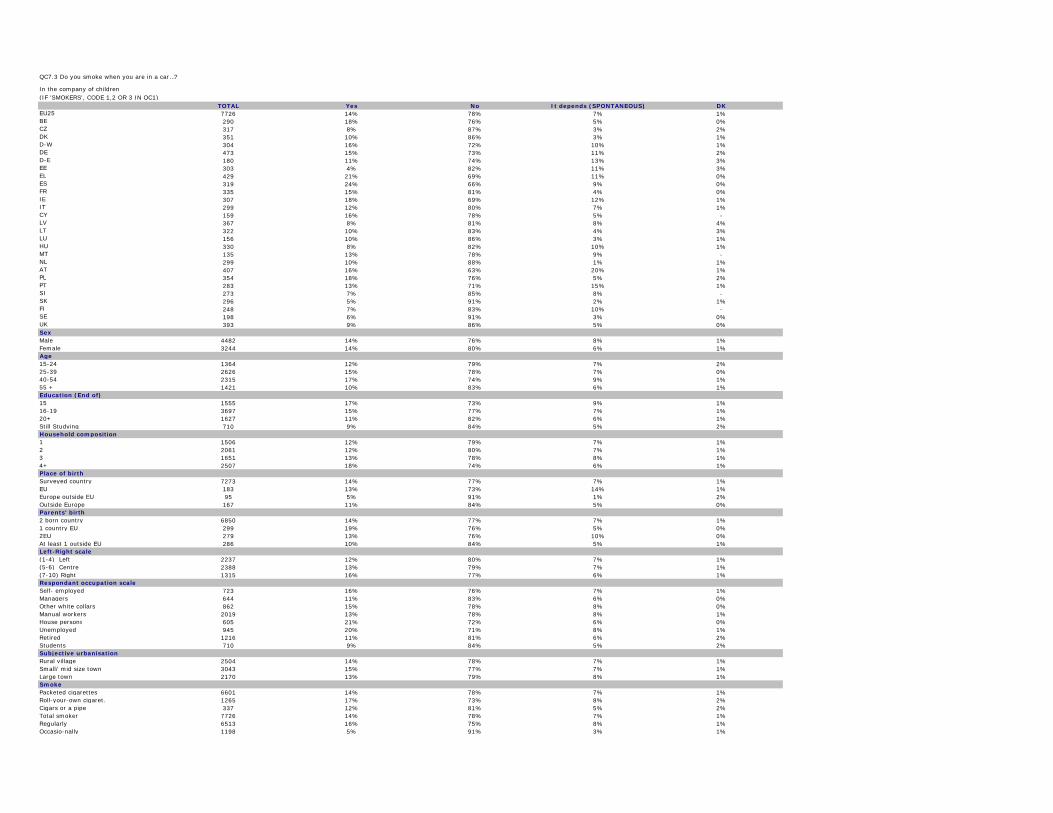
TOTAL Yes No It depends (SPONTANEOUS) DKEU25 7726 14% 78% 7% 1%BE 290 18% 76% 5% 0%CZ 317 8% 87% 3% 2%DK 351 10% 86% 3% 1%D-W 304 16% 72% 10% 1%DE 473 15% 73% 11% 2%D-E 180 11% 74% 13% 3%EE 303 4% 82% 11% 3%EL 429 21% 69% 11% 0%ES 319 24% 66% 9% 0%FR 335 15% 81% 4% 0%IE 307 18% 69% 12% 1%IT 299 12% 80% 7% 1%CY 159 16% 78% 5% - LV 367 8% 81% 8% 4%LT 322 10% 83% 4% 3%LU 156 10% 86% 3% 1%HU 330 8% 82% 10% 1%MT 135 13% 78% 9% - NL 299 10% 88% 1% 1%AT 407 16% 63% 20% 1%PL 354 18% 76% 5% 2%PT 283 13% 71% 15% 1%SI 273 7% 85% 8% - SK 296 5% 91% 2% 1%FI 248 7% 83% 10% - SE 198 6% 91% 3% 0%UK 393 9% 86% 5% 0%SexMale 4482 14% 76% 8% 1%Female 3244 14% 80% 6% 1%Age15-24 1364 12% 79% 7% 2%25-39 2626 15% 78% 7% 0%40-54 2315 17% 74% 9% 1%55 + 1421 10% 83% 6% 1%Education (End of)15 1555 17% 73% 9% 1%16-19 3697 15% 77% 7% 1%20+ 1627 11% 82% 6% 1%Still Studying 710 9% 84% 5% 2%Household composition1 1506 12% 79% 7% 1%2 2061 12% 80% 7% 1%3 1651 13% 78% 8% 1%4+ 2507 18% 74% 6% 1%Place of birthSurveyed country 7273 14% 77% 7% 1%EU 183 13% 73% 14% 1%Europe outside EU 95 5% 91% 1% 2%Outside Europe 167 11% 84% 5% 0%Parents' birth2 born country 6850 14% 77% 7% 1%1 country EU 299 19% 76% 5% 0%2EU 279 13% 76% 10% 0%At least 1 outside EU 286 10% 84% 5% 1%Left-Right scale(1-4) Left 2237 12% 80% 7% 1%(5-6) Centre 2388 13% 79% 7% 1%(7-10) Right 1315 16% 77% 6% 1%Respondant occupation scaleSelf- employed 723 16% 76% 7% 1%Managers 644 11% 83% 6% 0%Other white collars 862 15% 78% 8% 0%Manual workers 2019 13% 78% 8% 1%House persons 605 21% 72% 6% 0%Unemployed 945 20% 71% 8% 1%Retired 1216 11% 81% 6% 2%Students 710 9% 84% 5% 2%Subjective urbanisationRural village 2504 14% 78% 7% 1%Small/ mid size town 3043 15% 77% 7% 1%Large town 2170 13% 79% 8% 1%SmokePacketed cigarettes 6601 14% 78% 7% 1%Roll-your-own cigaret. 1265 17% 73% 8% 2%Cigars or a pipe 337 12% 81% 5% 2%Total smoker 7726 14% 78% 7% 1%Regularly 6513 16% 75% 8% 1%Occasio-nally 1198 5% 91% 3% 1%
In the company of children(IF 'SMOKERS', CODE 1,2 OR 3 IN QC1)
QC7.3 Do you smoke when you are in a car…?

TOTAL Totally in favour Somewhat in favour Somewhat opposed Totally opposed DK In favour Opposed
EU25 24642 56% 21% 13% 9% 1% 77% 22%BE 1047 58% 21% 13% 8% 0% 79% 21%CZ 1011 27% 22% 26% 24% 1% 49% 50%DK 1011 37% 27% 18% 17% 1% 64% 34%D-W 1018 48% 22% 17% 11% 2% 70% 28%DE 1528 47% 22% 17% 11% 2% 69% 29%D-E 510 43% 24% 18% 14% 1% 68% 31%EE 1009 47% 31% 12% 7% 2% 79% 19%EL 1000 45% 25% 15% 15% 0% 69% 30%ES 1016 48% 22% 15% 13% 3% 70% 28%FR 1014 57% 21% 15% 7% 0% 77% 22%IE 1000 79% 14% 4% 2% 1% 93% 6%IT 1000 70% 20% 5% 4% 0% 91% 9%CY 502 69% 11% 12% 7% 2% 79% 19%LV 1049 62% 21% 8% 8% 2% 83% 15%LT 1002 49% 18% 15% 14% 3% 68% 29%LU 500 57% 20% 12% 10% 1% 77% 22%HU 1012 63% 20% 12% 5% 1% 82% 17%MT 500 84% 9% 2% 3% 1% 94% 5%NL 1000 44% 24% 12% 20% 0% 67% 32%AT 1012 33% 29% 22% 14% 2% 61% 36%PL 999 53% 22% 14% 8% 3% 75% 22%PT 1000 62% 19% 9% 10% 1% 80% 19%SI 1037 62% 29% 5% 4% 0% 91% 9%SK 1056 52% 23% 15% 9% 1% 75% 24%FI 1003 50% 28% 14% 7% 0% 79% 21%SE 1000 78% 11% 5% 6% 1% 88% 11%UK 1334 70% 14% 7% 7% 1% 84% 14%SexMale 11882 53% 21% 14% 11% 1% 74% 25%Female 12760 59% 20% 11% 8% 1% 79% 19%Age15-24 3758 48% 22% 17% 11% 1% 70% 28%25-39 6538 52% 23% 14% 11% 1% 75% 25%40-54 6299 53% 21% 14% 11% 1% 74% 25%55 + 8047 65% 18% 9% 6% 2% 83% 15%Education (End of)15 5879 60% 20% 11% 8% 2% 79% 19%16-19 9871 55% 20% 13% 11% 1% 75% 24%20+ 5753 57% 21% 13% 8% 1% 78% 21%Still Studying 2560 50% 24% 15% 9% 2% 74% 24%Household composition1 4662 55% 21% 12% 10% 2% 76% 22%2 7495 58% 20% 12% 9% 1% 78% 21%3 4865 54% 20% 14% 10% 1% 74% 24%4+ 7619 55% 22% 13% 8% 1% 77% 21%Place of birthSurveyed country 23083 56% 21% 13% 9% 1% 77% 22%EU 604 54% 22% 13% 10% 1% 76% 23%Europe outside EU 361 65% 15% 9% 9% 1% 81% 18%Outside Europe 581 64% 17% 11% 7% 1% 81% 18%Parents' birth2 born country 21903 56% 21% 13% 9% 1% 77% 22%1 country EU 828 48% 23% 16% 9% 3% 71% 26%2EU 816 54% 19% 13% 12% 2% 73% 25%At least 1 outside EU 1052 60% 18% 12% 8% 2% 78% 21%Left-Right scale(1-4) Left 6474 52% 22% 14% 11% 1% 74% 25%(5-6) Centre 7800 58% 19% 13% 9% 1% 77% 22%(7-10) Right 4593 56% 20% 12% 11% 1% 76% 23%Respondant occupation scaleSelf- employed 1937 54% 20% 13% 11% 2% 74% 24%Managers 2320 58% 20% 13% 9% 1% 78% 22%Other white collars 2622 55% 20% 14% 11% 1% 74% 25%Manual workers 4743 51% 21% 16% 11% 1% 72% 27%House persons 2519 58% 23% 10% 8% 1% 81% 18%Unemployed 1758 45% 22% 17% 15% 1% 67% 32%Retired 6184 65% 19% 9% 6% 2% 83% 15%Students 2560 50% 24% 15% 9% 2% 74% 24%Subjective urbanisationRural village 8632 57% 21% 12% 8% 2% 78% 20%Small/ mid size town 9822 59% 19% 12% 9% 1% 78% 21%Large town 6159 50% 22% 15% 11% 1% 73% 26%Smoke-don't smokePacketed cigarettes 6601 32% 24% 23% 21% 1% 55% 43%Roll-your-own cigaret. 1265 25% 23% 27% 24% 1% 48% 51%Cigars or a pipe 337 32% 27% 20% 20% 1% 59% 40%Smoked but have stopped 5185 61% 22% 10% 6% 1% 83% 16%Never smoke 11559 70% 18% 7% 3% 2% 88% 10%Total smoker 7726 31% 24% 23% 21% 1% 55% 44%
Restaurants
QC8.1 Are you in favour of smoking bans in the following places?

TOTAL Totally in favour Somewhat in favour Somewhat opposed Totally opposed DK In favour Opposed
EU25 24642 40% 21% 20% 16% 2% 62% 36%BE 1047 31% 25% 28% 16% 0% 56% 44%CZ 1011 16% 19% 36% 28% 2% 35% 63%DK 1011 23% 25% 21% 28% 2% 48% 49%D-W 1018 24% 20% 30% 22% 4% 45% 52%DE 1528 25% 21% 30% 22% 3% 45% 51%D-E 510 27% 22% 30% 20% 1% 49% 50%EE 1009 40% 34% 14% 10% 2% 74% 24%EL 1000 34% 22% 21% 22% 1% 56% 43%ES 1016 42% 20% 17% 18% 3% 62% 35%FR 1014 38% 21% 24% 15% 1% 60% 39%IE 1000 71% 11% 10% 7% 1% 81% 17%IT 1000 69% 19% 7% 5% 0% 88% 12%CY 502 56% 14% 16% 12% 2% 70% 28%LV 1049 49% 27% 10% 12% 2% 76% 22%LT 1002 40% 20% 20% 17% 3% 60% 37%LU 500 27% 26% 22% 24% 2% 53% 45%HU 1012 39% 24% 24% 11% 2% 63% 35%MT 500 64% 17% 9% 10% 1% 80% 19%NL 1000 23% 23% 17% 36% 1% 46% 53%AT 1012 21% 21% 30% 23% 4% 43% 53%PL 999 37% 22% 24% 13% 4% 59% 37%PT 1000 50% 19% 12% 16% 3% 69% 28%SI 1037 39% 34% 14% 13% 0% 73% 27%SK 1056 30% 21% 30% 17% 2% 51% 47%FI 1003 41% 33% 15% 10% 1% 74% 25%SE 1000 64% 18% 9% 9% 1% 82% 17%UK 1334 43% 24% 14% 17% 3% 67% 31%SexMale 11882 37% 21% 22% 19% 2% 57% 41%Female 12760 44% 22% 18% 14% 3% 66% 32%Age15-24 3758 29% 21% 24% 24% 2% 49% 49%25-39 6538 35% 23% 21% 19% 1% 58% 41%40-54 6299 39% 21% 22% 17% 2% 60% 38%55 + 8047 51% 21% 15% 10% 3% 72% 25%Education (End of)15 5879 49% 19% 16% 13% 3% 68% 29%16-19 9871 37% 21% 21% 19% 2% 59% 39%20+ 5753 40% 23% 21% 14% 1% 63% 36%Still Studying 2560 31% 23% 23% 20% 3% 54% 43%Household composition1 4662 42% 20% 18% 16% 3% 63% 34%2 7495 42% 21% 19% 15% 2% 64% 35%3 4865 39% 21% 21% 17% 2% 60% 39%4+ 7619 38% 22% 21% 17% 2% 60% 38%Place of birthSurveyed country 23083 40% 21% 20% 16% 2% 62% 36%EU 604 45% 17% 19% 17% 2% 62% 36%Europe outside EU 361 41% 21% 20% 16% 2% 62% 36%Outside Europe 581 43% 22% 21% 13% 2% 64% 33%Parents' birth2 born country 21903 41% 21% 20% 16% 2% 62% 36%1 country EU 828 34% 23% 22% 17% 3% 57% 40%2EU 816 37% 20% 20% 20% 3% 57% 40%At least 1 outside EU 1052 41% 20% 23% 15% 2% 60% 38%Left-Right scale(1-4) Left 6474 37% 22% 20% 19% 1% 59% 39%(5-6) Centre 7800 38% 22% 22% 16% 2% 61% 37%(7-10) Right 4593 40% 21% 19% 18% 2% 62% 37%Respondant occupation scaleSelf- employed 1937 43% 20% 19% 16% 3% 63% 34%Managers 2320 38% 22% 24% 15% 1% 61% 39%Other white collars 2622 39% 22% 21% 17% 1% 61% 38%Manual workers 4743 35% 20% 24% 20% 1% 54% 44%House persons 2519 49% 21% 16% 12% 2% 70% 28%Unemployed 1758 27% 20% 24% 28% 1% 47% 52%Retired 6184 49% 22% 15% 10% 4% 71% 25%Students 2560 31% 23% 23% 20% 3% 54% 43%Subjective urbanisationRural village 8632 40% 22% 19% 15% 3% 62% 35%Small/ mid size town 9822 44% 20% 19% 15% 2% 64% 34%Large town 6159 35% 22% 21% 20% 1% 57% 41%Smoke-don't smokePacketed cigarettes 6601 21% 16% 28% 34% 1% 37% 62%Roll-your-own cigaret. 1265 9% 12% 30% 47% 1% 21% 77%Cigars or a pipe 337 22% 17% 26% 33% 2% 39% 59%Smoked but have stopped 5185 42% 25% 21% 10% 2% 67% 31%Never smoke 11559 53% 23% 14% 6% 3% 77% 20%Total smoker 7726 19% 16% 28% 36% 1% 35% 63%
Bars or Pubs
QC8.2 Are you in favour of smoking bans in the following places?
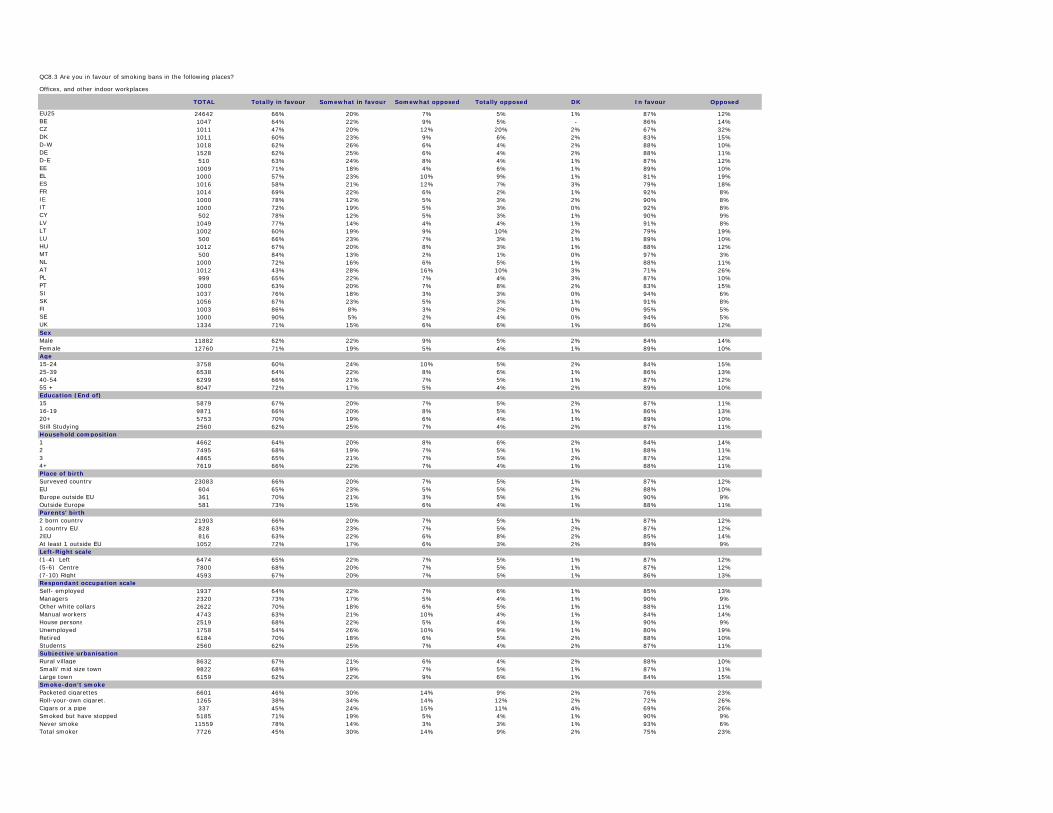
TOTAL Totally in favour Somewhat in favour Somewhat opposed Totally opposed DK In favour Opposed
EU25 24642 66% 20% 7% 5% 1% 87% 12%BE 1047 64% 22% 9% 5% - 86% 14%CZ 1011 47% 20% 12% 20% 2% 67% 32%DK 1011 60% 23% 9% 6% 2% 83% 15%D-W 1018 62% 26% 6% 4% 2% 88% 10%DE 1528 62% 25% 6% 4% 2% 88% 11%D-E 510 63% 24% 8% 4% 1% 87% 12%EE 1009 71% 18% 4% 6% 1% 89% 10%EL 1000 57% 23% 10% 9% 1% 81% 19%ES 1016 58% 21% 12% 7% 3% 79% 18%FR 1014 69% 22% 6% 2% 1% 92% 8%IE 1000 78% 12% 5% 3% 2% 90% 8%IT 1000 72% 19% 5% 3% 0% 92% 8%CY 502 78% 12% 5% 3% 1% 90% 9%LV 1049 77% 14% 4% 4% 1% 91% 8%LT 1002 60% 19% 9% 10% 2% 79% 19%LU 500 66% 23% 7% 3% 1% 89% 10%HU 1012 67% 20% 8% 3% 1% 88% 12%MT 500 84% 13% 2% 1% 0% 97% 3%NL 1000 72% 16% 6% 5% 1% 88% 11%AT 1012 43% 28% 16% 10% 3% 71% 26%PL 999 65% 22% 7% 4% 3% 87% 10%PT 1000 63% 20% 7% 8% 2% 83% 15%SI 1037 76% 18% 3% 3% 0% 94% 6%SK 1056 67% 23% 5% 3% 1% 91% 8%FI 1003 86% 8% 3% 2% 0% 95% 5%SE 1000 90% 5% 2% 4% 0% 94% 5%UK 1334 71% 15% 6% 6% 1% 86% 12%SexMale 11882 62% 22% 9% 5% 2% 84% 14%Female 12760 71% 19% 5% 4% 1% 89% 10%Age15-24 3758 60% 24% 10% 5% 2% 84% 15%25-39 6538 64% 22% 8% 6% 1% 86% 13%40-54 6299 66% 21% 7% 5% 1% 87% 12%55 + 8047 72% 17% 5% 4% 2% 89% 10%Education (End of)15 5879 67% 20% 7% 5% 2% 87% 11%16-19 9871 66% 20% 8% 5% 1% 86% 13%20+ 5753 70% 19% 6% 4% 1% 89% 10%Still Studying 2560 62% 25% 7% 4% 2% 87% 11%Household composition1 4662 64% 20% 8% 6% 2% 84% 14%2 7495 68% 19% 7% 5% 1% 88% 11%3 4865 65% 21% 7% 5% 2% 87% 12%4+ 7619 66% 22% 7% 4% 1% 88% 11%Place of birthSurveyed country 23083 66% 20% 7% 5% 1% 87% 12%EU 604 65% 23% 5% 5% 2% 88% 10%Europe outside EU 361 70% 21% 3% 5% 1% 90% 9%Outside Europe 581 73% 15% 6% 4% 1% 88% 11%Parents' birth2 born country 21903 66% 20% 7% 5% 1% 87% 12%1 country EU 828 63% 23% 7% 5% 2% 87% 12%2EU 816 63% 22% 6% 8% 2% 85% 14%At least 1 outside EU 1052 72% 17% 6% 3% 2% 89% 9%Left-Right scale(1-4) Left 6474 65% 22% 7% 5% 1% 87% 12%(5-6) Centre 7800 68% 20% 7% 5% 1% 87% 12%(7-10) Right 4593 67% 20% 7% 5% 1% 86% 13%Respondant occupation scaleSelf- employed 1937 64% 22% 7% 6% 1% 85% 13%Managers 2320 73% 17% 5% 4% 1% 90% 9%Other white collars 2622 70% 18% 6% 5% 1% 88% 11%Manual workers 4743 63% 21% 10% 4% 1% 84% 14%House persons 2519 68% 22% 5% 4% 1% 90% 9%Unemployed 1758 54% 26% 10% 9% 1% 80% 19%Retired 6184 70% 18% 6% 5% 2% 88% 10%Students 2560 62% 25% 7% 4% 2% 87% 11%Subjective urbanisationRural village 8632 67% 21% 6% 4% 2% 88% 10%Small/ mid size town 9822 68% 19% 7% 5% 1% 87% 11%Large town 6159 62% 22% 9% 6% 1% 84% 15%Smoke-don't smokePacketed cigarettes 6601 46% 30% 14% 9% 2% 76% 23%Roll-your-own cigaret. 1265 38% 34% 14% 12% 2% 72% 26%Cigars or a pipe 337 45% 24% 15% 11% 4% 69% 26%Smoked but have stopped 5185 71% 19% 5% 4% 1% 90% 9%Never smoke 11559 78% 14% 3% 3% 1% 93% 6%Total smoker 7726 45% 30% 14% 9% 2% 75% 23%
Offices, and other indoor workplaces
QC8.3 Are you in favour of smoking bans in the following places?

TOTAL Totally in favour Somewhat in favour Somewhat opposed Totally opposed DK In favour Opposed
EU25 24642 63% 21% 9% 6% 1% 84% 14%BE 1047 53% 26% 15% 6% 0% 79% 21%CZ 1011 50% 18% 11% 20% 1% 68% 31%DK 1011 53% 26% 12% 8% 1% 79% 20%D-W 1018 61% 22% 10% 5% 2% 83% 15%DE 1528 62% 22% 10% 5% 2% 83% 15%D-E 510 64% 21% 9% 4% 1% 85% 13%EE 1009 74% 15% 5% 6% 1% 88% 11%EL 1000 60% 21% 10% 9% 1% 81% 19%ES 1016 59% 21% 10% 8% 2% 80% 18%FR 1014 65% 23% 8% 3% 1% 88% 11%IE 1000 75% 13% 7% 4% 1% 88% 11%IT 1000 73% 18% 6% 3% 0% 91% 9%CY 502 75% 13% 6% 4% 1% 88% 10%LV 1049 76% 14% 5% 5% 1% 90% 9%LT 1002 61% 16% 10% 11% 2% 78% 21%LU 500 63% 21% 10% 5% 1% 85% 15%HU 1012 64% 22% 8% 4% 1% 87% 13%MT 500 79% 13% 5% 1% 1% 93% 7%NL 1000 60% 22% 9% 8% 1% 82% 17%AT 1012 37% 28% 19% 13% 4% 65% 32%PL 999 57% 26% 9% 5% 3% 83% 13%PT 1000 62% 20% 8% 9% 2% 82% 16%SI 1037 68% 24% 4% 3% 0% 92% 8%SK 1056 61% 27% 6% 4% 1% 89% 10%FI 1003 83% 10% 4% 2% 0% 93% 6%SE 1000 85% 8% 4% 4% 0% 92% 8%UK 1334 64% 21% 9% 5% 1% 84% 14%SexMale 11882 59% 23% 10% 7% 1% 82% 17%Female 12760 67% 19% 7% 5% 1% 87% 12%Age15-24 3758 56% 23% 12% 7% 2% 79% 19%25-39 6538 61% 23% 9% 6% 1% 84% 16%40-54 6299 62% 22% 8% 6% 1% 85% 14%55 + 8047 69% 18% 7% 4% 2% 87% 11%Education (End of)15 5879 65% 20% 8% 5% 2% 86% 13%16-19 9871 63% 20% 9% 6% 1% 83% 16%20+ 5753 65% 23% 8% 4% 1% 87% 12%Still Studying 2560 57% 23% 11% 6% 2% 81% 17%Household composition1 4662 63% 19% 10% 7% 2% 82% 16%2 7495 65% 20% 8% 5% 1% 85% 14%3 4865 62% 22% 9% 6% 2% 84% 14%4+ 7619 63% 22% 9% 5% 1% 85% 14%Place of birthSurveyed country 23083 63% 21% 9% 6% 1% 84% 14%EU 604 61% 25% 7% 5% 2% 86% 12%Europe outside EU 361 71% 16% 9% 3% 1% 87% 12%Outside Europe 581 71% 17% 6% 5% 1% 88% 11%Parents' birth2 born country 21903 63% 21% 9% 6% 1% 84% 14%1 country EU 828 62% 23% 8% 4% 2% 86% 13%2EU 816 63% 21% 8% 7% 2% 84% 14%At least 1 outside EU 1052 66% 19% 9% 4% 1% 86% 13%Left-Right scale(1-4) Left 6474 61% 23% 9% 6% 1% 84% 15%(5-6) Centre 7800 64% 21% 9% 5% 1% 85% 14%(7-10) Right 4593 64% 20% 8% 6% 1% 84% 15%Respondant occupation scaleSelf- employed 1937 63% 20% 9% 7% 1% 83% 16%Managers 2320 67% 20% 7% 5% 1% 88% 11%Other white collars 2622 65% 21% 9% 5% 0% 85% 14%Manual workers 4743 60% 22% 11% 5% 1% 82% 17%House persons 2519 66% 22% 6% 4% 1% 88% 11%Unemployed 1758 51% 27% 12% 9% 1% 79% 20%Retired 6184 68% 19% 7% 5% 2% 86% 12%Students 2560 57% 23% 11% 6% 2% 81% 17%Subjective urbanisationRural village 8632 63% 23% 8% 5% 2% 85% 13%Small/ mid size town 9822 66% 19% 8% 6% 1% 85% 14%Large town 6159 60% 22% 10% 7% 1% 82% 17%Smoke-don't smokePacketed cigarettes 6601 45% 28% 16% 10% 1% 73% 26%Roll-your-own cigaret. 1265 35% 31% 19% 14% 2% 65% 33%Cigars or a pipe 337 43% 26% 17% 14% 0% 69% 31%Smoked but have stopped 5185 68% 21% 7% 4% 1% 88% 11%Never smoke 11559 74% 17% 5% 3% 1% 91% 8%Total smoker 7726 44% 28% 16% 10% 1% 72% 26%
Any indoor public space (metro, airports, shops, etc.)
QC8.4 Are you in favour of smoking bans in the following places?

TOTAL Very often Sometimes Rarely Never DK Yes NoEU25 24642 15% 27% 30% 27% 0% 42% 57%BE 1047 12% 32% 29% 26% - 45% 55%CZ 1011 15% 34% 32% 18% 1% 50% 50%DK 1011 10% 22% 38% 29% 0% 32% 67%D-W 1018 10% 24% 42% 24% 0% 34% 66%DE 1528 11% 23% 41% 25% 0% 33% 66%D-E 510 13% 18% 39% 29% 0% 31% 69%EE 1009 18% 32% 24% 26% 1% 50% 49%EL 1000 18% 26% 26% 31% - 43% 57%ES 1016 18% 28% 27% 26% 1% 46% 53%FR 1014 12% 26% 23% 39% 0% 38% 62%IE 1000 9% 24% 27% 39% 0% 33% 66%IT 1000 22% 32% 27% 19% 0% 54% 46%CY 502 26% 28% 20% 26% - 54% 46%LV 1049 16% 28% 25% 30% 1% 44% 55%LT 1002 20% 32% 24% 23% 1% 52% 47%LU 500 11% 25% 25% 39% - 36% 64%HU 1012 20% 29% 24% 27% 0% 49% 51%MT 500 39% 25% 19% 15% 1% 65% 35%NL 1000 9% 30% 29% 32% - 39% 61%AT 1012 13% 36% 22% 28% 1% 49% 50%PL 999 20% 28% 25% 26% 1% 47% 52%PT 1000 13% 29% 34% 23% 0% 43% 57%SI 1037 16% 29% 33% 22% 0% 45% 55%SK 1056 24% 30% 26% 19% 1% 53% 46%FI 1003 7% 18% 42% 33% 0% 25% 75%SE 1000 7% 17% 43% 34% 0% 23% 77%UK 1334 14% 27% 31% 27% 0% 41% 58%SexMale 11882 14% 26% 29% 30% 0% 40% 60%Female 12760 16% 29% 31% 24% 0% 45% 55%Age15-24 3758 21% 32% 24% 22% 0% 53% 47%25-39 6538 15% 30% 29% 25% 0% 45% 55%40-54 6299 14% 28% 30% 28% 0% 42% 57%55 + 8047 13% 22% 34% 30% 0% 35% 65%Education (End of)15 5879 14% 23% 31% 31% 0% 38% 62%16-19 9871 15% 26% 30% 30% 0% 40% 60%20+ 5753 14% 30% 33% 23% 0% 44% 56%Still Studying 2560 21% 36% 25% 18% 1% 57% 43%Household composition1 4662 13% 24% 30% 33% 0% 37% 63%2 7495 13% 27% 31% 28% 0% 40% 59%3 4865 16% 27% 31% 25% 1% 43% 56%4+ 7619 17% 30% 29% 24% 0% 47% 53%Place of birthSurveyed country 23083 15% 27% 30% 27% 0% 42% 57%EU 604 10% 27% 34% 29% 0% 37% 63%Europe outside EU 361 17% 22% 37% 24% 0% 39% 61%Outside Europe 581 23% 30% 30% 17% - 53% 47%Parents' birth2 born country 21903 15% 27% 30% 27% 0% 42% 57%1 country EU 828 12% 24% 30% 34% 0% 37% 63%2EU 816 14% 26% 30% 30% - 40% 60%At least 1 outside EU 1052 22% 30% 29% 19% 0% 52% 48%Left-Right scale(1-4) Left 6474 13% 28% 32% 27% 0% 41% 59%(5-6) Centre 7800 14% 28% 31% 27% 0% 42% 58%(7-10) Right 4593 14% 26% 32% 27% 0% 40% 60%Respondant occupation scaleSelf- employed 1937 18% 25% 29% 27% 0% 43% 57%Managers 2320 13% 31% 33% 23% 0% 44% 56%Other white collars 2622 17% 31% 30% 22% 0% 48% 52%Manual workers 4743 16% 28% 26% 30% 0% 44% 56%House persons 2519 16% 29% 33% 23% 0% 44% 55%Unemployed 1758 11% 26% 28% 35% 0% 37% 63%Retired 6184 12% 21% 35% 32% 0% 33% 67%Students 2560 21% 36% 25% 18% 1% 57% 43%Subjective urbanisationRural village 8632 15% 26% 30% 29% 0% 41% 59%Small/ mid size town 9822 15% 29% 29% 27% 0% 43% 56%Large town 6159 16% 27% 32% 25% 0% 43% 57%Smoke-don't smokePacketed cigarettes 6601 8% 18% 25% 49% 1% 26% 74%Roll-your-own cigaret. 1265 9% 19% 21% 51% 0% 27% 72%Cigars or a pipe 337 6% 20% 24% 49% 1% 26% 73%Smoked but have stopped 5185 14% 30% 35% 21% 0% 44% 56%Never smoke 11559 21% 32% 32% 15% 0% 53% 47%Total smoker 7726 8% 18% 24% 49% 1% 26% 74%
QC9 How often are you bothered by exposure to tobacco smoke in your daily life?
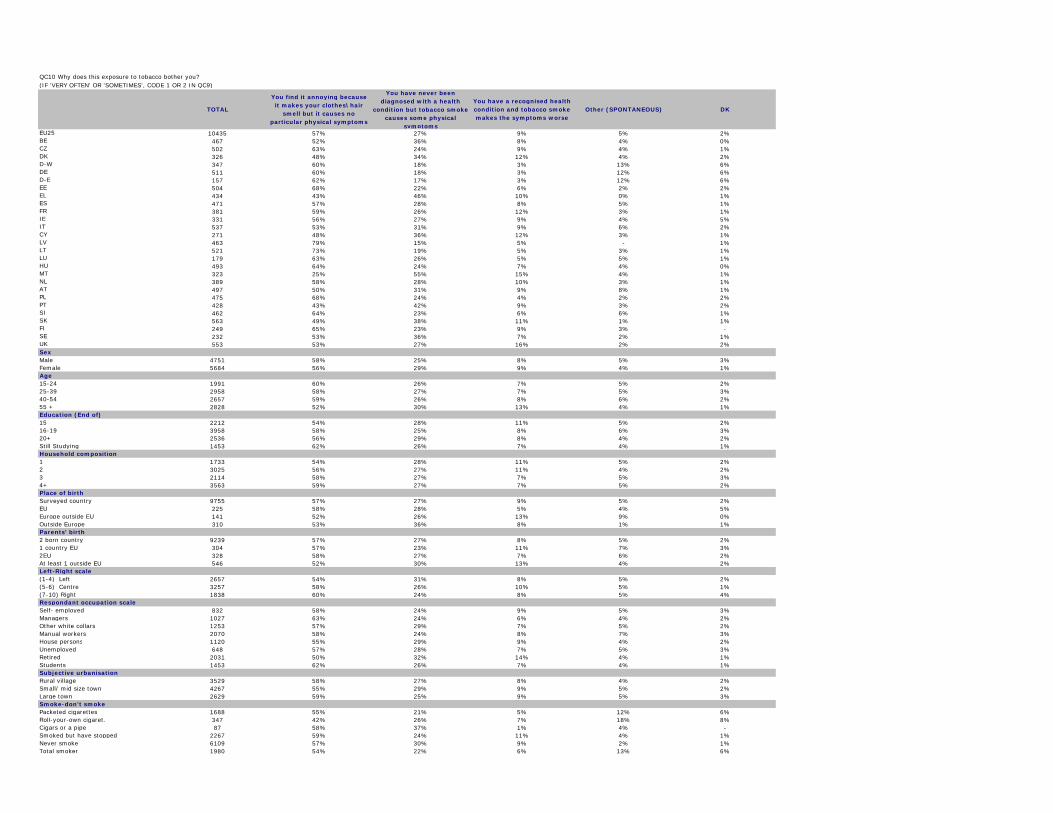
TOTAL
You find it annoying because it makes your clothes\hair
smell but it causes no particular physical symptoms
You have never been diagnosed with a health
condition but tobacco smoke causes some physical
symptoms
You have a recognised health condition and tobacco smoke makes the symptoms worse
Other (SPONTANEOUS) DK
EU25 10435 57% 27% 9% 5% 2%BE 467 52% 36% 8% 4% 0%CZ 502 63% 24% 9% 4% 1%DK 326 48% 34% 12% 4% 2%D-W 347 60% 18% 3% 13% 6%DE 511 60% 18% 3% 12% 6%D-E 157 62% 17% 3% 12% 6%EE 504 68% 22% 6% 2% 2%EL 434 43% 46% 10% 0% 1%ES 471 57% 28% 8% 5% 1%FR 381 59% 26% 12% 3% 1%IE 331 56% 27% 9% 4% 5%IT 537 53% 31% 9% 6% 2%CY 271 48% 36% 12% 3% 1%LV 463 79% 15% 5% - 1%LT 521 73% 19% 5% 3% 1%LU 179 63% 26% 5% 5% 1%HU 493 64% 24% 7% 4% 0%MT 323 25% 55% 15% 4% 1%NL 389 58% 28% 10% 3% 1%AT 497 50% 31% 9% 8% 1%PL 475 68% 24% 4% 2% 2%PT 428 43% 42% 9% 3% 2%SI 462 64% 23% 6% 6% 1%SK 563 49% 38% 11% 1% 1%FI 249 65% 23% 9% 3% - SE 232 53% 36% 7% 2% 1%UK 553 53% 27% 16% 2% 2%SexMale 4751 58% 25% 8% 5% 3%Female 5684 56% 29% 9% 4% 1%Age15-24 1991 60% 26% 7% 5% 2%25-39 2958 58% 27% 7% 5% 3%40-54 2657 59% 26% 8% 6% 2%55 + 2828 52% 30% 13% 4% 1%Education (End of)15 2212 54% 28% 11% 5% 2%16-19 3958 58% 25% 8% 6% 3%20+ 2536 56% 29% 8% 4% 2%Still Studying 1453 62% 26% 7% 4% 1%Household composition1 1733 54% 28% 11% 5% 2%2 3025 56% 27% 11% 4% 2%3 2114 58% 27% 7% 5% 3%4+ 3563 59% 27% 7% 5% 2%Place of birthSurveyed country 9755 57% 27% 9% 5% 2%EU 225 58% 28% 5% 4% 5%Europe outside EU 141 52% 26% 13% 9% 0%Outside Europe 310 53% 36% 8% 1% 1%Parents' birth2 born country 9239 57% 27% 8% 5% 2%1 country EU 304 57% 23% 11% 7% 3%2EU 328 58% 27% 7% 6% 2%At least 1 outside EU 546 52% 30% 13% 4% 2%Left-Right scale(1-4) Left 2657 54% 31% 8% 5% 2%(5-6) Centre 3257 58% 26% 10% 5% 1%(7-10) Right 1838 60% 24% 8% 5% 4%Respondant occupation scaleSelf- employed 832 58% 24% 9% 5% 3%Managers 1027 63% 24% 6% 4% 2%Other white collars 1253 57% 29% 7% 5% 2%Manual workers 2070 58% 24% 8% 7% 3%House persons 1120 55% 29% 9% 4% 2%Unemployed 648 57% 28% 7% 5% 3%Retired 2031 50% 32% 14% 4% 1%Students 1453 62% 26% 7% 4% 1%Subjective urbanisationRural village 3529 58% 27% 8% 4% 2%Small/ mid size town 4267 55% 29% 9% 5% 2%Large town 2629 59% 25% 9% 5% 3%Smoke-don't smokePacketed cigarettes 1688 55% 21% 5% 12% 6%Roll-your-own cigaret. 347 42% 26% 7% 18% 8%Cigars or a pipe 87 58% 37% 1% 4% - Smoked but have stopped 2267 59% 24% 11% 4% 1%Never smoke 6109 57% 30% 9% 2% 1%Total smoker 1980 54% 22% 6% 13% 6%
(IF 'VERY OFTEN' OR 'SOMETIMES', CODE 1 OR 2 IN QC9)QC10 Why does this exposure to tobacco bother you?

TOTAL Very often Sometimes Rarely Never DK Yes NoEU25 7726 20% 37% 24% 20% 0% 56% 44%BE 290 17% 37% 19% 27% - 54% 46%CZ 317 19% 49% 21% 11% - 68% 32%DK 351 25% 41% 20% 13% 1% 66% 33%D-W 304 14% 45% 24% 16% - 59% 41%DE 473 14% 45% 26% 15% - 59% 41%D-E 180 14% 44% 29% 12% - 58% 42%EE 303 18% 46% 23% 13% 0% 64% 36%EL 429 40% 30% 18% 12% 1% 70% 29%ES 319 23% 37% 20% 19% 1% 60% 39%FR 335 13% 38% 26% 23% - 51% 49%IE 307 43% 38% 10% 9% - 81% 19%IT 299 9% 28% 26% 36% 1% 37% 62%CY 159 28% 30% 20% 22% - 58% 42%LV 367 18% 42% 21% 17% 1% 60% 39%LT 322 32% 39% 21% 8% 0% 71% 29%LU 156 20% 32% 25% 21% 2% 52% 46%HU 330 8% 28% 33% 30% - 37% 63%MT 135 22% 44% 11% 22% 0% 66% 34%NL 299 32% 34% 18% 16% - 66% 34%AT 407 15% 47% 31% 7% 0% 62% 38%PL 354 19% 33% 30% 17% 1% 53% 46%PT 283 21% 36% 20% 22% 1% 58% 42%SI 273 13% 43% 28% 16% - 56% 44%SK 296 11% 39% 32% 18% - 50% 50%FI 248 51% 31% 14% 5% - 82% 18%SE 198 38% 32% 19% 11% 0% 70% 30%UK 393 30% 34% 21% 15% - 64% 36%SexMale 4482 23% 40% 23% 14% 0% 63% 37%Female 3244 15% 31% 26% 27% 1% 47% 53%Age15-24 1364 24% 41% 22% 13% 0% 65% 35%25-39 2626 21% 38% 23% 17% 0% 60% 40%40-54 2315 17% 36% 26% 21% 0% 53% 47%55 + 1421 17% 30% 24% 29% 0% 47% 53%Education (End of)15 1555 14% 32% 25% 29% 0% 46% 54%16-19 3697 20% 36% 24% 19% 0% 57% 43%20+ 1627 21% 40% 25% 14% 0% 61% 39%Still Studying 710 24% 41% 22% 12% 1% 65% 34%Household composition1 1506 24% 33% 22% 20% 0% 58% 42%2 2061 19% 38% 23% 19% 0% 57% 42%3 1651 18% 39% 24% 19% 0% 57% 43%4+ 2507 18% 36% 26% 20% 0% 54% 46%Place of birthSurveyed country 7273 19% 37% 24% 19% 0% 56% 43%EU 183 22% 40% 19% 19% 0% 62% 38%Europe outside EU 95 26% 22% 28% 23% 0% 48% 52%Outside Europe 167 17% 32% 25% 27% - 49% 51%Parents' birth2 born country 6850 20% 37% 24% 19% 0% 57% 43%1 country EU 299 22% 29% 30% 18% 1% 51% 48%2EU 279 20% 30% 29% 21% 0% 50% 50%At least 1 outside EU 286 18% 36% 24% 21% 1% 54% 45%Left-Right scale(1-4) Left 2237 22% 38% 22% 18% 0% 59% 40%(5-6) Centre 2388 18% 38% 25% 19% 0% 56% 44%(7-10) Right 1315 21% 37% 23% 18% 0% 59% 41%Respondant occupation scaleSelf- employed 723 22% 36% 25% 17% 1% 58% 42%Managers 644 19% 43% 26% 11% 0% 63% 37%Other white collars 862 22% 38% 22% 18% - 60% 40%Manual workers 2019 19% 40% 25% 16% 0% 58% 41%House persons 605 13% 25% 23% 38% 0% 38% 61%Unemployed 945 24% 36% 22% 18% - 60% 40%Retired 1216 15% 30% 24% 30% 0% 45% 54%Students 710 24% 41% 22% 12% 1% 65% 34%Subjective urbanisationRural village 2504 20% 37% 24% 19% 0% 57% 43%Small/ mid size town 3043 18% 35% 25% 22% 0% 53% 47%Large town 2170 21% 39% 22% 17% 1% 60% 39%SmokePacketed cigarettes 6601 19% 37% 25% 20% 0% 55% 44%Roll-your-own cigaret. 1265 26% 36% 19% 19% 0% 62% 38%Cigars or a pipe 337 23% 35% 29% 12% - 59% 41%Total smoker 7726 20% 37% 24% 20% 0% 56% 44%
Alcohol(IF 'SMOKERS', CODE 1,2 OR 3 IN QC1)
QC11.1 How often do you combine tobacco with…?

TOTAL Very often Sometimes Rarely Never DK Yes NoEU25 7726 11% 18% 20% 50% 1% 29% 70%BE 290 7% 16% 22% 54% 0% 24% 76%CZ 317 9% 22% 21% 47% 2% 31% 67%DK 351 17% 17% 18% 47% 1% 34% 65%D-W 304 7% 12% 18% 61% 0% 20% 80%DE 473 7% 11% 18% 63% 0% 18% 81%D-E 180 5% 8% 18% 68% 0% 14% 86%EE 303 8% 16% 15% 58% 3% 23% 73%EL 429 7% 12% 19% 60% 1% 20% 79%ES 319 14% 24% 22% 38% 2% 38% 60%FR 335 11% 21% 17% 50% 0% 33% 67%IE 307 13% 27% 22% 36% 2% 40% 58%IT 299 6% 17% 21% 54% 1% 24% 75%CY 159 11% 15% 14% 59% 1% 26% 73%LV 367 6% 15% 14% 63% 2% 21% 77%LT 322 11% 25% 13% 48% 3% 36% 61%LU 156 8% 10% 9% 71% 2% 17% 80%HU 330 7% 5% 11% 76% 1% 12% 87%MT 135 20% 15% 21% 44% - 35% 65%NL 299 17% 13% 23% 48% - 30% 70%AT 407 3% 18% 32% 45% 2% 21% 77%PL 354 14% 20% 25% 40% 1% 34% 65%PT 283 13% 22% 22% 42% 1% 35% 64%SI 273 6% 21% 28% 45% - 27% 73%SK 296 4% 12% 12% 72% - 16% 84%FI 248 11% 12% 15% 61% 1% 23% 76%SE 198 21% 17% 14% 46% 2% 38% 60%UK 393 18% 22% 19% 39% 2% 40% 58%SexMale 4482 10% 18% 20% 50% 1% 29% 70%Female 3244 12% 17% 20% 50% 1% 29% 70%Age15-24 1364 7% 15% 22% 54% 2% 22% 76%25-39 2626 11% 19% 21% 49% 1% 29% 70%40-54 2315 10% 18% 20% 51% 1% 28% 71%55 + 1421 17% 19% 16% 47% 2% 36% 63%Education (End of)15 1555 13% 21% 20% 45% 1% 34% 65%16-19 3697 10% 16% 21% 51% 1% 27% 72%20+ 1627 12% 20% 17% 50% 1% 32% 67%Still Studying 710 6% 13% 21% 58% 2% 19% 79%Household composition1 1506 18% 18% 18% 45% 1% 36% 63%2 2061 11% 20% 19% 49% 1% 31% 68%3 1651 8% 19% 20% 51% 2% 27% 71%4+ 2507 9% 15% 22% 53% 1% 24% 75%Place of birthSurveyed country 7273 11% 18% 20% 50% 1% 29% 70%EU 183 9% 19% 22% 47% 3% 28% 69%Europe outside EU 95 11% 26% 13% 50% 1% 36% 63%Outside Europe 167 14% 11% 15% 59% 1% 25% 74%Parents' birth2 born country 6850 11% 18% 20% 50% 1% 29% 70%1 country EU 299 17% 13% 22% 48% 0% 30% 70%2EU 279 12% 17% 18% 50% 3% 29% 68%At least 1 outside EU 286 13% 14% 19% 53% 1% 27% 72%Left-Right scale(1-4) Left 2237 12% 19% 21% 48% 1% 30% 69%(5-6) Centre 2388 10% 18% 19% 51% 1% 28% 71%(7-10) Right 1315 11% 17% 19% 52% 1% 27% 72%Respondant occupation scaleSelf- employed 723 5% 17% 20% 57% 1% 21% 78%Managers 644 9% 16% 23% 52% 1% 25% 74%Other white collars 862 9% 20% 20% 50% 0% 29% 70%Manual workers 2019 9% 18% 21% 51% 1% 27% 72%House persons 605 12% 18% 21% 49% 1% 30% 70%Unemployed 945 15% 18% 20% 47% 1% 32% 67%Retired 1216 20% 21% 15% 43% 2% 40% 58%Students 710 6% 13% 21% 58% 2% 19% 79%Subjective urbanisationRural village 2504 11% 20% 19% 50% 1% 30% 69%Small/ mid size town 3043 11% 16% 21% 51% 1% 28% 71%Large town 2170 11% 18% 21% 49% 1% 29% 70%SmokePacketed cigarettes 6601 10% 17% 21% 50% 1% 28% 71%Roll-your-own cigaret. 1265 16% 20% 16% 47% 1% 36% 63%Cigars or a pipe 337 10% 22% 18% 49% 0% 32% 67%Total smoker 7726 11% 18% 20% 50% 1% 29% 70%
Medicines(IF 'SMOKERS', CODE 1,2 OR 3 IN QC1)
QC11.2 How often do you combine tobacco with…?
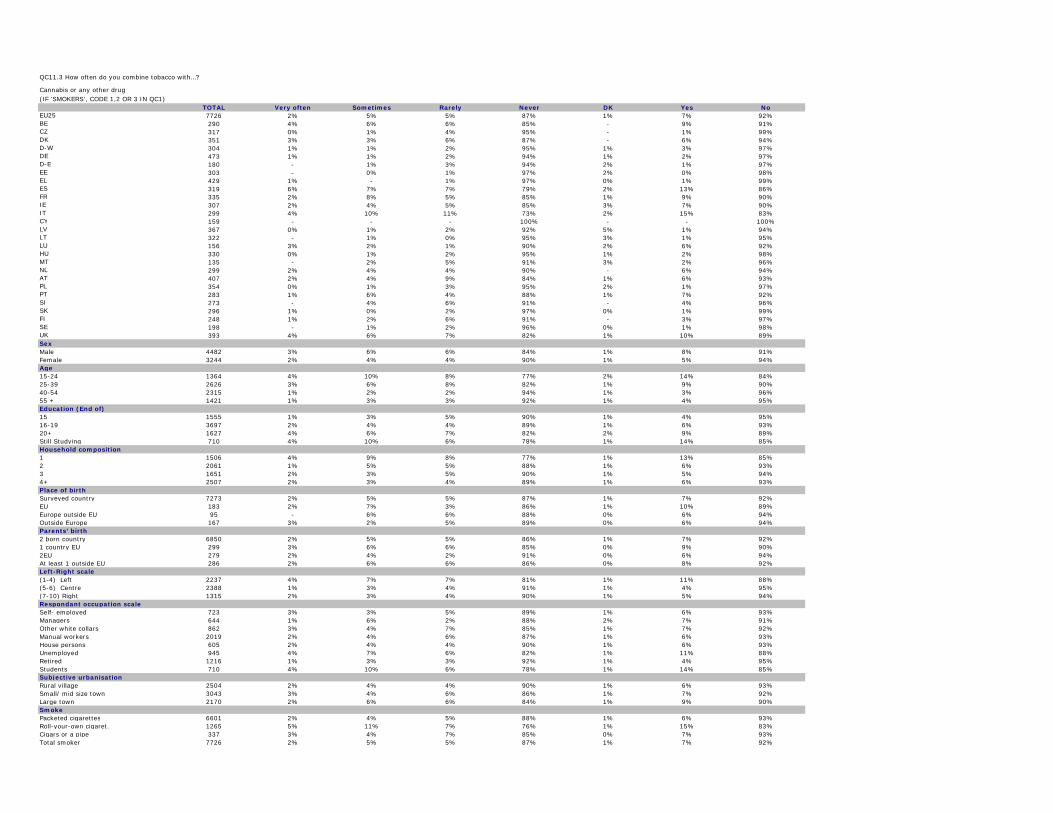
TOTAL Very often Sometimes Rarely Never DK Yes NoEU25 7726 2% 5% 5% 87% 1% 7% 92%BE 290 4% 6% 6% 85% - 9% 91%CZ 317 0% 1% 4% 95% - 1% 99%DK 351 3% 3% 6% 87% - 6% 94%D-W 304 1% 1% 2% 95% 1% 3% 97%DE 473 1% 1% 2% 94% 1% 2% 97%D-E 180 - 1% 3% 94% 2% 1% 97%EE 303 - 0% 1% 97% 2% 0% 98%EL 429 1% - 1% 97% 0% 1% 99%ES 319 6% 7% 7% 79% 2% 13% 86%FR 335 2% 8% 5% 85% 1% 9% 90%IE 307 2% 4% 5% 85% 3% 7% 90%IT 299 4% 10% 11% 73% 2% 15% 83%CY 159 - - - 100% - - 100%LV 367 0% 1% 2% 92% 5% 1% 94%LT 322 - 1% 0% 95% 3% 1% 95%LU 156 3% 2% 1% 90% 2% 6% 92%HU 330 0% 1% 2% 95% 1% 2% 98%MT 135 - 2% 5% 91% 3% 2% 96%NL 299 2% 4% 4% 90% - 6% 94%AT 407 2% 4% 9% 84% 1% 6% 93%PL 354 0% 1% 3% 95% 2% 1% 97%PT 283 1% 6% 4% 88% 1% 7% 92%SI 273 - 4% 6% 91% - 4% 96%SK 296 1% 0% 2% 97% 0% 1% 99%FI 248 1% 2% 6% 91% - 3% 97%SE 198 - 1% 2% 96% 0% 1% 98%UK 393 4% 6% 7% 82% 1% 10% 89%SexMale 4482 3% 6% 6% 84% 1% 8% 91%Female 3244 2% 4% 4% 90% 1% 5% 94%Age15-24 1364 4% 10% 8% 77% 2% 14% 84%25-39 2626 3% 6% 8% 82% 1% 9% 90%40-54 2315 1% 2% 2% 94% 1% 3% 96%55 + 1421 1% 3% 3% 92% 1% 4% 95%Education (End of)15 1555 1% 3% 5% 90% 1% 4% 95%16-19 3697 2% 4% 4% 89% 1% 6% 93%20+ 1627 4% 6% 7% 82% 2% 9% 89%Still Studying 710 4% 10% 6% 78% 1% 14% 85%Household composition1 1506 4% 9% 8% 77% 1% 13% 85%2 2061 1% 5% 5% 88% 1% 6% 93%3 1651 2% 3% 5% 90% 1% 5% 94%4+ 2507 2% 3% 4% 89% 1% 6% 93%Place of birthSurveyed country 7273 2% 5% 5% 87% 1% 7% 92%EU 183 2% 7% 3% 86% 1% 10% 89%Europe outside EU 95 - 6% 6% 88% 0% 6% 94%Outside Europe 167 3% 2% 5% 89% 0% 6% 94%Parents' birth2 born country 6850 2% 5% 5% 86% 1% 7% 92%1 country EU 299 3% 6% 6% 85% 0% 9% 90%2EU 279 2% 4% 2% 91% 0% 6% 94%At least 1 outside EU 286 2% 6% 6% 86% 0% 8% 92%Left-Right scale(1-4) Left 2237 4% 7% 7% 81% 1% 11% 88%(5-6) Centre 2388 1% 3% 4% 91% 1% 4% 95%(7-10) Right 1315 2% 3% 4% 90% 1% 5% 94%Respondant occupation scaleSelf- employed 723 3% 3% 5% 89% 1% 6% 93%Managers 644 1% 6% 2% 88% 2% 7% 91%Other white collars 862 3% 4% 7% 85% 1% 7% 92%Manual workers 2019 2% 4% 6% 87% 1% 6% 93%House persons 605 2% 4% 4% 90% 1% 6% 93%Unemployed 945 4% 7% 6% 82% 1% 11% 88%Retired 1216 1% 3% 3% 92% 1% 4% 95%Students 710 4% 10% 6% 78% 1% 14% 85%Subjective urbanisationRural village 2504 2% 4% 4% 90% 1% 6% 93%Small/ mid size town 3043 3% 4% 6% 86% 1% 7% 92%Large town 2170 2% 6% 6% 84% 1% 9% 90%SmokePacketed cigarettes 6601 2% 4% 5% 88% 1% 6% 93%Roll-your-own cigaret. 1265 5% 11% 7% 76% 1% 15% 83%Cigars or a pipe 337 3% 4% 7% 85% 0% 7% 93%Total smoker 7726 2% 5% 5% 87% 1% 7% 92%
Cannabis or any other drug(IF 'SMOKERS', CODE 1,2 OR 3 IN QC1)
QC11.3 How often do you combine tobacco with…?

TOTAL Totally agree Tend to agree Tend to disagree Totally disagree DK Agree DisagreeEU25 24642 74% 21% 3% 1% 1% 94% 4%BE 1047 69% 24% 5% 1% 0% 94% 6%CZ 1011 77% 21% 2% 1% 0% 97% 2%DK 1011 60% 26% 8% 2% 3% 86% 11%D-W 1018 76% 19% 3% 1% 1% 96% 4%DE 1528 77% 19% 3% 1% 1% 95% 4%D-E 510 78% 16% 4% 1% 1% 94% 5%EE 1009 79% 14% 2% 3% 1% 94% 5%EL 1000 81% 15% 2% 1% 0% 96% 3%ES 1016 71% 24% 3% 1% 2% 95% 3%FR 1014 81% 15% 3% 1% 0% 97% 3%IE 1000 62% 29% 3% 0% 6% 91% 4%IT 1000 69% 27% 3% 1% 0% 96% 4%CY 502 86% 10% 2% 1% 2% 96% 2%LV 1049 84% 12% 1% 1% 1% 97% 2%LT 1002 82% 13% 2% 1% 2% 96% 2%LU 500 78% 14% 5% 2% 1% 92% 7%HU 1012 86% 11% 2% 1% 0% 97% 3%MT 500 85% 12% 1% 1% 1% 97% 2%NL 1000 55% 29% 10% 3% 3% 85% 13%AT 1012 55% 30% 9% 4% 3% 85% 13%PL 999 78% 18% 1% 2% 1% 96% 3%PT 1000 73% 21% 3% 2% 1% 95% 5%SI 1037 75% 21% 2% 0% 1% 97% 2%SK 1056 79% 18% 1% 0% 2% 96% 2%FI 1003 65% 29% 5% 1% 0% 94% 6%SE 1000 63% 25% 7% 3% 1% 88% 10%UK 1334 72% 21% 4% 1% 2% 93% 5%SexMale 11882 73% 22% 3% 1% 1% 94% 4%Female 12760 74% 20% 3% 1% 1% 94% 5%Age15-24 3758 75% 20% 3% 1% 1% 95% 4%25-39 6538 72% 22% 4% 1% 1% 94% 5%40-54 6299 72% 22% 3% 1% 1% 94% 5%55 + 8047 75% 19% 3% 1% 1% 95% 4%Education (End of)15 5879 74% 21% 3% 1% 1% 95% 4%16-19 9871 74% 20% 3% 1% 1% 95% 5%20+ 5753 72% 21% 4% 1% 1% 94% 5%Still Studying 2560 75% 21% 2% 1% 1% 96% 3%Household composition1 4662 71% 22% 4% 1% 2% 93% 5%2 7495 74% 21% 3% 1% 1% 94% 4%3 4865 74% 21% 3% 1% 1% 95% 4%4+ 7619 75% 21% 3% 1% 1% 95% 4%Place of birthSurveyed country 23083 73% 21% 3% 1% 1% 94% 4%EU 604 72% 22% 3% 1% 1% 95% 4%Europe outside EU 361 83% 14% 1% 1% 1% 97% 2%Outside Europe 581 77% 17% 4% 1% 2% 94% 5%Parents' birth2 born country 21903 73% 21% 3% 1% 1% 94% 4%1 country EU 828 72% 22% 3% 2% 2% 94% 5%2EU 816 77% 18% 2% 2% 0% 95% 4%At least 1 outside EU 1052 76% 18% 3% 1% 1% 95% 4%Left-Right scale(1-4) Left 6474 72% 23% 3% 1% 1% 94% 5%(5-6) Centre 7800 75% 19% 3% 1% 1% 95% 4%(7-10) Right 4593 74% 20% 4% 1% 1% 94% 5%Respondant occupation scaleSelf- employed 1937 74% 20% 3% 2% 1% 94% 5%Managers 2320 75% 20% 3% 1% 0% 95% 5%Other white collars 2622 71% 22% 4% 1% 1% 93% 6%Manual workers 4743 73% 21% 4% 1% 1% 94% 5%House persons 2519 71% 24% 2% 2% 1% 95% 4%Unemployed 1758 71% 21% 4% 3% 1% 92% 7%Retired 6184 75% 20% 2% 1% 2% 95% 3%Students 2560 75% 21% 2% 1% 1% 96% 3%Subjective urbanisationRural village 8632 73% 21% 3% 1% 1% 94% 5%Small/ mid size town 9822 75% 20% 3% 1% 1% 95% 4%Large town 6159 71% 23% 4% 1% 1% 94% 5%Smoke-don't smokePacketed cigarettes 6601 65% 26% 6% 2% 1% 90% 8%Roll-your-own cigaret. 1265 60% 27% 8% 3% 2% 87% 11%Cigars or a pipe 337 65% 27% 6% 1% 1% 92% 8%Smoked but have stopped 5185 75% 20% 3% 1% 1% 95% 4%Never smoke 11559 79% 18% 2% 1% 1% 97% 2%Total smoker 7726 64% 26% 6% 2% 2% 90% 8%
To smoke in the presence of a pregnant woman can be very dangerous for the baby
QC12.1 To what extend do you agree or disagree with each of the following statements?

TOTAL Totally agree Tend to agree Tend to disagree Totally disagree DK Agree DisagreeEU25 24642 19% 22% 24% 27% 7% 41% 52%BE 1047 14% 33% 33% 17% 3% 47% 50%CZ 1011 47% 29% 17% 3% 4% 76% 20%DK 1011 13% 22% 27% 32% 6% 35% 59%D-W 1018 17% 13% 23% 45% 2% 30% 68%DE 1528 17% 13% 24% 44% 2% 29% 68%D-E 510 14% 14% 29% 41% 3% 28% 70%EE 1009 17% 11% 23% 43% 6% 28% 66%EL 1000 22% 27% 21% 22% 8% 50% 43%ES 1016 47% 22% 16% 7% 8% 69% 23%FR 1014 11% 17% 24% 42% 6% 28% 66%IE 1000 16% 26% 25% 18% 16% 42% 43%IT 1000 21% 38% 24% 8% 8% 59% 33%CY 502 21% 21% 26% 13% 18% 42% 40%LV 1049 20% 16% 24% 35% 6% 35% 59%LT 1002 15% 14% 24% 37% 10% 29% 61%LU 500 8% 14% 35% 34% 9% 22% 69%HU 1012 21% 19% 26% 30% 4% 39% 56%MT 500 13% 23% 22% 24% 18% 36% 46%NL 1000 8% 17% 32% 34% 9% 25% 66%AT 1012 17% 20% 27% 30% 6% 37% 57%PL 999 12% 21% 29% 28% 11% 32% 56%PT 1000 20% 25% 23% 26% 6% 44% 50%SI 1037 19% 29% 32% 17% 3% 48% 49%SK 1056 15% 16% 30% 34% 5% 31% 64%FI 1003 8% 14% 34% 41% 3% 22% 75%SE 1000 6% 7% 14% 71% 2% 13% 85%UK 1334 16% 26% 26% 20% 12% 42% 46%SexMale 11882 18% 24% 25% 24% 9% 42% 50%Female 12760 20% 21% 24% 30% 6% 41% 53%Age15-24 3758 16% 19% 27% 30% 8% 35% 57%25-39 6538 19% 21% 25% 30% 6% 40% 54%40-54 6299 19% 23% 25% 27% 6% 42% 52%55 + 8047 22% 23% 22% 24% 8% 45% 46%Education (End of)15 5879 24% 25% 22% 22% 8% 48% 44%16-19 9871 18% 22% 25% 27% 7% 40% 53%20+ 5753 17% 21% 26% 31% 6% 37% 57%Still Studying 2560 16% 18% 26% 32% 9% 34% 58%Household composition1 4662 19% 23% 24% 24% 9% 42% 49%2 7495 19% 22% 24% 29% 7% 41% 52%3 4865 22% 22% 23% 27% 6% 44% 50%4+ 7619 18% 22% 26% 28% 7% 40% 53%Place of birthSurveyed country 23083 19% 22% 25% 27% 7% 41% 51%EU 604 17% 16% 26% 33% 8% 33% 59%Europe outside EU 361 26% 16% 23% 30% 5% 42% 53%Outside Europe 581 24% 21% 13% 36% 5% 45% 49%Parents' birth2 born country 21903 19% 23% 24% 26% 7% 42% 51%1 country EU 828 17% 17% 25% 35% 6% 34% 60%2EU 816 16% 16% 25% 36% 7% 32% 61%At least 1 outside EU 1052 20% 18% 23% 33% 6% 38% 56%Left-Right scale(1-4) Left 6474 18% 22% 26% 28% 7% 40% 54%(5-6) Centre 7800 18% 20% 24% 31% 6% 39% 55%(7-10) Right 4593 18% 22% 26% 27% 7% 40% 53%Respondant occupation scaleSelf- employed 1937 21% 23% 25% 23% 7% 44% 49%Managers 2320 15% 20% 27% 34% 4% 35% 61%Other white collars 2622 19% 24% 25% 26% 7% 42% 51%Manual workers 4743 18% 22% 25% 29% 6% 40% 55%House persons 2519 26% 23% 22% 23% 6% 49% 45%Unemployed 1758 18% 20% 23% 30% 9% 38% 53%Retired 6184 21% 24% 23% 24% 9% 45% 47%Students 2560 16% 18% 26% 32% 9% 34% 58%Subjective urbanisationRural village 8632 20% 22% 23% 29% 6% 42% 52%Small/ mid size town 9822 18% 23% 26% 26% 7% 41% 52%Large town 6159 20% 21% 25% 26% 8% 42% 51%Smoke-don't smokePacketed cigarettes 6601 18% 23% 24% 26% 8% 41% 50%Roll-your-own cigaret. 1265 15% 22% 27% 27% 9% 37% 54%Cigars or a pipe 337 14% 28% 23% 28% 8% 41% 50%Smoked but have stopped 5185 17% 23% 27% 27% 7% 40% 53%Never smoke 11559 22% 21% 24% 28% 6% 42% 51%Total smoker 7726 18% 23% 24% 26% 9% 41% 50%
To drink 1 or 2 glasses of wine per day during pregnancy is harmless to the baby
QC12.2 To what extend do you agree or disagree with each of the following statements?

TOTAL Yes NoEU25 12970 83% 17%BE 535 82% 18%CZ 509 77% 23%DK 620 94% 6%D-W 556 82% 18%DE 846 82% 18%D-E 299 80% 20%EE 483 43% 57%EL 583 69% 31%ES 521 89% 11%FR 545 89% 11%IE 496 87% 13%IT 467 86% 14%CY 218 83% 17%LV 519 84% 16%LT 478 51% 49%LU 253 72% 28%HU 497 78% 22%MT 221 89% 11%NL 595 80% 20%AT 586 73% 27%PL 546 78% 22%PT 414 88% 12%SI 461 69% 31%SK 479 76% 24%FI 474 94% 6%SE 525 79% 21%UK 730 87% 13%SexMale 7525 83% 17%Female 5445 84% 16%Age15-24 1646 85% 15%25-39 3738 84% 16%40-54 3753 84% 16%55 + 3833 82% 18%Education (End of)15 2975 79% 21%16-19 5839 84% 16%20+ 3001 87% 13%Still Studying 924 84% 16%Household composition1 2459 81% 19%2 4089 84% 16%3 2648 87% 13%4+ 3773 83% 17%Place of birthSurveyed country 12188 84% 16%EU 316 78% 22%Europe outside EU 180 73% 27%Outside Europe 274 81% 19%Parents' birth2 born country 11572 84% 16%1 country EU 450 80% 20%2EU 433 81% 19%At least 1 outside EU 498 83% 17%Left-Right scale(1-4) Left 3703 85% 15%(5-6) Centre 4143 84% 16%(7-10) Right 2437 83% 17%Respondant occupation scaleSelf- employed 1116 85% 15%Managers 1175 83% 17%Other white collars 1382 86% 14%Manual workers 2982 85% 15%House persons 976 83% 17%Unemployed 1201 83% 17%Retired 3213 81% 19%Students 924 84% 16%Subjective urbanisationRural village 4429 82% 18%Small/ mid size town 5039 84% 16%Large town 3491 84% 16%SmokePacketed cigarettes 6601 85% 15%Roll-your-own cigaret. 1265 87% 13%Cigars or a pipe 337 84% 16%Total smoker 7726 85% 15%
(IF 'SMOKERS' OR 'FORMER SMOKERS', CODE 1, 2, 3, 4 OR 5 IN QC1)QC13 Do you remember hearing or seeing any tobacco campaign encouraging people to quit smoking?
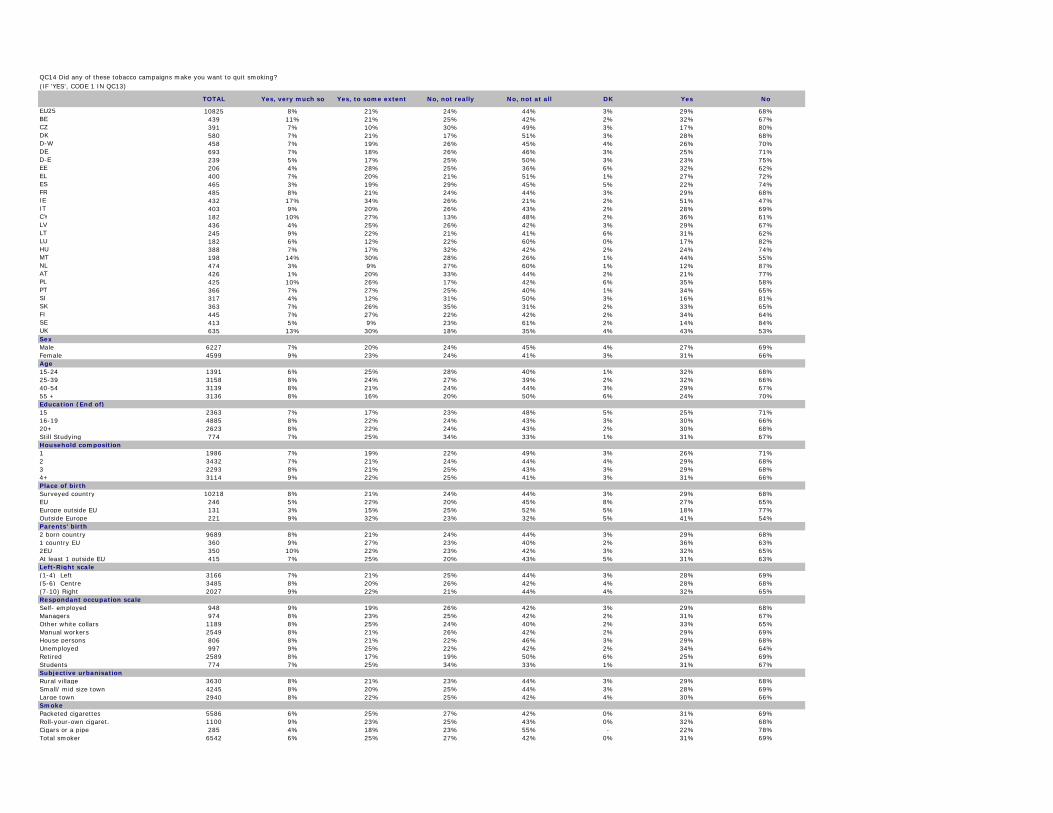
TOTAL Yes, very much so Yes, to some extent No, not really No, not at all DK Yes No
EU25 10825 8% 21% 24% 44% 3% 29% 68%BE 439 11% 21% 25% 42% 2% 32% 67%CZ 391 7% 10% 30% 49% 3% 17% 80%DK 580 7% 21% 17% 51% 3% 28% 68%D-W 458 7% 19% 26% 45% 4% 26% 70%DE 693 7% 18% 26% 46% 3% 25% 71%D-E 239 5% 17% 25% 50% 3% 23% 75%EE 206 4% 28% 25% 36% 6% 32% 62%EL 400 7% 20% 21% 51% 1% 27% 72%ES 465 3% 19% 29% 45% 5% 22% 74%FR 485 8% 21% 24% 44% 3% 29% 68%IE 432 17% 34% 26% 21% 2% 51% 47%IT 403 9% 20% 26% 43% 2% 28% 69%CY 182 10% 27% 13% 48% 2% 36% 61%LV 436 4% 25% 26% 42% 3% 29% 67%LT 245 9% 22% 21% 41% 6% 31% 62%LU 182 6% 12% 22% 60% 0% 17% 82%HU 388 7% 17% 32% 42% 2% 24% 74%MT 198 14% 30% 28% 26% 1% 44% 55%NL 474 3% 9% 27% 60% 1% 12% 87%AT 426 1% 20% 33% 44% 2% 21% 77%PL 425 10% 26% 17% 42% 6% 35% 58%PT 366 7% 27% 25% 40% 1% 34% 65%SI 317 4% 12% 31% 50% 3% 16% 81%SK 363 7% 26% 35% 31% 2% 33% 65%FI 445 7% 27% 22% 42% 2% 34% 64%SE 413 5% 9% 23% 61% 2% 14% 84%UK 635 13% 30% 18% 35% 4% 43% 53%SexMale 6227 7% 20% 24% 45% 4% 27% 69%Female 4599 9% 23% 24% 41% 3% 31% 66%Age15-24 1391 6% 25% 28% 40% 1% 32% 68%25-39 3158 8% 24% 27% 39% 2% 32% 66%40-54 3139 8% 21% 24% 44% 3% 29% 67%55 + 3136 8% 16% 20% 50% 6% 24% 70%Education (End of)15 2363 7% 17% 23% 48% 5% 25% 71%16-19 4885 8% 22% 24% 43% 3% 30% 66%20+ 2623 8% 22% 24% 43% 2% 30% 68%Still Studying 774 7% 25% 34% 33% 1% 31% 67%Household composition1 1986 7% 19% 22% 49% 3% 26% 71%2 3432 7% 21% 24% 44% 4% 29% 68%3 2293 8% 21% 25% 43% 3% 29% 68%4+ 3114 9% 22% 25% 41% 3% 31% 66%Place of birthSurveyed country 10218 8% 21% 24% 44% 3% 29% 68%EU 246 5% 22% 20% 45% 8% 27% 65%Europe outside EU 131 3% 15% 25% 52% 5% 18% 77%Outside Europe 221 9% 32% 23% 32% 5% 41% 54%Parents' birth2 born country 9689 8% 21% 24% 44% 3% 29% 68%1 country EU 360 9% 27% 23% 40% 2% 36% 63%2EU 350 10% 22% 23% 42% 3% 32% 65%At least 1 outside EU 415 7% 25% 20% 43% 5% 31% 63%Left-Right scale(1-4) Left 3166 7% 21% 25% 44% 3% 28% 69%(5-6) Centre 3485 8% 20% 26% 42% 4% 28% 68%(7-10) Right 2027 9% 22% 21% 44% 4% 32% 65%Respondant occupation scaleSelf- employed 948 9% 19% 26% 42% 3% 29% 68%Managers 974 8% 23% 25% 42% 2% 31% 67%Other white collars 1189 8% 25% 24% 40% 2% 33% 65%Manual workers 2549 8% 21% 26% 42% 2% 29% 69%House persons 806 8% 21% 22% 46% 3% 29% 68%Unemployed 997 9% 25% 22% 42% 2% 34% 64%Retired 2589 8% 17% 19% 50% 6% 25% 69%Students 774 7% 25% 34% 33% 1% 31% 67%Subjective urbanisationRural village 3630 8% 21% 23% 44% 3% 29% 68%Small/ mid size town 4245 8% 20% 25% 44% 3% 28% 69%Large town 2940 8% 22% 25% 42% 4% 30% 66%SmokePacketed cigarettes 5586 6% 25% 27% 42% 0% 31% 69%Roll-your-own cigaret. 1100 9% 23% 25% 43% 0% 32% 68%Cigars or a pipe 285 4% 18% 23% 55% - 22% 78%Total smoker 6542 6% 25% 27% 42% 0% 31% 69%
(IF 'YES', CODE 1 IN QC13)QC14 Did any of these tobacco campaigns make you want to quit smoking?

Technical note

SPECIAL EUROBAROMETER N°239 « Attitudes of Europeans towards tobacco »
TECHNICAL SPECIFICATIONS Between the 2nd of September and the 6th of October 2005, TNS Opinion & Social, a consortium created between Taylor Nelson Sofres and EOS Gallup Europe, carried out wave 64.1 of the EUROBAROMETER, on request of the EUROPEAN COMMISSION, Directorate-General Press and Communication, Opinion Polls. The SPECIAL EUROBAROMETER N°239 is part of wave 64.1 and covers the population of the respective nationalities of the European Union Member States, resident in each of the Member States and aged 15 years and over. The basic sample design applied in all states is a multi-stage, random (probability) one. In each country, a number of sampling points was drawn with probability proportional to population size (for a total coverage of the country) and to population density. In order to do so, the sampling points were drawn systematically from each of the "administrative regional units", after stratification by individual unit and type of area. They thus represent the whole territory of the countries surveyed according to the EUROSTAT NUTS II (or equivalent) and according to the distribution of the resident population of the respective nationalities in terms of metropolitan, urban and rural areas. In each of the selected sampling points, a starting address was drawn, at random. Further addresses (every Nth address) were selected by standard "random route" procedures, from the initial address. In each household, the respondent was drawn, at random (following the "closest birthday rule"). All interviews were conducted face-to-face in people's homes and in the appropriate national language. As far as the data capture is concerned, CAPI (Computer Assisted Personal Interview) was used in those countries where this technique was available.
ABREVIATIONS
COUNTRIES INSTITUTES N°
INTERVIEWS FIELDWORK
DATES POPULATION
15+ BE Belgium TNS Dimarso 1.047 07/09/2005 03/10/2005 8.598.982 CZ Czech Rep. TNS Aisa 1.011 07/09/2005 29/09/2005 8.571.710 DK Denmark TNS Gallup DK 1.011 08/09/2005 06/10/2005 4.380.063 DE Germany TNS Infratest 1.528 07/09/2005 30/09/2005 64.174.295 EE Estonia Emor 1.009 09/09/2005 03/10/2005 887.094 EL Greece TNS ICAP 1.000 05/09/2005 03/10/2005 8.674.230 ES Spain TNS Demoscopia 1.016 08/09/2005 04/10/2005 35.882.820 FR France TNS Sofres 1.014 05/09/2005 03/10/2005 44.010.619 IE Ireland TNS MRBI 1.000 06/09/2005 05/10/2005 3.089.775 IT Italy TNS Abacus 1.000 11/09/2005 03/10/2005 49.208.000 CY Rep. of Cyprus Synovate 502 05/09/2005 03/10/2005 552.213 LV Latvia TNS Latvia 1.049 07/09/2005 03/10/2005 1.394.351 LT Lithuania TNS Gallup Lithuania 1.002 07/09/2005 29/09/2005 2.803.661 LU Luxembourg TNS ILReS 500 03/09/2005 28/09/2005 367.199 HU Hungary TNS Hungary 1.012 14/09/2005 03/10/2005 8.503.379 MT Malta MISCO 500 05/09/2005 30/09/2005 322.917 NL Netherlands TNS NIPO 1.000 07/09/2005 03/10/2005 13.242.328
AT Austria Österreichisches Gallup-Institute 1.012 08/09/2005 03/10/2005 6.679.444
PL Poland TNS OBOP 999 07/09/2005 03/10/2005 31.610.437 PT Portugal TNS EUROTESTE 1.000 08/09/2005 06/10/2005 8.080.915 SI Slovenia RM PLUS 1.037 04/09/2005 03/10/2005 1.663.869 SK Slovakia TNS AISA SK 1.056 07/09/2005 22/09/2005 4.316.438 FI Finland TNS Gallup Oy 1.004 08/09/2005 03/10/2005 4.279.286 SE Sweden TNS GALLUP 1.000 07/09/2005 04/10/2005 7.376.680 UK United Kingdom TNS UK 1.334 02/09/2005 03/10/2005 47.685.578
TOTAL 24.643 02/09/2005 06/10/2005 366.356.283

For each country a comparison between the sample and the universe was carried out. The Universe description was derived from Eurostat population data or from national statistics offices. For all countries surveyed, a national weighting procedure, using marginal and intercellular weighting, was carried out based on this Universe description. In all countries, gender, age, region and size of locality were introduced in the iteration procedure. For international weighting (i.e. EU averages), TNS Opinion & Social applies the official population figures as provided by EUROSTAT or national statistic offices. The total population figures for input in this post-weighting procedure are listed above. Readers are reminded that survey results are estimations, the accuracy of which, everything being equal, rests upon the sample size and upon the observed percentage. With samples of about 1,000 interviews, the real percentages vary within the following confidence limits:
Observed percentages 10% or 90% 20% or 80% 30% or 70% 40% or 60% 50%
Confidence limits ± 1.9 points ± 2.5 points ± 2.7 points ± 3.0 points ± 3.1 points
Remark : Due to a problem in the translation of question 5 in Spain, people interviewed in September and October were re-contacted in order to put this question to them once again. The Spanish results presented in this report for this question are those observed during this recall.
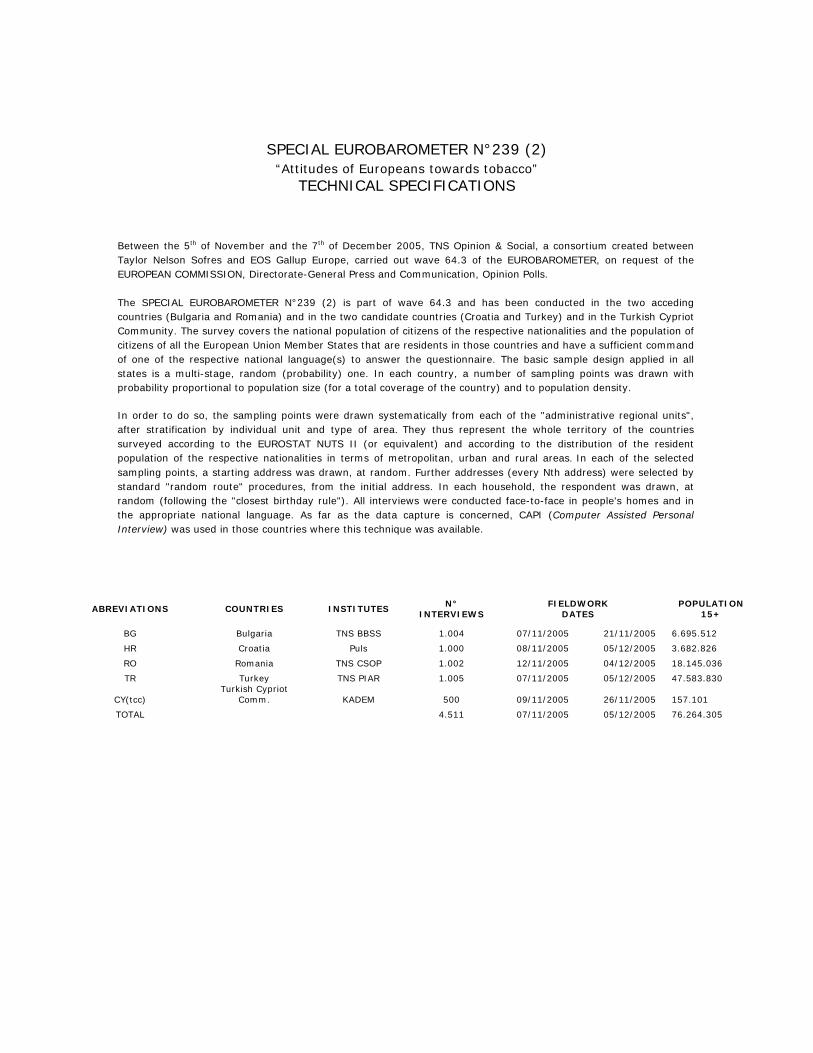
SPECIAL EUROBAROMETER N°239 (2)
“Attitudes of Europeans towards tobacco” TECHNICAL SPECIFICATIONS
Between the 5th of November and the 7th of December 2005, TNS Opinion & Social, a consortium created between Taylor Nelson Sofres and EOS Gallup Europe, carried out wave 64.3 of the EUROBAROMETER, on request of the EUROPEAN COMMISSION, Directorate-General Press and Communication, Opinion Polls. The SPECIAL EUROBAROMETER N°239 (2) is part of wave 64.3 and has been conducted in the two acceding countries (Bulgaria and Romania) and in the two candidate countries (Croatia and Turkey) and in the Turkish Cypriot Community. The survey covers the national population of citizens of the respective nationalities and the population of citizens of all the European Union Member States that are residents in those countries and have a sufficient command of one of the respective national language(s) to answer the questionnaire. The basic sample design applied in all states is a multi-stage, random (probability) one. In each country, a number of sampling points was drawn with probability proportional to population size (for a total coverage of the country) and to population density. In order to do so, the sampling points were drawn systematically from each of the "administrative regional units", after stratification by individual unit and type of area. They thus represent the whole territory of the countries surveyed according to the EUROSTAT NUTS II (or equivalent) and according to the distribution of the resident population of the respective nationalities in terms of metropolitan, urban and rural areas. In each of the selected sampling points, a starting address was drawn, at random. Further addresses (every Nth address) were selected by standard "random route" procedures, from the initial address. In each household, the respondent was drawn, at random (following the "closest birthday rule"). All interviews were conducted face-to-face in people's homes and in the appropriate national language. As far as the data capture is concerned, CAPI (Computer Assisted Personal Interview) was used in those countries where this technique was available.
ABREVIATIONS COUNTRIES INSTITUTES N° INTERVIEWS
FIELDWORK DATES
POPULATION 15+
BG Bulgaria TNS BBSS 1.004 07/11/2005 21/11/2005 6.695.512
HR Croatia Puls 1.000 08/11/2005 05/12/2005 3.682.826
RO Romania TNS CSOP 1.002 12/11/2005 04/12/2005 18.145.036
TR Turkey TNS PIAR 1.005 07/11/2005 05/12/2005 47.583.830
CY(tcc) Turkish Cypriot
Comm. KADEM 500 09/11/2005 26/11/2005 157.101
TOTAL 4.511 07/11/2005 05/12/2005 76.264.305

For each country a comparison between the sample and the universe was carried out. The Universe description was derived from Eurostat population data or from national statistics offices. For all countries surveyed, a national weighting procedure, using marginal and intercellular weighting, was carried out based on this Universe description. In all countries, gender, age, region and size of locality were introduced in the iteration procedure. For international weighting (i.e. EU averages), TNS Opinion & Social applies the official population figures as provided by EUROSTAT or national statistic offices. The total population figures for input in this post-weighting procedure are listed above. Readers are reminded that survey results are estimations, the accuracy of which, everything being equal, rests upon the sample size and upon the observed percentage. With samples of about 1,000 interviews, the real percentages vary within the following confidence limits:
Observed percentages 10% or 90% 20% or 80% 30% or 70% 40% or 60% 50%
Confidence limits ± 1.9 points ± 2.5 points ± 2.7 points ± 3.0 points ± 3.1 points
Remark : Due to a problem in the Bulgarian translation of question 5, this question was asked once again in Bulgaria in a Eurobarometer survey which took place between December 2005 and January 2006 (EUROBAROMETRE 64.4). The results shown for this country in the report were collected during the 64.4 wave.

Questionnaire

QC1
1,2,3,4,5,6,7,8,
QC2
123
OccasionallyDK
EB58.2 Q3 TREND MODIFIED
Do you smoke regularly, or occasionally?
Regularly
Other (SPONTANEOUS)DK
EB58.2 TREND SLIGHTLY MODIFIED
IF "SMOKERS", CODE 1, 2 OR 3 IN QC1
You smoke cigars or a pipeYou chew tobacco or take snuffYou used to smoke but you have stoppedYou have never smoked
Which of the following applies to you?
(SHOW CARD – READ OUT – MULTIPLE ANSWERS POSSIBLE FOR CODES 1, 2, 3 AND 4)
You smoke packed cigarettesYou smoke roll-up cigarettes
Now moving on another topic.
ASK ALL
MasterbilingueEB641PRESScomplet20050823 40/55 23/08/2005

QC3
123456789
1011
QC4
12345
QC5
123456
It depends (SPONTANEOUS)DK
EB58.2 Q11 TREND
Is harmlessCan cause discomfortCan cause some health problems such as respiratory problemsCan even, in the long term, cause serious illnesses such as cancer
EB58.2 Q7 TREND MODIFIED
Do you think that, for the non-smoker, other people's smoke…?
(SHOW CARD – READ OUT – ONE ANSWER ONLY)
OftenSometimesNeverDK
Do you ever ask a smoker not to smoke near you because it bothers you?
(READ OUT – ONE ANSWER ONLY)
Always
No, do not smoke every dayDK
EB58.2 Q4 TREND
ASK ALL
Yes, 25 to 29 cigarettes a dayYes, 30 to 34 cigarettes a dayYes, 35 to 39 cigarettes a dayYes, 40 or more cigarettes a day
Yes, 5 to 9 cigarettes a dayYes, 10 to 14 cigarettes a dayYes, 15 to 19 cigarettes a dayYes, 20 to 24 cigarettes a day
Do you smoke every day? (IF YES) How many cigarettes a day do you smoke?
(SHOW CARD – READ OUT – ONE ANSWER ONLY)
Yes, less than 5 cigarettes a day
IF "CIGARETTE SMOKERS, INCLUDING ROLL-UP", CODES 1 OR 2 IN QC1
MasterbilingueEB641PRESScomplet20050823 41/55 23/08/2005

QC6
123
QC7
123
QC8
123
4
EB64.1 NEW
4 5
Any indoor public space (metro, airports, shops, etc.)
1 2 3 4 5
Offices, and other indoor workplaces
1 2 3
4 5Bars or Pubs 1 2 3 4 5Restaurants 1 2 3
Are you in favour of smoking bans in the following places?
(SHOW CARD – ONE ANSWER PER LINE)
(READ OUT) Totally in favour
Somewhat in favour
Somewhat opposed
Totally opposed
DK
4
EB64.1 NEW
ASK ALL
In the company of children 1 2 3
4In the company of non-smokers 1 2 3 4When you are alone 1 2 3
Do you smoke when you are in a car…?
(ONE ANSWER PER LINE)
(READ OUT) Yes No It depends (SPONTANEOUS)
DK
NoDK
EB43 TREND
Do you smoke at home?
Yes
IF "SMOKERS", CODE 1, 2 OR 3 IN QC1
MasterbilingueEB641PRESScomplet20050823 42/55 23/08/2005
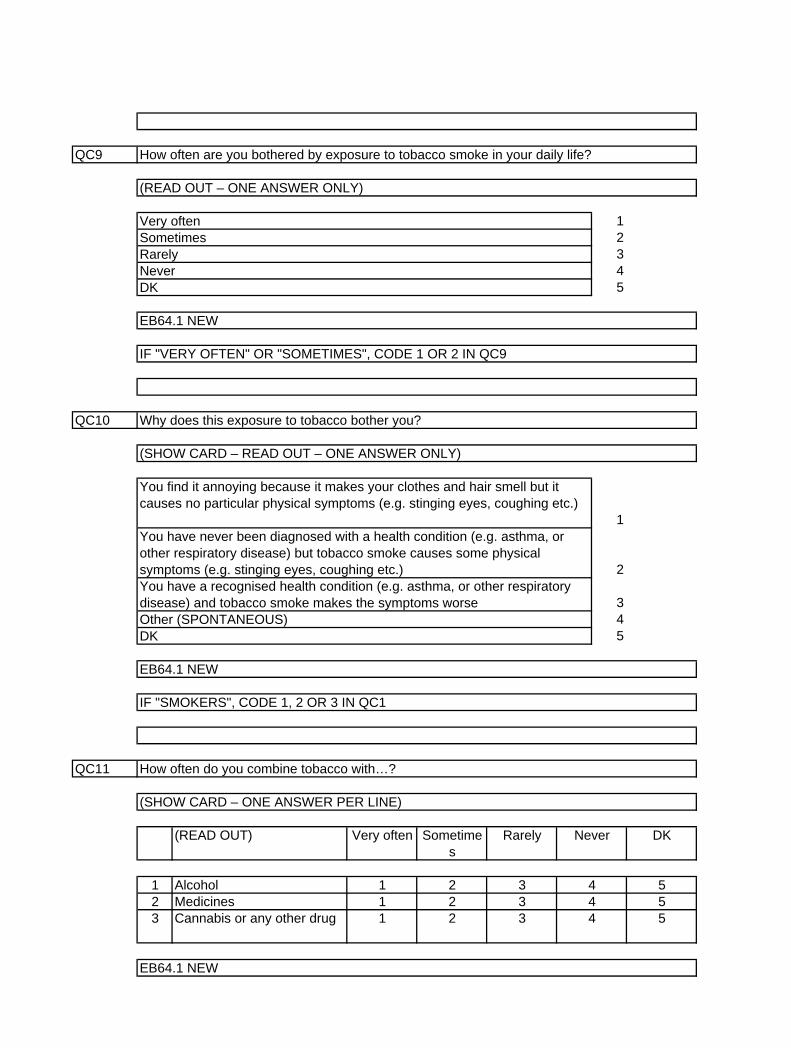
QC9
12345
QC10
1
2
345
QC11
123
EB64.1 NEW
4 5Cannabis or any other drug 1 2 3 4 5Medicines 1 2 3
Never DK
Alcohol 1 2 3 4 5
(READ OUT) Very often Sometimes
Rarely
IF "SMOKERS", CODE 1, 2 OR 3 IN QC1
How often do you combine tobacco with…?
(SHOW CARD – ONE ANSWER PER LINE)
You have a recognised health condition (e.g. asthma, or other respiratory disease) and tobacco smoke makes the symptoms worseOther (SPONTANEOUS)DK
EB64.1 NEW
Why does this exposure to tobacco bother you?
(SHOW CARD – READ OUT – ONE ANSWER ONLY)
You find it annoying because it makes your clothes and hair smell but it causes no particular physical symptoms (e.g. stinging eyes, coughing etc.)
You have never been diagnosed with a health condition (e.g. asthma, or other respiratory disease) but tobacco smoke causes some physical symptoms (e.g. stinging eyes, coughing etc.)
DK
EB64.1 NEW
IF "VERY OFTEN" OR "SOMETIMES", CODE 1 OR 2 IN QC9
Very oftenSometimesRarelyNever
How often are you bothered by exposure to tobacco smoke in your daily life?
(READ OUT – ONE ANSWER ONLY)
MasterbilingueEB641PRESScomplet20050823 43/55 23/08/2005

QC12
1
2
QC13
12
QC14
12345DK
EB64.1 NEW
Yes, very much soYes, to some extentNo, not reallyNo, not at all
IF "YES", CODE 1 IN QC13
Did any of these tobacco campaigns make you want to quit smoking?
(READ OUT – ONE ANSWER ONLY)
YesNo
EB64.1 NEW
EB64.1 NEW
IF "SMOKERS" OR "FORMER SMOKERS", CODE 1, 2, 3, 4 or 5 IN QC1
Do you remember hearing or seeing any tobacco campaign encouraging people to quit smoking?
4 5
To drink 1 or 2 glasses of wine per day during pregnancy is harmless to the baby
1 2 3 4 5
To smoke in the presence of a pregnant woman can be very dangerous for the baby
1 2 3
(SHOW CARD – ONE ANSWER PER LINE)
(READ OUT) Totally agree
Tend to agree
Tend to disagree
Totally disagree
DK
ASK ALL
To what extend do you agree or disagree with each of the following statements?
MasterbilingueEB641PRESScomplet20050823 44/55 23/08/2005
D1
1 2 3 4 5 6 7 8 9 10
11
12
D7
123456789
10
D8 How old were you when you stopped full-time education?
(INT.: IF "STILL STUDYING", CODE ‘00’)
EB63.4 D8
WidowedOther (SPONTANEOUS)Refusal (SPONTANEOUS)
EB63.4 D7
Unmarried, having never lived with a partnerUnmarried, having previously lived with a partner, but now on my ownDivorcedSeparated
(SHOW CARD - READ OUT - ONE ANSWER ONLY)
MarriedRemarriedUnmarried, currently living with partner
DK
EB63.4 D1
NO QUESTIONS D2 TO D6
Could you give me the letter which corresponds best to your own current situation?
(SHOW CARD) - (INT.: DO NOT PROMPT - IF CONTACT HESITATES, TRY AGAIN)
Left Right
Refusal
DEMOGRAPHICS
ASK ALL
In political matters people talk of "the left" and "the right".How would you place your views on this scale?
MasterbilingueEB641PRESScomplet20050823 51/55 23/08/2005

D10
12
D11
D25
1234
D40a
D40b Could you tell me how many children less than 10 years old live in your household?
INT.: READ OUT - WRITE DOWN)
EB63.4 D40b
NO QUESTIONS D26 TO D39
Could you tell me how many people aged 15 years or more live in your household, yourself included?
INT.: READ OUT - WRITE DOWN)
EB63.4 D40a
Small or middle sized townLarge townDK
EB63.4 D25
NO QUESTIONS D16 TO D24
Would you say you live in a...?
(READ OUT)
Rural area or village
How old are you?
EB63.4 D11
NO QUESTION D12 TO D14
D15 a&b ASKED BEFORE Q1
Gender.
MaleFemale
EB63.4 D10
NO QUESTION D9
MasterbilingueEB641PRESScomplet20050823 52/55 23/08/2005

D40c
D41
123456
D42
1
2
345
D43a
D43b
No 2 2
EB63.4 D43a D43b
Fixed MobileYes 1 1
Do you own a mobile telephone?
D43a D43b
Another situation (SPONTANEOUS) (M)DK/Refusal (SPONTANEOUS)
EB63.4 D42
Do you own a fixed telephone?
(SHOW CARD - READ OUT - ONE ANSWER ONLY)
Your mother and your father were born in (OUR COUNTRY)One of your parents was born in (OUR COUNTRY) and the other was born in another Member State of the European UnionYour mother and your father were born in another Member State of the European Union
In Northern America, in Japan or in OceaniaRefusal (SPONTANEOUS)
EB63.4 D41
Which of these proposals corresponds to your situation?
In (OUR COUNTRY)In another Member Country of the European UnionIn Europe, but not in a Member Country of the European UnionIn Asia, in Africa or in Latin America
INT.: READ OUT - WRITE DOWN)
EB63.4 D40c
You personally, were you born…?
(SHOW CARD - READ OUT - ONE ANSWER ONLY)
Could you tell me how many children aged 10 to 14 years old live in your household?
MasterbilingueEB641PRESScomplet20050823 53/55 23/08/2005

P1
P2
P3
P4
1234
P5
1234
P6 Size of locality
(LOCAL CODES)
EB63.4 P6
FairAverageBad
EB63.4 P5
Five or more
EB63.4 P4
Respondent cooperation
Excellent
Number of persons present during the interview, including interviewer
Two (interviewer and respondent)ThreeFour
EB63.4 P2
NUMBER OF MINUTES THE INTERVIEW LASTED
MINUTES
EB63.4 P3
EB63.4 P1
TIME OF THE BEGINNING OF THE INTERVIEW
(INT.:USE 24 HOUR CLOCK)
HOUR MINUTES
INTERVIEW PROTOCOLE
DATE OF INTERVIEW
DAY MONTH
MasterbilingueEB641PRESScomplet20050823 54/55 23/08/2005
P7
P8
P9
P10
P11
P13
123
Language 1Language 2Language 3
EB63.4 P13
Weighting factor
EB63.4 P11
ASK ONLY in LU, BE, ES, FI, EE, LV, MT and TR
Language of interview
Sample point number
EB63.4 P9
Interviewer number
EB63.4 P10
(LOCAL CODES)
EB63.4 P7
Postal code
EB63.4 P8
Region
MasterbilingueEB641PRESScomplet20050823 55/55 23/08/2005