Embed Size (px)
Citation preview
The Gallup Organization Flash EB No206b � EU Transport Policy
Analytical Report page 1
Flash Eurobarometer
Attitudes on issues related to EU Transport Policy Analytical report
Fieldwork: May 2007
Report: July 2007
Fla
sh E
uro
ba
rom
ete
r 2
06
b �
Th
e G
allu
p O
rga
niz
atio
n
This survey was requested by Directorate-General for Energy and Transport and coordinated by Directorate General Communication
This document does not represent the point of view of the European Commission.
The interpretations and opinions contained in it are solely those of the authors.
European Commission
id874569437 pdfMachine by Broadgun Software - a great PDF writer! - a great PDF creator! - http://www.pdfmachine.com http://www.broadgun.com

Flash EB No206b � EU Transport Policy The Gallup Organization
page 2
Flash EB Series #206b
Attitudes on issues
related to
EU Transport Policy
Conducted by
The Gallup Organization, Hungary
upon the request of the
Directorate-General for Energy and Transport
Survey organised and managed by the
Eurobarometer Team of Directorate-General
�Communication�
This document does not represent the point of
view of the European Commission.
The interpretations and opinions contained in it
are solely those of the authors.
THE GALLUP ORGANIZATION

The Gallup Organization Flash EB No206b � EU Transport Policy
Analytical Report page 3
Table of contents
Table of contents ..................................................................................................................................... 3
Introduction ............................................................................................................................................. 4
Main findings .......................................................................................................................................... 5
1. Transportation usage patterns.............................................................................................................. 7
1.1. Car usage in the household........................................................................................................... 7 1.2. The main mode of transport for daily activities ........................................................................... 9 1.3. Improvement of public transport to encourage less car usage.................................................... 12
2. Cars and environment........................................................................................................................ 16
2.1. The impact of the type of car people drive and the way they use it on the environment ........... 16 2.2. The best way to reverse the rise of CO2 emission from road transport ..................................... 17 2.3. Actions taken by citizens to save fuel ........................................................................................ 21 2.4. Incentives for using the bio fuel ................................................................................................. 25
3. Traffic situation ................................................................................................................................. 29
3.1. The impact of the type of car people drive and the way they use it on the traffic situation....... 29 3.2. Measures that could improve the traffic situation in the city or nearby ..................................... 31
4. Costs of damaging environment........................................................................................................ 35
4.1. Preparedness to pay more........................................................................................................... 35 4.2. Paying for congestion and environmental damage through road tolls ....................................... 37 4.3. How to spend the collected money............................................................................................. 39
5. Flight safety and passenger rights ..................................................................................................... 41
5.1. Attitudes toward security controls at the airports....................................................................... 41 5.2. Awareness of the rights for air passengers ................................................................................. 45
6. Annex tables...................................................................................................................................... 48
7. Survey details .................................................................................................................................... 75
8. Survey questionnaire ......................................................................................................................... 78

Flash EB No206b � EU Transport Policy The Gallup Organization
page 4
Introduction
The data provided herein are the most important findings of the latest Flash Eurobarometer on "Attitudes on issues related to EU Transport Policy". The study was commissioned by the Directorate-General for Energy & Transport of the European Commission, carried out under the Flash Eurobarometer framework and coordinated by The Gallup Organization. The survey covered all 27 Member States of the European Union on a randomly selected sample of over 25,767 individuals of at least 15 years of age. Telephone interviews were conducted in each country with the exception of the Bulgaria, Czech Republic, Estonia, Latvia, Lithuania, Hungary Poland, Romania and Slovakia where, both telephone and face-to-face interviews were conducted between the 03/05/2007 and the 07/05/2007. More details on the survey are available in the final chapter of this report (see the Survey details). The study was primarily designed to:
o Follow up the car and other transport usage patterns o Understand to what extent citizens link the car type and its usage to the environment and
to the traffic situation
o What people think about the means of improvement of traffic situation
o What people do to decrease the CO2 emissions from road transport
o What are the costs of damaging environment and who should bear them
o What the people think about the security controls at the airports and if they are aware of their rights as air passengers.

The Gallup Organization Flash EB No206b � EU Transport Policy
Analytical Report page 5
Main findings
Methods used for personal mobility Most EU citizens have a car in their household that they are the primary driver of (49%). Those in
the New Member States were significantly more likely to answer that they do not have a car in their household.
Considering the main mode of personal mobility we find that motorized individual transport is the
most widespread in the EU (53%), followed by non motorized individual transport (23%), and the least popular mode is using public (or community) transport (21%). In the Netherlands non motorized individual transport enjoys extreme popularity.
Considering potential changes to the public transportation system that might encourage more
people using it, respondents who primarily use a car think that a better schedule and better connections would be most likely to encourage them to use public transportation and to drive less frequently. 22% of primary car users said that they would not change their attitudes regardless of any changes to the public transportation system.
Cars and environment The vast majority of the EU citizens (about eight out of ten) share the opinion that the type of the
car and the way people use them have an important impact on the environment in the respondent's area.
The best way to reverse the rise of CO2 emissions is to allow only the sales of less polluting
vehicles. Among regular car drivers, the highest proportion tried to save fuel by adapting their driving style.
On an average the citizens in Luxemburg have utilised the most of the listed possible strategies to save fuel during the past year; they were followed by the Germans, the Austrians, the Slovenians, and the Czech. The citizens in Estonia and Cyprus are at the end of this hierarchy of countries.
According to the opinion of the citizens in the EU, the best strategy to encourage the use of bio
fuel is to give tax incentives to make it cheaper. Traffic situation Three in four (74%) EU citizens are of the opinion that the type of the cars and the way people use
them have a significant influence on the traffic situation in their immediate area, as well. Relatively few people, only 6% in the EU, believe that there is no need to improve the traffic
situation in their area. The vast majority (90%) are of the opinion that the traffic situation in their area should be improved. Of this 90%, most (49%) think that a better public transport system is the best way to address this issue. There are fewer people who consider that either introducing limitations in the city centres (17%), or speed limits (17%) could improve the traffic situation, and the ratio of those who think that charges for road usage could contribute to the improvement of the traffic situation is even lower (5%).
Flash EB No206b � EU Transport Policy The Gallup Organization
page 6
Costs of damaging environment A slim majority of EU citizens are prepared to pay more to use less polluting transport (54%), but
only a small minority are ready to pay a more than 10 percent increase (9%). The majority, six out of ten respondents do not agree with the statement that all road users should
pay for congestion and environmental damage through road tolls. Most EU citizens support spending the money collected from road users on the improvement of
public transport (40%). Slightly fewer respondents favour the improvement of road related infrastructures (36%), and using these funds as general public expenditure is the least popular option (17%). Generally, respondents in old Member States are more likely to favour an investment in public transportation, those in newer Member States are more likely to favour the improvement of road-related infrastructures.
Flight safety and passenger rights A large number of the citizens in the EU (38%) responded that they seldom fly, and are thus not
really competent to answer questions concerning security controls at airports. The majority of informed respondents (61%) consider airport security controls appropriate, one quarter (24%) find it insufficient and only 16% think they are excessive.
There are a great proportion of citizens who are not aware of the rights of passengers at airports in
the EU (49%). Among them, 17% said that they were not aware of these rights in spite of the fact that they do travel by plane. At the same time, 46% of the EU citizens were informed about the rights of passengers at airports in EU territory. Citizens not aware of the rights of air passengers in spite of the fact that they travel by plane are more likely to be found in the old than in the newer Member States (20% vs. 6%).

The Gallup Organization Flash EB No206b � EU Transport Policy
Analytical Report page 7
1. Transportation usage patterns
1.1. Car usage in the household Almost half of EU citizens have a car that they are the primary driver of (49%), while 32% of respondents said that they have a car or cars in their households, but that they are not the primary driver. In total, 81% of respondents do have a car in their households, and 19 percent do not.
Car in the household
Q1. Which of the following applies to you?
%, Base: all respondents
49
32
19
There is a car in the Hhold that is
primarily driven by Respondent
There is a car/are cars in the Hhold, but
primarily driven by other family members
There is no car in the Hhold
EU27
The above described traits of car ownership and use � that refer to the EU27 - vary extremely from country to country. Citizens in Cyprus have the overall highest percentage of respondents who have a car at their disposal (67%). The Cypriots are followed by the French, 61% of whom report being the primary driver of their own car. Bulgarian, Slovakian and Romanian respondents are the least likely to be the primary driver of their own automobile (26%, 25% and 22%). The citizens who only have a car in their households that is not driven primarily by them are found in the highest proportions in Slovenia and Luxemburg (both with 43%) and in Greece (42%) while the lowest proportions in this regard are in the United Kingdom (27%), Romania (24%) and Latvia (21%). The highest proportions of those who do not have a car at all in their household are found in Romania (54%), Latvia (48%) and Bulgaria (42%), while the lowest proportions can be observed in Cyprus (6%), Italy and in Luxemburg (both 7%).

Flash EB No206b � EU Transport Policy The Gallup Organization
page 8
Car in the household:
Car is primarily driven by the respondent
6761
56 55 53 53 53 53 52 52 50 50 49 49 49 49 49 48 48 4540
34 34 34 3126 25 22
CY
FR
AT
NL
IT DE
FI
MT
UK
BE IE LU
PT SI
DK
EU
27
EL
SE
ES
CZ
LT
EE
HU
PL
LV
BG
SK
RO
43 43 42 40 40 38 37 36 35 35 35 33 33 33 33 32 32 32 32 31 29 28 28 28 27 27 24 21
SI
LU IE SK IT BE
MT
DK
SE
EL
ES
PL
CZ
LT
AT
PT
EU
27
BG
DE
NL
FI
CY
EE
HU
FR
UK
RO
LV
Car is primarily driven by other family members
5448
4238 38 35 32
2622 21 19 18 18 17 16 15 15 14 14 12 11 10 9 8 8 7 7 6
RO
LV
BG
HU
EE
SK
PL
LT
CZ
UK
EU
27
PT FI
ES
EL
SE
DE
DK
NL
AT
FR
BE
MT SI
IE LU IT CY
There is no car in your household
Q1. Which of the following applies to you?
%, Base: all respondents, by country Those who have their own car (or those who are the primary driver of the household car) are more often men, those aged 25-39 or 40-54, those with the highest educational level, respondents living in rural zones; the self-employed and the employees, and are less likely to be women, the youngest, those still in education, those living in cities, or those who are not working. Those respondents whose household has a car that they are not the primary driver of show almost the opposite pattern; those in this group are more likely to be women, the youngest generation, those still completing education, and those who are not working. Men, the oldest generations and those aged 25-39, those with the highest levels of education, and manual workers are less likely to report that their household has a car that is primarily driven by other family members. Considering levels of urbanization we observe slight differences; those living in other cities or urban centres, and those in rural zones are more likely to choose the latter answer option than those living in metropolitan areas. Considering the socio-demographic patterns of those respondents who do not have a car in their household, this trait is most likely to be found among women, the oldest generation, those with the lowest levels of educational, residents in metropolitan areas and those without professional activity. It is less likely to find this trait among men, those aged 40-54, those with the highest levels of educational (or still completing education), those in rural zones, and the self-employed and employees.

The Gallup Organization Flash EB No206b � EU Transport Policy
Analytical Report page 9
We formed two groups for analysing the further results regarding car usage in households, primary car users and others. Within the others those who have a car in their household that they are not the primary driver of significantly outnumber those who do not have a car in their household at all (63% compared to 37%).
EU27
GENDER
Male
Female
AGE GROUP
15 - 24
25 - 39
40 - 54
55+
EDUCATION (END OF)
-15
16 - 20
20+
Still in education
SUBJECTIVE URBANIZATION
Metropolitan zone
Other town/urban centre
Rural zone
OCCUPATION
Self-employee
Employees
Manual worker
Not working
DRIVE
Primarily driven car
Other
Car in the household
Q1. Which of the following applies to you?
%, Base: all respondents, by demography
49
5840
23
58
5648
40
53
6121
46
4753
6361
5636
100
0
32
2638
59
26
3126
30
28
2665
29
3333
2727
2438
0
63
19
1622
18
16
1327
29
19
1314
24
2015
1011
2126
0
37
Car is primarily driven
by the respondent
Car is primarily driven by
other family members
There is no car in your
household
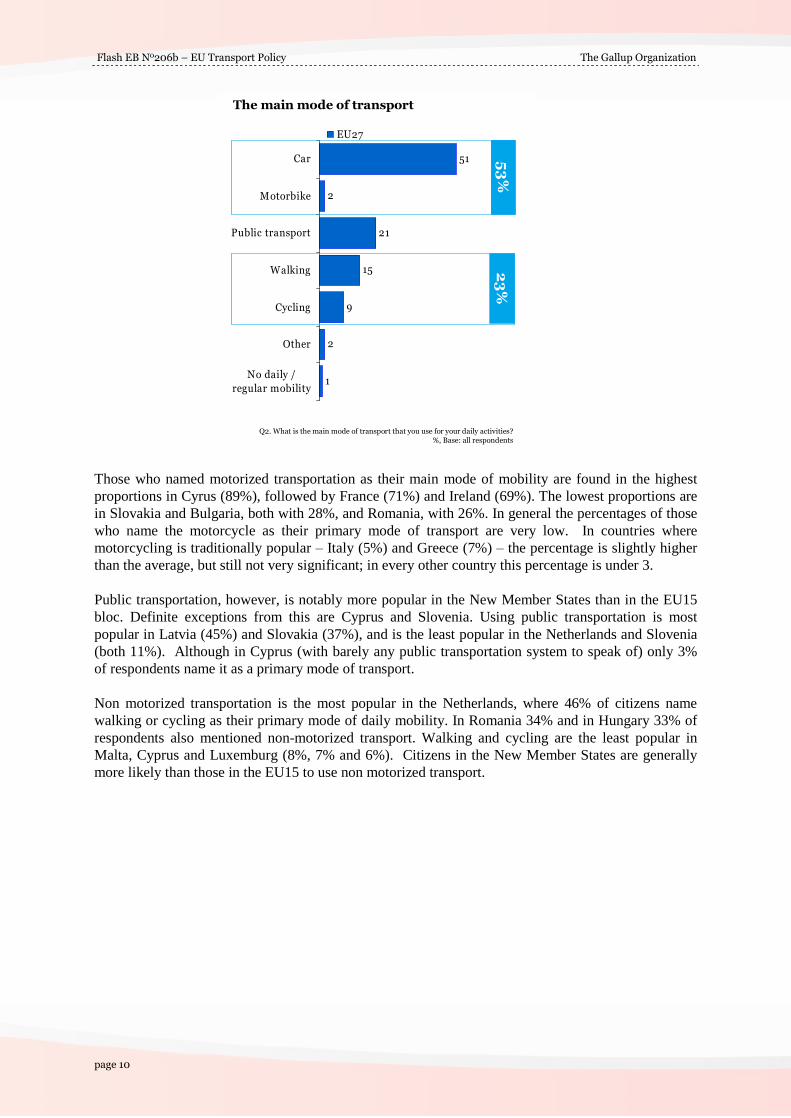
1.2. The main mode of transport for daily activities The majority of EU citizens named the car as their main mode of transport (51%). The second most popular mode of transportation for daily activities is public transport (21%), followed by walking (15%). The least popular choice is the motorbike, mentioned by only 2 percent of respondents as their primary mode of transportation. 2% found other means of transportation, and 1% did not provide an answer to this question. We classified the means of transport into three major groups. Together the car and the motorbike are motorized individual transportation, walking and cycling are the non motorized individual transportation means, and public transportation alone is the third group. The largest of these groups is motorized individual transportation, comprised of 53% of respondents, followed by the 23% using non motorized individual transportation, and the least populous group is that of public transportation users (21%).
Flash EB No206b � EU Transport Policy The Gallup Organization
page 10
51
2
21
15
9
2
1
Car
Motorbike
Public transport
Walking
Cycling
Other
No daily /
regular mobility
EU27
The main mode of transport
Q2. What is the main mode of transport that you use for your daily activities?
%, Base: all respondents
23
%5
3%
Those who named motorized transportation as their main mode of mobility are found in the highest proportions in Cyrus (89%), followed by France (71%) and Ireland (69%). The lowest proportions are in Slovakia and Bulgaria, both with 28%, and Romania, with 26%. In general the percentages of those who name the motorcycle as their primary mode of transport are very low. In countries where motorcycling is traditionally popular � Italy (5%) and Greece (7%) � the percentage is slightly higher than the average, but still not very significant; in every other country this percentage is under 3. Public transportation, however, is notably more popular in the New Member States than in the EU15 bloc. Definite exceptions from this are Cyprus and Slovenia. Using public transportation is most popular in Latvia (45%) and Slovakia (37%), and is the least popular in the Netherlands and Slovenia (both 11%). Although in Cyprus (with barely any public transportation system to speak of) only 3% of respondents name it as a primary mode of transport. Non motorized transportation is the most popular in the Netherlands, where 46% of citizens name walking or cycling as their primary mode of daily mobility. In Romania 34% and in Hungary 33% of respondents also mentioned non-motorized transport. Walking and cycling are the least popular in Malta, Cyprus and Luxemburg (8%, 7% and 6%). Citizens in the New Member States are generally more likely than those in the EU15 to use non motorized transport.

The Gallup Organization Flash EB No206b � EU Transport Policy
Analytical Report page 11
The main mode of transport:
Motorized individual transport (car and motorbike)
89
71 69 67 66 63 61 60 60 59 58 57 57 56 5348 48 47 44 43 43 41 38
30 30 28 28 26
88
69
69
66
65
63
58
55
59
58
56
56
57
55
51
42
47
45
44
41
42
40
37
30
28
28
28
26
CY
FR IE SI
MT
LU
BE
IT FI
UK
PT
AT
DK
DE
EU
27
EL
SE
ES
LT
PL
CZ
NL
EE
LV
HU
SK
BG
RO
Car and motorbike Car Motorbike
Public transport
4537 35 35 35 34
30 30 30 3026 26 25 24 21 20 18 18 17 16 16 15 14 13 12 11 11
3
LV
SK
BG
CZ
EE
HU
RO
ES
LU
LT
EL
PL
PT
MT
EU
27
AT
IT UK
SE
BE
FR
DE
IE DK
FI
NL SI
CY
Public transport
Not motorized individual transport (walking and cycling)
46
34 33 31 30 29 29 28 26 26 24 23 23 23 23 22 21 21 20 20 20 20 16 14 128 7 6
32 15 14 28 21 17 4 14 19 15 16 17 20 21 10 13 15 17 6 15 15 12 7 6 5
403
18 173
9 1123 16 12 5 9 7 6 3 2
11 8 314
5 1 2 31
6 10 9
NL
RO
HU
SE
BG
SK
PL
DK
DE
FI
EE
EU
27
LT
LV
EL
ES
AT SI
IT UK
BE
CZ
PT IE FR
MT
CY
LU
Walking and cycling Walking Cycling
Q2. What is the main mode of transport that you use for your daily activities?
%, Base: all respondents, by country We find that those in the motorized individual transportation group (basically car) are more likely to be men, aged 25-39 and 40-54, those with the highest level of education, in rural zones and the self-employed. Women, the youngest generation, those still completing education, citizens in metropolitan areas and those without professional activity are less likely to be in this group. Public transport is more likely to be used by women, the youngest generation, those still in school, residents of metropolitan areas and those who do not have a car at their disposal. It is less often used by men, those aged 40-54, those living in a rural zone, the self-employed and obviously, the �primary car users".
Non motorized individual transportation � walking and cycling � is more popular among the socio-demographic groups of women, the oldest generation, those with the lowest level of education, citizens in other cities, those without any professional activity, those who do not have a car, and those who are not the primary driver of their household car. Men those aged 25-39, those with the highest level of education, those living in rural zones or metropolitan areas, the self-employed, employees and primary car users are less likely to choose this form of transportation.

Flash EB No206b � EU Transport Policy The Gallup Organization
page 12
Table 1. The main mode of transport (%, by demography)
Motorized
individual
transport
Public
transport
Non motorized
individual
transport
Other
No daily /
regular
mobility
EU27 53 21 15 2 1
SEX
Male 61 18 10 2 1
Female 47 23 19 1 1
AGE
15 - 24 35 39 14 2 0
25 - 39 64 17 11 1 0
40 - 54 63 14 13 1 1
55 + 46 21 19 2 2
EDUCATION (end of)
Until 15 years of
age 45 19 20 3 3
16 - 20 59 17 14 1 1
20 + 62 18 11 1 0
Still in education 32 41 15 2 0
SUBJECTIVE URBANIZATION
Metropolitan area 42 35 13 1 1
Other towns 49 21 19 1 1
Rural zones 64 13 12 2 2
OCCUPATION
Self-employed 72 10 9 3 1
Employee 66 17 9 1 0
Manual worker 64 16 11 2 0
Not working 40 26 20 2 2
DRIVE
Primarily driven
car 78 7 8 1 0
Other 29 34 21 2 2
Q2. What is the main mode of transport that you use for your daily activities?
1.3. Improvement of public transport to encourage less car usage Supposing that public transport can be popularized by better service, we asked those citizens who primarily use their car for daily mobility about what improvements to public transportation might encourage them to drive less often. The two most popular answers were better schedule (regularity and operating hours) (29%) and better connections to regular destinations (28%) . 12% of primary car users said that stops should be closer to their residence, while only 6% are concerned about security in public transportation. However, a remarkable proportion of this group said that under no circumstances would they use their car less (22%). 3% did not know or did not want to answer this question.

The Gallup Organization Flash EB No206b � EU Transport Policy
Analytical Report page 13
In what aspect the public transport should be better
Q6. In order to encourage you to use your car less, in what aspect should the public transport be better?
%, Base: those who use car primarily for daily mobility
29
28
12
6
22
3
Better schedule (regularity and
operating hours)
Better connection to your regular
destinations
Closer proximity of stops to where you
live
Security of public transport
None of the above, you would not use
the car less
DK/NA
Hungarian drivers are the least likely to change their attitudes regardless of changes to public transport, 44% of respondents there stating that none of the above mentioned scenarios would encourage them to use their car less. Cypriot respondent are the most optimistic regarding change in this regard; only 9% of respondents said that they would not change their attitude.
44 42 41 40 3833 31 29 27 26 25 23 22 22 21 20 19 19 17 16 16 15 14 14 13 12 10 9
HU
EE
BG
LV
LT
RO
PL
FR
SK
NL
AT
DE
EU
27
DK
CZ
SE
UK FI
BE
IT LU IE
MT
EL
PT SI
ES
CY
In what aspect the public transport should be better:
None of the above, you would not use the car less
Q6. In order to encourage you to use your car less, in what aspect should the public transport be better?
%, Base: those who use car primarily for daily mobility, by country
Regarding potential change one by one, and at a country-to-country level: A better schedule is the best stimulus for the respondents of Malta, (46% of them support this change) while Poles offer the least support for this amendment (12%). The Danish are the most interested in better connections (38%), and the Bulgarians would be the least likely to be swayed by this improvement (11%). The Irish (23%) and the French (18%) find the closer proximity of stops a more effective amendment, while Bulgarians (6%) and Latvians (5%) consider it less convincing. In Romania, the Czech Republic and Cyprus, respondents are the most likely to say that a more secure public transportation system would encourage them to drive less (18%, 15%, and 12% respectively). However, the Austrians, the Finns (both with only 3%) and the Swedes (2%) are the least interested in this potential improvement.

Flash EB No206b � EU Transport Policy The Gallup Organization
page 14
4642 41 41 41 39 38 38 37
32 31 30 29 29 28 28 27 27 26 26 24 24 23 20 18 18 15 12
MT
EL
ES
CY
PT
UK SI
IT LU IE SE FI
DK
EU
27
LV
BG
LT
NL
BE
AT
DE
HU
EE
RO
SK
FR
CZ
PL
In what aspect the public transport should be better:
Better schedule (regularity and operating hours)
38 36 36 3631 30 30 30 30 29 29 28 27 26 26 23 22 22 22 21 19 17 17 16 14 12 12 11
DE
SK FI
AT
PL
ES
IT CZ
SE SI
BE
EU
27
NL
DK
LU IE FR
UK
EL
PT
CY
LT
LV
MT
RO
EE
HU
BG
Better connection to your regular destinations
2318 16 16 16 16 15 13 13 12 12 12 12 12 11 10 10 9 9 9 9 8 8 8 7 7 6 5
IE FR
CY
BE SI
CZ
DK
PT
PL
EL
NL
EU
27
ES
SE
RO
HU
UK
LT
SK FI
IT AT
MT
DE
LU
EE
BG
LV
Closer proximity of stops to where you live
18 15 12 11 10 10 10 8 8 8 8 8 8 7 7 6 6 6 5 5 4 4 4 3 3 3 3 2
RO
CZ
CY
PT
MT
LU
BG
PL
UK
BE
EL
FR
HU
EE
SK
EU
27
LV
IT DK
IE NL
ES
LT
DE SI
AT FI
SE
Security of public transport
Q6. In order to encourage you to use your car less, in what aspect should the public transport be better?
%, Base: those who use car primarily for daily mobility, by country Those least likely to use their cars less are most likely to be drivers who are men, from the oldest generation, having medium education, those living in smaller cities or rural areas, and the self-employed. A better schedule is more crucial for the youngest generation, (the overlapping group of) those still in school, those living in cities and for employees. Considering the improvement in terms of better connections, those aged 25-39 and 40-54 find it more important than the youngest and the oldest generation, those with the highest level of education find it more important than those with less education and those still in school, and it is also more important to respondents living in cities than to those living in rural areas. Employees emphasized this aspect more than any other occupational group. There are only slight differences when considering the importance of improved proximity as a way to make public transportation more popular; it is more important to women and the oldest generation and less important to those who are still in school. Every socio-demographic group considered better

The Gallup Organization Flash EB No206b � EU Transport Policy
Analytical Report page 15
security in the public transportation system the least effective way to encourage less car use. Although those living in metropolitan areas find it slightly more important than those in other groups. Table2. In what aspect the public transport should be better (% by demography)
None of the
above, you
would not use
the car less
Better
schedule
(regularity and
operating
hours)
Better
connection to
your regular
destinations
Closer
proximity of
stops to where
you live
Security of
public
transport
EU27 22 29 28 12 6
SEX
Male 25 28 28 10 6
Female 19 30 29 13 6
AGE
15 - 24 14 41 25 10 7
25 - 39 21 27 32 12 6
40 - 54 22 29 30 11 6
55 + 26 26 22 13 7
EDUCATION (end of)
Until 15 years of
age 23 29 23 12 7
16 - 20 25 27 27 12 6
20 + 20 28 33 12 5
Still in education 11 47 24 9 8
SUBJECTIVE URBANIZATION
Metropolitan area 20 32 25 10 9
Other towns 23 30 28 10 6
Rural zones 23 26 29 13 5
OCCUPATION
Self-employed 29 26 26 8 8
Employee 18 31 32 12 5
Manual worker 26 22 28 13 7
Not working 23 29 24 12 8
DRIVE
Primary driver 23 28 29 11 6
Other 20 29 26 13 8
Q6. In order to encourage you to use your car less, in what aspect should the public transport be better?
%, Base: those who use car primarily for daily mobility

Flash EB No206b � EU Transport Policy The Gallup Organization
page 16
2. Cars and environment
2.1. The impact of the type of car people drive and the way they use it on the environment The vast majority, more than three-quarters (78%) of the population of the EU is of the opinion that the type of car people drive and the way that they drive it actually exerts a significant influence on their area�s environment. At the same time, one-fifth (19%) of the population of the EU27 is of the contrary opinion, believing that the above factors have no influence on their respective environment. The majority opinion detected and measured at EU level prevails in all the individual Member States, too. The proportion of citizens in the individual countries of the EU27 who believe that the type of cars and their manner of usage significantly influence the quality of their residential environment has only a relatively small range of variation. The citizens in Slovakia (87%), Spain (84%), Cyprus (83%) and Poland (83%) were most likely to believe that there was a strong relationship between the type and the manner of usage of cars and their effect on the environment of the respondent. This important impact was detected in Poland, Belgium, Bulgaria, Austria, Slovenia, Ireland, the Czech Republic, Greece, Luxemburg and Italy, too, where at least 8 citizens out of ten thought that these factors (the car type and the manner of usage of cars) influence the environment. As opposed to this, the ratio of those who did not see any essential relationship between these factors (type of car, type of usage of the car and the environment of the respondent) was the highest in Romania (31%), Latvia (29%) and Finland (29%).
87 84 83 83 82 82 82 81 81 81 81 81 81 80 80 78 78 77 76 76 73 71 71 69 68 64 62
11 15 15 15 13 11 16 17 17 18 19 13 17 16 17 19 19 20 17 26 2825 29
31 29
2 2 2 3 5 7 3 1 1 1 7 2 4 4 2 3 3 62 4 4 3 1 6 3 5 9
76
22 20 24
0
20
40
60
80
100
SK
ES
CY
PL
BE
BG
AT SI
IE CZ
EL
LU IT
MT
SE
DE
EU
27
UK
LT
FR
NL
HU
DK
PT
EE
LV
RO FI
Yes No DK/NA
The type of car and the way of its usage has an important impact on the
environment in the respondents� area
Q3b. Do you think the type of car people drive and the way they use it has an important impact on: the environment in your area
%, Base: all respondents, by country
The type of car and the way of its usage has an
important impact on the environment in the
respondents� area
Yes; 78
DK/NA;
3
No; 19
Q3b. Do you think the type of car people drive and the way they use it has an important
impact on: the environment in your area
%, Base: all respondents
The Gallup Organization Flash EB No206b � EU Transport Policy
Analytical Report page 17
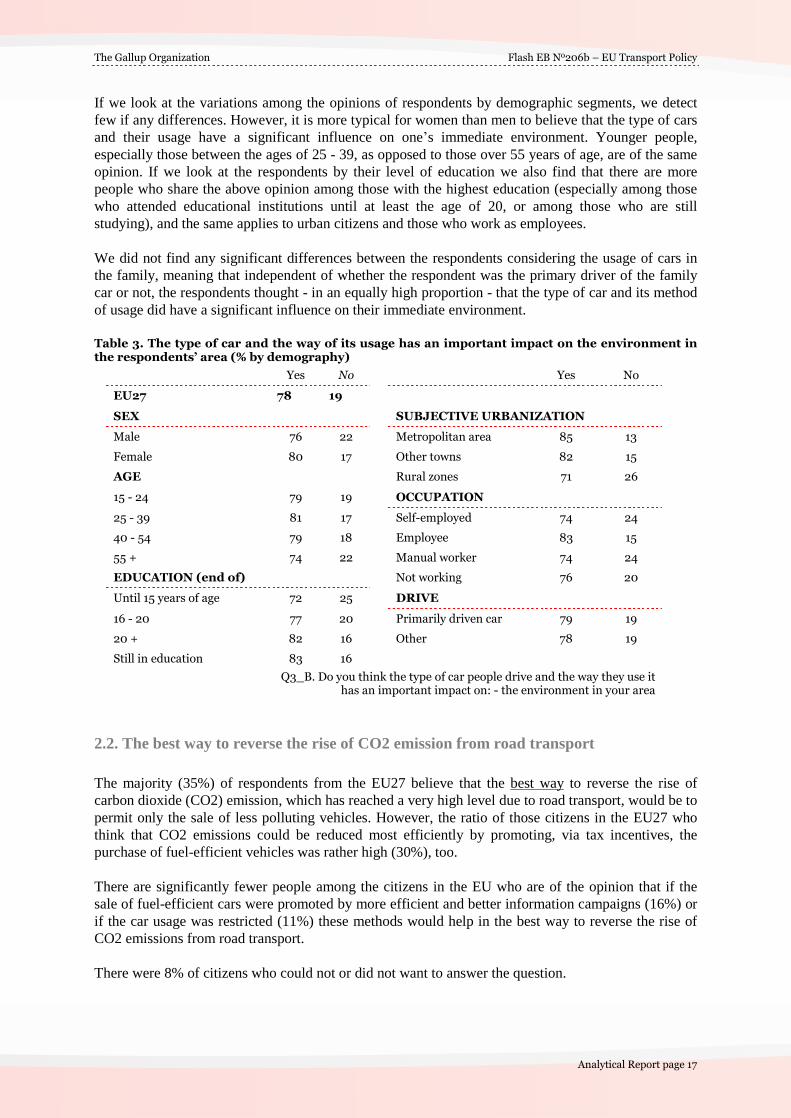
If we look at the variations among the opinions of respondents by demographic segments, we detect few if any differences. However, it is more typical for women than men to believe that the type of cars and their usage have a significant influence on one�s immediate environment. Younger people, especially those between the ages of 25 - 39, as opposed to those over 55 years of age, are of the same opinion. If we look at the respondents by their level of education we also find that there are more people who share the above opinion among those with the highest education (especially among those who attended educational institutions until at least the age of 20, or among those who are still studying), and the same applies to urban citizens and those who work as employees. We did not find any significant differences between the respondents considering the usage of cars in the family, meaning that independent of whether the respondent was the primary driver of the family car or not, the respondents thought - in an equally high proportion - that the type of car and its method of usage did have a significant influence on their immediate environment. Table 3. The type of car and the way of its usage has an important impact on the environment in
the respondents� area (% by demography)
Yes No Yes No
EU27 78 19
SEX SUBJECTIVE URBANIZATION
Male 76 22 Metropolitan area 85 13
Female 80 17 Other towns 82 15
AGE Rural zones 71 26
15 - 24 79 19 OCCUPATION
25 - 39 81 17 Self-employed 74 24
40 - 54 79 18 Employee 83 15
55 + 74 22 Manual worker 74 24
EDUCATION (end of) Not working 76 20
Until 15 years of age 72 25 DRIVE
16 - 20 77 20 Primarily driven car 79 19
20 + 82 16 Other 78 19
Still in education 83 16
Q3_B. Do you think the type of car people drive and the way they use it
has an important impact on: - the environment in your area
2.2. The best way to reverse the rise of CO2 emission from road transport The majority (35%) of respondents from the EU27 believe that the best way to reverse the rise of carbon dioxide (CO2) emission, which has reached a very high level due to road transport, would be to permit only the sale of less polluting vehicles. However, the ratio of those citizens in the EU27 who think that CO2 emissions could be reduced most efficiently by promoting, via tax incentives, the purchase of fuel-efficient vehicles was rather high (30%), too. There are significantly fewer people among the citizens in the EU who are of the opinion that if the sale of fuel-efficient cars were promoted by more efficient and better information campaigns (16%) or if the car usage was restricted (11%) these methods would help in the best way to reverse the rise of CO2 emissions from road transport. There were 8% of citizens who could not or did not want to answer the question.

Flash EB No206b � EU Transport Policy The Gallup Organization
page 18
35
30
16
11
8
Only allow the sale of less polluting vehicles
Promote the purchase of fuel-efficient
vehicles through tax incentives
Promote the purchase of fuel-efficient
vehicles by giving better information
Introduce restrictions to the use of cars.
DK/NA
EU27
The best way to reverse the rise of CO2 emissions from road transport
Q5. Road transport generates about one fifth of the EU�s harmful emissions. Between 1990 and 2004, CO2 emissions from
road transport rose by 26%. Which is the best way to reverse this trend?
%, Base: all respondents
The opinions of the respondents in the individual countries differ slightly from each other in their preferences concerning the best way to reverse the rise of CO2 emissions from road transport. At the level of the EU27 countries, the most preferred method to reverse the rise of CO2 emissions from road transport would be "only to allow the sale of less polluting vehicles". However, if we look at the individual countries, we find that the proportion of those respondents who considered the above method the best was the highest in Spain (47%), Slovenia (44%) and the Czech Republic (43%), while this proportion was the lowest among the Swedish (18%) and the Finnish (21%) respondents. In this case, the difference between the first and the last country was 29 percentage points. In the majority of the EU27 countries, in 16 of them, this method of solving the CO2 problem was mentioned in the first place with the highest ratio. These countries are Spain, Slovenia, the Czech Republic, Portugal, France, Italy, Malta, Romania, The Netherlands, Belgium, Poland, Latvia, Bulgaria, Slovakia, Luxemburg and Greece. We find the biggest difference between individual countries if we analyse the following opinion: "promote the purchase of fuel-efficient vehicles through tax incentives" (in order to reduce the rise of CO2 emission from road transport). While half (50%) of the Finnish respondents agreed with the above solution, only 16% of the Spanish shared this opinion. The ratio of those who agreed with the application of the above method was also high in Lithuania (44%) and in Ireland (44%), and was also relatively low in Romania (19%), Luxemburg (20%) and the Czech Republic (20%). This was the first or second most frequently given answer at the level of the EU27 countries, and was chosen as the best solution in 10 Member States (including Finland, Lithuania, Ireland, Germany, the United Kingdom, Cyprus, Sweden, Denmark, Austria and Greece). The ratio of those who consider "promoting the purchase of fuel-efficient vehicles by giving better information" the best method to reduce the rise of CO2 emission was 28% among the Swedish, 26% among the Slovakian, and 21% among the UK respondents. The ratio of those respondents who shared the above opinion was also relatively high (20%) among the citizens in Ireland and Luxemburg. The ratio of those respondents who preferred this method was the lowest in Malta (8%), and was similarly low in Slovenia (9%) and Bulgaria (10%), too. The Greeks were the most likely to give preference to the method of "introducing restrictions to the use of cars" (23%). Citizens in Cyprus were the second most likely to cite this as a preference (18%), though the ratio of support in the latter country is significantly lower. The French and the Polish respondents were the least supportive of this method (7% each). Introducing restrictions to the use of cars was considered the least efficient solution to reverse the rise of CO2 emission from road transport

The Gallup Organization Flash EB No206b � EU Transport Policy
Analytical Report page 19
by the citizens in all but 6 of the EU27 countries. In Slovenia, Greece, Bulgaria, Italy, the Czech Republic, Hungary, Cyprus and Austria "promote the sales of fuel-efficient vehicles by giving better information", and not "introducing restrictions to the use of cars" was the least likely to be mentioned among the possible methods to reverse the rise of CO2 emission from road transport
47 44 43 42 41 40 40 39 37 36 35 35 35 34 34 33 32 31 30 30 28 27 24 23 22 22 21 18
ES
SI
CZ
PT
FR IT
MT
RO
NL
BE
PL
LV
EU
27
BG
SK
LU
DE
DK
HU
AT
EL
EE
CY
UK
LT IE FI
SE
5044 44
37 35 35 34 33 32 32 32 32 31 31 30 30 29 29 28 27 27 27 24 2420 20 19 16
FI
LT IE DE
HU
UK
LV
CY
SE
PL
BG
DK
BE
AT
NL
EU
27
FR
EE
MT SI
EL
IT SK
PT
CZ
LU
RO ES
Promote the purchase of fuel-efficient vehicles through tax incentives
The best way to reverse the rise of CO2 emissions from road transport:
Only allow the sale of less polluting vehicles
28 2621 20 20 19 18 18 18 18 17 17 16 16 16 16 15 15 15 15 15 14 12 12 12 10 9 8
SE
SK
UK IE LU
RO
EE
PT
ES
EL
CY
PL
EU
27
NL
DK
FR
BE
HU
CZ
DE
LT
AT FI
LV IT BG SI
MT
2318 16 16 15 15 14 14 13 13 11 11 11 11 11 10 10 10 10 9 9 9 9 8 8 8 7 7
EL
CY
CZ
HU
AT SI
IT BG
LU
UK IE EE
EU
27
SK
LV
RO
PT
DE
DK
BE
LT
ES
NL
FI
MT
SE
PL
FR
Introduce restrictions to the use of cars
Promote the purchase of fuel-efficient vehicles by giving better information
Q5. Road transport generates about one fifth of the EU�s harmful emissions. Between 1990 and 2004, CO2 emissions from road transport rose by 26%. Which is the best
way to reverse this trend?
%, Base: all respondents, by country Women, those over the age of 55, and those with the lowest level of education consider the method of "only allowing the sales of less polluting cars" to be the best way to reduce the rise of CO2 emissions from road transport. The above opinion was shared the least by men and by employees. Those respondents who do not drive were more inclined to think that "only allowing the sales of less polluting cars" was the best way to reduce the rise of CO2 emission from road transport than those who are the primary driver of a car in their household.

Flash EB No206b � EU Transport Policy The Gallup Organization
page 20
Between genders, men, among the age groups those between the age of 25 and 39, and between different educational levels those with the highest level of education and the employees considered the method of "promoting the purchase of fuel-efficient vehicles through tax incentives" the best way to reduce the rise of CO2 emissions from road transport (this method was mentioned by a relatively higher proportion of these demographic groups than by others). At the same time, the citizens with the lowest level of education were significantly less likely to consider this method to be the most efficient way to reduce CO2 emissions. Those who are the primary driver of a car in their household considered this method to reverse the increase of CO2 emissions as an optimum solution in a much higher proportion than did other car users. "Promote the purchase of fuel-efficient vehicles by giving better information" was most likely to be chosen as the best way to reverse the rise of CO2 emissions from road transport by the youngest age group and by manual workers. At the same time, "introducing restrictions to the use of cars" was most likely to be considered the best way to reverse the rise of CO2 emission from road transport by those with the lowest level of education. Table 4. The best way to reverse the rise of CO2 emissions from road transport (%, by
demography)
Introduce
restrictions to
the use of
cars.
Only allow the
sale of less
polluting
vehicles
Promote the
purchase of
fuel-efficient
vehicles by
giving better
information
Promote the
purchase of
fuel-efficient
vehicles
through tax
incentives
EU27 11 35 16 30
SEX
Male 10 33 16 33
Female 12 37 17 27
AGE
15 - 24 12 35 21 29
25 - 39 9 34 17 35
40 - 54 10 34 15 33
55 + 13 37 15 24
EDUCATION (end of)
Until 15 years of age 14 38 14 21
16 - 20 10 34 17 31
20 + 10 34 16 35
Still in education 11 36 19 30
SUBJECTIVE URBANIZATION
Metropolitan area 10 35 16 32
Other towns 12 36 16 29
Rural zones 10 34 17 30

The Gallup Organization Flash EB No206b � EU Transport Policy
Analytical Report page 21
(cont. Table 4.)
Introduce
restrictions to
the use of
cars.
Only allow the
sale of less
polluting
vehicles
Promote the
purchase of
fuel-efficient
vehicles by
giving better
information
Promote the
purchase of
fuel-efficient
vehicles
through tax
incentives
OCCUPATION
Self-employed 6 36 15 35
Employee 9 33 17 37
Manual worker 10 35 20 29
Not working 13 36 16 25
DRIVE
Primarily driven car 9 34 16 34
Other 13 36 16 26
Q5. Road transport generates about one fifth of the EU's harmful
emissions. Between 1990 and 2004, CO2 emissions from road
transport rose by 26%. Which is the best way to reverse this trend?
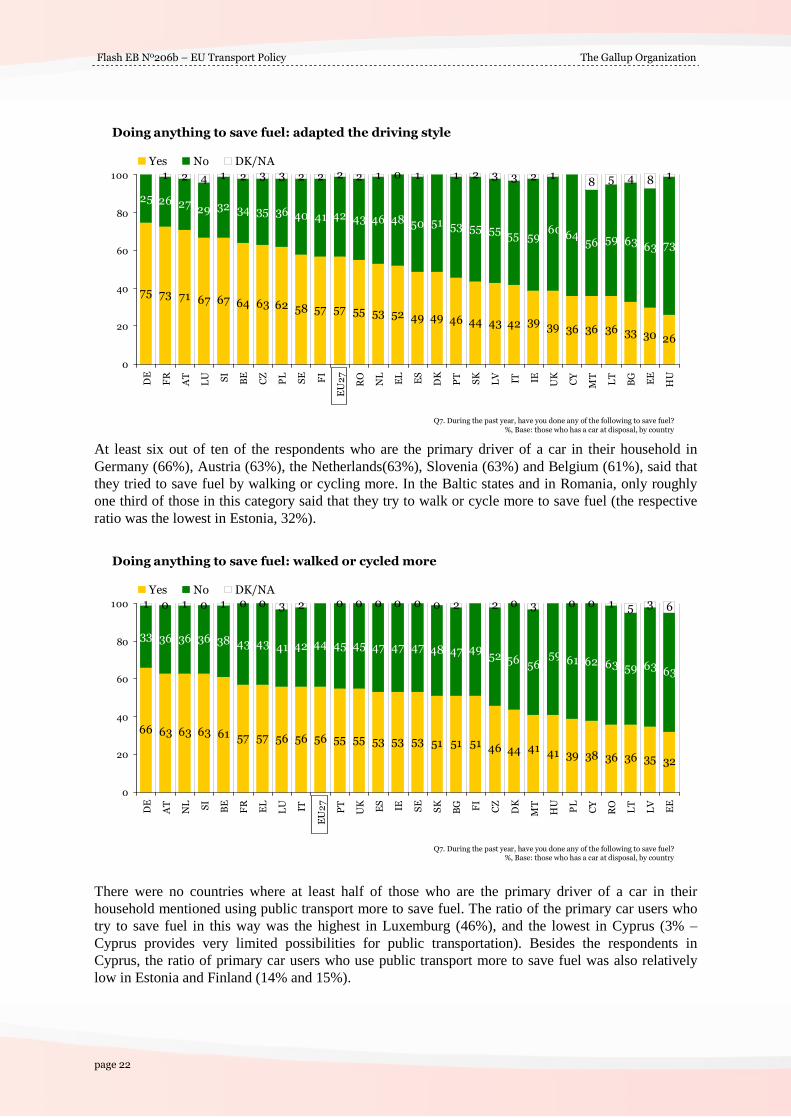
2.3. Actions taken by citizens to save fuel In the countries of the EU27, more than half (57%) of the respondents who are the primary driver of a car in their household tried to save fuel either by adapting their driving style or by walking or cycling more (56%). Much fewer, approximately one quarter, of the respondents used - for the purpose of saving fuel - public transport more often (26%), or changed to another car which consumes less fuel (25%). In the countries of the EU27, 16% of the respondents who are the primary driver of a car in their household did not use any of the methods indicated in the questionnaire in the past one year, and 4% of them applied all the methods mentioned to save fuel (more details on this are available later in this section). In the EU15 Member States, those respondents who are the primary driver of a car in their household tried to save fuel in the recent past by adapting their driving style (58%), walking or cycling more (58%), or by using public transport more often (27%) � the respective figures from NMS12 are 52%, 41% and 22%. While in the New EU Member States drivers were more likely to try to save fuel by changing their car to another one which uses less fuel (33% - the respective ratio in the EU15 countries was 24%). It is primarily typical of the Germans (75%), the French (73%) and the Austrians (71%) to try to save fuel by changing their driving style. The ratio of those who mentioned the above method to save fuel was the lowest among the Hungarians (26%). Relatively more of the respondents in Luxemburg, Slovenia, Belgum, the Czech Republic and Poland changed their driving style to save fuel, too (at least every sixth of the primary car users in the above countries mentioned this solution).
Actions taken by the citizens to save fuel
Q7. During the past year, have you done any of the following to save fuel?
%, Base: those who has a car at disposal
57
56
26
25
42
44
73
74
2
1
1
1
Adapted the
driving style
Walked or cycled
more
Used public
transport more
Changed ther car
to another one
which uses less fuel
Yes No DK/NA
Flash EB No206b � EU Transport Policy The Gallup Organization
page 22
75 73 71 67 67 64 63 62 58 57 57 55 53 52 49 49 46 44 43 42 39 36 36 36 33 30 26
25 26 2729 32 34 35 36 40 41 42 43 46 48 50 51 53 55 55 64
56 59 6363 73
1 2 4 1 2 3 3 2 2 2 2 1 0 1 1 2 3 3 2 18 5 4 8 1
39
55 5960
0
20
40
60
80
100
DE
FR
AT
LU SI
BE
CZ
PL
SE FI
EU
27
RO
NL
EL
ES
DK
PT
SK
LV IT IE UK
CY
MT
LT
BG
EE
HU
Yes No DK/NA
Doing anything to save fuel: adapted the driving style
Q7. During the past year, have you done any of the following to save fuel?
%, Base: those who has a car at disposal, by country At least six out of ten of the respondents who are the primary driver of a car in their household in Germany (66%), Austria (63%), the Netherlands(63%), Slovenia (63%) and Belgium (61%), said that they tried to save fuel by walking or cycling more. In the Baltic states and in Romania, only roughly one third of those in this category said that they try to walk or cycle more to save fuel (the respective ratio was the lowest in Estonia, 32%).
66 63 63 63 61 57 57 56 56 56 55 55 53 53 53 51 51 51 46 44 41 39 38 36 36 35 32
33 36 36 36 38 43 43 41 42 44 45 45 47 47 47 48 47 4952 61 62 63 59 63
63
1 0 1 0 1 0 0 3 2 0 0 0 0 0 0 2 2 0 3 0 0 1 5 3 6
41
56 5659
0
20
40
60
80
100
DE
AT
NL SI
BE
FR
EL
LU IT
EU
27
PT
UK
ES
IE SE
SK
BG FI
CZ
DK
MT
HU
PL
CY
RO
LT
LV
EE
Yes No DK/NA
Doing anything to save fuel: walked or cycled more
Q7. During the past year, have you done any of the following to save fuel?
%, Base: those who has a car at disposal, by country There were no countries where at least half of those who are the primary driver of a car in their household mentioned using public transport more to save fuel. The ratio of the primary car users who try to save fuel in this way was the highest in Luxemburg (46%), and the lowest in Cyprus (3% � Cyprus provides very limited possibilities for public transportation). Besides the respondents in Cyprus, the ratio of primary car users who use public transport more to save fuel was also relatively low in Estonia and Finland (14% and 15%).
The Gallup Organization Flash EB No206b � EU Transport Policy
Analytical Report page 23
4636 35 34 33 33 33 30 30 27 26 26 25 25 24 23 23 22 21 20 18 18 16 16 15 14
3
5264 63 66 64 66 68 70 70
70 73 74 71 75 76 76 77 78 79 80 81 80 85 8297
3 0 2 0 4 1 0 3 1 3 0 0 0 0 0 0 2 0 2 3 5 4 0
19
80 8082
0
20
40
60
80
100L
U
SK
CZ
ES
IE BE
EL
UK
AT
MT
EU
27
DE
IT SI
PT
FR
SE
PL
NL
HU
LV
DK
BG
RO
LT FI
EE
CY
Yes No DK/NA
Doing anything to save fuel: used public transport more
Q7. During the past year, have you done any of the following to save fuel?
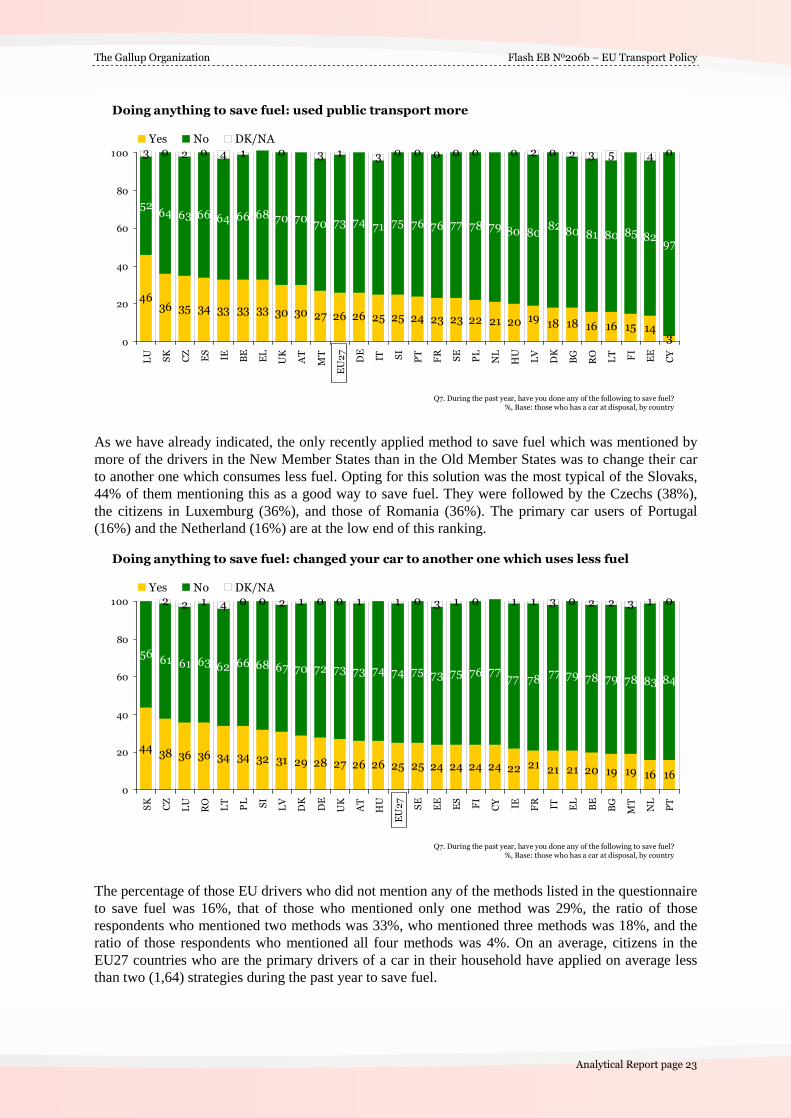
%, Base: those who has a car at disposal, by country As we have already indicated, the only recently applied method to save fuel which was mentioned by more of the drivers in the New Member States than in the Old Member States was to change their car to another one which consumes less fuel. Opting for this solution was the most typical of the Slovaks, 44% of them mentioning this as a good way to save fuel. They were followed by the Czechs (38%), the citizens in Luxemburg (36%), and those of Romania (36%). The primary car users of Portugal (16%) and the Netherland (16%) are at the low end of this ranking.
4438 36 36 34 34 32 31 29 28 27 26 26 25 25 24 24 24 24 22 21 21 20 19 19 16 16
5661 61 63 62 66 68 67 70 72 73 73 74 74 75 73 75 76 77 79 78 79 78 83 84
2 2 1 4 0 0 2 1 0 0 1 1 0 3 1 0 1 1 3 0 2 2 3 1 0
21
77 7877
0
20
40
60
80
100
SK
CZ
LU
RO
LT
PL SI
LV
DK
DE
UK
AT
HU
EU
27
SE
EE
ES
FI
CY IE FR
IT EL
BE
BG
MT
NL
PT
Yes No DK/NA
Doing anything to save fuel: changed your car to another one which uses less fuel
Q7. During the past year, have you done any of the following to save fuel?
%, Base: those who has a car at disposal, by country The percentage of those EU drivers who did not mention any of the methods listed in the questionnaire to save fuel was 16%, that of those who mentioned only one method was 29%, the ratio of those respondents who mentioned two methods was 33%, who mentioned three methods was 18%, and the ratio of those respondents who mentioned all four methods was 4%. On an average, citizens in the EU27 countries who are the primary drivers of a car in their household have applied on average less than two (1,64) strategies during the past year to save fuel.

Flash EB No206b � EU Transport Policy The Gallup Organization
page 24
<3>; 18
<4>; 4
<0>; 16
<2>; 33
<1>; 29
Doing anything to save fuel: adapted your driving style, used
public transport more, walked or cycled more and changed your car
to another one which uses less fuel (count all the �yes� answers)
Q7. During the past year, have you done any of the following to save fuel?
%, Base: those who has a car at disposal, by country
0=did not mention any
of these means
4= mentioned all these
means
Mean:1,64
We have also analysed the average (how many different methods did the primary car users of the EU27 countries use to save fuel) at the level of the individual countries and by socio-economic groups. The average ratio was the highest among the citizens in Luxemburg (2,05), meaning that on an average the citizens in Luxemburg have tried two different methods to save fuel during the past year. They were followed by the Germans (1,94), the Austrians (1,90), the Slovenians (1,87), and the Czech (1,82). However, the Belgians (1,78%), the French (1,75%) and the Slovaks (1,75%) also exceeded the average of the EU15 countries in this respect. The citizens in Estonia (0,99) and Cyprus (1,01) are at the end of this hierarchy of countries.
2,0
5
1,9
4
1,9
0
1,8
7
1,8
2
1,7
8
1,7
5
1,7
5
1,6
4
1,6
3
1,6
1
1,5
9
1,5
6
1,5
2
1,5
0
1,4
8
1,4
7
1,4
4
1,4
2
1,4
1
1,4
0
1,2
7
1,2
4
1,2
2
1,2
1
1,12
1,0
1
0,9
9
0
1
2
3
4
LU
DE
AT SI
CZ
BE
FR
SK
EU
27
EL
ES
SE
PL
NL
UK IE FI
IT RO
PT
DK
LV
MT
BG
LT
HU
CY
EE
Doing anything to save fuel: adapted your driving style, used public transport more, walked or cycled more and changed your
car to another one which uses less fuel (count all the �yes� answers and calculating the averages)
Q7. During the past year, have you done any of the following to save fuel?
%, Base: those who has a car at disposal, by country
0=did not mention any of these means
4= mentioned all these means
If we investigate the issue of how many methods were used, on an average, by primary car users to save fuel during the past few years we find that citizens in the metropolitan zones were the ones who tried the largest number of different approaches (average = 1,82). Similarly, citizens over the age of 55 (1,73), and the inactive population (1,72) also used various methods to save fuel. Among those respondents who are the primary driver of a car in their household, the self-employed used the least number of methods to try to save on fuel consumption (average = 1,51).

The Gallup Organization Flash EB No206b � EU Transport Policy
Analytical Report page 25
1,64
1,631,65
1,581,581,61
1,73
1,651,631,641,63
1,821,62
1,57
1,51
1,651,72
1,64
1,60
0 1 2 3 4
EU27
GENDER
Male
Female
AGE GROUP
15 - 24
25 - 39
40 - 54
55+
EDUCAT ION (END OF)
-15
16 - 20
20+
Still in education
SUBJECT IVE URBANIZAT ION
Metropolitan zone
Other town/urban centre
Rural zone
OCCUPAT ION
Self-employee
Employees
Manual worker
Not working
DRIVE
Primarily driven car
Other
Doing anything to save fuel: adapted your driving style, used public transport more, walked or cycled more and changed your
car to another one which uses less fuel (count all the �yes� answers and calculating the averages)
Q7. During the past year, have you done any of the following to save fuel?
%, Base: those who has a car at disposal, by demography
0=did not mention any of the means
4= mentioned all the means
The Annex Tables presenting the Q7 a-d questions show, in detail, the data on the proportion of the different methods used or mentioned by the demographic segments to save fuel. In summary we can say that there are no outstanding patterns. While primary car users over the age of 55 (together with the inactive population and with those who have the lowest educational level) were rather inclined to save fuel by adapting their driving style, or by walking and/or cycling more, the youngest respondents, and the citizens in metropolitan zones tried to save fuel by using public transport more frequently. Primary car users between the ages of 25 and 39, those with a medium educational level, and the citizens in metropolitan zones mentioned in higher proportion than the other demographic segments that they have changed their car to a more fuel-efficient one.
2.4. Incentives for using the bio fuel According to 36% of EU citizens, the best method to encourage the use of bio fuel is to make it cheaper via tax incentives. The second most preferred (almost as popular) measure was to define compulsory standards for manufacturers to produce cars that use bio fuel (32%). The remaining measures were mentioned by a much smaller proportion (around one tenth) of the citizens. Crop subsidies for bio fuel production was mentioned by 13%, and higher taxes for polluting vehicles using traditional fossil fuels by 10% of the respondents. 3% opted for other measures not presented in the questionnaire and 7% of citizens who could not or did not want to answer the question.

Flash EB No206b � EU Transport Policy The Gallup Organization
page 26
36
32
13
10
3
7
Tax incentives to make bio fuel cheaper
Compulsory standards for manufacturers
to produce cars that use bio fuel
Crop subsidies for bio fuel production
Higher taxes for polluting vehicles using
traditional fossil fuel
Other measures
DK/NA
EU27
The best measure to encourage the use of biofuels
Q8. Bio fuels are renewable fuels that can reduce fossil oil dependence of vehicles. Which is in
your opinion the best measure to encourage the use of bio fuels?
%, Base: all respondents
There is a high level of variation between individual Member States in the degree to which different measures were mentioned. The Finnish were the most likely to mention (more than half of the population) that reducing the price of bio fuel would best promote the consumption of bio fuel (54%). A relatively high proportion of the Swedish (48%), the Lithuanians (47%) and the Hungarians (46%) also shared this opinion. The Spanish were least likely to pick this approach � to decrease bio fuel prices � to encourage the use of it (20%). Still, in most Member States (in 20 countries out of the 27), this incentive was given the highest preference. In the remaining 7 (seven) countries, (Portugal, the United Kingdom, Germany, Austria, Spain, Italy and Greece) "compulsory standards for the manufacturers to produce cars that use bio fuel" was the most trusted measure. Among the citizens in the above countries, the Portuguese were the most supportive (43%) of this method. They were followed by those in the UK (40%), in Germany (39%), Austria (38%) and Spain (36%). This method was considered to be the least efficient way to encourage the purchase and the use of bio fuel by the citizens in Malta (14%) and Finland (16%). In every country, less than one fourth of the population considered crop subsidies for bio fuel production the best method to encourage the use of bio fuel. This ratio was the highest among the Hungarians (24%) and was also relatively high in Slovakia (21%) and Poland (20%). This incentive was considered to be the best by only 5% in Germany 6% in the UK, and 7% in Ireland. At the level of the EU27 countries, higher taxes for polluting vehicles using traditional fossil fuel was also considered to be an efficient tool to encourage the consumption of bio fuel by only a very small proportion of the respondents, but there are differences among the individual Member States in this respect: the citizens in Luxemburg (17%) and Denmark (17%) mentioned it relatively most frequently, while the Hungarians (3%) and the Polish (8%) quite rarely.

The Gallup Organization Flash EB No206b � EU Transport Policy
Analytical Report page 27
5448 47 46 45 42 41 40 39 38 38 38 37 37 36 36 36 36 36 35 35 33 32 31 31 31
2620
FI
SE
LT
HU
PL
IE EE
LV
FR
DK
MT
UK
BG
CY SI
DE
CZ
AT
EU
27
BE
NL
SK
EL
PT IT RO
LU ES
43 40 39 38 36 35 34 33 32 32 32 32 30 28 28 25 24 23 23 22 21 21 20 20 19 19 16 14
PT
UK
DE
AT
ES
IT IE EL SI
EU
27
BE
NL
FR
SK
CY
DK
LU
CZ
LV
LT
SE
BG
HU
RO
PL
EE
FI
MT
Compulsory standards for manufacturers to produce cars that use bio fuel
The best way to encourage the use of biofuels:
Tax incentives to make bio fuel cheaper
24 21 20 19 18 17 16 16 16 16 15 15 15 14 14 14 13 10 10 10 9 8 8 8 8 7 6 5
HU
SK
PL
EL
ES
LU
BE
RO SI
LV
FR
NL
CY
CZ
IT BG
EU
27
DK
MT
LT FI
AT
PT
SE
EE
IE UK
DE
17 17 15 15 13 13 13 11 11 11 10 10 10 10 10 10 10 9 9 9 9 9 8 8 8 8 83
LU
DK
CZ
IE CY FI
SE
BG SI
RO
UK
NL
ES
EE
DE
LV
EU
27
FR
MT
EL
SK
PT
AT IT LT
BE
PL
HU
Higher taxes for polluting vehicles using traditional fossil fuel
Crop subsidies for bio fuel production
Q8. Bio fuels are renewable fuels that can reduce fossil oil dependence of vehicles. Which is in your opinion the best measure to encourage the use of bio fuels?
%, Base: all respondents, by country Women were more likely than men to favour compulsory standards for manufacturers to produce cars that use bio fuel, while men considered all the other incentives more efficient than the one mentioned by the highest proportion of female respondents. In the age group of 25 to 39 years of age, there was a higher ratio of those who mentioned more frequently than the other age groups tax incentives to make bio fuel cheaper. Other demographic groups (besides the age group of 25 - 39, the most qualified respondents, the manual workers and the primary car users) also thought that tax incentives to make bio fuel cheaper would be the most efficient way to encourage the use of bio fuel. At the same time, a higher proportion of the members of the youngest age group consider higher taxes for polluting vehicles using traditional fossil fuels to be the best incentive. Besides the youngest age group, the option for higher taxes for polluting vehicles was indicated by a relatively higher proportion of those who are still in school, too.

Flash EB No206b � EU Transport Policy The Gallup Organization
page 28
The highest proportion of respondents in the age group of 25 - 39 thought that compulsory standards for manufacturers are the best way to encourage the use of bio fuel; the same attitude hold those who are still in school and employees with relatively higher ratio, too. This method was considered to be the best to encourage the use of bio fuel by more of those who drive their car than by others. It is more than evident, that the ratio of those who found crop subsidies for bio fuel production to be the best way to promote the use of bio fuel was the highest among citizens in rural zones and the lowest among citizens in metropolitan zones. The ratio of those who share the above opinion is relatively higher among manual workers than in the other demographic segments. Table 5. The best way to encourage the use of bio fuels (%, by demography)
Tax incentives
to make bio
fuel cheaper
Compulsory
standards for
manufacturers
to produce cars
that use bio fuel
Crop subsidies for
bio fuel
production
Higher taxes for
polluting vehicles
using traditional
fossil fuel
EU27 36 32 13 10
SEX
Male 36 31 13 10
Female 35 33 12 9
AGE
15 - 24 34 33 13 14
25 - 39 39 35 11 9
40 - 54 36 34 13 9
55 + 33 29 13 9
EDUCATION (end of)
Until 15 years of age 31 30 13 8
16 - 20 37 31 14 9
20 + 38 34 10 9
Still in education 33 36 11 14
SUBJECTIVE URBANIZATION
Metropolitan area 36 33 11 11
Other towns 34 34 12 9
Rural zones 36 31 14 9
OCCUPATION
Self-employed 37 34 14 7
Employee 38 36 11 9
Manual worker 39 27 15 9
Not working 33 30 13 11
DRIVE
Primarily driven car 38 34 12 8
Other 33 31 13 11
Q8. Bio fuels are renewable fuels that can reduce fossil oil dependence of
vehicles. Which is in your opinion the best measure to encourage the use of
bio fuels?
The Gallup Organization Flash EB No206b � EU Transport Policy
Analytical Report page 29
3. Traffic situation
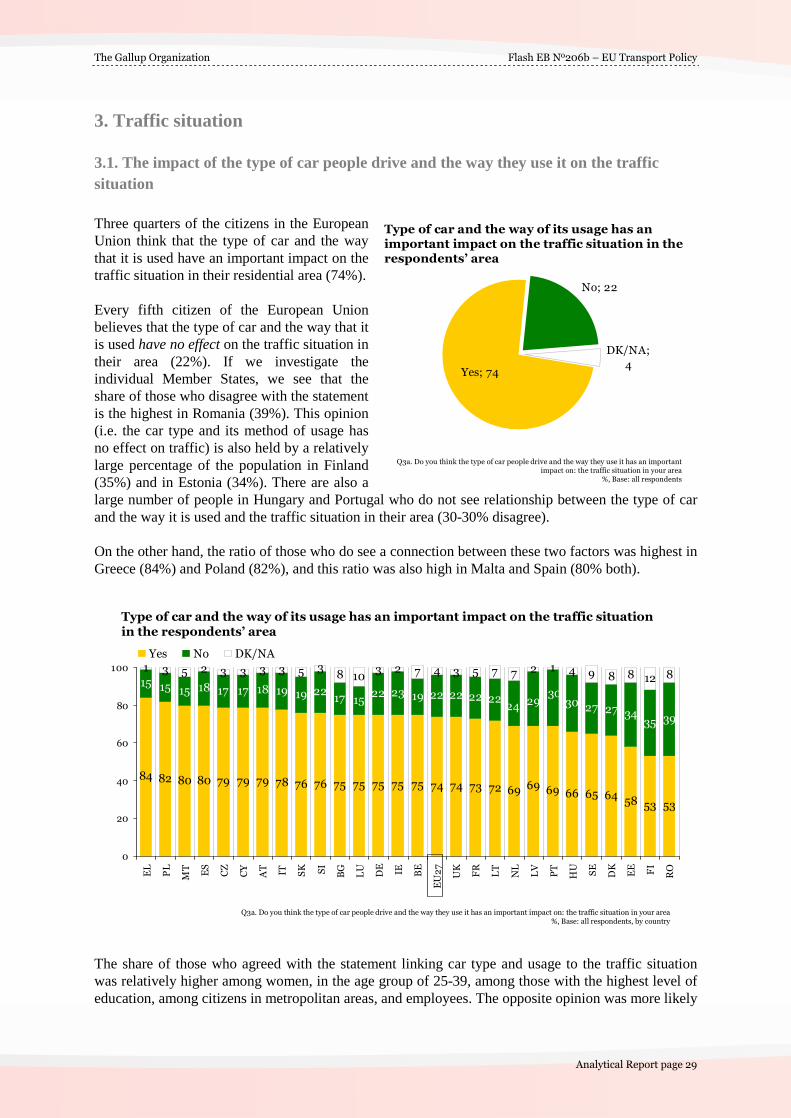
3.1. The impact of the type of car people drive and the way they use it on the traffic situation Three quarters of the citizens in the European Union think that the type of car and the way that it is used have an important impact on the traffic situation in their residential area (74%). Every fifth citizen of the European Union believes that the type of car and the way that it is used have no effect on the traffic situation in their area (22%). If we investigate the individual Member States, we see that the share of those who disagree with the statement is the highest in Romania (39%). This opinion (i.e. the car type and its method of usage has no effect on traffic) is also held by a relatively large percentage of the population in Finland (35%) and in Estonia (34%). There are also a large number of people in Hungary and Portugal who do not see relationship between the type of car and the way it is used and the traffic situation in their area (30-30% disagree). On the other hand, the ratio of those who do see a connection between these two factors was highest in Greece (84%) and Poland (82%), and this ratio was also high in Malta and Spain (80% both).
84 82 80 80 79 79 79 78 76 76 75 75 75 75 75 74 74 73 72 69 69 66 65 6458 53 53
15 15 15 18 17 17 18 19 19 2217 15
22 23 19 22 22 22 22 30 27 27 3435 39
1 3 5 2 3 3 3 3 5 38 10
3 2 7 4 3 5 7 7 2 1 4 9 8 8 12 8
69
24 2930
0
20
40
60
80
100
EL
PL
MT
ES
CZ
CY
AT
IT SK SI
BG
LU
DE
IE BE
EU
27
UK
FR
LT
NL
LV
PT
HU
SE
DK
EE
FI
RO
Yes No DK/NA
Type of car and the way of its usage has an important impact on the traffic situation
in the respondents� area
Q3a. Do you think the type of car people drive and the way they use it has an important impact on: the traffic situation in your area
%, Base: all respondents, by country
The share of those who agreed with the statement linking car type and usage to the traffic situation was relatively higher among women, in the age group of 25-39, among those with the highest level of education, among citizens in metropolitan areas, and employees. The opposite opinion was more likely
Type of car and the way of its usage has an
important impact on the traffic situation in the
respondents� area
Yes; 74
DK/NA;
4
No; 22
Q3a. Do you think the type of car people drive and the way they use it has an important
impact on: the traffic situation in your area
%, Base: all respondents

Flash EB No206b � EU Transport Policy The Gallup Organization
page 30
to be held by men, the youngest generation, those with the lowest educational level, inhabitants of rural zones, and manual workers. There are more people among car drivers who do see a connection between these items than there are among those who are not the primary users of a car, or those who do not have a car at all. Table 6. Type of car and the way of its usage has an important impact on the traffic situation in the
respondents� area (%, by demography)
Yes No Yes No
EU27 74 22 74 22
SEX SUBJECTIVE URBANIZATION
Male 73 24 Metropolitan area 81 16
Female 76 20 Other towns 78 18
AGE Rural zones 67 29
15 - 24 73 25 OCCUPATION
25 - 39 77 20 Self-employed 73 24
40 - 54 75 22 Employee 78 20
55 + 73 22 Manual worker 70 26
EDUCATION (end of) Not working 73 22
Until 15 years of age 70 24 DRIVE
16 - 20 74 22 Primarily driven car 76 21
20 + 78 19 Other 73 23
Still in education 75 22
Q3_A. Do you think the type of car people drive and the way they use it
has an important impact on: - the traffic situation in your area

The Gallup Organization Flash EB No206b � EU Transport Policy
Analytical Report page 31
3.2. Measures that could improve the traffic situation in the city or nearby Relatively few people, only 6% in the EU are of the opinion that there is no need to improve the traffic situation in their city (or in the closest urban centre if they are living in a rural area). Beside there are other 4% who could not or did not want to answer the question. In total, the vast majority (90%) are of the opinion that the traffic situation in their area should be improved by some of the means the questionnaire listed. Nearly half of the citizens in the European Union (49%) think that better public transport could significantly improve the traffic situation in their (closest) city. There are much fewer people who firmly believe that either limitations in the city centre (17%), or speed limits (17%) could improve the traffic situation. The ratio of those who think that charges for road usage (city tolls) could actually improve the traffic situation in their respective area is even lower (5%). 4% of EU27 citizens think that other measures than those presented in the questionnaire could improve the traffic situation in their area. Though at the level of the EU27 there are relatively few people who say that there is no need to improve the traffic situation in their area, the opinions on this matter in individual countries is not completely uniform. The share of those who think that there is no need to improve the traffic situation in their area was the highest in Estonia (12%), but this opinion is shared by a relatively large proportion of people in Latvia (10%), Hungary (10%), Germany (10%) and Austria (10%) as well. This opinion was shared in the lowest proportions in Ireland (0,4%) and the United Kingdom (1%).
12 10 10 10 10 9 8 8 7 7 6 6 6 6 6 6 5 5 5 4 4 3 3 2 2 2 1 0
EE
LV
HU
DE
AT
DK FI
LT
NL
PT
LU
PL
BE
RO ES
EU
27
FR
SE
SK IT CZ
MT
BG SI
EL
CY
UK IE
Measures that could improve the traffic situation in the city and nearby:
No need to improve
Q4. Thinking of the city you are living or the one you live nearby, which of the following measures could, in your opinion, improve the traffic situation there?
%, Base: all respondents, by country We have analysed the composition of those who think that there is a need to improve the traffic situation in their residential area by demographic factors as well. There seems to be no difference in those who share this opinion by gender or by car usage.
49
17
17
5
6
4
4
Better public transport
Limitations in city centres (parking,
access for private cars or trucks)
Speed limitations
Charges for road usage (e.g. city tolls)
No need to improve
Other
DK/NA
EU27
Measures that could improve the traffic situation in
the city and nearby
Q4. Thinking of the city you are living or the one you live nearby, which of the following measures
could, in your opinion, improve the traffic situation there?
%, Base: all respondents

Flash EB No206b � EU Transport Policy The Gallup Organization
page 32
Older citizens are more inclined to think that there is no need to improve the traffic situation. A similar direct relationship was measured when we analysed the respondents by the level of their education: the lower the educational level was, the more likely the respondents were to think that the traffic situation in their area should not be improved. And similarly, the smaller the settlement where the respondent lives, the higher the likelihood is that they believe there is no need to improve the traffic situation in their area. Investigating the data by occupation, we see that the share of those who think that there is no need to improve the traffic situation in their area is relatively higher among the inactive population, and is relatively lower among both the self-employed and employees. However, the majority of the citizens in the EU27 countries are of the contrary opinion, the vast majority (90%) of these respondents firmly of the belief that there is a need to improve the traffic situation in their area. The proportion of those who think that better public transport is the right solution is higher in the EU15 countries than in the NMS12 (53% vs. 32%), and the introduction of various restrictions is in general more preferred by the citizens in the NMS12 countries than of the EU15 countries. At the level of the EU27 countries, better public transport is considered to be the best solution for improving the traffic situation, but we have measured considerable differences at the level of individual countries. The proportion of those who are of the opinion that better public transport could significantly contribute to the improvement of congested traffic situation in their city is the highest in Ireland (67%), and is the lowest in Bulgaria (21%). There are also relatively more people in Italy (62%), the United Kingdom (60%) and Portugal (60%) who think that better public transport is the right solution to the traffic situation. In addition to the Bulgarians, this opinion is shared by relatively few citizens in Lithuania (24%), Latvia (25%), and Poland (27%), too, but even in these countries, one fourth of the population thinks that better public transport would be the right solution to the urban traffic problems they face. Citizens in Greece are the most likely to think that limitations in city centres are the right solution in to traffic problems (33%). This opinion is also shared by a relatively high proportion of the population in Slovakia (27%), the Czech Republic (26%), Lithuania (26%), and Latvia (26%). The proportion of those who disagree with potential positive effects of limitations in the city is the lowest in Luxemburg (9%). Speed limitations, as a possible way to improving the traffic situation in the city of the respondents was most likely to be mentioned by the Bulgarians (39%), but it was also given a relatively high
6
6
6
4
46
7
8
6
5
3
46
7
5
56
7
66
EU27
GENDER
Male
Female
AGE GROUP
15 - 24
25 - 39
40 - 54
55+
EDUCATION (END OF)
-15
16 - 20
20+
Still in education
SUBJECTIVE URBANIZATION
Metropolitan zone
Other town/urban centre
Rural zone
OCCUPATION
Self-employee
Employees
Manual worker
Not working
DRIVE
Primarily driven car
Other
Measures that could improve the traffic situation
in the city and nearby: no need to improve
Q4. Thinking of the city you are living or the one you live nearby, which of the
following measures could, in your opinion, improve the traffic situation there?
%, Base: all respondents, by demography

The Gallup Organization Flash EB No206b � EU Transport Policy
Analytical Report page 33
priority in Poland (28%) and Lithuania (26%). At the same time, only 9% of the Portuguese and Austrian citizens were of this same opinion. The share of those who agree with the introduction of city tolls is generally low in the EU27 countries. This solution was considered worthwhile in the highest proportion in Romania (10%), but the share of those who agreed with it was also relatively high in Germany (8%) and in the Czech Republic (8%), and was the lowest in Spain (1%).
6762 60 60 58 57 56 53 53 52 52 49 47 46 46 45 45 44 41 40 39 39 37 34
27 25 24 21
IE IT UK
PT
ES
CY
LU
NL
FI
AT
SE
EU
27
BE
DK
FR SI
DE
MT
EL
CZ
RO
EE
SK
HU
PL
LV
LT
BG
3327 26 26 26 24 22 21 20 19 19 17 17 17 16 16 15 15 15 14 14 14 14 13 13 12 10 9
EL
SK
CZ
LV
LT
HU
PL
BG SI
MT
FR
PT
BE
EU
27
EE FI
IT RO SE
UK
NL
DE
ES
IE AT
DK
CY
LU
Limitations in city centres (parking, access for private cars or trucks)
Measures that could improve the traffic situation in the city and nearby:
Better public transport
39
28 26 25 22 21 21 21 21 20 19 19 17 17 17 17 17 14 14 14 13 13 12 12 10 10 9 9
BG
PL
LT SI
CY
SK
LV
MT
HU
FR
EE
BE
DE
DK
LU
RO
EU
27
SE
NL
ES
CZ
EL
UK FI
IT IE AT
PT
10 8 8 7 7 7 7 6 6 6 5 5 5 5 5 5 5 5 4 4 4 4 3 3 3 2 2 1
RO
DK
CZ
AT
DE
LV
SE
IE UK
LT
EL
NL
BE
LU
EU
27
FI
CY
FR
SK
BG
PL
MT
EE
HU SI
PT IT ES
Charges for road usage (e.g. city tolls)
Speed limitations
Q4. Thinking of the city you are living or the one you live nearby, which of the following measures could, in your opinion, improve the traffic situation there?
%, Base: all respondents, by country There are no typical patterns in the responses by demographic segments when we analysed the most preferred solutions to the traffic problems in the respondents� (nearby) city. Regardless of the demographic segments we find that better public transport is always mentioned first as a possible solution to improve the traffic situation in the city. Better public transport was most likely to be named as the right solution to the problem by employees, but was also mentioned relatively often by those in the age groups of 25-39 and 40-54 years of age, by those with the highest level of education, and by citizens living in metropolitan zones. There were also quite a large number of respondents among the

Flash EB No206b � EU Transport Policy The Gallup Organization
page 34
primary car users (in comparison to other car users) who gave high priority to the improvement of public transport as a solution to the traffic problems in their area. Limitations in city centres were more likely to be seen as the right solution by men, the youngest, inhabitants of urban zones, the self-employed and manual workers. At the same time, women, the eldest, those with the lowest educational level, inhabitants of rural areas and the inactive were more likely to think that the introduction of speed limitations could improve the traffic situation in their city. There were more among the �other� car users (non-primary car users and those who do not drive a car) than among those who are primary car users who thought that these two types of limitations could be efficient tools to improve the congested traffic. No matter which of the demographic segments we analysed, we found that charges for road usage (city tolls) were mentioned by the least people as a solution to the traffic problems in their city. However, there were relatively more young people and those still in school who considered this solution worthwhile.
Table 7. Measures that could improve the traffic situation in the city and nearby (%, by
demography)
Better public
transport
Limitations in city
centres Speed limitations
Charges for road
usage
EU27 49 17 17 5
SEX
Male 49 18 13 6
Female 48 16 20 4
AGE
15 - 24 48 20 17 7
25 - 39 51 19 16 5
40 - 54 53 15 13 5
55 + 43 15 20 4
EDUCATION (end of)
Until 15 years of
age 44 12 21 3
16 - 20 48 17 17 5
20 + 53 18 13 6
Still in education 50 19 16 7
SUBJECTIVE URBANIZATION
Metropolitan
area 52 19 13 6
Other towns 47 19 17 5
Rural zones 48 14 18 5
OCCUPATION
Self-employed 50 18 11 5
Employee 56 17 13 5
Manual worker 44 18 17 6
Not working 44 16 20 4
DRIVE
Primarily driven
car 53 16 14 4
Other 44 18 19 6
Q4. Thinking of the city you are living or the one you live nearby, which of the following
measures could, in your opinion, improve the traffic situation there?

The Gallup Organization Flash EB No206b � EU Transport Policy
Analytical Report page 35
4. Costs of damaging environment
4.1. Preparedness to pay more We asked citizens whether or not they are ready to pay more to use a less polluting system of transport, such as energy efficient private or public vehicles, or clean fuels. The majority of EU citizens are ready to pay more (54%), although the majority of that group are willing only with a cost increase of no more than 10 percent. 45% of respondents would are prepared to pay up to 10 percent more, while only 9% of citizens are willing to pay even more than a 10 percent increase. 41% stated that they are not prepared for an increase in expenses in order to use less polluting transport systems. 5% of respondents could not, or did not want to answer this question. Respondents in the New Member States are more likely than those in the Old Member States to say that they are not prepared for an increase in expenses (49% vs. 39%). Latvia had the highest proportion of citizens answering that they are not prepared to pay more (59%), followed by Polish respondents (56%) and Romanians (49%). Citizens in Luxembourg were the least likely to state that they are not ready to pay more (24%), followed by Slovenia with 27% and Greece and Malta (both with 29%). As indicated above, citizens in the Old Member States are in general more prepared to pay more for less polluting transport than those in the New Member States, still, the level of preparedness is higher in Slovenia than in any other Member State; 70% of the Slovenian respondents answered that they are ready to pay more. The second and third most prepared countries � regarding both those who would pay up to 10 percent increases and those who are ready to pay more than 10% - are Greece (68%) and Luxembourg (67%). Latvians and Estonians are the least prepared for an increase in expenses � either under or above 10 percent � both with only 35% of respondents saying they are prepared to pay more, followed by the Polish (37%). We find that citizens in Greece are the most prepared to accept a more than 10 percent increase to use less polluting transport (21%); the second most prepared country in this sense is Slovenia (16%) followed by Cyprus (14%). The lowest proportions regarding willingness to pay more than a 10 percent increase are Latvia (5%), Estonia (4%), and Poland (3%).
DK/NA; 5
Not
prepared to
pay more; 41
Yes, I would
pay more
than 10%
more; 9
Yes, I would
pay up to
10% more;
45
Preparedness to pay more for using a less
polluting transport
Q9. Would you be prepared to pay more for using a less polluting transport (energy efficient
private and public vehicles, clean fuels...)? How much more would you be prepared to pay?
%, Base: all respondents
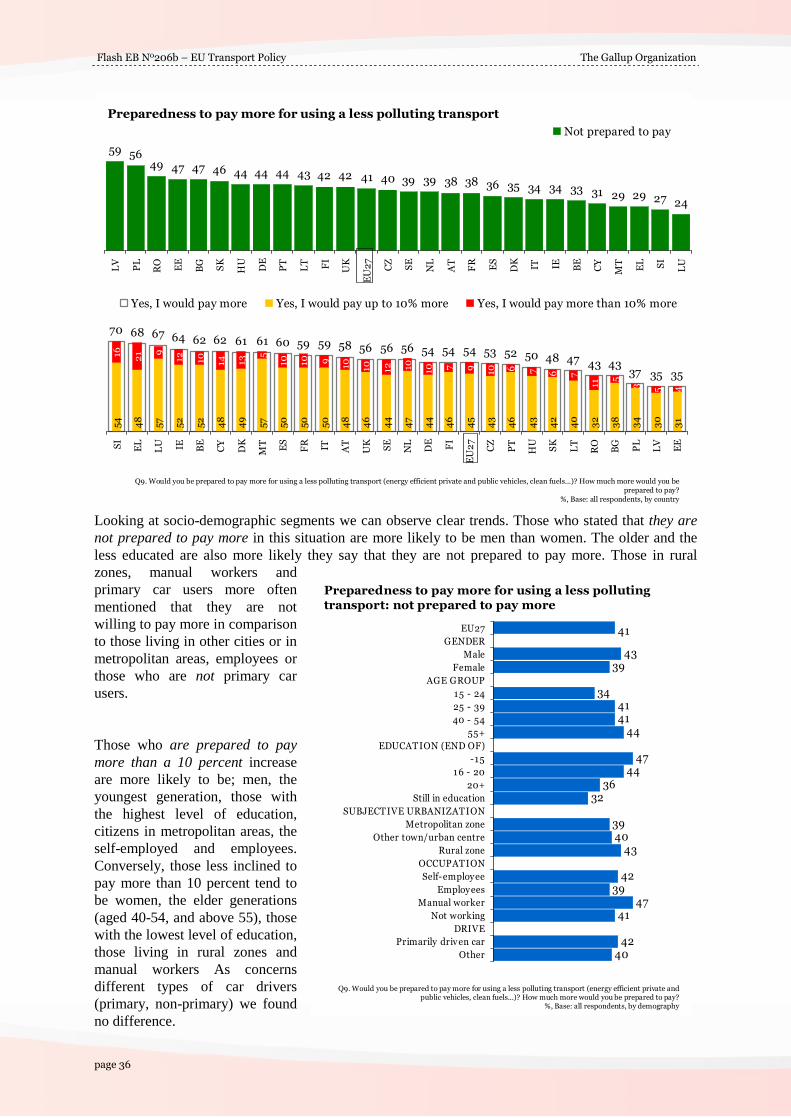
Flash EB No206b � EU Transport Policy The Gallup Organization
page 36
41
4339
344141
44
4744
3632
3940
43
4239
4741
4240
EU27
GENDER
Male
Female
AGE GROUP
15 - 24
25 - 39
40 - 54
55+
EDUCAT ION (END OF)
-15
1 6 - 20
20+
Still in education
SUBJECT IVE URBANIZAT ION
Metropolitan zone
Other town/urban centre
Rural zone
OCCUPAT ION
Self-employee
Employees
Manual worker
Not working
DRIVE
Primarily driv en car
Other
Preparedness to pay more for using a less polluting
transport: not prepared to pay more
Q9. Would you be prepared to pay more for using a less polluting transport (energy efficient private and
public vehicles, clean fuels...)? How much more would you be prepared to pay?
%, Base: all respondents, by demography
59 5649 47 47 46 44 44 44 43 42 42 41 40 39 39 38 38 36 35 34 34 33 31 29 29 27 24
LV
PL
RO
EE
BG
SK
HU
DE
PT
LT FI
UK
EU
27
CZ
SE
NL
AT
FR
ES
DK
IT IE BE
CY
MT
EL SI
LU
Not prepared to pay
more
70 68 67 64 62 62 61 61 60 59 59 58 56 56 56 54 54 54 53 52 50 48 47 43 4337 35 35
54
48
57
52
52
48
49
57
50
50
50
48
46
44
47
44
46
45
43
46
43
42
40
32
38
34
30
31
16 21 9
12 10 14 13 5
10
10 9
10 10
12 10 10 7 9 10 6 7 6 7
11
5
3 5 4
SI
EL
LU IE BE
CY
DK
MT
ES
FR
IT AT
UK
SE
NL
DE
FI
EU
27
CZ
PT
HU
SK
LT
RO
BG
PL
LV
EE
Yes, I would pay more Yes, I would pay up to 10% more Yes, I would pay more than 10% more
Preparedness to pay more for using a less polluting transport
Q9. Would you be prepared to pay more for using a less polluting transport (energy efficient private and public vehicles, clean fuels...)? How much more would you be
prepared to pay?
%, Base: all respondents, by country
Looking at socio-demographic segments we can observe clear trends. Those who stated that they are not prepared to pay more in this situation are more likely to be men than women. The older and the less educated are also more likely they say that they are not prepared to pay more. Those in rural zones, manual workers and primary car users more often mentioned that they are not willing to pay more in comparison to those living in other cities or in metropolitan areas, employees or those who are not primary car users. Those who are prepared to pay more than a 10 percent increase are more likely to be; men, the youngest generation, those with the highest level of education, citizens in metropolitan areas, the self-employed and employees. Conversely, those less inclined to pay more than 10 percent tend to be women, the elder generations (aged 40-54, and above 55), those with the lowest level of education, those living in rural zones and manual workers As concerns different types of car drivers (primary, non-primary) we found no difference.

The Gallup Organization Flash EB No206b � EU Transport Policy
Analytical Report page 37
Table 9. Preparedness to pay more for using a less polluting transport (%, by demography)
Yes, I
would
pay up
to 10%
more
Yes, I
would
pay
more
than
10%
more
Yes, I
would
pay up to
10%
more
Yes, I
would
pay
more
than
10%
more
EU27 45 9 45 9
SEX SUBJECTIVE URBANIZATION
Male 42 11 Metropolitan area 46 11
Female 48 8 Other towns 46 9
AGE Rural zones 44 8
15 - 24 50 12 OCCUPATION
25 - 39 46 10 Self-employed 45 11
40 - 54 47 8 Employee 48 11
55 + 42 8 Manual worker 42 6
EDUCATION (end of) Not working 44 9
Until 15 years of age 41 5 DRIVE
16 - 20 45 7 Primary driver 46 9
20 + 47 14 Other 45 9
Still in education 52 13
Q9. Would you be prepared to pay more for using a less polluting
transport (energy efficient private and public vehicles, clean fuels...)? -
How much more would you be prepared to pay?
4.2. Paying for congestion and environmental damage through road tolls The majority of respondents do not think that all road users should pay for congestion and environmental damage through road tolls. Six out of ten respondents feel this way, opposed by 35% of EU citizens who think that paying for congestion and environmental damage should be requested from every road user. 6% of respondents do not have an answer to this question, or did not want to share their opinion. In the six countries that top the ranking, those in favour of payment outnumber those opposed to it. These countries are the Czech Republic (54% to 40%), Lithuania (52% to 38%), Greece (51% to 45%), Latvia (51% to 40%), Poland (49% to 44%) and Bulgaria (46% to 40%). In Romania as many respondents agree as disagree (46% both). French, Italian and Hungarian respondents are the least likely to agree with the idea of general payment for all road users (24%, 25%, and 26%).
Yes; 35
DK/NA;
6
No; 60
Paying for congestion and environmental
damage through road tolls
Q10. In principle, do you think all road users should pay for congestion and
environmental damage through road tolls?
%, Base: all respondents
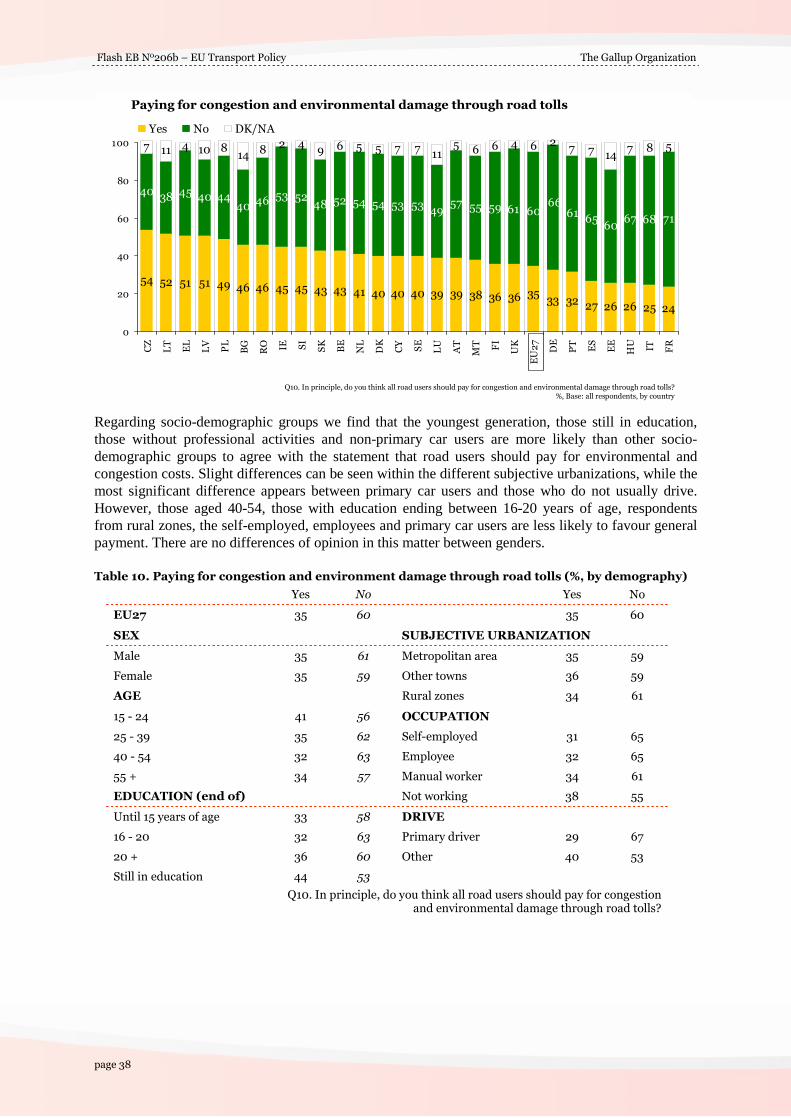
Flash EB No206b � EU Transport Policy The Gallup Organization
page 38
54 52 51 51 49 46 46 45 45 43 43 41 40 40 40 39 39 38 36 36 33 32 27 26 26 25 24
4038 45 40 44
4046 53 52
48 52 54 54 53 5349
57 55 5961
6560
67 68 71
7 11 4 10 814
82 4
9 6 5 5 7 711
5 6 6 4 6 27 7 14
7 8 5
35
61 6066
0
20
40
60
80
100C
Z
LT
EL
LV
PL
BG
RO IE SI
SK
BE
NL
DK
CY
SE
LU
AT
MT FI
UK
EU
27
DE
PT
ES
EE
HU
IT FR
Yes No DK/NA
Paying for congestion and environmental damage through road tolls
Q10. In principle, do you think all road users should pay for congestion and environmental damage through road tolls?
%, Base: all respondents, by country
Regarding socio-demographic groups we find that the youngest generation, those still in education, those without professional activities and non-primary car users are more likely than other socio-demographic groups to agree with the statement that road users should pay for environmental and congestion costs. Slight differences can be seen within the different subjective urbanizations, while the most significant difference appears between primary car users and those who do not usually drive. However, those aged 40-54, those with education ending between 16-20 years of age, respondents from rural zones, the self-employed, employees and primary car users are less likely to favour general payment. There are no differences of opinion in this matter between genders. Table 10. Paying for congestion and environment damage through road tolls (%, by demography)
Yes No Yes No
EU27 35 60 35 60
SEX SUBJECTIVE URBANIZATION
Male 35 61 Metropolitan area 35 59
Female 35 59 Other towns 36 59
AGE Rural zones 34 61
15 - 24 41 56 OCCUPATION
25 - 39 35 62 Self-employed 31 65
40 - 54 32 63 Employee 32 65
55 + 34 57 Manual worker 34 61
EDUCATION (end of) Not working 38 55
Until 15 years of age 33 58 DRIVE
16 - 20 32 63 Primary driver 29 67
20 + 36 60 Other 40 53
Still in education 44 53
Q10. In principle, do you think all road users should pay for congestion
and environmental damage through road tolls?

The Gallup Organization Flash EB No206b � EU Transport Policy
Analytical Report page 39
4.3. How to spend the collected money A slight majority of respondents think that the best way to spend any collected money would be investments in public transport; 40% of EU27 citizens chose this option. 36% of respondents favoured the improvement of road-related infrastructure (e.g. city tunnels, noise barriers). Only 17% of citizens are in favour of using the money as a general public expenditure. 7% of respondents do not know or did not want to answer this question. Old and New Member States think differently about how such money would be best spent. Those in Old Member States favour an investment in public transport (46%), while citizens in the New Member States are more interested in spending to improve road-related infrastructure (58%). Ireland and the UK (both with 61%) and Luxembourg (56%) are most likely to support the idea of investing the collected money in public transport, and Romania (11%), Latvia (12%) and Malta (15%) are the least in favour of this approach. Improvement of road related infrastructure would be the most welcome in Latvia (73%), Bulgaria (68%) and Romania (67%), while it is the least popular in Luxembourg (17%), in the United Kingdom (20%) and in Austria (22%). The least popular answer option, that of general public expenditure, is relatively the most popular in Spain, where 21% of the respondents mentioned it, and in Malta, Germany and Belgium (all with 20%). In three countries the votes for general public expenditures come in the second place, in Luxembourg, 19% outnumbering the percentage of those who chose road-related infrastructure; in Malta (20% to 15% - also over road-related infrastructure) and in Romania (12% outnumbering the 11% who mentioned public transport).
61 61 56 53 52 50 50 48 48 46 45 45 44 43 43 4033 29 29 28 25 19 18 18 15 12 11
25 2017
32 2822
3127 29 29 34 29
4132 34 36 48
45 5061 68
5755
7367
12 1619
9 1318
1520 12 20 16
1710
18 15 17 1313
1521 10
12
104
16 20
912
2 3 9 7 7 11 4 5 11 5 5 9 5 7 8 7 713
7 8 131
10 10 10 10 6 10
27
4350
62
0
20
40
60
80
100
IE UK
LU SE
CY
AT
NL
DE
PT
BE FI
IT SI
FR
DK
EU
27
SK
EE
CZ
ES
HU
EL
LT
BG
PL
MT
LV
RO
To invest in public transport To improve road-related infrastructure As general public expenditure DK/NA
How the money thus collected should be spent
Q11. How should the money thus collected be spent?
%, Base: all respondents, by country
DK/NA; 7
Improve road-
related
infrastructure;
36
As general
public
expenditure;
17
Invest in
public
transport; 40
How the money thus collected should be spent
Q11. How should the money thus collected be spent?
%, Base: all respondents
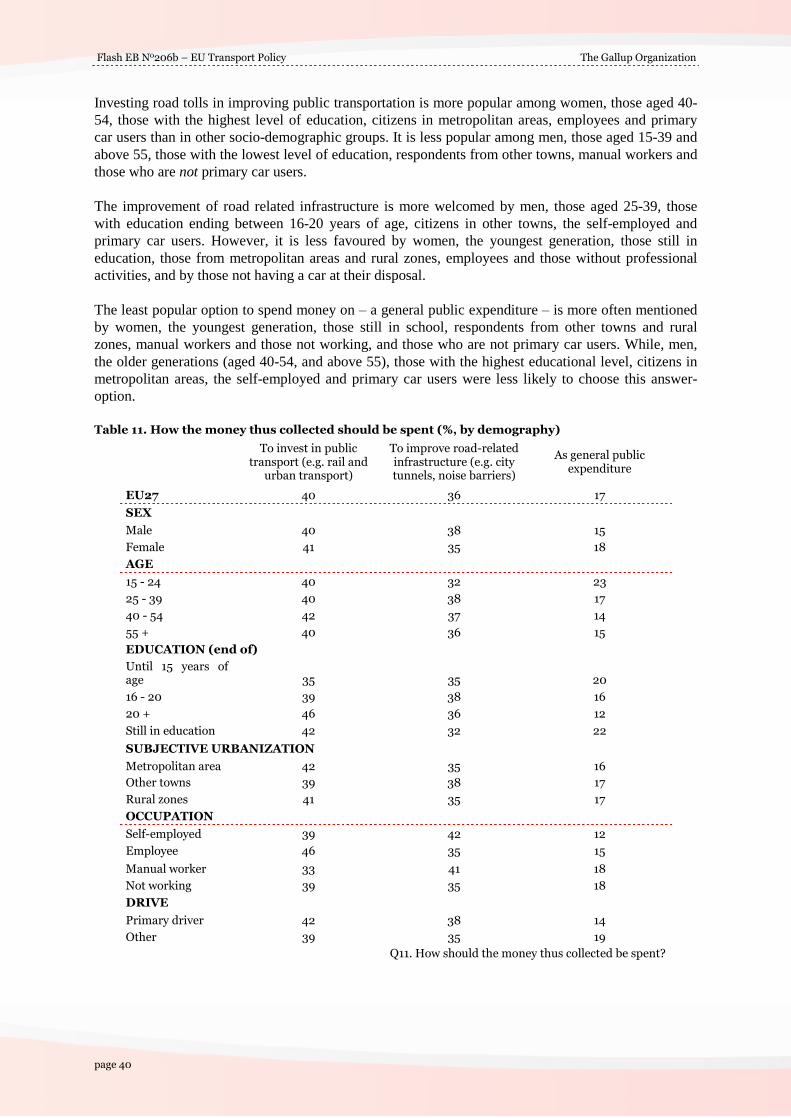
Flash EB No206b � EU Transport Policy The Gallup Organization
page 40
Investing road tolls in improving public transportation is more popular among women, those aged 40-54, those with the highest level of education, citizens in metropolitan areas, employees and primary car users than in other socio-demographic groups. It is less popular among men, those aged 15-39 and above 55, those with the lowest level of education, respondents from other towns, manual workers and those who are not primary car users. The improvement of road related infrastructure is more welcomed by men, those aged 25-39, those with education ending between 16-20 years of age, citizens in other towns, the self-employed and primary car users. However, it is less favoured by women, the youngest generation, those still in education, those from metropolitan areas and rural zones, employees and those without professional activities, and by those not having a car at their disposal. The least popular option to spend money on � a general public expenditure � is more often mentioned by women, the youngest generation, those still in school, respondents from other towns and rural zones, manual workers and those not working, and those who are not primary car users. While, men, the older generations (aged 40-54, and above 55), those with the highest educational level, citizens in metropolitan areas, the self-employed and primary car users were less likely to choose this answer-option. Table 11. How the money thus collected should be spent (%, by demography)
To invest in public
transport (e.g. rail and
urban transport)
To improve road-related
infrastructure (e.g. city
tunnels, noise barriers)
As general public
expenditure
EU27 40 36 17
SEX
Male 40 38 15
Female 41 35 18
AGE
15 - 24 40 32 23
25 - 39 40 38 17
40 - 54 42 37 14
55 + 40 36 15
EDUCATION (end of)
Until 15 years of
age 35 35 20
16 - 20 39 38 16
20 + 46 36 12
Still in education 42 32 22
SUBJECTIVE URBANIZATION
Metropolitan area 42 35 16
Other towns 39 38 17
Rural zones 41 35 17
OCCUPATION
Self-employed 39 42 12
Employee 46 35 15
Manual worker 33 41 18
Not working 39 35 18
DRIVE
Primary driver 42 38 14
Other 39 35 19
Q11. How should the money thus collected be spent?

The Gallup Organization Flash EB No206b � EU Transport Policy
Analytical Report page 41
5. Flight safety and passenger rights
5.1. Attitudes toward security controls at the airports The majority of citizens in the EU27 countries (38%) responded that they fly rarely, and are thus not really capable of answering questions related to airport security control. If we also take into account the ratio of those citizens who could not or did not want to answer this question (5%), then the share of citizens in the EU27 countries who did not give a valid answer is 43% - thus the share of those who give a valid answer is 57%). The majority of respondents, approximately one third of all citizens in the EU27 countries, were of the opinion that security control at the airports was appropriate (34%). The ratio of those respondents who considered airport security insufficient was much smaller (13%). However, the ratio of those who believe that security control at the airports is insufficient was still higher than the proportion of those who think that security control is excessive (9%). If we investigate the opinion of those citizens in the EU27 countries who gave a valid answer to this question (they do not answer that they are not concerned, or that they could not or did not want to answer) we find that the majority of the respondents (61%) consider airport security control appropriate, while one quarter (24%) of the respondents find it insufficient and 16% excessive. The ratio of those who said they were not competent, or could not answer the question was much higher in New Member States than in the old ones (59% vs. 40%). This proportion was the highest in Hungary (74%), but was also high in Poland (66%), Bulgaria (65%), Latvia (63%), Lithuania (61%), Romania (59%), Estonia (54%), and Slovenia (54%), where more than half of the population was unable to competently answer the question. Overall, in 13 of the 27 countries investigated, the majority of citizens were unable to answer the question competently. The highest proportions of those who found airport security control insufficient were found in Cyprus (35%) and Italy (24%), but this answer was much less typical in the latter country. If we look at the Greeks and the Portuguese we find that every fifth citizen felt this way, making these two countries the third and fourth most likely to have a large number of citizens holding this opinion. The two countries where citizens were least likely to find airport control insufficient are Finland and Hungary (3% for both), but there are significant differences between these two countries, because while the majority of the Finnish population thought airport control was appropriate, the Hungarians � as we have already indicated � were not competent in the issue. If we investigate the opinion of only those citizens who gave a valid answer (they do not say that they are not concerned, or that they could not or did not want to answer), we find that more people in the NMS12 countries than in the EU15 countries think that airport security is insufficient (32% and 22%, respectively). This opinion is most likely to be held by the inhabitants of Poland (44%), Bulgaria (43%) and Cyprus (43%).
34
13
9
38
5
61
24
16
They are appropriate
They are insufficient
They are excessive
I am not concerned
as I seldom travel by plane
DK/NA
EU27, total sample
EU27, those who are
concerned
Opinion about the security controls at airports
Q12. Based on your experience or what you hear; what is your opinion on security controls at airports?
%, Base: all respondents and those who are concerned

Flash EB No206b � EU Transport Policy The Gallup Organization
page 42
At the level of the EU27, every tenth citizen considered airport security controls to be excessive, but this opinion is shared by more of the citizens in the EU15 (10%), than of the NMS12 countries (4%). The proportion of those who agree with this statement is significantly higher in Denmark (22%) and Austria (22%), where more than one fifth of the population thought that airport security control was excessive. The share of those who agree with this statement is higher than the average of the EU15 in the Netherlands (19%), Ireland (18%), Finland (17%), Sweden (17%), Luxemburg (16%), France (11%) and Slovenia (the only New Member State on this list, 11%). The share of those who consider airport security controls excessive is the lowest in Estonia, Bulgaria and Poland (2% in each of these countries). If we again examine only the answers of those citizens who gave a valid answer to the question, then we find that the rank of the countries does not change at all: the citizens in the very same countries indicated that � according to them � airport security controls were excessive. These were the inhabitants of Austria (35%), Holland (32%), Denmark (31%), Slovenia (24%), Ireland (24%), Luxemburg (24%), Finland (23%), Sweden (23%), and France (21%). However, we have to underline that when investigating only the valid answers more respondents of Slovenia (24%) and Hungary (18%) than of EU15 indicated that airport security controls are excessive (only these two countries are above the EU15 average). As we have already indicated above, in 13 out of the EU 27 Members States, the largest ratio of citizens is the group that is unable to capably answer questions regarding the security control at airports. (They said they are not competent or they could not or did not want to answer the question.) In the remaining 14 Member States, the largest proportion of respondents feels that controls at the airports are appropriate. Those in Finland (54%), and the UK (51%) are the most likely to agree with this judgement, as � in both countries � more than half of the population shared this opinion This opinion is also held by a relative majority in Sweden (49%), Malta (48%), and Ireland (48%).The share of those who consider controls at the airports appropriate is the lowest in Portugal (33%) and Greece (34%), but even in these countries, at least one third of the population thought that airport security controls were appropriate. If we analyse only the answers of those who are competent, then we find that the Estonians (even more than the Finnish � 73%) are the most likely to consider airport security controls appropriate (80%), while the citizens in Malta and in Hungary also have in general a positive opinion about airport security controls (71%), as do UK citizens (70%).

The Gallup Organization Flash EB No206b � EU Transport Policy
Analytical Report page 43
35 24 20 20 16 16 16 16 15 15 13 13 13 12 12 11 11 10 10 10 9 8 7 6 5 4 3 3
28 34 33 4838
2942
18 1734
51
22 26
4840 40
2138 32 33
4937 43
30 37
19
54
8
6 103
79
10
2 2
9
9
5 3
16 9
6
9 1911
17
2
22
11
22
5
17
13
3430
3325 30 43
25
48 53
38
25
44 43
2131 39
56
39 3746
22
45
26
47
35
67
24
7 8 5 9 8 95 8
16 13 5 317 16
2 2 1 6 4 2 2 5 10 4 7 3 7 1
3 8
1 8
5
CY IT EL
PT
MT
SK
ES
CZ
BG
PL
EU
27
UK
LT
RO IE LU
DE
LV
BE
NL
FR
SE
EE
DK SI
AT
HU FI
They are insufficient They are appropriate They are excessive I am not concerned as I seldom travel by plane DK/NA
Opinion about the security controls at airports,
total sample
Q12. Based on your experience or what you hear; what is your opinion on security controls at airports?
%, Base: all respondents by country
44 43 43 41 35 32 32 30 29 27 26 24 24 23 18 18 17 17 16 16 16 15 11 11 11 8 7 4
51 48 48 57 55 53 5464
56 62 7161 62 66 67 70
61 60
80
52 61 65 66 7161 59 73
6 6 10 8 12 15 167
17 12 516 15 15 12
21 24
4
3224 24 23 18
31 3523
5 0
1 61 1
PL
BG
CY IT PT
LT
EL
ES
RO
LV
SK
MT
EU
27
CZ
BE
DE
UK
FR
LU
EE
NL
IE SI
SE
HU
DK
AT FI
They are insufficient They are appropriate They are excessive
Those who are competent
It is far from surprising that the share of those who could not judge the adequacy of airport security controls was the highest among the members of the less affluent demographic segments, including women, the eldest, those with the lowest levels of education, the inhabitants of rural zones, manual workers, inactive people, and those who do not have a car at their disposal. Men, the youngest generation, those who are still in school, the inhabitants of metropolitan zones, employees, and the primary users of the household car are most likely to agree with the appropriateness of the security controls at the airports. If we only look at the answers of those who responded competently to this question (see the figures from the parentheses in the table below), then we find again that the ratio of those who thought that security controls at the airports were insufficient was the highest among members of the economically less successful demographic segments (women, the oldest people, those with the lowest level of education, the inhabitants of villages and small towns, manual workers, the inactive population, and those who were not the primary users of the household car). There is a higher proportion of those who are competent and feel that security controls at the airports are excessive, among those who belong to the demographic segments of men, those between the ages of 25-39, those with the highest educational level, those who live in metropolitan zones, and the self-employed.

Flash EB No206b � EU Transport Policy The Gallup Organization
page 44
Table 12. Opinion about the security controls at airports
(%, by demography, in parenthesis the proportions within those who meaningfully answered the question are
shown)
They are
appropriate
They are
insufficient
They are
excessive
I am not
concerned as I
seldom travel
by plane
EU27 34 (61) 13 (24) 9 (16) 38
SEX
Male 36 (61) 13 (21) 10 (17) 36
Female 32 (60) 14 (26) 8 (14) 40
AGE
15 - 24 38 (66) 11 (19) 9 (16) 38
25 - 39 34 (59) 14 (23) 11 (18) 38
40 - 54 35 (61) 14 (24) 9 (15) 37
55 + 32 (60) 14 (26) 7 (13) 40
EDUCATION (end of)
Until 15 years of age 25 (55) 15 (34) 5 (11) 46
16 - 20 34 (62) 14 (25) 7 (13) 40
20 + 39 (61) 13 (20) 13 (20) 32
Still in education 41 (65) 11 (18) 11 (17) 35
SUBJECTIVE URBANIZATION
Metropolitan area 37 (60) 14 (22) 12 (19) 34
Other towns 35 (61) 14 (24) 9 (15) 37
Rural zones 32 (62) 13 (24) 7 (14) 42
OCCUPATION
Self-employed 38 (60) 14 (22) 12 (18) 32
Employee 40 (63) 13 (20) 11 (17) 34
Manual worker 27 (61) 12 (27) 5 (12) 49
Not working 31 (59) 14 (26) 8 (15) 41
DRIVE
Primarily driven car 37 (63) 13 (21) 10 (16) 36
Other 31 (59) 14 (26) 8 (15) 41
Q12. Based on your experience or what you hear; what is your opinion on
security controls at airports?

The Gallup Organization Flash EB No206b � EU Transport Policy
Analytical Report page 45
5.2. Awareness of the rights for air passengers A majority of EU citizens are unaware of the rights of air passengers that must be respected by the airlines operating in the EU (49%). Of these respondents, 17% say this in spite of the fact that they travel by plane. On the other hand, almost as many, 46% of EU citizens responded that they were aware of passenger�s rights that must be respected by the airlines. The ratio of those who indicated that they were aware of the rights of air passengers was higher in the EU15 countries than in the NMS12 countries (48% vs. 39%). At the same time, however, the ratio of citizens who are not aware of air passenger�s rights in spite of the fact that they use air travel was also higher in the EU15 countries than in the NMS12 countries, (20% vs. 6%). Out of the 27 Member States of the EU, there are only 11 countries where the ratio of those aware of these rights is higher than that of those who are not: these countries are Cyprus, Portugal, Slovenia, Spain, Greece, Ireland, Italy, Denmark, Malta, the Netherlands, and Austria. In the remaining 16 countries, the citizens who are unaware of their rights at EU airports represent the majority.
9
3121
9
3022 17
37
16 177 3
20 1710
28
8
38
20
215
2310 6 9
237
5827
3648
2633 38
18
37 3543 46
29 3239
20
39
8
2714
27 30 276
21
5
4 29
2 6 1 01 1 3 1 0 14
2 6
18
2 71
6 1814
31 3 11
3 7
4 6
2738 40
3442 40 36
45 45 45 40 3750 46
3351 46
5348
39 4558
50 5361 58
67 66
3
41 38
24
HU FI
DE
LV
SE
LU
CZ
UK
FR
BE
LT
PL
NL
EU
27
EE
DK
SK IE AT
BG
RO
EL
MT IT SI
ES
CY
PT
No, although I do fly No, I never fly Yes
Awareness of there are certain rights for air passengers to be respected by airlines
Q13. Are you aware that there are certain rights for air passengers to be respected by airlines operating in the European Union, e.g. in case of flight
cancellation or delays?
%, Base: all respondents, by country The overall ratio of those who indicated that they were not aware of the rights for of passengers that must be respected by the airlines was the highest in Hungary (68%). This ratio was also high among the Finnish (58%), the Germans (57%) and the Latvians (57%). While among the Hungarians and the Latvians those who do not fly at all make up the largest ratio, in Finland and Germany, the majority of those who were not aware of their rights in this matter are among those who do travel by air. The ratio of those who were not aware of the rights of passengers at airports was the lowest among respondents in Portugal (28%) and Cyprus (29%), but the respective patterns are different in these two
Awareness of the rights for air passengers to be
respected by airlines
Q13. Are you aware that there are certain rights for air passengers to be respected by
airlines operating in the European Union, e.g. in case of flight cancellation or delays?
%, Base: all respondents
DK/NA; 6Yes; 46
No, I
never fly;
32
No,
although I
do fly; 17

Flash EB No206b � EU Transport Policy The Gallup Organization
page 46
countries, too. While among the Portuguese there is a majority unaware of their rights that do not fly at all, in Cyprus, the majority consists of those who are not aware of their rights but do fly. Consequently, the citizens in Cyprus and Portugal are the most conscious, 67% of the Cypriots and 66% of the Portuguese aware of the fact that at the airports of the EU, passengers have certain rights that the air companies must respect. This was indicated by a similarly high proportion of people in Slovenia (61%). If we investigate the above data by demographic characteristics we find that men, those aged between 40 � 54, those with the highest level of education, the citizens in metropolitan zones, and the self-employed and employees are more aware of the rights of air passengers. Those who know about these rights are also over-represented among primary users of family cars in comparison to other car drivers. The proportion of those who were not aware of the rights of air passengers was relatively high among women, the youngest people, those with a low level of education (respondents with the lowest level of education and also those who finished their studies between the ages of 16-20), inhabitants of rural zones, and manual workers (this time, we have analysed all the �no� answers together). There are relatively more people among the youngest, those who are still in school, the self-employed, employees who are not aware of the rights of air passengers that must be respected by the airlines at the airports of the EU, in spite of the fact that they travel by air.
49
4751
52
5046
47
5351
4149
43
4654
42
4758
50
4850
17
17
17
21
19
17
12
11
17
19
21
1 8
16
16
20
22
11
14
19
15
32
30
34
31
31
29
35
42
34
22
28
25
30
38
22
25
47
36
29
35
EU27
SEX
Male
Female
AGE
15 - 24
25 - 39
40 - 54
55 +
EDUCAT ION (end of)
Until 1 5 y ears of age
1 6 - 20
20 +
Still in education
SUBJECT IVE URBANIZAT ION
Metropolitan area
Other towns
Rural zones
OCCUPAT ION
Self-employed
Employee
Manual worker
Not working
DRIVE
Primarily driv en car
Other
Not aw are No, although I do fly No, I never fly
Awareness of there are certain rights for air passengers to be respected by airlines
Q13. Are you aware that there are certain rights for air passengers to be respected by airlines operating in the European Union, e.g. in case of flight cancellation or delays?
%, Base: all respondents, by country
46
48
44
44
45
48
45
36
43
55
47
52
48
40
53
50
35
43
48
44
Aw are

The Gallup Organization Flash EB No206b � EU Transport Policy
Analytical Report page 47
Flash EB Series #206
Attitudes on issues
related to
EU Transport Policy
Annex
Tables and
Survey
Details
THE GALLUP ORGANIZATION

Flash EB No206b � EU Transport Policy The Gallup Organization
page 48
6. Annex tables
Table 1a. Car in the household.............................................................................................................. 49
Table 1b. Car in the household............................................................................................................. 50
Table 2a. The main mode of transport................................................................................................... 51
Table 2b. The main mode of transport .................................................................................................. 52
Table 3a. The type of car and the way of its usage has an important impact on the environment and the
traffic situation in the respondents� area ............................................................................................... 53
Table 3b. The type of car and the way of its usage has an important impact on the environment and the
traffic situation in the respondents� area ............................................................................................... 54
Table 4a. Measures that could improve the traffic situation in the city and nearby.............................. 55
Table 4b. Measures that could improve the traffic situation in the city and nearby.............................. 56
Table 5a. The best way to reverse the rise of CO2 emissions from road transport ............................... 57
Table 5b. The best way to reverse the rise of CO2 emissions from road transport............................... 58
Table 6a. In what aspect the public transport should be better.............................................................. 59
Table 6b. In what aspect the public transport should be better ............................................................. 60
Table 7a. Doing anything to save fuel................................................................................................... 61
Table 7b. Doing anything to save fuel................................................................................................... 62
Table 8a. The best way to encourage the use of bio fuels ..................................................................... 63
Table 8b. The best way to encourage the use of bio fuels..................................................................... 64
Table 9a. Preparedness to pay more for using a less polluting transport .............................................. 65
Table 9b. Preparedness to pay more for using a less polluting transport .............................................. 66
Table 10a. Paying for congestion and environmental damage through road tolls................................. 67
Table 10b. Paying for congestion and environmental damage through road tolls ................................ 68
Table 11a. How the money thus collected should be spent................................................................... 69
Table 11b. How the money thus collected should be spent................................................................... 70
Table 12a. Opinion about the security controls at airports.................................................................... 71
Table 12b. Opinion about the security controls at airports.................................................................... 72
Table 13a. Awareness of the rights for air passengers to be respected by airlines................................ 73
Table 13b. Awareness of the rights for air passengers to be respected by airlines ............................... 74

The Gallup Organization Flash EB No206b � EU Transport Policy
Analytical Report page 49
Table 1a. Car in the household
QUESTION: Q1. Which of the following applies to you?
Total N % There is a
car in your
household
that is
primarily
driven by you
(that is: not
driven by
someone else)
% There is a
car/are cars
in your
household,
but primarily
driven by
other family
members
% There is no
car in your
household
% DK/NA
EU27 25767 48.8 32.1 18.8 0.3
COUNTRY
Belgium 1038 51.6 37.7 10.1 0.6
Bulgaria 1010 25.7 32 42.1 0.2
Czech Rep. 1012 44.6 33.2 21.9 0.3
Denmark 1018 49 35.8 14.4 0.8
Germany 1017 53.2 31.8 14.6 0.4
Estonia 1006 34.3 27.7 37.6 0.3
Greece 1011 48.8 34.8 16.3 0.1
Spain 1007 47.9 34.7 17.3 0
France 1001 61.2 27.4 11.4 0.1
Ireland 1000 50 41.8 7.8 0.3
Italy 1009 53.3 39.8 6.5 0.3
Cyprus 508 66.5 27.9 5.6 0
Latvia 1016 31 20.5 48.2 0.3
Lithuania 1009 40.4 33.2 26.1 0.3
Luxembourg 541 49.6 42.6 7.2 0.5
Hungary 1017 34.1 27.6 38.1 0.2
Malta 505 52.5 37.3 9.4 0.9
Netherlands 1006 54.8 30.9 14.3 0
Austria 1000 55.5 32.6 11.7 0.2
Poland 1004 33.7 33.4 32.3 0.5
Portugal 1000 49.3 32.4 18.2 0.1
Romania 1009 22.2 23.6 53.7 0.5
Slovenia 1004 49.1 42.7 8 0.1
Slovakia 1009 24.6 40.1 35.2 0.1
Finland 1000 52.7 29.3 17.6 0.4
Sweden 1003 48.2 35.3 15 1.5
United Kingdom 1007 52.1 26.9 20.9 0.1

Flash EB No206b � EU Transport Policy The Gallup Organization
page 50
Table 1b. Car in the household
QUESTION: Q1. Which of the following applies to you?
Total N % There is
a car in
your
household
that is
primarily
driven by
you (that
is: not
driven by
someone
else)
% There is
a car/are
cars in
your
household
, but
primarily
driven by
other
family
members
% There is
no car in
your
household
% DK/NA
EU27 25767 48.8 32.1 18.8 0.3
SEX
Male 12465 58 25.9 15.8 0.3
Female 13302 40.2 37.8 21.7 0.3
AGE
15 - 24 3851 22.6 59.1 18 0.3
25 - 39 6567 57.5 26.3 16 0.3
40 - 54 7044 56.2 30.5 13 0.3
55 + 8170 47.6 25.5 26.7 0.3
EDUCATION (end of)
Until 15 years of age 4355 40.4 30 29.4 0.2
16 - 20 10912 52.9 28.2 18.7 0.2
20 + 6938 61 25.6 12.9 0.5
Still in education 2972 20.5 65.1 14.1 0.2
LOCALITY TYPE
Metropolitan area 5338 46.2 29.3 24.4 0.1
Other towns 10032 46.5 33 20.1 0.4
Rural zones 10313 52.5 32.5 14.8 0.3
OCCUPATION
Self-employed 2370 63.1 26.6 9.9 0.3
Employee 8435 61.3 27.3 10.9 0.5
Manual worker 2243 55.7 23.7 20.6 0.1
Not working 12638 36.4 37.8 25.6 0.2
DRIVE
Primarily driven car 12572 100 0 0 0
Other 13195 0 62.6 36.8 0.6
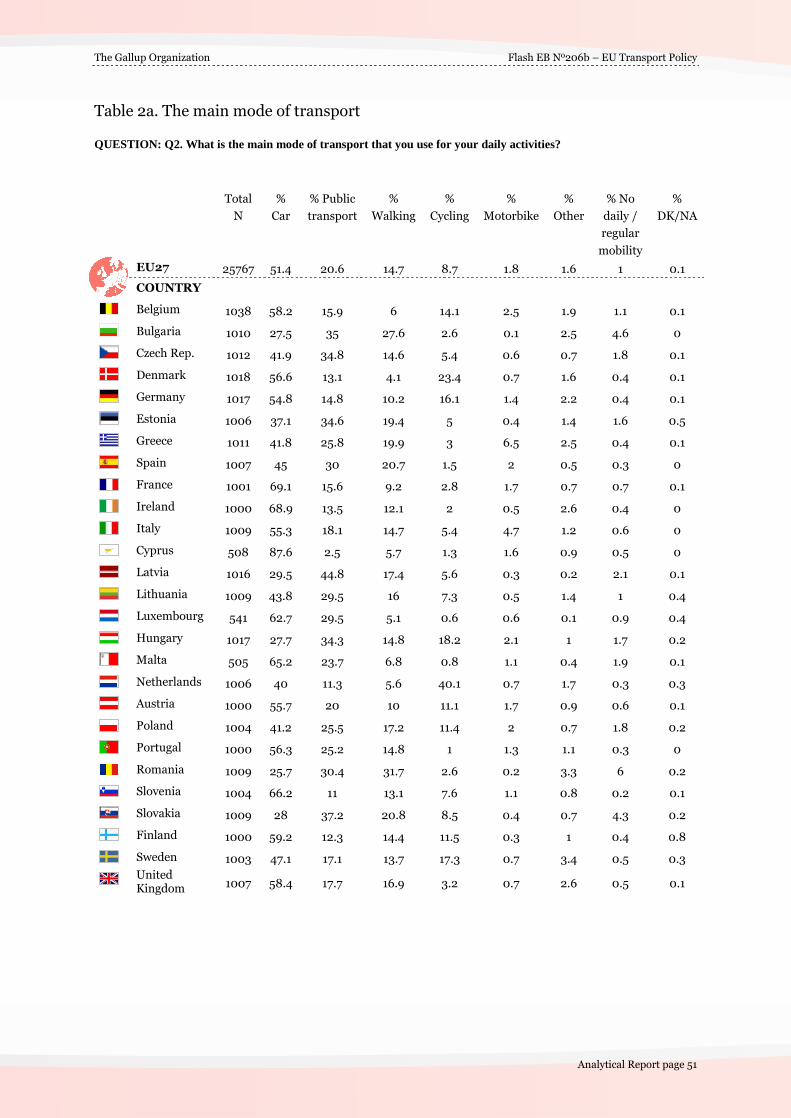
The Gallup Organization Flash EB No206b � EU Transport Policy
Analytical Report page 51
Table 2a. The main mode of transport
QUESTION: Q2. What is the main mode of transport that you use for your daily activities?
Total
N
%
Car
% Public
transport
%
Walking
%
Cycling
%
Motorbike
%
Other
% No
daily /
regular
mobility
%
DK/NA
EU27 25767 51.4 20.6 14.7 8.7 1.8 1.6 1 0.1
COUNTRY
Belgium 1038 58.2 15.9 6 14.1 2.5 1.9 1.1 0.1
Bulgaria 1010 27.5 35 27.6 2.6 0.1 2.5 4.6 0
Czech Rep. 1012 41.9 34.8 14.6 5.4 0.6 0.7 1.8 0.1
Denmark 1018 56.6 13.1 4.1 23.4 0.7 1.6 0.4 0.1
Germany 1017 54.8 14.8 10.2 16.1 1.4 2.2 0.4 0.1
Estonia 1006 37.1 34.6 19.4 5 0.4 1.4 1.6 0.5
Greece 1011 41.8 25.8 19.9 3 6.5 2.5 0.4 0.1
Spain 1007 45 30 20.7 1.5 2 0.5 0.3 0
France 1001 69.1 15.6 9.2 2.8 1.7 0.7 0.7 0.1
Ireland 1000 68.9 13.5 12.1 2 0.5 2.6 0.4 0
Italy 1009 55.3 18.1 14.7 5.4 4.7 1.2 0.6 0
Cyprus 508 87.6 2.5 5.7 1.3 1.6 0.9 0.5 0
Latvia 1016 29.5 44.8 17.4 5.6 0.3 0.2 2.1 0.1
Lithuania 1009 43.8 29.5 16 7.3 0.5 1.4 1 0.4
Luxembourg 541 62.7 29.5 5.1 0.6 0.6 0.1 0.9 0.4
Hungary 1017 27.7 34.3 14.8 18.2 2.1 1 1.7 0.2
Malta 505 65.2 23.7 6.8 0.8 1.1 0.4 1.9 0.1
Netherlands 1006 40 11.3 5.6 40.1 0.7 1.7 0.3 0.3
Austria 1000 55.7 20 10 11.1 1.7 0.9 0.6 0.1
Poland 1004 41.2 25.5 17.2 11.4 2 0.7 1.8 0.2
Portugal 1000 56.3 25.2 14.8 1 1.3 1.1 0.3 0
Romania 1009 25.7 30.4 31.7 2.6 0.2 3.3 6 0.2
Slovenia 1004 66.2 11 13.1 7.6 1.1 0.8 0.2 0.1
Slovakia 1009 28 37.2 20.8 8.5 0.4 0.7 4.3 0.2
Finland 1000 59.2 12.3 14.4 11.5 0.3 1 0.4 0.8
Sweden 1003 47.1 17.1 13.7 17.3 0.7 3.4 0.5 0.3
United
Kingdom 1007 58.4 17.7 16.9 3.2 0.7 2.6 0.5 0.1

Flash EB No206b � EU Transport Policy The Gallup Organization
page 52
Table 2b. The main mode of transport
QUESTION: Q2. What is the main mode of transport that you use for your daily activities?
To
tal
N
% C
ar
% P
ub
lic
tra
nsp
ort
% W
alk
ing
% C
ycli
ng
% M
oto
rbik
e
% O
ther
% N
o d
ail
y /
reg
ula
r m
ob
ilit
y
% D
K/N
A
EU27 25767 51.4 20.6 14.7 8.7 1.8 1.6 1 0.1
SEX
Male 12465 57.5 18 10.2 8.3 3.3 1.9 0.7 0.1
Female 13302 45.8 23.1 18.8 9.1 0.5 1.3 1.3 0.1
AGE
15 - 24 3851 29.8 38.6 13.8 11.6 4.6 1.5 0.2 0
25 - 39 6567 61.9 16.9 11 6.7 1.7 1.3 0.4 0.1
40 - 54 7044 61.3 14.1 13 7.6 1.7 1.4 0.7 0.1
55 + 8170 44.8 20.8 19.3 10 0.8 2 2.1 0.1
EDUCATION
(end of)
Until 15 years of
age 4355 44.4 19.4 20.4 9 1.3 2.5 3 0
16 - 20 10912 56.7 17.1 14.2 8.2 1.5 1.4 0.8 0.1
20 + 6938 59.7 17.8 11.3 8.2 1.5 1.2 0.2 0.1
Still in
education 2972 27.1 40.5 14.7 11.4 4.9 1.5 0.1 0
LOCALITY
TYPE
Metropolitan
area 5338 40.4 35.1 12.7 7.7 2 1.4 0.6 0.1
Other towns 10032 47.1 21.1 18.6 9.3 1.8 1.3 0.7 0.1
Rural zones 10313 61.5 12.6 11.9 8.6 1.8 1.9 1.5 0.1
OCCUPATION
Self-employed 2370 70.1 9.6 8.9 5.7 1.9 3 0.8 0
Employee 8435 64.3 16.7 9.3 7 1.8 0.7 0.2 0.1
Manual worker 2243 60.3 15.8 10.5 7.7 3.7 1.6 0.3 0.1
Not working 12638 37.7 26.3 20 10.6 1.6 1.9 1.7 0.1
DRIVE
Primarily driven
car 12572 77.2 7.2 7.6 5.5 1.3 0.7 0.3 0.1
Other 13195 26.9 33.5 21.4 11.7 2.3 2.4 1.7 0.1

The Gallup Organization Flash EB No206b � EU Transport Policy
Analytical Report page 53
Table 3a. The type of car and the way of its usage has an important impact on the
environment and the traffic situation in the respondents� area
QUESTION: Q3_A-B. Do you think the type of car people drive and the way they use it has an important impact on:
% of �yes� shown
Total N the traffic situation
in your area
the environment in
your area
EU27 25767 74.4 78.2
COUNTRY
Belgium 1038 74.9 82.2
Bulgaria 1010 75.4 82.2
Czech Rep. 1012 79.3 81
Denmark 1018 64.2 71.2
Germany 1017 75.1 78.4
Estonia 1006 58 69.4
Greece 1011 84.3 80.9
Spain 1007 79.7 83.6
France 1001 73.4 76.3
Ireland 1000 75.1 81.2
Italy 1009 78.3 80.7
Cyprus 508 79.3 82.9
Latvia 1016 68.8 68.4
Lithuania 1009 71.7 76.4
Luxembourg 541 75.4 80.8
Hungary 1017 65.9 72.7
Malta 505 80.1 79.9
Netherlands 1006 69.3 75.9
Austria 1000 79.1 81.5
Poland 1004 81.6 82.6
Portugal 1000 68.7 70.9
Romania 1009 53 63.7
Slovenia 1004 75.5 81.4
Slovakia 1009 76.1 87.1
Finland 1000 53.2 62.2
Sweden 1003 64.8 79.5
United Kingdom 1007 74.2 77

Flash EB No206b � EU Transport Policy The Gallup Organization
page 54
Table 3b. The type of car and the way of its usage has an important impact on the
environment and the traffic situation in the respondents� area
QUESTION: Q3_A-B. Do you think the type of car people drive and the way they use it has an important impact on:
% of �yes� shown
Total N the traffic situation
in your area
the environment in
your area
EU27 25767 74.4 78.2
SEX
Male 12465 72.7 75.9
Female 13302 75.9 80.3
AGE
15 - 24 3851 72.5 79.1
25 - 39 6567 77.4 81.4
40 - 54 7044 74.6 79.2
55 + 8170 72.5 74.2
EDUCATION (end of)
Until 15 years of age 4355 70.3 71.5
16 - 20 10912 74 77.3
20 + 6938 77.5 82.4
Still in education 2972 75.1 82.6
LOCALITY TYPE
Metropolitan area 5338 80.8 85
Other towns 10032 78.1 81.9
Rural zones 10313 67.4 70.9
OCCUPATION
Self-employed 2370 72.9 73.6
Employee 8435 77.8 83.3
Manual worker 2243 69.8 73.6
Not working 12638 73.1 76.3
DRIVE
Primarily driven car 12572 76.4 78.7
Other 13195 72.5 77.6

The Gallup Organization Flash EB No206b � EU Transport Policy
Analytical Report page 55
Table 4a. Measures that could improve the traffic situation in the city and nearby
QUESTION: Q4. Thinking of the city you are living or the one you live nearby, which of the following measures could, in your opinion, improve the traffic situation there?
Total
N
% Better
public
transport
%
Limitations
in city
centres
(parking,
access for
private cars
or trucks)
% Speed
limitations
%
Charges
for road
usage
(e.g.
city
tolls)
% No
need to
improve
%
Other
%
DK/NA
EU27 25767 48.5 16.8 16.5 4.8 5.9 3.8 3.7
COUNTRY
Belgium 1038 46.9 17.1 18.8 5.1 6.3 4.4 1.5
Bulgaria 1010 21.2 21.4 38.7 3.7 2.7 6 6.3
Czech Rep. 1012 39.5 26.4 13.4 7.9 4 5 3.8
Denmark 1018 46.3 12 17.3 8.4 9 2.7 4.3
Germany 1017 45 14.2 17.4 6.9 9.9 3.9 2.7
Estonia 1006 38.8 16.1 18.9 3.1 12.3 4 6.8
Greece 1011 41.2 33 13 5.4 1.9 4.7 0.8
Spain 1007 58.2 14 13.7 1.1 6.1 4.4 2.4
France 1001 46.1 18.8 20 4.5 5.2 2 3.5
Ireland 1000 67 13.2 9.8 6.4 0.4 1.4 1.7
Italy 1009 62.4 14.8 10.4 1.8 4.2 3.3 3.1
Cyprus 508 57.3 9.7 22 4.5 1.6 2.4 2.6
Latvia 1016 25 25.8 20.7 6.8 10.3 6.4 5
Lithuania 1009 24.4 25.7 25.8 5.8 7.9 5.3 5.1
Luxembourg 541 55.6 9.3 17.2 5.1 6.4 3.9 2.5
Hungary 1017 33.9 24 20.6 2.9 10.1 4.2 4.3
Malta 505 44 19.3 20.7 3.5 3.3 4 5.1
Netherlands 1006 53.1 14.4 13.7 5.3 6.8 4.6 2.1
Austria 1000 52.2 12.8 9.2 7.2 9.9 2.2 6.5
Poland 1004 27.1 21.8 27.6 3.5 6.4 7.1 6.5
Portugal 1000 59.7 17.3 8.8 2.4 6.6 1.8 3.5
Romania 1009 39.1 14.7 17 9.5 6.2 6.2 7.2
Slovenia 1004 45.1 20.1 24.5 2.8 2.4 3.1 2
Slovakia 1009 36.7 26.9 21.2 4 4.5 3.1 3.6
Finland 1000 52.7 15.5 12.2 4.8 8 3.1 3.7
Sweden 1003 52 14.5 14.2 6.6 5 3.2 4.5
United
Kingdom 1007 59.8 14.4 12.4 5.9 1.3 2.3 3.9

Flash EB No206b � EU Transport Policy The Gallup Organization
page 56
Table 4b. Measures that could improve the traffic situation in the city and nearby
QUESTION: Q4. Thinking of the city you are living or the one you live nearby, which of the following measures could, in your opinion, improve the traffic situation there?
Total
N
% Better
public
transport
%
Limitations
in city
centres
(parking,
access for
private
cars or
trucks)
% Speed
limitations
%
Charges
for road
usage
(e.g.
city
tolls)
% No
need to
improve
%
Other
%
DK/NA
EU27 25767 48.5 16.8 16.5 4.8 5.9 3.8 3.7
SEX
Male 12465 49.1 17.9 12.5 5.8 6.3 5.4 3.1
Female 13302 48 15.9 20.3 3.9 5.5 2.3 4.2
AGE
15 - 24 3851 47.6 20.2 17.1 6.8 4.3 2.1 1.9
25 - 39 6567 50.7 18.6 15.5 5 4.3 3 2.8
40 - 54 7044 53.1 15.1 13.3 5 6.4 4.4 2.8
55 + 8170 43.1 15.4 19.9 3.6 7.4 4.7 5.9
EDUCATION
(end of)
Until 15 years of
age 4355 44.3 12.1 21.2 2.5 7.6 4.9 7.4
16 - 20 10912 47.7 17.4 17.2 4.7 6.2 3.4 3.5
20 + 6938 52.6 18.2 12.5 5.7 5 4.1 1.9
Still in
education 2972 49.5 19.3 16.2 6.8 3.3 3 2
LOCALITY
TYPE
Metropolitan
area 5338 52.3 18.5 12.8 6.1 3.7 4.3 2.3
Other towns 10032 46.9 18.8 17 4.5 5.8 4 3.1
Rural zones 10313 48 14.1 18.1 4.5 7.1 3.3 4.9
OCCUPATION
Self-employed 2370 50.3 18 10.8 5.3 5.4 6.4 3.8
Employee 8435 56 16.9 12.6 4.9 4.6 2.9 2.1
Manual worker 2243 44.3 17.8 16.5 6 6.2 4.5 4.7
Not working 12638 44 16.3 20.2 4.4 6.7 3.8 4.5
DRIVE
Primarily driven
car 12572 53 16.1 13.8 4 6.2 4.2 2.6
Other 13195 44.3 17.6 19.1 5.6 5.5 3.4 4.7

The Gallup Organization Flash EB No206b � EU Transport Policy
Analytical Report page 57
Table 5a. The best way to reverse the rise of CO2 emissions from road transport
QUESTION: Q5. Road transport generates about one fifth of the EU's harmful emissions. Between 1990 and 2004, CO2 emissions from road transport rose by 26%. Which is the best way to reverse this trend?
Total N %
Introduce
restrictions
to the use
of cars.
% Only
allow the
sale of less
polluting
vehicles
% Promote
the
purchase of
fuel-
efficient
vehicles by
giving
better
information
% Promote
the
purchase
of fuel-
efficient
vehicles
through
tax
incentives
% DK/NA
EU27 25767 10.8 35 16.3 29.9 8
COUNTRY
Belgium 1038 9.4 36.2 15.2 30.9 8.3
Bulgaria 1010 13.7 34.4 10.1 31.7 10
Czech Rep. 1012 15.9 42.7 14.9 20.2 6.3
Denmark 1018 9.8 31.4 15.6 31.5 11.8
Germany 1017 9.9 32 14.8 36.7 6.5
Estonia 1006 11.2 26.7 18.3 28.5 15.3
Greece 1011 22.7 28.3 17.5 26.8 4.6
Spain 1007 8.6 46.9 18.2 16 10.3
France 1001 7 41.2 15.5 28.8 7.5
Ireland 1000 11.4 21.7 19.8 43.5 3.5
Italy 1009 14.2 40.3 11.6 26.5 7.4
Cyprus 508 17.9 23.6 17.1 32.5 8.9
Latvia 1016 10.5 35.2 11.7 33.8 8.8
Lithuania 1009 9 21.8 14.7 44.2 10.3
Luxembourg 541 13.4 32.8 19.5 20 14.4
Hungary 1017 15.8 30.2 15 35.4 3.6
Malta 505 8.2 39.8 7.5 28.4 16.2
Netherlands 1006 8.6 37.1 16.1 30.2 8
Austria 1000 15.1 29.9 14.4 30.7 9.9
Poland 1004 7 35.4 16.7 31.9 9
Portugal 1000 10 42.1 18.3 23.8 5.8
Romania 1009 10.4 38.9 18.8 19.1 12.8
Slovenia 1004 14.7 44.4 8.6 27.3 5
Slovakia 1009 10.7 33.9 26.2 23.9 5.2
Finland 1000 8.3 21.1 11.9 49.9 8.8
Sweden 1003 7.5 18.4 27.5 32.4 14.2
United Kingdom 1007 13 23 21.1 35.3 7.6
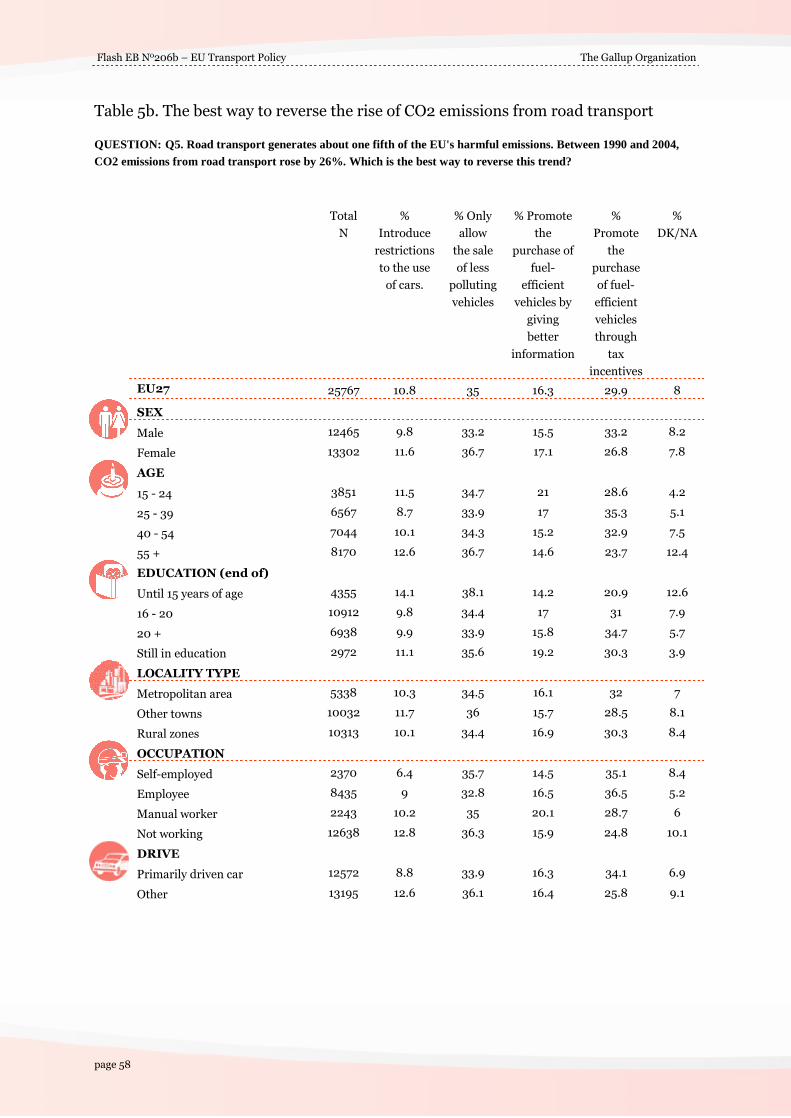
Flash EB No206b � EU Transport Policy The Gallup Organization
page 58
Table 5b. The best way to reverse the rise of CO2 emissions from road transport
QUESTION: Q5. Road transport generates about one fifth of the EU's harmful emissions. Between 1990 and 2004, CO2 emissions from road transport rose by 26%. Which is the best way to reverse this trend?
Total
N
%
Introduce
restrictions
to the use
of cars.
% Only
allow
the sale
of less
polluting
vehicles
% Promote
the
purchase of
fuel-
efficient
vehicles by
giving
better
information
%
Promote
the
purchase
of fuel-
efficient
vehicles
through
tax
incentives
%
DK/NA
EU27 25767 10.8 35 16.3 29.9 8
SEX
Male 12465 9.8 33.2 15.5 33.2 8.2
Female 13302 11.6 36.7 17.1 26.8 7.8
AGE
15 - 24 3851 11.5 34.7 21 28.6 4.2
25 - 39 6567 8.7 33.9 17 35.3 5.1
40 - 54 7044 10.1 34.3 15.2 32.9 7.5
55 + 8170 12.6 36.7 14.6 23.7 12.4
EDUCATION (end of)
Until 15 years of age 4355 14.1 38.1 14.2 20.9 12.6
16 - 20 10912 9.8 34.4 17 31 7.9
20 + 6938 9.9 33.9 15.8 34.7 5.7
Still in education 2972 11.1 35.6 19.2 30.3 3.9
LOCALITY TYPE
Metropolitan area 5338 10.3 34.5 16.1 32 7
Other towns 10032 11.7 36 15.7 28.5 8.1
Rural zones 10313 10.1 34.4 16.9 30.3 8.4
OCCUPATION
Self-employed 2370 6.4 35.7 14.5 35.1 8.4
Employee 8435 9 32.8 16.5 36.5 5.2
Manual worker 2243 10.2 35 20.1 28.7 6
Not working 12638 12.8 36.3 15.9 24.8 10.1
DRIVE
Primarily driven car 12572 8.8 33.9 16.3 34.1 6.9
Other 13195 12.6 36.1 16.4 25.8 9.1

The Gallup Organization Flash EB No206b � EU Transport Policy
Analytical Report page 59
Table 6a. In what aspect the public transport should be better
QUESTION: Q6. In order to encourage you to use your car less, in what aspect should the public transport be better?
Base: those whose car is primarily used for daily mobility
Total
N
%
Security
of public
transport,
% Closer
proximity
of stops to
where you
live,
% Better
connection
to your
regular
destinations,
% Better
schedule
(regularity
and
operating
hours),
% None
of the
above,
you
would
not use
the car
less
%
DK/NA
EU27 13256 6.4 11.5 28 28.6 22.1 3.4
COUNTRY
Belgium 604 7.9 16.3 28.9 26.3 17.3 3.4
Bulgaria 278 9.8 6.1 11.1 27.5 40.7 4.9
Czech Rep. 424 14.7 15.6 29.8 15.3 21.4 3.2
Denmark 576 5.3 14.9 26.4 29.2 21.8 2.4
Germany 557 3.1 7.6 38.1 24.1 23.4 3.7
Estonia 373 7.4 6.7 12.4 23.4 41.9 8.3
Greece 423 7.6 12.3 22 42.2 14.3 1.6
Spain 453 4 11.5 30.4 40.8 9.9 3.3
France 692 7.6 18.3 22.2 18.2 28.9 4.7
Ireland 689 5.3 22.8 22.9 32.2 14.7 2.1
Italy 558 5.8 8.5 29.9 37.8 15.9 2.1
Cyprus 445 12.3 16.3 19 40.8 8.9 2.6
Latvia 300 6.1 5.1 16.9 27.9 39.5 4.4
Lithuania 442 4 9.2 17.1 27.4 38 4.4
Luxembourg 339 10 7.2 26 36.9 15.6 4.3
Hungary 282 7.5 9.7 11.9 23.8 44.4 2.6
Malta 329 10.2 7.7 15.7 45.8 14.4 6.1
Netherlands 403 4.4 12.3 26.7 26.7 26.3 3.6
Austria 557 2.6 8.2 35.7 26.2 24.6 2.7
Poland 413 8.1 13.1 31.3 12.1 31.2 4.1
Portugal 563 10.8 13.2 21.1 40.6 12.5 1.9
Romania 259 18.1 11.1 13.6 20 32.6 4.5
Slovenia 664 2.7 16 29.2 38.1 12.3 1.7
Slovakia 282 6.8 9 36.4 18.2 26.7 2.8
Finland 592 2.5 8.6 36.1 29.8 18.8 4.1
Sweden 472 2.3 11.5 29.7 30.8 19.6 6.1
United Kingdom 588 8 9.6 22.2 38.7 19.3 2.2

Flash EB No206b � EU Transport Policy The Gallup Organization
page 60
Table 6b. In what aspect the public transport should be better
QUESTION: Q6. In order to encourage you to use your car less, in what aspect should the public transport be better?
Base: those whose car is primarily used for daily mobility
Total
N
%
Security
of public
transport,
% Closer
proximity
of stops
to where
you live,
% Better
connection
to your
regular
destinations,
% Better
schedule
(regularity
and
operating
hours),
%
None
of the
above,
you
would
not
use
the
car
less
%
DK/NA
EU27 13256 6.4 11.5 28 28.6 22.1 3.4
SEX
Male 7166 6.3 10.4 27.5 27.5 25 3.4
Female 6091 6.4 12.9 28.6 30 18.7 3.4
AGE
15 - 24 1148 6.7 10.3 25.2 41.2 14.3 2.3
25 - 39 4067 5.9 11.6 32.1 26.8 20.9 2.7
40 - 54 4319 6.2 10.6 29.8 29.1 21.7 2.6
55 + 3659 6.7 13.1 22.4 26 26.4 5.3
EDUCATION (end
of)
Until 15 years of age 1936 7.3 12.1 23 29.2 22.8 5.6
16 - 20 6185 6.4 11.7 26.8 26.6 25.1 3.4
20 + 4140 5.4 11.5 33.2 27.9 19.5 2.5
Still in education 804 8.3 9.3 23.8 46.8 10.6 1.2
LOCALITY TYPE
Metropolitan area 2154 9.2 10.3 25.2 31.9 19.8 3.6
Other towns 4727 6.4 9.8 27.8 30.4 22.6 3
Rural zones 6338 5.3 13.2 29 26.3 22.7 3.6
OCCUPATION
Self-employed 1662 7.6 8.3 25.9 25.9 28.6 3.7
Employee 5425 4.8 11.5 31.7 31 18.3 2.8
Manual worker 1351 6.7 13.3 28.3 21.9 25.7 4.1
Not working 4769 7.6 12.2 24.3 28.8 23.4 3.8
DRIVE
Primarily driven car 9704 5.9 11.1 28.6 28.4 22.9 3.1
Other 3553 7.7 12.8 26.3 29.2 20 4.1

The Gallup Organization Flash EB No206b � EU Transport Policy
Analytical Report page 61
Table 7a. Doing anything to save fuel
QUESTION: Q7_A-D. During the past year, have you done any of the following to save fuel?
% of �yes� shown
Base: those who has a car at disposal
Total N Adapted your
driving style
Used public
transport
more
Walked or
cycled more
Changed your
car to another
one which
uses less fuel
EU27 12572 56.8 26 55.9 25
COUNTRY
Belgium 535 64.1 32.8 61.2 19.8
Bulgaria 260 33.1 18 51.3 19.3
Czech Rep. 451 62.6 35.4 46 37.7
Denmark 499 48.7 18.2 43.9 29.4
Germany 541 74.6 25.7 66 27.7
Estonia 345 29.6 14.1 31.5 24.2
Greece 494 52.3 32.5 57.1 20.9
Spain 482 49 34.3 53.1 24.1
France 613 73.2 23.3 57.2 21.4
Ireland 500 39.3 33 53 22.3
Italy 538 42.1 25.2 56 21
Cyprus 338 36 3.2 38.2 23.5
Latvia 315 43 18.5 35 30.9
Lithuania 408 35.5 15.5 35.8 34.2
Luxembourg 268 67 45.7 56.4 36.4
Hungary 347 26.2 19.5 40.6 25.7
Malta 265 35.9 27.3 41.4 19.3
Netherlands 551 52.7 20.6 63.3 15.6
Austria 555 71 29.5 63.4 26.4
Poland 339 61.5 21.7 38.9 33.5
Portugal 493 46.1 24 55.3 15.5
Romania 224 54.7 15.7 35.9 35.6
Slovenia 493 66.8 25.2 63.2 31.6
Slovakia 248 43.9 35.6 51.4 43.6
Finland 527 57.4 14.9 50.5 23.7
Sweden 484 58.2 23.2 52.9 24.9
United Kingdom 525 38.6 29.6 54.8 27.1

Flash EB No206b � EU Transport Policy The Gallup Organization
page 62
Table 7b. Doing anything to save fuel
QUESTION: Q7_A-D. During the past year, have you done any of the following to save fuel?
% of �yes� shown
Base: those who has a car at disposal
Total N Adapted
your
driving
style
Used
public
transport
more
Walked or
cycled
more
Changed
your car to
another
one which
uses less
fuel
EU27 12572 56.8 26 55.9 25
SEX
Male 7231 57.8 25.2 53.6 26.2
Female 5341 55.4 27.1 59 23.4
AGE
15 - 24 870 50.2 36.2 51.6 20.1
25 - 39 3774 56.8 22.3 51.2 27.9
40 - 54 3960 54.8 22.4 57.2 26.8
55 + 3885 60.6 31 59.9 21.5
EDUCATION (end of)
Until 15 years of age 1760 56.3 25.3 60.2 23.6
16 - 20 5767 56.5 24.2 55.1 27.7
20 + 4232 58.3 26.8 55.7 22.9
Still in education 610 51.3 39 54.4 18.1
LOCALITY TYPE
Metropolitan area 2466 54.9 40.5 57 29.2
Other towns 4666 55.2 26.9 57.8 22.5
Rural zones 5410 59 18.8 53.8 25.2
OCCUPATION
Self-employed 1496 56.4 20.8 49 25
Employee 5173 56.1 23.8 54.8 25.2
Manual worker 1248 57.4 22.9 51.8 32.6
Not working 4595 57.5 31.1 60.5 22.7
DRIVE
Primarily driven car 12572 56.8 26 55.9 25
Other 0 0 0 0 0

The Gallup Organization Flash EB No206b � EU Transport Policy
Analytical Report page 63
Table 8a. The best way to encourage the use of bio fuels
QUESTION: Q8. Bio fuels are renewable fuels that can reduce fossil oil dependence of vehicles. Which is in your opinion the best measure to encourage the use of bio fuels?
Total
N
% Tax
incentives
to make
bio fuel
cheaper
% Higher
taxes for
polluting
vehicles
using
traditional
fossil fuel
% Compulsory
standards for
manufacturers
to produce
cars that use
bio fuel
% Crop
subsidies
for bio fuel
production
% Other
measures
%
DK/NA
EU27 25767 35.5 9.6 32.2 12.5 3.1 7.1
COUNTRY
Belgium 1038 35.4 8.1 32 16.4 3.4 4.7
Bulgaria 1010 37.1 10.8 20.8 13.9 1.6 15.7
Czech Rep. 1012 35.7 14.7 23.1 14.3 2.7 9.3
Denmark 1018 38.3 16.5 24.8 9.7 4 6.8
Germany 1017 35.8 9.9 39.2 5.4 4.3 5.3
Estonia 1006 41 9.9 18.7 7.5 3.2 19.6
Greece 1011 31.7 8.9 32.6 19.4 1.9 5.6
Spain 1007 20.2 9.9 36.1 17.8 6.1 10
France 1001 38.7 9.4 29.6 15 2.3 5
Ireland 1000 41.9 14.7 34 6.9 0.4 2
Italy 1009 30.5 8.3 34.6 13.9 4.3 8.4
Cyprus 508 36.9 13.4 27.6 14.5 2.3 5.4
Latvia 1016 40.2 9.7 22.8 15.7 2 9.6
Lithuania 1009 47.1 8.2 22.3 9.5 1.2 11.6
Luxembourg 541 26.2 17.3 24 17.4 6.2 8.9
Hungary 1017 45.9 3.4 20.1 24.4 2.2 4
Malta 505 38.2 9.4 13.6 9.7 5.8 23.3
Netherlands 1006 35.2 10 31.9 14.7 5 3.1
Austria 1000 35.7 8.4 38.4 8.3 3 6.3
Poland 1004 44.7 7.6 19.2 20.3 1 7.2
Portugal 1000 31.1 8.5 43.4 7.7 1.6 7.7
Romania 1009 30.5 10.6 19.8 16.3 1.8 21
Slovenia 1004 36.3 10.7 32.4 16.2 1.6 2.9
Slovakia 1009 32.8 8.7 27.7 21 1.2 8.5
Finland 1000 53.8 13 16.1 9 2.4 5.6
Sweden 1003 48 12.8 21.2 7.7 3.5 6.9
United
Kingdom 1007 38.1 10.3 40.4 5.5 1.6 4.1

Flash EB No206b � EU Transport Policy The Gallup Organization
page 64
Table 8b. The best way to encourage the use of bio fuels
QUESTION: Q8. Bio fuels are renewable fuels that can reduce fossil oil dependence of vehicles. Which is in your opinion the best measure to encourage the use of bio fuels?
Total
N
% Tax
incentives
to make
bio fuel
cheaper
% Higher
taxes for
polluting
vehicles
using
traditional
fossil fuel
% Compulsory
standards for
manufacturers
to produce
cars that use
bio fuel
% Crop
subsidies
for bio fuel
production
% Other
measures
%
DK/NA
EU27 25767 35.5 9.6 32.2 12.5 3.1 7.1
SEX
Male 12465 36.1 9.9 31.4 13.1 4.1 5.5
Female 13302 34.9 9.3 33 11.9 2.2 8.7
AGE
15 - 24 3851 33.8 14.1 32.6 13.4 1.4 4.7
25 - 39 6567 38.6 9.1 34.7 10.8 2.4 4.4
40 - 54 7044 36 8.6 33.7 12.9 3.7 5.2
55 + 8170 33.4 8.6 28.8 13 4 12.1
EDUCATION
(end of)
Until 15 years of
age 4355 31 8.4 30 13 3.6 14
16 - 20 10912 36.7 9.1 31.3 13.9 2.7 6.2
20 + 6938 38.2 9.1 34.3 10.2 3.7 4.5
Still in education 2972 32.7 14.3 36.4 11.4 1.8 3.4
LOCALITY
TYPE
Metropolitan
area 5338 36.4 11.1 32.5 10.8 3.2 6
Other towns 10032 34.1 9 33.6 12 3.5 7.8
Rural zones 10313 36.3 9.4 30.7 13.8 2.7 7.2
OCCUPATION
Self-employed 2370 36.8 7.2 33.6 14.3 3.9 4.2
Employee 8435 37.7 8.8 36.4 10.5 2.9 3.7
Manual worker 2243 38.7 9.2 27.2 15.3 2.3 7.2
Not working 12638 33.2 10.7 30 12.9 3.3 10
DRIVE
Primarily driven
car 12572 38.2 7.9 33.9 11.8 3.6 4.6
Other 13195 32.9 11.2 30.6 13.1 2.6 9.6

The Gallup Organization Flash EB No206b � EU Transport Policy
Analytical Report page 65
Table 9a. Preparedness to pay more for using a less polluting transport
QUESTION: Q9. Would you be prepared to pay more for using a less polluting transport (energy efficient private and public vehicles, clean fuels...)? - How much more would you be prepared to pay?
Total N % No, I am
not prepared
to pay more
% Yes, I
would pay up
to 10% more
% Yes, I would
pay more than
10% more
% DK/NA
EU27 25767 41 45.2 9.2 4.6
COUNTRY
Belgium 1038 33 51.6 10 5.4
Bulgaria 1010 46.7 37.9 4.7 10.7
Czech Rep. 1012 40.1 42.9 10.2 6.8
Denmark 1018 35.2 48.5 12.6 3.7
Germany 1017 43.6 43.6 10.1 2.7
Estonia 1006 47.2 30.6 3.9 18.3
Greece 1011 28.7 47.7 20.7 3
Spain 1007 36.2 50 9.7 4
France 1001 37.8 49.8 9.6 2.8
Ireland 1000 34 52.2 11.5 2.3
Italy 1009 34.2 50.4 8.5 6.8
Cyprus 508 30.9 48.4 13.6 7.1
Latvia 1016 59 30.4 4.5 6.1
Lithuania 1009 43 39.6 7.3 10.1
Luxembourg 541 24.2 57.2 9.4 9.1
Hungary 1017 44.4 43 6.6 6
Malta 505 29.2 56.5 4.7 9.6
Netherlands 1006 38.8 46.8 9.6 4.8
Austria 1000 38.1 48.4 9.6 3.9
Poland 1004 55.7 34.1 3 7.2
Portugal 1000 43.5 45.7 6 4.8
Romania 1009 48.7 32.2 10.8 8.3
Slovenia 1004 26.5 54.1 15.9 3.5
Slovakia 1009 46.1 42.2 6 5.7
Finland 1000 41.8 46.3 7.3 4.6
Sweden 1003 39 44 12.4 4.5
United Kingdom 1007 41.8 46 9.8 2.4

Flash EB No206b � EU Transport Policy The Gallup Organization
page 66
Table 9b. Preparedness to pay more for using a less polluting transport
QUESTION: Q9. Would you be prepared to pay more for using a less polluting transport (energy efficient private and public vehicles, clean fuels...)? - How much more would you be prepared to pay?
Total N % No, I am
not
prepared
to pay
more
% Yes, I
would pay
up to 10%
more
% Yes, I
would pay
more than
10% more
% DK/NA
EU27 25767 41 45.2 9.2 4.6
SEX
Male 12465 43.2 42.3 10.8 3.7
Female 13302 38.9 47.9 7.7 5.5
AGE
15 - 24 3851 34.4 49.7 12.1 3.8
25 - 39 6567 40.5 45.7 10.3 3.4
40 - 54 7044 41.2 46.9 8.3 3.7
55 + 8170 43.8 41.6 7.8 6.8
EDUCATION (end of)
Until 15 years of age 4355 46.5 40.7 4.9 7.9
16 - 20 10912 44.3 44.5 7.1 4
20 + 6938 35.5 47.2 14 3.2
Still in education 2972 31.9 51.8 12.5 3.7
LOCALITY TYPE
Metropolitan area 5338 38.8 45.8 11 4.4
Other towns 10032 39.7 45.9 9.4 5
Rural zones 10313 43.3 44.4 8.1 4.3
OCCUPATION
Self-employed 2370 41.6 45 11.2 2.3
Employee 8435 38.5 48.1 10.5 2.9
Manual worker 2243 46.9 41.6 6.3 5.2
Not working 12638 41.3 44.1 8.5 6.1
DRIVE
Primarily driven car 12572 42.3 45.8 8.9 2.9
Other 13195 39.7 44.7 9.4 6.2

The Gallup Organization Flash EB No206b � EU Transport Policy
Analytical Report page 67
Table 10a. Paying for congestion and environmental damage through road tolls
QUESTION: Q10. In principle, do you think all road users should pay for congestion and environmental damage through road tolls?
Total N % Yes % No % DK/NA
EU27 25767 34.7 59.8 5.5
COUNTRY
Belgium 1038 42.5 51.9 5.6
Bulgaria 1010 46.3 40 13.7
Czech Rep. 1012 53.7 39.5 6.7
Denmark 1018 40.3 54.3 5.4
Germany 1017 32.5 65.6 1.9
Estonia 1006 26.3 59.7 13.9
Greece 1011 51.4 44.7 3.9
Spain 1007 27.3 65.3 7.3
France 1001 23.8 71.4 4.8
Ireland 1000 44.8 53 2.2
Italy 1009 24.9 67.5 7.5
Cyprus 508 39.6 53.2 7.2
Latvia 1016 50.7 39.8 9.5
Lithuania 1009 51.8 37.6 10.6
Luxembourg 541 39.4 49.3 11.2
Hungary 1017 25.9 66.7 7.4
Malta 505 38.4 55.1 6.4
Netherlands 1006 41.2 54.3 4.5
Austria 1000 38.5 56.7 4.8
Poland 1004 49 43.5 7.5
Portugal 1000 31.9 60.6 7.4
Romania 1009 46.2 45.9 7.9
Slovenia 1004 44.5 51.9 3.6
Slovakia 1009 42.6 48.1 9.3
Finland 1000 35.9 58.5 5.6
Sweden 1003 39.6 53.3 7.1
United Kingdom 1007 35.7 60.9 3.5
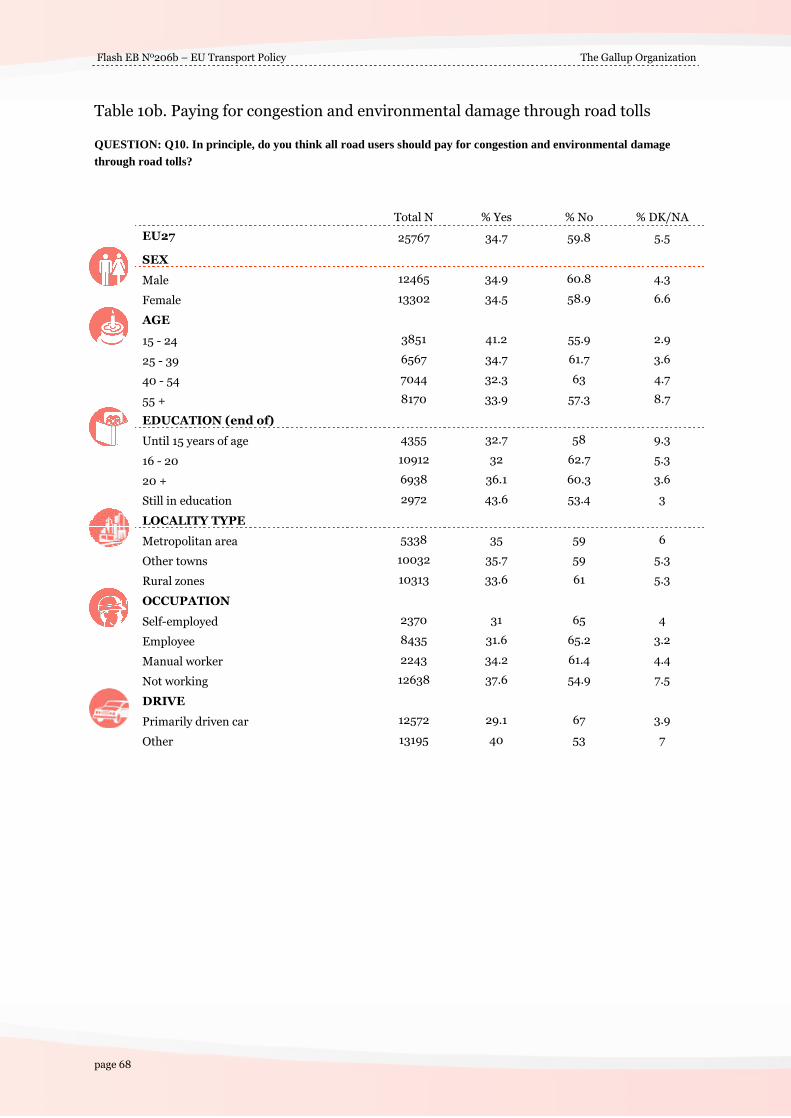
Flash EB No206b � EU Transport Policy The Gallup Organization
page 68
Table 10b. Paying for congestion and environmental damage through road tolls
QUESTION: Q10. In principle, do you think all road users should pay for congestion and environmental damage through road tolls?
Total N % Yes % No % DK/NA
EU27 25767 34.7 59.8 5.5
SEX
Male 12465 34.9 60.8 4.3
Female 13302 34.5 58.9 6.6
AGE
15 - 24 3851 41.2 55.9 2.9
25 - 39 6567 34.7 61.7 3.6
40 - 54 7044 32.3 63 4.7
55 + 8170 33.9 57.3 8.7
EDUCATION (end of)
Until 15 years of age 4355 32.7 58 9.3
16 - 20 10912 32 62.7 5.3
20 + 6938 36.1 60.3 3.6
Still in education 2972 43.6 53.4 3
LOCALITY TYPE
Metropolitan area 5338 35 59 6
Other towns 10032 35.7 59 5.3
Rural zones 10313 33.6 61 5.3
OCCUPATION
Self-employed 2370 31 65 4
Employee 8435 31.6 65.2 3.2
Manual worker 2243 34.2 61.4 4.4
Not working 12638 37.6 54.9 7.5
DRIVE
Primarily driven car 12572 29.1 67 3.9
Other 13195 40 53 7

The Gallup Organization Flash EB No206b � EU Transport Policy
Analytical Report page 69
Table 11a. How the money thus collected should be spent
QUESTION: Q11. How should the money thus collected be spent?
Total N % To improve
road-related
infrastructure
(e.g. city
tunnels, noise
barriers)
% To invest
in public
transport
(e.g. rail and
urban
transport)
% As general
public
expenditure
% DK/NA
EU27 25767 36.2 40.4 16.5 6.9
COUNTRY
Belgium 1038 29 46.1 20 4.9
Bulgaria 1010 68 17.6 4.4 10
Czech Rep. 1012 49.9 28.7 14.5 6.9
Denmark 1018 33.7 42.7 15.4 8.3
Germany 1017 27.4 48.1 19.6 5
Estonia 1006 44.9 29.1 12.6 13.4
Greece 1011 61.8 24.6 12.3 1.3
Spain 1007 42.9 28.4 21.1 7.6
France 1001 32.4 43 17.6 7
Ireland 1000 25 60.7 12.4 1.9
Italy 1009 29.1 44.6 17.3 9
Cyprus 508 28.3 52.3 12.7 6.7
Latvia 1016 73.3 11.5 9.3 5.9
Lithuania 1009 60.7 19.4 9.5 10.4
Luxembourg 541 16.8 55.5 19.1 8.5
Hungary 1017 50 27 10.2 12.8
Malta 505 55.4 14.9 19.9 9.8
Netherlands 1006 30.5 50.2 15 4.3
Austria 1000 21.5 50.3 17.5 10.8
Poland 1004 56.8 17.5 16.1 9.5
Portugal 1000 28.5 47.8 12.4 11.3
Romania 1009 67.2 11.1 11.7 10
Slovenia 1004 40.7 44 10.3 5
Slovakia 1009 47.9 32.5 12.9 6.7
Finland 1000 33.7 45.2 15.7 5.4
Sweden 1003 31.9 52.5 9.1 6.5
United Kingdom 1007 20.2 60.5 16 3.2

Flash EB No206b � EU Transport Policy The Gallup Organization
page 70
Table 11b. How the money thus collected should be spent
QUESTION: Q11. How should the money thus collected be spent?
Total N % To improve
road-related
infrastructure
(e.g. city
tunnels, noise
barriers)
% To
invest in
public
transport
(e.g. rail
and
urban
transport)
% As
general
public
expenditure
% DK/NA
EU27 25767 36.2 40.4 16.5 6.9
SEX
Male 12465 38.1 40.3 14.9 6.8
Female 13302 34.5 40.6 18 6.9
AGE
15 - 24 3851 31.8 39.6 23.4 5.2
25 - 39 6567 38 40 16.6 5.5
40 - 54 7044 37.1 42.4 14 6.5
55 + 8170 36.2 39.5 15.3 9
EDUCATION (end of)
Until 15 years of age 4355 35.3 34.5 19.9 10.3
16 - 20 10912 37.9 39.2 16.2 6.7
20 + 6938 36.1 46 12.4 5.5
Still in education 2972 32.2 42.2 21.8 3.7
LOCALITY TYPE
Metropolitan area 5338 34.8 41.9 16.2 7
Other towns 10032 37.8 39 16.5 6.6
Rural zones 10313 35.3 41.1 16.7 6.9
OCCUPATION
Self-employed 2370 42 38.7 12.2 7.1
Employee 8435 35.1 45.6 14.7 4.6
Manual worker 2243 40.7 32.6 17.8 8.9
Not working 12638 35 38.8 18.3 7.9
DRIVE
Primarily driven car 12572 37.5 41.9 14.3 6.3
Other 13195 35 39.1 18.6 7.4

The Gallup Organization Flash EB No206b � EU Transport Policy
Analytical Report page 71
Table 12a. Opinion about the security controls at airports
QUESTION: Q12. Based on your experience or what you hear; what is your opinion on security controls at airports?
Total N % They are
appropriate
% They are
insufficient
% They are
excessive
% I am not
concerned
as I seldom
travel by
plane
% DK/NA
EU27 25767 34.2 13.3 8.8 38.4 5.4
COUNTRY
Belgium 1038 37.5 10.2 9.2 38.7 4.4
Bulgaria 1010 18 15.4 2.1 48.4 16.1
Czech Rep. 1012 41.8 15.5 9.8 24.5 8.4
Denmark 1018 42.5 5.8 21.9 25.6 4.2
Germany 1017 40 10.6 9.1 39.4 0.9
Estonia 1006 36.8 7.3 1.8 44.5 9.5
Greece 1011 34.3 20.4 10 30.2 5.2
Spain 1007 28.6 15.7 8.5 42.5 4.7
France 1001 32.5 9.1 11.3 45.7 1.5
Ireland 1000 47.5 11.9 18.4 20.5 1.7
Italy 1009 27.8 23.5 6.3 34.4 8
Cyprus 508 38.4 34.8 7.7 12.5 6.6
Latvia 1016 21 10.3 6.2 56.3 6.2
Lithuania 1009 21.5 12.5 4.8 44 17.3
Luxembourg 541 40.3 11 15.8 30.9 2.1
Hungary 1017 18.7 2.9 4.8 66.9 6.8
Malta 505 48 16.3 3.1 25 7.6
Netherlands 1006 31.6 9.6 19.4 37 2.2
Austria 1000 37 4.1 21.8 34.6 2.5
Poland 1004 16.8 14.9 2.1 53.3 12.8
Portugal 1000 33.1 20.1 4.6 32.9 9.3
Romania 1009 26.4 12.2 2.8 42.9 15.8
Slovenia 1004 30 5.2 11 47.3 6.6
Slovakia 1009 38.2 16.2 7.4 29.6 8.6
Finland 1000 54.2 2.8 17.4 24.2 1.4
Sweden 1003 48.7 8 16.8 21.6 4.8
United Kingdom 1007 50.8 12.5 9 24.7 2.9

Flash EB No206b � EU Transport Policy The Gallup Organization
page 72
Table 12b. Opinion about the security controls at airports
QUESTION: Q12. Based on your experience or what you hear; what is your opinion on security controls at airports?
Total
N
% They are
appropriate
% They are
insufficient
% They
are
excessive
% I am
not
concerned
as I
seldom
travel by
plane
%
DK/NA
EU27 25767 34.2 13.3 8.8 38.4 5.4
SEX
Male 12465 36.3 12.7 10.1 36.3 4.7
Female 13302 32.2 13.9 7.5 40.3 6
AGE
15 - 24 3851 38.2 10.8 9.3 38.4 3.4
25 - 39 6567 34 13.5 10.5 38.2 3.8
40 - 54 7044 35.3 13.8 8.9 37.1 4.9
55 + 8170 31.7 13.9 7.1 39.5 7.8
EDUCATION (end of)
Until 15 years of age 4355 24.6 15.2 4.8 46.3 9.2
16 - 20 10912 33.8 13.7 7.4 39.7 5.4
20 + 6938 39.3 12.7 12.7 32.2 3
Still in education 2972 40.6 11.1 10.9 34.6 2.7
LOCALITY TYPE
Metropolitan area 5338 37.2 13.6 11.6 33.8 3.7
Other towns 10032 34.6 13.7 8.8 37.2 5.8
Rural zones 10313 32.4 12.8 7.3 41.8 5.8
OCCUPATION
Self-employed 2370 38.1 14.1 11.8 32 4
Employee 8435 40 13 10.7 33.6 2.8
Manual worker 2243 26.9 12 5.4 49 6.7
Not working 12638 30.9 13.6 7.6 40.8 7.1
DRIVE
Primarily driven car 12572 37.4 12.7 9.7 36 4.2
Other 13195 31.1 13.8 7.9 40.6 6.5

The Gallup Organization Flash EB No206b � EU Transport Policy
Analytical Report page 73
Table 13a. Awareness of the rights for air passengers to be respected by airlines
QUESTION: Q13. Are you aware that there are certain rights for air passengers to be respected by airlines operating in the European Union, e.g. in case of flight cancellation or delays?
Total N % Yes % No, although
I do fly
% No, I never
fly
% DK/NA
EU27 25767 45.8 16.6 31.9 5.7
COUNTRY
Belgium 1038 44.7 17 35.1 3.2
Bulgaria 1010 39.2 2.4 40.9 17.6
Czech Rep. 1012 35.5 16.9 37.5 10.1
Denmark 1018 50.5 27.8 19.7 2
Germany 1017 40.2 21.3 36.1 2.4
Estonia 1006 33.3 9.7 38.7 18.3
Greece 1011 57.8 15.2 24.3 2.7
Spain 1007 58.1 8.9 26.5 6.5
France 1001 45 16.4 37.4 1.2
Ireland 1000 53.1 37.9 8.3 0.7
Italy 1009 52.8 9.7 26.9 10.6
Cyprus 508 67.3 22.9 6.3 3.6
Latvia 1016 33.5 9.2 48.1 9.2
Lithuania 1009 39.7 7.1 42.8 10.3
Luxembourg 541 39.8 22.1 32.5 5.6
Hungary 1017 27.4 9.3 58.2 5.2
Malta 505 50.2 23.2 14 12.7
Netherlands 1006 49.7 19.7 29 1.6
Austria 1000 47.7 19.6 26.5 6.3
Poland 1004 36.8 3.3 45.9 14.1
Portugal 1000 66.1 7.2 21 5.6
Romania 1009 44.7 3.1 38.4 13.8
Slovenia 1004 60.9 6.3 29.6 3.3
Slovakia 1009 46.1 7.6 38.9 7.4
Finland 1000 38.2 31.1 27.2 3.5
Sweden 1003 42.4 29.6 25.7 2.4
United Kingdom 1007 44.5 36.6 17.6 1.2

Flash EB No206b � EU Transport Policy The Gallup Organization
page 74
Table 13b. Awareness of the rights for air passengers to be respected by airlines
QUESTION: Q13. Are you aware that there are certain rights for air passengers to be respected by airlines operating in the European Union, e.g. in case of flight cancellation or delays?
Total N % Yes % No, although I
do fly
% No, I
never fly
% DK/NA
EU27 25767 45.8 16.6 31.9 5.7
SEX
Male 12465 47.8 16.7 30 5.5
Female 13302 43.9 16.6 33.7 5.9
AGE
15 - 24 3851 43.5 21 31.2 4.3
25 - 39 6567 45.3 19.4 30.7 4.5
40 - 54 7044 48.1 16.7 29.2 5.9
55 + 8170 45.3 12.4 35.3 7.1
EDUCATION (end of)
Until 15 years of age 4355 36.4 11.1 42.1 10.4
16 - 20 10912 43.4 16.9 34.4 5.3
20 + 6938 55.3 18.9 22.4 3.5
Still in education 2972 47.4 20.7 27.6 4.3
LOCALITY TYPE
Metropolitan area 5338 51.9 18.3 25 4.8
Other towns 10032 48.2 16.2 29.6 6
Rural zones 10313 40.4 16.2 37.5 5.9
OCCUPATION
Self-employed 2370 53.1 20.1 22.4 4.4
Employee 8435 50.4 21.7 24.9 3.1
Manual worker 2243 35.4 11.4 46.7 6.6
Not working 12638 43.2 13.6 35.6 7.6
DRIVE
Primarily driven car 12572 48 18.6 29.1 4.4
Other 13195 43.7 14.8 34.5 7

The Gallup Organization Flash EB No206b � EU Transport Policy
Analytical Report page 75
7. Survey details
This survey on the General population survey on �Transport� was conducted for the European Commission, Directorate-General Energy and Transport R3. Telephone interviews were conducted in each country with the exception of the Bulgaria, Czech Republic, Estonia, Latvia, Lithuania, Hungary Poland, Romania and Slovakia where, both telephone and face-to-face interviews were conducted (700 webCATI and 300 F2F interviews). The interviews were conducted between the 03/05/2007 and the 07/05/2007 by these Institutes: Belgium BE Gallup Europe (Interviews : 03/05/2007 - 05/05/2007) Czech Republic CZ Focus Agency (Interviews : 03/05/2007 - 07/05/2007) Denmark DK Hermelin (Interviews : 03/05/2007 - 07/05/2007) Germany DE IFAK (Interviews : 03/05/2007 - 07/05/2007) Estonia EE Saar Poll (Interviews : 03/05/2007 - 07/05/2007) Greece EL Metroanalysis (Interviews : 03/05/2007 - 07/05/2007) Spain ES Gallup Spain (Interviews : 03/05/2007 - 07/05/2007) France FR Efficience3 (Interviews : 03/05/2007 - 06/05/2007) Ireland IE Gallup UK (Interviews : 03/05/2007 - 07/05/2007) Italy IT Demoskopea (Interviews : 03/05/2007 - 07/05/2007) Cyprus CY CYMAR (Interviews : 03/05/2007 - 04/05/2007) Latvia LV Latvian Facts (Interviews : 03/05/2007 - 07/05/2007) Lithuania LT Baltic Survey (Interviews : 03/05/2007 - 07/05/2007) Luxembourg LU Gallup Europe (Interviews : 03/05/2007 - 07/05/2007) Hungary HU Gallup Hungary (Interviews : 03/05/2007 - 07/05/2007) Malta MT MISCO (Interviews : 03/05/2007 - 06/05/2007) Netherlands NL Telder (Interviews : 03/05/2007 - 06/05/2007) Austria AT Spectra (Interviews : 03/05/2007 - 07/05/2007) Poland PL Gallup Poland (Interviews : 03/05/2007 - 07/05/2007) Portugal PT Consulmark (Interviews : 03/05/2007 - 07/05/2007) Slovenia SI Cati d.o.o. (Interviews : 03/05/2007 - 07/05/2007) Slovakia SK Focus Agency (Interviews : 03/05/2007 - 07/05/2007) Finland FI Hermelin (Interviews : 03/05/2007 - 07/05/2007) Sweden SE Hermelin (Interviews : 03/05/2007 - 07/05/2007) United Kingdom UK Gallup UK (Interviews : 03/05/2007 - 07/05/2007) Bulgaria BG Vitosha (Interviews : 03/05/2007 - 07/05/2007) Romania RO Gallup Romania (Interviews : 03/05/2007 - 07/05/2007) Representativeness of the results Each national sample is representative of the population aged 15 years and above. Sizes of the sample In most EU countries the target sample size was 1000 respondents, in Cyprus, Luxembourg, and Malta the targeted size was 500. The below table shows the achieved sample size by country A weighting factor was applied to the national results in order to compute a marginal total where each country contributes to the European Union result in proportion to its population.
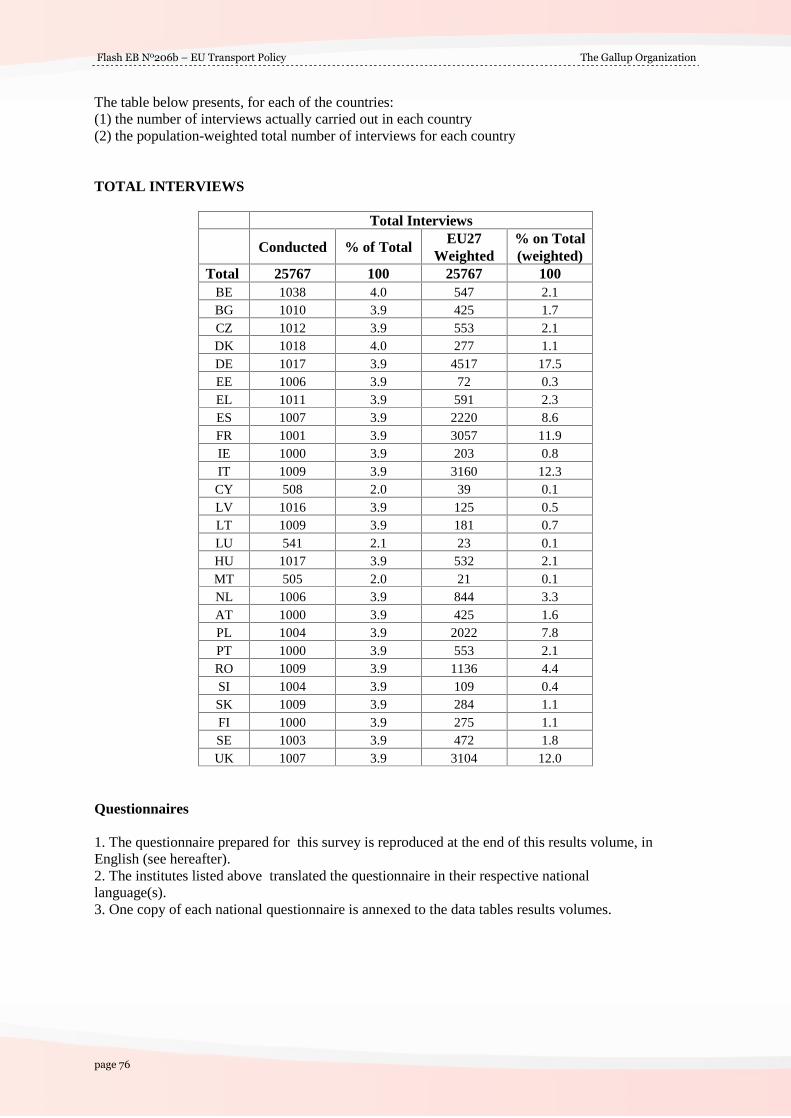
Flash EB No206b � EU Transport Policy The Gallup Organization
page 76
The table below presents, for each of the countries: (1) the number of interviews actually carried out in each country (2) the population-weighted total number of interviews for each country TOTAL INTERVIEWS
Total Interviews
Conducted % of Total EU27
Weighted % on Total (weighted)
Total 25767 100 25767 100 BE 1038 4.0 547 2.1 BG 1010 3.9 425 1.7 CZ 1012 3.9 553 2.1 DK 1018 4.0 277 1.1 DE 1017 3.9 4517 17.5 EE 1006 3.9 72 0.3 EL 1011 3.9 591 2.3 ES 1007 3.9 2220 8.6 FR 1001 3.9 3057 11.9 IE 1000 3.9 203 0.8 IT 1009 3.9 3160 12.3 CY 508 2.0 39 0.1 LV 1016 3.9 125 0.5 LT 1009 3.9 181 0.7 LU 541 2.1 23 0.1 HU 1017 3.9 532 2.1 MT 505 2.0 21 0.1 NL 1006 3.9 844 3.3 AT 1000 3.9 425 1.6 PL 1004 3.9 2022 7.8 PT 1000 3.9 553 2.1 RO 1009 3.9 1136 4.4 SI 1004 3.9 109 0.4 SK 1009 3.9 284 1.1 FI 1000 3.9 275 1.1 SE 1003 3.9 472 1.8 UK 1007 3.9 3104 12.0
Questionnaires 1. The questionnaire prepared for this survey is reproduced at the end of this results volume, in English (see hereafter). 2. The institutes listed above translated the questionnaire in their respective national language(s). 3. One copy of each national questionnaire is annexed to the data tables results volumes.

The Gallup Organization Flash EB No206b � EU Transport Policy
Analytical Report page 77
Tables of results VOLUME A: COUNTRY BY COUNTRY The VOLUME A presents the European Union results country by country. VOLUME B : RESPONDENTS� DEMOGRAPHICS The VOLUME B presents the European Union results with the following socio-demographic characteristics of respondents as breakdowns: Volume B : Sex (Male, Female) Age (15-24, 25-39, 40-54, 55 +) Education (15&-, 16-20, 21&+, Still in full time education) Subjective urbanisation (Metropolitan zone, Other town/urban centre, Rural zone) Occupation (Self-employed, Employee, Manual worker, Not working) Drive (Primarily driven car, other) Sampling error The results in a survey are valid only between the limits of a statistical margin caused by the sampling process. This margin varies with three factors: 1. The sample size (or the size of the analysed part in the sample): the greater the number of respondents is, the smaller the statistical margin will be; 2. The result in itself: the closer the result approaches 50%, the wider the statistical margin will be; 3. The desired degree of confidence: the more "strict" we are, the wider the statistical margin will be. As an example, examine this illustrative case: 1. One question has been answered by 500 people; 2. The analysed result is around 50%; 3. We choose a significance level of 95 % (it is the level most often used by the statisticians, and it is the one chosen for the Table hereafter); In this illustrative case the statistical margin is: (+/- 4.4%) around the observed 50%. And as a conclusion: the result for the whole population lies between 45.6% and 54.4 %. Hereafter, the statistical margins computed for various observed results are shown, on various sample sizes, at the 95% significance level. STATISTICAL MARGINS DUE TO THE SAMPLING PROCESS (AT THE 95 % LEVEL OF CONFIDENCE) Various sample sizes are in rows; Various observed results are in columns:
5% 10% 15% 20% 25% 30% 35% 40% 45% 50%
N=50 6,0 8,3 9,9 11,1 12,0 12,7 13,2 13,6 13,8 13,9
N=500 1,9 2,6 3,1 3,5 3,8 4,0 4,2 4,3 4,4 4,4
N=1000 1,4 1,9 2,2 2,5 2,7 2,8 3,0 3,0 3,1 3,1
N=1500 1,1 1,5 1,8 2,0 2,2 2,3 2,4 2,5 2,5 2,5
N=2000 1,0 1,3 1,6 1,8 1,9 2,0 2,1 2,1 2,2 2,2
N=3000 0,8 1,1 1,3 1,4 1,5 1,6 1,7 1,8 1,8 1,8
N=4000 0,7 0,9 1,1 1,2 1,3 1,4 1,5 1,5 1,5 1,5
N=5000 0,6 0,8 1,0 1,1 1,2 1,3 1,3 1,4 1,4 1,4
N=6000 0,6 0,8 0,9 1,0 1,1 1,2 1,2 1,2 1,3 1,3
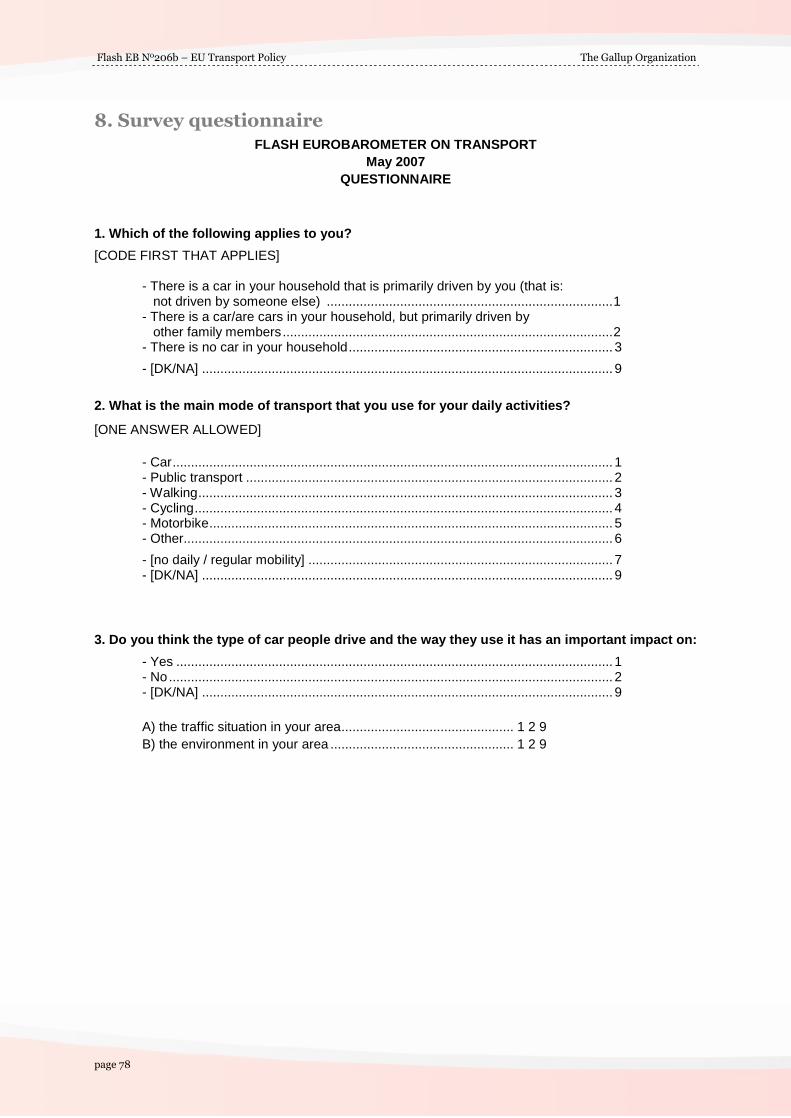
Flash EB No206b � EU Transport Policy The Gallup Organization
page 78
8. Survey questionnaire
FLASH EUROBAROMETER ON TRANSPORT May 2007
QUESTIONNAIRE
1. Which of the following applies to you?
[CODE FIRST THAT APPLIES]
- There is a car in your household that is primarily driven by you (that is: not driven by someone else) ..............................................................................1 - There is a car/are cars in your household, but primarily driven by other family members..........................................................................................2 - There is no car in your household........................................................................ 3
- [DK/NA] ................................................................................................................ 9
2. What is the main mode of transport that you use for your daily activities?
[ONE ANSWER ALLOWED]
- Car........................................................................................................................ 1 - Public transport .................................................................................................... 2 - Walking................................................................................................................. 3 - Cycling.................................................................................................................. 4 - Motorbike.............................................................................................................. 5 - Other..................................................................................................................... 6
- [no daily / regular mobility] ................................................................................... 7 - [DK/NA] ................................................................................................................ 9
3. Do you think the type of car people drive and the way they use it has an important impact on:
- Yes ....................................................................................................................... 1 - No......................................................................................................................... 2 - [DK/NA] ................................................................................................................ 9
A) the traffic situation in your area............................................... 1 2 9 B) the environment in your area .................................................. 1 2 9
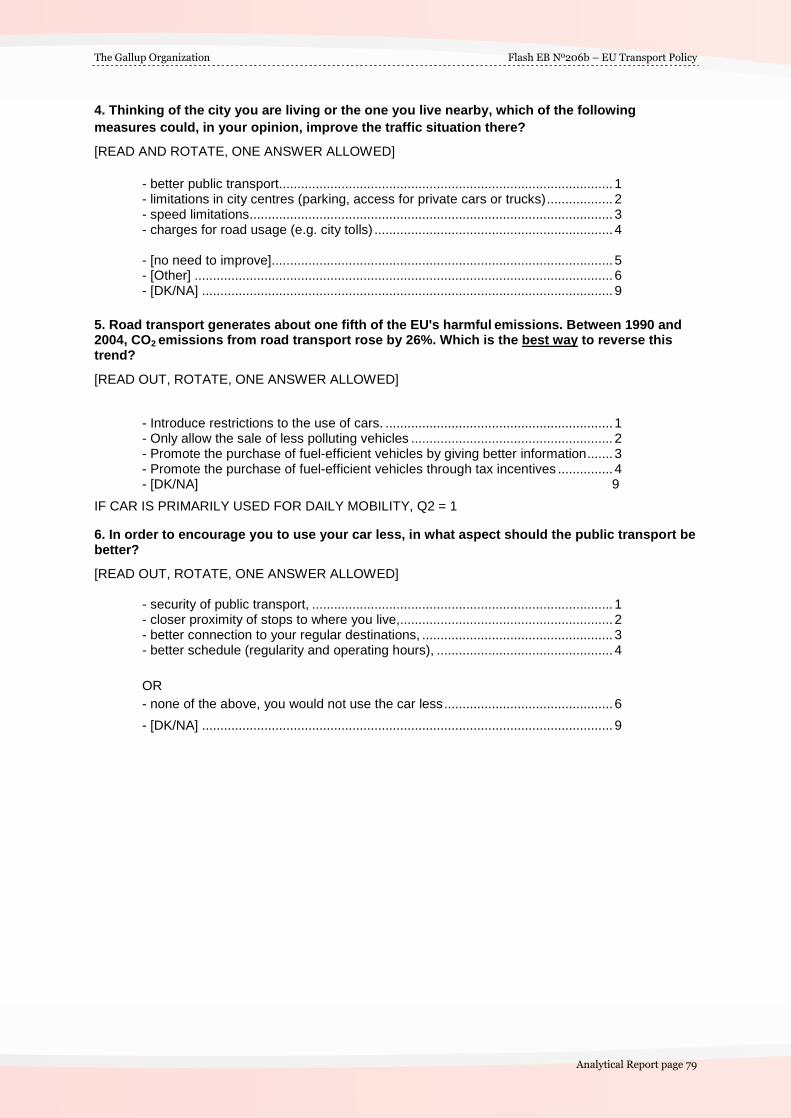
The Gallup Organization Flash EB No206b � EU Transport Policy
Analytical Report page 79
4. Thinking of the city you are living or the one you live nearby, which of the following measures could, in your opinion, improve the traffic situation there?
[READ AND ROTATE, ONE ANSWER ALLOWED]
- better public transport........................................................................................... 1 - limitations in city centres (parking, access for private cars or trucks).................. 2 - speed limitations................................................................................................... 3 - charges for road usage (e.g. city tolls) ................................................................. 4 - [no need to improve]............................................................................................. 5 - [Other] .................................................................................................................. 6 - [DK/NA] ................................................................................................................ 9
5. Road transport generates about one fifth of the EU's harmful emissions. Between 1990 and 2004, CO2 emissions from road transport rose by 26%. Which is the best way to reverse this trend?
[READ OUT, ROTATE, ONE ANSWER ALLOWED]
- Introduce restrictions to the use of cars. .............................................................. 1 - Only allow the sale of less polluting vehicles ....................................................... 2 - Promote the purchase of fuel-efficient vehicles by giving better information....... 3 - Promote the purchase of fuel-efficient vehicles through tax incentives ............... 4 - [DK/NA] 9
IF CAR IS PRIMARILY USED FOR DAILY MOBILITY, Q2 = 1
6. In order to encourage you to use your car less, in what aspect should the public transport be better?
[READ OUT, ROTATE, ONE ANSWER ALLOWED] - security of public transport, .................................................................................. 1 - closer proximity of stops to where you live,.......................................................... 2 - better connection to your regular destinations, .................................................... 3 - better schedule (regularity and operating hours), ................................................ 4
OR - none of the above, you would not use the car less.............................................. 6
- [DK/NA] ................................................................................................................ 9

Flash EB No206b � EU Transport Policy The Gallup Organization
page 80
IF HAS A CAR AT DISPOSAL, Q1 = 1 7. During the past year, have you done any of the following to save fuel?
[MULTIPLE ANSWER] - Yes ....................................................................................................................... 1 - No......................................................................................................................... 2 - [DK/NA] ................................................................................................................ 9 A) Adapted your driving style .................................................... 1 2 9 B) Used public transport more..................................................... 1 2 9 C) Walked or cycled more ........................................................... 1 2 9 D) Changed your car to another one which uses less fuel.......... 1 2 9
8. Bio fuels are renewable fuels that can reduce fossil oil dependence of vehicles. Which is in your opinion the best measure to encourage the use of bio fuels? [READ OUT, ROTATE, ONE ANSWER ALLOWED]
- Tax incentives to make bio fuel cheaper ............................................................. 1 - Higher taxes for polluting vehicles using traditional fossil fuel ............................. 2 - Compulsory standards for manufacturers to produce cars that use bio fuel ....... 3 - Crop subsidies for bio fuel production.................................................................. 4 - [Other measures].................................................................................................. 5 - [DK/NA] ................................................................................................................ 9
9. Would you be prepared to pay more for using a less polluting transport (energy efficient private and public vehicles, clean fuels�)? How much more would you be prepared to pay? [ONE ANSWER ALLOWED]
- No, I am not prepared to pay more......................................................1 - Yes, I would pay up to 10% more........................................................2 - Yes, I would pay more than 10% more................................................3 - [DK/NA] ................................................................................................9
10. In principle, do you think all road users should pay for congestion and environmental damage through road tolls?
- Yes ....................................................................................................................... 1 - No......................................................................................................................... 2 - [DK/NA] ................................................................................................................ 9
11. How should the money thus collected be spent?
- To improve road-related infrastructure (e.g. city tunnels, noise barriers) ............ 1 - To invest in public transport (e.g. rail and urban transport) ................................. 2 - As general public expenditure.............................................................................. 3 - [DK/NA] ................................................................................................................ 9

The Gallup Organization Flash EB No206b � EU Transport Policy
Analytical Report page 81
12. Based on your experience or what you hear; what is your opinion on security controls at airports?
- they are appropriate ............................................................................................. 1 - they are insufficient .............................................................................................. 2 - they are excessive................................................................................................ 3 - I am not concerned as I seldom travel by plane .................................................. 4
- [DK/NA] ................................................................................................................ 9
13. Are you aware that there are certain rights for air passengers to be respected by airlines operating in the European Union, e.g. in case of flight cancellation or delays?
- Yes ....................................................................................................................... 1 - No, although I do fly ............................................................................................. 2 - No, I never fly
- [DK/NA] ................................................................................................................ 9 Demography D1. Gender [DO NOT ASK - MARK APPROPRIATE] [1 ] Male [2] Female D2. How old are you? [_][_] years old [00] [REFUSAL/NO ANSWER] D3. How old were you when you stopped full-time education? [Write in THE AGE WHEN EDUCATION WAS TERMINATED] [_][_] years old [ 0 0 ] [STILL IN FULL TIME EDUCATION] [ 0 1 ] [NEVER BEEN IN FULL TIME EDUCATION] [ 9 9 ] [REFUSAL/NO ANSWER]

Flash EB No206b � EU Transport Policy The Gallup Organization
page 82
D4. As far as your current occupation is concerned, would you say you are self-employed, an employee, a manual worker or would you say that you are without a professional activity? Does it mean that you are a(n)...
[IF A RESPONSE TO THE MAIN CATEGORY IS GIVEN, READ OUT THE RESPECTIVE SUB-CATEGORIES - ONE ANSWER ONLY]
Self-employed
i.e. : - farmer, forester, fisherman............................................................................ 11 - owner of a shop, craftsman........................................................................... 12 - professional (lawyer, medical practitioner, accountant, architect,...)........... 13 - manager of a company ................................................................................. 14 - other............................................................................................................... 15
Employee i.e. : - professional (employed doctor, lawyer, accountant, architect) .................. 21
- general management, director or top management..................................... 22 - middle management...................................................................................... 23 - Civil servant ................................................................................................... 24 - office clerk...................................................................................................... 25 - other employee (salesman, nurse, etc...) ..................................................... 26 - other............................................................................................................... 27
Manual worker
i.e. : - supervisor / foreman (team manager, etc...) ............................................... 31 - Manual worker ............................................................................................... 32 - unskilled manual worker................................................................................ 33 - other............................................................................................................... 34
Without a professional activity i.e. : - looking after the home................................................................................... 41 - student (full time) ........................................................................................... 42 - retired ............................................................................................................ 43 - seeking a job ................................................................................................. 44 - other............................................................................................................... 45
- [Refusal] ........................................................................................................................... 99 D6. Would you say you live in a ...?
- metropolitan zone............................................................................................ 1 - other town/urban centre .................................................................................. 2 - rural zone......................................................................................................... 3 - [Refusal]........................................................................................................... 9