Embed Size (px)
Citation preview
TNS BMRB
JN121168
Attitudes to Mental Illness2013 Research ReportPrepared for Time to ChangeFebruary 2014
2Attitudes to Mental Illness 2013 TNS BMRB 2014
Contents
1. Executive summary 3
2. Introduction 6
3. Attitudes to mental illness 8
4. Ways of describing someone who is mentally ill 23
5. Mental health-related knowledge 25
6. Reported and intended behaviour (RIBS) 28
7. Personal experience of mental illness 31
8. Mental health-related stigma and campaign awareness 36
9. Appendix– Survey methodology 40
10. Appendix – Questionnaire 47
3Attitudes to Mental Illness 2013 TNS BMRB 2014
1. Executive summary
This report presents the findings of a survey of attitudes towards mental illness among adults in England. Questions on this topic have been asked since 1994, with questions added and removed over time. Surveys were initially carried out annually, then every three years from 1997-2003. Surveys have again been carried out annually since 2007. From 1994 to 2011 the surveys were carried out early in the year (January to March). In 2011 a second survey was also carried out in December, and in 2012 and 2013 the surveys were again carried out in December. The aim of these surveys is to monitor changes in public attitudes towards mental illness over time. This report focusses on trends over the past six years, looking at results from the surveys carried out from 2008 onwards. For the 2013 survey 1,714 adults (aged 16+) were interviewed in England in December 2013. The survey questionnaire included a number of statements about mental illness. Respondents were asked to indicate how much they agreed or disagreed with each statement. Other questions covered a range of topics such as descriptions of people with mental illness, relationships with people with mental health problems, personal experience of mental illness, and perceptions of mental health-related stigma and discrimination.It should be noted that, in common with results of other surveys, small fluctuations are likely to be due to statistical sampling variation rather than reflecting a true change in attitudes.
The main changes between 2008 – 2013 include: n Attitudes towards people with mental illness are more favourable in 2013
than they were in 2008. There has been a decline in the proportions agreeing that:n ‘Anyone with a history of mental problems should be excluded from public
office’, from 21% in 2008 to 13% in 2013, with a significant difference also in the results between 2012 (18%) and 2013
n ‘It is frightening to think of people with mental problems living in residential neighbourhoods’, from 16% to 10%, with a significant difference also in the results between 2012 (13%) and 2013
n ‘I would not want to live next door to someone who has been mentally ill’, from 12% to 8%
n ‘People with mental illness should not be given any responsibility’, from 15% to 10%
n ‘People with mental illness are a burden on society’, from 7% to 5%, with a significant difference also in the results between 2012 (7%) and 2013
4Attitudes to Mental Illness 2013 TNS BMRB 2014
n ‘A woman would be foolish to marry a man who has suffered from mental illness, even though he seems fully recovered’, from 12% to 9%
n ‘Locating mental health facilities in a residential area downgrades the neighbourhood’, from 20% to 16%
n Understanding and tolerance of mental illness have increased since 2008, although, because the level of tolerance was already high in 2008, increases are quite small. There has been a statistically significant increase in the proportion who said that they agreed with the statements: n ‘We need to adopt a far more tolerant attitude toward people with mental
illness in our society’, from 83% in 2008 to 89% in 2013n ‘As far as possible, mental health services should be provided through
community-based facilities’, from 72% to 77%n ‘People with mental illness have for too long been the subject of ridicule’,
from 75% to 79%n ‘We have a responsibility to provide the best possible care for people with
mental illness’, from 89% to 93%, andn ‘Virtually anyone can become mentally ill’ from 89% to 92%
n There has been an increase in the proportion who disagreed that:n ‘Increased spending on mental health services is a waste of money’, from
83% in 2008 to 88% in 2013, with a significant difference also in the results between 2012 (85%) and 2013
n ‘People with mental illness don’t deserve our sympathy’, from 85% to 90%
n Attitudes towards integrating people with mental illness into the community have become more favourable since 2008. There has been an increase in the proportion who agreed that:n ‘Most women who were once patients in a mental hospital can be trusted
as babysitters’, from 23% in 2008 to 28% in 2013, with a significant difference also in the results between 2012 (25%) and 2013
n ‘People with mental health problems should have the same rights to a job as anyone else’, from 66% to 78%
n ‘Less emphasis should be placed on protecting the public from people with mental illness’, from 29% to 34%
n ‘The best therapy for many people with mental illness is to be part of a normal community’, from 70% to 80%
n ‘Residents have nothing to fear from people coming into their neighbourhood to obtain mental health services’, from 59% to 67%
n ‘No-one has the right to exclude people with mental illness from their neighbourhood’, from 74% to 83%
n ‘People with mental illness are far less of a danger than most people suppose’, from 57% to 62%, and
n ‘Mental illness is an illness like any other’, from 74% to 77%
5Attitudes to Mental Illness 2013 TNS BMRB 2014
n Analysis of summary scores across all of the community attitudes to mental illness (CAMI) statements confirmed that overall attitudes towards mental illness have become more favourable since 2008, with a significant increase also since 2012.
n Since 2009, when the MAKS Part A statements, covering stigma-related mental health knowledge, were first asked, there has been an increase in the proportion of people who agreed that ‘Psychotherapy can be an effective treatment for people with mental health problems’, from 79% to 84%, with a significant difference also in the results between 2012 (81%) and 2013; and a decrease in the proportion agreeing that ‘Most people with mental health problems go to a healthcare professional to get help’, from 54% in 2009 to 47% in 2013. In terms of the identification of various types of mental illness (MAKS Part B), there has been an increase, since 2009, in the proportion who agreed that bipolar disorder is a type of mental illness, from 82% to 85% in 2013. Since 2012 there has been a significant increase in the proportion agreeing that stress (54% to 59%) and grief (46% to 51%) are types of mental illness, and a decrease in the proportion agreeing that schizophrenia is a mental illness (90% to 87%).
n Analysis of summary scores for mental health-related knowledge confirmed that there has been an overall increase in reported knowledge among the population since 2009, with a significant increase also since 2012.
n Since 2009, when questions about intended behaviour were first asked, there has been a marked increase in the proportion of people who say they would be willing to continue a relationship with a friend with a mental health problem (82% to 88%), willing to work with someone with a mental health problem (69% to 76%), willing to live nearby to someone with a mental health problem (72% to 77%) and who would be willing to live with someone with a mental health problem (57% to 62%).
n The proportion of people saying they know someone close to them who has had some kind of mental illness has increased from 58% in 2009 to 64% in 2013.
n The percentage of people who would be willing in the future to continue a relationship, work with, or live with someone with a mental health problem is at the highest level since starting tracking in 2009, with the percentage who would be willing to live nearby someone with a mental health problem remaining similar to 2012 when this was the highest level recorded since 2009. These suggest a marked positive change in attitudes relating to intended behaviour.
n Analysis of summary scores for reported and intended behaviour (RIBS) confirmed that both reported and intended behaviour scores have become significantly more positive since 2009. For intended behaviour there was also a significant increase in mean score since 2012.

6Attitudes to Mental Illness 2013 TNS BMRB 2014
n
7Attitudes to Mental Illness 2013 TNS BMRB 2014
2. Introduction
This report includes the findings of a survey into attitudes to mental illness conducted late in 2013. This is the fourteenth survey in this series funded by the Department of Health.The survey has been carried out since 1994 on TNS’s face-to-face Omnibus1. From 1994 to 1997 the questions were asked annually, then every third year until 2003, under management of the Department of Health. The survey was repeated annually from 2007 to 2010, under management of ‘Shift’, an initiative to tackle stigma and discrimination surrounding mental health issues in England, which was part of the National Mental Health Development Unit (NMHDU), funded by the Department of Health and the NHS. Shift and the NMHDU closed at the end of March 2011. The February 2011 survey was managed by the NHS Information Centre for Health and Social Care. The December 2011, December 2012 and December 2013 surveys were managed by the ‘Time to Change’ anti-discrimination campaign, run jointly by Rethink Mental Illness and Mind, funded by the Department of Health and Comic Relief. These surveys act as a tracking mechanism and in this report the most recent 2013 results are compared with those from earlier years, with a particular focus on changes since 2008, when the ‘Time to Change’ programme began. From 1994 to 2011 the surveys were carried out early in the year (January to March). In 2011 a second survey was also carried out in December, and in 2012 and 2013 the surveys were again carried out in December, prior to Time to Change national advertising campaigns in January. The sample size for each survey was approximately 1,700 adults, selected to be representative of adults in England, using a random location sampling methodology. The 1996 and 1997 surveys had larger samples of approximately 5,000 adults in each. For the 2013 survey, 1,714 adults in England were interviewed. Interviews were carried out face-to-face by fully trained interviewers using Computer-Assisted Personal Interviewing (CAPI), and were carried out in respondents’ homes. Interviewing took place between December 4th and December 8th 2013.Data were weighted to be representative of the target population by age, gender and working status.Respondents in these surveys were presented with a number of statements about mental illness. These statements covered a wide range of issues from attitudes towards people with mental illness, to opinions on services provided 1 An Omnibus survey combines questions on a variety of topics into a single survey.
8Attitudes to Mental Illness 2013 TNS BMRB 2014
for people with mental health problems. The core of the questionnaire has remained the same for all surveys in this series. Over time a number of additional items have been added, including questions about personal experience of mental illness and descriptions of people with mental illness. Some new questions were added in 2009 to tie in with the evaluation of the ‘Time to Change’ anti-discrimination campaign, by the Institute of Psychiatry. Some additional questions, on perceptions of stigma and discrimination, were added in 2010. The 2013 questionnaire was the same as that used in 2010, 2011 and 2012.Where findings are reported as ‘significant’ in the following chapters in this report this always means that the findings were statistically significant at the 95% confidence level or higher. Commentary is made only on differences which were statistically significant. All the differences reported in the Summary were statistically significant at the 95% confidence level or higher. This means that, if a finding is statistically significant we can be 95% confident that differences reported represent real changes in attitude rather than occurring just by chance. Significance of differences has been tested using the two-tailed t-test for independent samples. The whole percentages shown in the report are usually rounded, but the significance tests have been carried out on the true percentages. This means that a difference in the report of, say, 3 percentage points may be significant in some cases but not in others, depending on the effect of rounding.In addition to this commentary the Attitudes to Mental Illness 2013 release includes 21 reference data tables, a machine readable data file and appendices supporting that explain the methodology of the survey. These are available on the publication page available here https://www.rethink.org/get-involved/campaigns/time-to-change/national-attitudes-to-mental-illness-survey. Full details of the survey methodology and a copy of the questionnaire are included in the Methodology Annexes which are available on the publication page.

9Attitudes to Mental Illness 2013 TNS BMRB 2014
3. Attitudes to mental illness
3.1 Grouping the statementsThe survey included statements on a range of attitudes towards mental illness. The Attitudes to Mental Illness questionnaire was developed by the Department of Health for this series of surveys, based on previous research in Toronto, Canada and the West Midlands, UK. It included 26 items based on the 40-item Community Attitudes toward the Mentally Ill (CAMI) scale2 and the Opinions about Mental Illness scale3, and an added item on employment-related attitudes. The questions covered a wide range of issues, from attitudes towards people with mental illness, to opinions on services provided for people with mental health problems. Respondents were asked to give their opinion on each attitude statement, using a 5-point scale from ‘Agree strongly’ to ‘Disagree strongly’. The 27 attitude statements are grouped into four categories for analysis purposes: n Fear and exclusion of people with mental illnessn Understanding and tolerance of mental illnessn Integrating people with mental illness into the communityn Causes of mental illness and the need for special services.
3.2 Fear and exclusion of people with mental illness
Introduction
This section explores fear and exclusion of people with mental illness. These statements have all been included in each wave of the survey since 1994. The statements covered in this section are:n ‘Locating mental health facilities in a residential area downgrades the
neighbourhood’ n ‘It is frightening to think of people with mental problems living in residential
neighbourhoods’n ‘I would not want to live next door to someone who has been mentally ill’
2 Taylor SM, Dear MJ, ‘Scaling community attitudes toward the mentally ill’, Schizophr Bull 1981, 7: 225-40.3 Cohen J, Struening EL, ‘Opinions about mental illness in the personnel of two large mental hospitals’, J Abnorm Soc Psychol 1962, 64: 349-60
10Attitudes to Mental Illness 2013 TNS BMRB 2014
n ‘A woman would be foolish to marry a man who has suffered from mental illness, even though he seems fully recovered’
n ‘Anyone with a history of mental problems should be excluded from taking public office’
n ‘People with mental illness should not be given any responsibility’ n ‘People with mental illness are a burden on society’ n ‘As soon as a person shows signs of mental disturbance, he should be
hospitalized’
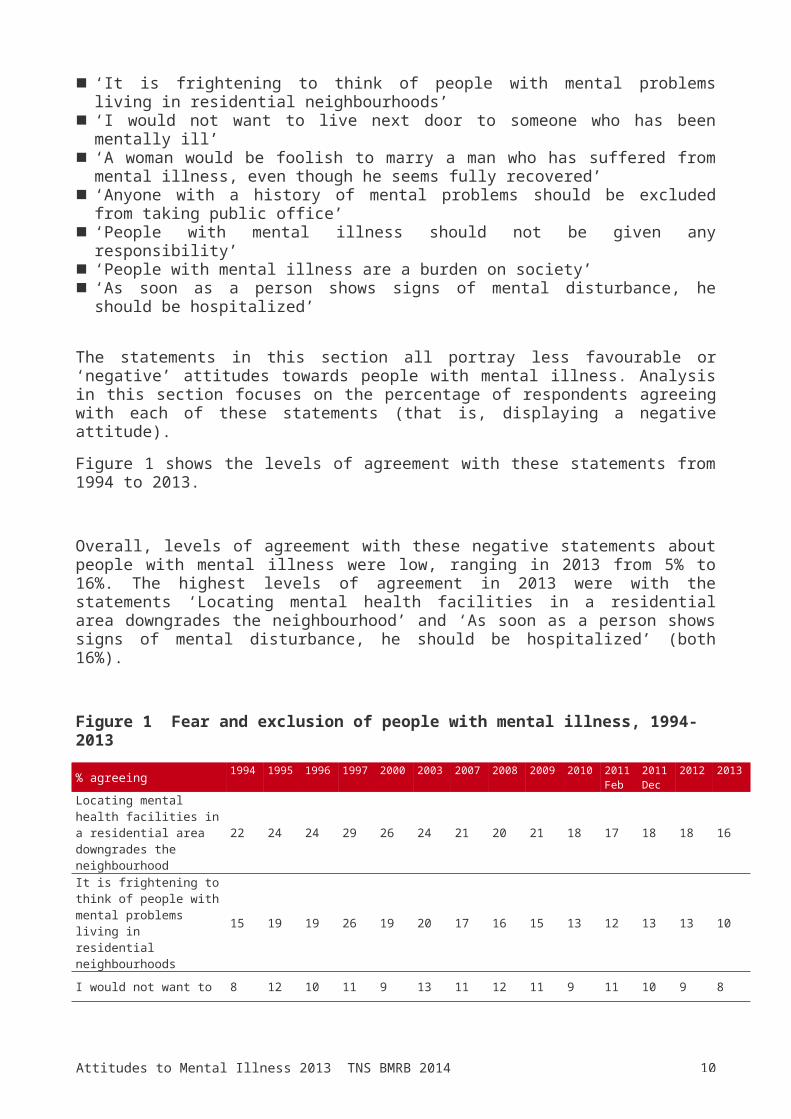
The statements in this section all portray less favourable or ‘negative’ attitudes towards people with mental illness. Analysis in this section focuses on the percentage of respondents agreeing with each of these statements (that is, displaying a negative attitude).Figure 1 shows the levels of agreement with these statements from 1994 to 2013.
Overall, levels of agreement with these negative statements about people with mental illness were low, ranging in 2013 from 5% to 16%. The highest levels of agreement in 2013 were with the statements ‘Locating mental health facilities in a residential area downgrades the neighbourhood’ and ‘As soon as a person shows signs of mental disturbance, he should be hospitalized’ (both 16%). Figure 1 Fear and exclusion of people with mental illness, 1994-2013
% agreeing 1994 1995 1996 1997 2000 2003 2007 2008 2009 2010 2011 Feb
2011 Dec
2012 2013
Locating mental health facilities in a residential area downgrades the neighbourhood
22 24 24 29 26 24 21 20 21 18 17 18 18 16
It is frightening to think of people with mental problems living in residential neighbourhoods
15 19 19 26 19 20 17 16 15 13 12 13 13 10
I would not want to live next door to someone who has been mentally ill
8 12 10 11 9 13 11 12 11 9 11 10 9 8
A woman would be foolish to marry a man who has suffered from mental illness, even though he seems fully recovered
12 15 14 13 14 13 13 12 14 12 13 11 10 9
Anyone with a history of mental problems should be excluded from taking public office
29 32 28 33 24 25 21 21 22 20 21 18 18 13
People with mental illness should not be given any responsibility
17 21 16 18 14 16 14 15 13 12 13 11 10 10
11Attitudes to Mental Illness 2013 TNS BMRB 2014
People with mental illness are a burden on society
10 11 10 9 7 10 7 7 7 8 6 7 7 5
As soon as a person shows signs of mental disturbance, he should be hospitalized
19 23 21 23 20 22 19 18 20 20 21 19 16 16
Base (unweighted) 1682 1554 5071 4900 1707 1632 1729 1703 1751 1745 1741 1717 1727 1714
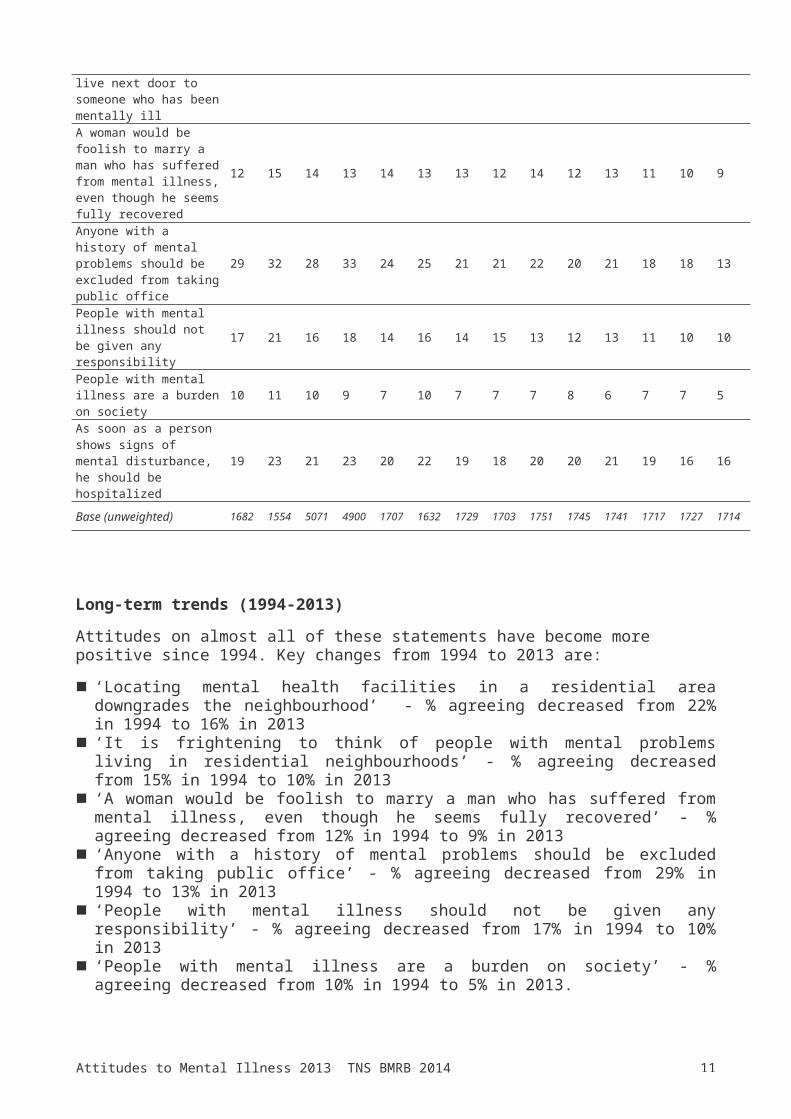
Long-term trends (1994-2013)
Attitudes on almost all of these statements have become more positive since 1994. Key changes from 1994 to 2013 are:n ‘Locating mental health facilities in a residential area downgrades the
neighbourhood’ - % agreeing decreased from 22% in 1994 to 16% in 2013n ‘It is frightening to think of people with mental problems living in residential
neighbourhoods’ - % agreeing decreased from 15% in 1994 to 10% in 2013n ‘A woman would be foolish to marry a man who has suffered from mental
illness, even though he seems fully recovered’ - % agreeing decreased from 12% in 1994 to 9% in 2013
n ‘Anyone with a history of mental problems should be excluded from taking public office’ - % agreeing decreased from 29% in 1994 to 13% in 2013
n ‘People with mental illness should not be given any responsibility’ - % agreeing decreased from 17% in 1994 to 10% in 2013
n ‘People with mental illness are a burden on society’ - % agreeing decreased from 10% in 1994 to 5% in 2013.
More recent trends (2008-2013)
Looking at changes since 2008, levels of agreement with almost all of these statements have fallen since 2008. The exception, where there has been no significant change in the proportion agreeing, is for the statement ‘As soon as a person shows signs of mental disturbance, he should be hospitalized’. The most marked decreases since 2008 in the proportion agreeing are for the statements: ‘Anyone with a history of mental health problems should be excluded from taking public office’, down from 21% in 2008 to 13% in 2013; ‘It is frightening to think of people with mental problems living in residential neighbourhoods’, down from 16% to 10% in the same period; ‘I would not want to live next door to someone who has been mentally ill’, down from 12% to 8%; and ‘People with mental illness should not be given any responsibility’, down from 15% in 2008 to 10% in 2013.Looking at changes between 2012 and 2013, there has been a drop in the proportion agreeing that ‘It is frightening to think of people with mental health problems living in residential neighbourhoods’ (from 13% to 10%), ‘Anyone with a history of mental health problems should be excluded from taking public office’ (from 18% to 13%) and ‘People with mental illness are a burden on

12Attitudes to Mental Illness 2013 TNS BMRB 2014
society’ (from 7% to 5%). There were no other significant changes between 2012 and 2013 in levels of agreement with this group of statements.
Differences by age and sex
Looking at the three age groups 16-34, 35-54 and 55+, there were significant differences by age group in levels of agreement with several of these statements in 2013 (Figure 2). Only those statements where there were significant differences are shown on the chart.
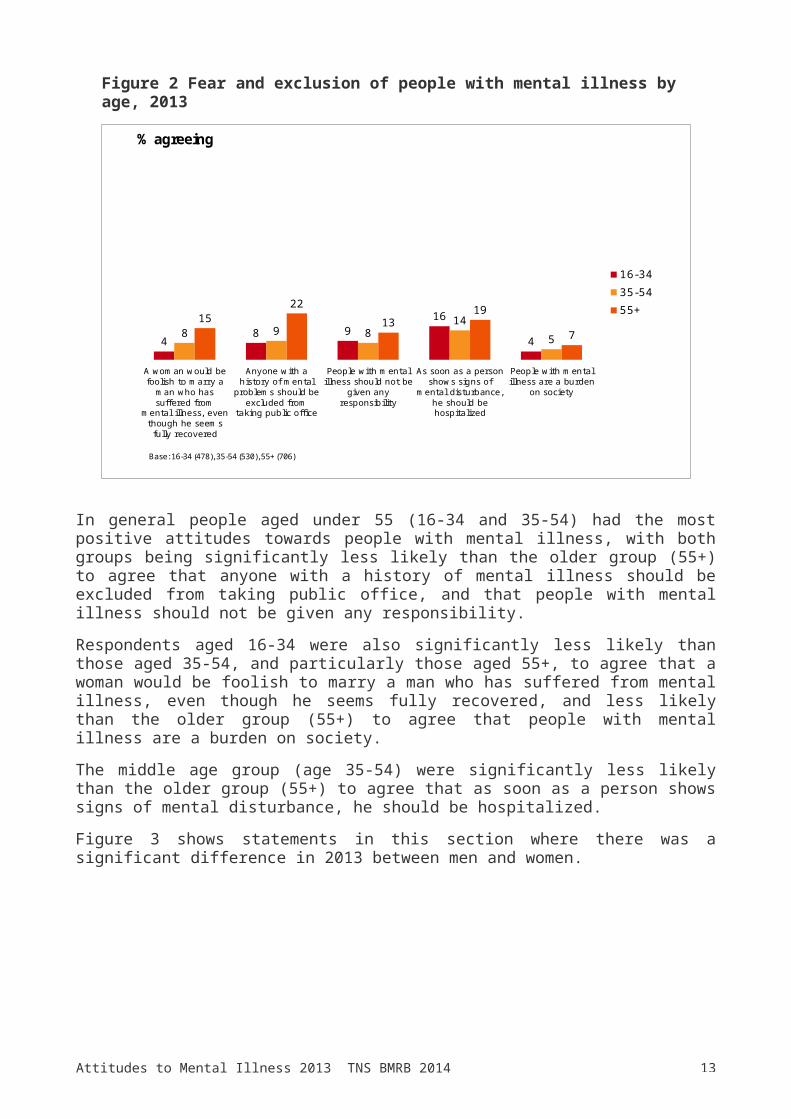
Figure 2 Fear and exclusion of people with mental illness by age, 2013
3.14X AXIS
6.65BASE MARGIN
5.95TOP MARGIN
4.52CHART TOP
11.90LEFT MARGIN
11.90RIGHT MARGIN
Fear & exclusion by age, 2013
4 8 916
48 9 8 14
5 15
2213
19
7
A woman would befoolish to marry a
man who hassuffered from
mental illness, eventhough he seemsfully recovered
Anyone with ahistory of mental
problems should beexcluded from
taking public office
People with mentalillness should not be
given anyresponsibility
As soon as a personshows signs of
mental disturbance,he should behospitalized
People with mentalillness are a burden
on society
16-3435-5455+
Base: 16-34 (478), 35-54 (530), 55+ (706)
% agreeing
In general people aged under 55 (16-34 and 35-54) had the most positive attitudes towards people with mental illness, with both groups being significantly less likely than the older group (55+) to agree that anyone with a history of mental illness should be excluded from taking public office, and that people with mental illness should not be given any responsibility. Respondents aged 16-34 were also significantly less likely than those aged 35-54, and particularly those aged 55+, to agree that a woman would be foolish to marry a man who has suffered from mental illness, even though he seems fully recovered, and less likely than the older group (55+) to agree that people with mental illness are a burden on society.The middle age group (age 35-54) were significantly less likely than the older group (55+) to agree that as soon as a person shows signs of mental disturbance, he should be hospitalized.
13Attitudes to Mental Illness 2013 TNS BMRB 2014
Figure 3 shows statements in this section where there was a significant difference in 2013 between men and women.
Figure 3 Fear and exclusion of people with mental illness by sex, 2013
3.14X AXIS
6.65BASE MARGIN
5.95TOP MARGIN
4.52CHART TOP
11.90LEFT MARGIN
11.90RIGHT MARGIN
Fear & exclusion by gender, 2013
18
713
4
Locating mental health facilities in a residentialarea downgrades the neighbourhood
People with mental illness are a burden on society
MenWomen
Base: Men (821), Women (893)
% agreeing
Women were more positive than men in their attitudes towards people with mental illness in terms of being less likely to see them as a burden on society and less likely to think that the location of mental health facilities in a residential area would downgrade the neighbourhood.
3.3 Understanding and tolerance of mental illness
Introduction
This section explores understanding and tolerance of mental illness. These statements have all been included in each survey since 1994.Analysis in this section focuses on the understanding/tolerance dimension of each statement. For some statements this is the percentage agreeing, for others it is the percentage disagreeing. This is indicated for each statement in the list below.The statements included are:n ‘We have a responsibility to provide the best possible care for people with
mental illness’ (% agreeing)

14Attitudes to Mental Illness 2013 TNS BMRB 2014
n ‘Virtually anyone can become mentally ill’ (% agreeing)n ‘Increased spending on mental health services is a waste of money’ (%
disagreeing)n ‘People with mental illness don't deserve our sympathy’ (% disagreeing)n ‘We need to adopt a far more tolerant attitude toward people with mental
illness in our society’ (% agreeing)n ‘People with mental illness have for too long been the subject of ridicule’ (%
agreeing)n ‘As far as possible, mental health services should be provided through
community based facilities’ (% agreeing)
Levels of understanding and tolerance of mental illness were generally high. The percentage of respondents with understanding attitudes on these statements ranged in 2013 from 77% for ‘As far as possible, mental health services should be provided through community based facilities’ to 93% for ‘We have a responsibility to provide the best possible care for people with mental illness’. (Figure 4).
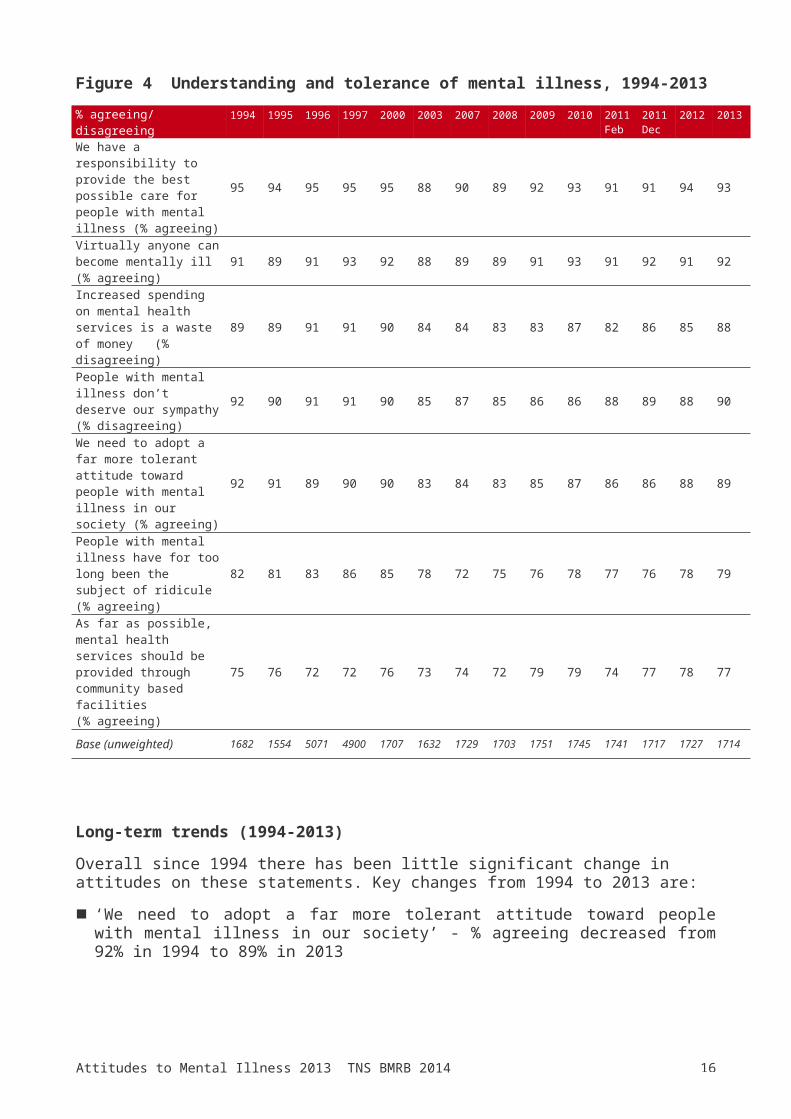
Figure 4 Understanding and tolerance of mental illness, 1994-2013
% agreeing/ disagreeing 1994 1995 1996 1997 2000 2003 2007 2008 2009 2010 2011 Feb
2011 Dec
2012 2013
We have a responsibility to provide the best possible care for people with mental illness (% agreeing)
95 94 95 95 95 88 90 89 92 93 91 91 94 93
Virtually anyone can become mentally ill (% agreeing)
91 89 91 93 92 88 89 89 91 93 91 92 91 92
Increased spending on mental health services is a waste of money (% disagreeing)
89 89 91 91 90 84 84 83 83 87 82 86 85 88
People with mental illness don’t deserve our sympathy (% disagreeing)
92 90 91 91 90 85 87 85 86 86 88 89 88 90
We need to adopt a far more tolerant attitude toward people with mental illness in our society (% agreeing)
92 91 89 90 90 83 84 83 85 87 86 86 88 89
People with mental illness have for too long been the subject of ridicule (% agreeing)
82 81 83 86 85 78 72 75 76 78 77 76 78 79
As far as possible, mental health services should be provided through community based facilities (% agreeing)
75 76 72 72 76 73 74 72 79 79 74 77 78 77
Base (unweighted) 1682 1554 5071 4900 1707 1632 1729 1703 1751 1745 1741 1717 1727 1714
15Attitudes to Mental Illness 2013 TNS BMRB 2014
Long-term trends (1994-2013)
Overall since 1994 there has been little significant change in attitudes on these statements. Key changes from 1994 to 2013 are:n ‘We need to adopt a far more tolerant attitude toward people with mental
illness in our society’ - % agreeing decreased from 92% in 1994 to 89% in 2013
n ‘People with mental illness have for too long been the subject of ridicule’ - % agreeing decreased from 82% in 1994 to 79% in 2013.
More recent trends (2008-2013)
Since 2008 the proportion of respondents expressing more tolerant opinions on all of these statements has increased, following a dip in tolerant attitudes in the early years of the survey. Differences are all quite small (ranging from between 3% and 5%) but this is to be expected given that the level of tolerance is already high.There was a significant change between 2012 and 2013 for one statement in this section – the proportion disagreeing that ‘Increased spending on mental health services is a waste of money’ increased from 85% to 88%.
16Attitudes to Mental Illness 2013 TNS BMRB 2014
Differences by age and sex
There were differences by age group for several of the statements in this section (Figure 5).
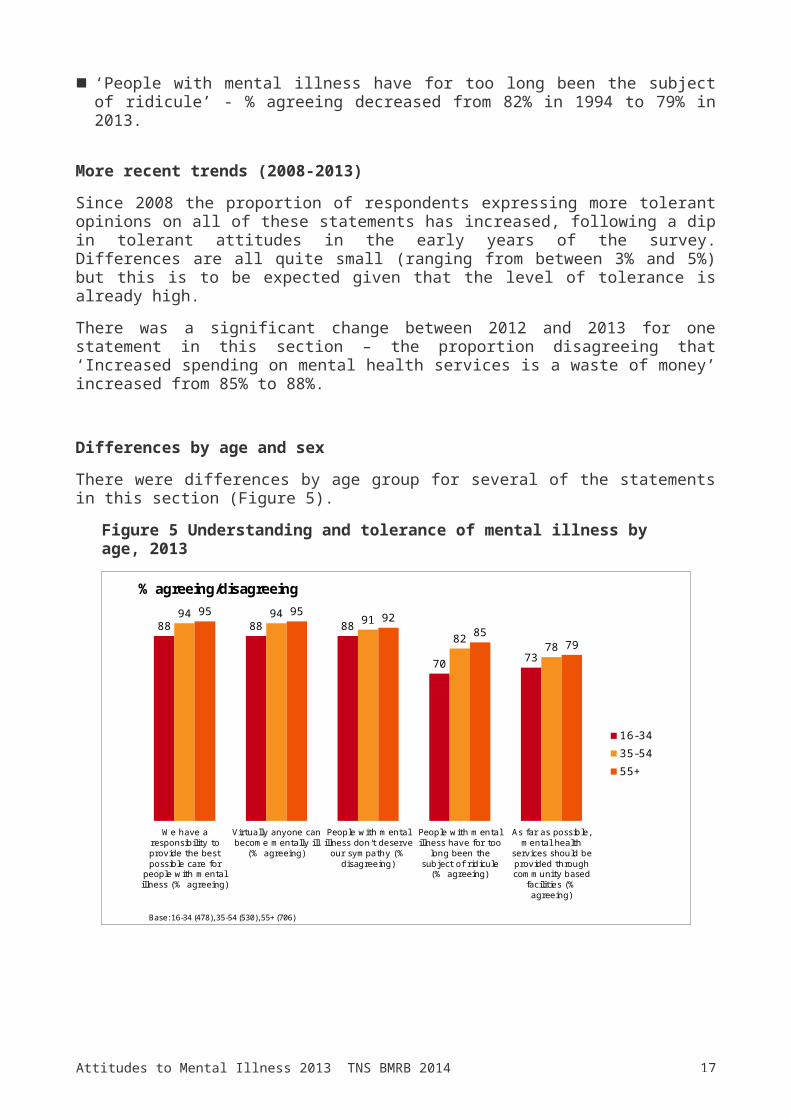
Figure 5 Understanding and tolerance of mental illness by age, 2013
3.14X AXIS
6.65BASE MARGIN
5.95TOP MARGIN
4.52CHART TOP
11.90LEFT MARGIN
11.90RIGHT MARGIN
Understanding & tolerance by age, 2013
88 88 88
70 73
94 94 91 82 78
95 95 9285
79
We have aresponsibility toprovide the bestpossible care for
people with mentalillness (% agreeing)
Virtually anyone canbecome mentally ill
(% agreeing)
People with mentalillness don't deserve
our sympathy (%disagreeing)
People with mentalillness have for too
long been thesubject of ridicule
(% agreeing)
As far as possible,mental health
services should beprovided throughcommunity based
facilities (%agreeing)
16-3435-5455+
Base: 16-34 (478), 35-54 (530), 55+ (706)
% agreeing/disagreeing
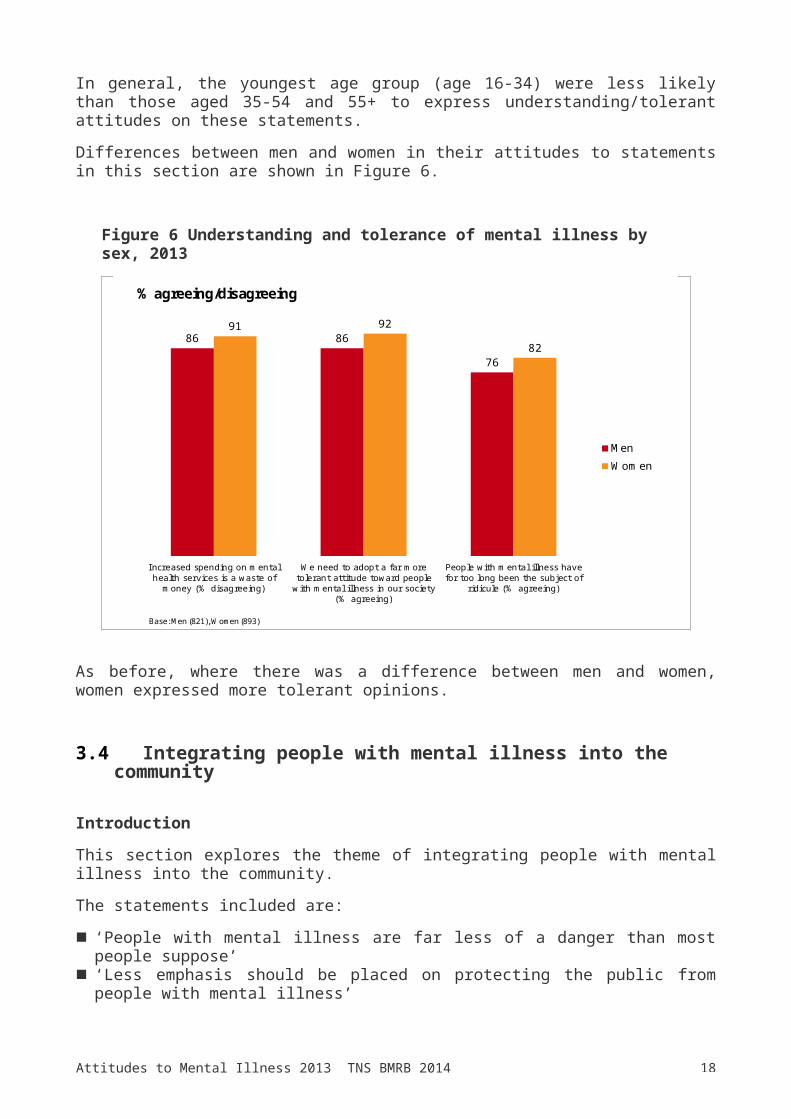
In general, the youngest age group (age 16-34) were less likely than those aged 35-54 and 55+ to express understanding/tolerant attitudes on these statements.Differences between men and women in their attitudes to statements in this section are shown in Figure 6.
17Attitudes to Mental Illness 2013 TNS BMRB 2014
Figure 6 Understanding and tolerance of mental illness by sex, 2013
3.14X AXIS
6.65BASE MARGIN
5.95TOP MARGIN
4.52CHART TOP
11.90LEFT MARGIN
11.90RIGHT MARGIN
Understanding & tolerance by gender, 2013
86 86
76
91 92
82
Increased spending on mentalhealth services is a waste of
money (% disagreeing)
We need to adopt a far moretolerant attitude toward people
with mental illness in our society(% agreeing)
People with mental illness havefor too long been the subject of
ridicule (% agreeing)
MenWomen
Base: Men (821), Women (893)
% agreeing/disagreeing
As before, where there was a difference between men and women, women expressed more tolerant opinions.
3.4 Integrating people with mental illness into the community
Introduction
This section explores the theme of integrating people with mental illness into the community.The statements included are:n ‘People with mental illness are far less of a danger than most people
suppose’n ‘Less emphasis should be placed on protecting the public from people with
mental illness’n ‘The best therapy for many people with mental illness is to be part of a
normal community’n ‘Residents have nothing to fear from people coming into their neighbourhood
to obtain mental health services’n ‘People with mental health problems should have the same rights to a job as
anyone else’n ‘Most women who were once patients in a mental hospital can be trusted as
babysitters’
18Attitudes to Mental Illness 2013 TNS BMRB 2014
n ‘Mental illness is an illness like any other’n ‘No-one has the right to exclude people with mental illness from their
neighbourhood’n ‘Mental hospitals are an outdated means of treating people with mental
illnesses.
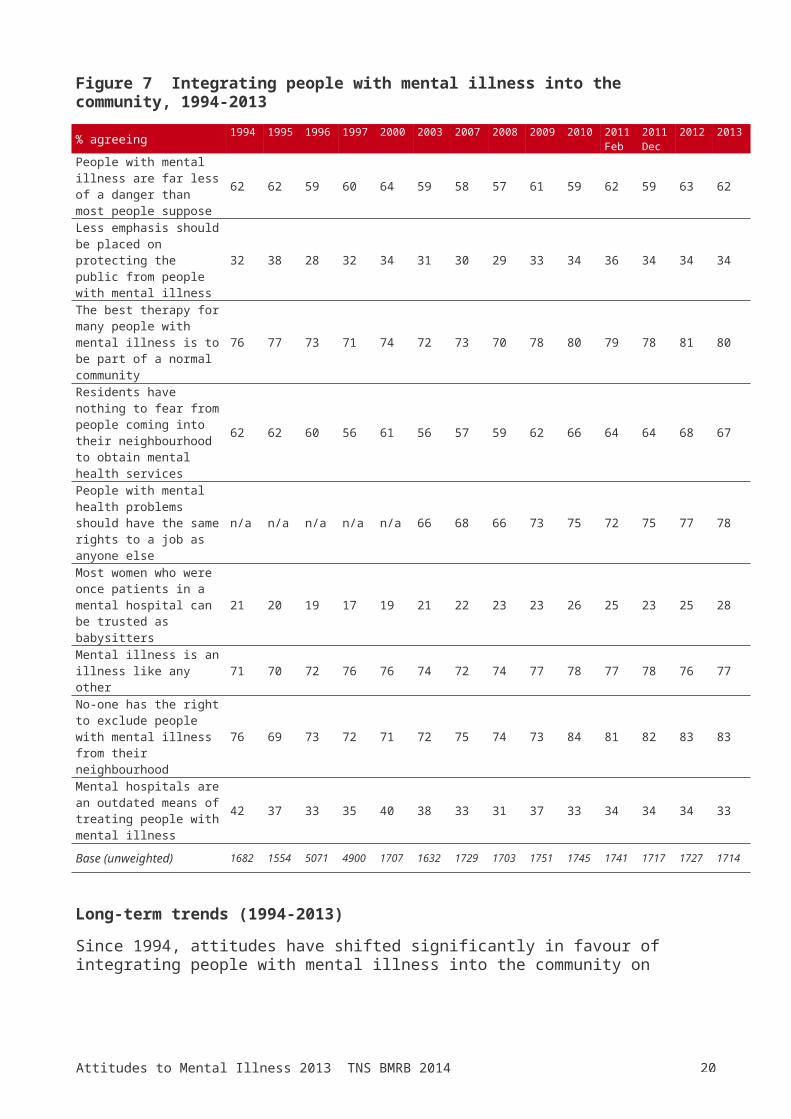
Analysis of these statements is based on the proportions of respondents agreeing with each.Figure 7 shows the proportions of respondents agreeing with these statements since 1994. Opinions on integrating people with mental illness into the community were mixed. Levels of agreement with several of the statements in this section were high, for example in 2013 83% agreed that ‘No-one has the right to exclude people with mental illness from their neighbourhood’, 80% that ‘The best therapy for many people with mental illness is to be part of a normal community’, 78% that ‘People with mental health problems should have the same rights to a job as anyone else’ and 77% that ‘Mental illness is an illness like any other’.However respondents were far less likely to agree that ‘Most women who were once patients in a mental hospital can be trusted as babysitters’ (28% agreed), ‘Mental hospitals are an outdated means of treating people with mental illness’ (33% agreed) and ‘Less emphasis should be placed on protecting the public from people with mental illness’ (34% agreed).The other two statements in this section fell between these two extremes, with 67% of respondents agreeing that ‘Residents have nothing to fear from people coming into their neighbourhood to obtain mental health services’ and 62% that ‘People with mental illness are far less of a danger than most people suppose’.
19Attitudes to Mental Illness 2013 TNS BMRB 2014
Figure 7 Integrating people with mental illness into the community, 1994-2013
% agreeing 1994 1995 1996 1997 2000 2003 2007 2008 2009 2010 2011 Feb
2011 Dec
2012 2013
People with mental illness are far less of a danger than most people suppose
62 62 59 60 64 59 58 57 61 59 62 59 63 62
Less emphasis should be placed on protecting the public from people with mental illness
32 38 28 32 34 31 30 29 33 34 36 34 34 34
The best therapy for many people with mental illness is to be part of a normal community
76 77 73 71 74 72 73 70 78 80 79 78 81 80
Residents have nothing to fear from people coming into their neighbourhood to obtain mental health services
62 62 60 56 61 56 57 59 62 66 64 64 68 67
People with mental health problems should have the same rights to a job as anyone else
n/a n/a n/a n/a n/a 66 68 66 73 75 72 75 77 78
Most women who were once patients in a mental hospital can be trusted as babysitters
21 20 19 17 19 21 22 23 23 26 25 23 25 28
Mental illness is an illness like any other 71 70 72 76 76 74 72 74 77 78 77 78 76 77No-one has the right to exclude people with mental illness from their neighbourhood
76 69 73 72 71 72 75 74 73 84 81 82 83 83
Mental hospitals are an outdated means of treating people with mental illness
42 37 33 35 40 38 33 31 37 33 34 34 34 33
Base (unweighted) 1682 1554 5071 4900 1707 1632 1729 1703 1751 1745 1741 1717 1727 1714
Long-term trends (1994-2013)
Since 1994, attitudes have shifted significantly in favour of integrating people with mental illness into the community on several of the statements in this section. Key changes from 1994 to 2013 are:n ‘The best therapy for many people with mental illness is to be part of a
normal community’ - % agreeing increased from 76% in 1994 to 80% in 2013n ‘Residents have nothing to fear from people coming into their neighbourhood
to obtain mental health services’- % agreeing increased from 62% in 1994 to 67% in 2013
n ‘Most women who were once patients in a mental hospital can be trusted as babysitters’ - % agreeing increased from 21% in 1994 to 28% in 2013
20Attitudes to Mental Illness 2013 TNS BMRB 2014
n ‘Mental illness is an illness like any other’ - % agreeing increased from 71% in 1994 to 77% in 2013
n ‘No-one has the right to exclude people with mental illness from their neighbourhood’ - % agreeing increased from 76% in 1994 to 83% in 2013
n ‘Mental hospitals are an outdated means of treating people with mental illnesses - % agreeing decreased from 42% in 1994 to 33% in 2013.
More recent trends (2008-2013)
Attitudes to all but one of the statements in this section are significantly more positive in 2013 than they were in 2008. The most notable improvements are:n ‘Most women who were once patients in a mental hospital can be trusted as
babysitters’ – agreement increased from 23% in 2008 to 28% in 2013 n ‘People with mental health problems should have the same rights to a job as
anyone else’ – agreement increased from 66% in 2008 to 78% in 2013n ‘Less emphasis should be placed on protecting the public from people with
mental illness – agreement increased from 29% in 2008 to 34% in 2013n ‘The best therapy for many people with mental illness is to be part of a
normal community’ – agreement increased from 70% in 2008 to 80% in 2013n ‘Residents have nothing to fear from people coming into their neighbourhood
to obtain mental health services’ – agreement increased from 59% in 2008 to 67% in 2013
n ‘No-one has the right to exclude people with mental illness from their neighbourhood’ – agreement increased from 74% in 2008 to 83% in 2013
The one statement where there is no significant difference between the levels of agreement in 2008 and 2013 is ‘Mental hospitals are an outdated means of treating people with mental illnesses’ (31% in 2008 and 33% in 2013).There was a significant increase between 2012 and 2013 for one statement in this section. The proportion agreeing that ‘Most women who were once patients in a mental hospital can be trusted as babysitters’ increased from 25% in 2012 to 28% in 2013.
Differences by age and sex
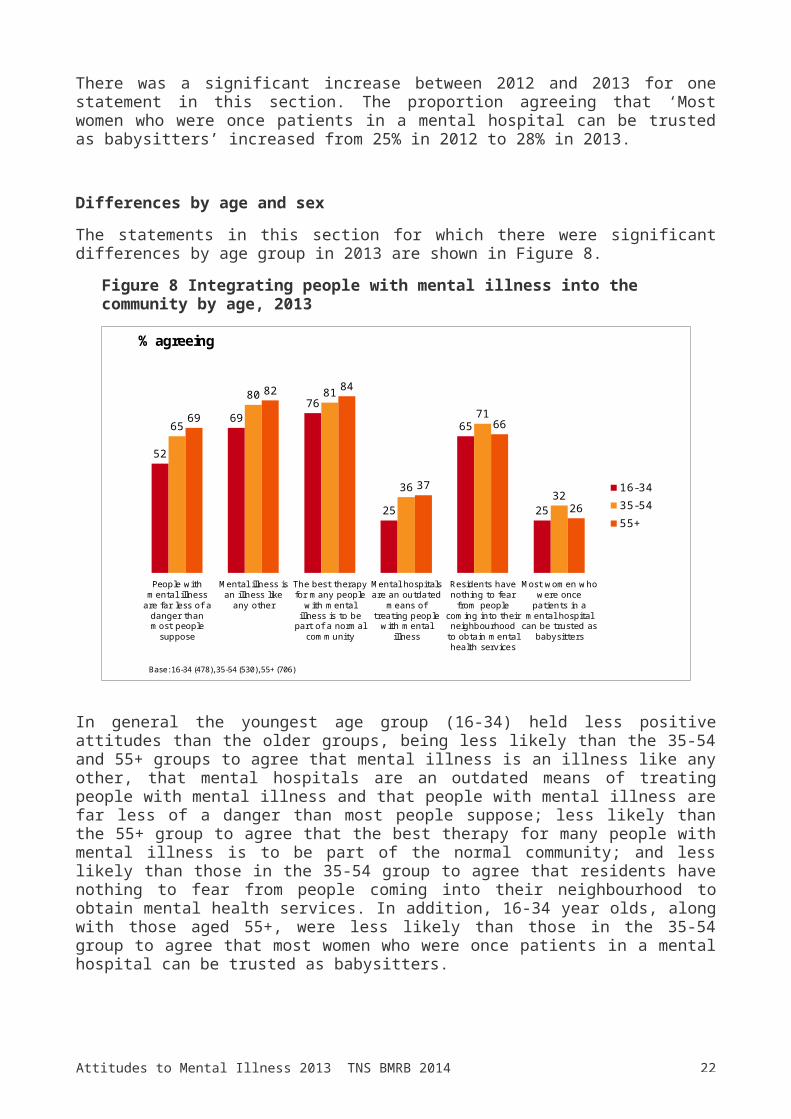
The statements in this section for which there were significant differences by age group in 2013 are shown in Figure 8.
21Attitudes to Mental Illness 2013 TNS BMRB 2014
Figure 8 Integrating people with mental illness into the community by age, 2013
3.14X AXIS
6.65BASE MARGIN
5.95TOP MARGIN
4.52CHART TOP
11.90LEFT MARGIN
11.90RIGHT MARGIN
Integrating by age, 2013
52
6976
25
65
25
65
80 81
36
71
32
69
82 84
37
66
26
People withmental illness
are far less of adanger thanmost people
suppose
Mental illness isan illness like
any other
The best therapyfor many people
with mentalillness is to be
part of a normalcommunity
Mental hospitalsare an outdated
means oftreating people
with mentalillness
Residents havenothing to fear
from peoplecoming into theirneighbourhood
to obtain mentalhealth services
Most women whowere once
patients in amental hospital
can be trusted asbabysitters
16-3435-5455+
Base: 16-34 (478), 35-54 (530), 55+ (706)
% agreeing
In general the youngest age group (16-34) held less positive attitudes than the older groups, being less likely than the 35-54 and 55+ groups to agree that mental illness is an illness like any other, that mental hospitals are an outdated means of treating people with mental illness and that people with mental illness are far less of a danger than most people suppose; less likely than the 55+ group to agree that the best therapy for many people with mental illness is to be part of the normal community; and less likely than those in the 35-54 group to agree that residents have nothing to fear from people coming into their neighbourhood to obtain mental health services. In addition, 16-34 year olds, along with those aged 55+, were less likely than those in the 35-54 group to agree that most women who were once patients in a mental hospital can be trusted as babysitters.Looking at differences by sex (Figure 9), women were more likely than men to agree that most women who were once patients in a mental hospital can be trusted as babysitters, that mental illness is an illness like any other, that people with mental illness are far less of a danger than most people suppose, that the best therapy for many people with mental illness is to be part of a normal community and that no-one has the right to exclude people with mental illness from their neighbourhood. Once again, women are generally expressing more positive attitudes than men.
22Attitudes to Mental Illness 2013 TNS BMRB 2014
Figure 9 Integrating people with mental illness into the community by sex, 2013
3.14X AXIS
6.65BASE MARGIN
5.95TOP MARGIN
4.52CHART TOP
11.90LEFT MARGIN
11.90RIGHT MARGIN
Integrating by gender, 2013
25
75
57
78 81
30
79
67
82 85
Most women whowere once patientsin a mental hospitalcan be trusted as
babysitters
Mental illness is anillness like any other
People with mentalillness are far less ofa danger than most
people suppose
The best therapy formany people withmental illness is tobe part of a normal
community
No-one has theright to exclude
people with mentalillness from theirneighbourhood
MenWomen
Base: Men (821), Women (893)
% agreeing
3.5 Causes of mental illness and the need for special services
Introduction
This section reports on statements about the causes of mental illness and the need for special services.The statements reported here are:n ‘There are sufficient existing services for people with mental illness’n ‘One of the main causes of mental illness is a lack of self-discipline and will-
power’n ‘There is something about people with mental illness that makes it easy to
tell them from normal people’.
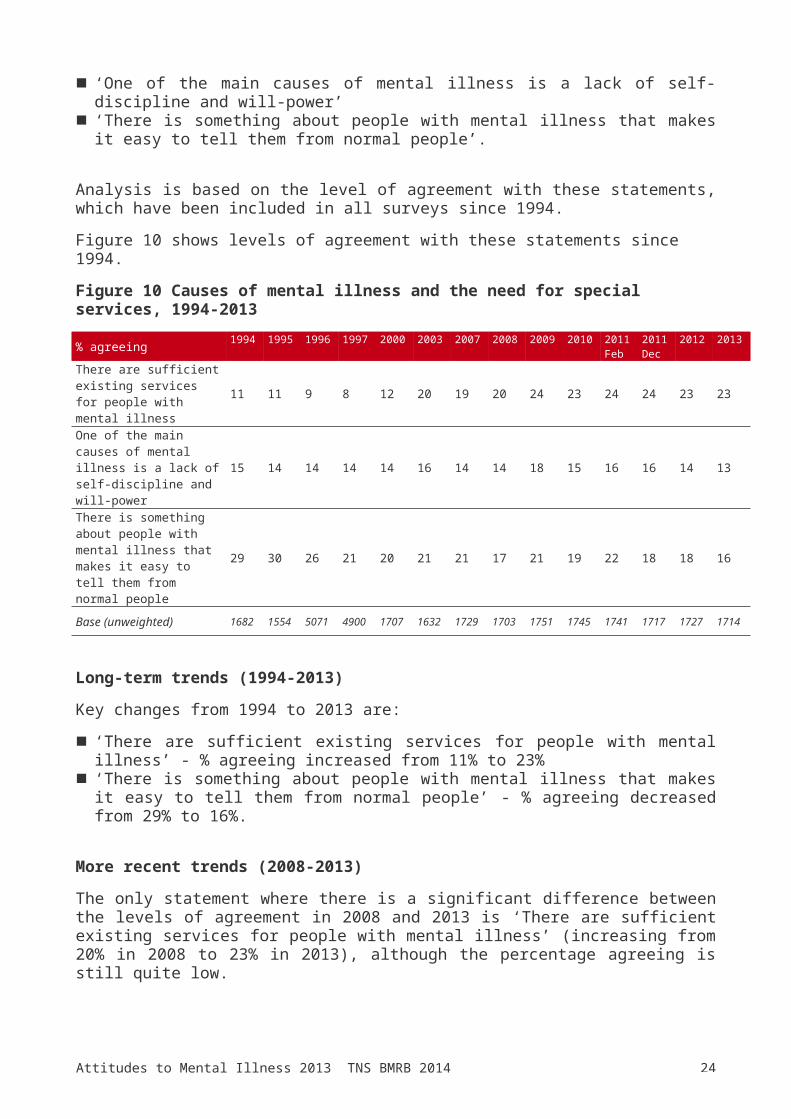
Analysis is based on the level of agreement with these statements, which have been included in all surveys since 1994.

23Attitudes to Mental Illness 2013 TNS BMRB 2014
Figure 10 shows levels of agreement with these statements since 1994.Figure 10 Causes of mental illness and the need for special services, 1994-2013
% agreeing 1994 1995 1996 1997 2000 2003 2007 2008 2009 2010 2011 Feb
2011 Dec
2012 2013
There are sufficient existing services for people with mental illness
11 11 9 8 12 20 19 20 24 23 24 24 23 23
One of the main causes of mental illness is a lack of self-discipline and will-power
15 14 14 14 14 16 14 14 18 15 16 16 14 13
There is something about people with mental illness that makes it easy to tell them from normal people
29 30 26 21 20 21 21 17 21 19 22 18 18 16
Base (unweighted) 1682 1554 5071 4900 1707 1632 1729 1703 1751 1745 1741 1717 1727 1714
Long-term trends (1994-2013)
Key changes from 1994 to 2013 are:n ‘There are sufficient existing services for people with mental illness’ - %
agreeing increased from 11% to 23%n ‘There is something about people with mental illness that makes it easy to
tell them from normal people’ - % agreeing decreased from 29% to 16%.
More recent trends (2008-2013)
The only statement where there is a significant difference between the levels of agreement in 2008 and 2013 is ‘There are sufficient existing services for people with mental illness’ (increasing from 20% in 2008 to 23% in 2013), although the percentage agreeing is still quite low. There have been no significant changes in levels of agreement with these statements between 2012 and 2013.
Differences by age and sex
Looking at differences by age, there was a significant difference between the youngest age group (age 16-34) and the older groups for one statement in this section – 16-34 year olds (33%) were more likely than 35-54 year olds (18%) and those aged 55+ (18%) to agree that there are sufficient existing services for people with mental illness.Looking at differences by sex, there was a significant difference between men and women for two statements in this section – men (26%) were more likely
24Attitudes to Mental Illness 2013 TNS BMRB 2014
than women (20%) to agree that there are sufficient existing services for people with mental illness, and men (16%) were more likely than women (11%) to agree that one of the main causes of mental illness is a lack of self-discipline and will-power.
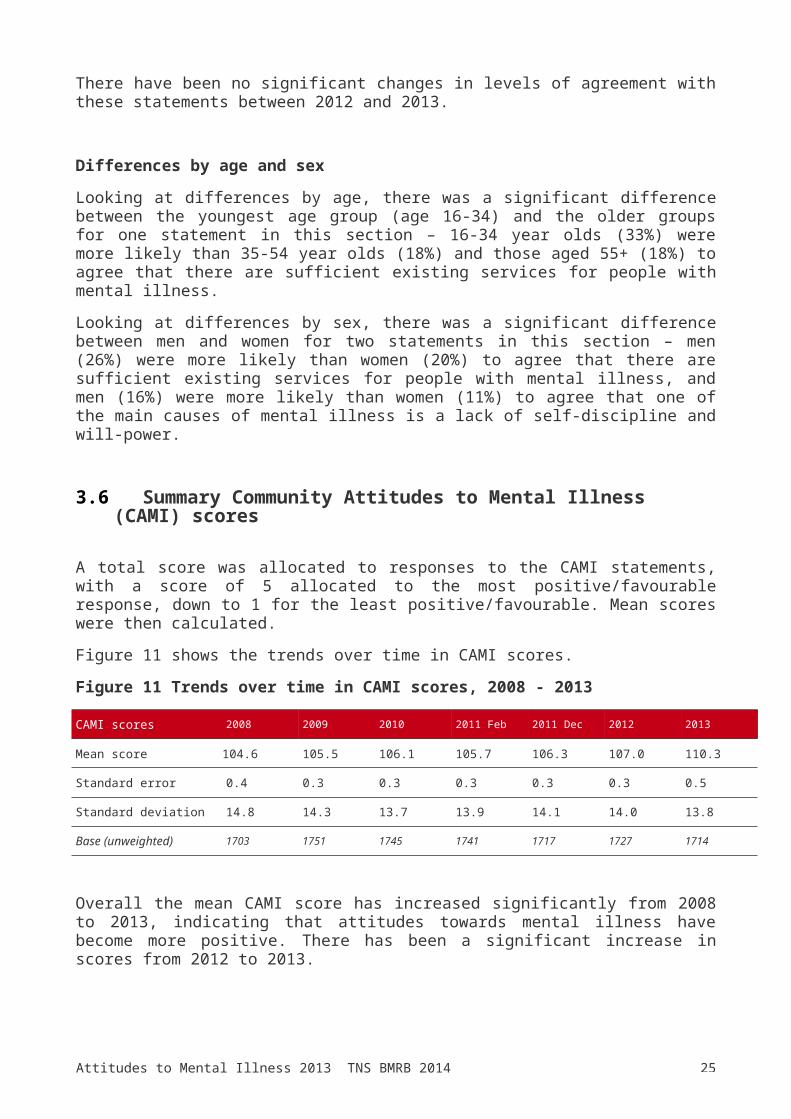
3.6 Summary Community Attitudes to Mental Illness (CAMI) scores
A total score was allocated to responses to the CAMI statements, with a score of 5 allocated to the most positive/favourable response, down to 1 for the least positive/favourable. Mean scores were then calculated.Figure 11 shows the trends over time in CAMI scores.Figure 11 Trends over time in CAMI scores, 2008 - 2013
CAMI scores 2008 2009 2010 2011 Feb 2011 Dec 2012 2013
Mean score 104.6 105.5 106.1 105.7 106.3 107.0 110.3
Standard error 0.4 0.3 0.3 0.3 0.3 0.3 0.5
Standard deviation 14.8 14.3 13.7 13.9 14.1 14.0 13.8
Base (unweighted) 1703 1751 1745 1741 1717 1727 1714
Overall the mean CAMI score has increased significantly from 2008 to 2013, indicating that attitudes towards mental illness have become more positive. There has been a significant increase in scores from 2012 to 2013.
Figure 12 compares the CAMI scores among different population groups.Figure 12 CAMI scores among different population groups, 2013
CAMI scores Sex Age group Social grade Ethnicity Familiarity with mental health problems
1 2 1 2 3 1 2 1 2 1 2 3
Men Wom-en 16-34 35-54 55+ ABC1 C2DE White BME Self
Someone else
No-one
Mean score 106.72 110.31 106.4 2,3
110.5 1,3
108.6 1,2 111.22 105.81 110.02 98.51 114.8
2,3112.1 1,3
101.9 1,2
Standard error 0.5 0.5 0.6 0.6 0.6 0.4 0.5 0.3 0.9 1.2 0.4 0.5Standard deviation 13.7 13.8 13.4 14.0 13.8 13.2 14.0 13.4 12.9 13.0 12.6 13.0Base (unweighted) 821 893 478 530 706 810 904 1507 200 126 953 606
n Note: 1/2/3 shows that the figure is significantly different from that for the group indicated by the column number
25Attitudes to Mental Illness 2013 TNS BMRB 2014
As Figure 12 shows, mean CAMI scores were significantly higher, indicating more positive attitudes towards mental illness, for the following groups:n Women compared with menn Respondents aged 35-54 compared with those aged 16-34 and 55+n Respondents aged 55+ compared with those aged 16-34n Respondents in ABC1 social grades compared with those in C2DE gradesn White respondents compared with those in black and minority ethnic groupsn Those who have experienced mental health problems themselves, compared
with those who know someone else with mental health problems and those who do not know anyone with mental health problems
n Those who know someone else with mental health problems compared with those who do not know anyone with mental health problems.n

26Attitudes to Mental Illness 2013 TNS BMRB 2014
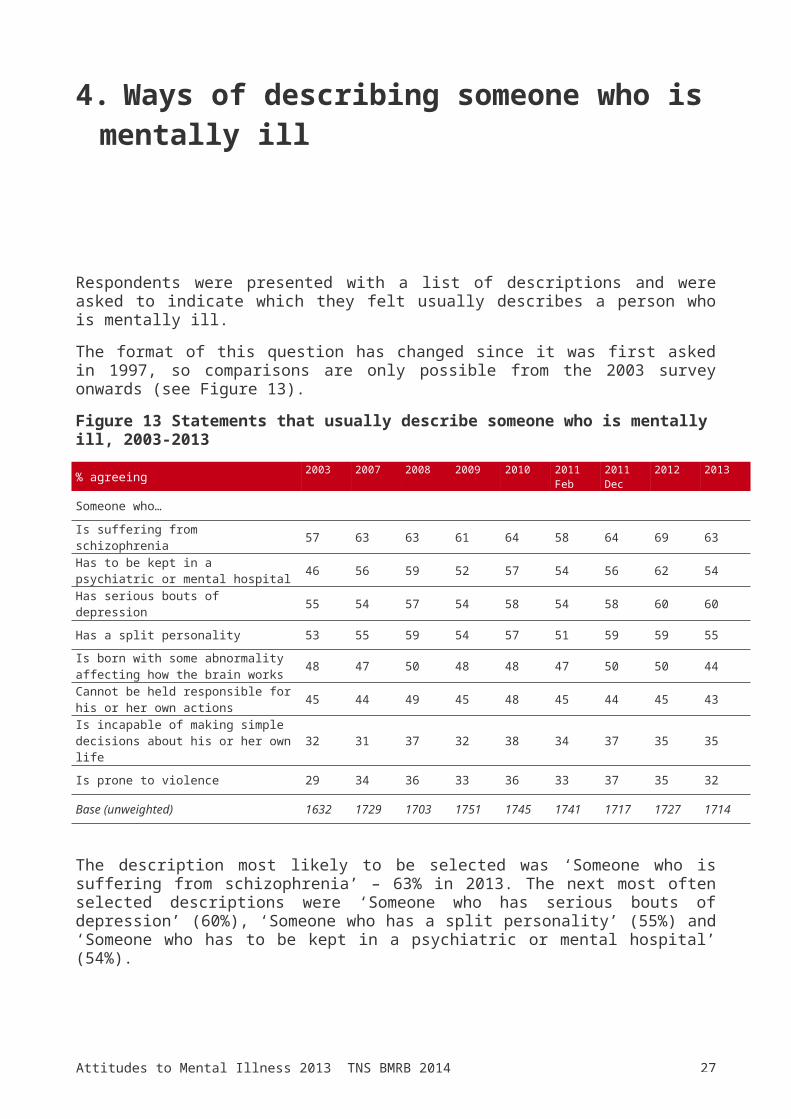
4. Ways of describing someone who is mentally ill
Respondents were presented with a list of descriptions and were asked to indicate which they felt usually describes a person who is mentally ill.The format of this question has changed since it was first asked in 1997, so comparisons are only possible from the 2003 survey onwards (see Figure 13).Figure 13 Statements that usually describe someone who is mentally ill, 2003-2013
% agreeing 2003 2007 2008 2009 2010 2011 Feb
2011 Dec
2012 2013
Someone who…
Is suffering from schizophrenia 57 63 63 61 64 58 64 69 63Has to be kept in a psychiatric or mental hospital 46 56 59 52 57 54 56 62 54
Has serious bouts of depression 55 54 57 54 58 54 58 60 60
Has a split personality 53 55 59 54 57 51 59 59 55Is born with some abnormality affecting how the brain works 48 47 50 48 48 47 50 50 44Cannot be held responsible for his or her own actions 45 44 49 45 48 45 44 45 43Is incapable of making simple decisions about his or her own life 32 31 37 32 38 34 37 35 35
Is prone to violence 29 34 36 33 36 33 37 35 32
Base (unweighted) 1632 1729 1703 1751 1745 1741 1717 1727 1714
The description most likely to be selected was ‘Someone who is suffering from schizophrenia’ – 63% in 2013. The next most often selected descriptions were ‘Someone who has serious bouts of depression’ (60%), ‘Someone who has a split personality’ (55%) and ‘Someone who has to be kept in a psychiatric or mental hospital’ (54%).The descriptions least likely to be selected were ‘Someone who is prone to violence’ (32%) and ‘Someone who is incapable of making simple decisions about his or her own life’ (35%).
More recent trends (2008-2013)
27Attitudes to Mental Illness 2013 TNS BMRB 2014
Since 2008 there has been a significant decrease in the proportion of respondents selecting several of these descriptions:n ‘Someone who is born with some abnormality affecting the way the brain
works’ – from 50% in 2008 to 44% in 2013n ‘Someone who cannot be held responsible for his or her own actions’ – from
49% in 2008 to 43% in 2013n ‘Someone who is prone to violence’ – from 36% in 2008 to 32% in 2013n ‘Someone who has to be kept in a psychiatric or mental hospital’ – from 59%
in 2008 to 54% in 2013n ‘Someone who has a split personality’ – from 59% in 2008 to 55% in 2013.
There was a significant decrease from 2012 to 2013 in the proportion of respondents selecting ‘Someone who is suffering from schizophrenia’ (from 69% to 63%), ‘Someone who has to be kept in a psychiatric or mental hospital’ (from 62% to 54%), ‘Someone who has a split personality’ (from 59% to 55%) and ‘Someone who is born with some abnormality affecting the way the brain works’ (from 50% to 44%).
28Attitudes to Mental Illness 2013 TNS BMRB 2014
5. Mental health-related knowledge
5.1 IntroductionMental health-related knowledge was measured by the Mental Health Knowledge Scale (MAKS).4 Part A comprised six items covering stigma-related mental health knowledge areas (help-seeking, recognition, support, employment, treatment and recovery) and Part B comprised six items covering the identification of various types of mental illness. These questions were first asked in the survey in 2009.
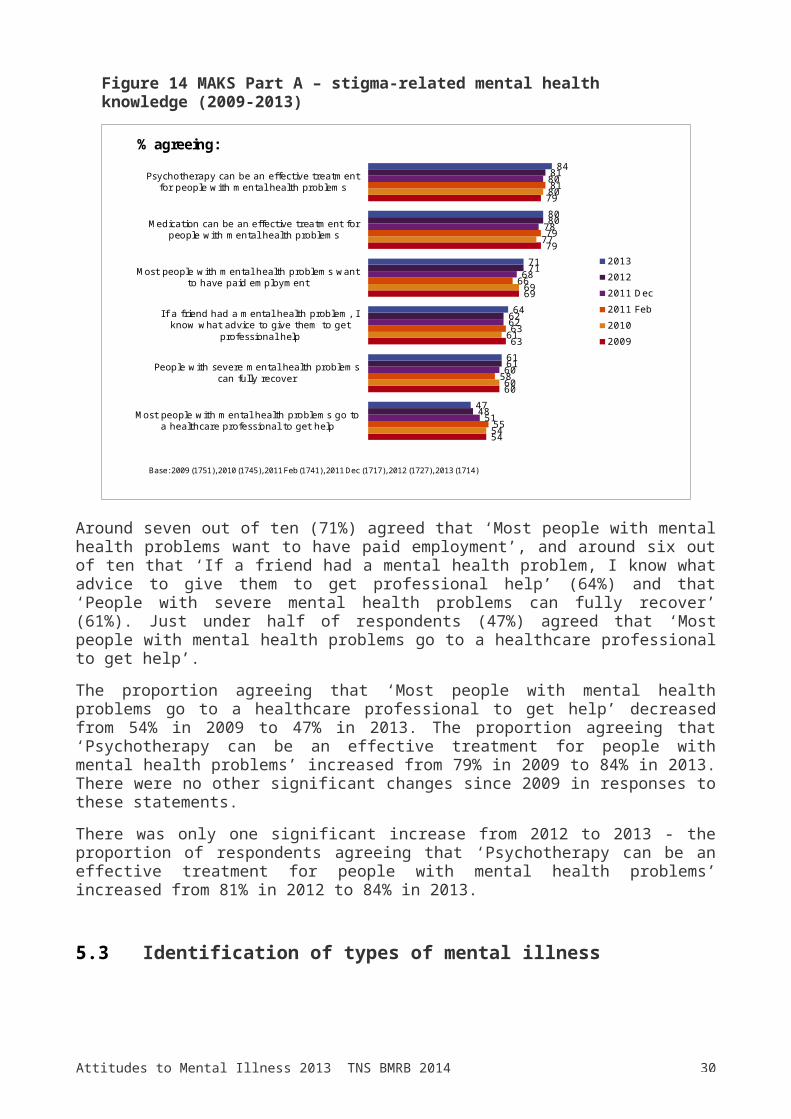
5.2 Stigma-related mental health knowledgeFigure 14 shows levels of agreement with the MAKS Part A statements, covering stigma-related mental health knowledge. There was a high level of agreement that mental health problems can be treated, with around eight out of ten respondents agreeing that psychotherapy (84%) and medication (80%) can be effective treatments for people with mental health problems.
4 Evans-Lacko S, Little K, Meltzer H, Rose D, Rhydderch D, Henderson C et al ‘Development and psychometric properties of the Mental Health Knowledge Schedule’, Can J Psychiatry 2010; 55: 440-8
29Attitudes to Mental Illness 2013 TNS BMRB 2014
Figure 14 MAKS Part A – stigma-related mental health knowledge (2009-2013)
3.14X AXIS
6.65BASE MARGIN
5.95TOP MARGIN
4.52CHART TOP
11.90LEFT MARGIN
11.90RIGHT MARGIN
Mental health knowledge, 2009-2013
54
60
63
69
79
79
54
60
61
69
77
80
55
58
63
66
79
81
51
60
62
68
78
80
48
61
62
71
80
81
47
61
64
71
80
84
Most people with mental health problems go toa healthcare professional to get help
People with severe mental health problemscan fully recover
I f a friend had a mental health problem, Iknow what advice to give them to get
professional help
Most people with mental health problems wantto have paid employment
Medication can be an effective treatment forpeople with mental health problems
Psychotherapy can be an effective treatmentfor people with mental health problems
201320122011 Dec2011 Feb20102009
Base: 2009 (1751), 2010 (1745), 2011 Feb (1741), 2011 Dec (1717), 2012 (1727), 2013 (1714)
% agreeing:
Around seven out of ten (71%) agreed that ‘Most people with mental health problems want to have paid employment’, and around six out of ten that ‘If a friend had a mental health problem, I know what advice to give them to get professional help’ (64%) and that ‘People with severe mental health problems can fully recover’ (61%). Just under half of respondents (47%) agreed that ‘Most people with mental health problems go to a healthcare professional to get help’.The proportion agreeing that ‘Most people with mental health problems go to a healthcare professional to get help’ decreased from 54% in 2009 to 47% in 2013. The proportion agreeing that ‘Psychotherapy can be an effective treatment for people with mental health problems’ increased from 79% in 2009 to 84% in 2013. There were no other significant changes since 2009 in responses to these statements.There was only one significant increase from 2012 to 2013 - the proportion of respondents agreeing that ‘Psychotherapy can be an effective treatment for people with mental health problems’ increased from 81% in 2012 to 84% in 2013.
5.3 Identification of types of mental illness
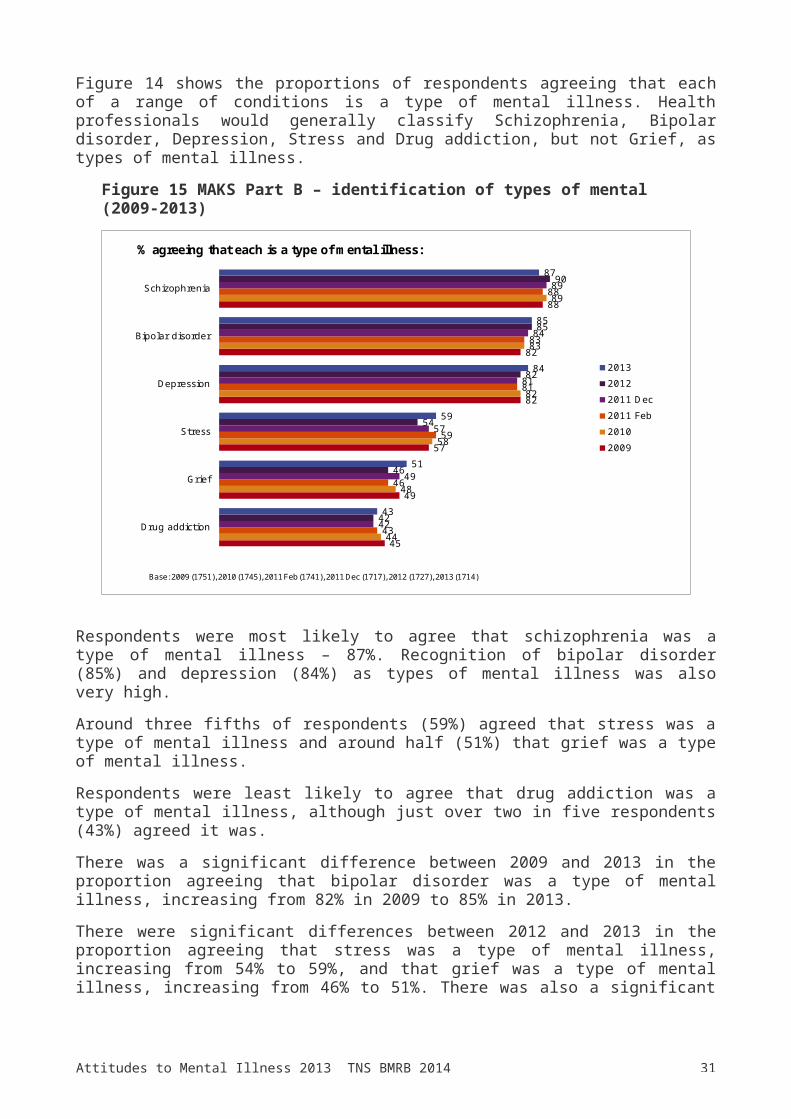
Figure 14 shows the proportions of respondents agreeing that each of a range of conditions is a type of mental illness. Health professionals would generally
30Attitudes to Mental Illness 2013 TNS BMRB 2014
classify Schizophrenia, Bipolar disorder, Depression, Stress and Drug addiction, but not Grief, as types of mental illness.
Figure 15 MAKS Part B – identification of types of mental (2009-2013)
3.14X AXIS
6.65BASE MARGIN
5.95TOP MARGIN
4.52CHART TOP
11.90LEFT MARGIN
11.90RIGHT MARGIN
Mental health knowledge, 2009-2013
45
49
57
82
82
88
44
48
58
82
83
89
43
46
59
81
83
88
42
49
57
81
84
89
42
46
54
82
85
90
43
51
59
84
85
87
Drug addiction
Grief
Stress
Depression
Bipolar disorder
Schizophrenia
201320122011 Dec2011 Feb20102009
% agreeing that each is a type of mental illness:
Base: 2009 (1751), 2010 (1745), 2011 Feb (1741), 2011 Dec (1717), 2012 (1727), 2013 (1714)
Respondents were most likely to agree that schizophrenia was a type of mental illness – 87%. Recognition of bipolar disorder (85%) and depression (84%) as types of mental illness was also very high.Around three fifths of respondents (59%) agreed that stress was a type of mental illness and around half (51%) that grief was a type of mental illness. Respondents were least likely to agree that drug addiction was a type of mental illness, although just over two in five respondents (43%) agreed it was. There was a significant difference between 2009 and 2013 in the proportion agreeing that bipolar disorder was a type of mental illness, increasing from 82% in 2009 to 85% in 2013.There were significant differences between 2012 and 2013 in the proportion agreeing that stress was a type of mental illness, increasing from 54% to 59%, and that grief was a type of mental illness, increasing from 46% to 51%. There was also a significant decrease between 2012 and 2013 in the proportion agreeing that schizophrenia was a type of mental illness – from 90% to 87%.
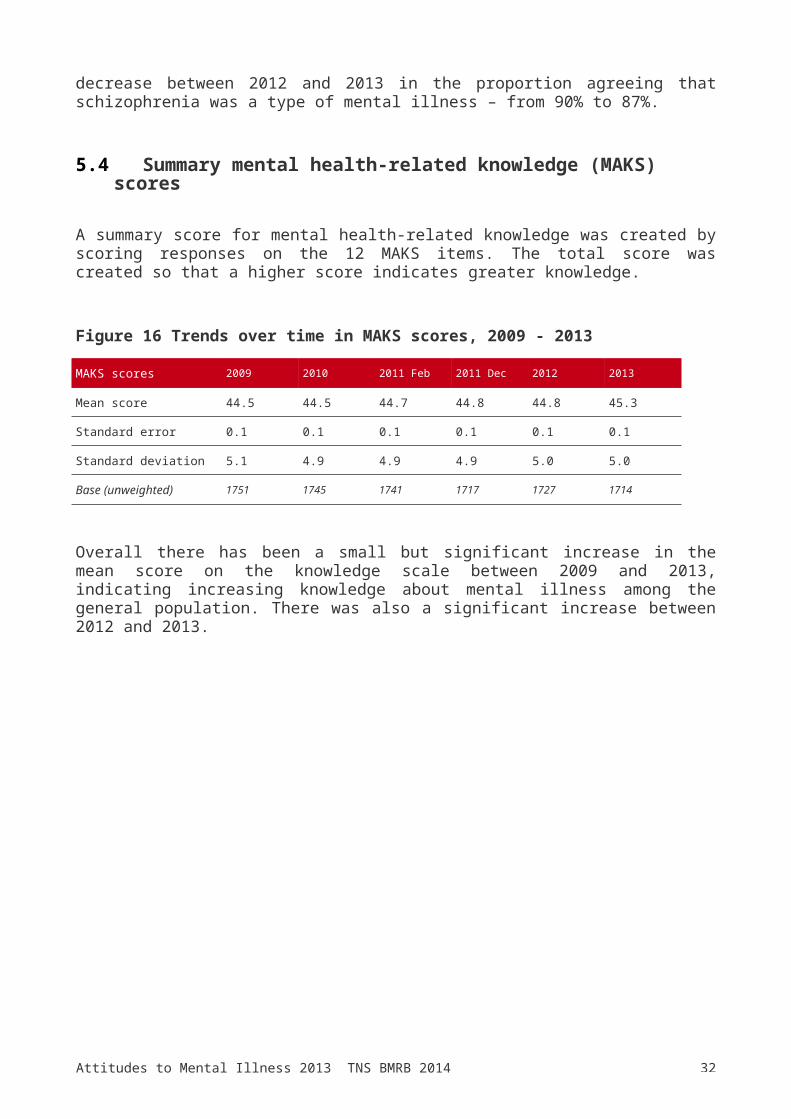
5.4 Summary mental health-related knowledge (MAKS) scores
31Attitudes to Mental Illness 2013 TNS BMRB 2014
A summary score for mental health-related knowledge was created by scoring responses on the 12 MAKS items. The total score was created so that a higher score indicates greater knowledge.
Figure 16 Trends over time in MAKS scores, 2009 - 2013
MAKS scores 2009 2010 2011 Feb 2011 Dec 2012 2013
Mean score 44.5 44.5 44.7 44.8 44.8 45.3
Standard error 0.1 0.1 0.1 0.1 0.1 0.1
Standard deviation 5.1 4.9 4.9 4.9 5.0 5.0
Base (unweighted) 1751 1745 1741 1717 1727 1714
Overall there has been a small but significant increase in the mean score on the knowledge scale between 2009 and 2013, indicating increasing knowledge about mental illness among the general population. There was also a significant increase between 2012 and 2013.
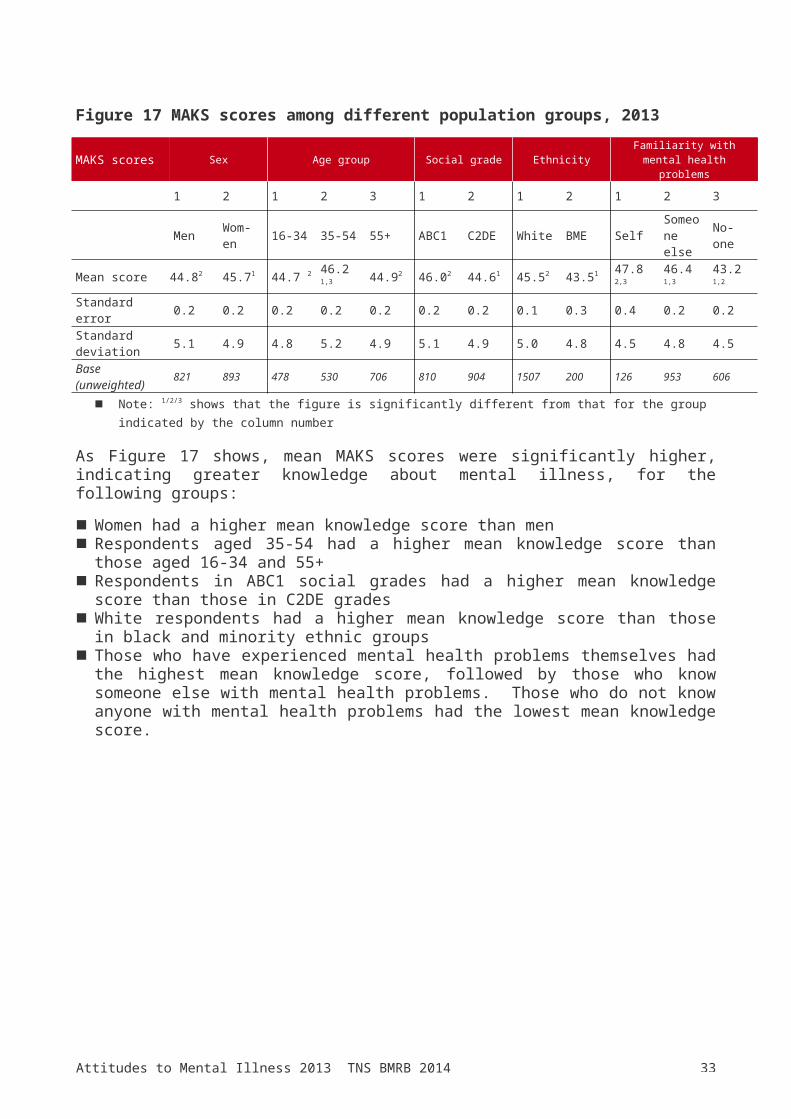
Figure 17 MAKS scores among different population groups, 2013
MAKS scores Sex Age group Social grade Ethnicity Familiarity with mental health problems
1 2 1 2 3 1 2 1 2 1 2 3
Men Wom-en 16-34 35-54 55+ ABC1 C2DE White BME Self
Someone else
No-one
Mean score 44.82 45.71 44.7 2 46.2 1,3 44.92 46.02 44.61 45.52 43.51 47.8 2,3 46.4 1,3 43.2 1,2
Standard error 0.2 0.2 0.2 0.2 0.2 0.2 0.2 0.1 0.3 0.4 0.2 0.2Standard deviation 5.1 4.9 4.8 5.2 4.9 5.1 4.9 5.0 4.8 4.5 4.8 4.5Base (unweighted) 821 893 478 530 706 810 904 1507 200 126 953 606
n Note: 1/2/3 shows that the figure is significantly different from that for the group indicated by the column number
As Figure 17 shows, mean MAKS scores were significantly higher, indicating greater knowledge about mental illness, for the following groups:n Women had a higher mean knowledge score than menn Respondents aged 35-54 had a higher mean knowledge score than those
aged 16-34 and 55+n Respondents in ABC1 social grades had a higher mean knowledge score than
those in C2DE gradesn White respondents had a higher mean knowledge score than those in black
and minority ethnic groups
32Attitudes to Mental Illness 2013 TNS BMRB 2014
n Those who have experienced mental health problems themselves had the highest mean knowledge score, followed by those who know someone else with mental health problems. Those who do not know anyone with mental health problems had the lowest mean knowledge score.
33Attitudes to Mental Illness 2013 TNS BMRB 2014
6. Reported and intended behaviour (RIBS)
6.1 Reported and intended behaviourRespondents were asked about their experiences of people who have mental health problems, that is, ‘people who have been seen by healthcare staff for a mental health problem’. Respondents were asked whether they currently, or ever had:n Lived with someone with a mental health problem;n Worked with someone with a mental health problem;n Had a neighbour with a mental health problem; orn Had a close friend with a mental health problem.
They were then asked to agree or disagree (on a 5-point scale) with the following statement: ‘In the future, I would be willing to...’n ... live with someone with a mental health problemn ... work with someone with a mental health problemn ... live nearby to someone with a mental health problemn ... continue a relationship with a friend who developed a mental health
problem.
These questions form the Reported and Intended Behaviour Scale (RIBS)5 and have been asked since 2009.Figure 18 shows trends in reported behaviours since 2009.
5 Evans-Lacko S, Rose D, Little K, Flach C, Rhydderch D, Henderson C et al ‘Development and psychometric properties of the reported and intended behaviour scale (RIBS): a stigma-related behaviour measure’, Epidemiol Psychiatr Sci 2011: 20, 263-71.
34Attitudes to Mental Illness 2013 TNS BMRB 2014
Figure 18 Reported behaviour, 2009 to 2013
3.14X AXIS
6.65BASE MARGIN
5.95TOP MARGIN
4.52CHART TOP
11.90LEFT MARGIN
11.90RIGHT MARGIN
Reported behaviour, 2009-2013
19
20
27
35
20
16
25
34
18
19
26
33
20
20
27
34
21
22
29
39
21
23
29
40
Have a neighbour with a mental healthproblem
Live with someone with a mentalhealth problem
Work with someone with a mentalhealth problem
Have a close friend with a mentalhealth problem
201320122011 Dec2011 Feb20102009
% who currently or ever have:
Base: 2009 (1751), 2010 (1745), 2011 Feb (1741), 2011 Dec (1717), 2012 (1727), 2013 (1714)
The most common reported experience of someone with a mental health problem was with a close friend – 40% of respondents said they currently or ever had a close friend with a mental health problem. Around three in ten (29%) reported that they currently or ever have worked with someone with a mental health problem, 23% that they had lived with and 21% that they had a neighbour with a mental health problem.Since 2009 there has been a significant increase in the proportion of respondents who reported that they currently or ever had a close friend with a mental health problem - from 35% in 2009 to 40% in 2013; and the proportion reporting that they were or have ever lived with someone with a mental health problem – from 20% in 2009 to 23% in 2013.There have been no significant changes in reported experiences between 2012 and 2013. Figure 19 shows the trends in intended behaviours.

35Attitudes to Mental Illness 2013 TNS BMRB 2014
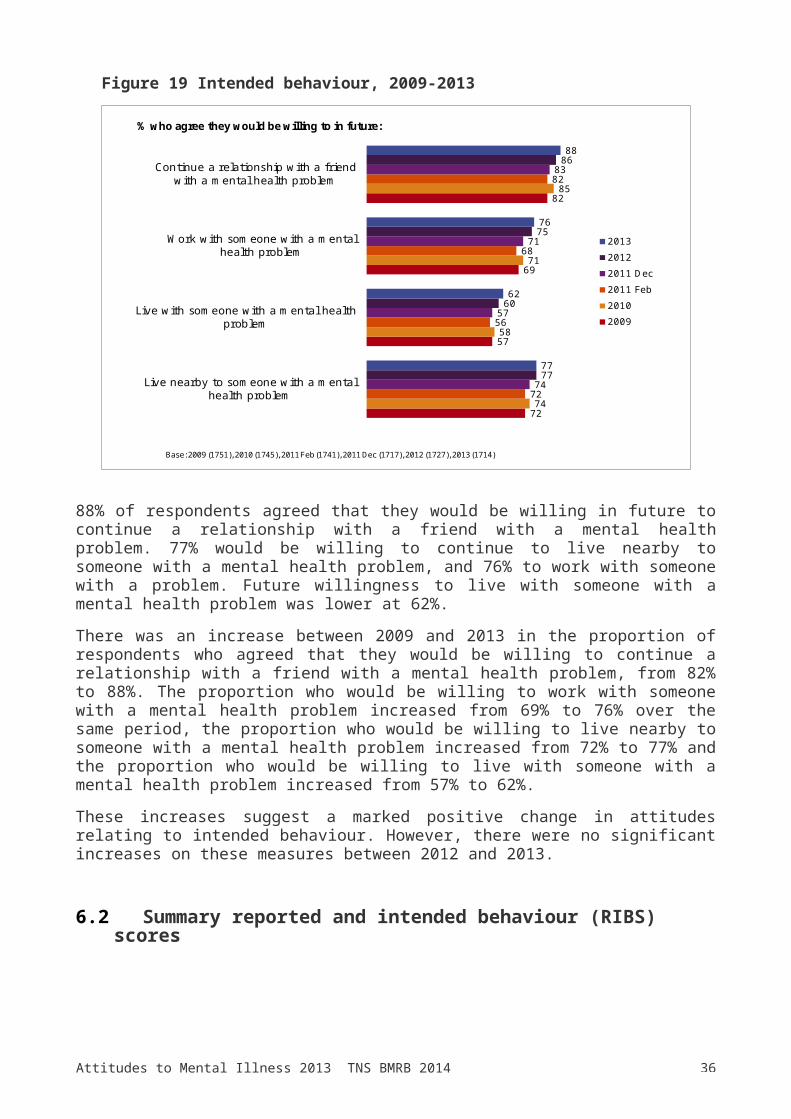
Figure 19 Intended behaviour, 2009-2013
3.14X AXIS
6.65BASE MARGIN
5.95TOP MARGIN
4.52CHART TOP
11.90LEFT MARGIN
11.90RIGHT MARGIN
Intended behaviour, 2013
72
57
69
82
74
58
71
85
72
56
68
82
74
57
71
83
77
60
75
86
77
62
76
88
Live nearby to someone with a mentalhealth problem
Live with someone with a mental healthproblem
Work with someone with a mentalhealth problem
Continue a relationship with a friendwith a mental health problem
201320122011 Dec2011 Feb20102009
% who agree they would be willing to in future:
Base: 2009 (1751), 2010 (1745), 2011 Feb (1741), 2011 Dec (1717), 2012 (1727), 2013 (1714)
88% of respondents agreed that they would be willing in future to continue a relationship with a friend with a mental health problem. 77% would be willing to continue to live nearby to someone with a mental health problem, and 76% to work with someone with a problem. Future willingness to live with someone with a mental health problem was lower at 62%.There was an increase between 2009 and 2013 in the proportion of respondents who agreed that they would be willing to continue a relationship with a friend with a mental health problem, from 82% to 88%. The proportion who would be willing to work with someone with a mental health problem increased from 69% to 76% over the same period, the proportion who would be willing to live nearby to someone with a mental health problem increased from 72% to 77% and the proportion who would be willing to live with someone with a mental health problem increased from 57% to 62%.These increases suggest a marked positive change in attitudes relating to intended behaviour. However, there were no significant increases on these measures between 2012 and 2013.
6.2 Summary reported and intended behaviour (RIBS) scores
Summary scores were created for reported and intended behaviour, by scoring the RIBS intended and reported behaviour items. The total intended behaviour score was calculated so that a higher score indicates more favourable intended
36Attitudes to Mental Illness 2013 TNS BMRB 2014
behaviour. The reported behaviour score was calculated by counting the number of reports of close contact with people with mental health problems. Summary scores for reported and intended behaviour are shown in Figure 20.Figure 20 Trends over time in RIBS scores – reported and intended behaviour, 2009 - 2013RIBS scores – reported behaviour 2009 2010 2011 Feb 2011 Dec 2012 2013
Mean score 1.02 0.96 0.95 1.01 1.10 1.13
Standard error 0.03 0.03 0.03 0.03 0.03 0.03
Standard deviation 1.16 1.13 1.13 1.16 1.18 1.21
RIBS scores – intended behaviour 2009 2010 2011 Feb 2011 Dec 2012 2013
Mean score 15.9 16.1 15.9 16.2 16.4 16.7
Standard error 0.09 0.08 0.09 0.08 0.08 0.08
Standard deviation 3.6 3.4 3.5 3.4 3.4 3.3
Base (unweighted) 1751 1745 1741 1717 1727 1714
Overall there was a small but significant increase in the reported behaviour score between 2009 and 2013. There was no significant difference in the score from 2012 to 2013.The mean intended behaviour score also increased significantly between 2009 and 2013. There was also a significant increase between 2012 and 2013.
Figure 21 shows mean reported and intended behaviour scores among different groups of the population.

37Attitudes to Mental Illness 2013 TNS BMRB 2014
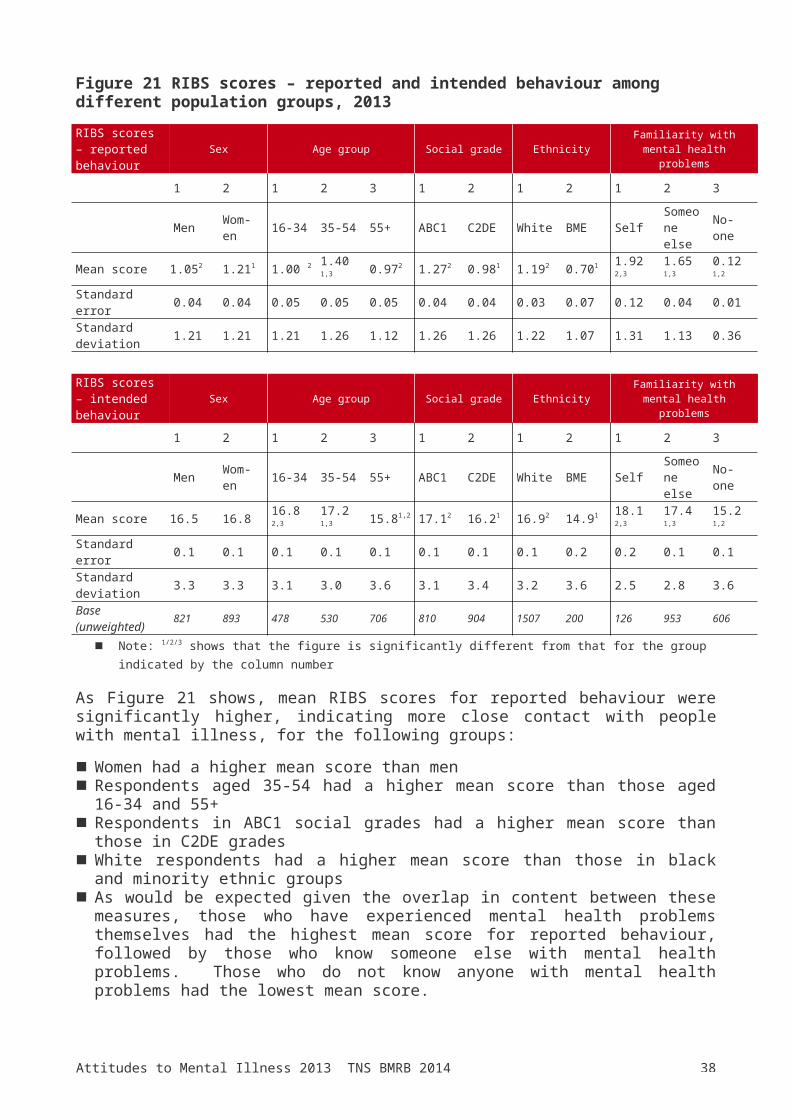
Figure 21 RIBS scores – reported and intended behaviour among different population groups, 2013RIBS scores – reported behaviour
Sex Age group Social grade Ethnicity Familiarity with mental health problems
1 2 1 2 3 1 2 1 2 1 2 3
Men Wom-en 16-34 35-54 55+ ABC1 C2DE White BME Self
Someone else
No-one
Mean score 1.052 1.211 1.00 2 1.40 1,3 0.972 1.272 0.981 1.192 0.701 1.92 2,3 1.65 1,3 0.12 1,2
Standard error 0.04 0.04 0.05 0.05 0.05 0.04 0.04 0.03 0.07 0.12 0.04 0.01Standard deviation 1.21 1.21 1.21 1.26 1.12 1.26 1.26 1.22 1.07 1.31 1.13 0.36
RIBS scores – intended behaviour
Sex Age group Social grade Ethnicity Familiarity with mental health problems
1 2 1 2 3 1 2 1 2 1 2 3
Men Wom-en 16-34 35-54 55+ ABC1 C2DE White BME Self
Someone else
No-one
Mean score 16.5 16.8 16.8 2,3 17.2 1,3 15.81,2 17.12 16.21 16.92 14.91 18.1
2,3 17.4 1,3 15.2 1,2
Standard error 0.1 0.1 0.1 0.1 0.1 0.1 0.1 0.1 0.2 0.2 0.1 0.1Standard deviation 3.3 3.3 3.1 3.0 3.6 3.1 3.4 3.2 3.6 2.5 2.8 3.6Base (unweighted) 821 893 478 530 706 810 904 1507 200 126 953 606
n Note: 1/2/3 shows that the figure is significantly different from that for the group indicated by the column number
As Figure 21 shows, mean RIBS scores for reported behaviour were significantly higher, indicating more close contact with people with mental illness, for the following groups:n Women had a higher mean score than menn Respondents aged 35-54 had a higher mean score than those aged 16-34
and 55+n Respondents in ABC1 social grades had a higher mean score than those in
C2DE gradesn White respondents had a higher mean score than those in black and minority
ethnic groupsn As would be expected given the overlap in content between these measures,
those who have experienced mental health problems themselves had the highest mean score for reported behaviour, followed by those who know someone else with mental health problems. Those who do not know anyone with mental health problems had the lowest mean score.
Looking at intended behaviour, mean RIBS scores were significantly higher, indicating more favourable intended behaviour, for the following groups:
38Attitudes to Mental Illness 2013 TNS BMRB 2014
n Respondents aged 35-54 had a higher mean score than those aged 16-34 and 55+. Those aged 55+ had the lowest mean score.
n Respondents in ABC1 social grades had a higher mean score than those in C2DE grades
n White respondents had a higher mean score than those in black and minority ethnic groups
n Those who have experienced mental health problems themselves had the highest mean score for reported behaviour, followed by those who know someone else with mental health problems. Those who do not know anyone with mental health problems had the lowest mean score.
39Attitudes to Mental Illness 2013 TNS BMRB 2014
7. Personal experience of mental illness
7.1 Friends and family who have had mental illnessRespondents were asked who, if anyone, close to them has had some kind of mental illness. Results are shown in Figure 22.
Figure 22 Person closest to respondent who has had some kind of mental illness, 2009 to 2013
3.14X AXIS
6.65BASE MARGIN
5.95TOP MARGIN
4.52CHART TOP
11.90LEFT MARGIN
11.90RIGHT MARGIN
Person closest to respondent who has had some kind of mental illness
4
5
6
5
8
15
14
58
4
4
5
4
9
16
13
56
7
3
5
5
9
14
15
57
6
5
5
6
9
14
15
60
5
4
5
6
10
16
17
63
8
3
5
7
9
17
15
64
Other
Acquaintance
Work colleague
Self
Other family (uncle/aunt/cousin/grandparent etc)
Friend
Immediate family (spouse/child/ sister/brother/parentetc)
Anyone mentioned
201320122011 Dec2011 Feb20102009
Base: 2009 (1751), 2010 (1745), 2011 Feb (1741), 2011 Dec (1717), 2012 (1727), 2013 (1714)
Note: ‘Partner – living with you’ and ‘Partner – not living with you’ are included with ‘Other’
The majority of respondents reported that someone close to them had some kind of mental illness – 64% in 2013.The most commonly-selected answer in 2013 was a friend, with 17% of respondents selecting this. Next most common was someone in the immediate family (spouse/child/sister/ brother/parent etc.), with 15% of respondents selecting this. 7% of respondents said that they had experienced some kind of mental illness themselves.The proportion of respondents saying that someone close to them had some kind of mental illness increased from 58% in 2009 to 64% in 2013 and the

40Attitudes to Mental Illness 2013 TNS BMRB 2014
proportion reporting ‘Other’ people increased from 4% to 8% over the same period. There was a significant difference between 2012 and 2013 in the proportion reporting ‘Other’ people – increasing from 5% to 8%.
7.2 Proportion of people who might have a mental health problem
Respondents were asked what proportion of people in the UK they think might have a mental health problem at some point in their lives, and were given a list of options to choose from, ranging from 1 in 3 to 1 in 1000. Results are shown in Figure 23.Figure 23 Proportion of people who might have a mental health problem, 2003-2013
% 2003 2007 2008 2009 2010 2011 Feb
2011 Dec
2012 2013
1 in 1000 9 8 7 9 8 9 6 7 6
1 in 100 15 14 13 15 16 13 13 13 13
1 in 50 14 17 14 16 18 14 16 16 15
1 in 10 26 25 25 24 24 28 27 27 25
1 in 4 12 15 14 13 16 14 14 16 17
1 in 3 9 8 9 8 7 6 8 10 11
Don’t know 15 13 17 15 12 16 15 10 12
Base (unweighted) 1632 1729 1703 1751 1745 1741 1717 1727 1714
The largest group of respondents in all years (25% in 2013) said that the proportion of people who would have a mental health problem at some point in their lives was 1 in 10, with 35% of respondents in 2013 thinking it was less than this. In 2013, 17% thought that the proportion was 1 in 4, and 11% that it was 1 in 3. The proportion of respondents who said that they did not know was 12% in 2013.More recent trends (2008-2013)
The proportion of respondents thinking that 1 in 4 people would have a mental health problem at some point in their lives increased from 14% in 2008 to 17% in 2013. The proportion of respondents unable to give an answer (‘Don’t know’) decreased from 17% to 12% over the same period. There were no significant differences in the results between 2012 and 2013.
7.3 Consulting a GP about a mental health problem

41Attitudes to Mental Illness 2013 TNS BMRB 2014
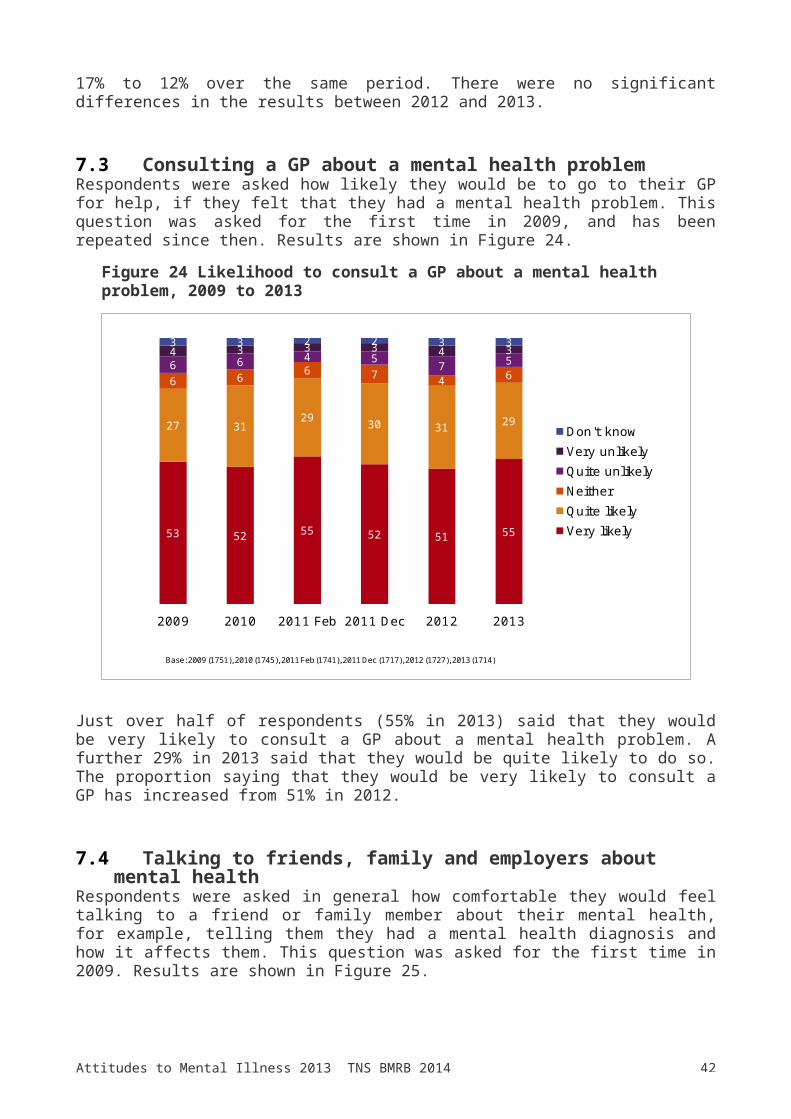
Respondents were asked how likely they would be to go to their GP for help, if they felt that they had a mental health problem. This question was asked for the first time in 2009, and has been repeated since then. Results are shown in Figure 24.
Figure 24 Likelihood to consult a GP about a mental health problem, 2009 to 2013
3.14X AXIS
6.65BASE MARGIN
5.95TOP MARGIN
4.52CHART TOP
11.90LEFT MARGIN
11.90RIGHT MARGIN
How likely to go to GP for help, 2013
53 52 55 52 51 55
27 31 29 30 31 29
6 6 6 7 4 66 6 4 5 7 54 3 3 3 4 33 3 2 2 3 3
2009 2010 2011 Feb 2011 Dec 2012 2013
Don't knowVery unlikelyQuite unlikelyNeitherQuite likelyVery likely
Base: 2009 (1751), 2010 (1745), 2011 Feb (1741), 2011 Dec (1717), 2012 (1727), 2013 (1714)
Just over half of respondents (55% in 2013) said that they would be very likely to consult a GP about a mental health problem. A further 29% in 2013 said that they would be quite likely to do so. The proportion saying that they would be very likely to consult a GP has increased from 51% in 2012.
7.4 Talking to friends, family and employers about mental health
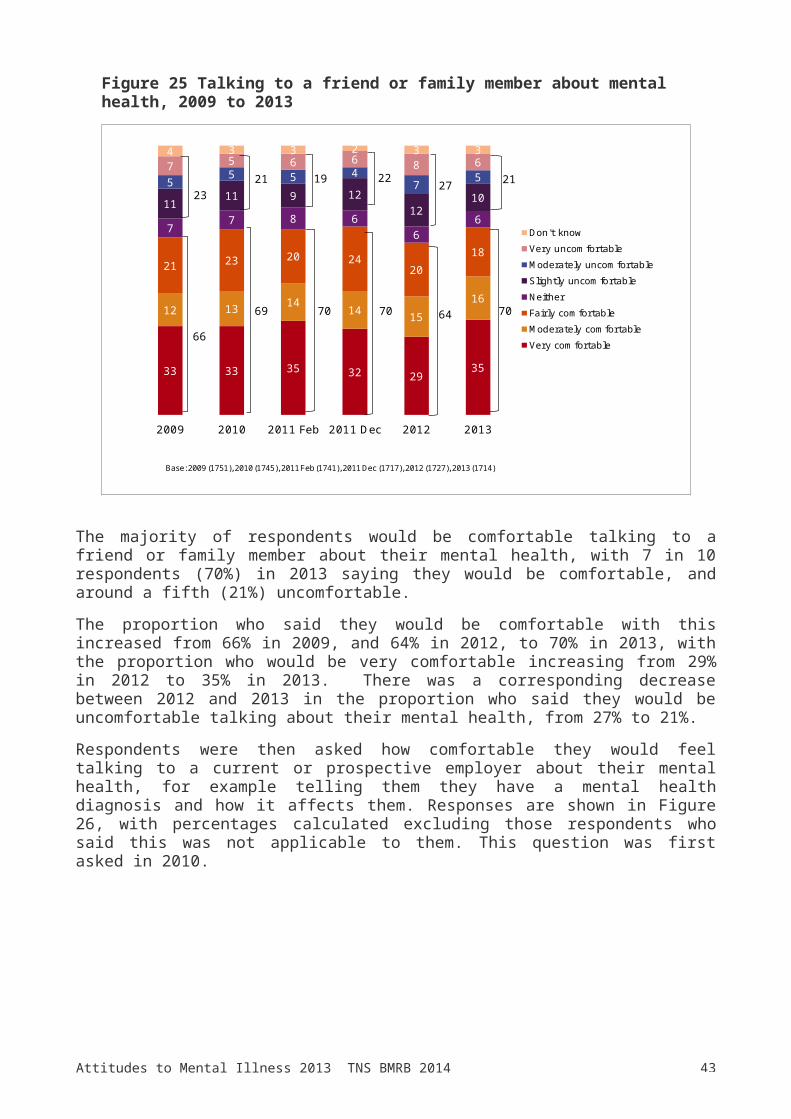
Respondents were asked in general how comfortable they would feel talking to a friend or family member about their mental health, for example, telling them they had a mental health diagnosis and how it affects them. This question was asked for the first time in 2009. Results are shown in Figure 25.
42Attitudes to Mental Illness 2013 TNS BMRB 2014
Figure 25 Talking to a friend or family member about mental health, 2009 to 2013
3.14X AXIS
6.65BASE MARGIN
5.95TOP MARGIN
4.52CHART TOP
11.90LEFT MARGIN
11.90RIGHT MARGIN
Talking to friends/ family about mental health, 2013
33 33 35 32 29 35
12 13 14 14 1516
21 23 20 2420
18
7 7 8 66
611 11 9 12
1210
5 5 5 47 5
7 5 6 6 8 64 3 3 2 3 3
2009 2010 2011 Feb 2011 Dec 2012 2013
Don't knowVery uncomfortableModerately uncomfortableSlightly uncomfortableNeitherFairly comfortableModerately comfortableVery comfortable
70
22
70
2123
66
21
69
19
70
27
64
Base: 2009 (1751), 2010 (1745), 2011 Feb (1741), 2011 Dec (1717), 2012 (1727), 2013 (1714)
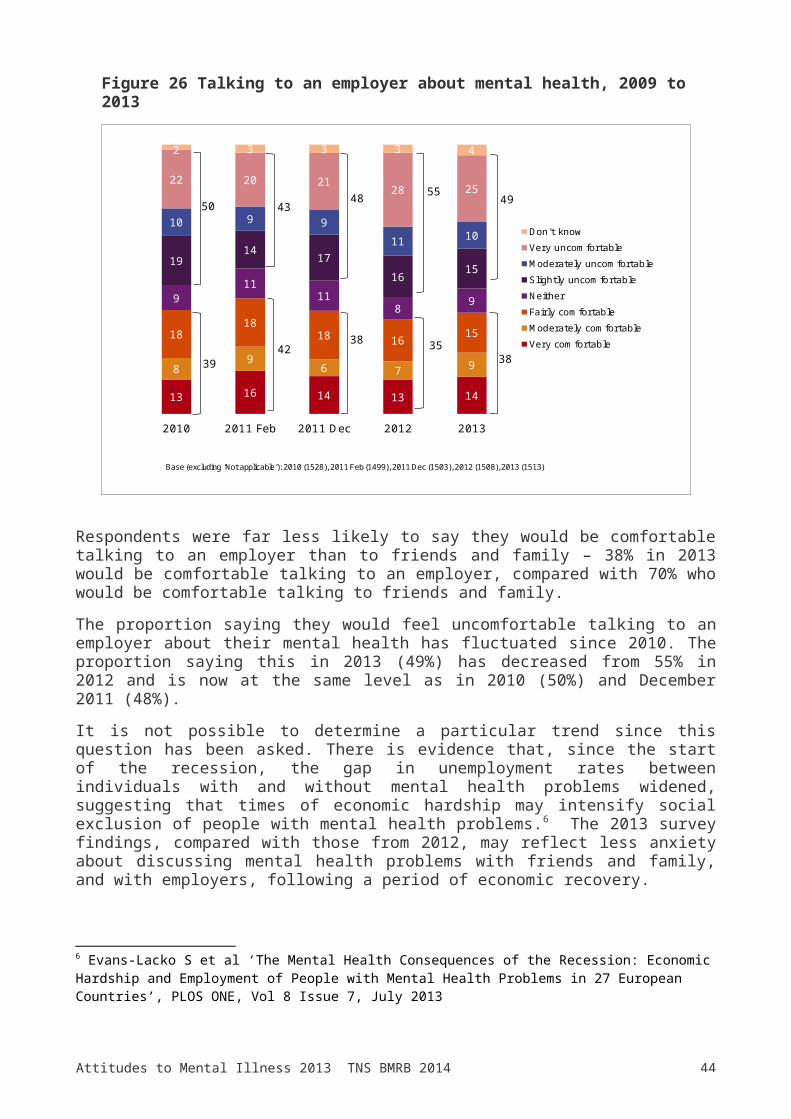
The majority of respondents would be comfortable talking to a friend or family member about their mental health, with 7 in 10 respondents (70%) in 2013 saying they would be comfortable, and around a fifth (21%) uncomfortable.The proportion who said they would be comfortable with this increased from 66% in 2009, and 64% in 2012, to 70% in 2013, with the proportion who would be very comfortable increasing from 29% in 2012 to 35% in 2013. There was a corresponding decrease between 2012 and 2013 in the proportion who said they would be uncomfortable talking about their mental health, from 27% to 21%.Respondents were then asked how comfortable they would feel talking to a current or prospective employer about their mental health, for example telling them they have a mental health diagnosis and how it affects them. Responses are shown in Figure 26, with percentages calculated excluding those respondents who said this was not applicable to them. This question was first asked in 2010.
43Attitudes to Mental Illness 2013 TNS BMRB 2014
Figure 26 Talking to an employer about mental health, 2009 to 2013
3.14X AXIS
6.65BASE MARGIN
5.95TOP MARGIN
4.52CHART TOP
11.90LEFT MARGIN
11.90RIGHT MARGIN
Talking to an employer about mental health, 2013
13 16 14 13 14
89 6 7 9
1818
18 16 15
911
118 9
1914 17
16 15
10 9 911 10
22 20 21 28 25
2 3 3 3 4
2010 2011 Feb 2011 Dec 2012 2013
Don't knowVery uncomfortableModerately uncomfortableSlightly uncomfortableNeitherFairly comfortableModerately comfortableVery comfortable
38
50
39
43
42
48
38
55
35
Base (excluding ‘Not applicable’): 2010 (1528), 2011 Feb (1499), 2011 Dec (1503), 2012 (1508), 2013 (1513)
49
Respondents were far less likely to say they would be comfortable talking to an employer than to friends and family – 38% in 2013 would be comfortable talking to an employer, compared with 70% who would be comfortable talking to friends and family.The proportion saying they would feel uncomfortable talking to an employer about their mental health has fluctuated since 2010. The proportion saying this in 2013 (49%) has decreased from 55% in 2012 and is now at the same level as in 2010 (50%) and December 2011 (48%). It is not possible to determine a particular trend since this question has been asked. There is evidence that, since the start of the recession, the gap in unemployment rates between individuals with and without mental health problems widened, suggesting that times of economic hardship may intensify social exclusion of people with mental health problems.6 The 2013 survey findings, compared with those from 2012, may reflect less anxiety about discussing mental health problems with friends and family, and with employers, following a period of economic recovery.
6 Evans-Lacko S et al ‘The Mental Health Consequences of the Recession: Economic Hardship and Employment of People with Mental Health Problems in 27 European Countries’, PLOS ONE, Vol 8 Issue 7, July 2013
44Attitudes to Mental Illness 2013 TNS BMRB 2014
8. Mental health-related stigma and campaign awareness
8.1 Mental health-related stigmaTwo new questions around stigma and discrimination were asked in 2010: whether people with mental illness experience stigma and discrimination nowadays, because of their mental health problems; and whether mental health-related stigma and discrimination has changed in the past year. These questions have been included in subsequent surveys. Responses are shown in Figures 27 and 28.
Figure 27 Whether people with mental illness experience stigma and discrimination, 2010 to 2013
3.14X AXIS
6.65BASE MARGIN
5.95TOP MARGIN
4.52CHART TOP
11.90LEFT MARGIN
11.90RIGHT MARGIN
Mental health related stigma, 2013
51 50 50 53 52
36 35 34 36 37
8 9 66 5
5 6 9 5 6
2010 2011 Feb 2011 Dec 2012 2013
Don't knowNoYes - a littleYes - a lot
89 8987 85 85
Base: 2009 (1751), 2010 (1745), 2011 Feb (1741), 2011 Dec (1717), 2012 (1727), 2013 (1714)
Overall, 89% of respondents in 2013 said that people with mental illness experience stigma and discrimination, a similar level to that reported in 2012 but an increase from 85% in February and December 2011. In 2013, around half (52%) said that they experience a lot of stigma and discrimination, and a further 37% that they experience a little.When asked whether mental health-related stigma and discrimination had changed in the past year, just under two fifths (37%) of respondents said that it

45Attitudes to Mental Illness 2013 TNS BMRB 2014
had changed, and a little over 6 in 10 (63%) that it has not changed or that they didn’t know (Figure 28). There was a significant increase between 2010 and 2013 in the proportion of respondents who said that it had changed, from 32% in 2010 to 37% in 2103, with an increase in the proportion saying that stigma and discrimination had decreased in the past year, from 17% to 22% in the same period. There was a corresponding fall in the proportion who said that mental health-related stigma and discrimination had not changed, from 48% in 2010 to 44% in 2013, driven by a significant decrease in the proportion who said that it had not changed between 2013 and 2012 (48%).There were no other significant changes in responses to this question between 2013 and 2012.
Figure 28 Whether mental health-related stigma and discrimination has changed in the past year, 2010 to 2012
3.14X AXIS
6.65BASE MARGIN
5.95TOP MARGIN
4.52CHART TOP
11.90LEFT MARGIN
11.90RIGHT MARGIN
Mental health related stigma changed, Dec 2012
15 14 13 15 15
17 17 18 20 22
48 48 50 48 44
20 20 19 17 19
2010 2011 Feb 2011 Dec 2012 2013
Don't knowNoYes - decreasedYes - increased
Base: 2009 (1751), 2010 (1745), 2011 Feb (1741), 2011 Dec (1717), 2012 (1727), 2013 (1714)
8.2 Awareness of mental health advertising
Respondents were shown still images of pictures from recent Time to Change mental health advertising campaigns, and were asked whether they had seen or heard any of this advertising, or other similar advertising, during the last year. These questions were first asked in December 2011.

46Attitudes to Mental Illness 2013 TNS BMRB 2014
Figure 29 Awareness of mental health advertising, 2011 and 2012
3.14X AXIS
6.65BASE MARGIN
5.95TOP MARGIN
4.52CHART TOP
11.90LEFT MARGIN
11.90RIGHT MARGIN
Seen or heard ads, 2013
2132
108 11 10
2011 Dec 2012 Dec 2013
Yes - seen adYes - seen similar
Base: 2011 Dec (1717), 2012 (1727), 2013 (1714)
In December 2011, 21% of respondents reported that they had seen the advertising shown and 8% had seen similar advertising. In 2012, this increased to 32% of respondents who had seen the advertising, and 11% who had seen similar. In 2013, this decreased to 10% of respondents who had seen the Time to Change advertising, and 10% who had seen similar advertising.
8.3 Awareness of mental health advertising and experience of mental illness
There was some clear correlation between awareness of mental health advertising and personal experience of mental illness. It is not possible to tell from this survey whether people who have more experience of mental illness were more likely to notice the advertising, or whether the advertising may have impacted on attitudes. Figure 30 sets out comparisons between those who had and had not seen the advertising on some of the measures discussed in this report.
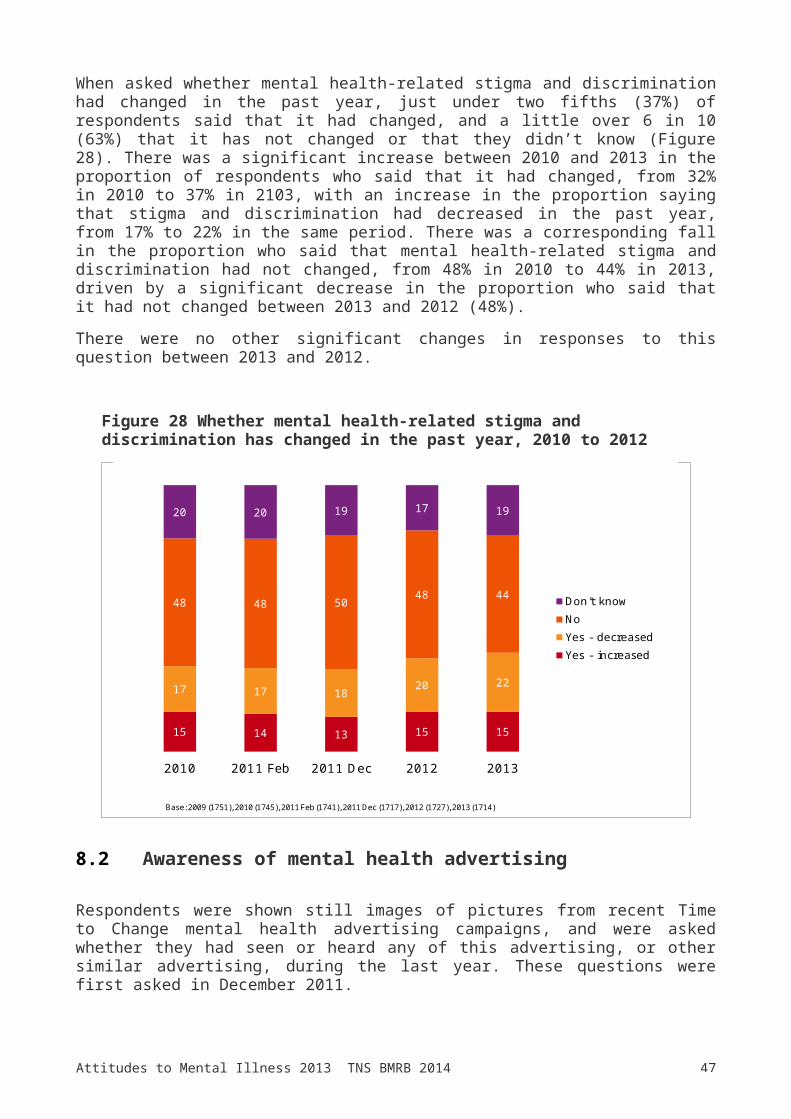
47Attitudes to Mental Illness 2013 TNS BMRB 2014
Figure 30 Awareness of mental health advertising and experience of mental illness, 2013
% agreeingSeen or heard Time to
Change or similar advertising
Not seen or heard advertising
Who is the person closest to you who has had some kind of mental illness? – Anyone mentioned
78 60
If you felt you had a mental health problem, how likely would you be to go to your GP for help? – Likely
86 84
How comfortable would you feel talking to a friend or family member about your mental health? – Comfortable
77 69
How comfortable would you feel talking to an employer about your mental health? – Comfortable
39 38
Do you think that people with mental illness experience stigma and discrimination? – Yes 96 87
Base (unweighted) 320 1380
Respondents who were aware of mental health advertising were more likely than those who had not seen or heard any advertising to say that they knew someone close to them who had some kind of mental illness. 78% of those who had seen advertising said that they knew someone with mental illness, compared with 60% of those who had not seen any advertising.There was no significant difference in likelihood to go to a GP for help if they had a mental health problem, between respondents who had and had not seen advertising. Those who had seen advertising were more likely to say they would feel comfortable talking to a friend or family member about a mental health diagnosis (77%), compared with 69% of those who had not seen advertising. There was no significant difference between those who had and those who had not seen or heard any advertising in terms of the proportion who would feel comfortable talking to an employer about their mental health. Respondents who had seen advertising were more likely than those who had not to agree that people with mental illness experience stigma and discrimination – 96% of them agreed, compared with 87% of those who had not seen advertising.

48Attitudes to Mental Illness 2013 TNS BMRB 2014
9. Appendix– Survey methodology
9.1 PopulationThe Attitudes to Mental Illness surveys have been carried out in England as part of TNS’s Omnibus survey. The Omnibus survey aims to cover adults aged 16+, living in private households. This report relates to the 2013 survey, although the methodology followed was the same for the earlier surveys.
9.2 Interview modeInterviews were carried out by face-to-face interviewing in-home, using Computer Assisted Personal Interviewing (CAPI).
9.3 Sample selection
Sample frameThe TNS Omnibus is carried out using a quota sample, with sample points selected by a random location methodology.The sample points were selected from those determined by TNS’s own sampling system. 2001 Census small area statistics and the Postcode Address File (PAF) were used to define sample points. The sample points are areas of similar population sizes formed by the combination of electoral Wards, with the constraint that each sample point must be contained within a single Government Office Region (GOR). Geographic systems were used to minimise the travelling time that would be needed by an interviewer to cover each area.TNS have defined 600 points south of the Caledonian Canal in Great Britain.
Selection of sampling points278 TNS sample points were selected south of the Caledonian Canal for use by the Omnibus, after stratification by GOR and Social Grade. Sample points were checked to ensure that they are representative by an urban and rural classification. These points were divided into two replicates, and each set of points is used in alternative weeks of Omnibus fieldwork. Sequential waves of fieldwork are issued systematically across the sampling frame to provide maximum geographical dispersion. For this survey, 139 sampling points were selected in England.
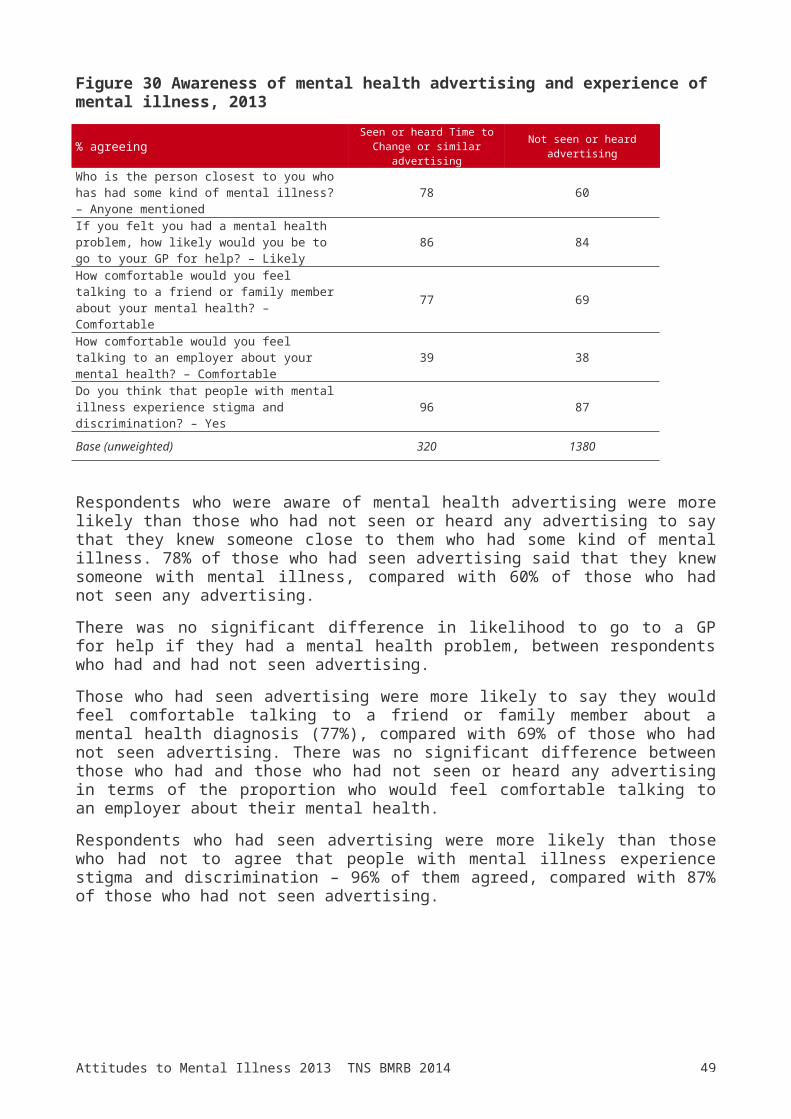
49Attitudes to Mental Illness 2013 TNS BMRB 2014
Selection of clusters within sampling pointsAll the sample points in the sampling frame have been divided into two geographically distinct segments each containing, as far as possible, equal populations. The segments comprise aggregations of complete wards. For the Omnibus, alternate A and B halves are worked each wave of fieldwork. Each week different wards are selected in the required half and Census Output Areas selected within those wards. Then, blocks containing an average of 150 addresses are sampled from PAF in the selected Output Areas, and are issued to interviewers.
Interviewing and quota controlsAssignments are conducted over two days of fieldwork and are carried out on weekdays from 2pm-8pm and at the weekend. Quotas are set by sex (male, female ‘housewife’, female non-‘housewife’, where a ‘housewife/househusband’ is the person (male or female) responsible for carrying out more than half of the weekly shopping); within female ‘housewife’, presence of children and working status, and within men, working status, to ensure a balanced sample of adults within contacted addresses. Interviewers are instructed to leave 3 doors between each successful interview.
Response ratesAs this is a quota sample it is not possible to quote response rates for achieved interviews. Approximately 13 interviews were achieved on average per sample point.
9.4 FieldworkInterviews were carried out by fully trained interviewers from TNS’s field department. Interviewing took place between December 4th and December 8th
2013 inclusive.
9.5 The questionnaireThe Attitudes to Mental Illness questionnaire was developed by the Department of Health for this series of surveys, based on previous research in Toronto, Canada and the West Midlands, UK. It included 26 items based on the 40-item Community Attitudes toward the Mentally Ill (CAMI) scale7 and the Opinions about Mental Illness scale8, and an added item on employment-related attitudes. The questions covered a wide range of issues, from attitudes towards people with mental illness, to opinions on services provided for people with mental health problems. There have been minor changes to the questionnaire over the course of the surveys, but the core has remained the same. Some new 7 Taylor SM, Dear MJ, ‘Scaling community attitudes toward the mentally ill’, Schizophr Bull 1981, 7: 225-40.8 Cohen J, Struening EL, ‘Opinions about mental illness in the personnel of two large mental hospitals’, J Abnorm Soc Psychol 1962, 64: 349-60
50Attitudes to Mental Illness 2013 TNS BMRB 2014
questions were added in 2009 and 2010 to tie in with the evaluation of the ‘Time to Change’ anti-discrimination campaign, by the Institute of Psychiatry. The 2013 questionnaire consisted of:n 27 attitude statements using a five-point Likert scale (Agree strongly/Agree
slightly/Neither agree nor disagree/Disagree slightly/Disagree strongly), covering a wide range of issues including attitudes towards people with mental illness, to opinions on services provided for people with mental health problems.
n Descriptions of people with mental illness.n Relationships with people with mental health problems.n Attitudes towards people with mental health problems.n Types of mental illness.n Personal experience of mental illness.n Proportions of people who may have a mental health problem.n Likelihood of going to a GP with a mental health problem.n Talking to friends and family about a mental health problem.n Talking to employers about a mental health problem.n Perceptions of mental health-related stigma and discrimination. n Awareness of mental health advertising.
In addition a range of demographic measures are included on the Omnibus:n Sexn Agen Social Grade, using the Market Research Society’s classification system
(AB/C1/C2/DE), based on the occupation of the Highest Income Householder (chief income earner). A description of the social grades is as follows:
n AB – professional/managerial occupationsn C1 – other non-manual occupationsn C2 – skilled manual occupationsn DE – semi-/unskilled manual occupations and people dependent on state
benefitsn Marital statusn Presence of children aged under 16 in the householdn Ethnicity of respondent (White British, White Irish, Any other white
background, Mixed white & Black Caribbean, Mixed white & Black African, Mixed white & Asian, Other mixed background, Indian, Pakistani, Bangladeshi, Other Asian background, Black Caribbean, Black African, Other Black background, Chinese, Other)
n Government Office Region (North East, North West, Yorkshire and Humberside, East Midlands, West Midlands, East of England, London, South East, South West).
A copy of the 2013 survey questionnaire is included in Section 9.
9.6 Validation, editing and imputation

51Attitudes to Mental Illness 2013 TNS BMRB 2014
As the interviews are carried out using CAPI, validation is carried out at the point of interview. The CAPI program ensures that the correct questionnaire routing is followed, and checks for valid ranges on numerical variables such as age. Range and consistency checks are then validated in the post-interview editing process.Following the fieldwork, data were converted from CAPI into the Quantum data processing package. A set of tabulations of questions by demographic variables was created. A dataset in SPSS format was exported from Quantum. The tabulations and dataset were checked against the source data by the research staff.A problem inherent in all surveys is item non-response, where respondents agree to give an interview but either do not know the answer to certain questions or refuse to answer them. In the 2013 Attitudes to Mental Illness survey, the level of item non-response was generally around 2% to 5% of respondents, but on three measures it was higher than 10%9. These ‘don’t know’ responses have been counted as valid responses in the data analysis, so that the base for analysis for each question is the whole sample who were asked the question, not those who gave a substantive response. There has been no attempt made to impute missing data.
9.7 Weighting
9 To what extent do you agree or disagree with the statement: There are sufficient existing services for people with mental illness (16%); Mental hospitals are an outdated means of treating people with mental illness (11%); People with severe mental health problems can fully recover (11%); and What proportion of people in the UK do you think might have a mental health problem at some point in their lives? (12%)
52Attitudes to Mental Illness 2013 TNS BMRB 2014
Data were weighted to match the population profile by region. The weighting matrix used is shown in Figure 31.Figure 31 Weighting matrix - weights, 2013
Total North Midlands South
Total 1.00 1.01 0.97 1.02 Men ABC1 : 16-24 1.04 1.82 1.41 0.73 Men ABC1 : 25-44 1.49 1.11 1.74 1.63 Men ABC1 : 45-64 1.07 1.05 1.03 1.11 Men ABC1 : 65+ 0.55 0.49 0.54 0.60 Men C2 : 16-24 0.91 1.09 1.01 0.74 Men C2 : 25-44 1.56 2.03 2.15 1.12 Men C2 : 45-64 1.36 1.34 1.27 1.49 Men C2 : 65+ 0.78 0.67 0.77 0.89 Men DE : 16-24 1.35 3.09 0.84 1.08 Men DE : 25-44 1.24 1.49 0.76 1.73 Men DE : 45-64 0.95 1.22 1.03 0.75 Men DE : 65+ 0.55 0.55 0.67 0.46 Female ABC1 : 16-24 1.34 1.18 1.96 1.16 Female ABC1 : 25-44 1.26 0.87 1.28 1.60 Female ABC1 : 45-64 1.02 0.99 0.86 1.18 Female ABC1 : 65+ 0.84 0.58 0.65 1.22 Female C2 : 16-24 1.01 1.24 0.93 0.96 Female C2 : 25-44 0.98 1.23 0.79 1.00 Female C2 : 45-64 1.13 1.05 1.22 1.17 Female C2 : 65+ 0.57 0.49 0.53 0.67 Female DE : 16-24 1.04 1.45 1.29 0.69 Female DE : 25-44 0.79 0.95 0.78 0.68 Female DE : 45-64 0.85 1.50 0.77 0.67 Female DE : 65+ 0.84 0.84 0.72 0.99
53Attitudes to Mental Illness 2013 TNS BMRB 2014
The profile of the samples before and after application of the weighting is shown in Figure 32.Figure 32 Weighted and unweighted sample profiles, 2013
Weighted Unweighted
N % N % Sex Men 844 49 821 48 Women 874 51 893 52Age16-24 248 14 221 1325-34 311 18 257 1535-44 312 18 257 1545-54 284 17 273 1655+ 565 33 706 41Social GradeAB 368 21 353 21C1 501 29 457 27C2 352 20 333 19DE 498 29 571 33Working statusFull time 686 40 573 33Part time (8-29 hrs) 226 13 211 12Part time (under 8 hrs) 10 1 10 1Retired 390 23 531 31RegionNorth East 75 4 76 4North West 236 14 240 14Yorkshire & Humber 181 11 169 10East Midlands 138 8 140 8West Midlands 182 11 189 11East of England 195 11 202 12London 250 15 247 14South East 294 17 287 17South West 168 10 164 10Total 1718 100 1714 100
9.8 Reliability of estimatesAll survey estimates have a sampling error attached to them, calculated from the variability of the observations in the sample. From this, a margin of error (confidence interval) is derived. It is this confidence interval, rather than the estimate itself, that is used to make statements about the likely ‘true’ value in the population; specifically, to state the probability that the true value will be found between the upper and lower limits of the confidence interval. In general, a confidence interval of twice the standard error is used to state, with
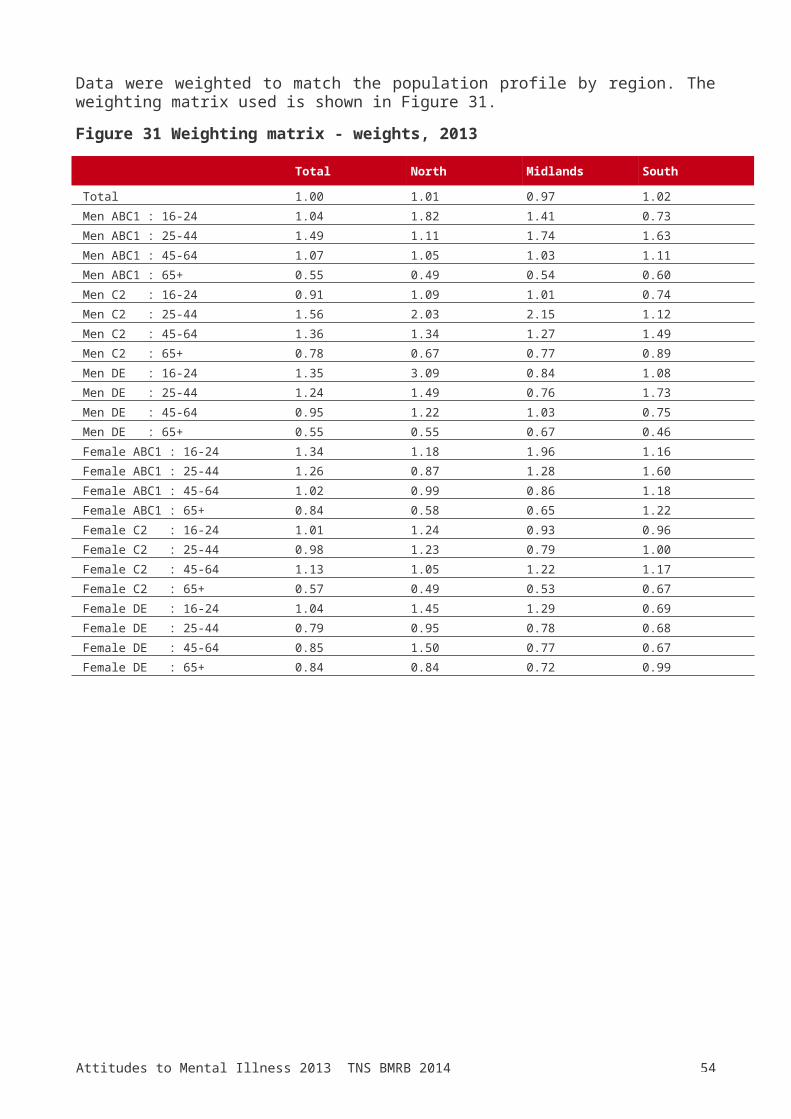
54Attitudes to Mental Illness 2013 TNS BMRB 2014
95 per cent confidence, that the true value falls within that interval. A small margin of error will result in a narrow interval, and hence a more precise estimate of where the true value lies.
The technical calculation of sampling errors (and thus confidence intervals) is based on an assumption of a simple random sampling method. This survey did not use a simple random sample, however it is common practice in such surveys to use the formulae applicable to simple random samples to estimate confidence intervals.In addition to sampling errors, consideration should also be given to non-sampling errors. Sampling errors generally arise through the process of sampling and the influence of chance. Non-sampling errors arise from the introduction of some systematic bias in the sample as compared to the population it is supposed to represent. Perhaps the most important of these is non-response bias.As this survey used a quota sample there is no measure available of the level of unit non-response to the survey. However, comparison of the achieved sample with the population profile (see Figure 32 above) indicates that the achieved sample contained fewer full-time workers, and more aged 55+ and from social grades DE, than would be expected if it were fully representative of the population. These discrepancies have been corrected by weighting, to remove this potential source of bias from survey estimates. There are many other potential sources of error in surveys, including misleading questions, data input errors or data handling problems. There is no simple control or measurement for such non-sampling errors, although the risk can be minimised through careful application of the appropriate survey techniques from questionnaire and sample design through to analysis of results.
9.9 Statistical disclosure controlRespondents were assured that any information they provided would be confidential and that personal details would not be disclosed at an identifiable level. Respondents’ contact details were collected for quality control purposes but this information was detached from the survey responses and the records anonymised during the processing stage. Data are published in aggregated tabulations only so as to minimise the risk that a combination of responses will lead to a respondent being identifiable. Data processing was carried out in accordance with the Data Protection Act and the Market Research Society Code of Conduct.
9.10 Statistical significanceWhere findings are reported as ‘significant’ in this report this always means that the findings are statistically significant at the 95% confidence level or
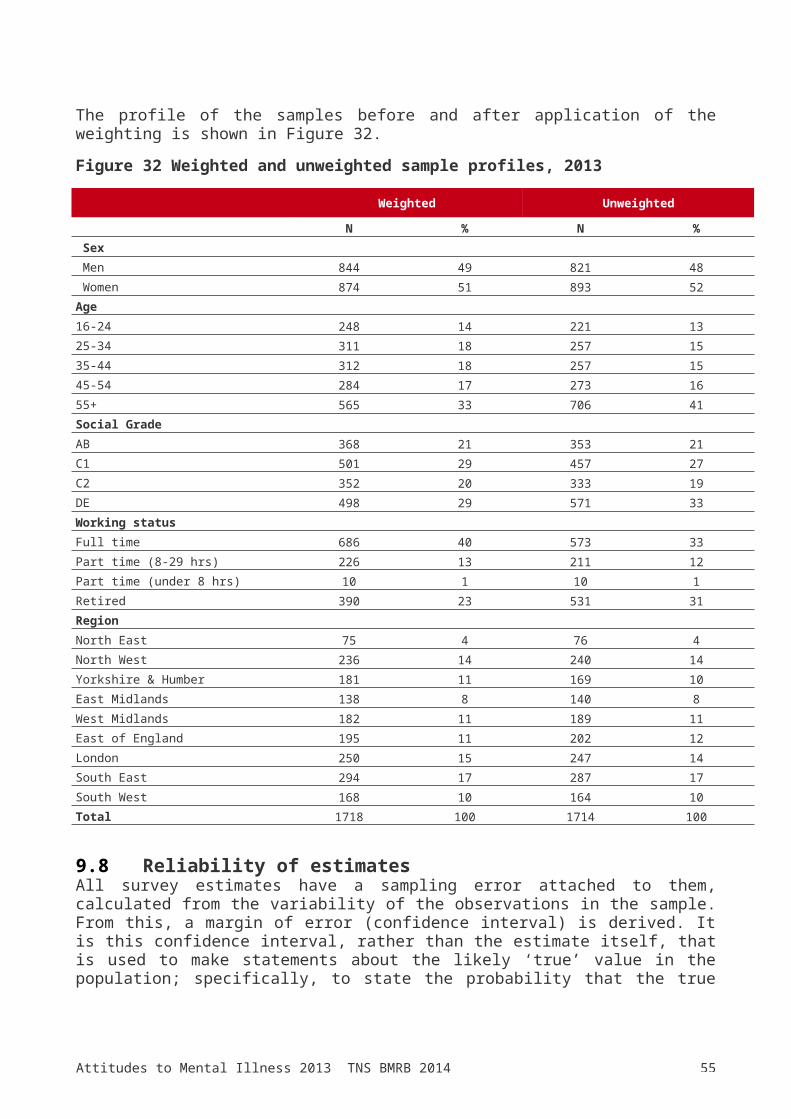
55Attitudes to Mental Illness 2013 TNS BMRB 2014
higher. If a finding is statistically significant we can be 95% confident that differences reported are real rather than occurring just by chance. Significance of differences has been tested using the two-tailed t-test for independent samples.
9.11 Sample numbers, 1994-2013Figure 33 shows the sample sizes for all surveys in this series since 1994.Figure 33 Sample numbers, 1994-2013
Sample size (unweighted)
Survey n1994 16821995 15541996 50711997 49002000 17072003 16322007 17292008 17032009 17512010 17452011 Feb 17412011 Dec 17172012 17272013 1714
56Attitudes to Mental Illness 2013 TNS BMRB 2014
10. Appendix – Questionnaire
SHOW SCREEN
Q.1 We have been asked by the Department of Health to find out people’s opinions on mental illness. I am going to read out some opinions which other people hold about mental illness and would like you to tell me how much you agree or disagree with each one...
(Order of statements rotated)
...One of the main causes of mental illness is a lack of self-discipline and will-power...There is something about people with mental illness that makes it easy to tell them from normal people...As soon as a person shows signs of mental disturbance, he should be hospitalized...Mental illness is an illness like any other...Less emphasis should be placed on protecting the public from people with mental illness...Mental hospitals are an outdated means of treating people with mental illness...Virtually anyone can become mentally ill...People with mental illness have for too long been the subject of ridicule...We need to adopt a far more tolerant attitude toward people with mental illness in our society...We have a responsibility to provide the best possible care for people with mental illness...People with mental illness don't deserve our sympathy...People with mental illness are a burden on society...Increased spending on mental health services is a waste of money...There are sufficient existing services for people with mental illness...People with mental illness should not be given any responsibility...A woman would be foolish to marry a man who has suffered from mental illness, even though he seems fully recovered...I would not want to live next door to someone who has been mentally ill...Anyone with a history of mental problems should be excluded from taking public office...No-one has the right to exclude people with mental illness from their neighbourhood...People with mental illness are far less of a danger than most people suppose...Most women who were once patients in a mental hospital can be trusted as babysitters
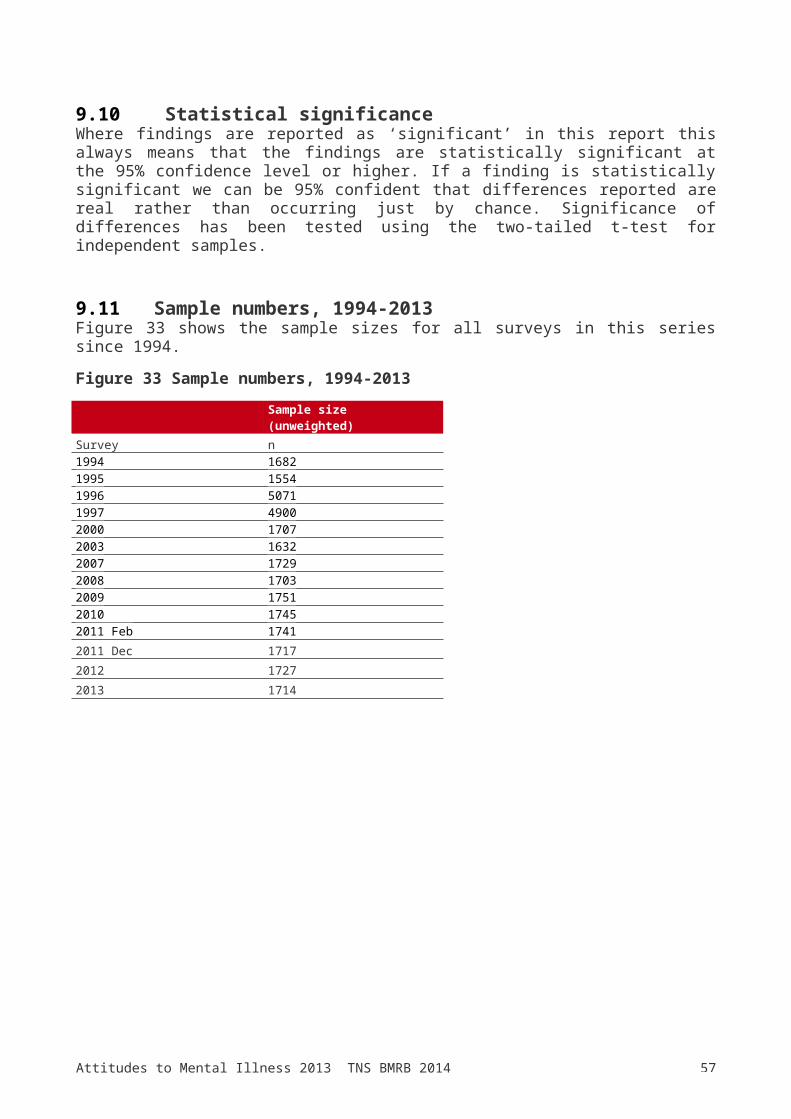
57Attitudes to Mental Illness 2013 TNS BMRB 2014
...The best therapy for many people with mental illness is to be part of a normal community...As far as possible, mental health services should be provided through community based facilities...Residents have nothing to fear from people coming into their neighbourhood to obtain mental health services...It is frightening to think of people with mental problems living in residential neighbourhoods...Locating mental health facilities in a residential area downgrades the neighbourhood...People with mental health problems should have the same rights to a job as anyone else
01: Agree strongly02: Agree slightly03: Neither agree nor disagree04: Disagree slightly05: Disagree strongly(DK)
SHOW SCREEN - MULTI CHOICE
Q.2 And which of these do you feel usually describes a person who is mentally ill?
01: Someone who has serious bouts of depression03: Someone who is incapable of making simple decisions about his or her own life05: Someone who has a split personality06: Someone who is born with some abnormality affecting the way the brain works07: Someone who cannot be held responsible for his or her own actions09: Someone prone to violence10: Someone who is suffering from schizophrenia11: Someone who has to be kept in a psychiatric or mental hospital12: Other (specify)None\dk
SHOW SCREEN
The following questions ask about your experiences and views in relation to people who have mental health problems. By this I mean people who have been seen by healthcare staff for a mental health problem.
Q.3 Are you currently living with, or have you ever lived with, someone with a mental health problem?
01: Yes02: No(DK)
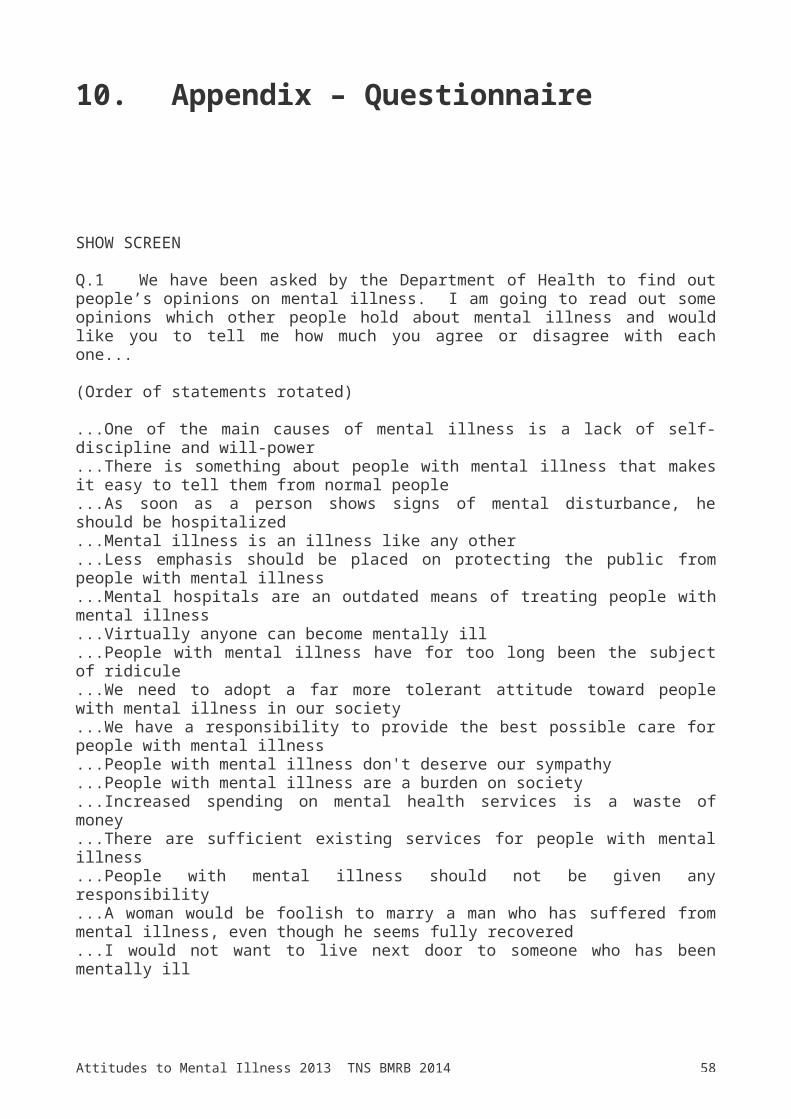
58Attitudes to Mental Illness 2013 TNS BMRB 2014
(R)
Q.4 Are you currently working, or have you ever worked, with someone with a mental health problem?01: Yes02: No(DK)(R)
Q.5 Do you currently, or have you ever, had a neighbour with a mental health problem?01: Yes02: No(DK) (R)
Q.6 Do you currently have, or have you ever had, a close friend with a mental health problem?01: Yes02: No(DK) (R)
Q.7 The following statements ask about any future relationships you may experience with people with mental health problems. Please tell me how much you agree or disagree with each one, taking your answer from the screen. SHOW SCREEN
(Order of statements rotated)
…In the future, I would be willing to live with someone with a mental health problem…In the future, I would be willing to work with someone with a mental health problem…In the future, I would be willing to live nearby to someone with a mental health problem…In the future, I would be willing to continue a relationship with a friend who developed a mental health problem
(Answer categories inverted on alternate interviews)
01: Agree strongly 02: Agree slightly 03: Neither agree nor disagree 04: Disagree slightly 05: Disagree strongly
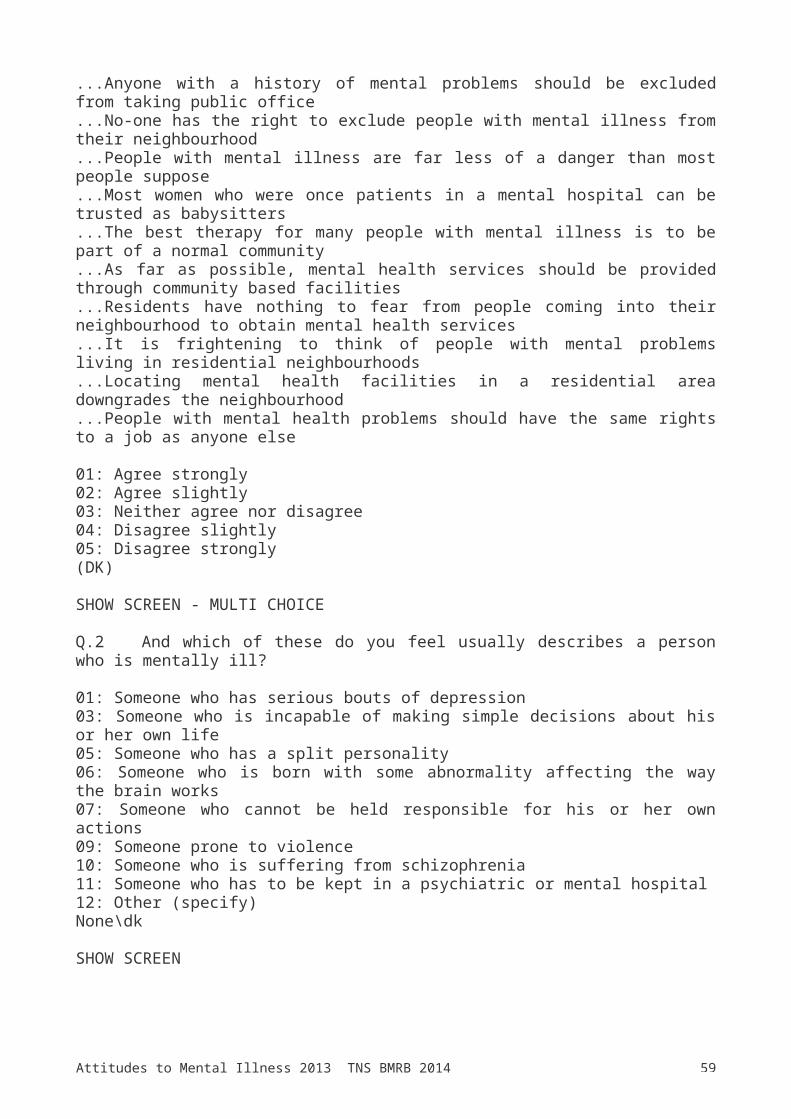
59Attitudes to Mental Illness 2013 TNS BMRB 2014
(DK) Q.8 I am now going to read out some more statements about mental health problems, again that is conditions for which an individual would be seen by healthcare staff. Please tell me how much you agree or disagree with each one.
SHOW SCREEN
(Order of statements rotated)
…Most people with mental health problems want to have paid employment…If a friend had a mental health problem, I know what advice to give them to get professional help …Medication can be an effective treatment for people with mental health problems…Psychotherapy (e.g., talking therapy or counselling) can be an effective treatment for people with mental health problems…People with severe mental health problems can fully recover…Most people with mental health problems go to a healthcare professional to get help
(Answer categories inverted on alternate interviews)01: Agree strongly 02: Agree slightly 03: Neither agree nor disagree 04: Disagree slightly 05: Disagree strongly (DK)
60Attitudes to Mental Illness 2013 TNS BMRB 2014
Q.9 Please say to what extent you agree or disagree that each of the following conditions is a type of mental illness…
SHOW SCREEN
(Order of items rotated)
…Depression…Stress …Schizophrenia…Bipolar disorder (manic-depression)…Drug addiction…Grief
(Answer categories inverted on alternate interviews)
01: Agree strongly 02: Agree slightly 03: Neither agree nor disagree 04: Disagree slightly 05: Disagree strongly (DK)
SHOW SCREENQ.10 Who is the person closest to you who has or has had some kind of mental illness ?
Please take your answer from this screen.
(Answer categories inverted on alternate interviews, ‘Other’ / ‘No-one’ fixed at bottom of list)
01: Immediate family (spouse\child\sister\brother\parent etc)02: Partner (living with you)03: Partner (not living with you)04: Other family (uncle\aunt\cousin\grand parent etc)05: Friend06: Acquaintance07: Work colleague08: Self09: Other (please specify)10: No-one known(R)
61Attitudes to Mental Illness 2013 TNS BMRB 2014
SHOW SCREEN
Q.11 What proportion of people in the UK do you think might have a mental health problem at some point in their lives?
01: 1 in 100002: 1 in 10003: 1 in 5004: 1 in 1005: 1 in 4 06: 1 in 3(DK)
SHOW SCREEN
Q.12 If you felt that you had a mental health problem, how likely would you be to go to your GP for help?
(Answer categories inverted on alternate interviews)
01: Very likely02: Quite likely03: Neither likely nor unlikely04: Quite unlikely05: Very unlikely(DK)
SHOW SCREEN
Q.13 In general, how comfortable would you feel talking to a friend or family member about your mental health, for example telling them you have a mental health diagnosis and how it affects you? (Answer categories inverted on alternate interviews) 01: Very uncomfortable02: Moderately uncomfortable03: Slightly uncomfortable04: Neither comfortable nor uncomfortable05: Fairly comfortable06: Moderately comfortable07: Very comfortable(DK)

62Attitudes to Mental Illness 2013 TNS BMRB 2014
SHOW SCREEN
Q.14 In general, how comfortable would you feel talking to a current or prospective employer about your mental health, for example telling them you have a mental health diagnosis and how it affects you?
(Answer categories inverted on alternate interviews) 01: Very uncomfortable02: Moderately uncomfortable03: Slightly uncomfortable04: Neither comfortable nor uncomfortable05: Fairly comfortable06: Moderately comfortable07: Very comfortable(Not applicable)(DK)
SHOW SCREEN
Q.15 Do you think that people with mental illness experience stigma and discrimination nowadays, because of their mental health problems?
(Answer categories inverted on alternate interviews)01: Yes- a lot of stigma and discrimination02: Yes- a little stigma and discrimination03: No(DK)
SHOW SCREEN
Q.16 Do you think mental health-related stigma and discrimination has changed in the past year?
(Answer categories inverted on alternate interviews)01: Yes - increased02: Yes – decreased03: No(DK)
Q.17 Now please look the pictures on the next couple of screens. These are pictures from different adverts that have appeared on television, radio, magazines or on the web.SHOW SCREEN
63Attitudes to Mental Illness 2013 TNS BMRB 2014
INTERVIEWER: PLEASE ALLOW THE RESPONDENT PLENTY OF TIME TO LOOK AT EACH PICTURE BEFORE CLICKING TO THE NEXT SCREEN
64Attitudes to Mental Illness 2013 TNS BMRB 2014
SHOW SCREENDo you think you have seen or heard any of this advertising, or similar during the last year?(Answer categories inverted on alternate interviews)
01: Yes - seen or heard some of these ads02: Yes - seen or heard similar ads03: No - Not seen(DK)
SHOW SCREENIF ‘Yes – seen or heard some of these ads’ OR ‘Yes – seen or heard similar ads’ AT Q.17
Q.18 How many times, before this interview, have you seen or heard ANY of the advertising in the pictures?
INTERVIEWER ADD IF NECESSARY: Please answer as best you can even if it is just an estimate.01: Once or twice02: Three to five times03: Six times or more (DK)