Embed Size (px)
Citation preview

Special Eurobarometer
Attitudes towards Energy
Fieldwork October - November 2005
Publication January 2006
Spe
cial
Eur
obar
omet
er 2
47 /
Wav
e 64
.2 -
TNS
Opi
nion
& S
ocia
l
This survey was requested and coordinated by the European Commission This document does not represent the point of view of the European Commission. The interpretations and opinions contained in it are solely those of the authors.
European Commission

Special EUROBAROMETER “Attitudes towards Energy”
- 1 -
Table of contents
PRESENTATION.............................................................................................2
1. THE ROLE OF PUBLIC INSTITUTIONS........................................................4
1.1 The level of decision-making .................................................................4 1.2 Priorities of National Governments.......................................................7 1.3 Priorities to reduce energy consumption .............................................10
2. THE ROLE OF CONSUMERS ......................................................................14
2.1 Citizens’ behaviour: a consumer perspective..........................................14 2.2 Consumers facing energy challenges: the use of renewable energy...........18 2.3 Consumers facing energy challenges: reduction of energy consumption.....24
3. CAR USAGE: A PRACTICAL EXAMPLE OF THE CHALLENGES FOR ENERGY POLICY .......................................................................................................27
3.1 Citizens’ attitude vs. rise in fuel prices ..................................................27
CONCLUSION ..............................................................................................32 ANNEXES Technical note Questionnaire Data tables
Special EUROBAROMETER “Attitudes towards Energy”
- 2 -
PRESENTATION After the oil crisis of 1973 and 1979, energy policy could count on regular supplies and relatively stable prices. The situation has recently become extremely different with a much tighter energy market and significantly higher and more volatile prices. The Energy Commissioner Andris Piebalgs recently declared1 that “under our business as usual scenario, almost 70% of the Energy the European Union uses will be imported by 2030. Energy demand will rise by 1% to 2% per year and the share of fossil fuels in our energy supply could rise to almost 90% substantially increasing greenhouse emissions”. The European Commission aims to respond to these challenges by following some essential steps:
1) Tackling rising energy demand by making energy efficiency a central plank of the Commission’s economic and sustainable development policies
2) Increasing the share of renewable energy in the energy mix 3) Making Europe’s energy supply more sustainable by limiting the rise in the EU’s
dependence on import
4) Making the use of fossil fuels more clean and efficient In this context the role of consumers is essential. On the 18th of July 2005, the European Commission launched a four-year campaign to raise public awareness on sustainable energy. This action was set to contribute to meeting EU energy policy aimed at facing new challenges most notably those which were outlined in the 2005 Green Paper on Energy Efficiency. With this in mind, the European Commission launched this Eurobarometer survey (EB64) on Energy in the 25 Member States as well as the acceding and candidate countries2 on a sample of 29.430 interviewees. This survey deals with the following themes:
• The most appropriate level to make decisions in order to respond to the new energy challenges
• Public authorities and Government priorities in order to reduce energy consumption and limit the rise of the European Union’s dependency on imported energy sources;
• Energy consumption habits and willingness to change them; This report presents the main results obtained. For each of these themes, the results are analysed in terms of the European average and then assessed at the country level.
1 Speech given in the 16th meeting of the Energy Charter Conference, Brussels, 9 December 2005: “The external dimension of the European Union’s Energy Policy” 2Cyprus as a whole is one of the 25 European Union Member States. However, the « acquis communautaire » is suspended in the part of the country that is not controlled by the government of the Republic of Cyprus. For practical reasons, only the interviews conducted in the part of the country controlled by the government of the Republic of Cyprus are recorded in the category « CY » and included in the EU25 average. If results of the sample in the non-controlled areas are displayed, these are abbreviated as « CY(tcc) » (Turkish Cypriot community).
Special EUROBAROMETER “Attitudes towards Energy”
- 3 -
Also, some brief comments are made on the socio-demographic variables of citizens of the European Union.3 Since the launching of this survey, some more recent events have once again triggered the debate on the security of supply. The results of this survey come in good time, particularly in view of the Green paper on “A secure, competitive and sustainable Energy Policy for Europe” to be published by European Commission in March, 2006. The fieldwork was conducted between the 11th of October and the 15th of November 2005 in the 25 Member States as well as the acceding and candidate countries. Further details of the methodology of the survey can be found in the technical note in the annex of this report.
3 In some cases, due to the rounding of figures, displayed sums can show a difference of one point with the sum of the individual cells.

Special EUROBAROMETER “Attitudes towards Energy”
- 4 -
QA67. In order to respond to the new energy challenges that we have to face for the years to
come, what is, according to you, the most appropriate level to take decisions?
47% 37% 8% 7%
0% 50% 100%
EU25
The European level The national level The local level Don't Know
1. THE ROLE OF PUBLIC INSTITUTIONS The first chapter deals with European citizens’ general opinion on the most appropriate decisional level to respond to the new energy challenges Europe. The measures and priorities public authorities should adopt in order to reduce energy consumption and the rise in Europe’s dependency on imported energy resources are examined as well. 1.1 The level of decision-making Source questionnaire: QA67 When facing the current challenges of the energy sector - such as increasing level of energy consumption, the climate change, secured energy supply and growing energy dependency - fast and effective decisions have to be taken.
- Clear support for decisions on energy to be taken at the European level –
A majority of EU citizens believes that Europe is the best level for determining energy challenges. Almost half of the respondents (47%) are of this view. Notwithstanding, also the national decision making is seen as important as 37% of Europeans consider it to be the most appropriate level to make decisions on energy related issues.
European citizens do not prioritise the role of local authorities in energy policy, as only 8% consider it to be at an appropriate level of decision making. It is probable that citizens are not aware of the importance of the local level in the promotion of energy efficiency and renewable energies.

Special EUROBAROMETER “Attitudes towards Energy”
- 5 -
QA67. In order to respond to the new energy challenges that we have to face for the years to come, what is, according to you, the most appropriate level to take
decisions?
47%
62%
61%
59%
59%
58%
53%
51%
51%
50%
50%
50%
48%
48%
45%
45%
45%
42%
38%
38%
38%
36%
34%
29%
27%
23%
49%
39%
39%
32%
26%
37%
22%
31%
29%
36%
31%
26%
36%
30%
36%
37%
36%
43%
39%
46%
36%
37%
30%
37%
40%
49%
43%
47%
44%
55%
57%
40%
31%
8%
7%
6%
6%
3%
9%
6%
6%
10%
7%
10%
4%
6%
6%
8%
7%
16%
13%
12%
10%
16%
16%
10%
10%
19%
11%
12%
10%
16%
9%
7%
9%
1%
7%
2%
2%
14%
4%
12%
5%
5%
3%
4%
7%
3%
11%
11%
12%
13%
3%
4%
3%
17%
8%
2%
12%
9%
20%
17%
15%
28%
35%
50%
9%
10%
EU25
CY
EL
IT
NL
BE
ES
DE
PT
FR
LV
LU
CZ
SI
DK
LT
AT
HU
IE
PL
SK
MT
SE
EE
UK
FI
CY (tcc)
HR
RO
TR
BG
The European level The national level The local level Don't know
At the country level, a majority of respondents in 17 countries out of the 25 Member States considers the European level as the best for undertakings of energy issues. The greatest support for a European energy policy is found in Cyprus (62%), Greece (61%), the Netherlands (59%) and Italy (59%) whereas the fewest citizens appreciating common effort at the European level are reside in Finland (23%), the United Kingdom (27%) and Estonia (29%). Support for a European energy policy appears to be lower in the acceding and candidate countries. In the Turkish Cypriot Community the European level is assessed as being the best forum to make decisions on energy related issues (49%).

Special EUROBAROMETER “Attitudes towards Energy”
- 6 -
The European level The national level The local level Don't knowEU25 47% 37% 8% 7%SexMale 51% 36% 8% 6%Female 43% 39% 9% 8%Age15-24 52% 34% 8% 6%25-39 52% 35% 8% 5%40-54 49% 37% 9% 6%55 + 40% 41% 9% 10%Education (End of)15 37% 41% 10% 11%16-19 47% 38% 9% 6%20+ 55% 34% 7% 3%Still Studying 54% 33% 6% 6%Household composition1 44% 38% 9% 9%2 46% 38% 9% 8%3 48% 39% 8% 6%4+ 50% 36% 8% 6%Left-Right scale(1-4) Left 53% 34% 8% 4%(5-6) Centre 47% 39% 9% 5%(7-10) Right 46% 41% 8% 4%Respondent occupation scaleSelf- employed 52% 35% 9% 4%Managers 56% 36% 5% 3%Other white collars 54% 35% 7% 4%Manual workers 47% 37% 9% 7%House persons 41% 37% 10% 12%Unemployed 46% 37% 11% 6%Retired 38% 42% 10% 10%Students 54% 33% 6% 6%Subjective urbanisationRural village 44% 39% 9% 8%Small/ mid size town 49% 36% 8% 7%Large town 48% 38% 8% 6%Leadership++ 54% 35% 8% 3%+ 51% 38% 7% 4%- 47% 38% 9% 6%-- 37% 37% 10% 15%Trust in EUTend to agree 59% 29% 7% 5%Tend to disagree 38% 46% 10% 6%Membership EUA good thing 60% 29% 7% 4%A bad thing 25% 54% 13% 8%Neither good nor bad 40% 44% 9% 8%Benef. EU member.Benefited 58% 30% 7% 5%Not benefited 35% 49% 11% 6%Image of EUPositive 62% 28% 6% 5%Neutral 41% 42% 9% 8%Negative 28% 52% 13% 7%
QA67 In order to respond to the new energy challenges that we have to face for the years to come, what is, according to you, the most appropriate level to take decisions?
When it comes to socio-demographic variables, some clear tendencies can be depicted. Men (51%) are more likely than women (43%) to support decision making at the European level. This is the case also for those aged 15-39 years (52%), for those who have studied at least until they are 20 years old (55%), and for the left sympathisers (53%). Not surprisingly, support for a common European energy policy prevails amongst those who in general perceive the European Union in a positive light. This is particularly the case for the respondents who evaluate the EU membership to be a good thing for their country (60%) and for those who see the image of the European Union to be positive (62%).
Overall, strong support appears to exist for the many initiatives the EU has launched over recent years in order to tackle the ever challenging issues in the energy field.

Special EUROBAROMETER “Attitudes towards Energy”
- 7 -
QA65.To reduce our dependency on imported energy resources, Governments have to choose from a list of alternatives, sometimes costly solutions. Which of the
following should the (NATIONALITY) Government mainly focus on the years to come? (MAX. 2 ANSWERS)
12%
23%
31%
41%
48%
0% 10% 20% 30% 40% 50% 60%
Develop the use of nuclearenergy
Regulate in order to reduce ourdependence of oil
Develop the use of wind power
Promote advanced research fornew energy technologies
(hydrogen, clean coal, etc.)
Develop the use of solar power
EU25
1.2 Priorities of National Governments Source questionnaire: QA65 When implementing energy policies, the national authorities play a leading role. They can favour several alternatives: promoting energy efficiency and renewable energies, developing new technologies, using nuclear energy etc.
- Clear support for enhancing the use of renewable energies -
When asked what the National Governments should focus on in order to reduce the current energy dependency, improvement of the use of renewable energies and investments in research and technology development are seen as the main means to tackle the problem.
Special EUROBAROMETER “Attitudes towards Energy”
- 8 -
Promote advanced
research for new energy technologies (hydrogen, clean coal,
etc.)
Regulate in order to
reduce our dependence
of oil
Develop the use of nuclear
energy
Develop the use of solar
power
Develop the use of wind
power
None of these (SPONTANEO
US)
Other (SPONTANEO
US)DK
EU25 41% 23% 12% 48% 31% 1% 1% 8%
NL 62% 10% 14% 47% 42% 0% 1% 3%
DK 61% 13% 4% 45% 59% 0% 0% 4%
SE 55% 25% 32% 31% 41% 0% 1% 2%
FI 54% 18% 27% 38% 41% 0% 3% 1%
DE 52% 21% 17% 55% 26% 1% 1% 4%
BE 46% 20% 11% 51% 49% 1% 1% 2%
CZ 46% 35% 17% 41% 25% 2% 0% 5%
LU 46% 18% 7% 62% 36% 1% 1% 4%
FR 43% 21% 8% 63% 38% 1% 1% 4%
SI 42% 29% 5% 60% 39% 1% 1% 5%
SK 42% 39% 19% 44% 23% 1% 0% 5%
IT 41% 26% 13% 41% 15% 0% 2% 10%
IE 40% 29% 7% 32% 52% 0% 1% 10%
PT 39% 31% 5% 37% 34% 1% 0% 13%
EE 37% 14% 8% 35% 54% 1% 2% 15%
HU 37% 16% 9% 43% 37% 2% 0% 11%
LV 36% 37% 8% 25% 39% 2% 1% 7%
AT 36% 36% 5% 54% 35% 2% 1% 5%
UK 36% 17% 18% 43% 39% 1% 0% 10%
PL 33% 27% 10% 37% 30% 2% 1% 13%
LT 32% 27% 21% 16% 22% 3% 0% 19%
ES 27% 25% 4% 50% 28% 1% - 18%
CY 25% 51% 2% 76% 22% 0% 0% 6%
MT 23% 34% 2% 58% 32% 0% 1% 9%
EL 22% 37% 2% 70% 44% 1% 0% 3%
CY (tcc) 52% 10% 10% 50% 11% 2% 1% 13%
RO 42% 28% 15% 29% 18% 1% 1% 22%
BG 37% 20% 24% 38% 16% 1% 1% 20%
HR 36% 17% 5% 60% 40% 1% 0% 8%
TR 31% 33% 15% 27% 9% 1% 0% 26%
QA65 To reduce our dependency on imported energy resources, Governments have to choose from a list of alternatives, sometimes costly solutions. Which of the following should the (NATIONALITY) Government mainly focus on for the years to come? (MAX. 2 ANSWE
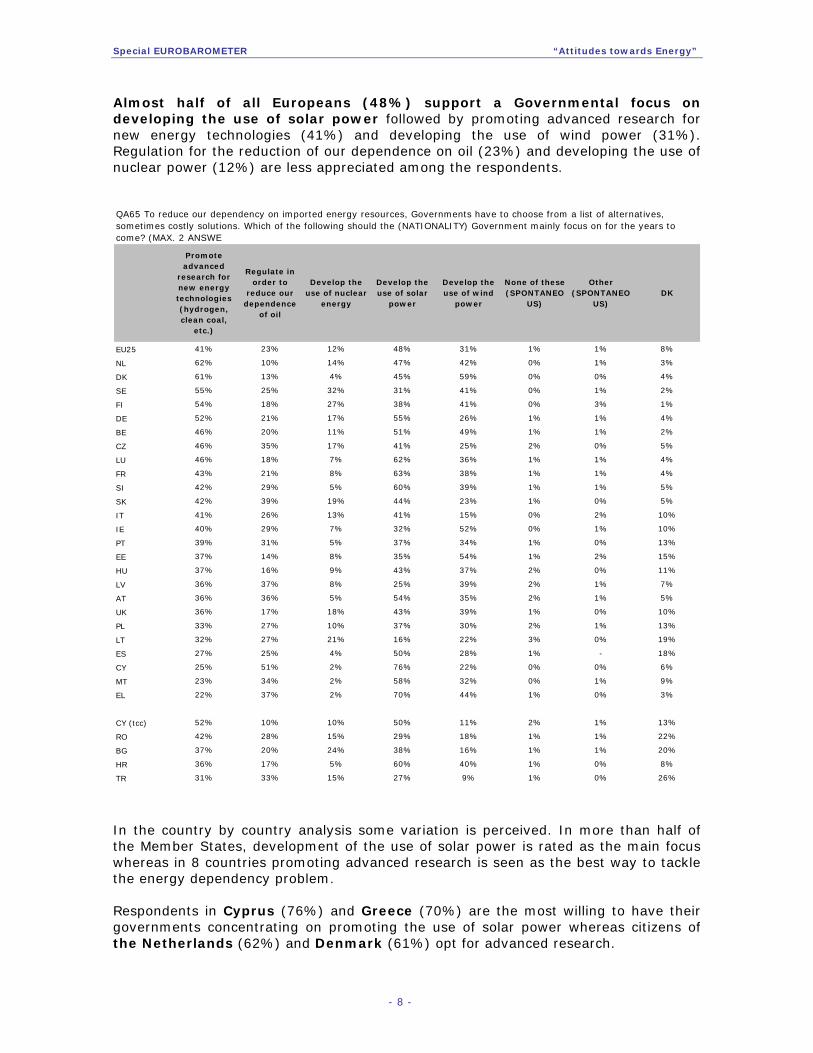
Almost half of all Europeans (48%) support a Governmental focus on developing the use of solar power followed by promoting advanced research for new energy technologies (41%) and developing the use of wind power (31%). Regulation for the reduction of our dependence on oil (23%) and developing the use of nuclear power (12%) are less appreciated among the respondents.
In the country by country analysis some variation is perceived. In more than half of the Member States, development of the use of solar power is rated as the main focus whereas in 8 countries promoting advanced research is seen as the best way to tackle the energy dependency problem. Respondents in Cyprus (76%) and Greece (70%) are the most willing to have their governments concentrating on promoting the use of solar power whereas citizens of the Netherlands (62%) and Denmark (61%) opt for advanced research.

Special EUROBAROMETER “Attitudes towards Energy”
- 9 -
Promote advanced
research for new energy technologies (hydrogen, clean coal,
etc )
Regulate in order to
reduce our dependence
of oil
Develop the use of nuclear
energy
Develop the use of solar
power
Develop the use of wind
power
None of these (SPONTANEO
US)
Other (SPONTANEO
US)Don't know
EU25 41% 23% 12% 48% 31% 1% 1% 8%SexMale 45% 23% 16% 47% 31% 1% 1% 6%Female 38% 24% 9% 49% 32% 1% 0% 10%Age15-24 41% 28% 11% 46% 31% 1% 1% 8%25-39 44% 25% 11% 48% 33% 1% 1% 6%40-54 44% 23% 12% 49% 34% 1% 0% 6%55 + 38% 20% 15% 48% 29% 1% 1% 12%Education (End of)15 30% 21% 10% 49% 29% 1% 1% 15%16-19 41% 24% 12% 50% 33% 1% 0% 6%20+ 53% 23% 16% 46% 32% 1% 1% 3%Still Studying 43% 28% 11% 46% 31% 1% 1% 8%Household composition1 39% 23% 12% 47% 30% 1% 1% 11%2 43% 22% 14% 48% 30% 1% 1% 8%3 40% 23% 12% 48% 33% 1% 1% 8%4+ 41% 25% 11% 49% 33% 1% 1% 7%Left-Right scale(1-4) Left 46% 24% 9% 54% 34% 1% 1% 5%(5-6) Centre 43% 24% 13% 49% 33% 1% 1% 5%(7-10) Right 44% 24% 19% 46% 30% 1% 1% 6%Respondent occupation scaleSelf- employed 47% 24% 13% 47% 29% 1% 1% 4%Managers 57% 22% 18% 45% 30% 1% 1% 3%Other white collars 47% 23% 11% 51% 32% 1% 1% 5%Manual workers 38% 24% 10% 50% 36% 1% 0% 7%House persons 34% 24% 9% 45% 27% 0% 0% 14%Unemployed 35% 26% 14% 50% 34% 1% 1% 7%Retired 36% 20% 14% 48% 31% 1% 1% 12%Students 43% 28% 11% 46% 31% 1% 1% 8%Subjective urbanisationRural village 39% 21% 12% 50% 35% 1% 1% 9%Small/ mid size town 43% 23% 12% 48% 30% 1% 1% 8%Large town 42% 27% 13% 45% 30% 1% 0% 7%Leadership++ 50% 24% 18% 47% 30% 1% 1% 4%+ 44% 25% 13% 47% 32% 1% 1% 6%- 43% 23% 12% 52% 32% 1% 1% 6%-- 30% 20% 9% 44% 30% 1% 0% 17%Trust in EUTend to agree 44% 25% 12% 48% 31% 1% 1% 6%Tend to disagree 40% 22% 14% 50% 33% 1% 1% 7%Membership EUA good thing 47% 24% 13% 49% 30% 1% 1% 5%A bad thing 36% 22% 15% 48% 34% 1% 1% 8%Neither good nor bad 36% 23% 11% 49% 34% 1% 1% 9%Benef. EU member.Benefited 46% 26% 12% 48% 31% 1% 1% 6%Not benefited 39% 22% 14% 51% 33% 1% 1% 7%Image of EUPositive 46% 25% 12% 48% 30% 1% 1% 6%Neutral 38% 23% 12% 49% 32% 1% 0% 9%Negative 40% 20% 14% 50% 35% 1% 1% 8%
QA65 To reduce our dependency on imported energy resources, Governments have to choose from a list of alternatives, sometimes costly solutions. Which of the following should the (NATIONALITY) Government mainly focus on for the years to come? (MAX. 2 ANSWERS)
Estonians (54%) and Irish (52%) are the most frequent to support development of the use of wind power. Sweden (32%) and Finland (27%) stand out with their citizens’ support for nuclear energy as a main focus which is most likely due to country specific developments and discussions about the subject. What comes to socio-demographic analysis, no great variation is depicted. It can be mentioned that men are slightly more positive about promotion of advanced research and nuclear power as government actions while the younger the respondent is the more likely to support governmental regulation to reduce the dependence of oil. Those in the political left are more inclined to support the use of solar power than their counterparts.

Special EUROBAROMETER “Attitudes towards Energy”
- 10 -
QA64. According to you, what should be the public authorities’ priority to help people to reduce their consumption of energy? (MAX. 2 ANSWERS)
11%
21%
32%
40%
43%
2%
0% 20% 40% 60%
Other (SPONTANEOUS)
Don't know
Control more strictly theapplication of existing
energy efficiency standards
Adopt higher efficiencystandards for energyconsuming equipment
Develop tax incentives topromote efficient use of
energy
Provide more informationon efficient use of energy
Results EU25
As increasing the share of renewable energy forms in the European energy mix is set as one of the main targets by the Commission, it appears that at the national level clear support for enhancing the use of renewable energies - both through developing the current use and promoting the research of new technologies - prevails. 1.3 Priorities to reduce energy consumption The current trend points to an ever continuing increase in energy consumption. According to some estimations, the level of energy use in the EU may increase by 10% in the coming 15 years if nothing is done, even if according to the Green Paper on Energy Efficiency it should be possible to cut down energy consumption by 20% over the same time period.
- Governments should more actively promote efficient use of energy - The respondents were asked what should be the public authorities’ priority to help people to reduce their energy consumption. Most of the European citizens (43%) would require more information on efficient use of energy, but also external steering in the form of tax incentives (40%). The actions related to energy standards are seen slightly less effective, higher energy efficiency standards reaching 32% share and more strict control over the current standards 21%.

Special EUROBAROMETER “Attitudes towards Energy”
- 11 -
Provide more information on efficient use of
energy
Develop tax incentives to
promote efficient use of
energy
Adopt higher efficiency
standards for energy
consuming equipment
Control more strictly the
application of existing energy
efficiency standards
Other (SPONTANEOUS)
DK
EU25 43% 40% 32% 21% 2% 11%
CY 60% 27% 41% 30% 1% 10%
DK 59% 44% 49% 16% 1% 4%
MT 57% 21% 36% 25% 2% 8%
EL 55% 27% 41% 38% 1% 6%
SE 52% 62% 26% 22% 2% 4%
ES 51% 25% 13% 10% 2% 23%
IE 51% 40% 30% 27% 1% 13%
PT 51% 33% 42% 18% 1% 9%
FI 51% 41% 32% 19% 2% 4%
SI 50% 53% 36% 29% 1% 7%
LU 49% 42% 25% 33% 3% 9%
BE 47% 54% 29% 30% 2% 2%
AT 47% 46% 26% 24% 2% 11%
NL 46% 54% 45% 13% 2% 3%
UK 46% 33% 37% 24% 0% 13%
SK 45% 47% 40% 25% 2% 4%
EE 44% 45% 26% 20% 1% 16%
FR 44% 31% 32% 30% 4% 10%
DE 40% 46% 43% 21% 2% 7%
LV 40% 34% 28% 28% 0% 10%
CZ 36% 59% 27% 23% 0% 7%
HU 36% 40% 18% 20% 1% 19%
PL 35% 41% 20% 18% 1% 16%
IT 33% 45% 27% 15% 2% 12%
LT 33% 30% 21% 26% - 21%
HR 53% 24% 27% 28% 0% 10%
CY (tcc) 48% 38% 19% 23% 1% 13%
TR 44% 21% 25% 18% 0% 25%
BG 39% 36% 24% 29% 0% 19%
RO 39% 35% 35% 23% 2% 20%
QA64 Against the background of high energy prices, some are proposing to take new measures that will help people to reduce their consumption of energy. According to you, what should be the public authorities’ priority to help people to reduce their consum
In most Member States (14 countries), increased distribution of information is rated as the priority for the public authorities. This is also the case in all the candidate and acceding countries. Citizens of 11 Member States assess the tax incentives as the best way to promote energy efficiency. Respondents in Cyprus (60%), Denmark (59%) and Malta (57%) are the first to appreciate the improvement of awareness by added information provided by the public authorities while the citizens of Sweden (62%) and the Czech Republic (59%) are the first to support the development of tax incentives.
In the socio-demographic analysis, once again, no clear tendencies are perceived and there is a general agreement about the lack of information in all the socio-demographic categories. However, some features can be described. Women appear to be more supportive to an increase in the information supply whereas men are inclined to more often name tax incentives and actions on energy standards as public authorities’ priorities.
Special EUROBAROMETER “Attitudes towards Energy”
- 12 -
Provide more information on efficient use of
energy
Develop tax incentives to
promote efficient use of
energy
Adopt higher efficiency
standards for energy
consuming equipment
Control more strictly the
application of existing energy
efficiency standards
Other (SPONTANEOU
S)Don't know
EU25 43% 40% 32% 21% 2% 11%SexMale 41% 43% 33% 21% 2% 10%Female 44% 37% 30% 20% 2% 13%Age15-24 46% 35% 30% 23% 1% 12%25-39 44% 45% 32% 19% 2% 8%40-54 42% 43% 33% 22% 2% 8%55 + 40% 36% 30% 21% 1% 16%Education (End of)15 41% 32% 26% 18% 2% 19%16-19 44% 40% 32% 23% 2% 10%20+ 42% 51% 38% 20% 2% 5%Still Studying 46% 35% 31% 22% 1% 11%Household composition1 44% 35% 32% 21% 2% 14%2 42% 40% 32% 20% 2% 12%3 42% 41% 31% 22% 2% 10%4+ 43% 42% 32% 20% 2% 10%Left-Right scale(1-4) Left 45% 40% 35% 22% 2% 8%(5-6) Centre 45% 42% 33% 22% 2% 8%(7-10) Right 41% 45% 34% 22% 2% 9%Respondent occupation scaleSelf- employed 40% 43% 36% 19% 2% 9%Managers 43% 52% 41% 21% 3% 4%Other white co 42% 47% 34% 20% 2% 8%Manual worker 45% 42% 29% 21% 2% 10%House persons 43% 34% 25% 18% 1% 17%Unemployed 47% 34% 30% 21% 2% 9%Retired 40% 34% 30% 22% 1% 16%Students 46% 35% 31% 22% 1% 11%Subjective urbanisationRural village 42% 39% 30% 20% 2% 13%Small/ mid size 42% 40% 32% 21% 2% 12%Large town 45% 42% 33% 22% 2% 8%Leadership++ 40% 47% 38% 24% 2% 6%+ 43% 46% 34% 20% 2% 8%- 44% 39% 32% 23% 2% 10%-- 42% 29% 24% 17% 1% 22%Trust in EUTend to agree 45% 43% 31% 21% 2% 8%Tend to disagre 42% 41% 33% 22% 2% 11%Membership EUA good thing 46% 43% 33% 21% 2% 8%A bad thing 38% 38% 32% 22% 2% 14%Neither good n 42% 39% 30% 22% 1% 12%Benef. EU member.Benefited 45% 43% 33% 21% 2% 8%Not benefited 41% 40% 33% 22% 2% 11%Image of EUPositive 46% 43% 33% 20% 2% 8%Neutral 42% 38% 30% 21% 1% 12%Negative 39% 39% 33% 23% 2% 13%
QA64 Against the background of high energy prices, some are proposing to take new measures that will help people to reduce their consumption of energy. According to you, what should be the public authorities’ priority to help people to reduce their consumption of energy? (MAX. 2 ANSWERS)
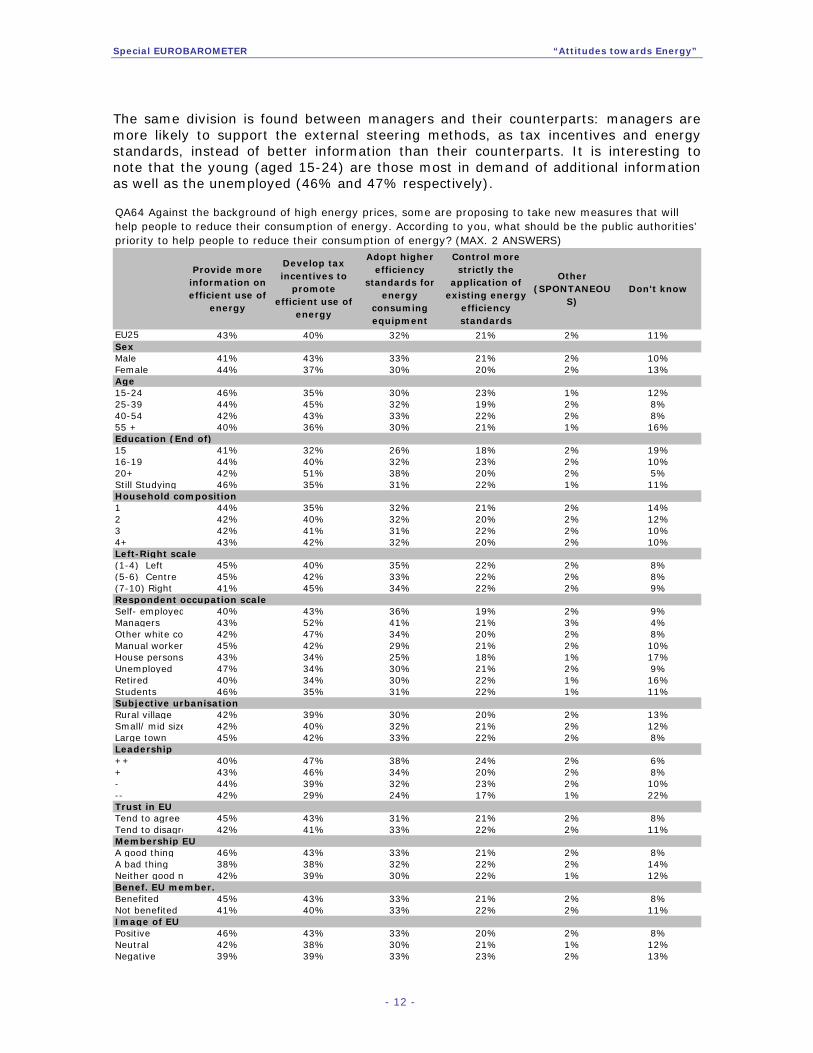
The same division is found between managers and their counterparts: managers are more likely to support the external steering methods, as tax incentives and energy standards, instead of better information than their counterparts. It is interesting to note that the young (aged 15-24) are those most in demand of additional information as well as the unemployed (46% and 47% respectively).

Special EUROBAROMETER “Attitudes towards Energy”
- 13 -
- Priorities to improve the European Union's economic performance -
10%
22%
24%
46%
49%
60%
11%
19%
26%
42%
43%
58%
Increase the legal number ofworking hours
Invest in transport infrastructure(motorways, railways, etc.)
Use energy more efficiently
Facilitate the creation of companies
Invest in research and innovation
Improve education andprofessional training
EB63 EB64
It appears that a lot remains to be done despite the efforts that have already been implemented, i.e. at the local and the regional level. It is worth recalling results from the former Eurobarometer on Energy4: when asked about the main subjects Europeans wished to be informed about, the main preferences were for the practical issue of how to save energy at home (53%) followed by more complex issues such as the use of new forms of energy, though again in the home (42%). These were followed by alternatives for petrol and diesel (39%) and safety of nuclear power installations (36%) among others. Public opinion seems to be aware of the vital role energy plays in economic competitiveness. In fact, results of the last Eurobarometer wave5 show that a most efficient use of energy is seen as a means to improve the performance of the European Economy by 1 out of 4 citizens within the European Union (26%, +2 points). The most supportive trend is to be found in Cyprus where 1 out of 2 citizens mentioned it as a potential means for a better economical performance. Results are important as well in Slovakia, Malta and Ireland while they decrease below the average in Spain, Italy and Latvia. The graph below shows the evolution of this indicator from the Eurobarometer 63, conducted in spring 2005 and the Eurobarometer 64, carried out in autumn 2005.
In conclusion, all the actions mentioned here are appreciated by a substantial part of Europeans. There is a clear demand for action on the side of public for authorities at all levels.
4 EB 57 “Energy: Issues, Options and Technologies”, December 2002. The full report is available on: http://europa.eu.int/comm/public_opinion/archives/ebs/ebs_169.pdf 5 EB 64, Autumn wave. QA63: “Which of the following statements would you prioritise to improve the performance of the European economy?”
Special EUROBAROMETER “Attitudes towards Energy”
- 14 -
2. THE ROLE OF CONSUMERS The second chapter portrays citizens’ behaviour in terms of energy consumption as well as their willingness to change their energy consumption habits. 2.1 Citizens’ behaviour: a consumer perspective
Source questionnaire: QA68 As consumers, do Europeans give any consideration to the idea of using less energy? As far as everyday products or equipment are concerned, the answer seems to be positive.
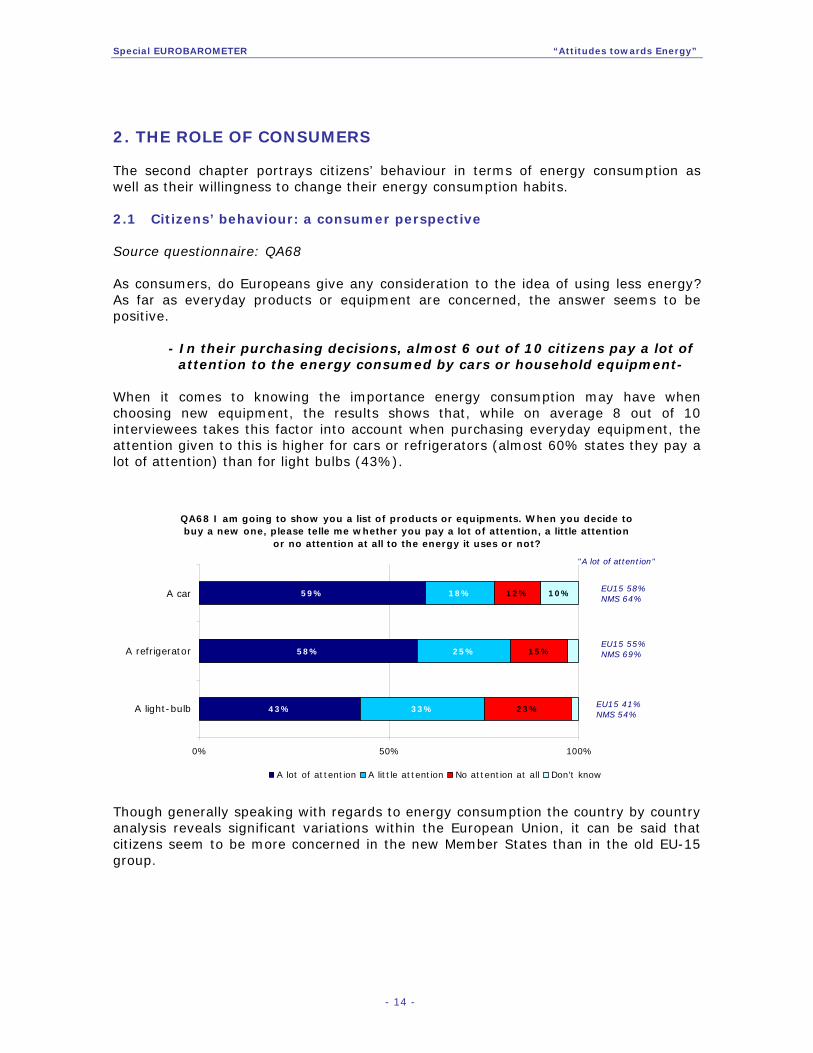
- In their purchasing decisions, almost 6 out of 10 citizens pay a lot of attention to the energy consumed by cars or household equipment-
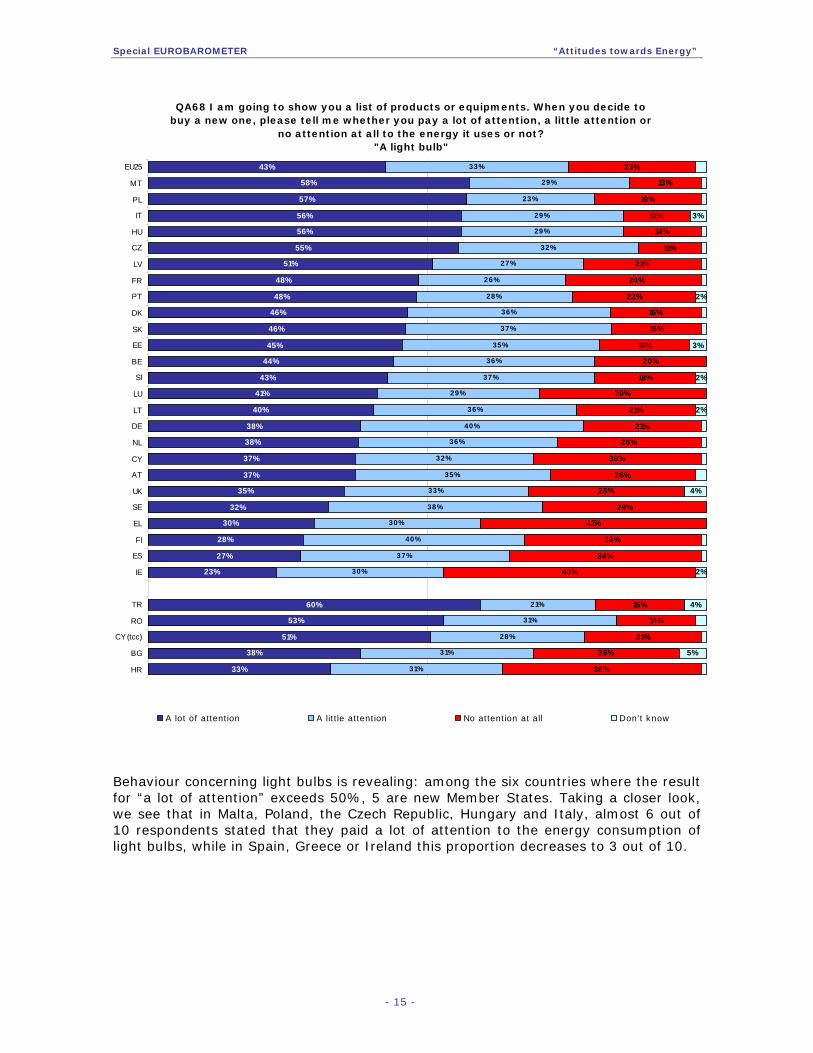
When it comes to knowing the importance energy consumption may have when choosing new equipment, the results shows that, while on average 8 out of 10 interviewees takes this factor into account when purchasing everyday equipment, the attention given to this is higher for cars or refrigerators (almost 60% states they pay a lot of attention) than for light bulbs (43%).
QA68 I am going to show you a list of products or equipments. When you decide to buy a new one, please telle me whether you pay a lot of attention, a little attention
or no attention at all to the energy it uses or not?
43%
58%
59%
33%
25%
18%
23%
15%
12% 10%
0% 50% 100%
A light-bulb
A refrigerator
A car
A lot of attention A little attention No attention at all Don't know
"A lot of attention"
EU15 58%NMS 64%
EU15 55%NMS 69%
EU15 41%NMS 54%
Though generally speaking with regards to energy consumption the country by country analysis reveals significant variations within the European Union, it can be said that citizens seem to be more concerned in the new Member States than in the old EU-15 group.
Special EUROBAROMETER “Attitudes towards Energy”
- 15 -
QA68 I am going to show you a list of products or equipments. When you decide to buy a new one, please tell me whether you pay a lot of attention, a little attention or
no attention at all to the energy it uses or not?"A light bulb"
43%
58%
57%
56%
56%
55%
51%
48%
48%
46%
46%
45%
44%
43%
41%
40%
38%
38%
37%
37%
35%
32%
30%
28%
27%
23%
60%
53%
51%
38%
33%
33%
29%
23%
29%
29%
32%
27%
26%
28%
36%
37%
35%
36%
37%
29%
36%
40%
36%
32%
35%
33%
38%
30%
40%
37%
30%
31%
28%
23%
13%
19%
12%
14%
11%
21%
22%
16%
16%
16%
20%
18%
30%
21%
21%
26%
30%
26%
28%
29%
41%
32%
34%
45%
16%
14%
21%
26%
36%
3%
2%
3%
2%
2%
4%
2%
4%
5%
21%
31%
31%
24%
EU25
MT
PL
IT
HU
CZ
LV
FR
PT
DK
SK
EE
BE
SI
LU
LT
DE
NL
CY
AT
UK
SE
EL
FI
ES
IE
TR
RO
CY (tcc)
BG
HR
A lot of attention A little attention No attention at all Don't know
Behaviour concerning light bulbs is revealing: among the six countries where the result for “a lot of attention” exceeds 50%, 5 are new Member States. Taking a closer look, we see that in Malta, Poland, the Czech Republic, Hungary and Italy, almost 6 out of 10 respondents stated that they paid a lot of attention to the energy consumption of light bulbs, while in Spain, Greece or Ireland this proportion decreases to 3 out of 10.

Special EUROBAROMETER “Attitudes towards Energy”
- 16 -
QA68 I am going to show you a list of products or equipments. When you decide to buy a new one, please tell me whether you pay a lot of attention, a little
attention or no attention at all to the energy it uses or not?"A refrigerator"
58%
83%
82%
76%
70%
70%
69%
68%
68%
67%
66%
62%
61%
61%
59%
58%
58%
57%
55%
55%
49%
46%
42%
40%
36%
31%
80%
62%
53%
39%
38%
25%
12%
13%
17%
21%
20%
20%
19%
16%
22%
23%
31%
24%
27%
27%
20%
22%
29%
23%
25%
29%
24%
28%
26%
30%
28%
21%
25%
15%
4%
4%
5%
6%
7%
8%
12%
8%
8%
5%
14%
9%
13%
21%
16%
13%
19%
15%
19%
25%
25%
30%
31%
40%
3%
14%
21%
20%
29%
2%
4%
2%
3%
2%
3%
5%
9%
31%
32%
12%
7%
2%
4%
3%
3%
5%
5%
3%
4%
5%
3%
3%
3%
2%
6%
2%
2%
EU25
CZ
SK
DK
IT
AT
SE
EE
PL
NL
HU
DE
LU
SI
BE
CY
LV
FI
FR
LT
M T
PT
UK
IE
ES
EL
RO
TR
CY (tcc)
BG
HR
A lot of attention A little attention No attention at all Don't know
Similar differences are found with regards to the other two kinds of equipment: the Czech Republic, Slovakia and Denmark are the Member States where prospective purchasers pay most attention to the energy use when deciding to buy a refrigerator (results for “a lot of attention” range from 83% to 76%).

Special EUROBAROMETER “Attitudes towards Energy”
- 17 -
QA68 I am going to show you a list of products or equipments. When you decide to buy a new one, please tell me whether you pay a lot of attention, a little attention
or no attention at all to the energy it uses or not?"A car"
59%
82%
81%
77%
75%
74%
71%
70%
67%
64%
62%
62%
62%
62%
61%
61%
58%
57%
56%
52%
51%
49%
49%
47%
46%
39%
72%
63%
61%
59%
36%
18%
7%
7%
7%
11%
14%
17%
20%
13%
22%
25%
12%
23%
8%
22%
14%
24%
26%
24%
19%
9%
13%
15%
19%
23%
19%
13%
16%
12%
5%
9%
6%
6%
6%
6%
7%
9%
7%
5%
12%
9%
8%
5%
12%
10%
13%
20%
13%
12%
18%
25%
19%
29%
4%
17%
10%
10%
15%
10%
12%
20%
21%
21%
27%
19%
20%
12%
10%
5%
6%
13%
12%
36%
7%
12%
9%
17%
26%
7%
7%
6%
8%
10%
6%
4%
8%
7%
6%
4%
6%
6%
3%
EU25
CZ
CY
SK
AT
IT
SI
SE
MT
DE
BE
EE
LU
PL
FR
LT
NL
DK
FI
IE
LV
HU
PT
EL
UK
ES
RO
CY (tcc)
HR
TR
BG
A lot of attention A little attention No attention at all Don't know
As far as cars are concerned, once more citizens of the Czech Republic and Slovakia, together with the Cypriots and Austrians seem to be particularly concerned about energy consumption (the proportion of citizens stating they pay “a lot of attention” varies from 82% to 75%).

Special EUROBAROMETER “Attitudes towards Energy”
- 18 -
It can also be pointed out that, within the European Union, respondents in Greece and Spain are notably less likely to pay attention to the energy consumption of cars or refrigerators. As far as the acceding and candidates countries are concerned, Romanians appear to be more concerned about energy consumption from a prospective purchaser point-of-view. When it comes to the socio-demographic variables, results show that behaviour in this area is mainly influenced by cultural levels: the longer the duration of respondent’s education, the more attention they tend to pay to energy arguments. Results seem to be also linked to the role played by the interviewee in the purchase of such a product or piece of equipment. In fact, we can observe that the young, that is to say interviewees from 15 to 24 years old, generally pay less attention than others to the energy consumed by the products mentioned. When analysing habits concerning cars, we can observe a significant difference between the attention paid by men compared to women (64% state they pay “a lot of attention” compared to 55% among women).
2.2 Consumers facing energy challenges: the use of renewable energy Source questionnaire: QA66a Besides covering respondents’ attention to energy consumption as prospective purchasers, they were also asked whether they would be ready to make some efforts, in terms of expense and consumption, in order to face the new energy challenges societies are tackling. Two different questions were used with this purpose in mind: half of the sample in each country was asked the trend question already proposed in the former Eurobarometer 57 carried out in 20026, while the rest answered a similar question but formulated differently7.
-The survey demonstrates that the majority of citizens do not want to pay more -
Both questions prove that people are reluctant to pay more. However a significant percentage (40%), most likely individuals who are more sensitive to environmental issues, would be prepared to pay somewhat more for energy from renewable sources (+2 points compared to the former survey). 27% would even accept an increase of 5% (+3 points) and 13% a higher price rise. The evolution seems to confirm that the price “ceiling” is situated at a 5% price increase.
6 “Would you be prepared to pay more for energy produced from renewable sources than for energy produced from other sources? (IF YES) How much more would be prepared to pay?” 7 “As you may know, we are now facing new energy challenges (like high energy price, international obligations to reduce CO2 emissions) that could imply efforts from citizens. With which of the following propositions do you agree the most?”

Special EUROBAROMETER “Attitudes towards Energy”
- 19 -
QA66a. Would you be prepared to pay more for energy produced from renewable sources than for energy produced from other sources? (IF YES)
How much more would you be prepared to pay?
54%
51%
66%
27%
28%
19%
11%
11%
8%
6%
6%
6%
0% 50% 100%
UE25 EU25
UE15 EU15
NEM10 NMS10
No, I am not prepared to pay more Yes, I would pay up to 5% moreYes, I would pay 6 to 10% more Yes, I would pay 11 to 25% moreYes, I would pay more than 25% more DK
QA66a. Would you be prepared to pay more for energy produced from renewable sources than for energy produced from other sources? (IF YES) How much more
would you be prepared to pay?
9%
54%
1%
2%
11%
24%
38%
6%
54%
0%
2%
11%
27%
40%
0% 10% 20% 30% 40% 50% 60%
Don't know
No, I am not preparedto pay more
Yes, I would pay morethan 25% more
Yes, I would pay 11 to25% more
Yes, I would pay 6 to10% more
Yes, I would pay up to5% more
Total Yes
EB 57 EU15 EB 64 EU25
Yet the country to country analysis reveals the existence of significant differences as far as price related efforts are concerned. A first cleavage is to be found amongst the old EU-15 Member States and the ten new Members, with the latter group being clearly more reluctant to pay higher prices for “green energy”, opposition to such a measure reaching 76% in Slovakia.

Special EUROBAROMETER “Attitudes towards Energy”
- 20 -
QA66a. Would you be prepared to pay more for energy produced from renewable sources than for energy produced from other sources? (IF YES)
How much more would you be prepared to pay?
54%
76%
73%
70%
70%
67%
66%
65%
59%
58%
57%
57%
56%
55%
55%
54%
54%
52%
50%
47%
47%
45%
45%
45%
39%
35%
76%
64%
54%
53%
47%
27%
15%
14%
21%
21%
16%
21%
22%
26%
25%
24%
24%
29%
27%
26%
29%
25%
32%
26%
31%
37%
33%
29%
24%
29%
31%
15%
12%
11%
5%
3%
5%
3%
8%
7%
5%
11%
6%
7%
10%
12%
11%
12%
13%
11%
9%
18%
13%
13%
6%
18%
17%
22%
22%
3%
3%
13%
9%
6%
3%
9%
3%
6%
8%
5%
8%
2%
9%
10%
6%
2%
5%
6%
1%
8%
5%
2%
4%
1%
14%
4%
10%
5%
5%
13%
18%
29%
7%
11%
8%
EU25
SK
LT
LV
PT
PL
HU
MT
EL
IT
IE
CY
DE
CZ
SI
BE
EE
AT
SE
FR
FI
ES
NL
UK
DK
LU
BG
RO
TR
HR
CY (tcc)
No, I am not prepared to pay more Yes, I would pay up to 5% more
Yes, I would pay 6 to 10% more Yes, I would pay 11 to 25% more
Yes, I would pay more than 25% more Don't know
Moreover, the existence of a market for “green energy” amongst consumers appears to be more evident in northern Europe with countries such as Luxembourg, Denmark, Finland or the Netherlands being more willing to take actions even if this involves an extra financial effort on their part in order to help the environment by consuming energy from renewable sources. In these countries more than half of the population would be prepared to pay more for “green energy”. It is interesting to note that 56% of Germans are not prepared to pay more, although the country is the foremost producer of wind energy.

Special EUROBAROMETER “Attitudes towards Energy”
- 21 -
QA66a.Would you be prepared to pay more for energy produced from renewable sources than for energy produced from other sources? (IF YES) How much more would you pay?
Willingness to pay more (difference "Total Yes" - "No")
CZ
DK
LU
SI
EU25
BEDE
ELES
FR
IE
IT
CY
LV
HU
MT
NLAT
PL
PT
SK
FI
SE UK
BGHR
RO TR
0
50
100
150
200
250
-100 -80 -60 -40 -20 0 20 40 60 80 100
EU 25 = 100
Would not be prepared to pay more
The size of bubbles represents the importance of the unemployment rate in the country. The bigger the bubble, the higher the unemployment rate.v
Would be prepared to pay more
Source : Eurobarometer 64- Aut. 2005
GD
P ra
te p
er in
habi
tant
in P
PS (S
tand
ard
Pur
chas
ing
pow
er)
- EU
25 =
100
Is there any relation between willingness to pay more for renewal energy sources and objective elements such as the economic situation or the unemployment rate of one’s country? A comparison between citizens’ attitudes and factual indicators suggests that a relationship exists. The chart below illustrates the result of this comparison. The X-axis represents the differential in percentage points in each country, between people who would be ready to pay more for “green energy” and those who would not. It varies therefore between 100 and -100. The Y-axis represents the GDP8 index in Standard Purchasing Power (PPS) for each country, the index 100 representing the value for the enlarged European Union. Finally, the size of the bubble depends on the country’s unemployment rate9. In other words, the bigger the bubble, the higher the unemployment rate in the country in question.
8 EUROSTAT News release- GDP per capita in purchasing power standards- Revised data for 2004 -Press release published on December 20th 2005. 9 EUROSTAT €uro-indicators– Rate of unemployment in the euro zone in November 2005 – Press release published on 6th January 2006. For the accession countries and candidate countries, the data shown here have been obtained from national statistics offices: BG: http://www.nsi.bg/Labour_e/Labour_e.htm HR: http://www.dzs.hr/defaulte.htm RO: http://www.insse.ro/ComuNou_sinteze/a05/sic03e05.pdf TR: http://www.die.gov.tr/ENGLISH/SONIST/ISGUCU/k_270605.xls

Special EUROBAROMETER “Attitudes towards Energy”
- 22 -
As already seen, among European Union Member States, citizens in Poland, Slovakia Lithuania (hidden behind SK bubble) and Latvia are the most reluctant to make efforts in energy consumption demanding higher charges for them. The same situation can be found in Bulgaria, Romania and Turkey. It should be noted in this regard that these countries share a GDP in Standard Purchasing Power (PPS) which is far lower than the European average, as well as a far higher unemployment rate10, in particular in Poland (17.4% versus a European Union average of 8.5%) and Slovakia (16%). The position of northern countries, on the upper-right side of the chart, with high GDP and low unemployment rates, exemplify their motivation as well as the existence of objective conditions allowing citizens to afford an additional cost of this sort. Yet, the ratio GDP-Unemployment rate/willingness to make economic efforts for changing energy consumption habits does not explain situations such as that observed in Italy, Ireland, Belgium and Austria: in spite of having GDPs equal of higher than the EU25 average and unemployment rates below the European level, reluctance is still significant. These results suggest a lack of environmental or energy related awareness, which could hamper, in these countries, a positive change towards renewable energy in spite of a favourable economical context. Education indeed seems essential in order to recognize and face the new energy related challenges. More than 25 points separate those who continued their education for a long period from those who ended it by the age of 15 when it comes to agreeing with the idea of paying more for “renewable” energy (55% compared to 28%). Apart from education, we can see that men, the young as well as managers and other white collars are more open-minded with regards to the use of “green energy” when cost implications are involved.
10 EUROSTAT €uro-indicators– Rate of unemployment in the euro zone in November 2005 – Press release published on 6th January 2006

Special EUROBAROMETER “Attitudes towards Energy”
- 23 -
No, I am not prepared to pay
more
Yes, I would payup to 5% more
Yes, I would pay6 to 10% more
Yes, I would pay11 to 25% more
Yes, I would pay more than 25%
moreDon't know Yes
EU25 54% 27% 11% 2% 0% 6% 40%SexMale 52% 27% 13% 3% 1% 6% 42%Female 56% 27% 9% 1% 0% 7% 38%Age15-24 45% 26% 14% 3% 1% 11% 43%25-39 51% 28% 13% 2% 1% 5% 44%40-54 55% 28% 10% 2% 0% 4% 41%55 + 58% 25% 8% 1% 0% 7% 35%Education (End of)15 64% 22% 5% 1% 0% 8% 28%16-19 58% 26% 10% 1% 0% 5% 37%20+ 41% 33% 17% 4% 1% 4% 55%Still Studying 39% 25% 18% 3% 1% 14% 47%Household composition1 55% 25% 11% 3% 0% 6% 39%2 53% 29% 10% 2% 0% 6% 41%3 54% 26% 10% 2% 1% 7% 38%4+ 54% 25% 12% 2% 0% 6% 40%Left-Right scale(1-4) Left 46% 30% 16% 2% 1% 6% 48%(5-6) Centre 54% 28% 10% 2% 0% 5% 41%(7-10) Right 54% 27% 12% 2% 0% 4% 42%Respondent occupation scaleSelf- employed 52% 28% 12% 2% 1% 5% 43%Managers 40% 35% 17% 4% 1% 3% 57%Other white collars 47% 35% 10% 2% 0% 5% 48%Manual workers 57% 24% 11% 2% 0% 5% 37%House persons 59% 25% 6% 1% 0% 8% 33%Unemployed 64% 23% 7% 1% 0% 5% 31%Retired 60% 23% 8% 1% 0% 7% 33%Students 39% 25% 18% 3% 1% 14% 47%Subjective urbanisationRural village 58% 25% 8% 1% 1% 7% 35%Small/ mid size town 53% 27% 11% 2% 0% 6% 40%Large town 48% 29% 15% 2% 0% 6% 46%
(IF 'SPLIT A', CODE 1 IN E)
QA66a Would you be prepared to pay more for energy produced from renewable sources than for energy produced from other sources? (IF YES) How much more would you be prepared to pay?
Special EUROBAROMETER “Attitudes towards Energy”
- 24 -
QA66b. As you may know, we are now facing new energy challenges (like high energy prices, international obligations to reduce CO2 emissions) that could imply efforts from citizens. With which of the following propositions do
you agree the most?
10%
8%
1%
5%
12%
15%
50%
0% 10% 20% 30% 40% 50% 60%
Don't know
None of these (SPONTANEOUS)
Other (SPONTANEOUS)
I intend to reduce my energyconsumption and I would be
prepared to pay more(SPONTANEOUS)
As I do not intend to change myenergy consumption habits, I
would be prepared to pay more
I do not intend to change myenergy consumption habits and I
would not be prepared to paymore (SPONTANEOUS)
As I intend to reduce my energyconsumption, I would not be
prepared to pay more
2.3 Consumers facing energy challenges: reduction of energy consumption Source questionnaire: QA66b While changing energy usage still generates a certain level of reluctance when it involves financial efforts, reducing energy consumption seems to be a realistic goal on a short-term basis.
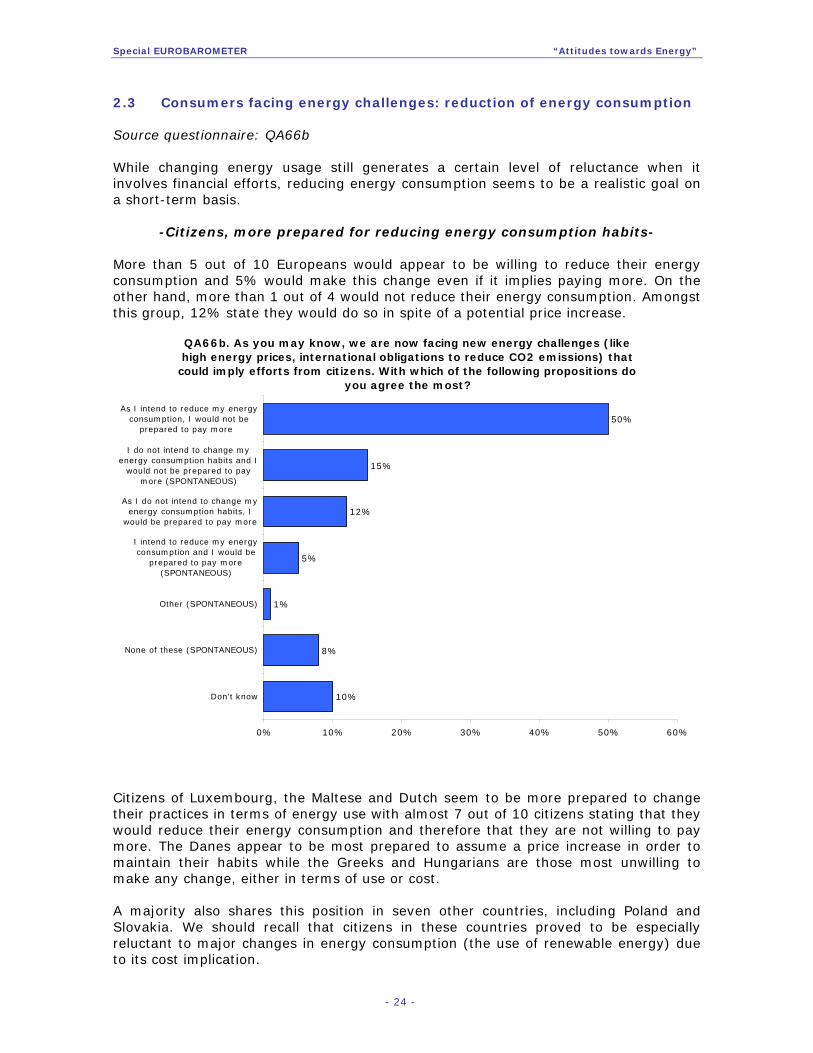
-Citizens, more prepared for reducing energy consumption habits- More than 5 out of 10 Europeans would appear to be willing to reduce their energy consumption and 5% would make this change even if it implies paying more. On the other hand, more than 1 out of 4 would not reduce their energy consumption. Amongst this group, 12% state they would do so in spite of a potential price increase.
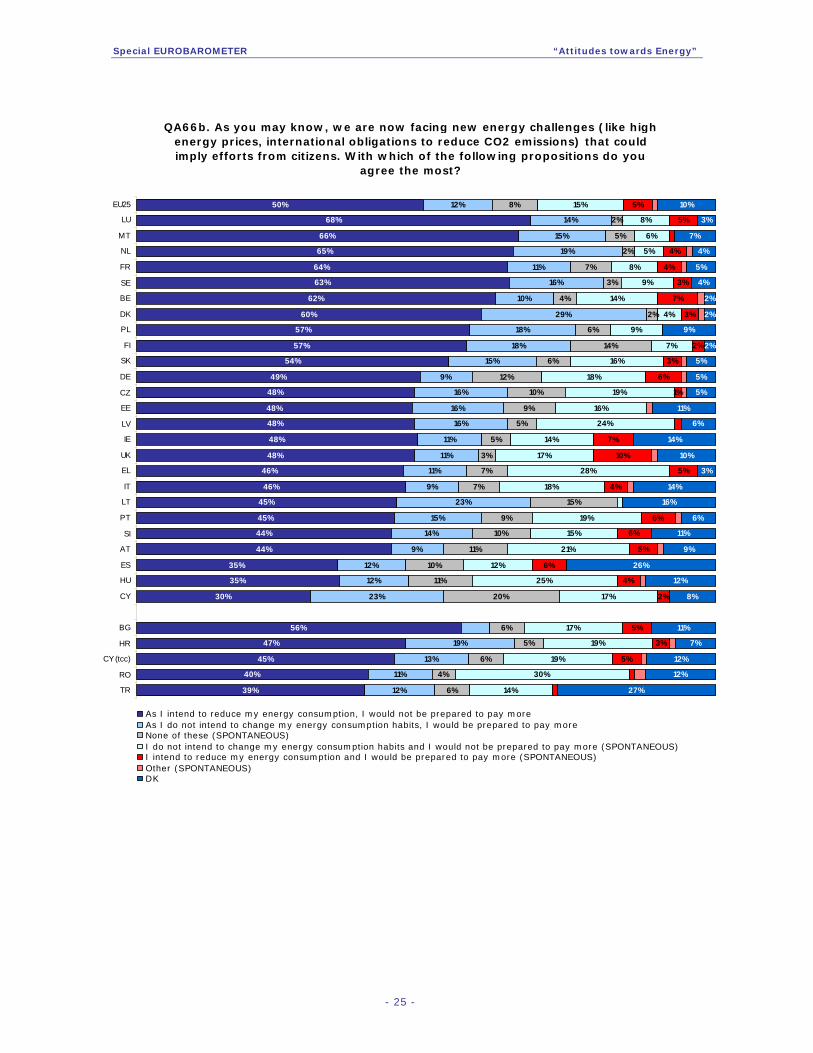
Citizens of Luxembourg, the Maltese and Dutch seem to be more prepared to change their practices in terms of energy use with almost 7 out of 10 citizens stating that they would reduce their energy consumption and therefore that they are not willing to pay more. The Danes appear to be most prepared to assume a price increase in order to maintain their habits while the Greeks and Hungarians are those most unwilling to make any change, either in terms of use or cost. A majority also shares this position in seven other countries, including Poland and Slovakia. We should recall that citizens in these countries proved to be especially reluctant to major changes in energy consumption (the use of renewable energy) due to its cost implication.
Special EUROBAROMETER “Attitudes towards Energy”
- 25 -
QA66b. As you may know, we are now facing new energy challenges (like high energy prices, international obligations to reduce CO2 emissions) that could imply efforts from citizens. With which of the following propositions do you
agree the most?
50%
68%
66%
65%
64%
63%
62%
60%
57%
57%
54%
49%
48%
48%
48%
48%
48%
46%
46%
45%
45%
44%
44%
35%
35%
30%
56%
47%
45%
40%
39%
12%
14%
15%
19%
11%
16%
10%
29%
18%
18%
15%
9%
16%
16%
16%
11%
11%
11%
9%
23%
15%
14%
9%
12%
12%
23%
19%
13%
8%
2%
5%
2%
7%
3%
4%
6%
14%
6%
12%
10%
9%
5%
5%
3%
7%
7%
15%
9%
10%
11%
10%
11%
20%
6%
5%
6%
4%
6%
15%
8%
6%
5%
8%
9%
14%
4%
9%
7%
16%
18%
19%
16%
24%
14%
17%
28%
18%
19%
15%
21%
12%
25%
17%
17%
19%
19%
30%
14%
5%
5%
4%
4%
3%
7%
3%
2%
3%
6%
1%
7%
10%
5%
4%
6%
6%
5%
6%
4%
2%
5%
3%
5%
10%
3%
7%
4%
5%
4%
2%
2%
9%
2%
5%
5%
5%
11%
6%
14%
10%
3%
14%
16%
6%
11%
9%
26%
12%
8%
11%
7%
12%
12%
27%12%
11%
2%
EU25
LU
MT
NL
FR
SE
BE
DK
PL
FI
SK
DE
CZ
EE
LV
IE
UK
EL
IT
LT
PT
SI
AT
ES
HU
CY
BG
HR
CY (tcc)
RO
TR
As I intend to reduce my energy consumption, I would not be prepared to pay more As I do not intend to change my energy consumption habits, I would be prepared to pay moreNone of these (SPONTANEOUS)I do not intend to change my energy consumption habits and I would not be prepared to pay more (SPONTANEOUS)I intend to reduce my energy consumption and I would be prepared to pay more (SPONTANEOUS)Other (SPONTANEOUS)DK

Special EUROBAROMETER “Attitudes towards Energy”
- 26 -
As I do not intend to change my
energy consumption
habits, I would be prepared to pay
more
As I intend to reduce my energy
consumption, I would not be
prepared to pay more
None of these (SPONTANEOUS)
I do not intend to change my energy
consumption habits and I would not be prepared to
pay more (SPONTANEOUS)
I intend to reduce my energy
consumption and I would be prepared
to pay more (SPONTANEOUS)
Other (SPONTANEOUS)
Don't know
EU25 12% 50% 8% 15% 5% 1% 10%SexMale 13% 48% 8% 15% 6% 1% 9%Female 11% 52% 7% 14% 4% 0% 10%Age15-24 13% 50% 7% 12% 4% 0% 14%25-39 12% 53% 8% 13% 5% 1% 8%40-54 12% 53% 8% 15% 5% 0% 7%55 + 13% 46% 7% 17% 6% 1% 10%Education (End of)15 10% 44% 7% 20% 5% 0% 13%16-19 12% 52% 8% 15% 4% 0% 9%20+ 14% 54% 7% 11% 7% 1% 5%Still Studying 12% 52% 8% 9% 4% 1% 14%Household composition1 13% 49% 7% 16% 4% 0% 10%2 12% 51% 8% 14% 6% 1% 8%3 12% 50% 8% 15% 4% 0% 10%4+ 12% 51% 7% 14% 5% 1% 10%Left-Right scale(1-4) Left 11% 55% 7% 14% 6% 1% 6%(5-6) Centre 12% 54% 7% 15% 5% 1% 8%(7-10) Right 16% 47% 8% 17% 5% 1% 7%Respondent occupation scaleSelf- employed 13% 49% 9% 14% 6% 1% 8%Managers 13% 54% 8% 10% 8% 1% 4%Other white collars 10% 58% 7% 11% 5% 0% 8%Manual workers 12% 50% 8% 17% 5% 0% 9%House persons 13% 45% 5% 17% 5% 1% 15%Unemployed 12% 52% 10% 18% 2% 1% 6%Retired 13% 47% 8% 17% 5% 0% 11%Students 12% 52% 8% 9% 4% 1% 14%Subjective urbanisationRural village 13% 51% 8% 13% 4% 0% 10%Small/ mid size town 12% 50% 7% 16% 5% 1% 10%Large town 12% 51% 8% 15% 6% 1% 8%
QA66b As you may know, we are now facing new energy challenges (like high energy prices, international obligations to reduce CO2 emissions) that could imply efforts from citizens. With which of the following propositions do you agree the most? (IF 'SPLIT B', CODE 2 IN E)
The socio-demographic analysis reveals once more the familiar patterns: the higher the level of education achieved the more citizens seem to be willing to assume commitments in terms of energy consumption habits.

Special EUROBAROMETER “Attitudes towards Energy”
- 27 -
3. CAR USAGE: A PRACTICAL EXAMPLE OF THE CHALLENGES FOR ENERGY POLICY The world has evolved significantly in terms of energy since 2000, when the Commission last launched a Green Paper on Security of Energy Supplies. The Green Paper identified the demand explosion in China as well as in other rapidly developing regions and was pessimistic about an eventual decrease in oil prices in the short term. Furthermore, the trends identified in the 2000 Green Paper, with Europe becoming 90% dependent on imported oil and gas by 2020, is deteriorating. On the other hand, energy policy is not only a question of security of supply. The Kyoto Protocol requires strong action in order to limit CO2 emissions. Consumers’ attitudes are an essential factor for European and National authorities when trying to best manage these challenges. 3.1 Citizens’ attitude vs. rise in fuel prices Car usage is very much representative of the challenges outlined above. What would consumers do if fuel prices reached a significant “price ceiling”? Would this be enough to provoke a substantial change in car usage?
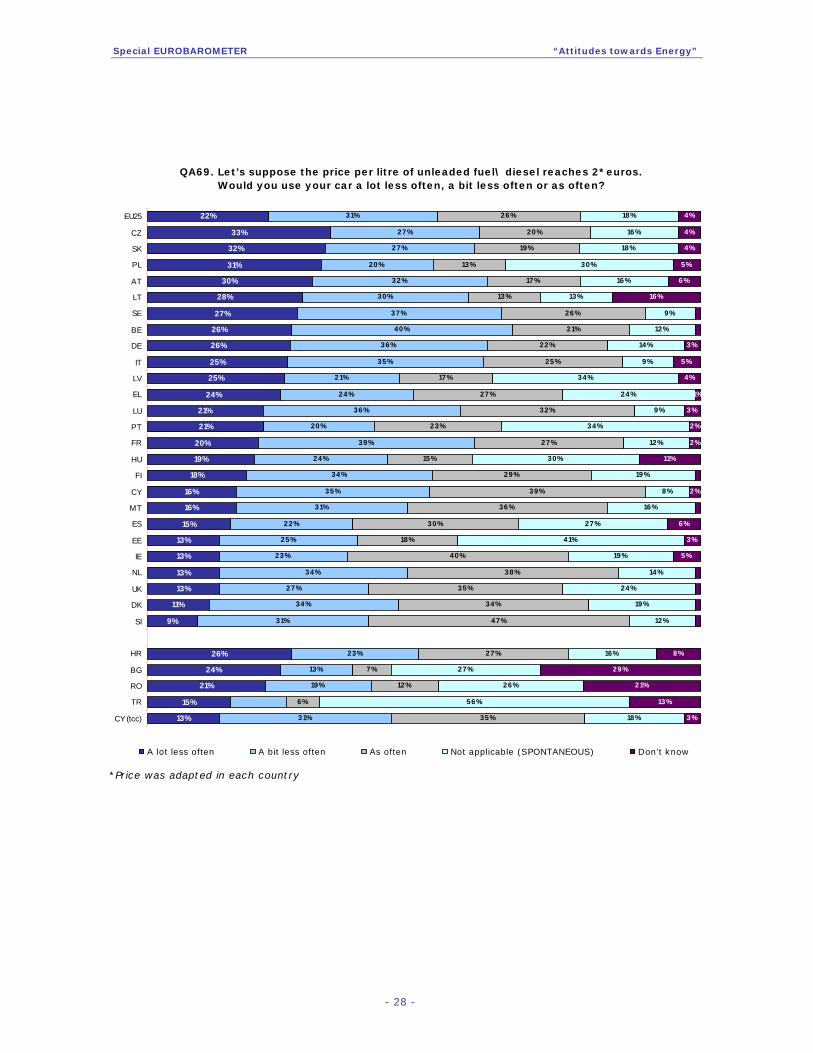
-Fuel prices could have a modest impact on car usage- The rise in fuel prices would have an impact on car usage if a certain ceiling is reached11: more than 2 out of 10 Europeans stated they would use their car/vehicle “a lot less often” while 3 out of ten declared they would do so “a bit less often”. Such a situation would have a more notable effect on citizens in the Czech Republic, Slovakia, Poland and Austria with almost one third of the population stating that they would be prepared to significantly reduce the use of cars/vehicles. On the other hand, it seems that the Irish, Cypriots, Maltese, Dutch, and particularly the Slovenians would be far more reluctant to introduce any change in their habits: between 36% and 47% of respondents in these countries declare that they would use their cars/vehicles as often.
11 The price barrier was adapted in each country to the national situation.
Special EUROBAROMETER “Attitudes towards Energy”
- 28 -
QA69. Let’s suppose the price per litre of unleaded fuel\ diesel reaches 2*euros. Would you use your car a lot less often, a bit less often or as often?
22%
33%
32%
31%
30%
28%
27%
26%
26%
25%
25%
24%
21%
21%
20%
19%
18%
16%
16%
15%
13%
13%
13%
13%
11%
9%
26%
24%
21%
15%
13%
31%
27%
27%
20%
32%
30%
37%
40%
36%
35%
21%
24%
36%
20%
39%
24%
34%
35%
31%
22%
25%
23%
34%
27%
34%
31%
13%
19%
26%
20%
19%
13%
17%
13%
26%
22%
25%
17%
27%
32%
23%
27%
15%
29%
39%
36%
30%
18%
40%
38%
35%
34%
47%
27%
7%
12%
6%
35%
18%
16%
18%
30%
16%
13%
9%
12%
14%
9%
34%
24%
9%
34%
12%
30%
19%
8%
16%
41%
19%
14%
24%
19%
12%
16%
27%
26%
56%
18%
4%
4%
4%
5%
6%
16%
3%
5%
4%
1%
3%
2%
2%
11%
2%
6%
3%
5%
8%
29%
21%
13%
3%31%
23%
21%
27%
EU25
CZ
SK
PL
AT
LT
SE
BE
DE
IT
LV
EL
LU
PT
FR
HU
FI
CY
MT
ES
EE
IE
NL
UK
DK
SI
HR
BG
RO
TR
CY (tcc)
A lot less often A bit less often As often Not applicable (SPONTANEOUS) Don't know
*Price was adapted in each country

Special EUROBAROMETER “Attitudes towards Energy”
- 29 -
QA69. Let’s suppose the price per litre of unleaded fuel\ diesel reaches 2*euros. Would you use your car a lot less often, a bit less often or as often?
Total "would use less often the car"
53%
66%
64%
62%
62%
60%
60%
59%
59%
58%
57%
52%
51%
51%
48%
47%
47%
46%
45%
43%
41%
40%
40%
38%
37%
36%
49%
44%
40%
37%
25%
0% 50%
EU25
BE
SE
AT
DE
CZ
IT
SK
FR
LT
LU
FI
PL
CY
EL
M T
NL
LV
DK
HU
PT
UK
SI
EE
ES
IE
HR
CY (tcc)
RO
BG
TR
Overall, the impact of a significant rise of fuel prices will be wider in countries such as Belgium, Sweden, Austria, Germany, the Czech Republic and Italy where at least 6 out of 10 citizens would use their vehicles less often.
The sociodemographic analysis does not reveal any significant trend. We could only point out that men, people aged between 40 and 54 years and living in rural areas seem to be more reluctant to change than other categories.

Special EUROBAROMETER “Attitudes towards Energy”
- 30 -
QA70. What would you do first to reduce the use of your cars often?Base: "will use the car less often"
37%
65%
64%
59%
59%
53%
52%
48%
46%
42%
42%
41%
38%
38%
37%
37%
37%
32%
30%
28%
28%
28%
28%
26%
25%
19%
63%
50%
46%
42%
41%
5%
2%
9%
3%
4%
2%
2%
9%
3%
4%
6%
3%
5%
3%
3%
3%
3%
2%
2%
2%
4%
3%
12%
10%
4%
10%
6%
10%
11%
5%
8%
11%
11%
7%
19%
11%
12%
10%
10%
24%
7%
7%
9%
16%
10%
23%
17%
4%
9%
15%
12%
9%
6%
20%
20%
13%
17%
17%
21%
12%
18%
17%
21%
19%
26%
17%
28%
11%
15%
8%
21%
4%
27%
36%
17%
24%
28%
5%
13%
12%
21%
39%
38%
23%
7%
4%
2%
8%
5%
20%
19%
24%
13%
23%
19%
20%
13%
34%
28%
30%
16%
51%
37%
24%
9%
36%
17%
20%
66%
2%
3%
18%
6%
7%
3%
2%
4%
2%
4%
5%
3%
2%
2%
2%
2%
3%
2%
3%
1%
9%
3%
3%
6%
7%
4%
6%
7%
2%
3%
2%
2%
3%
4%
2%
2%
4%
2%
2%
2%
2%
3%
3%
3%
3%
2%
3%
5%
4%
3%
6%
2%
3%
4%
9%
5%
8%
19%
EU25
EL
LU
ES
MT
PT
HU
LV
CZ
IT
SK
LT
AT
UK
BE
PL
SE
CY
DK
DE
EE
IE
FI
SI
FR
NL
TR
CY (tcc)
HR
BG
RO
Use public transport more Move closer to your workplaceShare a car with your relatives\ friends\ neighbours Walk moreUse a bicycle Other (SPONTANEOUS)
Although an eventual price increase could influence citizens, active policies are still necessary to promote the use of alternative means of transport. As the following graph shows, for citizens prepared to use their cars less, public transport would be the main alternative.
Use of public transport is more widely accepted in Greece (65%), Luxembourg (64%), Spain (59%), Malta (59%), Portugal (53%) and Hungary (52%). Bicycles would be the first option in northern countries such as the Netherlands (66%) and Denmark (51%) and to a lesser extent in Germany (37%) and Finland (36%). Finally, walking more would be the first thing Irish would do to reduce the use of their cars (36%).

Special EUROBAROMETER “Attitudes towards Energy”
- 31 -
Use public transport more
Move closer to your workplace
Share a car with your relatives\
friends\ neighbours
Walk more Use a bicycleOther
(SPONTANEOUS)DK
EU25 37% 5% 10% 20% 23% 3% 2%
Sex
Male 37% 5% 11% 16% 25% 4% 2%
Female 37% 5% 9% 23% 22% 3% 2%
Age
15-24 42% 7% 12% 14% 23% 2% 1%
25-39 35% 7% 12% 18% 23% 4% 2%
40-54 34% 4% 11% 19% 27% 2% 3%
55 + 37% 3% 7% 25% 20% 4% 3%
Education (End of)
15 34% 5% 8% 25% 21% 3% 3%
16-19 34% 4% 11% 20% 25% 3% 3%
20+ 39% 5% 10% 17% 24% 4% 2%
Still Studying 45% 6% 9% 14% 23% 1% 1%
Household composition
1 42% 5% 9% 19% 20% 3% 2%
2 37% 4% 8% 21% 23% 4% 2%
3 37% 6% 12% 20% 20% 3% 3%
4+ 34% 5% 11% 18% 27% 3% 2%
Left-Right scale
(1-4) Left 38% 6% 10% 18% 24% 3% 1%
(5-6) Centre 35% 4% 11% 21% 24% 3% 2%
(7-10) Right 33% 4% 10% 20% 25% 5% 3%
Respondent occupation scale
Self- employed 31% 7% 12% 21% 21% 5% 4%
Managers 38% 5% 9% 15% 26% 5% 2%
Other white collars 41% 6% 10% 16% 24% 2% 2%
Manual workers 31% 5% 13% 18% 28% 3% 2%
House persons 34% 7% 8% 26% 19% 4% 3%
Unemployed 35% 5% 13% 21% 23% 1% 2%
Retired 40% 2% 7% 25% 20% 3% 3%
Students 45% 6% 9% 14% 23% 1% 1%
Subjective urbanisation
Rural village 29% 5% 14% 17% 27% 4% 4%
Small/ mid size tow 35% 4% 10% 23% 24% 2% 2%
Large town 50% 6% 6% 17% 17% 3% 2%
(IF 'WILL USE THE CAR A LOT/A BIT LESS OFTEN', CODE 1 OR 2 IN QA69)
QA70 What would you do first to reduce the use of your car?
The socio-demographic analysis reveals that using public transport more would be the first option particularly for citizens living in large towns (50%), young interviewees (42%) as well as for those with a higher level of education (39%). Walking more would be a solution for women and the elderly (23% and 25%) while using a bike is more often mentioned by those aged 40 to 54 (27%), and interviewees living in rural areas or small/middle size towns (27% and 24% respectively).
Special EUROBAROMETER “Attitudes towards Energy”
- 32 -
CONCLUSION
The following points can be outlined based on the results of this survey:
• Results show that there is a clear demand for action on the side of public for authorities at all levels.
• The European level of decision making is perceived as the most
appropriate compared to the other options: 1 out of 2 interviewees support this view. Support for a European energy policy appears to be lower in the acceding and candidates countries.
• When asked what the National Governments should focus on in order to reduce
the current energy dependency, Europeans clearly support the enhanced use of renewable energies, particularly solar energy and to a lesser extend wind power. Europeans are also strongly in favour of promotion of advanced technologies such as hydrogen and clean coal.
• Governments should also promote the efficient use of energy more
actively, particularly regarding practical issues such as how to save energy and the use of new forms of energy at home. Most Europeans citizens would require more information on efficient use of energy, however external steering in the form of tax incentives would also be desired.
• As consumers, Europeans seem to give some consideration to the idea of using
less energy: in their purchasing decisions, almost 6 out of 10 citizens pay a lot of attention to the energy consumed by cars or household equipment. Though, the attention paid is lower when it comes to the energy consumed by more banal equipment (light bulb).
• Regarding renewable energies, 54% of Europeans are not prepared to pay more
for them, However 27% are prepared to do so provided the price increase is limited to 5%. Yet, there are still significant differences between former and new Member States, with the latter group being clearly more reluctant to pay higher prices for “green energy”.
• While changing energy usage still generates a certain level of reluctance when it
involves financial efforts, reducing energy consumption seems to be a realistic goal on a short term basis: more than 5 out of 10 Europeans would appear to be willing to reduce their energy consumption and 5% would make this change even if it implies paying more.
• Finally, it seems that a potential price increase of fuel could have an impact,
although limited, on car use.Other active policies are necessary to promote the use of alternative means of transport.

ANNEXES

SPECIAL EUROBAROMETER n° 247
« ATTITUDES TOWARDS ENERGY » TECHNICAL SPECIFICATIONS
Between the 11th of October and the 15th of November 2005, TNS Opinion & Social, a consortium created between Taylor Nelson Sofres and EOS Gallup Europe, carried out the wave 64.2 of the EUROBAROMETER, on request of the EUROPEAN COMMISSION, Directorate-General Press and Communication, Opinion Polls. This Special EUROBAROMETER is part of wave 64.2 and covers the population of the respective nationalities of the European Union Member States, resident in each of the Member States and aged 15 years and over. The EUROBAROMETER 64.2 has also been conducted in the two acceding countries (Bulgaria and Romania) and in the two candidate countries (Croatia and Turkey) as well as in the Turkish Cypriot Community. In these countries, the survey covers the national population of citizens of the respective nationalities and the population of citizens of all the European Union Member States that are residents in those countries and have a sufficient command of one of the respective national language(s) to answer the questionnaire. The basic sample design applied in all states is a multi-stage, random (probability) one. In each country, a number of sampling points was drawn with probability proportional to population size (for a total coverage of the country) and to population density. In order to do so, the sampling points were drawn systematically from each of the "administrative regional units", after stratification by individual unit and type of area. They thus represent the whole territory of the countries surveyed according to the EUROSTAT NUTS II (or equivalent) and according to the distribution of the resident population of the respective nationalities in terms of metropolitan, urban and rural areas. In each of the selected sampling points, a starting address was drawn, at random. Further addresses (every Nth address) were selected by standard "random route" procedures, from the initial address. In each household, the respondent was drawn, at random (following the "closest birthday rule"). All interviews were conducted face-to-face in people's homes and in the appropriate national language. As far as the data capture is concerned, CAPI (Computer Assisted Personal Interview) was used in those countries where this technique was available.

ABREVIATIONS COUNTRIES INSTITUTES N°
INTERVIEWS FIELDWORK DATES POPULATION 15+
BE Belgium TNS Dimarso 1.024 13/10/2005 06/11/2005 8.598.982 CZ Czech Rep. TNS Aisa 1.161 14/10/2005 05/11/2005 8.571.710 DK Denmark TNS Gallup DK 1.032 16/10/2005 13/11/2005 4.380.063 DE Germany TNS Infratest 1.534 14/10/2005 08/11/2005 64.174.295 EE Estonia Emor 1.000 14/10/2005 06/11/2005 887.094 EL Greece TNS ICAP 1.000 17/10/2005 05/11/2005 8.674.230 ES Spain TNS Demoscopia 1.015 15/10/2005 05/11/2005 35.882.820 FR France TNS Sofres 1.009 11/10/2005 07/11/2005 44.010.619 IE Ireland TNS MRBI 1.009 13/10/2005 13/11/2005 3.089.775 IT Italy TNS Abacus 1.000 19/10/2005 10/11/2005 49.208.000 CY Rep. of Cyprus Synovate 502 17/10/2005 06/11/2005 552.213 LV Latvia TNS Latvia 1.033 14/10/2005 07/11/2005 1.394.351 LT Lithuania TNS Gallup Lithuania 1.020 15/10/2005 04/11/2005 2.803.661 LU Luxembourg TNS ILReS 510 12/10/2005 05/11/2005 367.199 HU Hungary TNS Hungary 1.000 18/10/2005 06/11/2005 8.503.379 MT Malta MISCO 500 14/10/2005 05/11/2005 322.917 NL Netherlands TNS NIPO 1.041 21/10/2005 13/11/2005 13.242.328
AT Austria Österreichisches Gallup-Institute 1.020 14/10/2005 03/11/2005 6.679.444
PL Poland TNS OBOP 1.000 17/10/2005 07/11/2005 31.610.437 PT Portugal TNS EUROTESTE 1.003 17/10/2005 08/11/2005 8.080.915 SI Slovenia RM PLUS 1.034 11/10/2005 07/11/2005 1.663.869 SK Slovakia TNS AISA SK 1.096 17/10/2005 02/11/2005 4.316.438 FI Finland TNS Gallup Oy 1.028 13/10/2005 09/11/2005 4.279.286 SE Sweden TNS GALLUP 1.033 14/10/2005 06/11/2005 7.376.680 UK United Kingdom TNS UK 1.320 12/10/2005 15/11/2005 47.685.578 BG Bulgaria TNS BBSS 1.001 19/10/2005 31/10/2005 6.695.512 HR Croatia Puls 1.000 13/10/2005 06/11/2005 3.682.826 RO Romania TNS CSOP 1.000 13/10/2005 31/10/2005 18.145.036 TR Turkey TNS PIAR 1.005 14/10/2005 07/11/2005 47.583.830
CY (tcc) Turkish Cypriot Community KADEM 500 14/10/2005 29/10/2005 157.101 TOTAL 29.430 11/10/2005 15/11/2005 442.620.588

For each country a comparison between the sample and the universe was carried out. The Universe description was derived from Eurostat population data or from national statistics offices. For all countries surveyed, a national weighting procedure, using marginal and intercellular weighting, was carried out based on this Universe description. In all countries, gender, age, region and size of locality were introduced in the iteration procedure. For international weighting (i.e. EU averages), TNS Opinion & Social applies the official population figures as provided by EUROSTAT or national statistic offices. The total population figures for input in this post-weighting procedure are listed above. Readers are reminded that survey results are estimations, the accuracy of which, everything being equal, rests upon the sample size and upon the observed percentage. With samples of about 1,000 interviews, the real percentages vary within the following confidence limits:
Observed percentages 10% or 90% 20% or 80% 30% or 70% 40% or 60% 50%
Confidence limits ± 1.9 points ± 2.5 points ± 2.7 points ± 3.0 points ± 3.1 points

TOTALProvide more
information on efficient use of energy
Develop tax incentives to promote efficient use
of energy
Adopt higher efficiency standards for energy
consuming equipment
Control more strictly the application of existing
energy efficiency standards
Other (SPONTANEOUS) DK
UE25 EU25 24924 43% 40% 32% 21% 2% 11%BE 1024 47% 54% 29% 30% 2% 2%CZ 1161 36% 59% 27% 23% 0% 7%DK 1032 59% 44% 49% 16% 1% 4%D-W 1021 40% 46% 41% 21% 2% 8%DE 1534 40% 46% 43% 21% 2% 7%D-E 513 37% 48% 50% 24% 3% 5%EE 1000 44% 45% 26% 20% 1% 16%EL 1000 55% 27% 41% 38% 1% 6%ES 1015 51% 25% 13% 10% 2% 23%FR 1009 44% 31% 32% 30% 4% 10%IE 1009 51% 40% 30% 27% 1% 13%IT 1000 33% 45% 27% 15% 2% 12%CY 502 60% 27% 41% 30% 1% 10%LV 1033 40% 34% 28% 28% 0% 10%LT 1021 33% 30% 21% 26% - 21%LU 510 49% 42% 25% 33% 3% 9%HU 1000 36% 40% 18% 20% 1% 19%MT 500 57% 21% 36% 25% 2% 8%NL 1041 46% 54% 45% 13% 2% 3%AT 1020 47% 46% 26% 24% 2% 11%PL 1000 35% 41% 20% 18% 1% 16%PT 1003 51% 33% 42% 18% 1% 9%SI 1034 50% 53% 36% 29% 1% 7%SK 1096 45% 47% 40% 25% 2% 4%FI 1028 51% 41% 32% 19% 2% 4%SE 1033 52% 62% 26% 22% 2% 4%UK 1320 46% 33% 37% 24% 0% 13%BG 1001 39% 36% 24% 29% 0% 19%HR 1000 53% 24% 27% 28% 0% 10%RO 999 39% 35% 35% 23% 2% 20%TR 1005 44% 21% 25% 18% 0% 25%CY (tcc) 500 48% 38% 19% 23% 1% 13%SexMale 12020 41% 43% 33% 21% 2% 10%Female 12904 44% 37% 30% 20% 2% 13%Age15-24 3803 46% 35% 30% 23% 1% 12%25-39 6615 44% 45% 32% 19% 2% 8%40-54 6370 42% 43% 33% 22% 2% 8%55 + 8136 40% 36% 30% 21% 1% 16%Education (End of)15 6115 41% 32% 26% 18% 2% 19%16-19 9794 44% 40% 32% 23% 2% 10%20+ 6096 42% 51% 38% 20% 2% 5%Still Studying 2428 46% 35% 31% 22% 1% 11%Household composition1 4518 44% 35% 32% 21% 2% 14%2 7867 42% 40% 32% 20% 2% 12%3 4922 42% 41% 31% 22% 2% 10%4+ 7613 43% 42% 32% 20% 2% 10%Left-Right scale(1-4) Left 7017 45% 40% 35% 22% 2% 8%(5-6) Centre 8619 45% 42% 33% 22% 2% 8%(7-10) Right 4713 41% 45% 34% 22% 2% 9%
QA64 Against the background of high energy prices, some are proposing to take new measures that will help people to reduce their consumption of energy. According to you, what should be the public authorities’ priority to help people to reduce their consumption of energy? (MAX. 2 ANSWERS)

Respondent occupation scaleSelf- employed 1917 40% 43% 36% 19% 2% 9%Managers 2686 43% 52% 41% 21% 3% 4%Other white collars 2789 42% 47% 34% 20% 2% 8%Manual workers 5187 45% 42% 29% 21% 2% 10%House persons 2537 43% 34% 25% 18% 1% 17%Unemployed 1442 47% 34% 30% 21% 2% 9%Retired 5939 40% 34% 30% 22% 1% 16%Students 2428 46% 35% 31% 22% 1% 11%Subjective urbanisationRural village 8031 42% 39% 30% 20% 2% 13%Small/ mid size town 10634 42% 40% 32% 21% 2% 12%Large town 6199 45% 42% 33% 22% 2% 8%Leadership++ 2834 40% 47% 38% 24% 2% 6%+ 8181 43% 46% 34% 20% 2% 8%- 8634 44% 39% 32% 23% 2% 10%-- 5274 42% 29% 24% 17% 1% 22%Trust in EUTend to agree 11139 45% 43% 31% 21% 2% 8%Tend to disagree 10782 42% 41% 33% 22% 2% 11%Membership EUA good thing 12526 46% 43% 33% 21% 2% 8%A bad thing 3879 38% 38% 32% 22% 2% 14%Neither good nor bad 7562 42% 39% 30% 22% 1% 12%Benef. EU member.Benefited 13007 45% 43% 33% 21% 2% 8%Not benefited 9001 41% 40% 33% 22% 2% 11%Image of EUPositive 10993 46% 43% 33% 20% 2% 8%Neutral 8467 42% 38% 30% 21% 1% 12%Negative 4924 39% 39% 33% 23% 2% 13%EuroIn favour 14917 45% 44% 34% 21% 2% 7%Against 8378 42% 37% 31% 21% 2% 12%Foreign PolicyIn favour 17018 44% 43% 34% 22% 2% 7%Against 5162 42% 39% 32% 22% 2% 10%ESDPIn favour 19160 44% 42% 33% 22% 2% 8%Against 3747 41% 39% 31% 19% 2% 11%EnlargmentIn favour 12089 45% 42% 31% 21% 2% 7%Against 9828 42% 42% 36% 22% 2% 9%EU Knowledge38777 9793 43% 33% 26% 19% 2% 17%38902 13612 43% 45% 35% 22% 2% 7%38998 1293 41% 45% 39% 23% 3% 6%Satis. life you leadSatisfied 19934 44% 41% 32% 21% 2% 10%Not satisfied 4884 39% 35% 29% 21% 2% 15%Job stabilityConfi-dent 10029 44% 47% 35% 20% 2% 7%Not confident 2078 41% 40% 32% 23% 3% 10%Future of pensionsConfi-dent 6414 44% 42% 29% 19% 1% 9%Not confident 17414 43% 40% 34% 22% 2% 10%Proud to be EuropeanProud 15778 43% 43% 32% 20% 2% 9%Not proud 6928 43% 37% 34% 23% 1% 12%
QA64 Against the background of high energy prices, some are proposing to take new measures that will help people to reduce their consumption of energy. According to you, what should be the public authorities’ priority to help people to reduce their consumption of energy? (MAX. 2 ANSWERS)

TOTAL
Promote advanced research for new
energy technologies (hydrogen, clean
coal, etc.)
Regulate in order to reduce our
dependence of oil
Develop the use of nuclear energy
Develop the use of solar power
Develop the use of wind power
None of these (SPONTANEOUS)
Other (SPONTANEOUS)
DK
UE25 EU25 24924 41% 23% 12% 48% 31% 1% 1% 8%BE 1024 46% 20% 11% 51% 49% 1% 1% 2%CZ 1161 46% 35% 17% 41% 25% 2% 0% 5%DK 1032 61% 13% 4% 45% 59% 0% 0% 4%D-W 1021 52% 20% 16% 55% 26% 1% 0% 5%DE 1534 52% 21% 17% 55% 26% 1% 1% 4%D-E 513 56% 25% 19% 57% 26% 0% 1% 1%EE 1000 37% 14% 8% 35% 54% 1% 2% 15%EL 1000 22% 37% 2% 70% 44% 1% 0% 3%ES 1015 27% 25% 4% 50% 28% 1% - 18%FR 1009 43% 21% 8% 63% 38% 1% 1% 4%IE 1009 40% 29% 7% 32% 52% 0% 1% 10%IT 1000 41% 26% 13% 41% 15% 0% 2% 10%CY 502 25% 51% 2% 76% 22% 0% 0% 6%LV 1033 36% 37% 8% 25% 39% 2% 1% 7%LT 1021 32% 27% 21% 16% 22% 3% 0% 19%LU 510 46% 18% 7% 62% 36% 1% 1% 4%HU 1000 37% 16% 9% 43% 37% 2% 0% 11%MT 500 23% 34% 2% 58% 32% 0% 1% 9%NL 1041 62% 10% 14% 47% 42% 0% 1% 3%AT 1020 36% 36% 5% 54% 35% 2% 1% 5%PL 1000 33% 27% 10% 37% 30% 2% 1% 13%PT 1003 39% 31% 5% 37% 34% 1% 0% 13%SI 1034 42% 29% 5% 60% 39% 1% 1% 5%SK 1096 42% 39% 19% 44% 23% 1% 0% 5%FI 1028 54% 18% 27% 38% 41% 0% 3% 1%SE 1033 55% 25% 32% 31% 41% 0% 1% 2%UK 1320 36% 17% 18% 43% 39% 1% 0% 10%BG 1001 37% 20% 24% 38% 16% 1% 1% 20%HR 1000 36% 17% 5% 60% 40% 1% 0% 8%RO 999 42% 28% 15% 29% 18% 1% 1% 22%TR 1005 31% 33% 15% 27% 9% 1% 0% 26%CY (tcc) 500 52% 10% 10% 50% 11% 2% 1% 13%SexMale 12020 45% 23% 16% 47% 31% 1% 1% 6%Female 12904 38% 24% 9% 49% 32% 1% 0% 10%Age15-24 3803 41% 28% 11% 46% 31% 1% 1% 8%25-39 6615 44% 25% 11% 48% 33% 1% 1% 6%40-54 6370 44% 23% 12% 49% 34% 1% 0% 6%55 + 8136 38% 20% 15% 48% 29% 1% 1% 12%Education (End of)15 6115 30% 21% 10% 49% 29% 1% 1% 15%16-19 9794 41% 24% 12% 50% 33% 1% 0% 6%20+ 6096 53% 23% 16% 46% 32% 1% 1% 3%Still Studying 2428 43% 28% 11% 46% 31% 1% 1% 8%Household composition1 4518 39% 23% 12% 47% 30% 1% 1% 11%2 7867 43% 22% 14% 48% 30% 1% 1% 8%3 4922 40% 23% 12% 48% 33% 1% 1% 8%4+ 7613 41% 25% 11% 49% 33% 1% 1% 7%
QA65 To reduce our dependency on imported energy resources, Governments have to choose from a list of alternatives, sometimes costly solutions. Which of the following should the (NATIONALITY) Government mainly focus on for the years to come? (MAX. 2 ANSWERS)

Left-Right scale(1-4) Left 7017 46% 24% 9% 54% 34% 1% 1% 5%(5-6) Centre 8619 43% 24% 13% 49% 33% 1% 1% 5%(7-10) Right 4713 44% 24% 19% 46% 30% 1% 1% 6%Respondent occupation scaleSelf- employed 1917 47% 24% 13% 47% 29% 1% 1% 4%Managers 2686 57% 22% 18% 45% 30% 1% 1% 3%Other white collars 2789 47% 23% 11% 51% 32% 1% 1% 5%Manual workers 5187 38% 24% 10% 50% 36% 1% 0% 7%House persons 2537 34% 24% 9% 45% 27% 0% 0% 14%Unemployed 1442 35% 26% 14% 50% 34% 1% 1% 7%Retired 5939 36% 20% 14% 48% 31% 1% 1% 12%Students 2428 43% 28% 11% 46% 31% 1% 1% 8%Subjective urbanisationRural village 8031 39% 21% 12% 50% 35% 1% 1% 9%Small/ mid size town 10634 43% 23% 12% 48% 30% 1% 1% 8%Large town 6199 42% 27% 13% 45% 30% 1% 0% 7%Leadership++ 2834 50% 24% 18% 47% 30% 1% 1% 4%+ 8181 44% 25% 13% 47% 32% 1% 1% 6%- 8634 43% 23% 12% 52% 32% 1% 1% 6%-- 5274 30% 20% 9% 44% 30% 1% 0% 17%Trust in EUTend to agree 11139 44% 25% 12% 48% 31% 1% 1% 6%Tend to disagree 10782 40% 22% 14% 50% 33% 1% 1% 7%Membership EUA good thing 12526 47% 24% 13% 49% 30% 1% 1% 5%A bad thing 3879 36% 22% 15% 48% 34% 1% 1% 8%Neither good nor bad 7562 36% 23% 11% 49% 34% 1% 1% 9%Benef. EU member.Benefited 13007 46% 26% 12% 48% 31% 1% 1% 6%Not benefited 9001 39% 22% 14% 51% 33% 1% 1% 7%Image of EUPositive 10993 46% 25% 12% 48% 30% 1% 1% 6%Neutral 8467 38% 23% 12% 49% 32% 1% 0% 9%Negative 4924 40% 20% 14% 50% 35% 1% 1% 8%EuroIn favour 14917 47% 24% 13% 50% 31% 0% 1% 5%Against 8378 34% 23% 13% 47% 33% 1% 1% 9%Foreign PolicyIn favour 17018 46% 24% 13% 50% 31% 1% 1% 5%Against 5162 37% 24% 14% 48% 35% 2% 1% 6%ESDPIn favour 19160 45% 24% 13% 50% 32% 1% 1% 5%Against 3747 35% 23% 15% 45% 33% 2% 1% 7%EnlargmentIn favour 12089 43% 26% 12% 48% 33% 1% 1% 6%Against 9828 43% 22% 15% 51% 32% 1% 1% 5%EU Knowledge38777 9793 34% 22% 9% 47% 31% 1% 1% 13%38902 13612 46% 24% 14% 50% 32% 1% 1% 4%38998 1293 51% 24% 23% 43% 28% 1% 1% 4%Satis. life you leadSatisfied 19934 43% 23% 13% 48% 32% 1% 1% 7%Not satisfied 4884 34% 23% 11% 48% 31% 1% 1% 11%
QA65 To reduce our dependency on imported energy resources, Governments have to choose from a list of alternatives, sometimes costly solutions. Which of the following should the (NATIONALITY) Government mainly focus on for the years to come? (MAX. 2 ANSWERS)

Job stabilityConfi-dent 10029 48% 24% 13% 49% 33% 1% 1% 4%Not confident 2078 39% 23% 12% 49% 33% 1% 1% 7%Future of pensionsConfi-dent 6414 41% 27% 14% 42% 29% 1% 0% 7%Not confident 17414 43% 22% 12% 51% 33% 1% 1% 7%Proud to be EuropeanProud 15778 44% 25% 13% 47% 31% 1% 1% 6%Not proud 6928 38% 20% 13% 52% 34% 1% 1% 8%
QA65 To reduce our dependency on imported energy resources, Governments have to choose from a list of alternatives, sometimes costly solutions. Which of the following should the (NATIONALITY) Government mainly focus on for the years to come? (MAX. 2 ANSWERS)
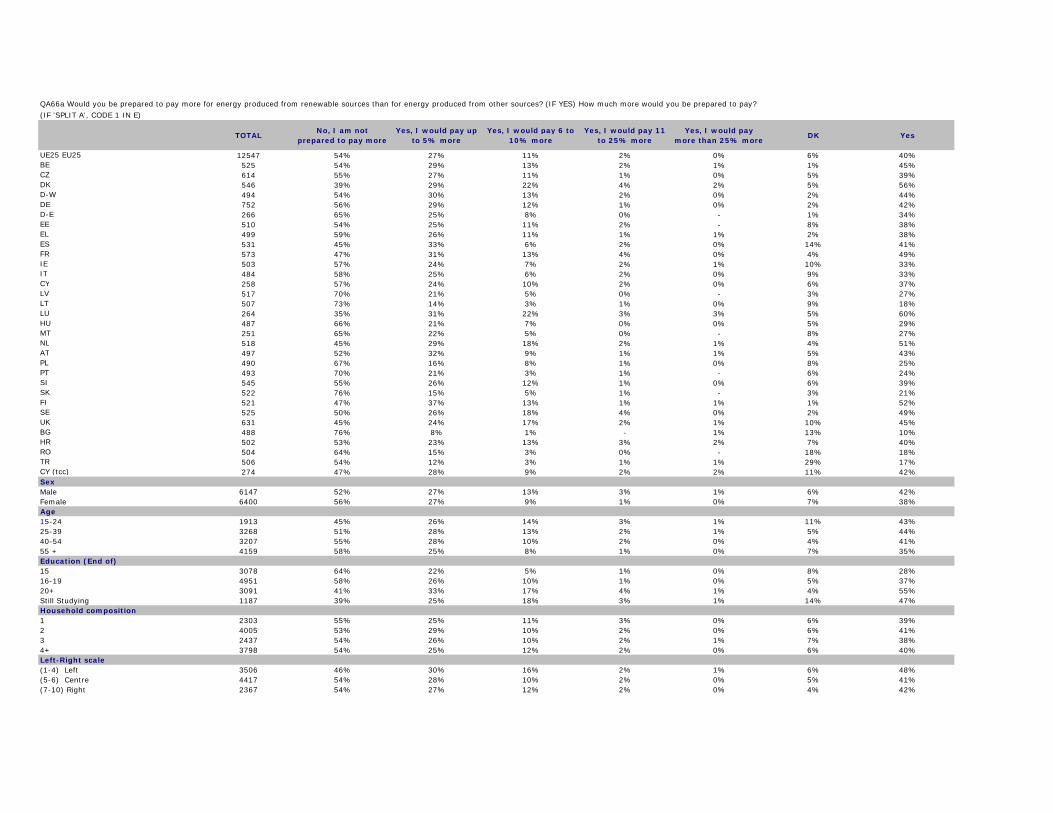
TOTALNo, I am not
prepared to pay moreYes, I would pay up
to 5% moreYes, I would pay 6 to
10% moreYes, I would pay 11
to 25% moreYes, I would pay
more than 25% moreDK Yes
UE25 EU25 12547 54% 27% 11% 2% 0% 6% 40%BE 525 54% 29% 13% 2% 1% 1% 45%CZ 614 55% 27% 11% 1% 0% 5% 39%DK 546 39% 29% 22% 4% 2% 5% 56%D-W 494 54% 30% 13% 2% 0% 2% 44%DE 752 56% 29% 12% 1% 0% 2% 42%D-E 266 65% 25% 8% 0% - 1% 34%EE 510 54% 25% 11% 2% - 8% 38%EL 499 59% 26% 11% 1% 1% 2% 38%ES 531 45% 33% 6% 2% 0% 14% 41%FR 573 47% 31% 13% 4% 0% 4% 49%IE 503 57% 24% 7% 2% 1% 10% 33%IT 484 58% 25% 6% 2% 0% 9% 33%CY 258 57% 24% 10% 2% 0% 6% 37%LV 517 70% 21% 5% 0% - 3% 27%LT 507 73% 14% 3% 1% 0% 9% 18%LU 264 35% 31% 22% 3% 3% 5% 60%HU 487 66% 21% 7% 0% 0% 5% 29%MT 251 65% 22% 5% 0% - 8% 27%NL 518 45% 29% 18% 2% 1% 4% 51%AT 497 52% 32% 9% 1% 1% 5% 43%PL 490 67% 16% 8% 1% 0% 8% 25%PT 493 70% 21% 3% 1% - 6% 24%SI 545 55% 26% 12% 1% 0% 6% 39%SK 522 76% 15% 5% 1% - 3% 21%FI 521 47% 37% 13% 1% 1% 1% 52%SE 525 50% 26% 18% 4% 0% 2% 49%UK 631 45% 24% 17% 2% 1% 10% 45%BG 488 76% 8% 1% - 1% 13% 10%HR 502 53% 23% 13% 3% 2% 7% 40%RO 504 64% 15% 3% 0% - 18% 18%TR 506 54% 12% 3% 1% 1% 29% 17%CY (tcc) 274 47% 28% 9% 2% 2% 11% 42%SexMale 6147 52% 27% 13% 3% 1% 6% 42%Female 6400 56% 27% 9% 1% 0% 7% 38%Age15-24 1913 45% 26% 14% 3% 1% 11% 43%25-39 3268 51% 28% 13% 2% 1% 5% 44%40-54 3207 55% 28% 10% 2% 0% 4% 41%55 + 4159 58% 25% 8% 1% 0% 7% 35%Education (End of)15 3078 64% 22% 5% 1% 0% 8% 28%16-19 4951 58% 26% 10% 1% 0% 5% 37%20+ 3091 41% 33% 17% 4% 1% 4% 55%Still Studying 1187 39% 25% 18% 3% 1% 14% 47%Household composition1 2303 55% 25% 11% 3% 0% 6% 39%2 4005 53% 29% 10% 2% 0% 6% 41%3 2437 54% 26% 10% 2% 1% 7% 38%4+ 3798 54% 25% 12% 2% 0% 6% 40%Left-Right scale(1-4) Left 3506 46% 30% 16% 2% 1% 6% 48%(5-6) Centre 4417 54% 28% 10% 2% 0% 5% 41%(7-10) Right 2367 54% 27% 12% 2% 0% 4% 42%
(IF 'SPLIT A', CODE 1 IN E)
QA66a Would you be prepared to pay more for energy produced from renewable sources than for energy produced from other sources? (IF YES) How much more would you be prepared to pay?

Respondent occupation scaleSelf- employed 990 52% 28% 12% 2% 1% 5% 43%Managers 1338 40% 35% 17% 4% 1% 3% 57%Other white collars 1375 47% 35% 10% 2% 0% 5% 48%Manual workers 2639 57% 24% 11% 2% 0% 5% 37%House persons 1336 59% 25% 6% 1% 0% 8% 33%Unemployed 717 64% 23% 7% 1% 0% 5% 31%Retired 2964 60% 23% 8% 1% 0% 7% 33%Students 1187 39% 25% 18% 3% 1% 14% 47%Subjective urbanisationRural village 4040 58% 25% 8% 1% 1% 7% 35%Small/ mid size town 5340 53% 27% 11% 2% 0% 6% 40%Large town 3141 48% 29% 15% 2% 0% 6% 46%Leadership++ 1434 48% 29% 15% 3% 1% 4% 48%+ 4171 48% 29% 14% 2% 1% 6% 46%- 4263 55% 28% 10% 2% 0% 5% 40%-- 2679 64% 20% 5% 1% 0% 10% 26%Trust in EUTend to agree 5643 49% 30% 12% 3% 1% 6% 45%Tend to disagree 5412 57% 25% 11% 2% 0% 5% 38%Membership EUA good thing 6364 48% 30% 14% 3% 1% 6% 47%A bad thing 1947 62% 23% 8% 1% 0% 6% 33%Neither good nor bad 3764 58% 25% 9% 2% 0% 6% 36%Benef. EU member.Benefited 6615 48% 30% 13% 2% 1% 6% 47%Not benefited 4496 60% 24% 9% 1% 0% 5% 35%Image of EUPositive 5526 46% 30% 14% 3% 0% 6% 48%Neutral 4269 58% 26% 9% 1% 0% 7% 36%Negative 2492 62% 23% 9% 1% 1% 4% 34%EuroIn favour 7552 51% 30% 12% 2% 0% 5% 45%Against 4151 60% 23% 9% 2% 1% 6% 35%Foreign PolicyIn favour 8621 51% 29% 12% 2% 1% 5% 44%Against 2566 57% 26% 10% 3% 0% 4% 39%ESDPIn favour 9642 53% 29% 11% 2% 1% 5% 43%Against 1885 56% 25% 11% 2% 0% 6% 38%EnlargmentIn favour 6065 50% 29% 13% 2% 1% 5% 45%Against 4959 56% 28% 10% 2% 0% 4% 40%EU Knowledge38777 4887 60% 23% 7% 1% 0% 8% 32%38902 6863 50% 30% 13% 2% 1% 4% 46%38998 680 51% 21% 17% 5% 1% 5% 44%Satis. life you leadSatisfied 10012 51% 28% 12% 2% 1% 6% 43%Not satisfied 2485 65% 21% 7% 1% 0% 6% 29%Job stabilityConfi-dent 4979 48% 32% 14% 2% 1% 4% 48%Not confident 1104 64% 21% 8% 2% 1% 4% 32%Future of pensionsConfi-dent 3245 48% 32% 12% 2% 0% 6% 46%Not confident 8772 56% 25% 11% 2% 1% 5% 39%Proud to be EuropeanProud 7968 51% 29% 12% 2% 0% 6% 44%Not proud 3496 60% 23% 10% 2% 0% 4% 36%
QA66a Would you be prepared to pay more for energy produced from renewable sources than for energy produced from other sources? (IF YES) How much more would you be prepared to pay?
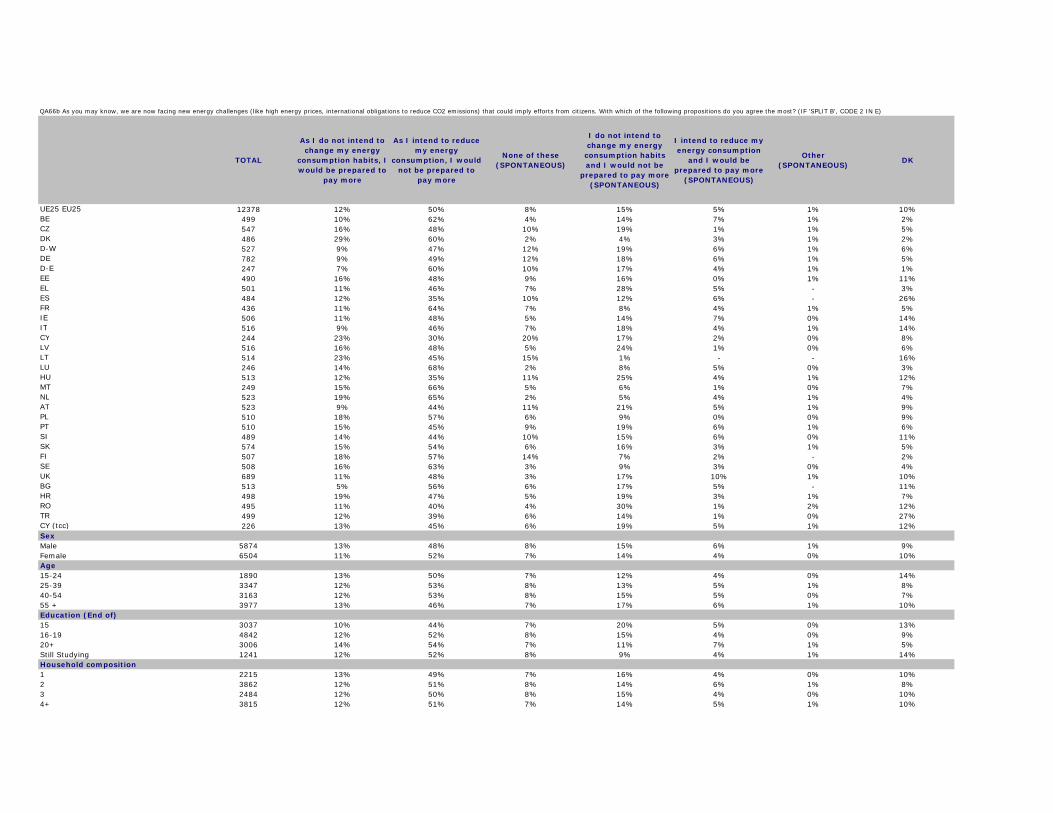
TOTAL
As I do not intend to change my energy
consumption habits, I would be prepared to
pay more
As I intend to reduce my energy
consumption, I would not be prepared to
pay more
None of these (SPONTANEOUS)
I do not intend to change my energy
consumption habits and I would not be
prepared to pay more (SPONTANEOUS)
I intend to reduce my energy consumption
and I would be prepared to pay more
(SPONTANEOUS)
Other (SPONTANEOUS)
DK
UE25 EU25 12378 12% 50% 8% 15% 5% 1% 10%BE 499 10% 62% 4% 14% 7% 1% 2%CZ 547 16% 48% 10% 19% 1% 1% 5%DK 486 29% 60% 2% 4% 3% 1% 2%D-W 527 9% 47% 12% 19% 6% 1% 6%DE 782 9% 49% 12% 18% 6% 1% 5%D-E 247 7% 60% 10% 17% 4% 1% 1%EE 490 16% 48% 9% 16% 0% 1% 11%EL 501 11% 46% 7% 28% 5% - 3%ES 484 12% 35% 10% 12% 6% - 26%FR 436 11% 64% 7% 8% 4% 1% 5%IE 506 11% 48% 5% 14% 7% 0% 14%IT 516 9% 46% 7% 18% 4% 1% 14%CY 244 23% 30% 20% 17% 2% 0% 8%LV 516 16% 48% 5% 24% 1% 0% 6%LT 514 23% 45% 15% 1% - - 16%LU 246 14% 68% 2% 8% 5% 0% 3%HU 513 12% 35% 11% 25% 4% 1% 12%MT 249 15% 66% 5% 6% 1% 0% 7%NL 523 19% 65% 2% 5% 4% 1% 4%AT 523 9% 44% 11% 21% 5% 1% 9%PL 510 18% 57% 6% 9% 0% 0% 9%PT 510 15% 45% 9% 19% 6% 1% 6%SI 489 14% 44% 10% 15% 6% 0% 11%SK 574 15% 54% 6% 16% 3% 1% 5%FI 507 18% 57% 14% 7% 2% - 2%SE 508 16% 63% 3% 9% 3% 0% 4%UK 689 11% 48% 3% 17% 10% 1% 10%BG 513 5% 56% 6% 17% 5% - 11%HR 498 19% 47% 5% 19% 3% 1% 7%RO 495 11% 40% 4% 30% 1% 2% 12%TR 499 12% 39% 6% 14% 1% 0% 27%CY (tcc) 226 13% 45% 6% 19% 5% 1% 12%SexMale 5874 13% 48% 8% 15% 6% 1% 9%Female 6504 11% 52% 7% 14% 4% 0% 10%Age15-24 1890 13% 50% 7% 12% 4% 0% 14%25-39 3347 12% 53% 8% 13% 5% 1% 8%40-54 3163 12% 53% 8% 15% 5% 0% 7%55 + 3977 13% 46% 7% 17% 6% 1% 10%Education (End of)15 3037 10% 44% 7% 20% 5% 0% 13%16-19 4842 12% 52% 8% 15% 4% 0% 9%20+ 3006 14% 54% 7% 11% 7% 1% 5%Still Studying 1241 12% 52% 8% 9% 4% 1% 14%Household composition1 2215 13% 49% 7% 16% 4% 0% 10%2 3862 12% 51% 8% 14% 6% 1% 8%3 2484 12% 50% 8% 15% 4% 0% 10%4+ 3815 12% 51% 7% 14% 5% 1% 10%
QA66b As you may know, we are now facing new energy challenges (like high energy prices, international obligations to reduce CO2 emissions) that could imply efforts from citizens. With which of the following propositions do you agree the most? (IF 'SPLIT B', CODE 2 IN E)

Left-Right scale(1-4) Left 3511 11% 55% 7% 14% 6% 1% 6%(5-6) Centre 4202 12% 54% 7% 15% 5% 1% 8%(7-10) Right 2346 16% 47% 8% 17% 5% 1% 7%Respondent occupation scaleSelf- employed 927 13% 49% 9% 14% 6% 1% 8%Managers 1348 13% 54% 8% 10% 8% 1% 4%Other white collars 1414 10% 58% 7% 11% 5% 0% 8%Manual workers 2548 12% 50% 8% 17% 5% 0% 9%House persons 1201 13% 45% 5% 17% 5% 1% 15%Unemployed 725 12% 52% 10% 18% 2% 1% 6%Retired 2975 13% 47% 8% 17% 5% 0% 11%Students 1241 12% 52% 8% 9% 4% 1% 14%Subjective urbanisationRural village 3992 13% 51% 8% 13% 4% 0% 10%Small/ mid size town 5294 12% 50% 7% 16% 5% 1% 10%Large town 3058 12% 51% 8% 15% 6% 1% 8%Leadership++ 1400 14% 51% 7% 13% 7% 1% 5%+ 4010 12% 54% 8% 13% 6% 1% 7%- 4371 12% 51% 7% 16% 4% 1% 8%-- 2596 11% 43% 8% 17% 3% 0% 18%Trust in EUTend to agree 5496 14% 51% 6% 13% 5% 0% 9%Tend to disagree 5370 12% 51% 9% 16% 5% 1% 7%Membership EUA good thing 6162 14% 51% 7% 13% 6% 1% 9%A bad thing 1932 11% 51% 10% 15% 5% 1% 7%Neither good nor bad 3799 11% 50% 8% 17% 4% 1% 9%Benef. EU member.Benefited 6391 15% 51% 6% 13% 5% 0% 9%Not benefited 4506 10% 52% 10% 17% 4% 1% 7%Image of EUPositive 5467 14% 51% 6% 12% 6% 1% 9%Neutral 4198 11% 50% 9% 17% 4% 0% 9%Negative 2433 11% 50% 9% 16% 5% 1% 7%EuroIn favour 7366 13% 53% 7% 14% 5% 1% 7%Against 4227 12% 49% 8% 17% 5% 1% 9%Foreign PolicyIn favour 8398 13% 53% 7% 14% 5% 1% 7%Against 2596 13% 48% 9% 17% 6% 0% 6%ESDPIn favour 9518 13% 53% 7% 14% 5% 1% 8%Against 1862 13% 47% 9% 18% 7% 0% 6%EnlargmentIn favour 6024 13% 52% 7% 13% 5% 0% 8%Against 4869 12% 52% 8% 16% 5% 1% 6%EU Knowledge38777 4905 11% 47% 8% 17% 4% 0% 13%38902 6749 13% 54% 7% 13% 6% 1% 7%38998 613 16% 47% 9% 17% 7% 1% 4%Satis. life you leadSatisfied 9922 13% 51% 7% 14% 5% 0% 10%Not satisfied 2399 10% 47% 10% 20% 4% 1% 8%Job stabilityConfi-dent 5050 12% 54% 8% 13% 6% 1% 7%Not confident 974 12% 51% 9% 15% 5% 0% 8%Future of pensionsConfi-dent 3169 16% 50% 8% 13% 5% 0% 9%Not confident 8642 11% 52% 7% 16% 5% 1% 8%
QA66b As you may know, we are now facing new energy challenges (like high energy prices, international obligations to reduce CO2 emissions) that could imply efforts from citizens. With which of the following propositions do you agree the most? (IF 'SPLIT B', CODE 2 IN E)

Proud to be EuropeanProud 7809 14% 52% 7% 12% 5% 1% 9%Not proud 3432 10% 49% 9% 19% 5% 1% 7%
QA66b As you may know, we are now facing new energy challenges (like high energy prices, international obligations to reduce CO2 emissions) that could imply efforts from citizens. With which of the following propositions do you agree the most? (IF 'SPLIT B', CODE 2 IN E)

TOTAL The European level The national level The local level DKUE25 EU25 24924 47% 37% 8% 7%BE 1024 58% 31% 9% 2%CZ 1161 48% 43% 4% 4%DK 1032 45% 46% 6% 3%D-W 1021 51% 37% 8% 4%DE 1534 51% 36% 9% 4%D-E 513 53% 36% 9% 2%EE 1000 29% 44% 10% 17%EL 1000 61% 31% 6% 1%ES 1015 53% 26% 6% 14%FR 1009 50% 36% 10% 5%IE 1009 38% 37% 13% 13%IT 1000 59% 29% 6% 7%CY 502 62% 22% 7% 9%LV 1033 50% 37% 7% 5%LT 1021 45% 36% 8% 11%LU 510 50% 36% 10% 3%HU 1000 42% 30% 16% 12%MT 500 36% 43% 16% 4%NL 1041 59% 36% 3% 2%AT 1020 45% 37% 7% 11%PL 1000 38% 40% 12% 10%PT 1003 51% 30% 6% 12%SI 1034 48% 39% 6% 7%SK 1096 38% 49% 10% 3%FI 1028 23% 57% 19% 2%SE 1033 34% 47% 16% 3%UK 1320 27% 55% 10% 8%BG 1001 26% 50% 9% 15%HR 1000 39% 40% 12% 9%RO 999 39% 31% 10% 20%TR 1005 32% 35% 16% 17%CY (tcc) 500 49% 28% 11% 12%SexMale 12020 51% 36% 8% 6%Female 12904 43% 39% 9% 8%Age15-24 3803 52% 34% 8% 6%25-39 6615 52% 35% 8% 5%40-54 6370 49% 37% 9% 6%55 + 8136 40% 41% 9% 10%Education (End of)15 6115 37% 41% 10% 11%16-19 9794 47% 38% 9% 6%20+ 6096 55% 34% 7% 3%Still Studying 2428 54% 33% 6% 6%Household composition1 4518 44% 38% 9% 9%2 7867 46% 38% 9% 8%3 4922 48% 39% 8% 6%4+ 7613 50% 36% 8% 6%Left-Right scale(1-4) Left 7017 53% 34% 8% 4%(5-6) Centre 8619 47% 39% 9% 5%(7-10) Right 4713 46% 41% 8% 4%
QA67 In order to respond to the new energy challenges that we have to face for the years to come, what is, according to you, the most appropriate level to take decisions?

Respondent occupation scaleSelf- employed 1917 52% 35% 9% 4%Managers 2686 56% 36% 5% 3%Other white collars 2789 54% 35% 7% 4%Manual workers 5187 47% 37% 9% 7%House persons 2537 41% 37% 10% 12%Unemployed 1442 46% 37% 11% 6%Retired 5939 38% 42% 10% 10%Students 2428 54% 33% 6% 6%Subjective urbanisationRural village 8031 44% 39% 9% 8%Small/ mid size town 10634 49% 36% 8% 7%Large town 6199 48% 38% 8% 6%Leadership++ 2834 54% 35% 8% 3%+ 8181 51% 38% 7% 4%- 8634 47% 38% 9% 6%-- 5274 37% 37% 10% 15%Trust in EUTend to agree 11139 59% 29% 7% 5%Tend to disagree 10782 38% 46% 10% 6%Membership EUA good thing 12526 60% 29% 7% 4%A bad thing 3879 25% 54% 13% 8%Neither good nor bad 7562 40% 44% 9% 8%Benef. EU member.Benefited 13007 58% 30% 7% 5%Not benefited 9001 35% 49% 11% 6%Image of EUPositive 10993 62% 28% 6% 5%Neutral 8467 41% 42% 9% 8%Negative 4924 28% 52% 13% 7%EuroIn favour 14917 57% 32% 7% 4%Against 8378 32% 49% 11% 8%Foreign PolicyIn favour 17018 56% 33% 7% 4%Against 5162 29% 54% 11% 6%ESDPIn favour 19160 54% 34% 8% 4%Against 3747 26% 57% 11% 7%EnlargmentIn favour 12089 56% 32% 8% 4%Against 9828 40% 46% 9% 5%EU Knowledge38777 9793 39% 40% 10% 11%38902 13612 53% 36% 8% 4%38998 1293 55% 36% 7% 3%Satis. life you leadSatisfied 19934 49% 37% 8% 6%Not satisfied 4884 41% 41% 9% 9%Job stabilityConfi-dent 10029 53% 36% 7% 4%Not confident 2078 47% 38% 9% 6%Future of pensionsConfi-dent 6414 51% 37% 7% 5%Not confident 17414 47% 38% 9% 6%Proud to be EuropeanProud 15778 55% 33% 7% 5%Not proud 6928 33% 48% 12% 7%
QA67 In order to respond to the new energy challenges that we have to face for the years to come, what is, according to you, the most appropriate level to take decisions?

TOTAL A lot of attention A little attention No attention at all DKUE25 EU25 24924 43% 33% 23% 2%BE 1024 44% 36% 20% 0%CZ 1161 55% 32% 11% 1%DK 1032 46% 36% 16% 1%D-W 1021 35% 41% 22% 1%DE 1534 38% 40% 21% 1%D-E 513 49% 36% 15% 0%EE 1000 45% 35% 16% 3%EL 1000 30% 30% 41% 0%ES 1015 27% 37% 34% 1%FR 1009 48% 26% 24% 1%IE 1009 23% 30% 45% 2%IT 1000 56% 29% 12% 3%CY 502 37% 32% 30% 1%LV 1033 51% 27% 21% 1%LT 1021 40% 36% 21% 2%LU 510 41% 29% 30% 0%HU 1000 56% 29% 14% 1%MT 500 58% 29% 13% 1%NL 1041 38% 36% 26% 1%AT 1020 37% 35% 26% 2%PL 1000 57% 23% 19% 1%PT 1003 48% 28% 22% 2%SI 1034 43% 37% 18% 2%SK 1096 46% 37% 16% 1%FI 1028 28% 40% 32% 1%SE 1033 32% 38% 29% 0%UK 1320 35% 33% 28% 4%BG 1001 38% 31% 26% 5%HR 1000 33% 31% 36% 1%RO 999 53% 31% 14% 2%TR 1005 60% 21% 16% 4%CY (tcc) 500 51% 28% 21% 1%SexMale 12020 43% 33% 23% 2%Female 12904 43% 32% 23% 2%Age15-24 3803 28% 32% 37% 3%25-39 6615 41% 35% 23% 1%40-54 6370 46% 33% 20% 1%55 + 8136 48% 31% 19% 2%Education (End of)15 6115 45% 31% 23% 2%16-19 9794 45% 32% 22% 1%20+ 6096 45% 34% 20% 1%Still Studying 2428 27% 34% 34% 4%Household composition1 4518 40% 32% 26% 2%2 7867 45% 33% 20% 2%3 4922 42% 33% 23% 1%4+ 7613 42% 32% 24% 2%Left-Right scale(1-4) Left 7017 44% 33% 22% 1%(5-6) Centre 8619 43% 34% 22% 1%(7-10) Right 4713 44% 32% 22% 1%
A light bulb
QA68.1 I am going to show you a list of products or equipment. When you decide to buy a new one, please tell me whether you pay a lot of attention, a little attention or no attention at all to the energy it uses or not?

Respondent occupation scaleSelf- employed 1917 48% 31% 20% 1%Managers 2686 43% 37% 20% 0%Other white collars 2789 43% 35% 20% 1%Manual workers 5187 42% 33% 24% 1%House persons 2537 42% 33% 23% 2%Unemployed 1442 41% 30% 28% 1%Retired 5939 49% 30% 19% 2%Students 2428 27% 34% 34% 4%Subjective urbanisationRural village 8031 43% 32% 23% 2%Small/ mid size town 10634 44% 32% 22% 2%Large town 6199 40% 36% 23% 1%Leadership++ 2834 48% 33% 17% 1%+ 8181 43% 35% 21% 1%- 8634 43% 32% 23% 1%-- 5274 38% 30% 29% 3%Trust in EUTend to agree 11139 43% 33% 23% 1%Tend to disagree 10782 43% 32% 23% 2%Membership EUA good thing 12526 43% 33% 23% 1%A bad thing 3879 44% 31% 23% 2%Neither good nor bad 7562 44% 33% 22% 1%Benef. EU member.Benefited 13007 42% 33% 23% 1%Not benefited 9001 45% 32% 22% 1%Image of EUPositive 10993 43% 34% 22% 1%Neutral 8467 41% 34% 24% 1%Negative 4924 45% 30% 24% 2%EuroIn favour 14917 44% 34% 21% 1%Against 8378 43% 31% 25% 1%Foreign PolicyIn favour 17018 45% 33% 21% 1%Against 5162 40% 34% 25% 2%ESDPIn favour 19160 44% 33% 22% 1%Against 3747 41% 32% 26% 1%EnlargmentIn favour 12089 44% 33% 22% 1%Against 9828 44% 32% 23% 1%EU Knowledge38777 9793 40% 31% 27% 2%38902 13612 45% 34% 20% 1%38998 1293 43% 34% 21% 2%Satis. life you leadSatisfied 19934 42% 33% 23% 2%Not satisfied 4884 48% 29% 21% 1%Job stabilityConfi-dent 10029 43% 35% 22% 1%Not confident 2078 48% 31% 20% 0%Future of pensionsConfi-dent 6414 38% 36% 25% 1%Not confident 17414 45% 32% 22% 1%Proud to be EuropeanProud 15778 44% 33% 21% 1%Not proud 6928 41% 32% 26% 1%
A light bulb
QA68.1 I am going to show you a list of products or equipment. When you decide to buy a new one, please tell me whether you pay a lot of attention, a little attention or no attention at all to the energy it uses or not?
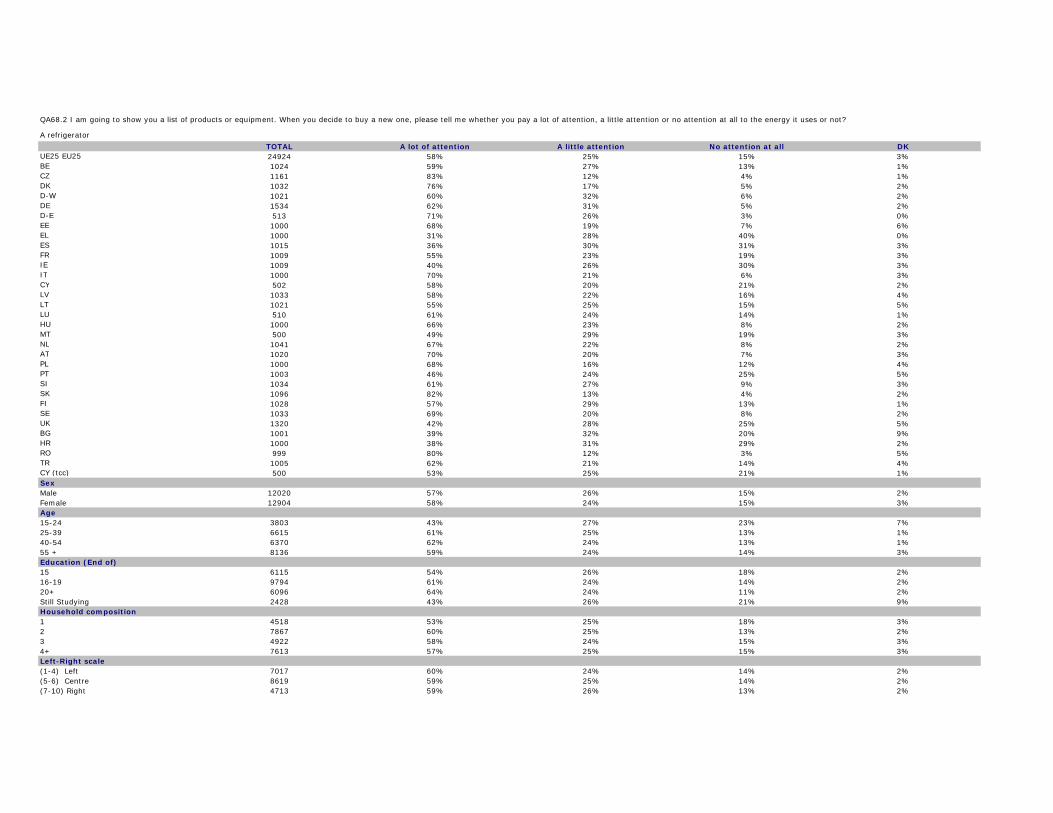
TOTAL A lot of attention A little attention No attention at all DKUE25 EU25 24924 58% 25% 15% 3%BE 1024 59% 27% 13% 1%CZ 1161 83% 12% 4% 1%DK 1032 76% 17% 5% 2%D-W 1021 60% 32% 6% 2%DE 1534 62% 31% 5% 2%D-E 513 71% 26% 3% 0%EE 1000 68% 19% 7% 6%EL 1000 31% 28% 40% 0%ES 1015 36% 30% 31% 3%FR 1009 55% 23% 19% 3%IE 1009 40% 26% 30% 3%IT 1000 70% 21% 6% 3%CY 502 58% 20% 21% 2%LV 1033 58% 22% 16% 4%LT 1021 55% 25% 15% 5%LU 510 61% 24% 14% 1%HU 1000 66% 23% 8% 2%MT 500 49% 29% 19% 3%NL 1041 67% 22% 8% 2%AT 1020 70% 20% 7% 3%PL 1000 68% 16% 12% 4%PT 1003 46% 24% 25% 5%SI 1034 61% 27% 9% 3%SK 1096 82% 13% 4% 2%FI 1028 57% 29% 13% 1%SE 1033 69% 20% 8% 2%UK 1320 42% 28% 25% 5%BG 1001 39% 32% 20% 9%HR 1000 38% 31% 29% 2%RO 999 80% 12% 3% 5%TR 1005 62% 21% 14% 4%CY (tcc) 500 53% 25% 21% 1%SexMale 12020 57% 26% 15% 2%Female 12904 58% 24% 15% 3%Age15-24 3803 43% 27% 23% 7%25-39 6615 61% 25% 13% 1%40-54 6370 62% 24% 13% 1%55 + 8136 59% 24% 14% 3%Education (End of)15 6115 54% 26% 18% 2%16-19 9794 61% 24% 14% 2%20+ 6096 64% 24% 11% 2%Still Studying 2428 43% 26% 21% 9%Household composition1 4518 53% 25% 18% 3%2 7867 60% 25% 13% 2%3 4922 58% 24% 15% 3%4+ 7613 57% 25% 15% 3%Left-Right scale(1-4) Left 7017 60% 24% 14% 2%(5-6) Centre 8619 59% 25% 14% 2%(7-10) Right 4713 59% 26% 13% 2%
A refrigerator
QA68.2 I am going to show you a list of products or equipment. When you decide to buy a new one, please tell me whether you pay a lot of attention, a little attention or no attention at all to the energy it uses or not?
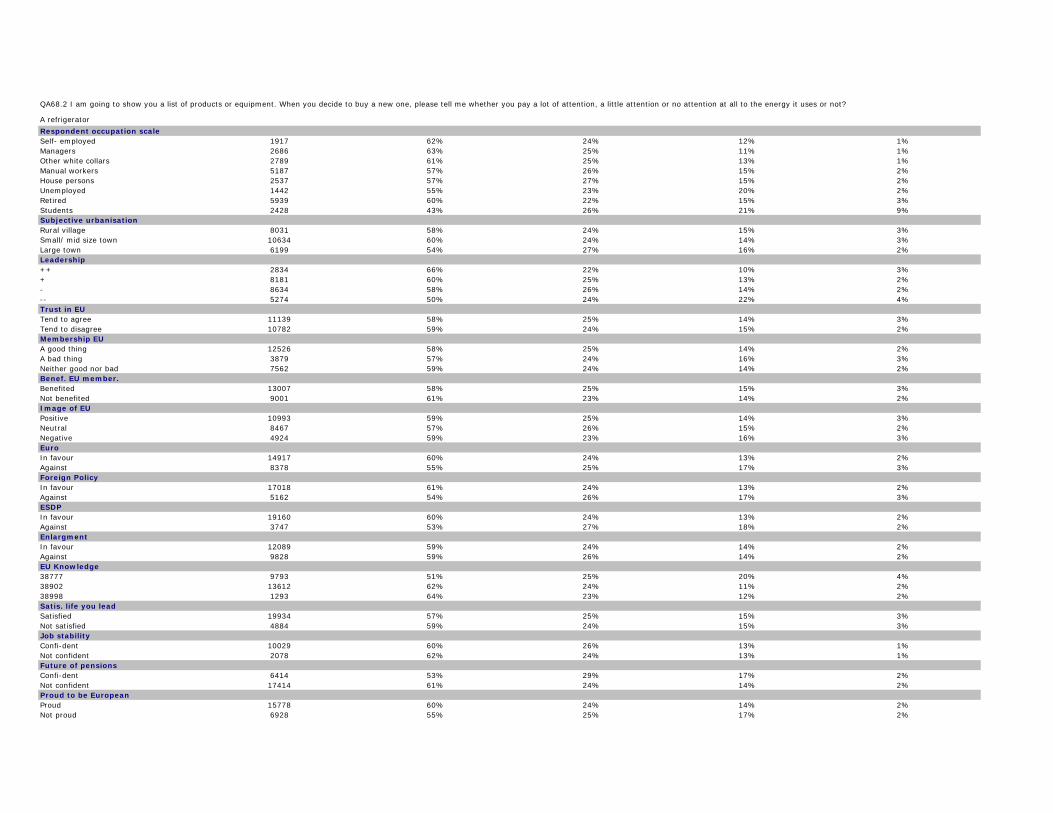
Respondent occupation scaleSelf- employed 1917 62% 24% 12% 1%Managers 2686 63% 25% 11% 1%Other white collars 2789 61% 25% 13% 1%Manual workers 5187 57% 26% 15% 2%House persons 2537 57% 27% 15% 2%Unemployed 1442 55% 23% 20% 2%Retired 5939 60% 22% 15% 3%Students 2428 43% 26% 21% 9%Subjective urbanisationRural village 8031 58% 24% 15% 3%Small/ mid size town 10634 60% 24% 14% 3%Large town 6199 54% 27% 16% 2%Leadership++ 2834 66% 22% 10% 3%+ 8181 60% 25% 13% 2%- 8634 58% 26% 14% 2%-- 5274 50% 24% 22% 4%Trust in EUTend to agree 11139 58% 25% 14% 3%Tend to disagree 10782 59% 24% 15% 2%Membership EUA good thing 12526 58% 25% 14% 2%A bad thing 3879 57% 24% 16% 3%Neither good nor bad 7562 59% 24% 14% 2%Benef. EU member.Benefited 13007 58% 25% 15% 3%Not benefited 9001 61% 23% 14% 2%Image of EUPositive 10993 59% 25% 14% 3%Neutral 8467 57% 26% 15% 2%Negative 4924 59% 23% 16% 3%EuroIn favour 14917 60% 24% 13% 2%Against 8378 55% 25% 17% 3%Foreign PolicyIn favour 17018 61% 24% 13% 2%Against 5162 54% 26% 17% 3%ESDPIn favour 19160 60% 24% 13% 2%Against 3747 53% 27% 18% 2%EnlargmentIn favour 12089 59% 24% 14% 2%Against 9828 59% 26% 14% 2%EU Knowledge38777 9793 51% 25% 20% 4%38902 13612 62% 24% 11% 2%38998 1293 64% 23% 12% 2%Satis. life you leadSatisfied 19934 57% 25% 15% 3%Not satisfied 4884 59% 24% 15% 3%Job stabilityConfi-dent 10029 60% 26% 13% 1%Not confident 2078 62% 24% 13% 1%Future of pensionsConfi-dent 6414 53% 29% 17% 2%Not confident 17414 61% 24% 14% 2%Proud to be EuropeanProud 15778 60% 24% 14% 2%Not proud 6928 55% 25% 17% 2%
A refrigerator
QA68.2 I am going to show you a list of products or equipment. When you decide to buy a new one, please tell me whether you pay a lot of attention, a little attention or no attention at all to the energy it uses or not?

TOTAL A lot of attention A little attention No attention at all DKUE25 EU25 24924 59% 18% 12% 10%BE 1024 62% 25% 7% 6%CZ 1161 82% 7% 5% 6%DK 1032 57% 26% 10% 7%D-W 1021 65% 20% 9% 5%DE 1534 64% 22% 9% 6%D-E 513 59% 26% 7% 8%EE 1000 62% 12% 5% 20%EL 1000 47% 19% 25% 9%ES 1015 39% 19% 29% 13%FR 1009 61% 22% 8% 8%IE 1009 52% 19% 20% 8%IT 1000 74% 14% 6% 7%CY 502 81% 7% 9% 4%LV 1033 51% 9% 13% 27%LT 1021 61% 14% 5% 21%LU 510 62% 23% 12% 3%HU 1000 49% 13% 12% 26%MT 500 67% 13% 7% 12%NL 1041 58% 24% 12% 6%AT 1020 75% 11% 6% 8%PL 1000 62% 8% 9% 21%PT 1003 49% 15% 18% 17%SI 1034 71% 17% 6% 6%SK 1096 77% 7% 6% 10%FI 1028 56% 24% 13% 7%SE 1033 70% 20% 6% 4%UK 1320 46% 23% 19% 12%BG 1001 36% 12% 15% 36%HR 1000 61% 16% 10% 12%RO 999 72% 5% 4% 19%TR 1005 59% 10% 10% 20%CY (tcc) 500 63% 13% 17% 7%SexMale 12020 64% 19% 11% 6%Female 12904 55% 17% 13% 14%Age15-24 3803 56% 18% 16% 10%25-39 6615 64% 20% 11% 5%40-54 6370 64% 19% 11% 7%55 + 8136 54% 16% 12% 17%Education (End of)15 6115 50% 16% 16% 17%16-19 9794 62% 19% 11% 8%20+ 6096 67% 20% 8% 5%Still Studying 2428 57% 17% 14% 12%Household composition1 4518 50% 15% 15% 20%2 7867 60% 19% 11% 10%3 4922 62% 19% 11% 7%4+ 7613 62% 19% 12% 7%Left-Right scale(1-4) Left 7017 62% 19% 10% 9%(5-6) Centre 8619 59% 20% 12% 9%(7-10) Right 4713 63% 17% 12% 8%
A car
QA68.3 I am going to show you a list of products or equipment. When you decide to buy a new one, please tell me whether you pay a lot of attention, a little attention or no attention at all to the energy it uses or not?

Respondent occupation scaleSelf- employed 1917 69% 19% 10% 2%Managers 2686 66% 23% 9% 2%Other white collars 2789 66% 20% 11% 3%Manual workers 5187 62% 20% 12% 6%House persons 2537 52% 19% 16% 13%Unemployed 1442 56% 18% 14% 13%Retired 5939 53% 15% 12% 21%Students 2428 57% 17% 14% 12%Subjective urbanisationRural village 8031 59% 19% 13% 9%Small/ mid size town 10634 61% 17% 11% 10%Large town 6199 56% 19% 12% 12%Leadership++ 2834 70% 17% 7% 6%+ 8181 64% 19% 9% 7%- 8634 60% 19% 12% 10%-- 5274 45% 17% 20% 18%Trust in EUTend to agree 11139 62% 18% 11% 9%Tend to disagree 10782 60% 19% 12% 9%Membership EUA good thing 12526 61% 19% 12% 8%A bad thing 3879 57% 19% 12% 12%Neither good nor bad 7562 60% 18% 12% 11%Benef. EU member.Benefited 13007 61% 18% 12% 8%Not benefited 9001 60% 18% 11% 10%Image of EUPositive 10993 62% 19% 11% 8%Neutral 8467 57% 18% 13% 12%Negative 4924 59% 18% 13% 11%EuroIn favour 14917 64% 19% 10% 7%Against 8378 54% 18% 15% 13%Foreign PolicyIn favour 17018 63% 18% 11% 8%Against 5162 56% 21% 13% 9%ESDPIn favour 19160 63% 18% 11% 8%Against 3747 55% 21% 15% 9%EnlargmentIn favour 12089 62% 18% 11% 9%Against 9828 61% 20% 11% 8%EU Knowledge38777 9793 51% 18% 16% 15%38902 13612 65% 19% 9% 7%38998 1293 69% 16% 11% 5%Satis. life you leadSatisfied 19934 60% 19% 12% 8%Not satisfied 4884 57% 14% 13% 17%Job stabilityConfi-dent 10029 65% 21% 11% 3%Not confident 2078 67% 17% 10% 6%Future of pensionsConfi-dent 6414 54% 22% 15% 9%Not confident 17414 62% 17% 11% 10%Proud to be EuropeanProud 15778 62% 18% 11% 8%Not proud 6928 56% 19% 14% 11%
A car
QA68.3 I am going to show you a list of products or equipment. When you decide to buy a new one, please tell me whether you pay a lot of attention, a little attention or no attention at all to the energy it uses or not?

TOTAL A lot less often A bit less often As oftenNot applicable
(SPONTANEOUS)DK
UE25 EU25 24924 22% 31% 26% 18% 4%BE 1024 26% 40% 21% 12% 1%CZ 1161 33% 27% 20% 16% 4%DK 1032 11% 34% 34% 19% 1%D-W 1021 27% 35% 22% 13% 3%DE 1534 26% 36% 22% 14% 3%D-E 513 22% 38% 22% 17% 2%EE 1000 13% 25% 18% 41% 3%EL 1000 24% 24% 27% 24% 1%ES 1015 15% 22% 30% 27% 6%FR 1009 20% 39% 27% 12% 2%IE 1009 13% 23% 40% 19% 5%IT 1000 25% 35% 25% 9% 5%CY 502 16% 35% 39% 8% 2%LV 1033 25% 21% 17% 34% 4%LT 1021 28% 30% 13% 13% 16%LU 510 21% 36% 32% 9% 3%HU 1000 19% 24% 15% 30% 11%MT 500 16% 31% 36% 16% 1%NL 1041 13% 34% 38% 14% 1%AT 1020 30% 32% 17% 16% 6%PL 1000 31% 20% 13% 30% 5%PT 1003 21% 20% 23% 34% 2%SI 1034 9% 31% 47% 12% 1%SK 1096 32% 27% 19% 18% 4%FI 1028 18% 34% 29% 19% 1%SE 1033 27% 37% 26% 9% 1%UK 1320 13% 27% 35% 24% 1%BG 1001 24% 13% 7% 27% 29%HR 1000 26% 23% 27% 16% 8%RO 999 21% 19% 12% 26% 21%TR 1005 15% 10% 6% 56% 13%CY (tcc) 500 13% 31% 35% 18% 3%SexMale 12020 22% 33% 28% 14% 3%Female 12904 22% 29% 23% 23% 4%Age15-24 3803 23% 30% 17% 26% 5%25-39 6615 23% 34% 31% 10% 2%40-54 6370 21% 32% 33% 11% 3%55 + 8136 21% 28% 20% 27% 4%Education (End of)15 6115 20% 25% 21% 28% 5%16-19 9794 23% 33% 28% 14% 3%20+ 6096 21% 36% 32% 9% 2%Still Studying 2428 23% 28% 13% 30% 6%Household composition1 4518 19% 24% 20% 34% 4%2 7867 22% 33% 26% 16% 4%3 4922 24% 31% 27% 15% 3%4+ 7613 22% 32% 28% 14% 4%Left-Right scale(1-4) Left 7017 23% 34% 24% 16% 3%(5-6) Centre 8619 21% 32% 28% 17% 3%(7-10) Right 4713 21% 32% 28% 17% 2%
QA69 Let’s suppose the price per litre of unleaded fuel\ diesel reaches 2 euros. Would you use your car a lot less often, a bit less often or as often?
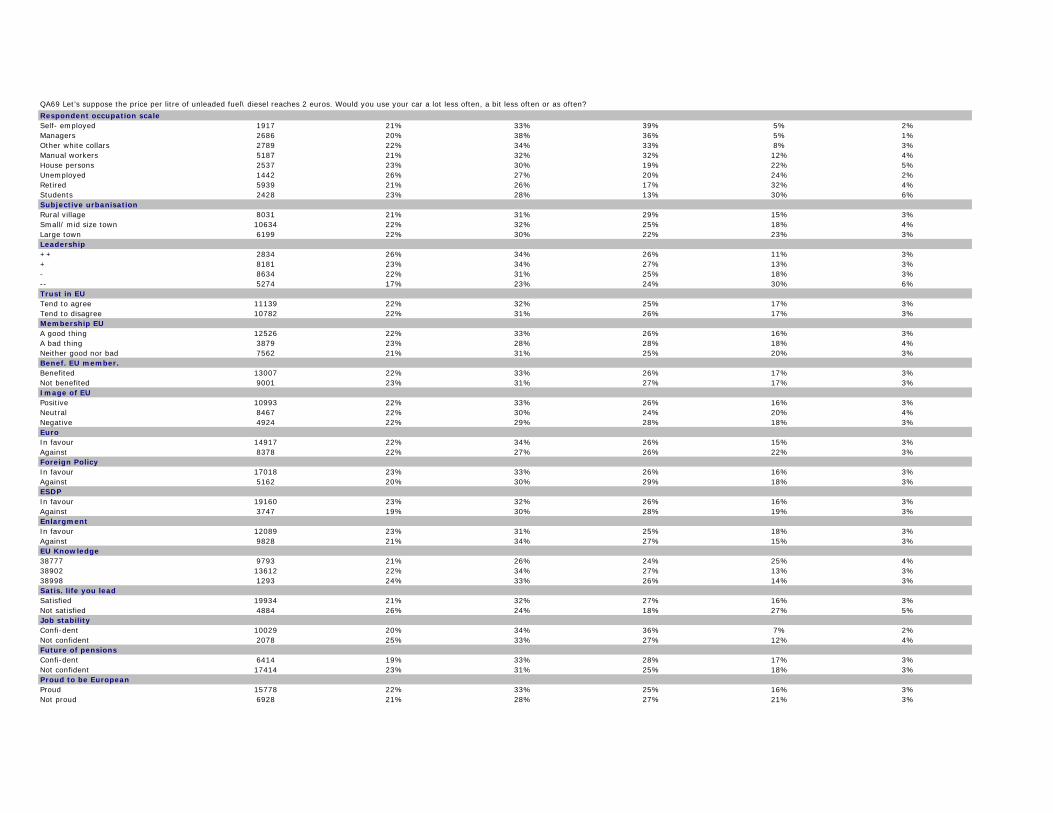
Respondent occupation scaleSelf- employed 1917 21% 33% 39% 5% 2%Managers 2686 20% 38% 36% 5% 1%Other white collars 2789 22% 34% 33% 8% 3%Manual workers 5187 21% 32% 32% 12% 4%House persons 2537 23% 30% 19% 22% 5%Unemployed 1442 26% 27% 20% 24% 2%Retired 5939 21% 26% 17% 32% 4%Students 2428 23% 28% 13% 30% 6%Subjective urbanisationRural village 8031 21% 31% 29% 15% 3%Small/ mid size town 10634 22% 32% 25% 18% 4%Large town 6199 22% 30% 22% 23% 3%Leadership++ 2834 26% 34% 26% 11% 3%+ 8181 23% 34% 27% 13% 3%- 8634 22% 31% 25% 18% 3%-- 5274 17% 23% 24% 30% 6%Trust in EUTend to agree 11139 22% 32% 25% 17% 3%Tend to disagree 10782 22% 31% 26% 17% 3%Membership EUA good thing 12526 22% 33% 26% 16% 3%A bad thing 3879 23% 28% 28% 18% 4%Neither good nor bad 7562 21% 31% 25% 20% 3%Benef. EU member.Benefited 13007 22% 33% 26% 17% 3%Not benefited 9001 23% 31% 27% 17% 3%Image of EUPositive 10993 22% 33% 26% 16% 3%Neutral 8467 22% 30% 24% 20% 4%Negative 4924 22% 29% 28% 18% 3%EuroIn favour 14917 22% 34% 26% 15% 3%Against 8378 22% 27% 26% 22% 3%Foreign PolicyIn favour 17018 23% 33% 26% 16% 3%Against 5162 20% 30% 29% 18% 3%ESDPIn favour 19160 23% 32% 26% 16% 3%Against 3747 19% 30% 28% 19% 3%EnlargmentIn favour 12089 23% 31% 25% 18% 3%Against 9828 21% 34% 27% 15% 3%EU Knowledge38777 9793 21% 26% 24% 25% 4%38902 13612 22% 34% 27% 13% 3%38998 1293 24% 33% 26% 14% 3%Satis. life you leadSatisfied 19934 21% 32% 27% 16% 3%Not satisfied 4884 26% 24% 18% 27% 5%Job stabilityConfi-dent 10029 20% 34% 36% 7% 2%Not confident 2078 25% 33% 27% 12% 4%Future of pensionsConfi-dent 6414 19% 33% 28% 17% 3%Not confident 17414 23% 31% 25% 18% 3%Proud to be EuropeanProud 15778 22% 33% 25% 16% 3%Not proud 6928 21% 28% 27% 21% 3%
QA69 Let’s suppose the price per litre of unleaded fuel\ diesel reaches 2 euros. Would you use your car a lot less often, a bit less often or as often?
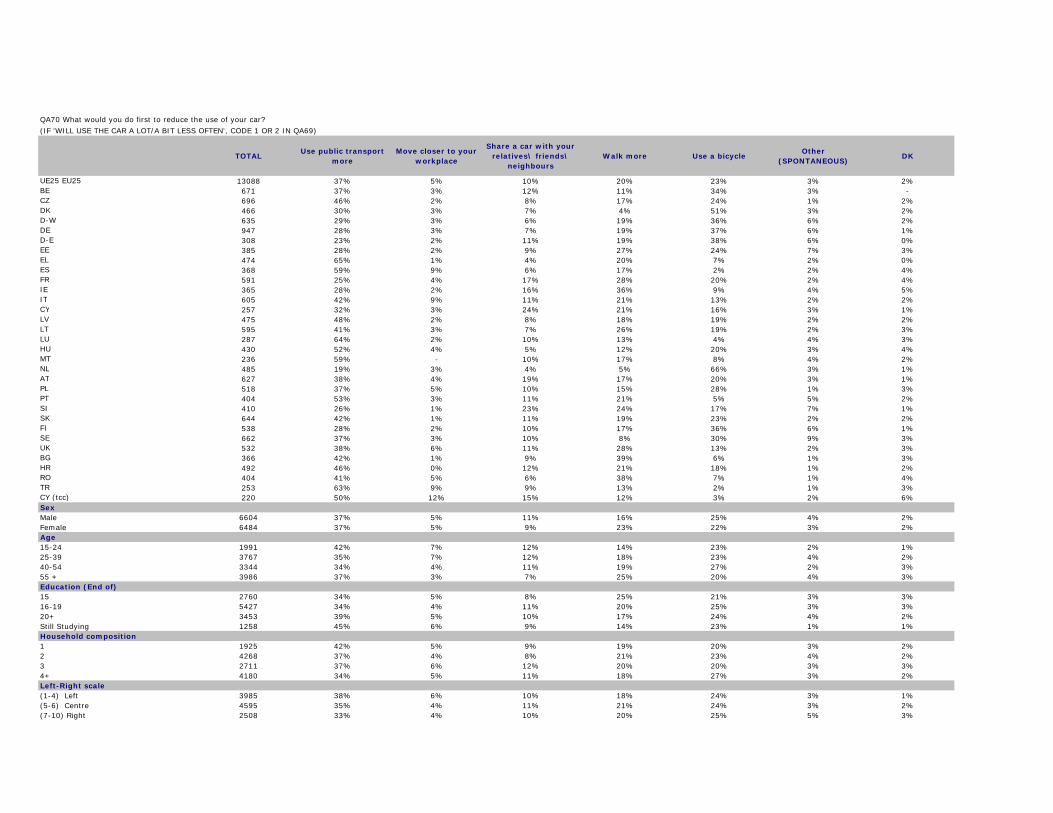
TOTALUse public transport
more Move closer to your
workplace
Share a car with your relatives\ friends\
neighboursWalk more Use a bicycle
Other (SPONTANEOUS)
DK
UE25 EU25 13088 37% 5% 10% 20% 23% 3% 2%BE 671 37% 3% 12% 11% 34% 3% - CZ 696 46% 2% 8% 17% 24% 1% 2%DK 466 30% 3% 7% 4% 51% 3% 2%D-W 635 29% 3% 6% 19% 36% 6% 2%DE 947 28% 3% 7% 19% 37% 6% 1%D-E 308 23% 2% 11% 19% 38% 6% 0%EE 385 28% 2% 9% 27% 24% 7% 3%EL 474 65% 1% 4% 20% 7% 2% 0%ES 368 59% 9% 6% 17% 2% 2% 4%FR 591 25% 4% 17% 28% 20% 2% 4%IE 365 28% 2% 16% 36% 9% 4% 5%IT 605 42% 9% 11% 21% 13% 2% 2%CY 257 32% 3% 24% 21% 16% 3% 1%LV 475 48% 2% 8% 18% 19% 2% 2%LT 595 41% 3% 7% 26% 19% 2% 3%LU 287 64% 2% 10% 13% 4% 4% 3%HU 430 52% 4% 5% 12% 20% 3% 4%MT 236 59% - 10% 17% 8% 4% 2%NL 485 19% 3% 4% 5% 66% 3% 1%AT 627 38% 4% 19% 17% 20% 3% 1%PL 518 37% 5% 10% 15% 28% 1% 3%PT 404 53% 3% 11% 21% 5% 5% 2%SI 410 26% 1% 23% 24% 17% 7% 1%SK 644 42% 1% 11% 19% 23% 2% 2%FI 538 28% 2% 10% 17% 36% 6% 1%SE 662 37% 3% 10% 8% 30% 9% 3%UK 532 38% 6% 11% 28% 13% 2% 3%BG 366 42% 1% 9% 39% 6% 1% 3%HR 492 46% 0% 12% 21% 18% 1% 2%RO 404 41% 5% 6% 38% 7% 1% 4%TR 253 63% 9% 9% 13% 2% 1% 3%CY (tcc) 220 50% 12% 15% 12% 3% 2% 6%SexMale 6604 37% 5% 11% 16% 25% 4% 2%Female 6484 37% 5% 9% 23% 22% 3% 2%Age15-24 1991 42% 7% 12% 14% 23% 2% 1%25-39 3767 35% 7% 12% 18% 23% 4% 2%40-54 3344 34% 4% 11% 19% 27% 2% 3%55 + 3986 37% 3% 7% 25% 20% 4% 3%Education (End of)15 2760 34% 5% 8% 25% 21% 3% 3%16-19 5427 34% 4% 11% 20% 25% 3% 3%20+ 3453 39% 5% 10% 17% 24% 4% 2%Still Studying 1258 45% 6% 9% 14% 23% 1% 1%Household composition1 1925 42% 5% 9% 19% 20% 3% 2%2 4268 37% 4% 8% 21% 23% 4% 2%3 2711 37% 6% 12% 20% 20% 3% 3%4+ 4180 34% 5% 11% 18% 27% 3% 2%Left-Right scale(1-4) Left 3985 38% 6% 10% 18% 24% 3% 1%(5-6) Centre 4595 35% 4% 11% 21% 24% 3% 2%(7-10) Right 2508 33% 4% 10% 20% 25% 5% 3%
(IF 'WILL USE THE CAR A LOT/A BIT LESS OFTEN', CODE 1 OR 2 IN QA69)
QA70 What would you do first to reduce the use of your car?
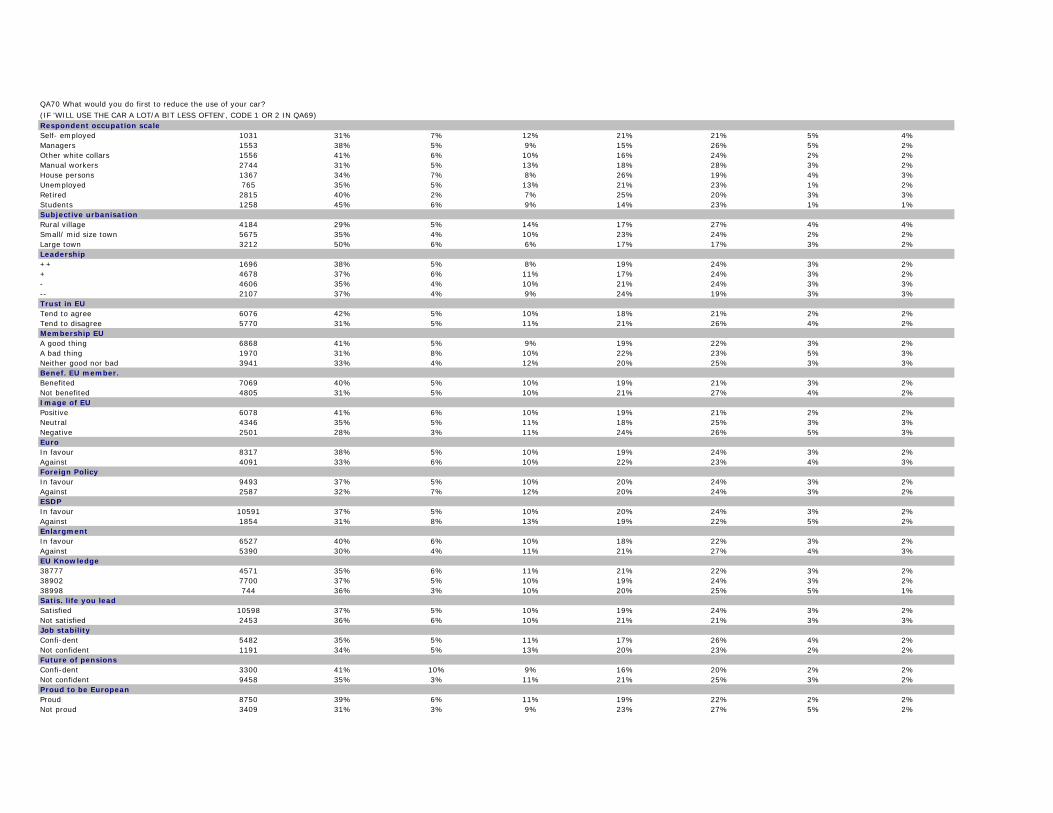
Respondent occupation scaleSelf- employed 1031 31% 7% 12% 21% 21% 5% 4%Managers 1553 38% 5% 9% 15% 26% 5% 2%Other white collars 1556 41% 6% 10% 16% 24% 2% 2%Manual workers 2744 31% 5% 13% 18% 28% 3% 2%House persons 1367 34% 7% 8% 26% 19% 4% 3%Unemployed 765 35% 5% 13% 21% 23% 1% 2%Retired 2815 40% 2% 7% 25% 20% 3% 3%Students 1258 45% 6% 9% 14% 23% 1% 1%Subjective urbanisationRural village 4184 29% 5% 14% 17% 27% 4% 4%Small/ mid size town 5675 35% 4% 10% 23% 24% 2% 2%Large town 3212 50% 6% 6% 17% 17% 3% 2%Leadership++ 1696 38% 5% 8% 19% 24% 3% 2%+ 4678 37% 6% 11% 17% 24% 3% 2%- 4606 35% 4% 10% 21% 24% 3% 3%-- 2107 37% 4% 9% 24% 19% 3% 3%Trust in EUTend to agree 6076 42% 5% 10% 18% 21% 2% 2%Tend to disagree 5770 31% 5% 11% 21% 26% 4% 2%Membership EUA good thing 6868 41% 5% 9% 19% 22% 3% 2%A bad thing 1970 31% 8% 10% 22% 23% 5% 3%Neither good nor bad 3941 33% 4% 12% 20% 25% 3% 3%Benef. EU member.Benefited 7069 40% 5% 10% 19% 21% 3% 2%Not benefited 4805 31% 5% 10% 21% 27% 4% 2%Image of EUPositive 6078 41% 6% 10% 19% 21% 2% 2%Neutral 4346 35% 5% 11% 18% 25% 3% 3%Negative 2501 28% 3% 11% 24% 26% 5% 3%EuroIn favour 8317 38% 5% 10% 19% 24% 3% 2%Against 4091 33% 6% 10% 22% 23% 4% 3%Foreign PolicyIn favour 9493 37% 5% 10% 20% 24% 3% 2%Against 2587 32% 7% 12% 20% 24% 3% 2%ESDPIn favour 10591 37% 5% 10% 20% 24% 3% 2%Against 1854 31% 8% 13% 19% 22% 5% 2%EnlargmentIn favour 6527 40% 6% 10% 18% 22% 3% 2%Against 5390 30% 4% 11% 21% 27% 4% 3%EU Knowledge38777 4571 35% 6% 11% 21% 22% 3% 2%38902 7700 37% 5% 10% 19% 24% 3% 2%38998 744 36% 3% 10% 20% 25% 5% 1%Satis. life you leadSatisfied 10598 37% 5% 10% 19% 24% 3% 2%Not satisfied 2453 36% 6% 10% 21% 21% 3% 3%Job stabilityConfi-dent 5482 35% 5% 11% 17% 26% 4% 2%Not confident 1191 34% 5% 13% 20% 23% 2% 2%Future of pensionsConfi-dent 3300 41% 10% 9% 16% 20% 2% 2%Not confident 9458 35% 3% 11% 21% 25% 3% 2%Proud to be EuropeanProud 8750 39% 6% 11% 19% 22% 2% 2%Not proud 3409 31% 3% 9% 23% 27% 5% 2%
(IF 'WILL USE THE CAR A LOT/A BIT LESS OFTEN', CODE 1 OR 2 IN QA69)
QA70 What would you do first to reduce the use of your car?

A A
B B
C C
D D
E E
1 12 2
SPLIT BALLOT
AB
notre numéro d'étude
EB64.1 C
numéro de l'interview
EB64.1 D
votre numéro d'étude
EB64.1 A
code pays
EB64.1 B
SPLIT BALLOT
AB
our survey number
EB64.1 C
Interview number
EB64.1 D
your survey number
EB64.1 A
country code
EB64.1 B
QuestionnaireBilingueEB642PRESScomplet20050928 1/54 28/09/2005

Q1 Q1
1, 1,2, 2,3, 3,4, 4,5, 5,6, 6,7, 7,8, 8,9, 9,
10, 10,11, 11,12, 12,13, 13,14, 14,15, 15,16, 16,17, 17,18, 18,19, 19,20, 20,21, 21,22, 22,23, 23,24, 24,25, 25,26, 26,27, 27,28, 28,29, 29,30, 30,31, 31,32, 32,
Autre paysNSP
EB64.1 Q1 TREND MODIFIE
RoumanieTurquieCroatieTerritoire de Chypre Nord
PologneSlovaquieSlovénieBulgarie
HongrieLettonieLituanieMalte
FinlandeRépublique de ChypreRépublique tchèqueEstonie
PortugalRoyaume-Uni (Grande Bretagne, Irlande du Nord)AutricheSuède
IrlandeItalieLuxembourgPays-Bas
AllemagneGrèceEspagneFrance
Quelle est votre nationalité ? Veuillez indiquer le(s) pays qui s'applique(nt).
(PLUSIEURS REPONSES POSSIBLES)
BelgiqueDanemark
POSER ITEM 27 UNIQUEMENT EN ROUMANIE
POSER ITEM 28 UNIQUEMENT EN TURQUIE
POSER ITEM 29 UNIQUEMENT EN CROATIE
POSER ITEM 30 UNIQUEMENT A CHYPRE (NORD)
POSER ITEM 26 UNIQUEMENT EN BULGARIE
Other countriesDK
EB64.1 Q1 TREND MODIFIED
RomaniaTurkeyCroatiaTerritory of Cyprus North
PolandSlovakiaSloveniaBulgaria
HungaryLatviaLithuaniaMalta
FinlandRepublic of CyprusCzech RepublicEstonia
PortugalUnited Kingdom (Great Britain, Northern Ireland)AustriaSweden
IrelandItalyLuxembourgNetherlands
GermanyGreeceSpainFrance
What is your nationality? Please tell me the country(ies) that applies(y).
(MULTIPLE ANSWERS POSSIBLE)
BelgiumDenmark
ASK ITEM 27 ONLY IN ROMENIA
ASK ITEM 28 ONLY IN TURKEY
ASK ITEM 29 ONLY IN CROATIA
ASK ITEM 30 ONLY IN CYPRUS (NORTH)
ASK ITEM 26 ONLY IN BULGARIA
QuestionnaireBilingueEB642PRESScomplet20050928 2/54 28/09/2005
QA64 QA64
1, 1,
2, 2,
3, 3,
4, 4,5, 5,6, 6,
QA65 QA65
1, 1,2, 2,3, 3,4, 4,5, 5,6, 6,7, 7,8, 8,
EB64.2 NOUVEAU
Développer l'utilisation de l'énergie éolienneAucune de celles-ci (SPONTANE)Autre (SPECIFIER - SPONTANE)NSP
Promouvoir la recherche de pointe pour de nouvelles technologies dans le domaine de l'énergie (l'hydrogène, le charbon propre, etc.)Légiférer pour réduire notre dépendance au pétroleDévelopper l'utilisation de l'énergie nucléaireDévelopper l'utilisation de l'énergie solaire
EB64.2 NOUVEAU
Pour réduire notre dépendance aux ressources énergétiques provenant de l'étranger, les gouvernements doivent choisir parmi une liste de solutions parfois coûteuses. Laquelle des solutions suivantes le Gouvernement (NATIONALITE) devrait-il favoriser dans les années à venir ?
(MONTRER CARTE - LIRE - MAX. 2 REPONSES)
Adopter des normes d'efficacité plus élevés pour les équipements qui consomment de l'énergieContrôler plus strictement l'application des normes d'efficacité en matière d'énergieAutre (SPECIFIER - SPONTANE)NSP
En réaction aux prix élevés de l'énergie, certains proposent d'appliquer de nouvelles mesures qui aideront les gens à réduire leur consommation d'énergie. Selon vous, quelle devrait être la priorité des autorités publiques pour aider les gens à réduire leur consommation d'énergie ?
(LIRE - MAX. 2 REPONSES)
Fournir plus d'informations pour un usage efficace de l'énergieDévelopper des incitations fiscales pour promouvoir un usage efficace de l'énergie
A TOUS
EB64.2 NEW
Develop the use of wind power None of these (SPONTANEOUS)Other (SPECIFY – SPONTANEOUS)DK
Promote advanced research for new energy technologies (hydrogen, clean coal, etc.)Regulate in order to reduce our dependence of oilDevelop the use of nuclear energyDevelop the use of solar power
EB64.2 NEW
To reduce our dependency on imported energy resources, governments have to choose from a list of alternatives, sometimes costly solutions. Which of the following should the (NATIONALITY) Government mainly focus on for the years to come?
(SHOW CARD - READ OUT – MAX. 2 ANSWERS)
Adopt higher efficiency standards for energy consuming equipment
Control more strictly the application of existing energy efficiency standards
Other (SPECIFY - SPONTANEOUS)DK
Against the background of high energy prices, some are proposing to take new measures that will help people to reduce their consumption of energy. According to you, what should be the public authorities’ priority to help people to reduce their consumption of energy?
(READ OUT – MAX. 2 ANSWERS)
Provide more information on efficient use of energyDevelop tax incentives to promote efficient use of energy
ASK ALL
QuestionnaireBilingueEB642PRESScomplet20050928 41/54 28/09/2005

QA66a QA66a
1 12 23 34 45 56 6
QA66b QA66b
1 1
2 23 3
4 45 5
J'ai l'intention de réduire ma consommation d'énergie et je serais prêt(e) à payer plus (SPONTANE)Autre (SPECIFIER - SPONTANE)NSP
EB64.2 NOUVEAU
Comme je n'ai pas l'intention de changer mes habitudes de consommation d'énergie, je serais prêt(e) à payer plusComme j'ai l'intention de réduire ma consommation d'énergie, je ne serais pas prêt(e) à payer plusAucune de celles-ci (SPONTANE)Je n'ai pas l'intention de changer mes habitudes de consommation d'énergie et je ne suis pas prêt(e) à payer plus (SPONTANE)
POSER AU SPLIT B
Comme vous le savez sans doute, nous devons relever de nouveaux défis en matière d'énergie (comme les prix élevés, l'obligation internationale de réduire les émissions de CO2) qui pourraient demander certains efforts aux citoyens. Avec lequelle des propositions suivantes êtes-vous le plus d'accord ?
(MONTRER CARTE - LIRE - UNE SEULE REPONSE)
Oui, je serais prêt(e) à payer de 11 à 25% de plusOui, je serais prêt(e) à payer plus de 25% de plusNSP
EB57.0 Q26
(MONTRER CARTE - LIRE - UNE SEULE REPONSE)
Non, je ne suis pas prêt(e) à payer plusOui, je serais prêt(e) à payer jusqu'à 5% de plusOui, je serais prêt(e) à payer de 6 à 10% de plus
POSER AU SPLIT A
Seriez-vous prêt(e) à payer plus pour l'énergie produite par des sources d'énergie renouvelables que pour de l'énergie produite par d'autres sources ? (SI OUI) Combien seriez-vous prêt(e) à payer en plus ?
I intend to reduce my energy consumption and I would be prepared to pay more (SPONTANEOUS)Other (SPECIFY - SPONTANEOUS)DK
EB64.2 NEW
As I do not intend to change my energy consumption habits, I would be prepared to pay moreAs I intend to reduce my energy consumption, I would not be prepared to pay more None of these (SPONTANEOUS)I do not intend to change my energy consumption habits and I would not be prepared to pay more (SPONTANEOUS)
ASK TO SPLIT B
As you may know, we are now facing new energy challenges (like high energy prices, international obligations to reduce CO2 emissions) that could imply efforts from citizens. With which of the following propositions do you agree the most?
(SHOW CARD – READ OUT – ONE ANSWER ONLY)
Yes, I would pay 11 to 25% moreYes, I would pay more than 25% moreDK
EB57.0 Q26
(SHOW CARD – READ OUT – ONE ANSWER ONLY)
No, I am not prepared to pay moreYes, I would pay up to 5% moreYes, I would pay 6 to 10% more
ASK TO SPLIT A
Would you be prepared to pay more for energy produced from renewable sources than for energy produced from other sources? (IF YES) How much more would you be prepared to pay?
QuestionnaireBilingueEB642PRESScomplet20050928 42/54 28/09/2005

QA67 QA67
1 12 23 34 4
QA68 QA68
1 12 23 3
EB57.0 Q27 TREND MODIFIE
4Une voiture 1 2 3 4Un réfrigérateur 1 2 3
NSP
Une ampoule électrique 1 2 3 4
(LIRE) Très attention
Un peu attention
Pas du tout
attention
EB64.2 NOUVEAU
Je vais vous montrer une liste de produits ou d'équipement. Quand vous décidez d'en acheter un nouveau, pourriez-vous me dire si vous faites très attention, un peu attention ou pas du tout attention à la quantité d'énergie qu'il consomme ?
(UNE REPONSE PAR LIGNE)
Le niveau européenLe niveau nationalLe niveau localNSP
A TOUS
Afin de répondre aux nouveaux défis en matière d'énergie que nous avons à relever dans les années à venir, d'après vous, quel est le meilleur niveau pour prendre les décisions ?
(LIRE - UNE SEULE REPONSE)
EB57.0 Q27 TREND MODIFIED
4A car 1 2 3 4A refrigerator 1 2 3
DK
A light bulb 1 2 3 4
(READ OUT) A lot of attention
A little attention
No attention at
all
EB64.2 NEW
I am going to show you a list of products or equipment. When you decide to buy a new one, please tell me whether you pay a lot of attention, a little attention or no attention at all to the energy it uses or not?
(ONE ANSWER PER LINE)
The European levelThe national levelThe local levelDK
ASK ALL
In order to respond to the new energy challenges that we have to face for the years to come, what is, according to you, the most appropriate level to take decisions?
(READ OUT – ONE ANSWER ONLY)
QuestionnaireBilingueEB642PRESScomplet20050928 43/54 28/09/2005

QA69 QA69
1 12 23 34 45 5
QA70 QA70
1 12 23 34 45 56 67 7NSP
EB64.2 NOUVEAU
Partager une voiture avec vos relations/amis/voisins ...Marcher plus souventRouler à bicycletteAutre (SPONTANE)
Que feriez-vous en premier lieu pour moins utiliser votre voiture ?
(LIRE - UNE SEULE REPONSE)
Utiliser plus souvent les transports publiquesDéménager plus près de votre lieu de travail
NSP
EB64.2 NOUVEAU
SI "BEAUCOUP MOINS SOUVENT" OU "UN PEU MOINS SOUVENT", CODE 1 OR 2 IN QA69
Beaucoup moins souventUn peu moins souventAussi souventPas applicable (SPONTANE)
Supposons que le prix au litre de l'essence sans plomb/ du diesel atteigne 2 euros (ADAPTER A LA SITUATION NATIONALE). Utiliseriez-vous votre voiture beaucoup moins souvent, un peu moins souvent ou aussi souvent ?
(LIRE - UNE SEULE REPONSE)
DK
EB64.2 NEW
Share a car with your relatives/friends/neighbours…Walk moreUse a bicycleOther (SPONTANEOUS)
What would you do first to reduce the use of your car?
(READ OUT – ONE ANSWER ONLY)
Use public transport more Move closer to your workplace
DK
EB64.2 NEW
IF "A LOT LESS OFTEN" OR "A BIT LESS OFTEN", CODE 1 OR 2 IN QA69
A lot less oftenA bit less oftenAs oftenNot applicable (SPONTANEOUS)
Let’s suppose the price per litre of unleaded fuel/diesel reaches 2 euros (TO BE ADAPTED ACCORDING TO NATIONAL SITUATIONS). Would you use your car a lot less often, a bit less often or as often?
(READ OUT – ONE ANSWER ONLY)
QuestionnaireBilingueEB642PRESScomplet20050928 44/54 28/09/2005

D1 D1
1 2 3 4 5 6 7 8 9 10 1 2 3 4 5 6 7 8 9 10
11 11
12 12
D7 D7
1 12 23 34 4
5 56 67 78 89 9
10 10
D8 D8
EB63.4 D7
A quel âge avez-vous arrêté vos études à temps complet ?
(ENQ. : SI "ETUDIE ENCORE", CODER ‘00’)
EB63.4 D8
Séparé(e)Veuf/Veuve Autre (SPONTANE)Refus (SPONTANE)
Célibataire vivant actuellement en couple Célibataire n'ayant jamais vécu en coupleCélibataire ayant déjà vécu en couple dans le passé mais actuellement seul(e)Divorcé(e)
Pouvez-vous m'indiquer la lettre qui correspond le mieux à votre situation actuelle ?
(MONTRER CARTE - LIRE - UNE SEULE REPONSE)
Marié(e)Remarié(e)
Refus
NSP
EB63.4 D1
PAS DE QUESTIONS D2 A D6
A propos de politique, les gens parlent de "droite" et de "gauche". Vous-même, voudriez-vous situer votre position sur cette échelle ?
(MONTRER CARTE) - (ENQ. : NE RIEN SUGGERER. SI LA PERSONNE HESITE, INSISTER)
Gauche Droite
DEMOGRAPHIQUES
A TOUS
EB63.4 D7
How old were you when you stopped full-time education?
(INT.: IF "STILL STUDYING", CODE ‘00’)
EB63.4 D8
SeparatedWidowedOther (SPONTANEOUS)Refusal (SPONTANEOUS)
Unmarried, currently living with partnerUnmarried, having never lived with a partnerUnmarried, having previously lived with a partner, but now on my own
Divorced
Could you give me the letter which corresponds best to your own current situation?
(SHOW CARD - READ OUT - ONE ANSWER ONLY)
MarriedRemarried
Refusal
DK
EB63.4 D1
NO QUESTIONS D2 TO D6
In political matters people talk of "the left" and "the right".How would you place your views on this scale?
(SHOW CARD) - (INT.: DO NOT PROMPT - IF CONTACT HESITATES, TRY AGAIN)
Left Right
DEMOGRAPHICS
ASK ALL
QuestionnaireBilingueEB642PRESScomplet20050928 48/54 28/09/2005
D10 D10
1 12 2
D11 D11
D25 D25
1 12 23 34 4
D40a D40a
PAS DE QUESTIONS D26 A D39
Pouvez-vous me dire combien de personnes âgées de 15 ans et plus vivent dans votre foyer, y compris vous-même ?
(ENQ. : LIRE - NOTER EN CLAIR)
EB63.4 D40a
Dans une ville petite ou moyenneDans une grande villeNSP
EB63.4 D25
PAS DE QUESTIONS D16 A D24
Diriez-vous que vous vivez … ?
(LIRE)
Dans une commune rurale
EB63.4 D10
Quel est votre âge ?
EB63.4 D11
PAS DE QUESTIONS D12 A D14
PAS DE QUESTION D9
Sexe du répondant.
HommeFemme
EB63.4 D40a
EB63.4 D25
NO QUESTIONS D26 TO D39
Could you tell me how many people aged 15 years or more live in your household, yourself included?
INT.: READ OUT - WRITE DOWN)
Rural area or villageSmall or middle sized townLarge townDK
D15 a&b ASKED AFTER Q1
NO QUESTIONS D16 TO D24
Would you say you live in a...?
(READ OUT)
EB63.4 D10
How old are you?
EB63.4 D11
NO QUESTION D12 TO D14
NO QUESTION D9
Gender.
MaleFemale
QuestionnaireBilingueEB642PRESScomplet20050928 49/54 28/09/2005

D40b D40b
D40c D40c
D43a D43a
D43b D43b
D49a D49a Pouvez-vous me dire, s’il y en a, quelles sont les chaînes de télévision que vous regardez régulièrement, c’est-à-dire au moins cinq fois par semaine ?
(NE RIEN SUGGERER – RECODER - PLUSIEURS REPONSES POSSIBLES) - (INSERER LISTE DES PRINCIPALES CHAINES DE TELEVISION DISPONIBLES DANS LE PAYS + AUTRE)
CODES CHAINES TELE (CODES NATIONAUX)
EB64.2 NOUVEAU
EB63.4 D43a D43b
D46 ET D47 SUPPRIMEES
PAS DE QUESTION D48
Oui 1 1Non 2 2
D43a D43bFixe Mobile / GSM /
portable
ENQ. : LIRE - NOTER EN CLAIR)
EB63.4 D40c
Possédez-vous un téléphone fixe ?
Possédez-vous un téléphone mobile / GSM / portable ?
Pouvez-vous me dire combien d’enfants de moins de 10 ans vivent dans votre foyer ?
ENQ. : LIRE - NOTER EN CLAIR)
EB63.4 D40b
Pouvez-vous me dire combien d’enfants de 10 à 14 ans vivent dans votre foyer ?
(DO NOT SUGGEST – RECODE – MULTIPLE ANSWERS POSSIBLE) - (INSERT THE LIST OF MAIN TV CHANNELS AVAILABLE IN THE COUNTRY + OTHER)
TV CHANNELS CODES (NATIONAL CODES)
EB64.2 NEW
D46 AND D47 SUPPRESSED
NO QUESTION D48
Can you tell me the TV channels, if any, that you regularly watch, meaning at least five times a week?
No 2 2
EB63.4 D43a D43b
Fixed Mobile
Yes 1 1
Do you own a fixed telephone?
Do you own a mobile telephone?
D43a D43b
Could you tell me how many children aged 10 to 14 years old live in your household?
INT.: READ OUT - WRITE DOWN)
EB63.4 D40c
D41 AND D42 SUPPRESSED
Could you tell me how many children less than 10 years old live in your household?
INT.: READ OUT - WRITE DOWN)
EB63.4 D40b
QuestionnaireBilingueEB642PRESScomplet20050928 50/54 28/09/2005

D49b D49b
D49c D49c
CODES QUOTIDIENS (CODES NATIONAUX)
EB64.2 NOUVEAU
EB64.2 NOUVEAU
Pouvez-vous me dire, s’il y en a, quelles sont les quotidiens que vous lisez régulièrement, c’est-à-dire au moins trois fois par semaine ?
(NE RIEN SUGGERER – RECODER - PLUSIEURS REPONSES POSSIBLES) - (INSERER LISTE DES PRINCIPAUX QUOTIDIENS DISPONIBLES DANS LE PAYS + AUTRE)
Pouvez-vous me dire, s’il y en a, quelles sont les chaînes de radio que vous écoutez régulièrement, c’est-à-dire au moins cinq fois par semaine ?
(NE RIEN SUGGERER – RECODER - PLUSIEURS REPONSES POSSIBLES) - (INSERER LISTE DES PRINCIPALES CHAINES DE RADIO DISPONIBLES DANS LE PAYS + AUTRE)
CODES CHAINES RADIO (CODES NATIONAUX)
EB64.2 NEW
Can you tell me the daily newspapers, if any, that you regularly read, meaning at least three times a week?
(DO NOT SUGGEST – RECODE – MULTIPLE ANSWERS POSSIBLE) - (INSERT THE LIST OF MAIN DAILY NEWSPAPERS AVAILABLE IN THE COUNTRY + OTHER)
DAILY NEWSPAPERS CODES (NATIONAL CODES)
Can you tell me the radio stations, if any, that you regularly listen to, meaning at least five times a week?
(DO NOT SUGGEST – RECODE – MULTIPLE ANSWERS POSSIBLE) - (INSERT THE LIST OF MAIN RADIO STATIONS AVAILABLE IN THE COUNTRY + OTHER)
RADIO STATIONS CODES (NATIONAL CODES)
EB64.2 NEW
QuestionnaireBilingueEB642PRESScomplet20050928 51/54 28/09/2005

D50 D50
1, 1,2, 2,3, 3,4, 4,5, 5,6, 6,7, 7,8, 8,9, 9,
10, 10,11, 11,12, 12,
13, 13,14, 14,15, 15,16, 16,NSP
EB64.2 NOUVEAU
Chercher des informations pratiques (météo, horaires, etc.)Je n’utilise pas Internet/ Je n’ai pas accès à Internet (SPONTANE)
J’utilise Internet moins souvent (SPONTANE)Autre (SPONTANE)
Acheter en ligneAccéder à des sites de loisirs (sports, voitures, etc.)Accéder à la banque en ligneAccéder au e-Gouvernement
Regarder la télévisionAccéder à des blogsAccéder à des forumsAccéder à des chats
(LIRE – PLUSIEURS REPONSES POSSIBLES)
Rechercher de l’information (en utilisant un moteur de recherche)Lire un journal Ecouter la radio
Pour quels usages parmi les suivants utilisez-vous Internet au moins une fois par semaine ?
EB64.2 NEW
I do not use the Internet/ I do not have access to the Internet (SPONTANEOUS)I use the Internet less often (SPONTANEOUS)Other (SPONTANEOUS)DK
Accessing leisure sites (sports, cars, etc.)Accessing your bank on lineAccessing e-GovernmentLooking up practical information (weather forecast, timetables, etc.)
Accessing blogsAccessing forumsAccessing chatsBuying on line
Searching information (by using a search engine)Reading a newspaper Listening to the radioWatching TV
For which of the following purposes do you use the Internet at least once a week?
(READ OUT – MULTIPLE ANSWERS POSSIBLE)
QuestionnaireBilingueEB642PRESScomplet20050928 52/54 28/09/2005

P1 P1
P2 P2
P3 P3
P4 P4
1 12 23 34 4
P5 P5
1 12 23 34 4
P6 P6
(CODES LOCAUX)
EB63.4 P6
MoyenneMédiocre
EB63.4 P5
Catégorie d'habitat
EB63.4 P4
Coopération du répondant
ExcellenteBonne
Deux (l'enquêteur et le répondant)TroisQuatreCinq et plus
DUREE DE L'INTERVIEW EN MINUTES
MINUTES
EB63.4 P3
Nombre de personnes présentes pendant l'interview, l'enquêteur inclus.
(ENQ. : DE 0 A 23 HEURE)
HEURE MINUTES
EB63.4 P2
JOUR MOIS
EB63.4 P1
HEURE DU DEBUT DE L'INTERVIEW
PROTOCOLE D'INTERVIEW
DATE DE L'INTERVIEW
Size of locality
(LOCAL CODES)
EB63.4 P6
FairAverageBad
EB63.4 P5
Five or more
EB63.4 P4
Respondent cooperation
Excellent
Number of persons present during the interview, including interviewer
Two (interviewer and respondent)ThreeFour
EB63.4 P2
NUMBER OF MINUTES THE INTERVIEW LASTED
MINUTES
EB63.4 P3
EB63.4 P1
TIME OF THE BEGINNING OF THE INTERVIEW
(INT.:USE 24 HOUR CLOCK)
HOUR MINUTES
INTERVIEW PROTOCOLE
DATE OF INTERVIEW
DAY MONTH
QuestionnaireBilingueEB642PRESScomplet20050928 53/54 28/09/2005
P7 P7
P8 P8
P9 P9
P10 P10
P11 P11
P13 P13
1 12 23 3
Langue 2Langue 3
EB63.4 P13
EB63.4 P11
POSER UNIQUEMENT en LU, BE, ES, FI, EE, LV, MT et TR
Langue de l'interview
Langue 1
EB63.4 P9
N° enquêteur
EB63.4 P10
Facteur de pondération
EB63.4 P7
Code postal
EB63.4 P8
N° point de chute
Région
(CODES LOCAUX)
Language 1Language 2Language 3
EB63.4 P13
Weighting factor
EB63.4 P11
ASK ONLY in LU, BE, ES, FI, EE, LV, MT and TR
Language of interview
Sample point number
EB63.4 P9
Interviewer number
EB63.4 P10
(LOCAL CODES)
EB63.4 P7
Postal code
EB63.4 P8
Region
QuestionnaireBilingueEB642PRESScomplet20050928 54/54 28/09/2005