Embed Size (px)
Citation preview

Attitudes towards Immigration
Looking at the results from a student led survey as part of the Politics Project, University of
Manchester

About this resource This resource was developed by the ESSTED project at the University of Manchester. ESSTED was funded through the ESRC Curriculum Innovation Initiative and ESRC Researcher Development Initiative. You can find details of the ESSTED project and others resources on the project websitehttp://patternsinpoliticsandsociety.wordpress.com/ ESSTED resources are released under the Creative Commons Attribution-ShareAlike 4.0 International License. Please use and adapt as you need, but acknowledge the creators and the ESSTED project as the source.

How many responded to the survey?
Frequency Percentversion A 296 65.2
version B 158 34.8
Total 454 100.0
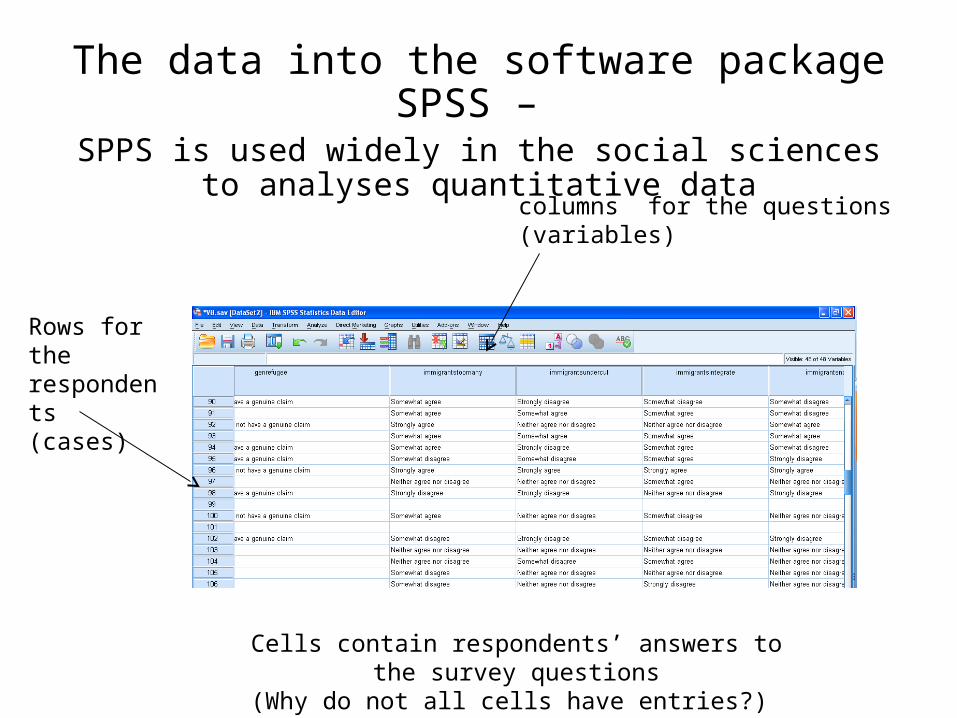
The data into the software package SPSS – SPPS is used widely in the social sciences to analyses
quantitative data
columns for the questions (variables)
Rows for the respondents(cases)
Cells contain respondents’ answers to the survey questions(Why do not all cells have entries?)

Finding out who responded (1)Get SPSS to provide frequencies for the socio-demographic questions

Finding out who responded (2)2) Look at the tables, graphs etc

Unusual responses

Summary of your respondentsPercentage of valid responses (% of total)
• Male 46% (42%) and Female 54% (49%)• 76.8 % (60%) born in the UK • White Background 69.4 (55%) • Party ID: Labour 34% (37%), Liberal Democrat
(11%) and Conservative 8% (9%) and none (28%) (31%)
• Average age: 23

Attitudes to immigration


Experimental questions

Make a table including response and an indicator for version A or B

Results – which group changes their mind the most?

Ask for Row percentages to compare how different row categories responded

A difference between the groups – which group is which?
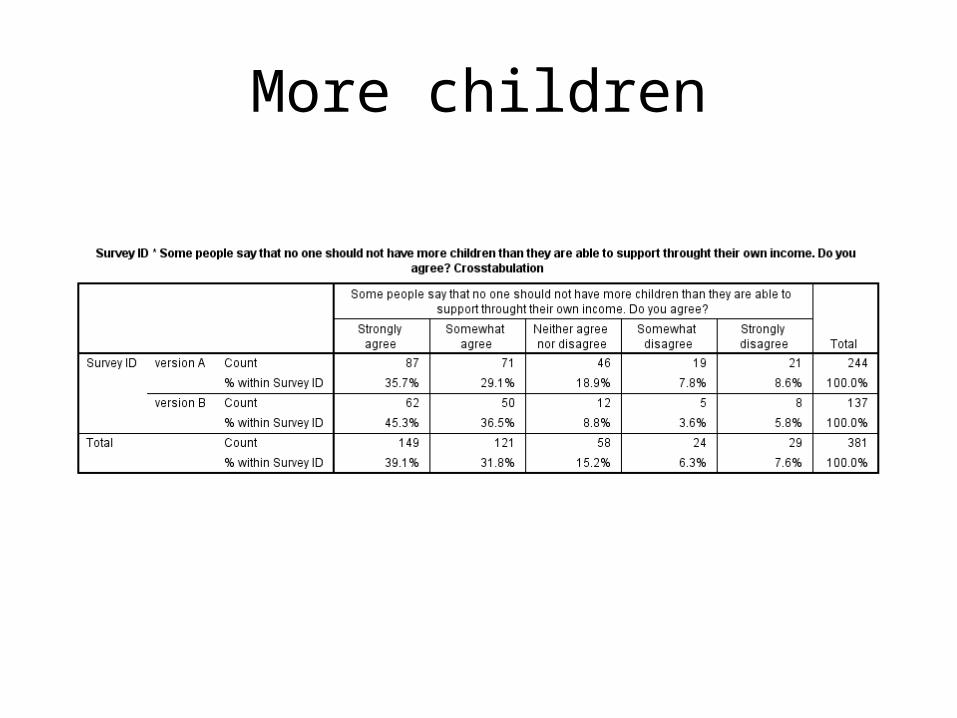
More children

Right to Job Seeker’s Allowance

Asylum seekers and refugees