Embed Size (px)
Citation preview
sustainability
Article
Attitudes towards Statistics among Business Students:Do Gender, Mathematical Skills and PersonalTraits Matter?
Leiv Opstad
NTNU Business School, Norwegian University of Science and Technology, 7491 Trondheim, Norway;[email protected]
Received: 9 July 2020; Accepted: 25 July 2020; Published: 29 July 2020�����������������
Abstract: The purpose of this article was to investigate different variables, by combining mathematicalskills and personal traits using The Big Five Model, to see which have the most influence on businessstudents’ attitudes towards statistics. The Big Five personality traits make up a model for capturingvarious personal characteristics. Specifically, we aimed to understand why there is a gender differencein attitudes towards statistics. Statistical skills are a key factor for success in business studies.The chosen methods were pairwise comparisons (t-test) and a linear regression model, using asample from a Norwegian business school. The finding was that there is a substantial gender gaptowards attitudes towards statistics but taking mathematical skills and personal characteristics intoconsideration then results in this gap becoming much smaller. Furthermore, mathematical skills andpersonal traits were shown to have an impact on students’ attitudes towards statistics.
Keywords: attitudes towards statistics; Big Five; mathematical skills; quantitative analysis; genderdifferences; business studies
1. Introduction
Attitudes towards statistics influence students’ learning in this subject [1]. Business statistics isan important tool in quantitative business courses and especially in courses for a finance major [2].Many students’ quantitative skills do not meet the expectations of the instructors in these fields. Goodanalysis requires statistical skills. In a subject like business law, there is also an advantage to havingstatistical abilities [3]. By allowing students to use statistical methods to analyze real data, one canimprove students’ statistical skills. According to Gal and Garfield [4], students’ attitudes towardsstatistics are particularly important since statistical thinking and application are useful tools in manycontexts. Hence, attitudes towards statistics matter for undergraduates in business fields.
The topic of gender gap in higher education continues to attract interest among researchersworldwide. Students’ decisions about their educational pathways and careers depend on academicabilities and preferences, and there is a significant gender difference in these preferences [5]. For example,women choose, to a large extent, to study humanities, languages, and social sciences, while sciencesappeal more to men. Worthington and Higgs [6] reported that women undergraduates are less likelyto continue to study finance after completing introductory courses, preferring instead accounting,marketing, and management. Many women find finance irrelevant or uninteresting. One reason mightbe that women students are less interested due to their attitudes towards statistics and mathematics [6,7].Males tend to outperform females in quantitative subjects. The findings in this research contribute toexplaining this result.
Economics and business studies attract both men and women. In this field, the gender distributionin Norway is approximately fifty-fifty. Prior research has shown that there is a substantial gender gap
Sustainability 2020, 12, 6104; doi:10.3390/su12156104 www.mdpi.com/journal/sustainability
Sustainability 2020, 12, 6104 2 of 16
among business and economics students in performance, attitudes, and choice of major [8–10]. One reasonmight be the mathematical abilities and attitudes towards mathematics [11] This phenomenon is calledthe confidence gap [12]. Despite gender equalization in many countries, there is still a significant genderdifference in mathematical skills [13]. This is due to women tending to choose practical mathematics inhigh school, while their counterparts prefer theoretical mathematics to a far greater extent. This facthas implications in their success in the different subjects at business school [14].
There is a link between mathematics and statistics [15]. Students who are insecure and have noenthusiasm for mathematics tend to have the same feelings and attitudes towards statistics, accordingto Ramos Salazar [16]. A problem is that many students do not realize the importance of statisticsin business courses [17]. Therefore, the gender gap in mathematics appears also in statistics [16,18].Women students are less motivated in business statistics than are their men peers. Women and menhave different attitudes towards statistics. Statistical skills are important tools in business courses,not only in quantitative courses, but also in subjects such as marketing. In finance courses, statisticalabilities are critical for conducting good analyses. A solid background in business statistics leads tobetter performance and improved careers [19]. Despite its usefulness, many undergraduates strugglewith the subject and it brings negative anxiety and antipathy [20,21]. Therefore, it is important toinvestigate business students’ attitudes towards statistics, and especially to understand if there is agender gap and if so, why. It may help explaining why more women tend to fall behind in somebusiness courses. The purpose of this article is to determine more on this issue.
We conducted this analysis by taking into consideration the mathematical abilities and personalitycharacteristics using the Big Five Model. The question is, after taking these above facets intoconsideration, is there still a gender difference in attitudes towards statistics, or does it disappear whenadjusting for differences in skills and personal traits.
2. Theory and Research Model
It is important for business graduates to have analytical skills [22]. Lack of interest, low confidence,and negative attitudes towards statistics can cause poor performance in business courses.
2.1. Attitudes towards Statistics
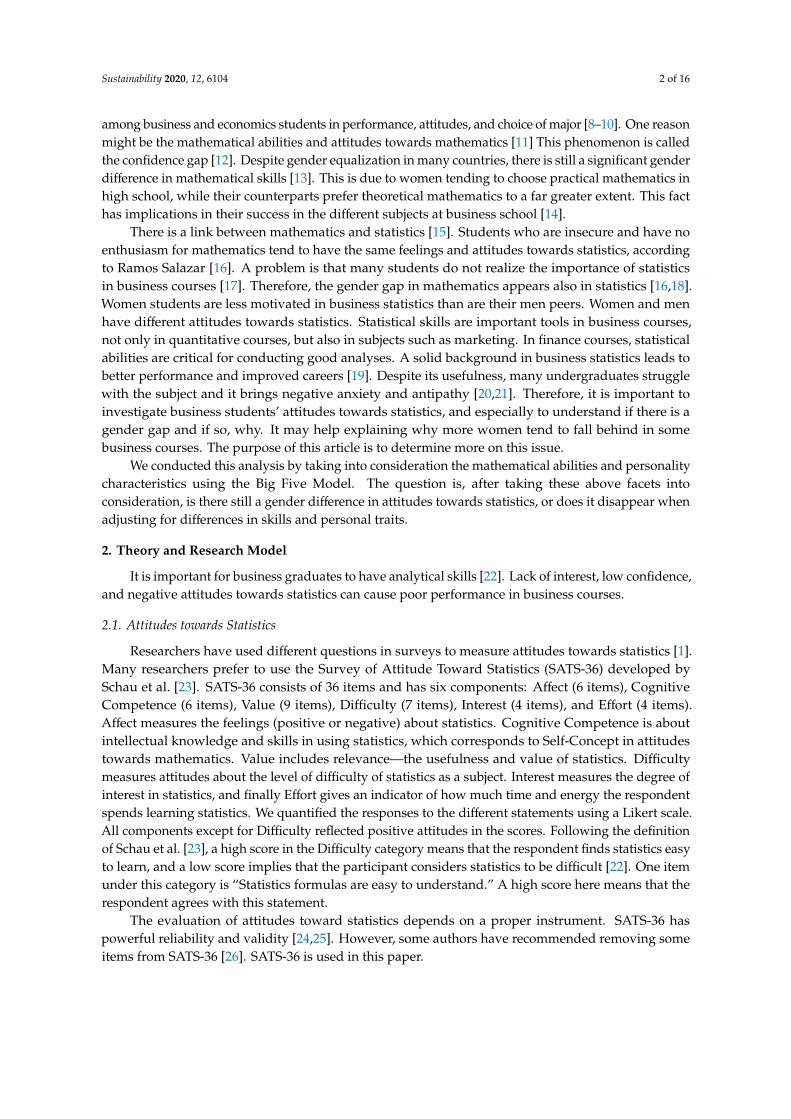
Researchers have used different questions in surveys to measure attitudes towards statistics [1].Many researchers prefer to use the Survey of Attitude Toward Statistics (SATS-36) developed bySchau et al. [23]. SATS-36 consists of 36 items and has six components: Affect (6 items), CognitiveCompetence (6 items), Value (9 items), Difficulty (7 items), Interest (4 items), and Effort (4 items).Affect measures the feelings (positive or negative) about statistics. Cognitive Competence is aboutintellectual knowledge and skills in using statistics, which corresponds to Self-Concept in attitudestowards mathematics. Value includes relevance—the usefulness and value of statistics. Difficultymeasures attitudes about the level of difficulty of statistics as a subject. Interest measures the degree ofinterest in statistics, and finally Effort gives an indicator of how much time and energy the respondentspends learning statistics. We quantified the responses to the different statements using a Likert scale.All components except for Difficulty reflected positive attitudes in the scores. Following the definitionof Schau et al. [23], a high score in the Difficulty category means that the respondent finds statistics easyto learn, and a low score implies that the participant considers statistics to be difficult [22]. One itemunder this category is “Statistics formulas are easy to understand.” A high score here means that therespondent agrees with this statement.
The evaluation of attitudes toward statistics depends on a proper instrument. SATS-36 haspowerful reliability and validity [24,25]. However, some authors have recommended removing someitems from SATS-36 [26]. SATS-36 is used in this paper.
Sustainability 2020, 12, 6104 3 of 16
2.2. Gender and Attitudes towards Statistics
Hommik and Luik [27] reported a gender difference in attitudes toward statistics. Men studentshad marginally higher values in the dimensions of Competence, Value, and Interest, while womenstudents had higher scores in Effort. Rejón-Guardia et al [28] confirmed this tendency with almostthe same conclusion. Women had significantly lower mean scores in Value, Competence, and Affect,but higher scores in Effort. The only difference between these two papers is that Affect was substitutedfor Interest. While Hommik and Luik [27] reported higher scores for men in Interest, Rejon-Guardiaet al [28] did not register any gender difference for this factor, but for the dimension Affect, whichscored in favor of men. Hannigan et al. [29] also found a gender gap with higher scores for men inCompetence and Affect. The other factors had almost even scores for men and women. According toFullerton and Umphrey [30], women are significantly more anxious than men. Others confirmed thatmen express more positive attitudes towards statistics [12,31,32]. Women have been shown to be lessconfident using statistics and to find statistics difficult, and these factors have led to women havingnegative feelings about the subject. However, the findings have been mixed. Sarikaya et al. [33] andWisenbaker and Scott [34] did not find any gender difference, and Mahmud and Zainol [35] concludedthat women had more positive attitudes toward statistics than men.
2.3. Mathematical Skills and Attitudes towards Statistics
Mathematical-orientated students have positive attitudes towards statistics [36]. Note, Chiesi,and Primii [12] did not find that women’s negative attitudes towards statistics were related to differencesin mathematical knowledge. Hence, it is not obvious how mathematical skills will affect the genderdifference in attitudes towards statistics.
2.4. The Big Five Personality Traits
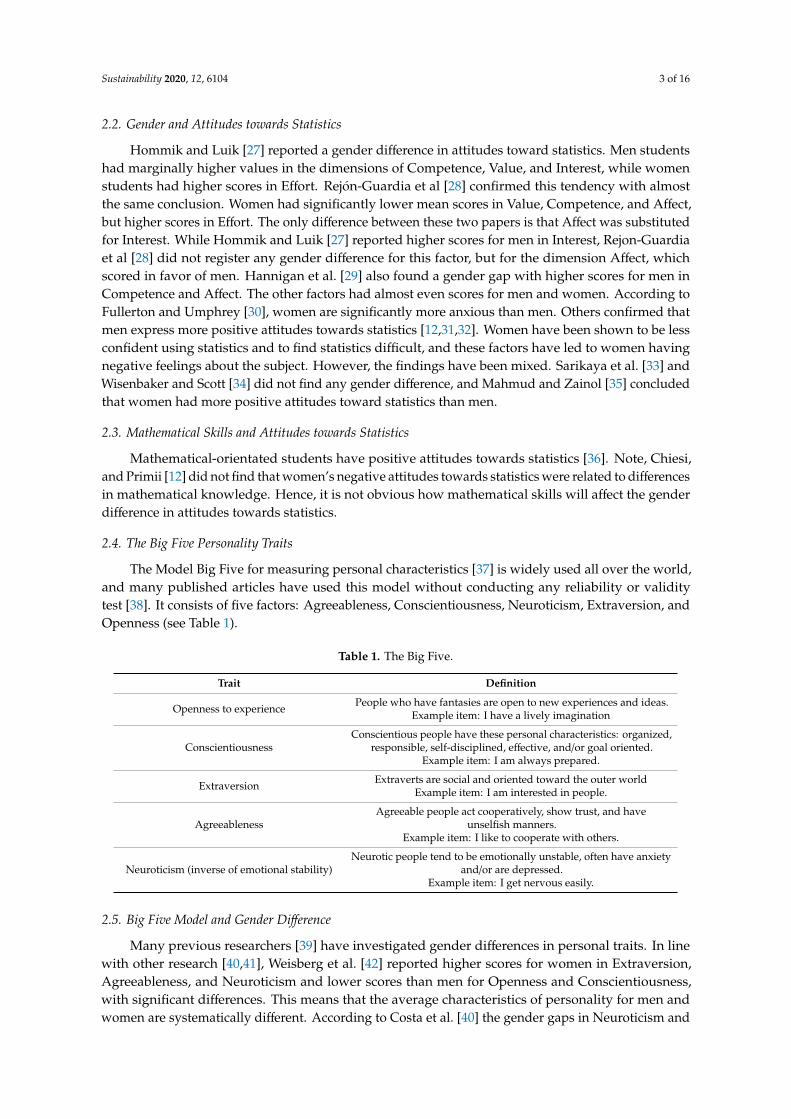
The Model Big Five for measuring personal characteristics [37] is widely used all over the world,and many published articles have used this model without conducting any reliability or validitytest [38]. It consists of five factors: Agreeableness, Conscientiousness, Neuroticism, Extraversion, andOpenness (see Table 1).
Table 1. The Big Five.
Trait Definition
Openness to experience People who have fantasies are open to new experiences and ideas.Example item: I have a lively imagination
ConscientiousnessConscientious people have these personal characteristics: organized,
responsible, self-disciplined, effective, and/or goal oriented.Example item: I am always prepared.
Extraversion Extraverts are social and oriented toward the outer worldExample item: I am interested in people.
AgreeablenessAgreeable people act cooperatively, show trust, and have
unselfish manners.Example item: I like to cooperate with others.
Neuroticism (inverse of emotional stability)Neurotic people tend to be emotionally unstable, often have anxiety
and/or are depressed.Example item: I get nervous easily.
2.5. Big Five Model and Gender Difference
Many previous researchers [39] have investigated gender differences in personal traits. In linewith other research [40,41], Weisberg et al. [42] reported higher scores for women in Extraversion,Agreeableness, and Neuroticism and lower scores than men for Openness and Conscientiousness,with significant differences. This means that the average characteristics of personality for men andwomen are systematically different. According to Costa et al. [40] the gender gaps in Neuroticism and
Sustainability 2020, 12, 6104 4 of 16
Agreeableness are stable due to biological gender differences. Chapman et al. [43] pointed out thatmen scored higher in some items/aspect of extraversion while women achieved higher scores in others.All together they found a moderately higher value for men than women in the dimension of Extraversion.Using the Big Five Inventory with samples from 55 nations (N = 17,637) Schmitt et al. [39] reportedthat women had higher scores in Neuroticism, Extraversion, Conscientiousness, and Agreeablenessacross most countries and cultures.
The model in this study is to see the level of differences in attitudes towards statistics based ongender, mathematical skills, and personal characteristics.
2.6. Hypotheses
Based on the literature review, we postulate the following hypotheses:
Hypothesis 1 (H1): There is a gender difference in personal characteristics among business students.
Hypothesis 2 (H2): There is a gender difference in attitudes towards statistics among business students.
Hypothesis 3 (H3): Mathematical skills and personal characteristics have influence on students’ attitudestowards statistics.
Hypothesis 4 (H4): The gender difference in attitudes towards statistics gets smaller when taking differencesin mathematical skills and personal traits into account.
Previous research has documented that there is a gender gap in attitudes towards statisticsand in personal traits. We wondered if there are gender differences using data from a Norwegianbusiness school.
We are not aware of any previous study that has analyzed the gender difference in attitudestowards statistics by linking this topic to mathematical skills and personal characteristics. Sincepersonal traits and mathematical abilities vary by gender, the assumption is that the gender distinctionin attitudes towards statistics decreases when these factors are taken into account (H4). Previousstudies have shown that mathematical skills and personal characteristics influence attitudes towardsstatistics [29,44]. Therefore, we postulate hypothesis H3.
3. Sample and Research Methodology
3.1. Sample
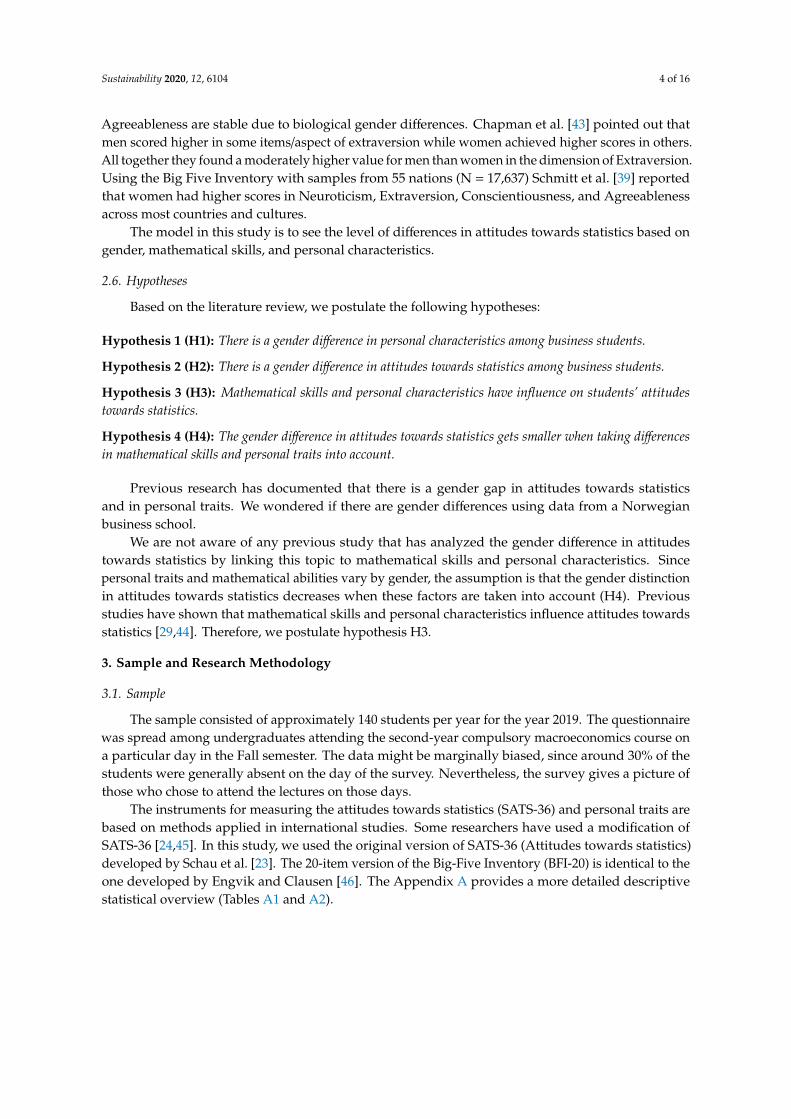
The sample consisted of approximately 140 students per year for the year 2019. The questionnairewas spread among undergraduates attending the second-year compulsory macroeconomics course ona particular day in the Fall semester. The data might be marginally biased, since around 30% of thestudents were generally absent on the day of the survey. Nevertheless, the survey gives a picture ofthose who chose to attend the lectures on those days.
The instruments for measuring the attitudes towards statistics (SATS-36) and personal traits arebased on methods applied in international studies. Some researchers have used a modification ofSATS-36 [24,45]. In this study, we used the original version of SATS-36 (Attitudes towards statistics)developed by Schau et al. [23]. The 20-item version of the Big-Five Inventory (BFI-20) is identical to theone developed by Engvik and Clausen [46]. The Appendix A provides a more detailed descriptivestatistical overview (Tables A1 and A2).
Sustainability 2020, 12, 6104 5 of 16
3.2. The Model
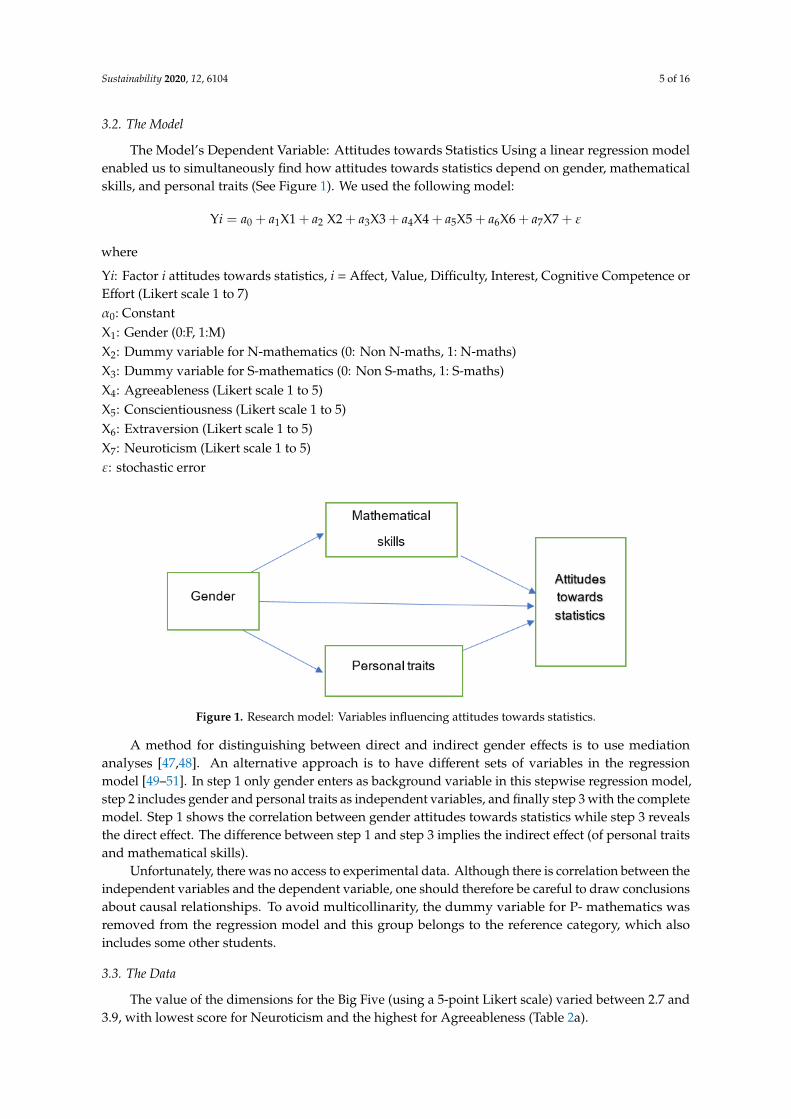
The Model’s Dependent Variable: Attitudes towards Statistics Using a linear regression modelenabled us to simultaneously find how attitudes towards statistics depend on gender, mathematicalskills, and personal traits (See Figure 1). We used the following model:
Yi = a0 + a1X1 + a2 X2 + a3X3 + a4X4 + a5X5 + a6X6 + a7X7 + ε
where
Yi: Factor i attitudes towards statistics, i = Affect, Value, Difficulty, Interest, Cognitive Competence orEffort (Likert scale 1 to 7)α0: ConstantX1: Gender (0:F, 1:M)X2: Dummy variable for N-mathematics (0: Non N-maths, 1: N-maths)X3: Dummy variable for S-mathematics (0: Non S-maths, 1: S-maths)X4: Agreeableness (Likert scale 1 to 5)X5: Conscientiousness (Likert scale 1 to 5)X6: Extraversion (Likert scale 1 to 5)X7: Neuroticism (Likert scale 1 to 5)ε: stochastic error
Sustainability 2020, 12, x 5 of 16
Y𝑖 𝑎 𝑎 X1 𝑎 X2 𝑎 X3 𝑎 X4 𝑎 X5 𝑎 X6 𝑎 X7 𝜀
where
Yi: Factor i attitudes towards statistics, i = Affect, Value, Difficulty, Interest, Cognitive Competence
or Effort (Likert scale 1 to 7)
α0: Constant
X1: Gender (0:F, 1:M)
X2: Dummy variable for N‐mathematics (0: Non N‐maths, 1: N‐maths)
X3: Dummy variable for S‐mathematics (0: Non S‐maths, 1: S‐maths)
X4: Agreeableness (Likert scale 1 to 5)
X5: Conscientiousness (Likert scale 1 to 5)
X6: Extraversion (Likert scale 1 to 5)
X7: Neuroticism (Likert scale 1 to 5)
ε: stochastic error
Figure 1. Research model: Variables influencing attitudes towards statistics.
A method for distinguishing between direct and indirect gender effects is to use mediation
analyses [47,48]. An alternative approach is to have different sets of variables in the regression model
[49–51]. In step 1 only gender enters as background variable in this stepwise regression model, step
2 includes gender and personal traits as independent variables, and finally step 3 with the complete
model. Step 1 shows the correlation between gender attitudes towards statistics while step 3 reveals
the direct effect. The difference between step 1 and step 3 implies the indirect effect (of personal traits
and mathematical skills).
Unfortunately, there was no access to experimental data. Although there is correlation between
the independent variables and the dependent variable, one should therefore be careful to draw
conclusions about causal relationships. To avoid multicollinarity, the dummy variable for
P‐ mathematics was removed from the regression model and this group belongs to the reference
category, which also includes some other students.
3.3. The Data
The value of the dimensions for the Big Five (using a 5‐point Likert scale) varied between 2.7
and 3.9, with lowest score for Neuroticism and the highest for Agreeableness (Table 2a).
There was also a considerable variation in the attitudes towards statistics (Table 2b). On a 7‐
point Likert scale, Difficulty was at the bottom with a value of 3.52 and Effort was on top with a value
of 5.67. There were also some differences in the values of the standard deviation.
Table 2c shows that the majority of business undergraduates are women (51.2%). Notice also
that most of the women students preferred practical mathematics (P‐maths) or mathematics for
business and social science (S‐maths). Among the students with backgrounds in mathematics for
natural science (N‐maths), there was an underrepresentation of women. More men than women
Figure 1. Research model: Variables influencing attitudes towards statistics.
A method for distinguishing between direct and indirect gender effects is to use mediationanalyses [47,48]. An alternative approach is to have different sets of variables in the regressionmodel [49–51]. In step 1 only gender enters as background variable in this stepwise regression model,step 2 includes gender and personal traits as independent variables, and finally step 3 with the completemodel. Step 1 shows the correlation between gender attitudes towards statistics while step 3 revealsthe direct effect. The difference between step 1 and step 3 implies the indirect effect (of personal traitsand mathematical skills).
Unfortunately, there was no access to experimental data. Although there is correlation between theindependent variables and the dependent variable, one should therefore be careful to draw conclusionsabout causal relationships. To avoid multicollinarity, the dummy variable for P- mathematics wasremoved from the regression model and this group belongs to the reference category, which alsoincludes some other students.
3.3. The Data
The value of the dimensions for the Big Five (using a 5-point Likert scale) varied between 2.7 and3.9, with lowest score for Neuroticism and the highest for Agreeableness (Table 2a).
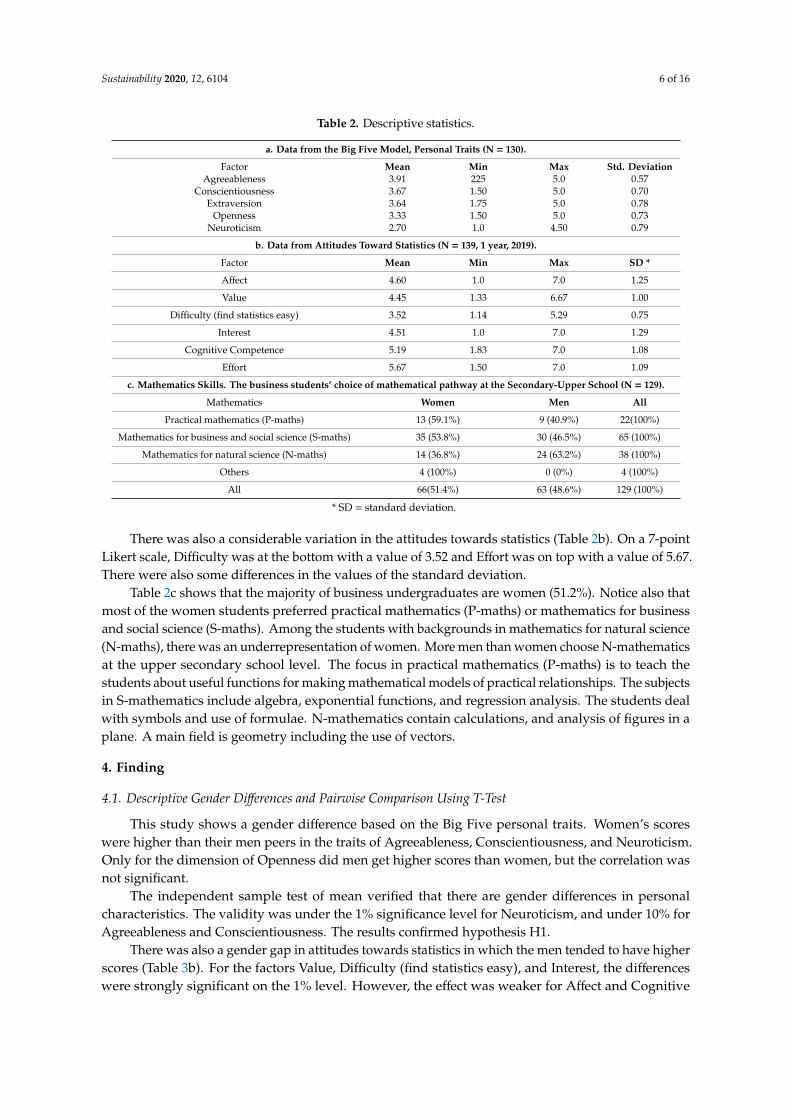
Sustainability 2020, 12, 6104 6 of 16
Table 2. Descriptive statistics.
a. Data from the Big Five Model, Personal Traits (N = 130).
Factor Mean Min Max Std. DeviationAgreeableness 3.91 225 5.0 0.57
Conscientiousness 3.67 1.50 5.0 0.70Extraversion 3.64 1.75 5.0 0.78
Openness 3.33 1.50 5.0 0.73Neuroticism 2.70 1.0 4.50 0.79
b. Data from Attitudes Toward Statistics (N = 139, 1 year, 2019).
Factor Mean Min Max SD *
Affect 4.60 1.0 7.0 1.25
Value 4.45 1.33 6.67 1.00
Difficulty (find statistics easy) 3.52 1.14 5.29 0.75
Interest 4.51 1.0 7.0 1.29
Cognitive Competence 5.19 1.83 7.0 1.08
Effort 5.67 1.50 7.0 1.09
c. Mathematics Skills. The business students’ choice of mathematical pathway at the Secondary-Upper School (N = 129).
Mathematics Women Men All
Practical mathematics (P-maths) 13 (59.1%) 9 (40.9%) 22(100%)
Mathematics for business and social science (S-maths) 35 (53.8%) 30 (46.5%) 65 (100%)
Mathematics for natural science (N-maths) 14 (36.8%) 24 (63.2%) 38 (100%)
Others 4 (100%) 0 (0%) 4 (100%)
All 66(51.4%) 63 (48.6%) 129 (100%)
* SD = standard deviation.
There was also a considerable variation in the attitudes towards statistics (Table 2b). On a 7-pointLikert scale, Difficulty was at the bottom with a value of 3.52 and Effort was on top with a value of 5.67.There were also some differences in the values of the standard deviation.
Table 2c shows that the majority of business undergraduates are women (51.2%). Notice also thatmost of the women students preferred practical mathematics (P-maths) or mathematics for businessand social science (S-maths). Among the students with backgrounds in mathematics for natural science(N-maths), there was an underrepresentation of women. More men than women choose N-mathematicsat the upper secondary school level. The focus in practical mathematics (P-maths) is to teach thestudents about useful functions for making mathematical models of practical relationships. The subjectsin S-mathematics include algebra, exponential functions, and regression analysis. The students dealwith symbols and use of formulae. N-mathematics contain calculations, and analysis of figures in aplane. A main field is geometry including the use of vectors.
4. Finding
4.1. Descriptive Gender Differences and Pairwise Comparison Using T-Test
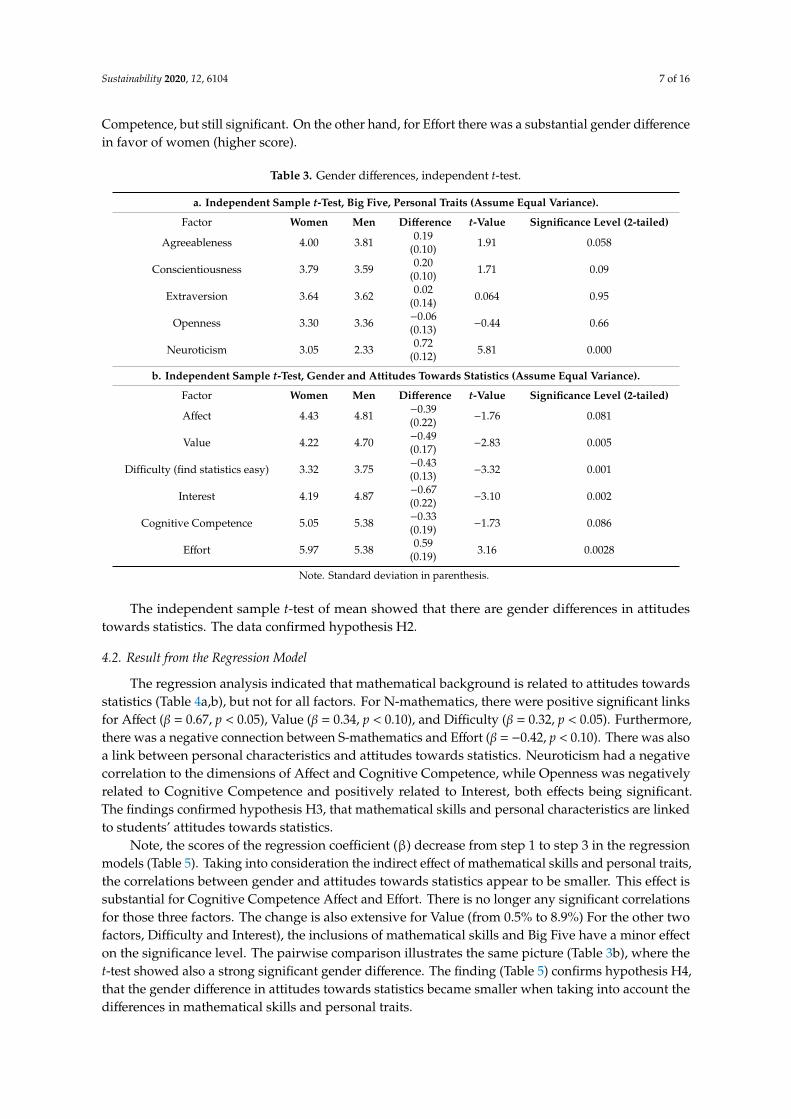
This study shows a gender difference based on the Big Five personal traits. Women’s scoreswere higher than their men peers in the traits of Agreeableness, Conscientiousness, and Neuroticism.Only for the dimension of Openness did men get higher scores than women, but the correlation wasnot significant.
The independent sample test of mean verified that there are gender differences in personalcharacteristics. The validity was under the 1% significance level for Neuroticism, and under 10% forAgreeableness and Conscientiousness. The results confirmed hypothesis H1.
There was also a gender gap in attitudes towards statistics in which the men tended to have higherscores (Table 3b). For the factors Value, Difficulty (find statistics easy), and Interest, the differenceswere strongly significant on the 1% level. However, the effect was weaker for Affect and Cognitive
Sustainability 2020, 12, 6104 7 of 16
Competence, but still significant. On the other hand, for Effort there was a substantial gender differencein favor of women (higher score).
Table 3. Gender differences, independent t-test.
a. Independent Sample t-Test, Big Five, Personal Traits (Assume Equal Variance).
Factor Women Men Difference t-Value Significance Level (2-tailed)
Agreeableness 4.00 3.81 0.19(0.10) 1.91 0.058
Conscientiousness 3.79 3.59 0.20(0.10) 1.71 0.09
Extraversion 3.64 3.62 0.02(0.14) 0.064 0.95
Openness 3.30 3.36 −0.06(0.13) −0.44 0.66
Neuroticism 3.05 2.33 0.72(0.12) 5.81 0.000
b. Independent Sample t-Test, Gender and Attitudes Towards Statistics (Assume Equal Variance).
Factor Women Men Difference t-Value Significance Level (2-tailed)
Affect 4.43 4.81 −0.39(0.22) −1.76 0.081
Value 4.22 4.70 −0.49(0.17) −2.83 0.005
Difficulty (find statistics easy) 3.32 3.75 −0.43(0.13) −3.32 0.001
Interest 4.19 4.87 −0.67(0.22) −3.10 0.002
Cognitive Competence 5.05 5.38 −0.33(0.19) −1.73 0.086
Effort 5.97 5.38 0.59(0.19) 3.16 0.0028
Note. Standard deviation in parenthesis.
The independent sample t-test of mean showed that there are gender differences in attitudestowards statistics. The data confirmed hypothesis H2.
4.2. Result from the Regression Model
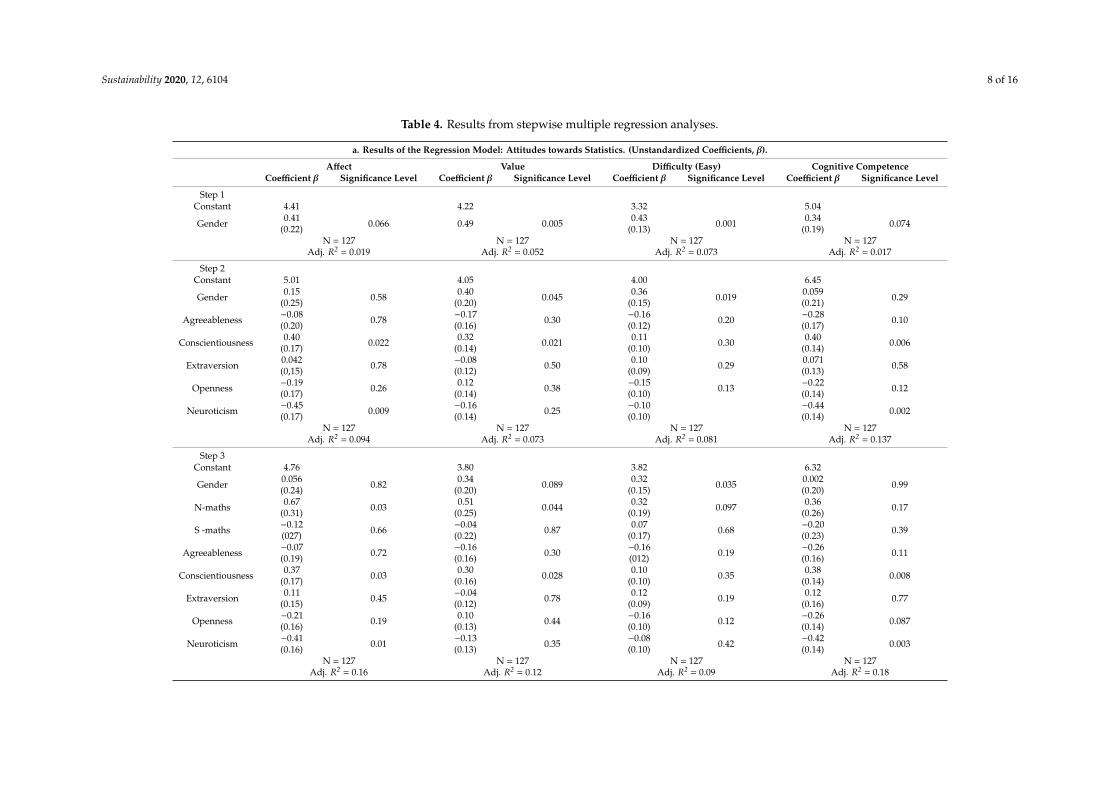
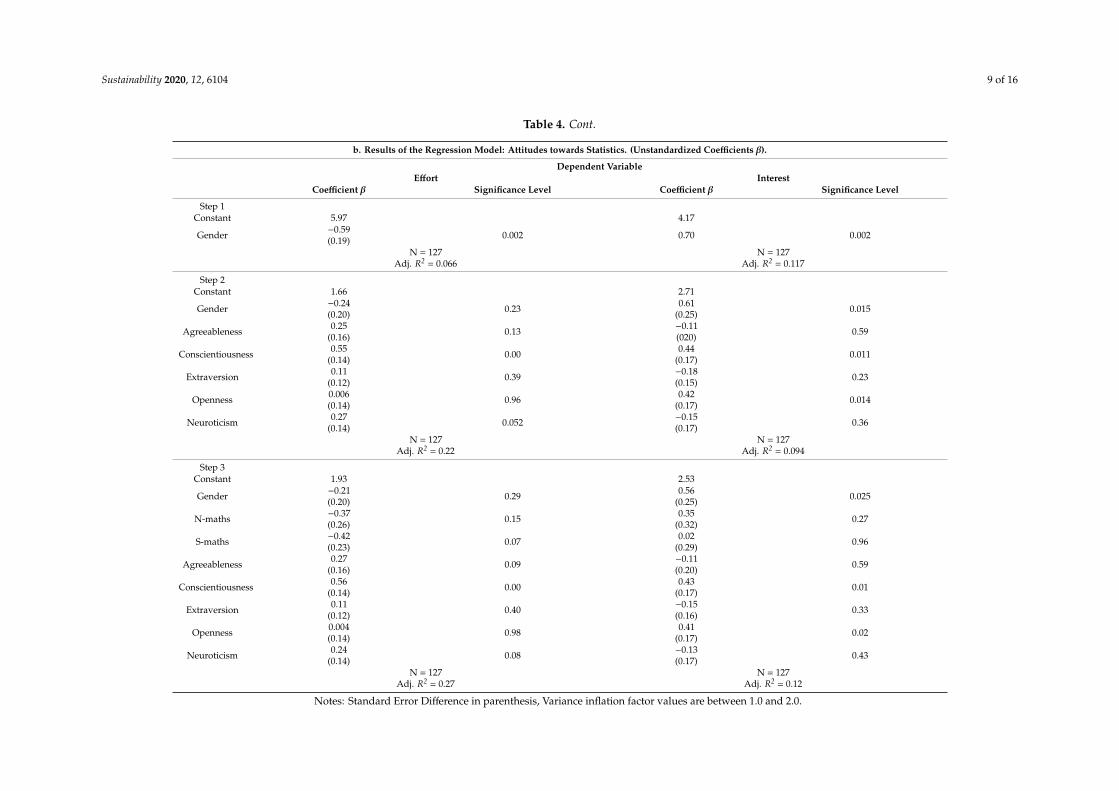
The regression analysis indicated that mathematical background is related to attitudes towardsstatistics (Table 4a,b), but not for all factors. For N-mathematics, there were positive significant linksfor Affect (β = 0.67, p < 0.05), Value (β = 0.34, p < 0.10), and Difficulty (β = 0.32, p < 0.05). Furthermore,there was a negative connection between S-mathematics and Effort (β = −0.42, p < 0.10). There was alsoa link between personal characteristics and attitudes towards statistics. Neuroticism had a negativecorrelation to the dimensions of Affect and Cognitive Competence, while Openness was negativelyrelated to Cognitive Competence and positively related to Interest, both effects being significant.The findings confirmed hypothesis H3, that mathematical skills and personal characteristics are linkedto students’ attitudes towards statistics.
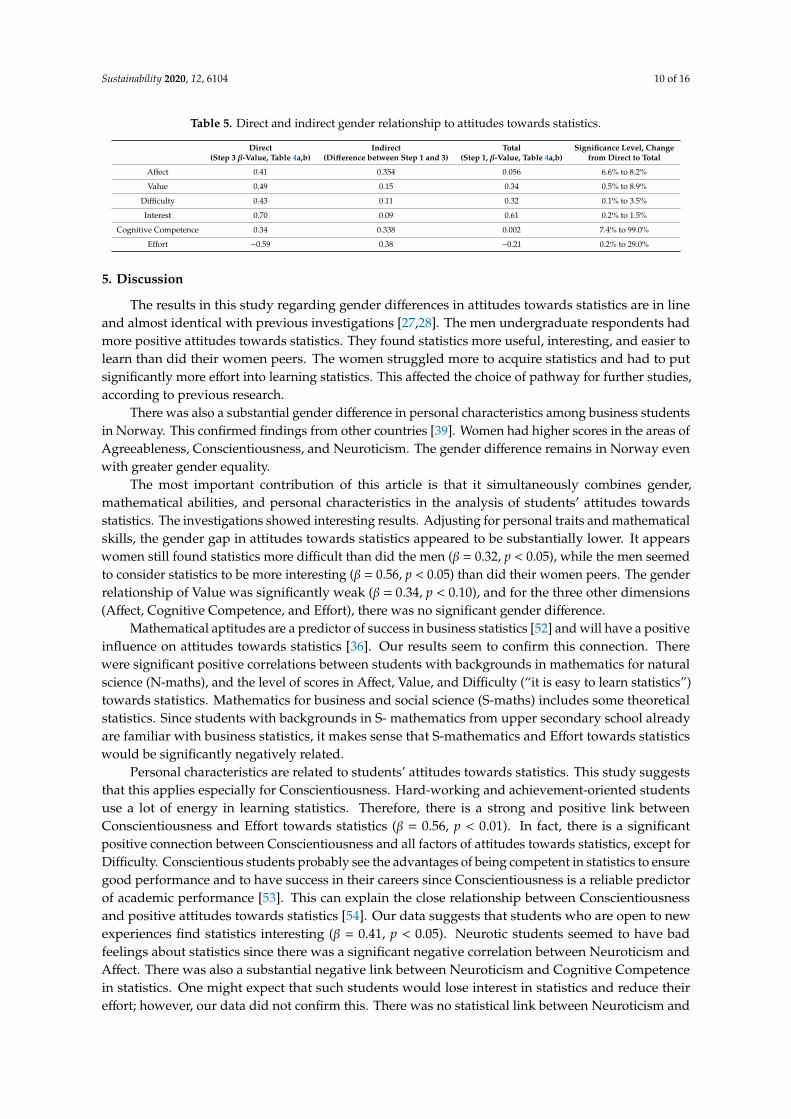
Note, the scores of the regression coefficient (β) decrease from step 1 to step 3 in the regressionmodels (Table 5). Taking into consideration the indirect effect of mathematical skills and personal traits,the correlations between gender and attitudes towards statistics appear to be smaller. This effect issubstantial for Cognitive Competence Affect and Effort. There is no longer any significant correlationsfor those three factors. The change is also extensive for Value (from 0.5% to 8.9%) For the other twofactors, Difficulty and Interest), the inclusions of mathematical skills and Big Five have a minor effecton the significance level. The pairwise comparison illustrates the same picture (Table 3b), where thet-test showed also a strong significant gender difference. The finding (Table 5) confirms hypothesis H4,that the gender difference in attitudes towards statistics became smaller when taking into account thedifferences in mathematical skills and personal traits.
Sustainability 2020, 12, 6104 8 of 16
Table 4. Results from stepwise multiple regression analyses.
a. Results of the Regression Model: Attitudes towards Statistics. (Unstandardized Coefficients, β).
Affect Value Difficulty (Easy) Cognitive CompetenceCoefficient β Significance Level Coefficient β Significance Level Coefficient β Significance Level Coefficient β Significance Level
Step 1Constant 4.41 4.22 3.32 5.04
Gender 0.41(0.22) 0.066 0.49 0.005 0.43
(0.13) 0.001 0.34(0.19) 0.074
N = 127Adj. R2 = 0.019
N = 127Adj. R2 = 0.052
N = 127Adj. R2 = 0.073
N = 127Adj. R2 = 0.017
Step 2Constant 5.01 4.05 4.00 6.45
Gender 0.15(0.25) 0.58 0.40
(0.20) 0.045 0.36(0.15) 0.019 0.059
(0.21) 0.29
Agreeableness −0.08(0.20) 0.78 −0.17
(0.16) 0.30 −0.16(0.12) 0.20 −0.28
(0.17) 0.10
Conscientiousness 0.40(0.17) 0.022 0.32
(0.14) 0.021 0.11(0.10) 0.30 0.40
(0.14) 0.006
Extraversion 0.042(0,15) 0.78 −0.08
(0.12) 0.50 0.10(0.09) 0.29 0.071
(0.13) 0.58
Openness −0.19(0.17) 0.26 0.12
(0.14) 0.38 −0.15(0.10) 0.13 −0.22
(0.14) 0.12
Neuroticism −0.45(0.17) 0.009 −0.16
(0.14) 0.25 −0.10(0.10)
−0.44(0.14) 0.002
N = 127Adj. R2 = 0.094
N = 127Adj. R2 = 0.073
N = 127Adj. R2 = 0.081
N = 127Adj. R2 = 0.137
Step 3Constant 4.76 3.80 3.82 6.32
Gender 0.056(0.24) 0.82 0.34
(0.20) 0.089 0.32(0.15) 0.035 0.002
(0.20) 0.99
N-maths 0.67(0.31) 0.03 0.51
(0.25) 0.044 0.32(0.19) 0.097 0.36
(0.26) 0.17
S -maths −0.12(027) 0.66 −0.04
(0.22) 0.87 0.07(0.17) 0.68 −0.20
(0.23) 0.39
Agreeableness −0.07(0.19) 0.72 −0.16
(0.16) 0.30 −0.16(012) 0.19 −0.26
(0.16) 0.11
Conscientiousness 0.37(0.17) 0.03 0.30
(0.16) 0.028 0.10(0.10) 0.35 0.38
(0.14) 0.008
Extraversion 0.11(0.15) 0.45 −0.04
(0.12) 0.78 0.12(0.09) 0.19 0.12
(0.16) 0.77
Openness −0.21(0.16) 0.19 0.10
(0.13) 0.44 −0.16(0.10) 0.12 −0.26
(0.14) 0.087
Neuroticism −0.41(0.16) 0.01 −0.13
(0.13) 0.35 −0.08(0.10) 0.42 −0.42
(0.14) 0.003
N = 127Adj. R2 = 0.16
N = 127Adj. R2 = 0.12
N = 127Adj. R2 = 0.09
N = 127Adj. R2 = 0.18
Sustainability 2020, 12, 6104 9 of 16
Table 4. Cont.
b. Results of the Regression Model: Attitudes towards Statistics. (Unstandardized Coefficients β).
Dependent VariableEffort Interest
Coefficient β Significance Level Coefficient β Significance Level
Step 1Constant 5.97 4.17
Gender −0.59(0.19) 0.002 0.70 0.002
N = 127Adj. R2 = 0.066
N = 127Adj. R2 = 0.117
Step 2Constant 1.66 2.71
Gender −0.24(0.20) 0.23 0.61
(0.25) 0.015
Agreeableness 0.25(0.16) 0.13 −0.11
(020) 0.59
Conscientiousness 0.55(0.14) 0.00 0.44
(0.17) 0.011
Extraversion 0.11(0.12) 0.39 −0.18
(0.15) 0.23
Openness 0.006(0.14) 0.96 0.42
(0.17) 0.014
Neuroticism 0.27(0.14) 0.052 −0.15
(0.17) 0.36
N = 127Adj. R2 = 0.22
N = 127Adj. R2 = 0.094
Step 3Constant 1.93 2.53
Gender −0.21(0.20) 0.29 0.56
(0.25) 0.025
N-maths −0.37(0.26) 0.15 0.35
(0.32) 0.27
S-maths −0.42(0.23) 0.07 0.02
(0.29) 0.96
Agreeableness 0.27(0.16) 0.09 −0.11
(0.20) 0.59
Conscientiousness 0.56(0.14) 0.00 0.43
(0.17) 0.01
Extraversion 0.11(0.12) 0.40 −0.15
(0.16) 0.33
Openness 0.004(0.14) 0.98 0.41
(0.17) 0.02
Neuroticism 0.24(0.14) 0.08 −0.13
(0.17) 0.43
N = 127Adj. R2 = 0.27
N = 127Adj. R2 = 0.12
Notes: Standard Error Difference in parenthesis, Variance inflation factor values are between 1.0 and 2.0.
Sustainability 2020, 12, 6104 10 of 16
Table 5. Direct and indirect gender relationship to attitudes towards statistics.
Direct(Step 3 β-Value, Table 4a,b)
Indirect(Difference between Step 1 and 3)
Total(Step 1, β-Value, Table 4a,b)
Significance Level, Changefrom Direct to Total
Affect 0.41 0.354 0.056 6.6% to 8.2%
Value 0.49 0.15 0.34 0.5% to 8.9%
Difficulty 0.43 0.11 0.32 0.1% to 3.5%
Interest 0.70 0.09 0.61 0.2% to 1.5%
Cognitive Competence 0.34 0.338 0.002 7.4% to 99.0%
Effort −0.59 0.38 −0.21 0.2% to 29.0%
5. Discussion
The results in this study regarding gender differences in attitudes towards statistics are in lineand almost identical with previous investigations [27,28]. The men undergraduate respondents hadmore positive attitudes towards statistics. They found statistics more useful, interesting, and easier tolearn than did their women peers. The women struggled more to acquire statistics and had to putsignificantly more effort into learning statistics. This affected the choice of pathway for further studies,according to previous research.
There was also a substantial gender difference in personal characteristics among business studentsin Norway. This confirmed findings from other countries [39]. Women had higher scores in the areas ofAgreeableness, Conscientiousness, and Neuroticism. The gender difference remains in Norway evenwith greater gender equality.
The most important contribution of this article is that it simultaneously combines gender,mathematical abilities, and personal characteristics in the analysis of students’ attitudes towardsstatistics. The investigations showed interesting results. Adjusting for personal traits and mathematicalskills, the gender gap in attitudes towards statistics appeared to be substantially lower. It appearswomen still found statistics more difficult than did the men (β = 0.32, p < 0.05), while the men seemedto consider statistics to be more interesting (β = 0.56, p < 0.05) than did their women peers. The genderrelationship of Value was significantly weak (β = 0.34, p < 0.10), and for the three other dimensions(Affect, Cognitive Competence, and Effort), there was no significant gender difference.
Mathematical aptitudes are a predictor of success in business statistics [52] and will have a positiveinfluence on attitudes towards statistics [36]. Our results seem to confirm this connection. Therewere significant positive correlations between students with backgrounds in mathematics for naturalscience (N-maths), and the level of scores in Affect, Value, and Difficulty (“it is easy to learn statistics”)towards statistics. Mathematics for business and social science (S-maths) includes some theoreticalstatistics. Since students with backgrounds in S- mathematics from upper secondary school alreadyare familiar with business statistics, it makes sense that S-mathematics and Effort towards statisticswould be significantly negatively related.
Personal characteristics are related to students’ attitudes towards statistics. This study suggeststhat this applies especially for Conscientiousness. Hard-working and achievement-oriented studentsuse a lot of energy in learning statistics. Therefore, there is a strong and positive link betweenConscientiousness and Effort towards statistics (β = 0.56, p < 0.01). In fact, there is a significantpositive connection between Conscientiousness and all factors of attitudes towards statistics, except forDifficulty. Conscientious students probably see the advantages of being competent in statistics to ensuregood performance and to have success in their careers since Conscientiousness is a reliable predictorof academic performance [53]. This can explain the close relationship between Conscientiousnessand positive attitudes towards statistics [54]. Our data suggests that students who are open to newexperiences find statistics interesting (β = 0.41, p < 0.05). Neurotic students seemed to have badfeelings about statistics since there was a significant negative correlation between Neuroticism andAffect. There was also a substantial negative link between Neuroticism and Cognitive Competencein statistics. One might expect that such students would lose interest in statistics and reduce theireffort; however, our data did not confirm this. There was no statistical link between Neuroticism and
Sustainability 2020, 12, 6104 11 of 16
Interest in statistics, and note also, there was a significant positive link between Neuroticism and Effort.Even those students who disliked statistics seemed to realize the subject was important. Therefore,they would spend more time learning statistics.
6. Limitations
The present dataset is from only one business school in Norway. It is difficult to say how validthe results are in an international context. There are probably other important factors to explain theattitudes towards statistics since the R square values are rather low.
This study applied the original version of attitudes towards statistics (SATS-36). To ensure a higherscore of goodness-of-fit, some researchers conducted an explanatory factor analysis and thereforeused adjusted versions of SATS-36. In line with many other papers [28,55–57], this procedure was notconsidered here. The original version is widely used internationally.
7. Conclusions
Similar to previous research, this study reported a substantial gender gap among business studentsin Norway in attitudes towards statistics. However, after taking into account the gender differences inpersonal traits and the level of mathematical skills, the gender differences in attitudes towards statisticswere significantly reduced. Some personality characteristics have obviously different effects on menand women and there is also a link between mathematical skills and attitudes towards statistics.
Since business statistics is an important tool for success in business studies, students need to knowmore about which factors influence their attitudes towards statistics and to further explore the genderdifference. Hopefully, this article has contributed to achieve more insight into this topic.
The choice of subjects and especially the mathematical pathway at upper secondary school matters.One policy implication is to ensure the students are well informed about the consequences of thevarious choices made at upper secondary school.
Funding: This research received no external funding.
Conflicts of Interest: The author declares no conflict of interest.
Appendix A
Table A1 gives an overview of the sample used in this analysis. The values for Skewness andKurtosis are well within acceptable values, except for the factor Effort. The Scala Reliabilities scores arealso appropriate. If we exclude Agreeableness, all Cronbach’s Alfa values are around 0.6 or higher.
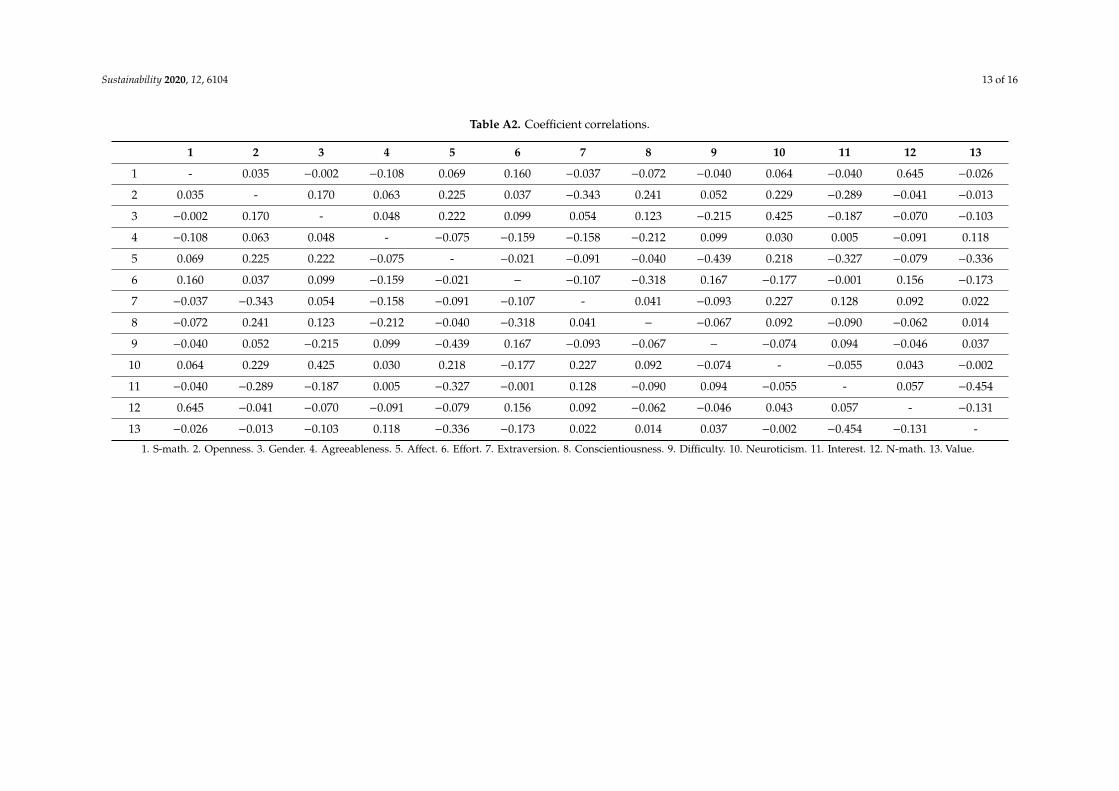
Table A2 shows the correlation among the variables.
Sustainability 2020, 12, 6104 12 of 16
Table A1. Descriptive statistics, skewness, kurtosis, and scale reliability (Cronbach’s Alfa).
N Min Max Mean Std. Deviation Skewness Std. Error Kurtosis Std. Error Scale ReliabilityCronbach’s Alfa
Affect 131 1.00 7.00 4.5941 1.24911 −0.460 0.212 0.151 0.420 0.837
Cog. Competence 131 1.83 7.00 5.1883 1.07934 −0.516 0.212 −0.053 0.420 0.840
Value 131 1.33 6.67 4.4448 0.99616 −0.220 0.212 −0.015 0.420 0.851
Difficulty 131 1.14 5.29 3.5217 0.75128 0.065 0.212 0.189 0.420 0.649
Interest 131 1.00 7.00 4.4994 1.29114 −0.222 0.212 −0.192 0.420 0.854
Effort 131 1.50 7.00 5.6698 1.08577 −1.250 0.212 1.847 0.420 0.700
Extraversion 130 1.75 5.00 3.6404 0.78305 −0.211 0.212 −0.483 0.422 0.835
Agreeableness 130 2.25 5.00 3.9103 0.56933 −0.574 0.212 0.110 0.422 0.486
Conscientiousness 130 1.50 5.00 3.6679 0.70245 −0.569 0.212 0.223 0.422 0.711
Neuroticism 130 1.00 4.50 2.7013 0.79110 0.041 0.212 −0.471 0.422 0.737
Openness 130 1.50 5.00 3.3295 0.72655 −0.120 0.212 −0.482 0.422 0.589
Valid N (listwise) 130
Sustainability 2020, 12, 6104 13 of 16
Table A2. Coefficient correlations.
1 2 3 4 5 6 7 8 9 10 11 12 13
1 - 0.035 −0.002 −0.108 0.069 0.160 −0.037 −0.072 −0.040 0.064 −0.040 0.645 −0.026
2 0.035 - 0.170 0.063 0.225 0.037 −0.343 0.241 0.052 0.229 −0.289 −0.041 −0.013
3 −0.002 0.170 - 0.048 0.222 0.099 0.054 0.123 −0.215 0.425 −0.187 −0.070 −0.103
4 −0.108 0.063 0.048 - −0.075 −0.159 −0.158 −0.212 0.099 0.030 0.005 −0.091 0.118
5 0.069 0.225 0.222 −0.075 - −0.021 −0.091 −0.040 −0.439 0.218 −0.327 −0.079 −0.336
6 0.160 0.037 0.099 −0.159 −0.021 − −0.107 −0.318 0.167 −0.177 −0.001 0.156 −0.173
7 −0.037 −0.343 0.054 −0.158 −0.091 −0.107 - 0.041 −0.093 0.227 0.128 0.092 0.022
8 −0.072 0.241 0.123 −0.212 −0.040 −0.318 0.041 − −0.067 0.092 −0.090 −0.062 0.014
9 −0.040 0.052 −0.215 0.099 −0.439 0.167 −0.093 −0.067 − −0.074 0.094 −0.046 0.037
10 0.064 0.229 0.425 0.030 0.218 −0.177 0.227 0.092 −0.074 - −0.055 0.043 −0.002
11 −0.040 −0.289 −0.187 0.005 −0.327 −0.001 0.128 −0.090 0.094 −0.055 - 0.057 −0.454
12 0.645 −0.041 −0.070 −0.091 −0.079 0.156 0.092 −0.062 −0.046 0.043 0.057 - −0.131
13 −0.026 −0.013 −0.103 0.118 −0.336 −0.173 0.022 0.014 0.037 −0.002 −0.454 −0.131 -
1. S-math. 2. Openness. 3. Gender. 4. Agreeableness. 5. Affect. 6. Effort. 7. Extraversion. 8. Conscientiousness. 9. Difficulty. 10. Neuroticism. 11. Interest. 12. N-math. 13. Value.
Sustainability 2020, 12, 6104 14 of 16
References
1. Suanpang, P.; Petocz, P.; Reid, A. Relationship between learning outcomes and online accesses. Australas. J.Educ. Technol. 2004, 20, 9–20. [CrossRef]
2. Martell, K. Assessing Student Learning: Are Business Schools Making the Grade? J. Educ. Bus. 2007, 82,189–195. [CrossRef]
3. Sebastianelli, R. Multiple student learning objectives in basic business statistics: Strategies, assessment,and recommendations. J. Educ. Bus. 2018, 93, 341–352. [CrossRef]
4. Gal, I.; Garfield, J.B. Assessment Challenge in Statistics Education; IOS Press: Amsterdam, The Netherlands, 1997.5. Reilly, D.; Neumann, D.L.; Andrews, G. Investigating Gender Differences in Mathematics and Science:
Results from the 2011 Trends in Mathematics and Science Survey. Res. Sci. Educ. 2017, 49, 25–50. [CrossRef]6. Worthington, A.; Higgs, H. Factors explaining the choice of an economics major. Int. J. Soc. Econ. 2004, 31,
593–613. [CrossRef]7. Griffith, J.D.; Adams, L.T.; Gu, L.L.; Hart, C.L.; Nichols-Whitehead, P. Students’ attitudes toward statistics
across the disciplines. A mixed-methods approach. Stat. Educ. Res. J. 2012, 11, 45–56.8. Johnson, M.; Robson, D.; Taengnoi, S. A Meta-analysis of the Gender Gap in Performance in Collegiate
Economics Courses. Rev. Soc. Econ. 2014, 72, 436–459. [CrossRef]9. Opstad, L.; Årethun, T. Factors that explain undergraduate business students’ performance in their chosen
field. Does gender matter? Glob. Conf. Bus. Financ. Proc. 2020, 15, 2–21.10. Pritchard, R.E.; Potter, G.C.; Saccucci, M.S. The Selection of a Business Major: Elements Influencing Student
Choice and Implications for Outcomes Assessment. J. Educ. Bus. 2004, 79, 152–156. [CrossRef]11. Opstad, L.; Årethun, T. Attitude towards mathematics among economics and business students in Norway.
Is there any gender difference? In Proceedings of the 16th International Conference on Enterprises, Systems,Accounting, Logistics and Management (16th ICESALM 2019), Chania, Greece, 1–3 July 2019.
12. Chiesi, F.; Primi, C. Gender differences in attitudes toward statistics: Is there a case for a confidencgap?In Proceedings of the 9th Conference of the European Society for Research in Mathematics Education (CERME9),Prague, Czech Republic, 4–8 February 2015; Krainer, K., Vondrova, N., Eds.; Charles University: Prague,Czech Republic, 2015.
13. Stoet, G.; Geary, D.C. The Gender-Equality Paradox in Science, Technology, Engineering, and MathematicsEducation. Psychol. Sci. 2018, 29, 581–593. [CrossRef]
14. Opstad, L. Success in business studies and mathematical background: The case of Norway. J. Appl. Res.High. Educ. 2018, 10, 399–408. [CrossRef]
15. Primi, C.; Bacherini, A.; Beccari, C.; Donati, M.A. Assessing math attitude through the Attitude TowardMathematics Inventory – Short form in introductory statistics course students. Stud. Educ. Eval. 2020, 64,100838. [CrossRef]
16. Salazar, L.R. Examining the Relationship between Math Self-Efficacy and Statistics Motivation in theIntroductory Business Statistics Course: Self-Compassion as a Mediator. Decis. Sci. J. Innov. Educ. 2018, 16,140–160. [CrossRef]
17. Peters, P.; Smith, A.; Middledorp, J.; Karpin, A.; Sin, S.; Kilgore, A. Learning essential terms and concepts inStatistics and Accounting. High. Educ. Res. Dev. 2013, 33, 742–756. [CrossRef]
18. Vecchione, M.; Alessandri, G.; Barbaranelli, C.; Caprara, G. Gender differences in the Big Fivepersonality development: A longitudinal investigation from late adolescence to emerging adulthood.Personal. Individ. Differ. 2012, 53, 740–746. [CrossRef]
19. Parker, R.S.; Pettijohn, C.E.; Keillor, B.D. The Nature and Role of Statistics in the Business School Curriculum.J. Educ. Bus. 1999, 75, 51–54. [CrossRef]
20. Einbinder, S.D. Reducing Research Anxiety among MSW Students. J. Teach. Soc. Work 2014, 34, 2–16.[CrossRef]
21. Nilsson, J.; Hauff, J.C. Reducing statistics anxiety using limited teaching resources. J. Int. Educ. Bus. 2018, 11,312–323. [CrossRef]
22. Ramirez, C.; Schau, C.; Emmioglu, E. The importance of attitudes in statistics education. Stat. Educ. Res. J.2012, 11, 57–71.
23. Schau, C.; Stevens, J.; Dauphinee, T.L.; Del Vecchio, A. The Development and Validation of the Survey ofAntitudes toward Statistics. Educ. Psychol. Meas. 1995, 55, 868–875. [CrossRef]
Sustainability 2020, 12, 6104 15 of 16
24. Persson, I.; Kraus, K.; Hansson, L.; Wallentin, F.Y. Confirming the structure of the survey of attitudes towardstatistics (SATS-36) by Swedish Students. Stat. Educ. Res. J. 2019, 18, 83–93.
25. Smith, T. Gamified Modules for an Introductory Statistics Course and Their Impact on Attitudes and Learning.Simul. Gaming 2017, 48, 832–854. [CrossRef]
26. Vanhoof, S.; Sotos, A.E.C.; Onghena, P.; Verschaffel, L.; Van Dooren, W.; Noortgate, W.V.D. Attitudes TowardStatistics and Their Relationship with Short- and Long-Term Exam Results. J. Stat. Educ. 2006, 14, 35–51.[CrossRef]
27. Hommik, C.; Luik, P. Adapting the Survey of Attitudes towards Statistics (SATS-36) for Estonian SecondarySchool Students. Stat. Educ. Res. J. 2017, 16, 228–239.
28. Rejón-Guardia, F.; Vich-I-Martorell, G.A.; Juaneda, C.; Cladera, M. Genfder differenced in attitudes towardsstatistics in social science degrees. In EDULEARN19 Proceedings; IATED: Palma, Mallorca, Spain, 2019;pp. 2933–2941.
29. Hannigan, A.; Hegarty, A.; Mc Grath, D. Attitudes towards statistics of graduate entry medical students: Therole of prior learning experiences. BMC Med. Educ. 2014, 14, 70. [CrossRef] [PubMed]
30. Fullerton, J.A.; Umphrey, D. An Analysis of Attitudes toward Statistics: Gender Differences among AdvertisingMajors; Annual Meeting of the Association for Education in Journalism and Mass Communication; AEJMC:Washington, DC, USA, 2001; ERIC Document Reproduction Service No. ED456479.
31. Auzmendi, E. Factors related to statistics: A study with a Spanish sample. In Proceedings of the annualmeeting of the American Educational Research Association, Chicago, IL, USA, 3–7 April 1991.
32. Tempelaar, D.; Nijhuis, J. Commonalities in attitudes and beliefs toward different academic subjects.Chall. Educ. People Lead Challenging World 2007, 10, 225–249. [CrossRef]
33. Sarikaya, E.E.; Ok, A.; Aydin, Y.C.; Schau, C. Turkish version of the Survey of Attitudes toward Statistics:Factorial Structure Invariance by Gender. Int. J. High. Educ. 2018, 7, 121.
34. Wisenbaker, J.M.; Scott, J.S. Modeling aspects of students’ attitudes and achievement in introductory statisticscourses. In Proceedings of the Annual Meeting of the American Educational Research Association, Chicago,IL, USA, 24–28 March 1997.
35. Mahmud, Z.; Zainol, M.S. Examining postgraduate students’ perceived competency in statistical dataanalysis and their attitudes toward statistics. Int. J. Edu. Inf. Technol. 2008, 2, 1, 79–86.
36. Carmona, J. Mathematical background and attitudes toward statistics in a sample of undergraduate students.Psychol. Rep. 2005, 97, 53–62. [CrossRef]
37. Costa, P.T., Jr.; McCrae, R.R. Revised NEO Personality Inventory (NEO-PI-R); Sage Publications, Inc.: New York,NY, USA, 2008.
38. O’Connor, M.C.; Paunonen, S.V. Big Five personality predictors of post-secondary academic performance.Personal. Individ. Differ. 2007, 43, 971–990. [CrossRef]
39. Schmitt, D.P.; Realo, A.; Voracek, M.; Allik, J. Why can’t a man be more like a woman? Sex differences in BigFive personality traits across 55 cultures. J. Personal. Soc. Psychol. 2008, 94, 168–182. [CrossRef] [PubMed]
40. Costa, P.T.; Terracciano, A.; McCrae, R.R.; Paul, J.C. Gender differences in personality traits across cultures:Robust and surprising findings. J. Personal. Soc. Psychol. 2001, 81, 322–331. [CrossRef] [PubMed]
41. Feingold, A. Gender differences in personality: A meta-analysis. Psychol. Bullutin 1994, 116, 429–456.[CrossRef]
42. Weisberg, Y.J.; Deyoung, C.G.; Hirsh, J.B. Gender Differences in Personality across the Ten Aspects of the BigFive. Front. Psychol. 2011, 2, 178. [CrossRef]
43. Chapman, B.P.; Duberstein, P.; Sörensen, S.; Lyness, J.M. Gender differences in Five Factor Model personalitytraits in an elderly cohort. Personal. Individ. Differ. 2007, 43, 1594–1603. [CrossRef]
44. Baloglu, M. The relationship between statistics anxiety and attitudes toward statistics. Ankara ÜniversitesiEgitim Bilimleri Fakültesi Dergisi 2007, 40, 23–39. [CrossRef]
45. Sin, Y.C.; Rosli, R. Validity and reliability of the survey of attitudes toward statistics (SATS) instrument(Kesahan dan Kebolehpercayaan Instrumen Survey of Attitudes Toward Statistics (SATS). J. Pendidik. Malays.2020, 45, 17–24.
46. Engvik, H.; Clausen, S.E. Norsk kortversjon av Big Five inventory (BFI-20). Tidsskr. Norsk Psykologforening2011, 48, 869–872. (In Norwegian)
47. Kane, L.; Ashbaugh, A.R. Simple and parallel mediation: {A} tutorial exploring anxiety sensitivity, sensationseeking, and gender. Quant. Methods Psychol. 2017, 13, 148–165. [CrossRef]
Sustainability 2020, 12, 6104 16 of 16
48. Park, H.; Oh, H.; Boo, S. The Role of Occupational Stress in the Association between Emotional Labor andMental Health: A Moderated Mediation Model. Sustainability 2019, 11, 1886. [CrossRef]
49. Baldry, A.C. The impact of direct and indirect bullying on the mental and physical health of Italian youngsters.Aggress. Behav. 2004, 30, 343–355. [CrossRef]
50. Shi, J.; Wu, C.; Qian, X. The Effects of Multiple Factors on Elderly Pedestrians’ Speed Perception and StoppingDistance Estimation of Approaching Vehicles. Sustainability 2020, 12, 5308. [CrossRef]
51. Dai, Y.; Byun, G.; Ding, F. The Direct and Indirect Impact of Gender Diversity in New Venture Teams onInnovation Performance. Entrep. Theory Pract. 2018, 43, 505–528. [CrossRef]
52. Noser, T.C.; Tanner, J.R.; Shah, S. Have Basic Mathematical Skills Grown Obsolete In The Computer Age:Assessing Basic Mathematical Skills And Forecasting Performance In A Business Statistics Course. J. Coll.Teach. Learn. 2008, 5, 1–6. [CrossRef]
53. Chamorro-Premuzic, T.; Furnham, A. Personality predicts academic performance: Evidence from twolongitudinal university samples. J. Res. Personal. 2003, 37, 319–338. [CrossRef]
54. Furnham, A.; Chamorro-Premuzic, T. Personality and intelligence as predictors of statistics examinationgrades. Personal. Individ. Differ. 2004, 37, 943–955. [CrossRef]
55. Mustam, A.A.; Adnan, M.; Johnny, J.; Setambah, M.A.B. Attitude towards statistics among pre-serviceteachers of institute of teacher education. J. Phys. Conf. Ser. 2020, 1521, 032011. [CrossRef]
56. Parnis, A.J.; Petocz, P. Secondary school students’ attitudes towards numeracy: An Australian investigationbased on the National Assessment Program—Literacy and Numeracy (NAPLAN). Aust. Educ. Res. 2016, 43,551–566. [CrossRef]
57. Walker, E.R.; Brakke, K.E. Undergraduate psychology students’ efficacy and attitudes across introductoryand advanced statistics courses. Scholarsh. Teach. Learn. Psychol. 2017, 3, 132–140. [CrossRef]
© 2020 by the author. Licensee MDPI, Basel, Switzerland. This article is an open accessarticle distributed under the terms and conditions of the Creative Commons Attribution(CC BY) license (http://creativecommons.org/licenses/by/4.0/).