Embed Size (px)
Citation preview

Industry Analysis
Attractiveness of the Personal Computer
Manufacturing Industry in the
United States
Prepared for Dr Kreiser Ohio University
Prepared by Jon Bennett Ohio University
BA 470 ndash Fall 2009
Jon Bennett
BA 470
Fall 2009
Industry Analysis
Personal Computer Manufacturing in the
United States
2 of 29 Last Modified 1162012 1014 PM
Overall Attractiveness of the Industry
The overall attractiveness of the PC manufacturing business is affected by several factors These
include general macroeconomic conditions as well as industry specific factors such as the unique
economic features of the industry competitive forces forces of change the market position and
expected behavior of the various competitors already in the industry and the industryrsquos key
success factors This report examines each of these factors in turn to arrive at an overall
assessment of the attractiveness of the industry and the types of companies that would or would
not be attracted to it The analysis starts with an assessment of the macroeconomic conditions
affecting the market
Macroeconomic Conditions (Details in Appendix A)
The world in currently in the grips of one of the longest-lasting recessions in modern times This
economic contraction has lasted 21 months and there is no consensus on whether the end is in
sight This makes the attractiveness of many industries questionable at this time
Additionally not all industries are affected equally The PC market has probably reached its
maximum penetration in terms of households and businesses At this point replacement due to
failure and obsolescence due to increasingly demanding applications are the primary drivers of
new PC purchase (see Pace of Technological Change ndash page 15) Replacement accounts for 80
of US PC purchases Since many of these demanding applications are in the home-computer
market demand is subject to disposable income which has been curtailed by the recession The
purchase of computers by businesses has also fallen sharply (see General Economic Conditions ndash
page 7) This has negative implications for the short-term attractiveness of the market
In terms of legislation and regulation there are no pending significant developments The Internet
Tax was postponed a few years ago and is not looming at this time
In terms of demographics and lifestyle changes the segment most interested in buying a new
computer in the near term are in the 18-34 year old range and are more interested in buying
laptops than desktop computers (see Population Demographics and Lifestyle ndash page 8)
The pace of technological change has been historically high in this market with both Moorersquos
law and Convergence being two forces driving the technological changes One factor Moorersquos
law when coupled with the convergence of other electronic devices into the computer is creating
a market where mobile devices could become a major competitor to traditional PC functionality
Additionally convergence is driving the computer into the televisionrsquos general arena The
consensus is that the market is moving towards highly-capable mobile devices and away from
PCs This has very negative implications for the long-term attractiveness of this market
Dominant Economic Features (Details in Appendix B)
The market for PCs in the home as reached its maximum and growth has largely stagnated As
noted earlier the market is primarily driven by replacement There is an upward trend to having
multiple PCs in each household but the trend is probably not enough to spur market growth It
Jon Bennett
BA 470
Fall 2009
Industry Analysis
Personal Computer Manufacturing in the
United States
3 of 29 Last Modified 1162012 1014 PM
may be that people are simply keeping them around for minor functions such as checking email
or surfing the news (see Market Size and Growth Rate ndash page 11) This has very negative
implications for the attractiveness of this market
Analysis shows that the market is highly concentrated with most of the revenue (90) coming
from half of the approximately 1500 companies (see Number of Rivals ndash page 11) Further
analysis identifies only five major players (Dell Hewlett-Packard Acer Apple and Lenovo)
accounting for the lionrsquos share of the market The fact that there are so few large competitors
with the remaining market share divided by over 1000 other companies indicates that anyone
can enter but few can grow This has negative implications for the attractiveness of this
market
The number of buyers in this market is relatively stable and growing only with population The
market is fully penetrated with every one of the estimated 111 million households already fully
served This is also reflected above in the analysis of market growth rate Also as noted earlier
the replacement market is driven by technological change (see Pace of Technological Change ndash
page 15) This has very negative implications for this attractiveness of this market
This industry is strongly affected by both experience curve effects and large economies of scale
Companies entering this industry would require significant experience in large-scale electronics
manufacturing in order to have a chance at competing This has negative implications for the
attractiveness of this market to most companies
From a financial perspective standard measures of company performance such as profitability
and liquidity ratios as well as economic efficiency measures such as ROA are low for the major
players in this market It seems that in order to achieve a large market share a company must
compete primarily on the basis of price and efficiency This has extremely negative
implications for the attractiveness of this market
Porterrsquos Five-Forces Analysis (See Appendix C for details)
As would be expected from the previous discussion of the economic characteristics of this
market this market is strongly competitive The rivalry is fierce with two groups of similarly-
sized rivals launching fresh market actions in attempts to take market share When coupled with
the marketrsquos slow growth this leads to a zero-sum game where each player can only grow at
anotherrsquos expense This fierce competition is driven by low switching costs commoditization of
almost all inputs and minor to non-existent differentiation among market offerings
Pressure from Rivalry Fierce
The threat of new entrants to this market must be examined in two lights There are an extremely
large number of small competitors which intuition and experience would lead one to expect to be
competing on price in tiny and geographically distinct markets While there is great likelihood of
new entrants on this level they offer significant risk with small returns and almost no growth
opportunity Large-scale new entrants are much less likely for the same reasons This means that
the threat of significant new entrants is normal
Threat of New Entrants Normal
Jon Bennett
BA 470
Fall 2009
Industry Analysis
Personal Computer Manufacturing in the
United States
4 of 29 Last Modified 1162012 1014 PM
Pressure from substitutes comes primarily from the growing capabilities of mobile devices As
devices such as the Blackberryreg and iPhonereg grow in capability they are expected to grow in
popularity and displace PCs from many of their traditional roles (see Forces Driving Change ndash
page 20)
Pressure from Substitutes Normal
Competitive pressures from supplies are almost non-existent in this market Most of the inputs
are commodity items and the remainder (CPU GPU) are facing their own competitive
pressures to sell as many units as possible The only pressure that may come from suppliers is
preferential treatment of important PC manufacturers in times of shortage such as during the
release of new items In recent years this has been mitigated by the fact that most of the cutting-
edge chips are aimed at high-performance computing which does not represent a large market
segment This allows the chip makers time to ramp up production without facing market
shortages
Pressure from Suppliers Weak
Buyers are in the driverrsquos seat in this market With the commoditization of computer hardware
the lack of differentiation due to the standardization of the operating system and the high-level
of performance that is normal with most hardware on the market today there is almost no
switching cost for the buyer This has led to an erosion of brand loyalty and extreme price
sensitivity
Pressure from Buyers Fierce
In total the five forces average around 21 on a 0-4 scale indicating a moderate level of
competitive pressure Moderate competitive pressure is common in many industries
This is neutral with respect to the attractiveness of this market
Forces Driving Change (See Appendix D for Details)
There are a variety of forces driving change in this industry These include the rapid
development and increasing capabilities of Smart Phones to perform some of the duties once
handled by PCs Additionally Cloud computing is removing much of the driving force for
increasing speed and memory requirements that characterized the PC market in the past Finally
Internet sales have been able to bypass many aspects of the historical lsquobricks and mortarrsquo
distribution channel This allows any manufacturer anywhere in the world to sell within the
US without having to start a distribution channel
In total the above forces are changing the PC industry by reducing its future growth
opportunities while increasing price competition
This has negative implications for the attractiveness of this market
Market Positions of Competitors (See Appendix E for Details)
The market positions of the various major competitors with the exception of Apple are easily
characterized as linear with market share correlating with high return on assets This correlation
Jon Bennett
BA 470
Fall 2009
Industry Analysis
Personal Computer Manufacturing in the
United States
5 of 29 Last Modified 1162012 1014 PM
between market share and efficiency provides further strength for the argument that competition
is primarily on the basis of price The two strategic group maps Market Share and ROA (on
page 22) and ROA and Customer Support (on page 23) offer additional insight on the fact that
price is the only significant driver of market share Since this is a low-margin industry with
almost no growth opportunities it is worthwhile to anticipate the various strategic moves that the
various competitors will make
Probable Strategic Moves by Competitors (See Appendix F for Details)
The five primary competitors can easily be grouped into three groups with similar strategic
options The first group comprised of Dell and HP has high ROAs moderate operating margins
and the two largest market shares Both of these companies have responded to conditions in the
PC manufacturing industry by seeking to diversify into related businesses with higher margins
In both cases they have purchased the remains of earlier Ross Perot companies (EDS and Perot
Systems) It would not be a surprise to see both of them follow IBMrsquos lead and outsource their
PC manufacturing to an overseas company probably in China and probably one of the
companies in our second group
The second group comprised of Acer and Lenovo has abysmal financial characteristics that
reflect their deep involvement in a commoditized industry While Acer is approximately seven
times as large as Lenovo in terms of market share it does not seem to have any better long-term
growth opportunities Given the larger market share and financial strength of Acer relative to
Lenovo it should be expected that Acer will acquire Lenovo as part of a consolidation in the
Chinese PC manufacturing industry
The third lsquogrouprsquo is comprised only of Apple Apple has done a fantastic job of maintaining its
market niche in what might be called luxury computing while expanding into consumer
electronics with the iPod and into the mobile devices market with the iPhone Applersquos long-term
growth prospects are excellent and Apple has the strongest balance sheet and financial ratios of
any of the companies in the analysis set Apple will continue to do what it has been doing
The fact that the players with the strongest financial health are diversifying outside of the
PC manufacturing industry while the ones with the weakest financial health are heading
into a consolidation has very negative implications for the attractiveness of this industry
Key Success Factors (See Appendix G for Details)
The key success factors for the PC manufacturing industry are few simple and strangely
irrelevant This is because they are necessary but not sufficient for financial success
Establishing a strong brand ndash Establishing a strong brand as Dell and HP have done allows a
company to gain market share Still with the paper-thin margins large economies of scale and
total lack of brand loyalty relative to price this does not confer and worthwhile advantage
Producing market-favored goods ndash This factor is necessary in order to sell anything at all The
problem is that there is and probably cannot be any product differentiation This means that if a
Jon Bennett
BA 470
Fall 2009
Industry Analysis
Personal Computer Manufacturing in the
United States
6 of 29 Last Modified 1162012 1014 PM
company is smart enough to product market-favored goods their product will look like every
other PC on the market This leaves price as the only competitive driver
Economies of Scale and Competitive Pricing ndash These two success factors must be treated
together because price is the sales driver and the price level is set by minimizing the margin of
production costs Ultimately this means that until a company reaches the high economies of
scale while cutting its margin it cannot compete in the marketplace If the company does achieve
these success factors then the margin will not offer enough return to justify the risks
Collectively the key success factors are necessary but not sufficient to achieve a financially
sound business This has very negative implications for the attractiveness of this market
Conclusion
In almost every category of analysis this market has shown to be very unattractive The more
successful players have either exited the market (IBM) or are diversifying to related businesses
that offer a better margin (Dell and HP) The ones that are staying in the market (Acer and
Lenovo) are probably heading for some form of shake-up and consolidation The player with the
healthiest financial ratios Apple probably has more in common with Sony or Samsung that it
does with the companies in the PC market
The inescapable conclusion is that this is a very unattractive market
Appendix A - Macroeconomic Environment
7 of 29 Last Modified 1162012 1014 PM
General Economic Conditions
According to the National Bureau of Economic Research (NBER) the United States economy
entered into a recession in December 2007 (National Bureau of Economic Research 2008) As of
now September 2009 the recession continues The contraction has lasted 21 months so far and
there is no consensus on whether or not we have reached the trough and begun an expansion
Again according to the NBER there have been 10 economic cycles since 1945 with an average
contraction of 10 months (National Bureau of Economic Research 2008) The current retraction
is putting stress on consumer spending and by extension industries that depend on consumer
spending The NBERrsquos Economic Report for the President notes
Real consumer spending stagnated in the first half of 2008 and then fell sharply in the
third quarter in what was the largest quarterly decline since 1980 This was a major
deceleration after the 28 percent average annual rate during the 2001ndash07 expansion
(National Bureau of Economic Research 2009 33)
This does not bode well for the near-term revenue for companies such as PC makers that target
the consumer market Unfortunately the outlook for business customers is no better Quoting
again from the Economic Report for the President
During the first three quarters of 2008 real business investment in equipment and
software fell 44 percent at an annual rate down from 28 percent growth in 2007
Growing categories included software (24 percent) communication equipment (52
percent) and agricultural equipment (27 percent) while investment in industrial
equipment fell 40 percent (National Bureau of Economic Research 2009 41)
This outlook is further supported by the Mintel Oxygen report Market Re-forecasts Technology
- US - April 2009 which notes the following points
In light of current macroeconomics as well as rapid developments in the market
Mintel has created a new forecast for its Home Personal Computers ndash US December
2008 report Previously Mintel had forecast 8 growth from 2008-12 for the market
as a whole Sales are now projected to decline by 14 for the same period
In terms of macroeconomics consumers are likely to be more willing to make do
with current PCs owned and households without a PC are likely to continue to make
do as well or turn to used equipment or low-end netbooks
Regardless of macroeconomic trends the desktop category has seen its peak and is
headed into permanent decline household penetration hasnrsquot risen in years standing
at 63-65 (Mintel Oxygen 2009)
In summary overall economic conditions are poor and will probably remain so for the next
several months
Appendix A - Macroeconomic Environment
8 of 29 Last Modified 1162012 1014 PM
Legislation and Regulation
Detailed searching at the United States House of Representatives reveals that HRES558 a bill
creating a ldquoNational Computer Science Education Weekrdquo was moved into committee on
61820091 There does not seem to be any other current legislation affecting the computer
industry
Population Demographics and Lifestyle
The Mintel Oxygen report Consumer Electronics Holiday Shopping - US - September 2009
notes a variety of demographic and lifestyle information that is pertinent to the PC industry
As part of surveying 2091 adults (aged 18+) with Internet access the following findings are
reported
When asked ldquowhich of the following PC and PC-related products are you interested in
purchasing between now and January 2010 either for yourself or as a gift for othersrdquo the
subjects responded as follows (Mintel Oxygen 2009)
Any consideration for purchase
Thinking about buying as gift by January 2010
Thinking about buying for self by January 2010
I am not sure what this is
Laptop PC 34 7 27 1
Desktop PC 21 5 17 1
A Netbook (such as the HP Mini or ASUS Eee)
15 4 11 8
The subjects responding to the previous question have the following age distribution
Figure 40 Interest in purchasing PCs before January 2010 by age June 2009
Any consideration for purchase All 18-24
25-34
35-44
45-54
55-64 65+
Laptop PC 34 45 44 39 31 24 17
Desktop PC 21 29 28 22 20 15 10
1 httpthomaslocgovcgi-binbdqueryDd1112temp~bdKqi1|bss111searchhtml| accessed 9292009 753
PM
Appendix A - Macroeconomic Environment
9 of 29 Last Modified 1162012 1014 PM
A Netbook (such as the HP Mini or ASUS Eee) 15 20 26 13 15 11 2
The report authors note that the age range interested in purchasing new computers is skewed
towards the lsquounder 35rsquo group This may have implications for the marketing strategies of
companies hoping to sell PCs this holiday season
In terms of lifestyle and usage patterns the Mintel Oxygen report Home Personal Computers -
US - December 2008 indicates the following usage patterns broken down by age group (Mintel
Oxygen 2008)
Total 18-24 25-34 35-44 45-54 55-64 65+
Internete-mail 82 77 86 86 82 83 74
Computer games 55 60 55 63 55 50 44
Digital music 48 59 60 59 49 34 17
Digital photo editing 47 46 56 53 45 44 32
Digital video 24 30 33 31 23 16 10
Networking devices 10 13 11 12 9 7 4
Technology
The pace of technological change in the Personal Computer arena is both clicheacute and complex
There are several factors that drive this change Two of these factors are the well-known
lsquoMoorersquos Lawrsquo and the somewhat familiar concept of lsquoConvergencersquo
Moorersquos Law ldquoMoores Law describes a long-term trend in the history of computing
hardware in which the number of transistors that can be placed inexpensively on an
integrated circuit has doubled approximately every two years[1] Rather than being a
naturally-occurring law that cannot be controlled however Moores Law is effectively
a business practice in which the advancement of transistor counts occurs at a fixed raterdquo2
The implication of Moorersquos law is that computers become faster and less expensive with great
frequency This allows for broader application of the computer to activities that were previously
too computationally expensive Moorersquos law is ultimately the driving force behind
lsquoConvergencersquo
In his Telephony article ldquoWhen TVs and PCs colliderdquo Ed Gubbins examines some of the
concepts and issues facing the convergence of the Personal Computer with the Television He
notes that ldquowith the rise of IPTV and online video among other trends TVs and PCs
increasingly are crowding each others turf posing plenty of questions about how the roles
played by these devices will shift over timehelliprdquo (Gubbins 2008) The convergence issues are also
2 httpenwikipediaorgwikiMoore27s_law accessed 9292009 903 PM
Appendix A - Macroeconomic Environment
10 of 29 Last Modified 1162012 1014 PM
being addressed by Microsoftreg with the Microsoft Media Center On the Microsoft Media
Center website Microsoft invites us to
Enjoy your entire digital entertainment library in full glory on your PC or even on your
TV with Windows Media CenterM
View your photos in a cinematic slide show browse
your music collection by cover art easily play DVDs watch and record TV shows
download movies and project your home videosmdashthen pass the remote to let friends and
family join in the fun (Microsoft 2009)
In addition to the technological issues raised by convergence the rise of mobile computing is
also acting as a force for change in the Personal Computer industry
In his article ldquoDisruptive Innovationrdquo in Wireless Week Keith Mallinson asserts ldquoPC industry
be warned Mobile devices are taking computing to everyone everywhere and all of the timerdquo
(Mallinson 2008)
He goes on to note that ldquodisruptive technologies tend to be cheaper more flexible with wider
applicability and outsell what they displace They succeed despite initially providing lower
performance than incumbent technologiesrdquo This leads him to conclude that with the increases in
computing power inherent in the development of mobile telephone (and computer) technology
that ldquomobiles will become the primary and most pervasively used or only computing
devices for most of the worldrsquos populationrdquo (Mallinson 2008)
Mr Mallinson is not the only one to make assertions along this line This position is supported
by the now flat market growth in the PC industry This is explored further in the Dominant
Economic Features section of this report
Appendix B - Dominant Economic Features
11 of 29 Last Modified 1162012 1014 PM
Market Size and Growth Rate
As noted earlier the Mintel Oxygen group has provided an update to the forecasts in the Home
Personal Computers ndash US December 2008 report In that re-forecast Mintel expects that the
Home PC market will decline by 14 in the period from 2008-2014 (see page 7)
Additionally ldquothe desktop category has seen its peak and is headed into permanent decline
household penetration hasnrsquot risen in years standing at 63-65 (Mintel Oxygen 2009)rdquo
Mintel provides the following data table to emphasize the declining sales expectation for the
home computer market
Total US supplier sales and forecast of home computers at current prices 2003-12
Year Index Index
$million change 2003 = 100 2008 = 100
2003 15579 - 100 74
2004 18233 170 117 87
2005 19399 64 125 93
2006 19553 08 126 93
2007 21156 82 136 101
2008 (est) 20931 -11 134 100
2009 (fore) 19242 -81 124 92
2010 (fore) 18595 -34 119 89
2011 (fore) 18183 -22 117 87
2012 (fore) 18089 -05 116 86
Source (Mintel Oxygen 2009)
While the forecast is dour it is at least directionally consistent with other sources An article in
EDN covers some of the details of a Gartner Group report forecasting PC sales in 2009
According to the article
The market-research company projects that worldwide PC shipments will reach 274
million units in 2009 a 6 decline from 2008 shipments of 292 million units The fourth
quarter should see growth setting the stage for a healthy market recovery in 2010 with
unit shipments forecast to increase 103rdquo (EDN 2009)
Number of Rivals
The PC manufacturing market is characterized by having a few large players in competition with
each other and a large number of smaller players (sometimes individuals) engaged in local
personal selling and consultancy Hoovers describes the industry as follows
The US computer manufacturing industry includes about 1500 companies with
combined annual revenue of $70 billion Major companies include Dell Hewlett-
Appendix B - Dominant Economic Features
12 of 29 Last Modified 1162012 1014 PM
Packard IBM and Sun Microsystems The industry is highly concentrated the top 50
companies generate about 90 percent of revenue (Hoovers nd)
The Mintel Oxygen report Home Personal Computers - US - December 2008 describes the
market participants as follows
For many years PCs have been an unusually commoditized product With the notable
exception of Apple most PC makers sell boxes that contain components (such as
processors and graphic and sound systems) and software that are produced by the same
third-party vendorsmdashand are often put together in the same factories Furthermore
component-level vendors are often heavily featured in advertising and product packaging
due to co-op advertising arrangements (Mintel Oxygen 2008)
The Mintel report also summarizes recent purchases by brand and recentness of purchase
Home Personal Computers - US - December 2008 - Brand Qualities
Brand of PC most recently acquired by date of purchase April 2007-June 2008
Total
Less than 1 year ago
1 year to less than 2 years ago
2 years to less than 3 years ago
3 years to less than 4 years ago
4 years to less than 5 years ago
5 years ago or more
Dell 38 31 41 42 43 47 32
Hewlett Packard 16 19 15 15 15 13 14
Compaq 10 9 10 9 8 8 15
Gateway 8 6 7 7 8 9 12
Apple 5 9 5 4 3 2 3
eMachines 4 3 4 5 6 2 2
Toshiba 3 5 3 3 2 2 1
Sony Vaio 2 2 3 2 3 2 2
Acer 2 4 2 1 1 1 2
IBM 2 2 1 2 2 2 2
Other 9 7 8 9 11 11 7
(Mintel Oxygen 2008)
It is worth noting a peculiarity about this brand list According to the Acer Group web site3 ldquothe
Acer Group family of brands -- Acer Gateway Packard Bell and eMachines -- and their
respective sub-brands offer products with distinguished brand characteristics that target different
customer needs in the global PC marketrdquo Additionally Hewlett-Packard and Compaq merged on
May 3 2002 This is significant for a number of reasons First it implies consolidation in the
industry and secondly it points out that the above list is based on brand but not on
3 httpwwwacer-groupcompublicThe_Brandsindexhtm accessed 9292009 1102 PM
Appendix B - Dominant Economic Features
13 of 29 Last Modified 1162012 1014 PM
manufacturer Reformatting the table accounting for brand consolidation and sorting by
market share shows a clearer picture of the competitive group
Total
Less than 1 year ago
1 year to less than 2 years ago
2 years to less than 3 years ago
3 years to less than 4 years ago
4 years to less than 5 years ago
5 years ago or more
Dell 38 31 41 42 43 47 32
Hewlett Packard + Compaq 26 28 25 24 23 21 29
Acer Group 14 13 13 13 15 12 16
Other 9 7 8 9 11 11 7
Apple 5 9 5 4 3 2 3
Toshiba 3 5 3 3 2 2 1
Sony Vaio 2 2 3 2 3 2 2
IBM 2 2 1 2 2 2 2
Total 99 97 99 99 102 99 92
Here we see that the primary players in the market are Dell HP and the Acer Group Ranking
along these lines is supported by the IBISWorld 33411 - Computer amp Peripheral Manufacturing
in the US - Industry Report The following graphic from the IBISWorld report shows the key
competitors identified by IBISWorld
(IBISWorld 2009 25)
While this chart supports the inclusion of Dell HP and possibly IBM in the competitive group
it is important to understand that the market definition here includes the manufacture of
peripheral equipment For example EMC does not manufacture lsquoPersonal Computersrsquo
Appendix B - Dominant Economic Features
14 of 29 Last Modified 1162012 1014 PM
Additionally the report goes on to note that from 2002 through 2007 IBM removed itself from
most of this market
In 2002 IBM sold its hard drive manufacturing business to Hitachi Ltd and its European
desktop computer business to Sanmina-SCI In 2005 IBM sold its personal computer business to
the Lenovo group based in China In 2007 IBM sold its stake in the printer manufacturing joint
venture InfoPrint to the other Stakeholder Ricoh
IBM explains these moves in their 2008 annual report as follows
IBM has divested commoditizing businesses like personal computers and hard disk
drives and strengthened its position through strategic investments and acquisitions in
higher-value segments like business intelligence and analytics virtualization and green
solutions4
For the above reasons it seems reasonable to cite Dell HP Acer Apple and possibly the Lenovo
group as the dominant players in the industry although a significant share of the market is
scattered among a very large number of small to tiny players A further note would be that since
Acer manufacturers motherboards and many of their motherboards are used in computers
provided by the lsquoothersrsquo any analysis is likely to understate the size of the financial share of the
market owned by Acer
Scope of Competitive Rivalry
This market is almost completely globalized with the major players having significant
representation throughout the developed world
Number of Buyers
With some caveats the number of buyers approximates the number of US households There
are demographic considerations with certain brands being preferred by lower or higher income
segments (Mintel Oxygen 2008) market penetration estimates are around 63-65 of households
(Mintel Oxygen 2009) While the penetration in number of households is stagnating it is
interesting to note that multiple-computer ownership is common When Mintel asked their
subjects ldquoWhat is the number of personal computers your household ownsrdquo they gleaned the
following data
Number of home computers owned June 2002-June 2008
June 02-May 03
May 03-Apr04
May 04-May 05
May 05-Jun 06
May 06- Jun 07
Apr 07- Jun 08
One PC 59 57 58 55 54 52
Two PCs 23 25 24 25 25 26
4 ftpftpsoftwareibmcomannualreport20082008_ibm_annualpdf accessed 9292009 1147 PM
Appendix B - Dominant Economic Features
15 of 29 Last Modified 1162012 1014 PM
Three or more PCs 12 12 13 15 16 17
Average number of PCs owned 155 156 158 163 166 171
This shows that the number of computers owned per household is increasing although probably
not at a rate that could drive industry-wide growth It seems reasonable to conclude that with the
high household penetration rate and the more than 15X multiplier of computers per household it
is reasonable to use the number of households as the number of buyers (063 X 171 = 108)
According to the US Census the estimate for the number of households is 111609629 (+-
103102)5
Pace of Technological Change
It is relatively common knowledge that the pace of technological change in the PC industry is
very rapid According to the IBISWorld report 33411 - Computer amp Peripheral Manufacturing
ldquoThere is a rapid introduction of new products due to a rapid rate of technological change There
is rapid growth in customer acceptance of new products and a rapid growth in household and
business demand (IBISWorld 2009 17)rdquo
Nevertheless there are interesting developments that affect both the rate of change and the
adoption of new technologies in this market One of the most important factors that drives
demand is the need (or desire) to replace existing computers as they age The IBISWorld report
makes the following observation
Replacement demand can change over time Replacement accounts for nearly 80 of
US PC shipments and 60 of worldwide PC shipments Western Digital Corporation
stated in its 2003 annual report that it believed that the cycle time in which existing PC
owners replaced their
PCs had lengthened from two to three years to approximately three to five years This
may be due to a number of factors including improvements in products quality an
increase in the capacity of computer equipment more scrutiny on technology budgets
and slower release of new applications (IBISWorld 2009 14)
This means that the pace of technological change in the PC world can influence demand but
does not (currently) drive it There are other factors such as the rise of mobile computing
devices (non-PC) that also affect the pace of technological change in this market
Economies of Scale
There are significant economies of scale in this industry IBISWorld notes that ldquothe fall in
computer prices was promoted by a rise in economies of scale and productivity improvements in
5 httpfactfindercensusgovservletSTTable_bm=yamp-geo_id=01000USamp-
qr_name=ACS_2007_3YR_G00_S2504amp-ds_name=ACS_2007_3YR_G00_ accessed 9302009 1220 AM
Appendix B - Dominant Economic Features
16 of 29 Last Modified 1162012 1014 PM
input industries (eg semi-conductors) and by rising productivity of computer manufacturers
(IBISWorld 2009 45)rdquo Additionally ldquoeconomies of scale can represent a major factor in
competitiveness by reducing component and other costs (IBISWorld 2009 24)rdquo These
economies of scale have significant impact on the competitive landscape both in costs and in
barriers to entry These effects are examined in the five-forces analysis
Experience Curve Effects
Experience-curve effects like economies of scale are related to production volume and have
significant impact on costs These effects are present in this industry and are responsible for the
increases in productivity that in conjunction with the economies of scale caused the ongoing
reduction in costs (IBISWorld 2009 45)
Industry Ratios
Analysis of financial statements of the major players indicates the following industry averages
and rates of change
While these averages and rates of change will serve as benchmarks for other parts of the
analysis a few words are in order about them
It is interesting to note that while industry revenues are growing by a compound annual rate of
145 both gross margin and return of assets are trending downward These numbers alone
could indicate that this is an unattractive industry
Industry Averages 2006 2007 2008 Average 3-year Slope
Financial Ratios
Revenue 1446
Gross Margin (Higher is Better) 654 636 645 645 -05
Operating Margin (Higher is Better) 57 75 68 67 06
Net Margin (Higher is Better) 51 64 53 56 01
ROA (Higher is Better) 75 89 60 75 -07
Current Ratio (Higher is Better) 141 141 139 140 -001
Quick Ratio (Higher is Better) 113 109 099 107 -007
Appendix C ndash Porterrsquos Five-Forces Analysis
17 of 29 Last Modified 1162012 1014 PM
Porterrsquos Five-Forces Analysis
Rivalry
Fresh Market Actions ndash There are on-going actions by all of the major players as they
work to increase market share There seems to be two approaches here depending on the
attributes of the company The US companies (Dell and HP) are launching efforts to
diversify into higher-margin operations The Chinese competitors (Acer and Lenovo)
seem to be willing to compete on a low-cost basis
There is almost no hope of differentiating the products as they all (but Apple) have to run
the current Microsoft OS Additionally there is full penetration in all dealer networks by
almost all brands and significant Internet sales as well
Apple seems more forward-looking and is working maintain its niche (high-quality)
while expanding into the mobile market
Force Rating 4
Similarly-Sized Competitors ndash There are essentially four players in the market as
Apple is subject to significantly different forces Again the US companies are of related
size and are both significantly larger in terms of market share than the Chinese
companies Each contingent seems to be competing in its own way Dell and HP are
diversifying while Acer and Lenovo go head-to-head in manufacturing
Force Rating 4
Rivalry Due to Slow Market Growth ndash This market is completely saturated and market
growth in terms of units sold is almost stagnate The players now face a zero-sum game
This explains why IBM chose to exit the field while Dell and HP diversify
Force Rating 4
Low Switching Costs ndash There is no switching cost except between the PC variants and
the Apple Macintosh variants Among the PC makers this leads to extreme rivalry
Force Rating 4
Threat of New Entrants
Economies of Scale Effects ndash There are great economies of scale in this industry and the
effects of this fact make it both expensive and risky for a new entrant With an industry
average ROA of 75 shrinking at a compound annual rate of -07 there is little in the
way of risk-adjusted rate of return to entice new entrants
Attractiveness Rating 0
Brand Loyalty ndash There is almost no brand loyalty in this largely commoditized market
This means that anyone can enter and make a convincing marketing pitch They will have
to understand that this pitch will be primarily on the basis of price
Attractiveness Rating 4
High Capital Requirements ndash To actually manufacture PCs requires a significant
amount of capital investment When coupled with the low net margins and high risks
inherent in this industry raising such capital in the equity market seems unlikely This is
further exacerbated by the slow industry growth
Attractiveness Rating 0
Appendix C ndash Porterrsquos Five-Forces Analysis
18 of 29 Last Modified 1162012 1014 PM
Regulatory or Tariff issues ndash There are some regulatory issues with respect to pollution
that discourage electronics manufacturing in the US These are not factors for overseas
manufacturers and there are no trade regulations or tariffs
Attractiveness Rating 3
Ability of Incumbents to Block New Entrants ndash There are certain manufacturer-
supplier relationships that may be leveraged to block new entrants It would be simple for
a company like Dell to simply buy most of Intelrsquos or AMDrsquos processor chips for a short
time thus preventing a new entrant from bringing systems to market While there would
likely be anti-trust suits filed over the infraction it would be worth the fines to the
incumbents to keep another loss-leader out of an already competitive market
Attractiveness Rating 0
Pressure from Substitutes
If there is an Achillesrsquo heel in this industry this is it The growing capabilities of mobile
devices have been documented in other sections of this report IBISWorld summarizes it
nicely
Finally substitute products are also key demand determinants Products not
classified to this industry can incorporate functions that provide computing
applications (eg mobile phones digital TVs) and therefore can potentially
adversely or positively affect demand for industry products The network
computer and on-demand computing which use central servers to provide
functionality could reduce demand in value terms (IBISWorld 2009 14)
For the time being PCs will continue to have significant application in word-processing
and business functions The primary challenge is in the home (non-business) market
Force Rating 1 (but growing in the future)
Pressure from Suppliers
Supplier Bargaining Power ndash The suppliers in this industry are in an interesting
position There are only two major players in the processor market Intel and AMD and
all manufacturers support both brands Additionally there are no major functional
differences between them This leaves the PC manufacturer agnostic with respect to
processors The other components of the PC are largely commodity items so there can be
no pressure from these suppliers either
Force Rating 0
Pressure from Buyers
Buyer Bargaining Power ndash Since the PC has become a largely commoditized item with
almost no switching cost or brand loyalty the buyers tend to by based on price While
there were times when poor manufacturing standards affected the so-called lsquoclonersquo
makers those days are gone Now buyers will buy almost any brand that matches their
price point
Force Rating 4
Appendix C ndash Porterrsquos Five-Forces Analysis
19 of 29 Last Modified 1162012 1014 PM
Summary of Competitive Forces
Force Elements Average
Rivalry 4444 4 - Fierce
Threat of New Entrants 04030 14 - Weak
Pressure from Substitutes 1 1 - Weak
Supplier Bargaining Power 0 0 - Weak
Buyer Bargaining Power 4 4 - Fierce
Grand Average 21 - Moderate
In total the five forces analysis reveals that there moderate competitive forces in this industry
This hardly comes as a surprise given the financial analysis indicating that the basis of
competition is almost entirely on price
Appendix D - Forces Driving Change
20 of 29 Last Modified 1162012 1014 PM
Forces Driving Change
There are a variety of forces driving change in this industry Some of these factors are from
within the industry itself while others originate within competing product categories
Smart Phones - The rapid pace of change in smart phones emphasized to consumers by
massive ad spending provides cross-category competition from sleek new devices that
surf the internet Mintel expects computing speed and screen size to continue to rise in
smart phones with cell phone costs often subsidized by carriers consumers eyeing
budgetary constraints may prefer to upgrade the phone and leave the PC be (Mintel
Oxygen 2009)
This is perhaps the most significant long-term force in the industry Keith Mallinson of
Wireless Week makes a strong case
Mobiles will become the primary and most pervasively used or only computing
devices for most of the worldrsquos population Much of that population hasnrsquot had a
phone for long More have not yet used or rarely used a computer or Internet
connection (Mallinson 2008)
Cloud Computing - Cloud computing is clearly gaining ground among consumers even if
the term itself is relatively unknown Most e-mail software exits in the cloud Further
developments in cloud computing are likely to ensure that processor speed and RAM will
not continue to be the driving force for sales in the future that they have been in the past
(Mintel Oxygen 2009)
Internet Sales - Computer manufacturers have become more dependent on Internet sales
over the last decade Many companies sell directly to consumers through their own Web
sites or through retailers (Hoovers nd)
Appendix E - Market Positions of Competitors
21 of 29 Last Modified 1162012 1014 PM
Market Positions of Competitors
The Personal Computer manufacturing market is highly commoditized with little differentiation
in product capabilities This leads to competition on other factors With respect to home
computers customer service seems a reasonable measure However research indicates a
negative correlation between customer service (as rated by consumer reports) and market
share The following scatter chart shows the lack of relationship between market share and
customer service
Also there does not seem to be a strong relationship between market share and any standard
profitability or performance ratio The following table demonstrates this conundrum
Note the red-highlighted items indicate a measure below the industry average
The strongest positive correlation to market share is average return on assets but there is no
theoretical financial model that would explain why companies with a higher ROA would also
Dell
HP
Acer (Gateway)
AppleLenovo
0
5
10
15
20
25
30
35
40
0 10 20 30 40 50 60 70 80 90
Mar
ket
Shar
e (
De
rriv
ed
fro
m M
inte
l)
Consumer Reports Customer Service Rating
Market Share v Customer Service
Industry Averages 2006 2007 2008 Average 3-year Slope
Financial Ratios
Revenue 1446
Gross Margin (Higher is Better) 654 636 645 645 -05
Operating Margin (Higher is Better) 57 75 68 67 06
Net Margin (Higher is Better) 51 64 53 56 01
ROA (Higher is Better) 75 89 60 75 -07
Current Ratio (Higher is Better) 141 141 139 140 -001
Quick Ratio (Higher is Better) 113 109 099 107 -007
Manufacturer
Market Share
(Derrived
from Mintel)
Average
Gross Margin
Average
Operating
Margin
Average Net
Margin Average ROA
Average
Current Ratio
Average
Quick Ratio
Consumer
Reports
Customer
Service
Rating
Dell 38 821 54 45 100 118 085 56
HP 26 758 81 69 77 118 077 47
Acer (Gateway) 14 105 21 26 52 135 111 54
Apple 5 676 168 132 125 235 194 81
Lenovo 2 865 10 09 20 095 068 66
Other 15
Correlation to Market Share 014 -010 -008 034 -033 -039 -066
Appendix E - Market Positions of Competitors
22 of 29 Last Modified 1162012 1014 PM
have greater market share One might speculate that the higher ROA implies lower capital
intensity and may free-up cash for advertising and sales promotion
An exhaustive correlation analysis shows the following characteristics of the industry
There are strong correlations between the margins but this is to be expected The strangest
correlation is between the customer service rating and the liquidity ratios
Speculation leads to the following question Since Apple is NOT subject to the same rules as the
commoditized PC makers it may sell its hardware at a premium if people want the operating
system perhaps Apple should be removed from the analysis
The following table shows the correlations between the various factors without including apple
in the data set
Now we see a strong positive correlation (100) between average ROA and market share ROA is
calculated as Net Income divided by total assets and is a measure of how efficiently a company
is using its assets High efficiency implies low operating costs This is further supported by the
low correlation to average gross margin (everyone is buying the same inputs) and the high
correlation to average operating margin as the operations of the companies with the highest
market share are also the most efficient All of this implies that the PC market with the
exception of Applersquos niche is driven primarily by price and other factors such as customer
service are secondary
Market Share and ROA
The following strategic group map shows the relationship between ROA and market share
CorrelationMarket Share
Average
Gross Margin
Average
Operating
Margin
Average Net
Margin Average ROA
Average
Current Ratio
Average
Quick Ratio
Customer
Service
Rating
Market Share 014 -010 -008 034 -033 -039 -066
Average Gross Margin 019 013 013 -016 -024 019
Average Operating Margin 100 087 089 083 058
Average Net Margin 087 090 083 054
Average ROA 075 069 034
Average Current Ratio 099 074
Average Quick Ratio 076
Customer Service Rating
Correlation
(wo Apple) Market Share
Average
Gross Margin
Average
Operating
Margin
Average Net
Margin Average ROA
Average
Current Ratio
Average
Quick Ratio
Customer
Service
Rating
Market Share 019 077 075 100 042 012 -061
Average Gross Margin 031 016 013 -081 -094 027
Average Operating Margin 099 078 023 -019 -083
Average Net Margin 077 037 -005 -090
Average ROA 047 017 -066
Average Current Ratio 091 -068
Average Quick Ratio -033
Customer Service Rating
Appendix E - Market Positions of Competitors
23 of 29 Last Modified 1162012 1014 PM
The strong correlation between efficiency and market share implies a market with paper-thin
margins and this is supported by the financial ratios of both the industry and the individual
players shown earlier This is further supported by the following strategic group map
ROA and Customer Support
From the above group map clearly shows that ROA is a primary driver of market size (bubble
size) while the larger players hover around mediocre customer service ratings This means that
there is no financial incentive to differentiate one brand from another by offering better customer
support
Dell
HP
Acer (Gateway)
Apple
Lenovo
00
20
40
60
80
100
120
140
160
0 5 10 15 20 25 30 35 40 45 50
Ave
rage
RO
A
Market Share
Market Positions of Major Companies
Dell
HP
Acer (Gateway)
Apple
Lenovo
00
20
40
60
80
100
120
140
160
0 10 20 30 40 50 60 70 80 90 100
Ave
rage
RO
A
Consumer Reports Customer Service Rating
Market Positions of Major Companies
Appendix F - Probable Strategic Moves by Competitors
24 of 29 Last Modified 1162012 1014 PM
Probable Strategic Moves by Competitors
This section attempts to predict strategic moves by the various major players in this industry
These predictions are a mixture of new items financial analysis and conjecture The following
tables derived from company financial statements provide the basis of the financial analysis
Dell
In terms of market share Dell is the largest player in this analysis Yet like the other players
(except Apple) the three-year trend in ROA is downward When coupled with dells lack-luster
revenue growth 113 below the industry average Dell is likely to diversify into related
opportunities that may offer a higher margin than hardware This would be consistent with
IBMrsquos exit from the market to focus services such as consulting With this in mind the following
excerpt from a Dell press release should come as no surprise
ROUND ROCK and PLANO Texas Sept 21 2009 mdash Dell and Perot Systems have
entered a definitive agreement for Dell to acquire Perot Systems in a transaction valued at
approximately $39 billion Terms of the agreement were approved yesterday by the
boards of directors of both companies
Manufacturer
Market Share
(Derrived
from Mintel)
Average
Gross Margin
Average
Operating
Margin
Average Net
Margin Average ROA
Average
Current Ratio
Average
Quick Ratio
Consumer
Reports
Customer
Service
Rating
Dell 38 821 54 45 100 118 085 56
HP 26 758 81 69 77 118 077 47
Acer (Gateway) 14 105 21 26 52 135 111 54
Apple 5 676 168 132 125 235 194 81
Lenovo 2 865 10 09 20 095 068 66
Other 15
Correlation to Market Share 014 -010 -008 034 -033 -039 -066
Dell 2006 2007 2008 Average 3-year Slope
Financial Ratios
Revenue 57420 61133 61101 59885 316
Gross Margin (Higher is Better) 834 809 821 821 -07
Operating Margin (Higher is Better) 53 56 52 54 -01
Net Margin (Higher is Better) 45 48 41 45 -02
ROA (Higher is Better) 101 107 94 100 -04
Current Ratio (Higher is Better) 112 107 136 118 012
Quick Ratio (Higher is Better) 090 078 087 085 -002
Appendix F - Probable Strategic Moves by Competitors
25 of 29 Last Modified 1162012 1014 PM
The acquisition will result in a compelling combination of two iconic information-
technology brands The expanded Dell will be even better positioned for immediate and
long-term growth and efficiency driven by
Providing a broader range of IT services and solutions and optimizing how theyrsquore
delivered
Extending the reach of Perot Systemsrsquo capabilities including in the most dynamic
customer segments around the world and
Supplying leading Dell computer systems to even more Perot Systems customers6
At some point Dell will probably outsource its PC manufacturing to China
Hewlett-Packard
Like Dell Hewlett-Packard has also diversified into consulting and IT outsourcing In the 2008
annual report the CEO Mark V Hurd writes of the recent (August 2008) acquisition of EDS
The EDS AcquisitionmdashDisciplined Execution of a Multi-year Strategy In August HP
completed its acquisition of EDS a global technology services outsourcing and
consulting leader for a purchase price of $13 billion The EDS integration is at or ahead
of the operational plans we announced in September and customer response to the
acquisition remains very positive (Hewlett-Packard 2008)
In terms of strategic moves HP seems likely to simply focus on expanding market share in the
consulting industry It would not be surprising if at some point HP outsources its PC
manufacturing to China
6 httpcontentdellcomusencorpdsecure2009-09-21-Perot-Systemsaspx accessed 9302009 845 PM
HP 2006 2007 2008 Average 3-year Slope
Financial Ratios
Revenue 91658 104286 118364 104769 1364
Gross Margin (Higher is Better) 757 756 760 758 01
Operating Margin (Higher is Better) 72 84 88 81 08
Net Margin (Higher is Better) 68 70 70 69 01
ROA (Higher is Better) 76 82 73 77 -01
Current Ratio (Higher is Better) 135 121 098 118 -018
Quick Ratio (Higher is Better) 092 078 059 077 -017
Appendix F - Probable Strategic Moves by Competitors
26 of 29 Last Modified 1162012 1014 PM
It is entertaining to note that EDS (Electronic Data Systems Corp) was founded in 1962 by Ross
Perot formerly of IBM As noted above Dell recently purchased Perot systems founded in 1988
by Ross Perot formerly of IBM
Acer Group
While Acer has growing revenues and a significant 14 market share there are almost no
positive aspects to its financial ratios There could be two options at play here
Acer may be operating as a loss leader in order to grow market share
Acer may be poorly managed and simple a bad company This seems unlikely with their
high quick ratio indicating a strong cash position
Between the two I would suspect the former It would also not be a surprise to see Acer acquire
Lenovo
Apple
Acer 2006 2007 2008 Average 3-year Slope
Financial Ratios HK$US
Revenue (HK$) 44976 59239 70035 58084 2479 78
Gross Margin (Higher is Better) 109 103 105 105 -02
Operating Margin (Higher is Better) 18 22 22 21 02
Net Margin (Higher is Better) 29 28 21 26 -04
ROA (Higher is Better) 54 53 48 52 -03
Current Ratio (Higher is Better) 147 134 125 135 -004
Quick Ratio (Higher is Better) 123 110 098 111 -004
Apple 2006 2007 2008 Average 3-year Slope
Financial Ratios
Revenue 19315 24006 32479 25267 2967
Gross Margin (Higher is Better) 710 660 657 676 -27
Operating Margin (Higher is Better) 127 184 193 168 33
Net Margin (Higher is Better) 103 146 149 132 23
ROA (Higher is Better) 116 138 122 125 03
Current Ratio (Higher is Better) 224 236 246 235 011
Quick Ratio (Higher is Better) 197 200 184 194 -006
Appendix F - Probable Strategic Moves by Competitors
27 of 29 Last Modified 1162012 1014 PM
Apple is going to continue to grow in consumer electronics and telephony Microsoft does not
dominate the operating system environment for mobile devices and Apple has a strong position
in mobile devices and mobile devices are the most likely candidate for the future of computing
platforms These facts would lead one to believe that Apple is well positioned for the future This
is also supported by the fact that of all of the companies in this analysis Apple is the only one
that is above industry averages in every financial ratio considered by this analysis They also top
the list in consumer service
Watch for Apple to continue doing what it has been doing
Lenovo
Between the two Chinese manufacturers Lenovo has the highest gross margin and the lowest
operating margin With these inefficiencies low liquidity ratios and the lowest ROA of any of
the companies examined here it seems likely that Acer will acquire Lenovo
Lenovo 2006 2007 2008 Average 3-year Slope
Financial Ratios
Revenue 14590 16352 14901 15281 106
Gross Margin (Higher is Better) 860 850 883 865 11
Operating Margin (Higher is Better) 13 31 -14 10 -14
Net Margin (Higher is Better) 11 30 -15 09 -13
ROA (Higher is Better) 30 67 -36 20 -33
Current Ratio (Higher is Better) 087 105 092 095 003
Quick Ratio (Higher is Better) 063 076 067 068 002
Appendix G - Key Success Factors
28 of 29 Last Modified 1162012 1014 PM
Key Success Factors
There are certain activities and attributes that a company must engage in and attain in order to be
successful in this industry According to IBISWorld the key success factors in this industry
include
Establishing brand names
Production of goods currently favored by the market
Economies of scale
Ensuring pricing policy is appropriate
Establishing brand names and associated reputations for quality are critical for success Brands
that have a reputation for low quality incompatibility and other negative aspects tend to
disappear from the market fairly quickly
The second two factors Economies of Scale and appropriate pricing policy are interrelated and
synergistic This means that large firms with significant economies of scale are also able to
reduce costs and by extension prices while maintaining an acceptable margin
The other KSFs cited by IBISWorld include supplier relations distribution systems and
innovation These factors are also important but perhaps not actually lsquokeyrsquo and are thus noted in
the five-forces analysis but not analyzed in any depth here
It is interesting to note that the key success factors are also responsible for the commoditization
that caused IBM to exit the market This observation bears significantly in the five-forces
analysis above
29 of 29 Last Modified 1162012 1014 PM
Works Cited
EDN PC Market to Slump 6 in 2009 EDN Aug 6 2009 54
Gubbins Ed When TVs and PCs collide Telephony Jan 3 2008 2-3
Hewlett-Packard HewlettPackard_2008_ARpdf Hewlett Packard 12 18 2008
httpmediacorporate-irnetmedia_filesirol7171087HewlettPackard_2008_ARpdf (accessed
9 30 2009)
Hoovers Computer Manufactur Industry Hoovers Online
httpwwwlibraryohiouedu2862subscribeindfrprofilebasicxhtmlID=212 (accessed 9 30
2009)
IBISWorld 33411 - Computer amp Peripheral Manufacturing in the US - Industry Report Santa
Monica IBISWorld 7 28 2009
Mallinson Keith Disruptive Innovation WirelessWeek September 2008 1431
Microsoft Explore the features Windows Media Center Microsoft 9 29 2009
httpwwwmicrosoftcomwindowswindows-vistafeaturesmedia-centeraspx (accessed 9 29
2009)
Mintel Oxygen Consumer Electronics Holiday Shopping - US - September 2009 Mintel
Oxygen 9 2009
httpwwwlibraryohiouedu2718sinatraoxygen_academicsearch_resultsdisplayid=297980amp
list=wh_itemsdisplayid=474804displayid=481151select_section=474804 (accessed 9 29
2009)
mdash Home Personal Computers - US - December 2008 Mintel Oxygen 12 2008
httpwwwlibraryohiouedu2718sinatraoxygen_academicsearch_resultsdisplayid=297980d
isplayid=434041hit1 (accessed 9 29 2009)
mdash Market Re-forecasts Technology - US - April 2009 Mintel Oxygen 4 2009
httpwwwlibraryohiouedu2718sinatraoxygen_academicsearch_resultsshowampamptype=RCIte
mampsort=relevantampaccess=accessibleamparchive=hideampsource=non_snapshotamplist=search_results
displayid=297980displayid=440938displayid=441066 (accessed Sept 29 2009)
National Bureau of Economic Research Business Cycle Dating Committee December 11 2008
httpwwwnberorgdec2008pdf (accessed September 29 2009)
mdash Business Cycle Expansions and Contractions 12 1 2008
httpwwwdevnberorgcyclescyclesmainhtml (accessed 9 29 2009)
mdash Economic Report for the President 1 2009 httpwwwnberorgerp2009_erppdf (accessed
9 29 2009)

Jon Bennett
BA 470
Fall 2009
Industry Analysis
Personal Computer Manufacturing in the
United States
6 of 29 Last Modified 1162012 1014 PM
company is smart enough to product market-favored goods their product will look like every
other PC on the market This leaves price as the only competitive driver
Economies of Scale and Competitive Pricing ndash These two success factors must be treated
together because price is the sales driver and the price level is set by minimizing the margin of
production costs Ultimately this means that until a company reaches the high economies of
scale while cutting its margin it cannot compete in the marketplace If the company does achieve
these success factors then the margin will not offer enough return to justify the risks
Collectively the key success factors are necessary but not sufficient to achieve a financially
sound business This has very negative implications for the attractiveness of this market
Conclusion
In almost every category of analysis this market has shown to be very unattractive The more
successful players have either exited the market (IBM) or are diversifying to related businesses
that offer a better margin (Dell and HP) The ones that are staying in the market (Acer and
Lenovo) are probably heading for some form of shake-up and consolidation The player with the
healthiest financial ratios Apple probably has more in common with Sony or Samsung that it
does with the companies in the PC market
The inescapable conclusion is that this is a very unattractive market
Appendix A - Macroeconomic Environment
7 of 29 Last Modified 1162012 1014 PM
General Economic Conditions
According to the National Bureau of Economic Research (NBER) the United States economy
entered into a recession in December 2007 (National Bureau of Economic Research 2008) As of
now September 2009 the recession continues The contraction has lasted 21 months so far and
there is no consensus on whether or not we have reached the trough and begun an expansion
Again according to the NBER there have been 10 economic cycles since 1945 with an average
contraction of 10 months (National Bureau of Economic Research 2008) The current retraction
is putting stress on consumer spending and by extension industries that depend on consumer
spending The NBERrsquos Economic Report for the President notes
Real consumer spending stagnated in the first half of 2008 and then fell sharply in the
third quarter in what was the largest quarterly decline since 1980 This was a major
deceleration after the 28 percent average annual rate during the 2001ndash07 expansion
(National Bureau of Economic Research 2009 33)
This does not bode well for the near-term revenue for companies such as PC makers that target
the consumer market Unfortunately the outlook for business customers is no better Quoting
again from the Economic Report for the President
During the first three quarters of 2008 real business investment in equipment and
software fell 44 percent at an annual rate down from 28 percent growth in 2007
Growing categories included software (24 percent) communication equipment (52
percent) and agricultural equipment (27 percent) while investment in industrial
equipment fell 40 percent (National Bureau of Economic Research 2009 41)
This outlook is further supported by the Mintel Oxygen report Market Re-forecasts Technology
- US - April 2009 which notes the following points
In light of current macroeconomics as well as rapid developments in the market
Mintel has created a new forecast for its Home Personal Computers ndash US December
2008 report Previously Mintel had forecast 8 growth from 2008-12 for the market
as a whole Sales are now projected to decline by 14 for the same period
In terms of macroeconomics consumers are likely to be more willing to make do
with current PCs owned and households without a PC are likely to continue to make
do as well or turn to used equipment or low-end netbooks
Regardless of macroeconomic trends the desktop category has seen its peak and is
headed into permanent decline household penetration hasnrsquot risen in years standing
at 63-65 (Mintel Oxygen 2009)
In summary overall economic conditions are poor and will probably remain so for the next
several months
Appendix A - Macroeconomic Environment
8 of 29 Last Modified 1162012 1014 PM
Legislation and Regulation
Detailed searching at the United States House of Representatives reveals that HRES558 a bill
creating a ldquoNational Computer Science Education Weekrdquo was moved into committee on
61820091 There does not seem to be any other current legislation affecting the computer
industry
Population Demographics and Lifestyle
The Mintel Oxygen report Consumer Electronics Holiday Shopping - US - September 2009
notes a variety of demographic and lifestyle information that is pertinent to the PC industry
As part of surveying 2091 adults (aged 18+) with Internet access the following findings are
reported
When asked ldquowhich of the following PC and PC-related products are you interested in
purchasing between now and January 2010 either for yourself or as a gift for othersrdquo the
subjects responded as follows (Mintel Oxygen 2009)
Any consideration for purchase
Thinking about buying as gift by January 2010
Thinking about buying for self by January 2010
I am not sure what this is
Laptop PC 34 7 27 1
Desktop PC 21 5 17 1
A Netbook (such as the HP Mini or ASUS Eee)
15 4 11 8
The subjects responding to the previous question have the following age distribution
Figure 40 Interest in purchasing PCs before January 2010 by age June 2009
Any consideration for purchase All 18-24
25-34
35-44
45-54
55-64 65+
Laptop PC 34 45 44 39 31 24 17
Desktop PC 21 29 28 22 20 15 10
1 httpthomaslocgovcgi-binbdqueryDd1112temp~bdKqi1|bss111searchhtml| accessed 9292009 753
PM
Appendix A - Macroeconomic Environment
9 of 29 Last Modified 1162012 1014 PM
A Netbook (such as the HP Mini or ASUS Eee) 15 20 26 13 15 11 2
The report authors note that the age range interested in purchasing new computers is skewed
towards the lsquounder 35rsquo group This may have implications for the marketing strategies of
companies hoping to sell PCs this holiday season
In terms of lifestyle and usage patterns the Mintel Oxygen report Home Personal Computers -
US - December 2008 indicates the following usage patterns broken down by age group (Mintel
Oxygen 2008)
Total 18-24 25-34 35-44 45-54 55-64 65+
Internete-mail 82 77 86 86 82 83 74
Computer games 55 60 55 63 55 50 44
Digital music 48 59 60 59 49 34 17
Digital photo editing 47 46 56 53 45 44 32
Digital video 24 30 33 31 23 16 10
Networking devices 10 13 11 12 9 7 4
Technology
The pace of technological change in the Personal Computer arena is both clicheacute and complex
There are several factors that drive this change Two of these factors are the well-known
lsquoMoorersquos Lawrsquo and the somewhat familiar concept of lsquoConvergencersquo
Moorersquos Law ldquoMoores Law describes a long-term trend in the history of computing
hardware in which the number of transistors that can be placed inexpensively on an
integrated circuit has doubled approximately every two years[1] Rather than being a
naturally-occurring law that cannot be controlled however Moores Law is effectively
a business practice in which the advancement of transistor counts occurs at a fixed raterdquo2
The implication of Moorersquos law is that computers become faster and less expensive with great
frequency This allows for broader application of the computer to activities that were previously
too computationally expensive Moorersquos law is ultimately the driving force behind
lsquoConvergencersquo
In his Telephony article ldquoWhen TVs and PCs colliderdquo Ed Gubbins examines some of the
concepts and issues facing the convergence of the Personal Computer with the Television He
notes that ldquowith the rise of IPTV and online video among other trends TVs and PCs
increasingly are crowding each others turf posing plenty of questions about how the roles
played by these devices will shift over timehelliprdquo (Gubbins 2008) The convergence issues are also
2 httpenwikipediaorgwikiMoore27s_law accessed 9292009 903 PM
Appendix A - Macroeconomic Environment
10 of 29 Last Modified 1162012 1014 PM
being addressed by Microsoftreg with the Microsoft Media Center On the Microsoft Media
Center website Microsoft invites us to
Enjoy your entire digital entertainment library in full glory on your PC or even on your
TV with Windows Media CenterM
View your photos in a cinematic slide show browse
your music collection by cover art easily play DVDs watch and record TV shows
download movies and project your home videosmdashthen pass the remote to let friends and
family join in the fun (Microsoft 2009)
In addition to the technological issues raised by convergence the rise of mobile computing is
also acting as a force for change in the Personal Computer industry
In his article ldquoDisruptive Innovationrdquo in Wireless Week Keith Mallinson asserts ldquoPC industry
be warned Mobile devices are taking computing to everyone everywhere and all of the timerdquo
(Mallinson 2008)
He goes on to note that ldquodisruptive technologies tend to be cheaper more flexible with wider
applicability and outsell what they displace They succeed despite initially providing lower
performance than incumbent technologiesrdquo This leads him to conclude that with the increases in
computing power inherent in the development of mobile telephone (and computer) technology
that ldquomobiles will become the primary and most pervasively used or only computing
devices for most of the worldrsquos populationrdquo (Mallinson 2008)
Mr Mallinson is not the only one to make assertions along this line This position is supported
by the now flat market growth in the PC industry This is explored further in the Dominant
Economic Features section of this report
Appendix B - Dominant Economic Features
11 of 29 Last Modified 1162012 1014 PM
Market Size and Growth Rate
As noted earlier the Mintel Oxygen group has provided an update to the forecasts in the Home
Personal Computers ndash US December 2008 report In that re-forecast Mintel expects that the
Home PC market will decline by 14 in the period from 2008-2014 (see page 7)
Additionally ldquothe desktop category has seen its peak and is headed into permanent decline
household penetration hasnrsquot risen in years standing at 63-65 (Mintel Oxygen 2009)rdquo
Mintel provides the following data table to emphasize the declining sales expectation for the
home computer market
Total US supplier sales and forecast of home computers at current prices 2003-12
Year Index Index
$million change 2003 = 100 2008 = 100
2003 15579 - 100 74
2004 18233 170 117 87
2005 19399 64 125 93
2006 19553 08 126 93
2007 21156 82 136 101
2008 (est) 20931 -11 134 100
2009 (fore) 19242 -81 124 92
2010 (fore) 18595 -34 119 89
2011 (fore) 18183 -22 117 87
2012 (fore) 18089 -05 116 86
Source (Mintel Oxygen 2009)
While the forecast is dour it is at least directionally consistent with other sources An article in
EDN covers some of the details of a Gartner Group report forecasting PC sales in 2009
According to the article
The market-research company projects that worldwide PC shipments will reach 274
million units in 2009 a 6 decline from 2008 shipments of 292 million units The fourth
quarter should see growth setting the stage for a healthy market recovery in 2010 with
unit shipments forecast to increase 103rdquo (EDN 2009)
Number of Rivals
The PC manufacturing market is characterized by having a few large players in competition with
each other and a large number of smaller players (sometimes individuals) engaged in local
personal selling and consultancy Hoovers describes the industry as follows
The US computer manufacturing industry includes about 1500 companies with
combined annual revenue of $70 billion Major companies include Dell Hewlett-
Appendix B - Dominant Economic Features
12 of 29 Last Modified 1162012 1014 PM
Packard IBM and Sun Microsystems The industry is highly concentrated the top 50
companies generate about 90 percent of revenue (Hoovers nd)
The Mintel Oxygen report Home Personal Computers - US - December 2008 describes the
market participants as follows
For many years PCs have been an unusually commoditized product With the notable
exception of Apple most PC makers sell boxes that contain components (such as
processors and graphic and sound systems) and software that are produced by the same
third-party vendorsmdashand are often put together in the same factories Furthermore
component-level vendors are often heavily featured in advertising and product packaging
due to co-op advertising arrangements (Mintel Oxygen 2008)
The Mintel report also summarizes recent purchases by brand and recentness of purchase
Home Personal Computers - US - December 2008 - Brand Qualities
Brand of PC most recently acquired by date of purchase April 2007-June 2008
Total
Less than 1 year ago
1 year to less than 2 years ago
2 years to less than 3 years ago
3 years to less than 4 years ago
4 years to less than 5 years ago
5 years ago or more
Dell 38 31 41 42 43 47 32
Hewlett Packard 16 19 15 15 15 13 14
Compaq 10 9 10 9 8 8 15
Gateway 8 6 7 7 8 9 12
Apple 5 9 5 4 3 2 3
eMachines 4 3 4 5 6 2 2
Toshiba 3 5 3 3 2 2 1
Sony Vaio 2 2 3 2 3 2 2
Acer 2 4 2 1 1 1 2
IBM 2 2 1 2 2 2 2
Other 9 7 8 9 11 11 7
(Mintel Oxygen 2008)
It is worth noting a peculiarity about this brand list According to the Acer Group web site3 ldquothe
Acer Group family of brands -- Acer Gateway Packard Bell and eMachines -- and their
respective sub-brands offer products with distinguished brand characteristics that target different
customer needs in the global PC marketrdquo Additionally Hewlett-Packard and Compaq merged on
May 3 2002 This is significant for a number of reasons First it implies consolidation in the
industry and secondly it points out that the above list is based on brand but not on
3 httpwwwacer-groupcompublicThe_Brandsindexhtm accessed 9292009 1102 PM
Appendix B - Dominant Economic Features
13 of 29 Last Modified 1162012 1014 PM
manufacturer Reformatting the table accounting for brand consolidation and sorting by
market share shows a clearer picture of the competitive group
Total
Less than 1 year ago
1 year to less than 2 years ago
2 years to less than 3 years ago
3 years to less than 4 years ago
4 years to less than 5 years ago
5 years ago or more
Dell 38 31 41 42 43 47 32
Hewlett Packard + Compaq 26 28 25 24 23 21 29
Acer Group 14 13 13 13 15 12 16
Other 9 7 8 9 11 11 7
Apple 5 9 5 4 3 2 3
Toshiba 3 5 3 3 2 2 1
Sony Vaio 2 2 3 2 3 2 2
IBM 2 2 1 2 2 2 2
Total 99 97 99 99 102 99 92
Here we see that the primary players in the market are Dell HP and the Acer Group Ranking
along these lines is supported by the IBISWorld 33411 - Computer amp Peripheral Manufacturing
in the US - Industry Report The following graphic from the IBISWorld report shows the key
competitors identified by IBISWorld
(IBISWorld 2009 25)
While this chart supports the inclusion of Dell HP and possibly IBM in the competitive group
it is important to understand that the market definition here includes the manufacture of
peripheral equipment For example EMC does not manufacture lsquoPersonal Computersrsquo
Appendix B - Dominant Economic Features
14 of 29 Last Modified 1162012 1014 PM
Additionally the report goes on to note that from 2002 through 2007 IBM removed itself from
most of this market
In 2002 IBM sold its hard drive manufacturing business to Hitachi Ltd and its European
desktop computer business to Sanmina-SCI In 2005 IBM sold its personal computer business to
the Lenovo group based in China In 2007 IBM sold its stake in the printer manufacturing joint
venture InfoPrint to the other Stakeholder Ricoh
IBM explains these moves in their 2008 annual report as follows
IBM has divested commoditizing businesses like personal computers and hard disk
drives and strengthened its position through strategic investments and acquisitions in
higher-value segments like business intelligence and analytics virtualization and green
solutions4
For the above reasons it seems reasonable to cite Dell HP Acer Apple and possibly the Lenovo
group as the dominant players in the industry although a significant share of the market is
scattered among a very large number of small to tiny players A further note would be that since
Acer manufacturers motherboards and many of their motherboards are used in computers
provided by the lsquoothersrsquo any analysis is likely to understate the size of the financial share of the
market owned by Acer
Scope of Competitive Rivalry
This market is almost completely globalized with the major players having significant
representation throughout the developed world
Number of Buyers
With some caveats the number of buyers approximates the number of US households There
are demographic considerations with certain brands being preferred by lower or higher income
segments (Mintel Oxygen 2008) market penetration estimates are around 63-65 of households
(Mintel Oxygen 2009) While the penetration in number of households is stagnating it is
interesting to note that multiple-computer ownership is common When Mintel asked their
subjects ldquoWhat is the number of personal computers your household ownsrdquo they gleaned the
following data
Number of home computers owned June 2002-June 2008
June 02-May 03
May 03-Apr04
May 04-May 05
May 05-Jun 06
May 06- Jun 07
Apr 07- Jun 08
One PC 59 57 58 55 54 52
Two PCs 23 25 24 25 25 26
4 ftpftpsoftwareibmcomannualreport20082008_ibm_annualpdf accessed 9292009 1147 PM
Appendix B - Dominant Economic Features
15 of 29 Last Modified 1162012 1014 PM
Three or more PCs 12 12 13 15 16 17
Average number of PCs owned 155 156 158 163 166 171
This shows that the number of computers owned per household is increasing although probably
not at a rate that could drive industry-wide growth It seems reasonable to conclude that with the
high household penetration rate and the more than 15X multiplier of computers per household it
is reasonable to use the number of households as the number of buyers (063 X 171 = 108)
According to the US Census the estimate for the number of households is 111609629 (+-
103102)5
Pace of Technological Change
It is relatively common knowledge that the pace of technological change in the PC industry is
very rapid According to the IBISWorld report 33411 - Computer amp Peripheral Manufacturing
ldquoThere is a rapid introduction of new products due to a rapid rate of technological change There
is rapid growth in customer acceptance of new products and a rapid growth in household and
business demand (IBISWorld 2009 17)rdquo
Nevertheless there are interesting developments that affect both the rate of change and the
adoption of new technologies in this market One of the most important factors that drives
demand is the need (or desire) to replace existing computers as they age The IBISWorld report
makes the following observation
Replacement demand can change over time Replacement accounts for nearly 80 of
US PC shipments and 60 of worldwide PC shipments Western Digital Corporation
stated in its 2003 annual report that it believed that the cycle time in which existing PC
owners replaced their
PCs had lengthened from two to three years to approximately three to five years This
may be due to a number of factors including improvements in products quality an
increase in the capacity of computer equipment more scrutiny on technology budgets
and slower release of new applications (IBISWorld 2009 14)
This means that the pace of technological change in the PC world can influence demand but
does not (currently) drive it There are other factors such as the rise of mobile computing
devices (non-PC) that also affect the pace of technological change in this market
Economies of Scale
There are significant economies of scale in this industry IBISWorld notes that ldquothe fall in
computer prices was promoted by a rise in economies of scale and productivity improvements in
5 httpfactfindercensusgovservletSTTable_bm=yamp-geo_id=01000USamp-
qr_name=ACS_2007_3YR_G00_S2504amp-ds_name=ACS_2007_3YR_G00_ accessed 9302009 1220 AM
Appendix B - Dominant Economic Features
16 of 29 Last Modified 1162012 1014 PM
input industries (eg semi-conductors) and by rising productivity of computer manufacturers
(IBISWorld 2009 45)rdquo Additionally ldquoeconomies of scale can represent a major factor in
competitiveness by reducing component and other costs (IBISWorld 2009 24)rdquo These
economies of scale have significant impact on the competitive landscape both in costs and in
barriers to entry These effects are examined in the five-forces analysis
Experience Curve Effects
Experience-curve effects like economies of scale are related to production volume and have
significant impact on costs These effects are present in this industry and are responsible for the
increases in productivity that in conjunction with the economies of scale caused the ongoing
reduction in costs (IBISWorld 2009 45)
Industry Ratios
Analysis of financial statements of the major players indicates the following industry averages
and rates of change
While these averages and rates of change will serve as benchmarks for other parts of the
analysis a few words are in order about them
It is interesting to note that while industry revenues are growing by a compound annual rate of
145 both gross margin and return of assets are trending downward These numbers alone
could indicate that this is an unattractive industry
Industry Averages 2006 2007 2008 Average 3-year Slope
Financial Ratios
Revenue 1446
Gross Margin (Higher is Better) 654 636 645 645 -05
Operating Margin (Higher is Better) 57 75 68 67 06
Net Margin (Higher is Better) 51 64 53 56 01
ROA (Higher is Better) 75 89 60 75 -07
Current Ratio (Higher is Better) 141 141 139 140 -001
Quick Ratio (Higher is Better) 113 109 099 107 -007
Appendix C ndash Porterrsquos Five-Forces Analysis
17 of 29 Last Modified 1162012 1014 PM
Porterrsquos Five-Forces Analysis
Rivalry
Fresh Market Actions ndash There are on-going actions by all of the major players as they
work to increase market share There seems to be two approaches here depending on the
attributes of the company The US companies (Dell and HP) are launching efforts to
diversify into higher-margin operations The Chinese competitors (Acer and Lenovo)
seem to be willing to compete on a low-cost basis
There is almost no hope of differentiating the products as they all (but Apple) have to run
the current Microsoft OS Additionally there is full penetration in all dealer networks by
almost all brands and significant Internet sales as well
Apple seems more forward-looking and is working maintain its niche (high-quality)
while expanding into the mobile market
Force Rating 4
Similarly-Sized Competitors ndash There are essentially four players in the market as
Apple is subject to significantly different forces Again the US companies are of related
size and are both significantly larger in terms of market share than the Chinese
companies Each contingent seems to be competing in its own way Dell and HP are
diversifying while Acer and Lenovo go head-to-head in manufacturing
Force Rating 4
Rivalry Due to Slow Market Growth ndash This market is completely saturated and market
growth in terms of units sold is almost stagnate The players now face a zero-sum game
This explains why IBM chose to exit the field while Dell and HP diversify
Force Rating 4
Low Switching Costs ndash There is no switching cost except between the PC variants and
the Apple Macintosh variants Among the PC makers this leads to extreme rivalry
Force Rating 4
Threat of New Entrants
Economies of Scale Effects ndash There are great economies of scale in this industry and the
effects of this fact make it both expensive and risky for a new entrant With an industry
average ROA of 75 shrinking at a compound annual rate of -07 there is little in the
way of risk-adjusted rate of return to entice new entrants
Attractiveness Rating 0
Brand Loyalty ndash There is almost no brand loyalty in this largely commoditized market
This means that anyone can enter and make a convincing marketing pitch They will have
to understand that this pitch will be primarily on the basis of price
Attractiveness Rating 4
High Capital Requirements ndash To actually manufacture PCs requires a significant
amount of capital investment When coupled with the low net margins and high risks
inherent in this industry raising such capital in the equity market seems unlikely This is
further exacerbated by the slow industry growth
Attractiveness Rating 0
Appendix C ndash Porterrsquos Five-Forces Analysis
18 of 29 Last Modified 1162012 1014 PM
Regulatory or Tariff issues ndash There are some regulatory issues with respect to pollution
that discourage electronics manufacturing in the US These are not factors for overseas
manufacturers and there are no trade regulations or tariffs
Attractiveness Rating 3
Ability of Incumbents to Block New Entrants ndash There are certain manufacturer-
supplier relationships that may be leveraged to block new entrants It would be simple for
a company like Dell to simply buy most of Intelrsquos or AMDrsquos processor chips for a short
time thus preventing a new entrant from bringing systems to market While there would
likely be anti-trust suits filed over the infraction it would be worth the fines to the
incumbents to keep another loss-leader out of an already competitive market
Attractiveness Rating 0
Pressure from Substitutes
If there is an Achillesrsquo heel in this industry this is it The growing capabilities of mobile
devices have been documented in other sections of this report IBISWorld summarizes it
nicely
Finally substitute products are also key demand determinants Products not
classified to this industry can incorporate functions that provide computing
applications (eg mobile phones digital TVs) and therefore can potentially
adversely or positively affect demand for industry products The network
computer and on-demand computing which use central servers to provide
functionality could reduce demand in value terms (IBISWorld 2009 14)
For the time being PCs will continue to have significant application in word-processing
and business functions The primary challenge is in the home (non-business) market
Force Rating 1 (but growing in the future)
Pressure from Suppliers
Supplier Bargaining Power ndash The suppliers in this industry are in an interesting
position There are only two major players in the processor market Intel and AMD and
all manufacturers support both brands Additionally there are no major functional
differences between them This leaves the PC manufacturer agnostic with respect to
processors The other components of the PC are largely commodity items so there can be
no pressure from these suppliers either
Force Rating 0
Pressure from Buyers
Buyer Bargaining Power ndash Since the PC has become a largely commoditized item with
almost no switching cost or brand loyalty the buyers tend to by based on price While
there were times when poor manufacturing standards affected the so-called lsquoclonersquo
makers those days are gone Now buyers will buy almost any brand that matches their
price point
Force Rating 4
Appendix C ndash Porterrsquos Five-Forces Analysis
19 of 29 Last Modified 1162012 1014 PM
Summary of Competitive Forces
Force Elements Average
Rivalry 4444 4 - Fierce
Threat of New Entrants 04030 14 - Weak
Pressure from Substitutes 1 1 - Weak
Supplier Bargaining Power 0 0 - Weak
Buyer Bargaining Power 4 4 - Fierce
Grand Average 21 - Moderate
In total the five forces analysis reveals that there moderate competitive forces in this industry
This hardly comes as a surprise given the financial analysis indicating that the basis of
competition is almost entirely on price
Appendix D - Forces Driving Change
20 of 29 Last Modified 1162012 1014 PM
Forces Driving Change
There are a variety of forces driving change in this industry Some of these factors are from
within the industry itself while others originate within competing product categories
Smart Phones - The rapid pace of change in smart phones emphasized to consumers by
massive ad spending provides cross-category competition from sleek new devices that
surf the internet Mintel expects computing speed and screen size to continue to rise in
smart phones with cell phone costs often subsidized by carriers consumers eyeing
budgetary constraints may prefer to upgrade the phone and leave the PC be (Mintel
Oxygen 2009)
This is perhaps the most significant long-term force in the industry Keith Mallinson of
Wireless Week makes a strong case
Mobiles will become the primary and most pervasively used or only computing
devices for most of the worldrsquos population Much of that population hasnrsquot had a
phone for long More have not yet used or rarely used a computer or Internet
connection (Mallinson 2008)
Cloud Computing - Cloud computing is clearly gaining ground among consumers even if
the term itself is relatively unknown Most e-mail software exits in the cloud Further
developments in cloud computing are likely to ensure that processor speed and RAM will
not continue to be the driving force for sales in the future that they have been in the past
(Mintel Oxygen 2009)
Internet Sales - Computer manufacturers have become more dependent on Internet sales
over the last decade Many companies sell directly to consumers through their own Web
sites or through retailers (Hoovers nd)
Appendix E - Market Positions of Competitors
21 of 29 Last Modified 1162012 1014 PM
Market Positions of Competitors
The Personal Computer manufacturing market is highly commoditized with little differentiation
in product capabilities This leads to competition on other factors With respect to home
computers customer service seems a reasonable measure However research indicates a
negative correlation between customer service (as rated by consumer reports) and market
share The following scatter chart shows the lack of relationship between market share and
customer service
Also there does not seem to be a strong relationship between market share and any standard
profitability or performance ratio The following table demonstrates this conundrum
Note the red-highlighted items indicate a measure below the industry average
The strongest positive correlation to market share is average return on assets but there is no
theoretical financial model that would explain why companies with a higher ROA would also
Dell
HP
Acer (Gateway)
AppleLenovo
0
5
10
15
20
25
30
35
40
0 10 20 30 40 50 60 70 80 90
Mar
ket
Shar
e (
De
rriv
ed
fro
m M
inte
l)
Consumer Reports Customer Service Rating
Market Share v Customer Service
Industry Averages 2006 2007 2008 Average 3-year Slope
Financial Ratios
Revenue 1446
Gross Margin (Higher is Better) 654 636 645 645 -05
Operating Margin (Higher is Better) 57 75 68 67 06
Net Margin (Higher is Better) 51 64 53 56 01
ROA (Higher is Better) 75 89 60 75 -07
Current Ratio (Higher is Better) 141 141 139 140 -001
Quick Ratio (Higher is Better) 113 109 099 107 -007
Manufacturer
Market Share
(Derrived
from Mintel)
Average
Gross Margin
Average
Operating
Margin
Average Net
Margin Average ROA
Average
Current Ratio
Average
Quick Ratio
Consumer
Reports
Customer
Service
Rating
Dell 38 821 54 45 100 118 085 56
HP 26 758 81 69 77 118 077 47
Acer (Gateway) 14 105 21 26 52 135 111 54
Apple 5 676 168 132 125 235 194 81
Lenovo 2 865 10 09 20 095 068 66
Other 15
Correlation to Market Share 014 -010 -008 034 -033 -039 -066
Appendix E - Market Positions of Competitors
22 of 29 Last Modified 1162012 1014 PM
have greater market share One might speculate that the higher ROA implies lower capital
intensity and may free-up cash for advertising and sales promotion
An exhaustive correlation analysis shows the following characteristics of the industry
There are strong correlations between the margins but this is to be expected The strangest
correlation is between the customer service rating and the liquidity ratios
Speculation leads to the following question Since Apple is NOT subject to the same rules as the
commoditized PC makers it may sell its hardware at a premium if people want the operating
system perhaps Apple should be removed from the analysis
The following table shows the correlations between the various factors without including apple
in the data set
Now we see a strong positive correlation (100) between average ROA and market share ROA is
calculated as Net Income divided by total assets and is a measure of how efficiently a company
is using its assets High efficiency implies low operating costs This is further supported by the
low correlation to average gross margin (everyone is buying the same inputs) and the high
correlation to average operating margin as the operations of the companies with the highest
market share are also the most efficient All of this implies that the PC market with the
exception of Applersquos niche is driven primarily by price and other factors such as customer
service are secondary
Market Share and ROA
The following strategic group map shows the relationship between ROA and market share
CorrelationMarket Share
Average
Gross Margin
Average
Operating
Margin
Average Net
Margin Average ROA
Average
Current Ratio
Average
Quick Ratio
Customer
Service
Rating
Market Share 014 -010 -008 034 -033 -039 -066
Average Gross Margin 019 013 013 -016 -024 019
Average Operating Margin 100 087 089 083 058
Average Net Margin 087 090 083 054
Average ROA 075 069 034
Average Current Ratio 099 074
Average Quick Ratio 076
Customer Service Rating
Correlation
(wo Apple) Market Share
Average
Gross Margin
Average
Operating
Margin
Average Net
Margin Average ROA
Average
Current Ratio
Average
Quick Ratio
Customer
Service
Rating
Market Share 019 077 075 100 042 012 -061
Average Gross Margin 031 016 013 -081 -094 027
Average Operating Margin 099 078 023 -019 -083
Average Net Margin 077 037 -005 -090
Average ROA 047 017 -066
Average Current Ratio 091 -068
Average Quick Ratio -033
Customer Service Rating
Appendix E - Market Positions of Competitors
23 of 29 Last Modified 1162012 1014 PM
The strong correlation between efficiency and market share implies a market with paper-thin
margins and this is supported by the financial ratios of both the industry and the individual
players shown earlier This is further supported by the following strategic group map
ROA and Customer Support
From the above group map clearly shows that ROA is a primary driver of market size (bubble
size) while the larger players hover around mediocre customer service ratings This means that
there is no financial incentive to differentiate one brand from another by offering better customer
support
Dell
HP
Acer (Gateway)
Apple
Lenovo
00
20
40
60
80
100
120
140
160
0 5 10 15 20 25 30 35 40 45 50
Ave
rage
RO
A
Market Share
Market Positions of Major Companies
Dell
HP
Acer (Gateway)
Apple
Lenovo
00
20
40
60
80
100
120
140
160
0 10 20 30 40 50 60 70 80 90 100
Ave
rage
RO
A
Consumer Reports Customer Service Rating
Market Positions of Major Companies
Appendix F - Probable Strategic Moves by Competitors
24 of 29 Last Modified 1162012 1014 PM
Probable Strategic Moves by Competitors
This section attempts to predict strategic moves by the various major players in this industry
These predictions are a mixture of new items financial analysis and conjecture The following
tables derived from company financial statements provide the basis of the financial analysis
Dell
In terms of market share Dell is the largest player in this analysis Yet like the other players
(except Apple) the three-year trend in ROA is downward When coupled with dells lack-luster
revenue growth 113 below the industry average Dell is likely to diversify into related
opportunities that may offer a higher margin than hardware This would be consistent with
IBMrsquos exit from the market to focus services such as consulting With this in mind the following
excerpt from a Dell press release should come as no surprise
ROUND ROCK and PLANO Texas Sept 21 2009 mdash Dell and Perot Systems have
entered a definitive agreement for Dell to acquire Perot Systems in a transaction valued at
approximately $39 billion Terms of the agreement were approved yesterday by the
boards of directors of both companies
Manufacturer
Market Share
(Derrived
from Mintel)
Average
Gross Margin
Average
Operating
Margin
Average Net
Margin Average ROA
Average
Current Ratio
Average
Quick Ratio
Consumer
Reports
Customer
Service
Rating
Dell 38 821 54 45 100 118 085 56
HP 26 758 81 69 77 118 077 47
Acer (Gateway) 14 105 21 26 52 135 111 54
Apple 5 676 168 132 125 235 194 81
Lenovo 2 865 10 09 20 095 068 66
Other 15
Correlation to Market Share 014 -010 -008 034 -033 -039 -066
Dell 2006 2007 2008 Average 3-year Slope
Financial Ratios
Revenue 57420 61133 61101 59885 316
Gross Margin (Higher is Better) 834 809 821 821 -07
Operating Margin (Higher is Better) 53 56 52 54 -01
Net Margin (Higher is Better) 45 48 41 45 -02
ROA (Higher is Better) 101 107 94 100 -04
Current Ratio (Higher is Better) 112 107 136 118 012
Quick Ratio (Higher is Better) 090 078 087 085 -002
Appendix F - Probable Strategic Moves by Competitors
25 of 29 Last Modified 1162012 1014 PM
The acquisition will result in a compelling combination of two iconic information-
technology brands The expanded Dell will be even better positioned for immediate and
long-term growth and efficiency driven by
Providing a broader range of IT services and solutions and optimizing how theyrsquore
delivered
Extending the reach of Perot Systemsrsquo capabilities including in the most dynamic
customer segments around the world and
Supplying leading Dell computer systems to even more Perot Systems customers6
At some point Dell will probably outsource its PC manufacturing to China
Hewlett-Packard
Like Dell Hewlett-Packard has also diversified into consulting and IT outsourcing In the 2008
annual report the CEO Mark V Hurd writes of the recent (August 2008) acquisition of EDS
The EDS AcquisitionmdashDisciplined Execution of a Multi-year Strategy In August HP
completed its acquisition of EDS a global technology services outsourcing and
consulting leader for a purchase price of $13 billion The EDS integration is at or ahead
of the operational plans we announced in September and customer response to the
acquisition remains very positive (Hewlett-Packard 2008)
In terms of strategic moves HP seems likely to simply focus on expanding market share in the
consulting industry It would not be surprising if at some point HP outsources its PC
manufacturing to China
6 httpcontentdellcomusencorpdsecure2009-09-21-Perot-Systemsaspx accessed 9302009 845 PM
HP 2006 2007 2008 Average 3-year Slope
Financial Ratios
Revenue 91658 104286 118364 104769 1364
Gross Margin (Higher is Better) 757 756 760 758 01
Operating Margin (Higher is Better) 72 84 88 81 08
Net Margin (Higher is Better) 68 70 70 69 01
ROA (Higher is Better) 76 82 73 77 -01
Current Ratio (Higher is Better) 135 121 098 118 -018
Quick Ratio (Higher is Better) 092 078 059 077 -017
Appendix F - Probable Strategic Moves by Competitors
26 of 29 Last Modified 1162012 1014 PM
It is entertaining to note that EDS (Electronic Data Systems Corp) was founded in 1962 by Ross
Perot formerly of IBM As noted above Dell recently purchased Perot systems founded in 1988
by Ross Perot formerly of IBM
Acer Group
While Acer has growing revenues and a significant 14 market share there are almost no
positive aspects to its financial ratios There could be two options at play here
Acer may be operating as a loss leader in order to grow market share
Acer may be poorly managed and simple a bad company This seems unlikely with their
high quick ratio indicating a strong cash position
Between the two I would suspect the former It would also not be a surprise to see Acer acquire
Lenovo
Apple
Acer 2006 2007 2008 Average 3-year Slope
Financial Ratios HK$US
Revenue (HK$) 44976 59239 70035 58084 2479 78
Gross Margin (Higher is Better) 109 103 105 105 -02
Operating Margin (Higher is Better) 18 22 22 21 02
Net Margin (Higher is Better) 29 28 21 26 -04
ROA (Higher is Better) 54 53 48 52 -03
Current Ratio (Higher is Better) 147 134 125 135 -004
Quick Ratio (Higher is Better) 123 110 098 111 -004
Apple 2006 2007 2008 Average 3-year Slope
Financial Ratios
Revenue 19315 24006 32479 25267 2967
Gross Margin (Higher is Better) 710 660 657 676 -27
Operating Margin (Higher is Better) 127 184 193 168 33
Net Margin (Higher is Better) 103 146 149 132 23
ROA (Higher is Better) 116 138 122 125 03
Current Ratio (Higher is Better) 224 236 246 235 011
Quick Ratio (Higher is Better) 197 200 184 194 -006
Appendix F - Probable Strategic Moves by Competitors
27 of 29 Last Modified 1162012 1014 PM
Apple is going to continue to grow in consumer electronics and telephony Microsoft does not
dominate the operating system environment for mobile devices and Apple has a strong position
in mobile devices and mobile devices are the most likely candidate for the future of computing
platforms These facts would lead one to believe that Apple is well positioned for the future This
is also supported by the fact that of all of the companies in this analysis Apple is the only one
that is above industry averages in every financial ratio considered by this analysis They also top
the list in consumer service
Watch for Apple to continue doing what it has been doing
Lenovo
Between the two Chinese manufacturers Lenovo has the highest gross margin and the lowest
operating margin With these inefficiencies low liquidity ratios and the lowest ROA of any of
the companies examined here it seems likely that Acer will acquire Lenovo
Lenovo 2006 2007 2008 Average 3-year Slope
Financial Ratios
Revenue 14590 16352 14901 15281 106
Gross Margin (Higher is Better) 860 850 883 865 11
Operating Margin (Higher is Better) 13 31 -14 10 -14
Net Margin (Higher is Better) 11 30 -15 09 -13
ROA (Higher is Better) 30 67 -36 20 -33
Current Ratio (Higher is Better) 087 105 092 095 003
Quick Ratio (Higher is Better) 063 076 067 068 002
Appendix G - Key Success Factors
28 of 29 Last Modified 1162012 1014 PM
Key Success Factors
There are certain activities and attributes that a company must engage in and attain in order to be
successful in this industry According to IBISWorld the key success factors in this industry
include
Establishing brand names
Production of goods currently favored by the market
Economies of scale
Ensuring pricing policy is appropriate
Establishing brand names and associated reputations for quality are critical for success Brands
that have a reputation for low quality incompatibility and other negative aspects tend to
disappear from the market fairly quickly
The second two factors Economies of Scale and appropriate pricing policy are interrelated and
synergistic This means that large firms with significant economies of scale are also able to
reduce costs and by extension prices while maintaining an acceptable margin
The other KSFs cited by IBISWorld include supplier relations distribution systems and
innovation These factors are also important but perhaps not actually lsquokeyrsquo and are thus noted in
the five-forces analysis but not analyzed in any depth here
It is interesting to note that the key success factors are also responsible for the commoditization
that caused IBM to exit the market This observation bears significantly in the five-forces
analysis above
29 of 29 Last Modified 1162012 1014 PM
Works Cited
EDN PC Market to Slump 6 in 2009 EDN Aug 6 2009 54
Gubbins Ed When TVs and PCs collide Telephony Jan 3 2008 2-3
Hewlett-Packard HewlettPackard_2008_ARpdf Hewlett Packard 12 18 2008
httpmediacorporate-irnetmedia_filesirol7171087HewlettPackard_2008_ARpdf (accessed
9 30 2009)
Hoovers Computer Manufactur Industry Hoovers Online
httpwwwlibraryohiouedu2862subscribeindfrprofilebasicxhtmlID=212 (accessed 9 30
2009)
IBISWorld 33411 - Computer amp Peripheral Manufacturing in the US - Industry Report Santa
Monica IBISWorld 7 28 2009
Mallinson Keith Disruptive Innovation WirelessWeek September 2008 1431
Microsoft Explore the features Windows Media Center Microsoft 9 29 2009
httpwwwmicrosoftcomwindowswindows-vistafeaturesmedia-centeraspx (accessed 9 29
2009)
Mintel Oxygen Consumer Electronics Holiday Shopping - US - September 2009 Mintel
Oxygen 9 2009
httpwwwlibraryohiouedu2718sinatraoxygen_academicsearch_resultsdisplayid=297980amp
list=wh_itemsdisplayid=474804displayid=481151select_section=474804 (accessed 9 29
2009)
mdash Home Personal Computers - US - December 2008 Mintel Oxygen 12 2008
httpwwwlibraryohiouedu2718sinatraoxygen_academicsearch_resultsdisplayid=297980d
isplayid=434041hit1 (accessed 9 29 2009)
mdash Market Re-forecasts Technology - US - April 2009 Mintel Oxygen 4 2009
httpwwwlibraryohiouedu2718sinatraoxygen_academicsearch_resultsshowampamptype=RCIte
mampsort=relevantampaccess=accessibleamparchive=hideampsource=non_snapshotamplist=search_results
displayid=297980displayid=440938displayid=441066 (accessed Sept 29 2009)
National Bureau of Economic Research Business Cycle Dating Committee December 11 2008
httpwwwnberorgdec2008pdf (accessed September 29 2009)
mdash Business Cycle Expansions and Contractions 12 1 2008
httpwwwdevnberorgcyclescyclesmainhtml (accessed 9 29 2009)
mdash Economic Report for the President 1 2009 httpwwwnberorgerp2009_erppdf (accessed
9 29 2009)

Appendix A - Macroeconomic Environment
9 of 29 Last Modified 1162012 1014 PM
A Netbook (such as the HP Mini or ASUS Eee) 15 20 26 13 15 11 2
The report authors note that the age range interested in purchasing new computers is skewed
towards the lsquounder 35rsquo group This may have implications for the marketing strategies of
companies hoping to sell PCs this holiday season
In terms of lifestyle and usage patterns the Mintel Oxygen report Home Personal Computers -
US - December 2008 indicates the following usage patterns broken down by age group (Mintel
Oxygen 2008)
Total 18-24 25-34 35-44 45-54 55-64 65+
Internete-mail 82 77 86 86 82 83 74
Computer games 55 60 55 63 55 50 44
Digital music 48 59 60 59 49 34 17
Digital photo editing 47 46 56 53 45 44 32
Digital video 24 30 33 31 23 16 10
Networking devices 10 13 11 12 9 7 4
Technology
The pace of technological change in the Personal Computer arena is both clicheacute and complex
There are several factors that drive this change Two of these factors are the well-known
lsquoMoorersquos Lawrsquo and the somewhat familiar concept of lsquoConvergencersquo
Moorersquos Law ldquoMoores Law describes a long-term trend in the history of computing
hardware in which the number of transistors that can be placed inexpensively on an
integrated circuit has doubled approximately every two years[1] Rather than being a
naturally-occurring law that cannot be controlled however Moores Law is effectively
a business practice in which the advancement of transistor counts occurs at a fixed raterdquo2
The implication of Moorersquos law is that computers become faster and less expensive with great
frequency This allows for broader application of the computer to activities that were previously
too computationally expensive Moorersquos law is ultimately the driving force behind
lsquoConvergencersquo
In his Telephony article ldquoWhen TVs and PCs colliderdquo Ed Gubbins examines some of the
concepts and issues facing the convergence of the Personal Computer with the Television He
notes that ldquowith the rise of IPTV and online video among other trends TVs and PCs
increasingly are crowding each others turf posing plenty of questions about how the roles
played by these devices will shift over timehelliprdquo (Gubbins 2008) The convergence issues are also
2 httpenwikipediaorgwikiMoore27s_law accessed 9292009 903 PM
Appendix A - Macroeconomic Environment
10 of 29 Last Modified 1162012 1014 PM
being addressed by Microsoftreg with the Microsoft Media Center On the Microsoft Media
Center website Microsoft invites us to
Enjoy your entire digital entertainment library in full glory on your PC or even on your
TV with Windows Media CenterM
View your photos in a cinematic slide show browse
your music collection by cover art easily play DVDs watch and record TV shows
download movies and project your home videosmdashthen pass the remote to let friends and
family join in the fun (Microsoft 2009)
In addition to the technological issues raised by convergence the rise of mobile computing is
also acting as a force for change in the Personal Computer industry
In his article ldquoDisruptive Innovationrdquo in Wireless Week Keith Mallinson asserts ldquoPC industry
be warned Mobile devices are taking computing to everyone everywhere and all of the timerdquo
(Mallinson 2008)
He goes on to note that ldquodisruptive technologies tend to be cheaper more flexible with wider
applicability and outsell what they displace They succeed despite initially providing lower
performance than incumbent technologiesrdquo This leads him to conclude that with the increases in
computing power inherent in the development of mobile telephone (and computer) technology
that ldquomobiles will become the primary and most pervasively used or only computing
devices for most of the worldrsquos populationrdquo (Mallinson 2008)
Mr Mallinson is not the only one to make assertions along this line This position is supported
by the now flat market growth in the PC industry This is explored further in the Dominant
Economic Features section of this report
Appendix B - Dominant Economic Features
11 of 29 Last Modified 1162012 1014 PM
Market Size and Growth Rate
As noted earlier the Mintel Oxygen group has provided an update to the forecasts in the Home
Personal Computers ndash US December 2008 report In that re-forecast Mintel expects that the
Home PC market will decline by 14 in the period from 2008-2014 (see page 7)
Additionally ldquothe desktop category has seen its peak and is headed into permanent decline
household penetration hasnrsquot risen in years standing at 63-65 (Mintel Oxygen 2009)rdquo
Mintel provides the following data table to emphasize the declining sales expectation for the
home computer market
Total US supplier sales and forecast of home computers at current prices 2003-12
Year Index Index
$million change 2003 = 100 2008 = 100
2003 15579 - 100 74
2004 18233 170 117 87
2005 19399 64 125 93
2006 19553 08 126 93
2007 21156 82 136 101
2008 (est) 20931 -11 134 100
2009 (fore) 19242 -81 124 92
2010 (fore) 18595 -34 119 89
2011 (fore) 18183 -22 117 87
2012 (fore) 18089 -05 116 86
Source (Mintel Oxygen 2009)
While the forecast is dour it is at least directionally consistent with other sources An article in
EDN covers some of the details of a Gartner Group report forecasting PC sales in 2009
According to the article
The market-research company projects that worldwide PC shipments will reach 274
million units in 2009 a 6 decline from 2008 shipments of 292 million units The fourth
quarter should see growth setting the stage for a healthy market recovery in 2010 with
unit shipments forecast to increase 103rdquo (EDN 2009)
Number of Rivals
The PC manufacturing market is characterized by having a few large players in competition with
each other and a large number of smaller players (sometimes individuals) engaged in local
personal selling and consultancy Hoovers describes the industry as follows
The US computer manufacturing industry includes about 1500 companies with
combined annual revenue of $70 billion Major companies include Dell Hewlett-
Appendix B - Dominant Economic Features
12 of 29 Last Modified 1162012 1014 PM
Packard IBM and Sun Microsystems The industry is highly concentrated the top 50
companies generate about 90 percent of revenue (Hoovers nd)
The Mintel Oxygen report Home Personal Computers - US - December 2008 describes the
market participants as follows
For many years PCs have been an unusually commoditized product With the notable
exception of Apple most PC makers sell boxes that contain components (such as
processors and graphic and sound systems) and software that are produced by the same
third-party vendorsmdashand are often put together in the same factories Furthermore
component-level vendors are often heavily featured in advertising and product packaging
due to co-op advertising arrangements (Mintel Oxygen 2008)
The Mintel report also summarizes recent purchases by brand and recentness of purchase
Home Personal Computers - US - December 2008 - Brand Qualities
Brand of PC most recently acquired by date of purchase April 2007-June 2008
Total
Less than 1 year ago
1 year to less than 2 years ago
2 years to less than 3 years ago
3 years to less than 4 years ago
4 years to less than 5 years ago
5 years ago or more
Dell 38 31 41 42 43 47 32
Hewlett Packard 16 19 15 15 15 13 14
Compaq 10 9 10 9 8 8 15
Gateway 8 6 7 7 8 9 12
Apple 5 9 5 4 3 2 3
eMachines 4 3 4 5 6 2 2
Toshiba 3 5 3 3 2 2 1
Sony Vaio 2 2 3 2 3 2 2
Acer 2 4 2 1 1 1 2
IBM 2 2 1 2 2 2 2
Other 9 7 8 9 11 11 7
(Mintel Oxygen 2008)
It is worth noting a peculiarity about this brand list According to the Acer Group web site3 ldquothe
Acer Group family of brands -- Acer Gateway Packard Bell and eMachines -- and their
respective sub-brands offer products with distinguished brand characteristics that target different
customer needs in the global PC marketrdquo Additionally Hewlett-Packard and Compaq merged on
May 3 2002 This is significant for a number of reasons First it implies consolidation in the
industry and secondly it points out that the above list is based on brand but not on
3 httpwwwacer-groupcompublicThe_Brandsindexhtm accessed 9292009 1102 PM
Appendix B - Dominant Economic Features
13 of 29 Last Modified 1162012 1014 PM
manufacturer Reformatting the table accounting for brand consolidation and sorting by
market share shows a clearer picture of the competitive group
Total
Less than 1 year ago
1 year to less than 2 years ago
2 years to less than 3 years ago
3 years to less than 4 years ago
4 years to less than 5 years ago
5 years ago or more
Dell 38 31 41 42 43 47 32
Hewlett Packard + Compaq 26 28 25 24 23 21 29
Acer Group 14 13 13 13 15 12 16
Other 9 7 8 9 11 11 7
Apple 5 9 5 4 3 2 3
Toshiba 3 5 3 3 2 2 1
Sony Vaio 2 2 3 2 3 2 2
IBM 2 2 1 2 2 2 2
Total 99 97 99 99 102 99 92
Here we see that the primary players in the market are Dell HP and the Acer Group Ranking
along these lines is supported by the IBISWorld 33411 - Computer amp Peripheral Manufacturing
in the US - Industry Report The following graphic from the IBISWorld report shows the key
competitors identified by IBISWorld
(IBISWorld 2009 25)
While this chart supports the inclusion of Dell HP and possibly IBM in the competitive group
it is important to understand that the market definition here includes the manufacture of
peripheral equipment For example EMC does not manufacture lsquoPersonal Computersrsquo
Appendix B - Dominant Economic Features
14 of 29 Last Modified 1162012 1014 PM
Additionally the report goes on to note that from 2002 through 2007 IBM removed itself from
most of this market
In 2002 IBM sold its hard drive manufacturing business to Hitachi Ltd and its European
desktop computer business to Sanmina-SCI In 2005 IBM sold its personal computer business to
the Lenovo group based in China In 2007 IBM sold its stake in the printer manufacturing joint
venture InfoPrint to the other Stakeholder Ricoh
IBM explains these moves in their 2008 annual report as follows
IBM has divested commoditizing businesses like personal computers and hard disk
drives and strengthened its position through strategic investments and acquisitions in
higher-value segments like business intelligence and analytics virtualization and green
solutions4
For the above reasons it seems reasonable to cite Dell HP Acer Apple and possibly the Lenovo
group as the dominant players in the industry although a significant share of the market is
scattered among a very large number of small to tiny players A further note would be that since
Acer manufacturers motherboards and many of their motherboards are used in computers
provided by the lsquoothersrsquo any analysis is likely to understate the size of the financial share of the
market owned by Acer
Scope of Competitive Rivalry
This market is almost completely globalized with the major players having significant
representation throughout the developed world
Number of Buyers
With some caveats the number of buyers approximates the number of US households There
are demographic considerations with certain brands being preferred by lower or higher income
segments (Mintel Oxygen 2008) market penetration estimates are around 63-65 of households
(Mintel Oxygen 2009) While the penetration in number of households is stagnating it is
interesting to note that multiple-computer ownership is common When Mintel asked their
subjects ldquoWhat is the number of personal computers your household ownsrdquo they gleaned the
following data
Number of home computers owned June 2002-June 2008
June 02-May 03
May 03-Apr04
May 04-May 05
May 05-Jun 06
May 06- Jun 07
Apr 07- Jun 08
One PC 59 57 58 55 54 52
Two PCs 23 25 24 25 25 26
4 ftpftpsoftwareibmcomannualreport20082008_ibm_annualpdf accessed 9292009 1147 PM
Appendix B - Dominant Economic Features
15 of 29 Last Modified 1162012 1014 PM
Three or more PCs 12 12 13 15 16 17
Average number of PCs owned 155 156 158 163 166 171
This shows that the number of computers owned per household is increasing although probably
not at a rate that could drive industry-wide growth It seems reasonable to conclude that with the
high household penetration rate and the more than 15X multiplier of computers per household it
is reasonable to use the number of households as the number of buyers (063 X 171 = 108)
According to the US Census the estimate for the number of households is 111609629 (+-
103102)5
Pace of Technological Change
It is relatively common knowledge that the pace of technological change in the PC industry is
very rapid According to the IBISWorld report 33411 - Computer amp Peripheral Manufacturing
ldquoThere is a rapid introduction of new products due to a rapid rate of technological change There
is rapid growth in customer acceptance of new products and a rapid growth in household and
business demand (IBISWorld 2009 17)rdquo
Nevertheless there are interesting developments that affect both the rate of change and the
adoption of new technologies in this market One of the most important factors that drives
demand is the need (or desire) to replace existing computers as they age The IBISWorld report
makes the following observation
Replacement demand can change over time Replacement accounts for nearly 80 of
US PC shipments and 60 of worldwide PC shipments Western Digital Corporation
stated in its 2003 annual report that it believed that the cycle time in which existing PC
owners replaced their
PCs had lengthened from two to three years to approximately three to five years This
may be due to a number of factors including improvements in products quality an
increase in the capacity of computer equipment more scrutiny on technology budgets
and slower release of new applications (IBISWorld 2009 14)
This means that the pace of technological change in the PC world can influence demand but
does not (currently) drive it There are other factors such as the rise of mobile computing
devices (non-PC) that also affect the pace of technological change in this market
Economies of Scale
There are significant economies of scale in this industry IBISWorld notes that ldquothe fall in
computer prices was promoted by a rise in economies of scale and productivity improvements in
5 httpfactfindercensusgovservletSTTable_bm=yamp-geo_id=01000USamp-
qr_name=ACS_2007_3YR_G00_S2504amp-ds_name=ACS_2007_3YR_G00_ accessed 9302009 1220 AM
Appendix B - Dominant Economic Features
16 of 29 Last Modified 1162012 1014 PM
input industries (eg semi-conductors) and by rising productivity of computer manufacturers
(IBISWorld 2009 45)rdquo Additionally ldquoeconomies of scale can represent a major factor in
competitiveness by reducing component and other costs (IBISWorld 2009 24)rdquo These
economies of scale have significant impact on the competitive landscape both in costs and in
barriers to entry These effects are examined in the five-forces analysis
Experience Curve Effects
Experience-curve effects like economies of scale are related to production volume and have
significant impact on costs These effects are present in this industry and are responsible for the
increases in productivity that in conjunction with the economies of scale caused the ongoing
reduction in costs (IBISWorld 2009 45)
Industry Ratios
Analysis of financial statements of the major players indicates the following industry averages
and rates of change
While these averages and rates of change will serve as benchmarks for other parts of the
analysis a few words are in order about them
It is interesting to note that while industry revenues are growing by a compound annual rate of
145 both gross margin and return of assets are trending downward These numbers alone
could indicate that this is an unattractive industry
Industry Averages 2006 2007 2008 Average 3-year Slope
Financial Ratios
Revenue 1446
Gross Margin (Higher is Better) 654 636 645 645 -05
Operating Margin (Higher is Better) 57 75 68 67 06
Net Margin (Higher is Better) 51 64 53 56 01
ROA (Higher is Better) 75 89 60 75 -07
Current Ratio (Higher is Better) 141 141 139 140 -001
Quick Ratio (Higher is Better) 113 109 099 107 -007
Appendix C ndash Porterrsquos Five-Forces Analysis
17 of 29 Last Modified 1162012 1014 PM
Porterrsquos Five-Forces Analysis
Rivalry
Fresh Market Actions ndash There are on-going actions by all of the major players as they
work to increase market share There seems to be two approaches here depending on the
attributes of the company The US companies (Dell and HP) are launching efforts to
diversify into higher-margin operations The Chinese competitors (Acer and Lenovo)
seem to be willing to compete on a low-cost basis
There is almost no hope of differentiating the products as they all (but Apple) have to run
the current Microsoft OS Additionally there is full penetration in all dealer networks by
almost all brands and significant Internet sales as well
Apple seems more forward-looking and is working maintain its niche (high-quality)
while expanding into the mobile market
Force Rating 4
Similarly-Sized Competitors ndash There are essentially four players in the market as
Apple is subject to significantly different forces Again the US companies are of related
size and are both significantly larger in terms of market share than the Chinese
companies Each contingent seems to be competing in its own way Dell and HP are
diversifying while Acer and Lenovo go head-to-head in manufacturing
Force Rating 4
Rivalry Due to Slow Market Growth ndash This market is completely saturated and market
growth in terms of units sold is almost stagnate The players now face a zero-sum game
This explains why IBM chose to exit the field while Dell and HP diversify
Force Rating 4
Low Switching Costs ndash There is no switching cost except between the PC variants and
the Apple Macintosh variants Among the PC makers this leads to extreme rivalry
Force Rating 4
Threat of New Entrants
Economies of Scale Effects ndash There are great economies of scale in this industry and the
effects of this fact make it both expensive and risky for a new entrant With an industry
average ROA of 75 shrinking at a compound annual rate of -07 there is little in the
way of risk-adjusted rate of return to entice new entrants
Attractiveness Rating 0
Brand Loyalty ndash There is almost no brand loyalty in this largely commoditized market
This means that anyone can enter and make a convincing marketing pitch They will have
to understand that this pitch will be primarily on the basis of price
Attractiveness Rating 4
High Capital Requirements ndash To actually manufacture PCs requires a significant
amount of capital investment When coupled with the low net margins and high risks
inherent in this industry raising such capital in the equity market seems unlikely This is
further exacerbated by the slow industry growth
Attractiveness Rating 0
Appendix C ndash Porterrsquos Five-Forces Analysis
18 of 29 Last Modified 1162012 1014 PM
Regulatory or Tariff issues ndash There are some regulatory issues with respect to pollution
that discourage electronics manufacturing in the US These are not factors for overseas
manufacturers and there are no trade regulations or tariffs
Attractiveness Rating 3
Ability of Incumbents to Block New Entrants ndash There are certain manufacturer-
supplier relationships that may be leveraged to block new entrants It would be simple for
a company like Dell to simply buy most of Intelrsquos or AMDrsquos processor chips for a short
time thus preventing a new entrant from bringing systems to market While there would
likely be anti-trust suits filed over the infraction it would be worth the fines to the
incumbents to keep another loss-leader out of an already competitive market
Attractiveness Rating 0
Pressure from Substitutes
If there is an Achillesrsquo heel in this industry this is it The growing capabilities of mobile
devices have been documented in other sections of this report IBISWorld summarizes it
nicely
Finally substitute products are also key demand determinants Products not
classified to this industry can incorporate functions that provide computing
applications (eg mobile phones digital TVs) and therefore can potentially
adversely or positively affect demand for industry products The network
computer and on-demand computing which use central servers to provide
functionality could reduce demand in value terms (IBISWorld 2009 14)
For the time being PCs will continue to have significant application in word-processing
and business functions The primary challenge is in the home (non-business) market
Force Rating 1 (but growing in the future)
Pressure from Suppliers
Supplier Bargaining Power ndash The suppliers in this industry are in an interesting
position There are only two major players in the processor market Intel and AMD and
all manufacturers support both brands Additionally there are no major functional
differences between them This leaves the PC manufacturer agnostic with respect to
processors The other components of the PC are largely commodity items so there can be
no pressure from these suppliers either
Force Rating 0
Pressure from Buyers
Buyer Bargaining Power ndash Since the PC has become a largely commoditized item with
almost no switching cost or brand loyalty the buyers tend to by based on price While
there were times when poor manufacturing standards affected the so-called lsquoclonersquo
makers those days are gone Now buyers will buy almost any brand that matches their
price point
Force Rating 4
Appendix C ndash Porterrsquos Five-Forces Analysis
19 of 29 Last Modified 1162012 1014 PM
Summary of Competitive Forces
Force Elements Average
Rivalry 4444 4 - Fierce
Threat of New Entrants 04030 14 - Weak
Pressure from Substitutes 1 1 - Weak
Supplier Bargaining Power 0 0 - Weak
Buyer Bargaining Power 4 4 - Fierce
Grand Average 21 - Moderate
In total the five forces analysis reveals that there moderate competitive forces in this industry
This hardly comes as a surprise given the financial analysis indicating that the basis of
competition is almost entirely on price
Appendix D - Forces Driving Change
20 of 29 Last Modified 1162012 1014 PM
Forces Driving Change
There are a variety of forces driving change in this industry Some of these factors are from
within the industry itself while others originate within competing product categories
Smart Phones - The rapid pace of change in smart phones emphasized to consumers by
massive ad spending provides cross-category competition from sleek new devices that
surf the internet Mintel expects computing speed and screen size to continue to rise in
smart phones with cell phone costs often subsidized by carriers consumers eyeing
budgetary constraints may prefer to upgrade the phone and leave the PC be (Mintel
Oxygen 2009)
This is perhaps the most significant long-term force in the industry Keith Mallinson of
Wireless Week makes a strong case
Mobiles will become the primary and most pervasively used or only computing
devices for most of the worldrsquos population Much of that population hasnrsquot had a
phone for long More have not yet used or rarely used a computer or Internet
connection (Mallinson 2008)
Cloud Computing - Cloud computing is clearly gaining ground among consumers even if
the term itself is relatively unknown Most e-mail software exits in the cloud Further
developments in cloud computing are likely to ensure that processor speed and RAM will
not continue to be the driving force for sales in the future that they have been in the past
(Mintel Oxygen 2009)
Internet Sales - Computer manufacturers have become more dependent on Internet sales
over the last decade Many companies sell directly to consumers through their own Web
sites or through retailers (Hoovers nd)
Appendix E - Market Positions of Competitors
21 of 29 Last Modified 1162012 1014 PM
Market Positions of Competitors
The Personal Computer manufacturing market is highly commoditized with little differentiation
in product capabilities This leads to competition on other factors With respect to home
computers customer service seems a reasonable measure However research indicates a
negative correlation between customer service (as rated by consumer reports) and market
share The following scatter chart shows the lack of relationship between market share and
customer service
Also there does not seem to be a strong relationship between market share and any standard
profitability or performance ratio The following table demonstrates this conundrum
Note the red-highlighted items indicate a measure below the industry average
The strongest positive correlation to market share is average return on assets but there is no
theoretical financial model that would explain why companies with a higher ROA would also
Dell
HP
Acer (Gateway)
AppleLenovo
0
5
10
15
20
25
30
35
40
0 10 20 30 40 50 60 70 80 90
Mar
ket
Shar
e (
De
rriv
ed
fro
m M
inte
l)
Consumer Reports Customer Service Rating
Market Share v Customer Service
Industry Averages 2006 2007 2008 Average 3-year Slope
Financial Ratios
Revenue 1446
Gross Margin (Higher is Better) 654 636 645 645 -05
Operating Margin (Higher is Better) 57 75 68 67 06
Net Margin (Higher is Better) 51 64 53 56 01
ROA (Higher is Better) 75 89 60 75 -07
Current Ratio (Higher is Better) 141 141 139 140 -001
Quick Ratio (Higher is Better) 113 109 099 107 -007
Manufacturer
Market Share
(Derrived
from Mintel)
Average
Gross Margin
Average
Operating
Margin
Average Net
Margin Average ROA
Average
Current Ratio
Average
Quick Ratio
Consumer
Reports
Customer
Service
Rating
Dell 38 821 54 45 100 118 085 56
HP 26 758 81 69 77 118 077 47
Acer (Gateway) 14 105 21 26 52 135 111 54
Apple 5 676 168 132 125 235 194 81
Lenovo 2 865 10 09 20 095 068 66
Other 15
Correlation to Market Share 014 -010 -008 034 -033 -039 -066
Appendix E - Market Positions of Competitors
22 of 29 Last Modified 1162012 1014 PM
have greater market share One might speculate that the higher ROA implies lower capital
intensity and may free-up cash for advertising and sales promotion
An exhaustive correlation analysis shows the following characteristics of the industry
There are strong correlations between the margins but this is to be expected The strangest
correlation is between the customer service rating and the liquidity ratios
Speculation leads to the following question Since Apple is NOT subject to the same rules as the
commoditized PC makers it may sell its hardware at a premium if people want the operating
system perhaps Apple should be removed from the analysis
The following table shows the correlations between the various factors without including apple
in the data set
Now we see a strong positive correlation (100) between average ROA and market share ROA is
calculated as Net Income divided by total assets and is a measure of how efficiently a company
is using its assets High efficiency implies low operating costs This is further supported by the
low correlation to average gross margin (everyone is buying the same inputs) and the high
correlation to average operating margin as the operations of the companies with the highest
market share are also the most efficient All of this implies that the PC market with the
exception of Applersquos niche is driven primarily by price and other factors such as customer
service are secondary
Market Share and ROA
The following strategic group map shows the relationship between ROA and market share
CorrelationMarket Share
Average
Gross Margin
Average
Operating
Margin
Average Net
Margin Average ROA
Average
Current Ratio
Average
Quick Ratio
Customer
Service
Rating
Market Share 014 -010 -008 034 -033 -039 -066
Average Gross Margin 019 013 013 -016 -024 019
Average Operating Margin 100 087 089 083 058
Average Net Margin 087 090 083 054
Average ROA 075 069 034
Average Current Ratio 099 074
Average Quick Ratio 076
Customer Service Rating
Correlation
(wo Apple) Market Share
Average
Gross Margin
Average
Operating
Margin
Average Net
Margin Average ROA
Average
Current Ratio
Average
Quick Ratio
Customer
Service
Rating
Market Share 019 077 075 100 042 012 -061
Average Gross Margin 031 016 013 -081 -094 027
Average Operating Margin 099 078 023 -019 -083
Average Net Margin 077 037 -005 -090
Average ROA 047 017 -066
Average Current Ratio 091 -068
Average Quick Ratio -033
Customer Service Rating
Appendix E - Market Positions of Competitors
23 of 29 Last Modified 1162012 1014 PM
The strong correlation between efficiency and market share implies a market with paper-thin
margins and this is supported by the financial ratios of both the industry and the individual
players shown earlier This is further supported by the following strategic group map
ROA and Customer Support
From the above group map clearly shows that ROA is a primary driver of market size (bubble
size) while the larger players hover around mediocre customer service ratings This means that
there is no financial incentive to differentiate one brand from another by offering better customer
support
Dell
HP
Acer (Gateway)
Apple
Lenovo
00
20
40
60
80
100
120
140
160
0 5 10 15 20 25 30 35 40 45 50
Ave
rage
RO
A
Market Share
Market Positions of Major Companies
Dell
HP
Acer (Gateway)
Apple
Lenovo
00
20
40
60
80
100
120
140
160
0 10 20 30 40 50 60 70 80 90 100
Ave
rage
RO
A
Consumer Reports Customer Service Rating
Market Positions of Major Companies
Appendix F - Probable Strategic Moves by Competitors
24 of 29 Last Modified 1162012 1014 PM
Probable Strategic Moves by Competitors
This section attempts to predict strategic moves by the various major players in this industry
These predictions are a mixture of new items financial analysis and conjecture The following
tables derived from company financial statements provide the basis of the financial analysis
Dell
In terms of market share Dell is the largest player in this analysis Yet like the other players
(except Apple) the three-year trend in ROA is downward When coupled with dells lack-luster
revenue growth 113 below the industry average Dell is likely to diversify into related
opportunities that may offer a higher margin than hardware This would be consistent with
IBMrsquos exit from the market to focus services such as consulting With this in mind the following
excerpt from a Dell press release should come as no surprise
ROUND ROCK and PLANO Texas Sept 21 2009 mdash Dell and Perot Systems have
entered a definitive agreement for Dell to acquire Perot Systems in a transaction valued at
approximately $39 billion Terms of the agreement were approved yesterday by the
boards of directors of both companies
Manufacturer
Market Share
(Derrived
from Mintel)
Average
Gross Margin
Average
Operating
Margin
Average Net
Margin Average ROA
Average
Current Ratio
Average
Quick Ratio
Consumer
Reports
Customer
Service
Rating
Dell 38 821 54 45 100 118 085 56
HP 26 758 81 69 77 118 077 47
Acer (Gateway) 14 105 21 26 52 135 111 54
Apple 5 676 168 132 125 235 194 81
Lenovo 2 865 10 09 20 095 068 66
Other 15
Correlation to Market Share 014 -010 -008 034 -033 -039 -066
Dell 2006 2007 2008 Average 3-year Slope
Financial Ratios
Revenue 57420 61133 61101 59885 316
Gross Margin (Higher is Better) 834 809 821 821 -07
Operating Margin (Higher is Better) 53 56 52 54 -01
Net Margin (Higher is Better) 45 48 41 45 -02
ROA (Higher is Better) 101 107 94 100 -04
Current Ratio (Higher is Better) 112 107 136 118 012
Quick Ratio (Higher is Better) 090 078 087 085 -002
Appendix F - Probable Strategic Moves by Competitors
25 of 29 Last Modified 1162012 1014 PM
The acquisition will result in a compelling combination of two iconic information-
technology brands The expanded Dell will be even better positioned for immediate and
long-term growth and efficiency driven by
Providing a broader range of IT services and solutions and optimizing how theyrsquore
delivered
Extending the reach of Perot Systemsrsquo capabilities including in the most dynamic
customer segments around the world and
Supplying leading Dell computer systems to even more Perot Systems customers6
At some point Dell will probably outsource its PC manufacturing to China
Hewlett-Packard
Like Dell Hewlett-Packard has also diversified into consulting and IT outsourcing In the 2008
annual report the CEO Mark V Hurd writes of the recent (August 2008) acquisition of EDS
The EDS AcquisitionmdashDisciplined Execution of a Multi-year Strategy In August HP
completed its acquisition of EDS a global technology services outsourcing and
consulting leader for a purchase price of $13 billion The EDS integration is at or ahead
of the operational plans we announced in September and customer response to the
acquisition remains very positive (Hewlett-Packard 2008)
In terms of strategic moves HP seems likely to simply focus on expanding market share in the
consulting industry It would not be surprising if at some point HP outsources its PC
manufacturing to China
6 httpcontentdellcomusencorpdsecure2009-09-21-Perot-Systemsaspx accessed 9302009 845 PM
HP 2006 2007 2008 Average 3-year Slope
Financial Ratios
Revenue 91658 104286 118364 104769 1364
Gross Margin (Higher is Better) 757 756 760 758 01
Operating Margin (Higher is Better) 72 84 88 81 08
Net Margin (Higher is Better) 68 70 70 69 01
ROA (Higher is Better) 76 82 73 77 -01
Current Ratio (Higher is Better) 135 121 098 118 -018
Quick Ratio (Higher is Better) 092 078 059 077 -017
Appendix F - Probable Strategic Moves by Competitors
26 of 29 Last Modified 1162012 1014 PM
It is entertaining to note that EDS (Electronic Data Systems Corp) was founded in 1962 by Ross
Perot formerly of IBM As noted above Dell recently purchased Perot systems founded in 1988
by Ross Perot formerly of IBM
Acer Group
While Acer has growing revenues and a significant 14 market share there are almost no
positive aspects to its financial ratios There could be two options at play here
Acer may be operating as a loss leader in order to grow market share
Acer may be poorly managed and simple a bad company This seems unlikely with their
high quick ratio indicating a strong cash position
Between the two I would suspect the former It would also not be a surprise to see Acer acquire
Lenovo
Apple
Acer 2006 2007 2008 Average 3-year Slope
Financial Ratios HK$US
Revenue (HK$) 44976 59239 70035 58084 2479 78
Gross Margin (Higher is Better) 109 103 105 105 -02
Operating Margin (Higher is Better) 18 22 22 21 02
Net Margin (Higher is Better) 29 28 21 26 -04
ROA (Higher is Better) 54 53 48 52 -03
Current Ratio (Higher is Better) 147 134 125 135 -004
Quick Ratio (Higher is Better) 123 110 098 111 -004
Apple 2006 2007 2008 Average 3-year Slope
Financial Ratios
Revenue 19315 24006 32479 25267 2967
Gross Margin (Higher is Better) 710 660 657 676 -27
Operating Margin (Higher is Better) 127 184 193 168 33
Net Margin (Higher is Better) 103 146 149 132 23
ROA (Higher is Better) 116 138 122 125 03
Current Ratio (Higher is Better) 224 236 246 235 011
Quick Ratio (Higher is Better) 197 200 184 194 -006
Appendix F - Probable Strategic Moves by Competitors
27 of 29 Last Modified 1162012 1014 PM
Apple is going to continue to grow in consumer electronics and telephony Microsoft does not
dominate the operating system environment for mobile devices and Apple has a strong position
in mobile devices and mobile devices are the most likely candidate for the future of computing
platforms These facts would lead one to believe that Apple is well positioned for the future This
is also supported by the fact that of all of the companies in this analysis Apple is the only one
that is above industry averages in every financial ratio considered by this analysis They also top
the list in consumer service
Watch for Apple to continue doing what it has been doing
Lenovo
Between the two Chinese manufacturers Lenovo has the highest gross margin and the lowest
operating margin With these inefficiencies low liquidity ratios and the lowest ROA of any of
the companies examined here it seems likely that Acer will acquire Lenovo
Lenovo 2006 2007 2008 Average 3-year Slope
Financial Ratios
Revenue 14590 16352 14901 15281 106
Gross Margin (Higher is Better) 860 850 883 865 11
Operating Margin (Higher is Better) 13 31 -14 10 -14
Net Margin (Higher is Better) 11 30 -15 09 -13
ROA (Higher is Better) 30 67 -36 20 -33
Current Ratio (Higher is Better) 087 105 092 095 003
Quick Ratio (Higher is Better) 063 076 067 068 002
Appendix G - Key Success Factors
28 of 29 Last Modified 1162012 1014 PM
Key Success Factors
There are certain activities and attributes that a company must engage in and attain in order to be
successful in this industry According to IBISWorld the key success factors in this industry
include
Establishing brand names
Production of goods currently favored by the market
Economies of scale
Ensuring pricing policy is appropriate
Establishing brand names and associated reputations for quality are critical for success Brands
that have a reputation for low quality incompatibility and other negative aspects tend to
disappear from the market fairly quickly
The second two factors Economies of Scale and appropriate pricing policy are interrelated and
synergistic This means that large firms with significant economies of scale are also able to
reduce costs and by extension prices while maintaining an acceptable margin
The other KSFs cited by IBISWorld include supplier relations distribution systems and
innovation These factors are also important but perhaps not actually lsquokeyrsquo and are thus noted in
the five-forces analysis but not analyzed in any depth here
It is interesting to note that the key success factors are also responsible for the commoditization
that caused IBM to exit the market This observation bears significantly in the five-forces
analysis above
29 of 29 Last Modified 1162012 1014 PM
Works Cited
EDN PC Market to Slump 6 in 2009 EDN Aug 6 2009 54
Gubbins Ed When TVs and PCs collide Telephony Jan 3 2008 2-3
Hewlett-Packard HewlettPackard_2008_ARpdf Hewlett Packard 12 18 2008
httpmediacorporate-irnetmedia_filesirol7171087HewlettPackard_2008_ARpdf (accessed
9 30 2009)
Hoovers Computer Manufactur Industry Hoovers Online
httpwwwlibraryohiouedu2862subscribeindfrprofilebasicxhtmlID=212 (accessed 9 30
2009)
IBISWorld 33411 - Computer amp Peripheral Manufacturing in the US - Industry Report Santa
Monica IBISWorld 7 28 2009
Mallinson Keith Disruptive Innovation WirelessWeek September 2008 1431
Microsoft Explore the features Windows Media Center Microsoft 9 29 2009
httpwwwmicrosoftcomwindowswindows-vistafeaturesmedia-centeraspx (accessed 9 29
2009)
Mintel Oxygen Consumer Electronics Holiday Shopping - US - September 2009 Mintel
Oxygen 9 2009
httpwwwlibraryohiouedu2718sinatraoxygen_academicsearch_resultsdisplayid=297980amp
list=wh_itemsdisplayid=474804displayid=481151select_section=474804 (accessed 9 29
2009)
mdash Home Personal Computers - US - December 2008 Mintel Oxygen 12 2008
httpwwwlibraryohiouedu2718sinatraoxygen_academicsearch_resultsdisplayid=297980d
isplayid=434041hit1 (accessed 9 29 2009)
mdash Market Re-forecasts Technology - US - April 2009 Mintel Oxygen 4 2009
httpwwwlibraryohiouedu2718sinatraoxygen_academicsearch_resultsshowampamptype=RCIte
mampsort=relevantampaccess=accessibleamparchive=hideampsource=non_snapshotamplist=search_results
displayid=297980displayid=440938displayid=441066 (accessed Sept 29 2009)
National Bureau of Economic Research Business Cycle Dating Committee December 11 2008
httpwwwnberorgdec2008pdf (accessed September 29 2009)
mdash Business Cycle Expansions and Contractions 12 1 2008
httpwwwdevnberorgcyclescyclesmainhtml (accessed 9 29 2009)
mdash Economic Report for the President 1 2009 httpwwwnberorgerp2009_erppdf (accessed
9 29 2009)
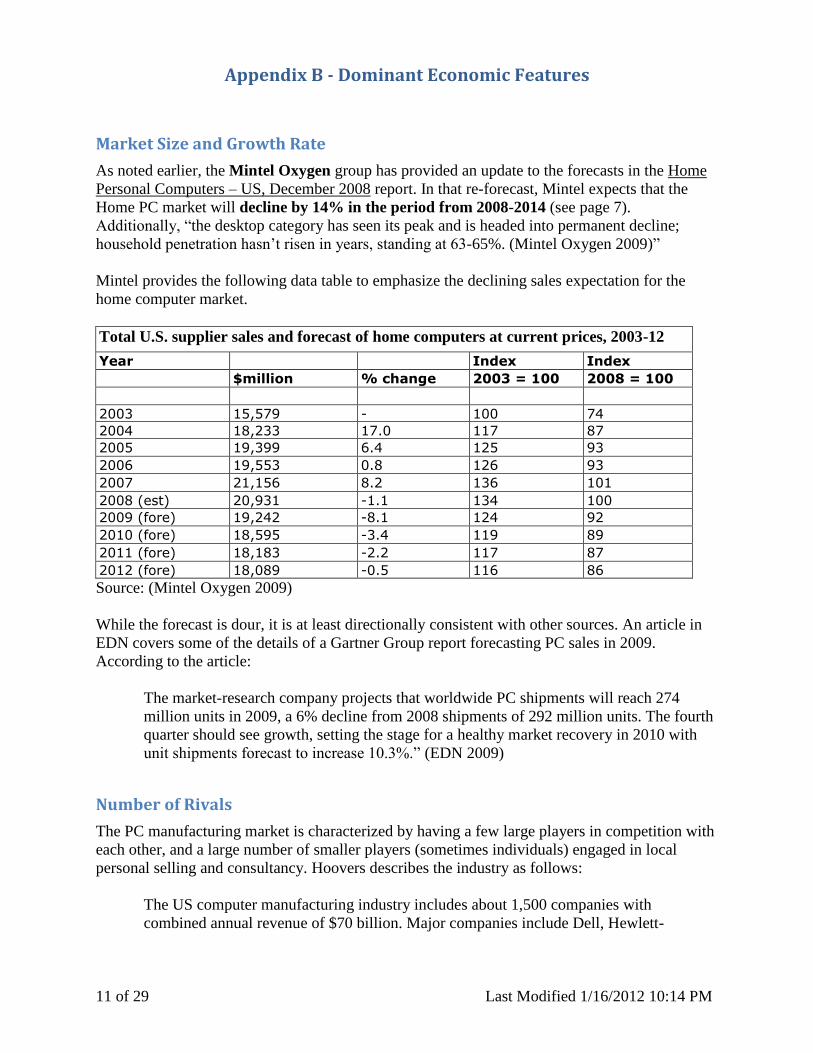
Appendix B - Dominant Economic Features
13 of 29 Last Modified 1162012 1014 PM
manufacturer Reformatting the table accounting for brand consolidation and sorting by
market share shows a clearer picture of the competitive group
Total
Less than 1 year ago
1 year to less than 2 years ago
2 years to less than 3 years ago
3 years to less than 4 years ago
4 years to less than 5 years ago
5 years ago or more
Dell 38 31 41 42 43 47 32
Hewlett Packard + Compaq 26 28 25 24 23 21 29
Acer Group 14 13 13 13 15 12 16
Other 9 7 8 9 11 11 7
Apple 5 9 5 4 3 2 3
Toshiba 3 5 3 3 2 2 1
Sony Vaio 2 2 3 2 3 2 2
IBM 2 2 1 2 2 2 2
Total 99 97 99 99 102 99 92
Here we see that the primary players in the market are Dell HP and the Acer Group Ranking
along these lines is supported by the IBISWorld 33411 - Computer amp Peripheral Manufacturing
in the US - Industry Report The following graphic from the IBISWorld report shows the key
competitors identified by IBISWorld
(IBISWorld 2009 25)
While this chart supports the inclusion of Dell HP and possibly IBM in the competitive group
it is important to understand that the market definition here includes the manufacture of
peripheral equipment For example EMC does not manufacture lsquoPersonal Computersrsquo
Appendix B - Dominant Economic Features
14 of 29 Last Modified 1162012 1014 PM
Additionally the report goes on to note that from 2002 through 2007 IBM removed itself from
most of this market
In 2002 IBM sold its hard drive manufacturing business to Hitachi Ltd and its European
desktop computer business to Sanmina-SCI In 2005 IBM sold its personal computer business to
the Lenovo group based in China In 2007 IBM sold its stake in the printer manufacturing joint
venture InfoPrint to the other Stakeholder Ricoh
IBM explains these moves in their 2008 annual report as follows
IBM has divested commoditizing businesses like personal computers and hard disk
drives and strengthened its position through strategic investments and acquisitions in
higher-value segments like business intelligence and analytics virtualization and green
solutions4
For the above reasons it seems reasonable to cite Dell HP Acer Apple and possibly the Lenovo
group as the dominant players in the industry although a significant share of the market is
scattered among a very large number of small to tiny players A further note would be that since
Acer manufacturers motherboards and many of their motherboards are used in computers
provided by the lsquoothersrsquo any analysis is likely to understate the size of the financial share of the
market owned by Acer
Scope of Competitive Rivalry
This market is almost completely globalized with the major players having significant
representation throughout the developed world
Number of Buyers
With some caveats the number of buyers approximates the number of US households There
are demographic considerations with certain brands being preferred by lower or higher income
segments (Mintel Oxygen 2008) market penetration estimates are around 63-65 of households
(Mintel Oxygen 2009) While the penetration in number of households is stagnating it is
interesting to note that multiple-computer ownership is common When Mintel asked their
subjects ldquoWhat is the number of personal computers your household ownsrdquo they gleaned the
following data
Number of home computers owned June 2002-June 2008
June 02-May 03
May 03-Apr04
May 04-May 05
May 05-Jun 06
May 06- Jun 07
Apr 07- Jun 08
One PC 59 57 58 55 54 52
Two PCs 23 25 24 25 25 26
4 ftpftpsoftwareibmcomannualreport20082008_ibm_annualpdf accessed 9292009 1147 PM
Appendix B - Dominant Economic Features
15 of 29 Last Modified 1162012 1014 PM
Three or more PCs 12 12 13 15 16 17
Average number of PCs owned 155 156 158 163 166 171
This shows that the number of computers owned per household is increasing although probably
not at a rate that could drive industry-wide growth It seems reasonable to conclude that with the
high household penetration rate and the more than 15X multiplier of computers per household it
is reasonable to use the number of households as the number of buyers (063 X 171 = 108)
According to the US Census the estimate for the number of households is 111609629 (+-
103102)5
Pace of Technological Change
It is relatively common knowledge that the pace of technological change in the PC industry is
very rapid According to the IBISWorld report 33411 - Computer amp Peripheral Manufacturing
ldquoThere is a rapid introduction of new products due to a rapid rate of technological change There
is rapid growth in customer acceptance of new products and a rapid growth in household and
business demand (IBISWorld 2009 17)rdquo
Nevertheless there are interesting developments that affect both the rate of change and the
adoption of new technologies in this market One of the most important factors that drives
demand is the need (or desire) to replace existing computers as they age The IBISWorld report
makes the following observation
Replacement demand can change over time Replacement accounts for nearly 80 of
US PC shipments and 60 of worldwide PC shipments Western Digital Corporation
stated in its 2003 annual report that it believed that the cycle time in which existing PC
owners replaced their
PCs had lengthened from two to three years to approximately three to five years This
may be due to a number of factors including improvements in products quality an
increase in the capacity of computer equipment more scrutiny on technology budgets
and slower release of new applications (IBISWorld 2009 14)
This means that the pace of technological change in the PC world can influence demand but
does not (currently) drive it There are other factors such as the rise of mobile computing
devices (non-PC) that also affect the pace of technological change in this market
Economies of Scale
There are significant economies of scale in this industry IBISWorld notes that ldquothe fall in
computer prices was promoted by a rise in economies of scale and productivity improvements in
5 httpfactfindercensusgovservletSTTable_bm=yamp-geo_id=01000USamp-
qr_name=ACS_2007_3YR_G00_S2504amp-ds_name=ACS_2007_3YR_G00_ accessed 9302009 1220 AM
Appendix B - Dominant Economic Features
16 of 29 Last Modified 1162012 1014 PM
input industries (eg semi-conductors) and by rising productivity of computer manufacturers
(IBISWorld 2009 45)rdquo Additionally ldquoeconomies of scale can represent a major factor in
competitiveness by reducing component and other costs (IBISWorld 2009 24)rdquo These
economies of scale have significant impact on the competitive landscape both in costs and in
barriers to entry These effects are examined in the five-forces analysis
Experience Curve Effects
Experience-curve effects like economies of scale are related to production volume and have
significant impact on costs These effects are present in this industry and are responsible for the
increases in productivity that in conjunction with the economies of scale caused the ongoing
reduction in costs (IBISWorld 2009 45)
Industry Ratios
Analysis of financial statements of the major players indicates the following industry averages
and rates of change
While these averages and rates of change will serve as benchmarks for other parts of the
analysis a few words are in order about them
It is interesting to note that while industry revenues are growing by a compound annual rate of
145 both gross margin and return of assets are trending downward These numbers alone
could indicate that this is an unattractive industry
Industry Averages 2006 2007 2008 Average 3-year Slope
Financial Ratios
Revenue 1446
Gross Margin (Higher is Better) 654 636 645 645 -05
Operating Margin (Higher is Better) 57 75 68 67 06
Net Margin (Higher is Better) 51 64 53 56 01
ROA (Higher is Better) 75 89 60 75 -07
Current Ratio (Higher is Better) 141 141 139 140 -001
Quick Ratio (Higher is Better) 113 109 099 107 -007
Appendix C ndash Porterrsquos Five-Forces Analysis
17 of 29 Last Modified 1162012 1014 PM
Porterrsquos Five-Forces Analysis
Rivalry
Fresh Market Actions ndash There are on-going actions by all of the major players as they
work to increase market share There seems to be two approaches here depending on the
attributes of the company The US companies (Dell and HP) are launching efforts to
diversify into higher-margin operations The Chinese competitors (Acer and Lenovo)
seem to be willing to compete on a low-cost basis
There is almost no hope of differentiating the products as they all (but Apple) have to run
the current Microsoft OS Additionally there is full penetration in all dealer networks by
almost all brands and significant Internet sales as well
Apple seems more forward-looking and is working maintain its niche (high-quality)
while expanding into the mobile market
Force Rating 4
Similarly-Sized Competitors ndash There are essentially four players in the market as
Apple is subject to significantly different forces Again the US companies are of related
size and are both significantly larger in terms of market share than the Chinese
companies Each contingent seems to be competing in its own way Dell and HP are
diversifying while Acer and Lenovo go head-to-head in manufacturing
Force Rating 4
Rivalry Due to Slow Market Growth ndash This market is completely saturated and market
growth in terms of units sold is almost stagnate The players now face a zero-sum game
This explains why IBM chose to exit the field while Dell and HP diversify
Force Rating 4
Low Switching Costs ndash There is no switching cost except between the PC variants and
the Apple Macintosh variants Among the PC makers this leads to extreme rivalry
Force Rating 4
Threat of New Entrants
Economies of Scale Effects ndash There are great economies of scale in this industry and the
effects of this fact make it both expensive and risky for a new entrant With an industry
average ROA of 75 shrinking at a compound annual rate of -07 there is little in the
way of risk-adjusted rate of return to entice new entrants
Attractiveness Rating 0
Brand Loyalty ndash There is almost no brand loyalty in this largely commoditized market
This means that anyone can enter and make a convincing marketing pitch They will have
to understand that this pitch will be primarily on the basis of price
Attractiveness Rating 4
High Capital Requirements ndash To actually manufacture PCs requires a significant
amount of capital investment When coupled with the low net margins and high risks
inherent in this industry raising such capital in the equity market seems unlikely This is
further exacerbated by the slow industry growth
Attractiveness Rating 0
Appendix C ndash Porterrsquos Five-Forces Analysis
18 of 29 Last Modified 1162012 1014 PM
Regulatory or Tariff issues ndash There are some regulatory issues with respect to pollution
that discourage electronics manufacturing in the US These are not factors for overseas
manufacturers and there are no trade regulations or tariffs
Attractiveness Rating 3
Ability of Incumbents to Block New Entrants ndash There are certain manufacturer-
supplier relationships that may be leveraged to block new entrants It would be simple for
a company like Dell to simply buy most of Intelrsquos or AMDrsquos processor chips for a short
time thus preventing a new entrant from bringing systems to market While there would
likely be anti-trust suits filed over the infraction it would be worth the fines to the
incumbents to keep another loss-leader out of an already competitive market
Attractiveness Rating 0
Pressure from Substitutes
If there is an Achillesrsquo heel in this industry this is it The growing capabilities of mobile
devices have been documented in other sections of this report IBISWorld summarizes it
nicely
Finally substitute products are also key demand determinants Products not
classified to this industry can incorporate functions that provide computing
applications (eg mobile phones digital TVs) and therefore can potentially
adversely or positively affect demand for industry products The network
computer and on-demand computing which use central servers to provide
functionality could reduce demand in value terms (IBISWorld 2009 14)
For the time being PCs will continue to have significant application in word-processing
and business functions The primary challenge is in the home (non-business) market
Force Rating 1 (but growing in the future)
Pressure from Suppliers
Supplier Bargaining Power ndash The suppliers in this industry are in an interesting
position There are only two major players in the processor market Intel and AMD and
all manufacturers support both brands Additionally there are no major functional
differences between them This leaves the PC manufacturer agnostic with respect to
processors The other components of the PC are largely commodity items so there can be
no pressure from these suppliers either
Force Rating 0
Pressure from Buyers
Buyer Bargaining Power ndash Since the PC has become a largely commoditized item with
almost no switching cost or brand loyalty the buyers tend to by based on price While
there were times when poor manufacturing standards affected the so-called lsquoclonersquo
makers those days are gone Now buyers will buy almost any brand that matches their
price point
Force Rating 4
Appendix C ndash Porterrsquos Five-Forces Analysis
19 of 29 Last Modified 1162012 1014 PM
Summary of Competitive Forces
Force Elements Average
Rivalry 4444 4 - Fierce
Threat of New Entrants 04030 14 - Weak
Pressure from Substitutes 1 1 - Weak
Supplier Bargaining Power 0 0 - Weak
Buyer Bargaining Power 4 4 - Fierce
Grand Average 21 - Moderate
In total the five forces analysis reveals that there moderate competitive forces in this industry
This hardly comes as a surprise given the financial analysis indicating that the basis of
competition is almost entirely on price
Appendix D - Forces Driving Change
20 of 29 Last Modified 1162012 1014 PM
Forces Driving Change
There are a variety of forces driving change in this industry Some of these factors are from
within the industry itself while others originate within competing product categories
Smart Phones - The rapid pace of change in smart phones emphasized to consumers by
massive ad spending provides cross-category competition from sleek new devices that
surf the internet Mintel expects computing speed and screen size to continue to rise in
smart phones with cell phone costs often subsidized by carriers consumers eyeing
budgetary constraints may prefer to upgrade the phone and leave the PC be (Mintel
Oxygen 2009)
This is perhaps the most significant long-term force in the industry Keith Mallinson of
Wireless Week makes a strong case
Mobiles will become the primary and most pervasively used or only computing
devices for most of the worldrsquos population Much of that population hasnrsquot had a
phone for long More have not yet used or rarely used a computer or Internet
connection (Mallinson 2008)
Cloud Computing - Cloud computing is clearly gaining ground among consumers even if
the term itself is relatively unknown Most e-mail software exits in the cloud Further
developments in cloud computing are likely to ensure that processor speed and RAM will
not continue to be the driving force for sales in the future that they have been in the past
(Mintel Oxygen 2009)
Internet Sales - Computer manufacturers have become more dependent on Internet sales
over the last decade Many companies sell directly to consumers through their own Web
sites or through retailers (Hoovers nd)
Appendix E - Market Positions of Competitors
21 of 29 Last Modified 1162012 1014 PM
Market Positions of Competitors
The Personal Computer manufacturing market is highly commoditized with little differentiation
in product capabilities This leads to competition on other factors With respect to home
computers customer service seems a reasonable measure However research indicates a
negative correlation between customer service (as rated by consumer reports) and market
share The following scatter chart shows the lack of relationship between market share and
customer service
Also there does not seem to be a strong relationship between market share and any standard
profitability or performance ratio The following table demonstrates this conundrum
Note the red-highlighted items indicate a measure below the industry average
The strongest positive correlation to market share is average return on assets but there is no
theoretical financial model that would explain why companies with a higher ROA would also
Dell
HP
Acer (Gateway)
AppleLenovo
0
5
10
15
20
25
30
35
40
0 10 20 30 40 50 60 70 80 90
Mar
ket
Shar
e (
De
rriv
ed
fro
m M
inte
l)
Consumer Reports Customer Service Rating
Market Share v Customer Service
Industry Averages 2006 2007 2008 Average 3-year Slope
Financial Ratios
Revenue 1446
Gross Margin (Higher is Better) 654 636 645 645 -05
Operating Margin (Higher is Better) 57 75 68 67 06
Net Margin (Higher is Better) 51 64 53 56 01
ROA (Higher is Better) 75 89 60 75 -07
Current Ratio (Higher is Better) 141 141 139 140 -001
Quick Ratio (Higher is Better) 113 109 099 107 -007
Manufacturer
Market Share
(Derrived
from Mintel)
Average
Gross Margin
Average
Operating
Margin
Average Net
Margin Average ROA
Average
Current Ratio
Average
Quick Ratio
Consumer
Reports
Customer
Service
Rating
Dell 38 821 54 45 100 118 085 56
HP 26 758 81 69 77 118 077 47
Acer (Gateway) 14 105 21 26 52 135 111 54
Apple 5 676 168 132 125 235 194 81
Lenovo 2 865 10 09 20 095 068 66
Other 15
Correlation to Market Share 014 -010 -008 034 -033 -039 -066
Appendix E - Market Positions of Competitors
22 of 29 Last Modified 1162012 1014 PM
have greater market share One might speculate that the higher ROA implies lower capital
intensity and may free-up cash for advertising and sales promotion
An exhaustive correlation analysis shows the following characteristics of the industry
There are strong correlations between the margins but this is to be expected The strangest
correlation is between the customer service rating and the liquidity ratios
Speculation leads to the following question Since Apple is NOT subject to the same rules as the
commoditized PC makers it may sell its hardware at a premium if people want the operating
system perhaps Apple should be removed from the analysis
The following table shows the correlations between the various factors without including apple
in the data set
Now we see a strong positive correlation (100) between average ROA and market share ROA is
calculated as Net Income divided by total assets and is a measure of how efficiently a company
is using its assets High efficiency implies low operating costs This is further supported by the
low correlation to average gross margin (everyone is buying the same inputs) and the high
correlation to average operating margin as the operations of the companies with the highest
market share are also the most efficient All of this implies that the PC market with the
exception of Applersquos niche is driven primarily by price and other factors such as customer
service are secondary
Market Share and ROA
The following strategic group map shows the relationship between ROA and market share
CorrelationMarket Share
Average
Gross Margin
Average
Operating
Margin
Average Net
Margin Average ROA
Average
Current Ratio
Average
Quick Ratio
Customer
Service
Rating
Market Share 014 -010 -008 034 -033 -039 -066
Average Gross Margin 019 013 013 -016 -024 019
Average Operating Margin 100 087 089 083 058
Average Net Margin 087 090 083 054
Average ROA 075 069 034
Average Current Ratio 099 074
Average Quick Ratio 076
Customer Service Rating
Correlation
(wo Apple) Market Share
Average
Gross Margin
Average
Operating
Margin
Average Net
Margin Average ROA
Average
Current Ratio
Average
Quick Ratio
Customer
Service
Rating
Market Share 019 077 075 100 042 012 -061
Average Gross Margin 031 016 013 -081 -094 027
Average Operating Margin 099 078 023 -019 -083
Average Net Margin 077 037 -005 -090
Average ROA 047 017 -066
Average Current Ratio 091 -068
Average Quick Ratio -033
Customer Service Rating
Appendix E - Market Positions of Competitors
23 of 29 Last Modified 1162012 1014 PM
The strong correlation between efficiency and market share implies a market with paper-thin
margins and this is supported by the financial ratios of both the industry and the individual
players shown earlier This is further supported by the following strategic group map
ROA and Customer Support
From the above group map clearly shows that ROA is a primary driver of market size (bubble
size) while the larger players hover around mediocre customer service ratings This means that
there is no financial incentive to differentiate one brand from another by offering better customer
support
Dell
HP
Acer (Gateway)
Apple
Lenovo
00
20
40
60
80
100
120
140
160
0 5 10 15 20 25 30 35 40 45 50
Ave
rage
RO
A
Market Share
Market Positions of Major Companies
Dell
HP
Acer (Gateway)
Apple
Lenovo
00
20
40
60
80
100
120
140
160
0 10 20 30 40 50 60 70 80 90 100
Ave
rage
RO
A
Consumer Reports Customer Service Rating
Market Positions of Major Companies
Appendix F - Probable Strategic Moves by Competitors
24 of 29 Last Modified 1162012 1014 PM
Probable Strategic Moves by Competitors
This section attempts to predict strategic moves by the various major players in this industry
These predictions are a mixture of new items financial analysis and conjecture The following
tables derived from company financial statements provide the basis of the financial analysis
Dell
In terms of market share Dell is the largest player in this analysis Yet like the other players
(except Apple) the three-year trend in ROA is downward When coupled with dells lack-luster
revenue growth 113 below the industry average Dell is likely to diversify into related
opportunities that may offer a higher margin than hardware This would be consistent with
IBMrsquos exit from the market to focus services such as consulting With this in mind the following
excerpt from a Dell press release should come as no surprise
ROUND ROCK and PLANO Texas Sept 21 2009 mdash Dell and Perot Systems have
entered a definitive agreement for Dell to acquire Perot Systems in a transaction valued at
approximately $39 billion Terms of the agreement were approved yesterday by the
boards of directors of both companies
Manufacturer
Market Share
(Derrived
from Mintel)
Average
Gross Margin
Average
Operating
Margin
Average Net
Margin Average ROA
Average
Current Ratio
Average
Quick Ratio
Consumer
Reports
Customer
Service
Rating
Dell 38 821 54 45 100 118 085 56
HP 26 758 81 69 77 118 077 47
Acer (Gateway) 14 105 21 26 52 135 111 54
Apple 5 676 168 132 125 235 194 81
Lenovo 2 865 10 09 20 095 068 66
Other 15
Correlation to Market Share 014 -010 -008 034 -033 -039 -066
Dell 2006 2007 2008 Average 3-year Slope
Financial Ratios
Revenue 57420 61133 61101 59885 316
Gross Margin (Higher is Better) 834 809 821 821 -07
Operating Margin (Higher is Better) 53 56 52 54 -01
Net Margin (Higher is Better) 45 48 41 45 -02
ROA (Higher is Better) 101 107 94 100 -04
Current Ratio (Higher is Better) 112 107 136 118 012
Quick Ratio (Higher is Better) 090 078 087 085 -002
Appendix F - Probable Strategic Moves by Competitors
25 of 29 Last Modified 1162012 1014 PM
The acquisition will result in a compelling combination of two iconic information-
technology brands The expanded Dell will be even better positioned for immediate and
long-term growth and efficiency driven by
Providing a broader range of IT services and solutions and optimizing how theyrsquore
delivered
Extending the reach of Perot Systemsrsquo capabilities including in the most dynamic
customer segments around the world and
Supplying leading Dell computer systems to even more Perot Systems customers6
At some point Dell will probably outsource its PC manufacturing to China
Hewlett-Packard
Like Dell Hewlett-Packard has also diversified into consulting and IT outsourcing In the 2008
annual report the CEO Mark V Hurd writes of the recent (August 2008) acquisition of EDS
The EDS AcquisitionmdashDisciplined Execution of a Multi-year Strategy In August HP
completed its acquisition of EDS a global technology services outsourcing and
consulting leader for a purchase price of $13 billion The EDS integration is at or ahead
of the operational plans we announced in September and customer response to the
acquisition remains very positive (Hewlett-Packard 2008)
In terms of strategic moves HP seems likely to simply focus on expanding market share in the
consulting industry It would not be surprising if at some point HP outsources its PC
manufacturing to China
6 httpcontentdellcomusencorpdsecure2009-09-21-Perot-Systemsaspx accessed 9302009 845 PM
HP 2006 2007 2008 Average 3-year Slope
Financial Ratios
Revenue 91658 104286 118364 104769 1364
Gross Margin (Higher is Better) 757 756 760 758 01
Operating Margin (Higher is Better) 72 84 88 81 08
Net Margin (Higher is Better) 68 70 70 69 01
ROA (Higher is Better) 76 82 73 77 -01
Current Ratio (Higher is Better) 135 121 098 118 -018
Quick Ratio (Higher is Better) 092 078 059 077 -017
Appendix F - Probable Strategic Moves by Competitors
26 of 29 Last Modified 1162012 1014 PM
It is entertaining to note that EDS (Electronic Data Systems Corp) was founded in 1962 by Ross
Perot formerly of IBM As noted above Dell recently purchased Perot systems founded in 1988
by Ross Perot formerly of IBM
Acer Group
While Acer has growing revenues and a significant 14 market share there are almost no
positive aspects to its financial ratios There could be two options at play here
Acer may be operating as a loss leader in order to grow market share
Acer may be poorly managed and simple a bad company This seems unlikely with their
high quick ratio indicating a strong cash position
Between the two I would suspect the former It would also not be a surprise to see Acer acquire
Lenovo
Apple
Acer 2006 2007 2008 Average 3-year Slope
Financial Ratios HK$US
Revenue (HK$) 44976 59239 70035 58084 2479 78
Gross Margin (Higher is Better) 109 103 105 105 -02
Operating Margin (Higher is Better) 18 22 22 21 02
Net Margin (Higher is Better) 29 28 21 26 -04
ROA (Higher is Better) 54 53 48 52 -03
Current Ratio (Higher is Better) 147 134 125 135 -004
Quick Ratio (Higher is Better) 123 110 098 111 -004
Apple 2006 2007 2008 Average 3-year Slope
Financial Ratios
Revenue 19315 24006 32479 25267 2967
Gross Margin (Higher is Better) 710 660 657 676 -27
Operating Margin (Higher is Better) 127 184 193 168 33
Net Margin (Higher is Better) 103 146 149 132 23
ROA (Higher is Better) 116 138 122 125 03
Current Ratio (Higher is Better) 224 236 246 235 011
Quick Ratio (Higher is Better) 197 200 184 194 -006
Appendix F - Probable Strategic Moves by Competitors
27 of 29 Last Modified 1162012 1014 PM
Apple is going to continue to grow in consumer electronics and telephony Microsoft does not
dominate the operating system environment for mobile devices and Apple has a strong position
in mobile devices and mobile devices are the most likely candidate for the future of computing
platforms These facts would lead one to believe that Apple is well positioned for the future This
is also supported by the fact that of all of the companies in this analysis Apple is the only one
that is above industry averages in every financial ratio considered by this analysis They also top
the list in consumer service
Watch for Apple to continue doing what it has been doing
Lenovo
Between the two Chinese manufacturers Lenovo has the highest gross margin and the lowest
operating margin With these inefficiencies low liquidity ratios and the lowest ROA of any of
the companies examined here it seems likely that Acer will acquire Lenovo
Lenovo 2006 2007 2008 Average 3-year Slope
Financial Ratios
Revenue 14590 16352 14901 15281 106
Gross Margin (Higher is Better) 860 850 883 865 11
Operating Margin (Higher is Better) 13 31 -14 10 -14
Net Margin (Higher is Better) 11 30 -15 09 -13
ROA (Higher is Better) 30 67 -36 20 -33
Current Ratio (Higher is Better) 087 105 092 095 003
Quick Ratio (Higher is Better) 063 076 067 068 002
Appendix G - Key Success Factors
28 of 29 Last Modified 1162012 1014 PM
Key Success Factors
There are certain activities and attributes that a company must engage in and attain in order to be
successful in this industry According to IBISWorld the key success factors in this industry
include
Establishing brand names
Production of goods currently favored by the market
Economies of scale
Ensuring pricing policy is appropriate
Establishing brand names and associated reputations for quality are critical for success Brands
that have a reputation for low quality incompatibility and other negative aspects tend to
disappear from the market fairly quickly
The second two factors Economies of Scale and appropriate pricing policy are interrelated and
synergistic This means that large firms with significant economies of scale are also able to
reduce costs and by extension prices while maintaining an acceptable margin
The other KSFs cited by IBISWorld include supplier relations distribution systems and
innovation These factors are also important but perhaps not actually lsquokeyrsquo and are thus noted in
the five-forces analysis but not analyzed in any depth here
It is interesting to note that the key success factors are also responsible for the commoditization
that caused IBM to exit the market This observation bears significantly in the five-forces
analysis above
29 of 29 Last Modified 1162012 1014 PM
Works Cited
EDN PC Market to Slump 6 in 2009 EDN Aug 6 2009 54
Gubbins Ed When TVs and PCs collide Telephony Jan 3 2008 2-3
Hewlett-Packard HewlettPackard_2008_ARpdf Hewlett Packard 12 18 2008
httpmediacorporate-irnetmedia_filesirol7171087HewlettPackard_2008_ARpdf (accessed
9 30 2009)
Hoovers Computer Manufactur Industry Hoovers Online
httpwwwlibraryohiouedu2862subscribeindfrprofilebasicxhtmlID=212 (accessed 9 30
2009)
IBISWorld 33411 - Computer amp Peripheral Manufacturing in the US - Industry Report Santa
Monica IBISWorld 7 28 2009
Mallinson Keith Disruptive Innovation WirelessWeek September 2008 1431
Microsoft Explore the features Windows Media Center Microsoft 9 29 2009
httpwwwmicrosoftcomwindowswindows-vistafeaturesmedia-centeraspx (accessed 9 29
2009)
Mintel Oxygen Consumer Electronics Holiday Shopping - US - September 2009 Mintel
Oxygen 9 2009
httpwwwlibraryohiouedu2718sinatraoxygen_academicsearch_resultsdisplayid=297980amp
list=wh_itemsdisplayid=474804displayid=481151select_section=474804 (accessed 9 29
2009)
mdash Home Personal Computers - US - December 2008 Mintel Oxygen 12 2008
httpwwwlibraryohiouedu2718sinatraoxygen_academicsearch_resultsdisplayid=297980d
isplayid=434041hit1 (accessed 9 29 2009)
mdash Market Re-forecasts Technology - US - April 2009 Mintel Oxygen 4 2009
httpwwwlibraryohiouedu2718sinatraoxygen_academicsearch_resultsshowampamptype=RCIte
mampsort=relevantampaccess=accessibleamparchive=hideampsource=non_snapshotamplist=search_results
displayid=297980displayid=440938displayid=441066 (accessed Sept 29 2009)
National Bureau of Economic Research Business Cycle Dating Committee December 11 2008
httpwwwnberorgdec2008pdf (accessed September 29 2009)
mdash Business Cycle Expansions and Contractions 12 1 2008
httpwwwdevnberorgcyclescyclesmainhtml (accessed 9 29 2009)
mdash Economic Report for the President 1 2009 httpwwwnberorgerp2009_erppdf (accessed
9 29 2009)
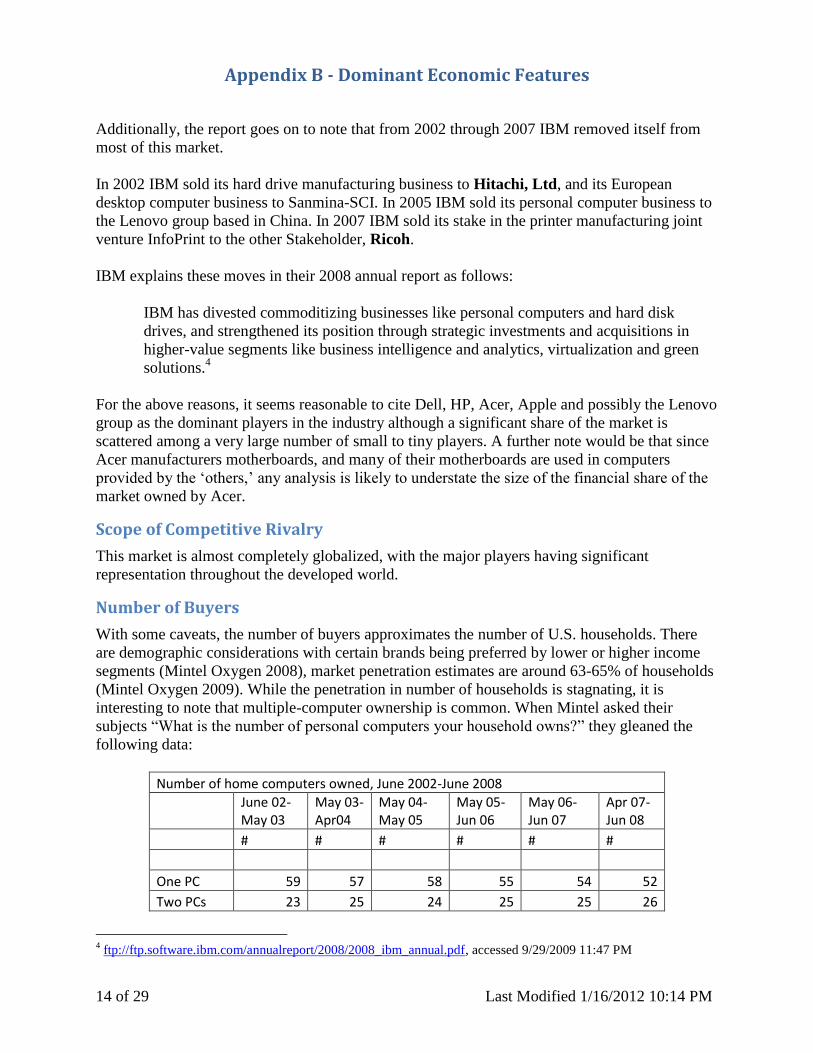
Appendix B - Dominant Economic Features
16 of 29 Last Modified 1162012 1014 PM
input industries (eg semi-conductors) and by rising productivity of computer manufacturers
(IBISWorld 2009 45)rdquo Additionally ldquoeconomies of scale can represent a major factor in
competitiveness by reducing component and other costs (IBISWorld 2009 24)rdquo These
economies of scale have significant impact on the competitive landscape both in costs and in
barriers to entry These effects are examined in the five-forces analysis
Experience Curve Effects
Experience-curve effects like economies of scale are related to production volume and have
significant impact on costs These effects are present in this industry and are responsible for the
increases in productivity that in conjunction with the economies of scale caused the ongoing
reduction in costs (IBISWorld 2009 45)
Industry Ratios
Analysis of financial statements of the major players indicates the following industry averages
and rates of change
While these averages and rates of change will serve as benchmarks for other parts of the
analysis a few words are in order about them
It is interesting to note that while industry revenues are growing by a compound annual rate of
145 both gross margin and return of assets are trending downward These numbers alone
could indicate that this is an unattractive industry
Industry Averages 2006 2007 2008 Average 3-year Slope
Financial Ratios
Revenue 1446
Gross Margin (Higher is Better) 654 636 645 645 -05
Operating Margin (Higher is Better) 57 75 68 67 06
Net Margin (Higher is Better) 51 64 53 56 01
ROA (Higher is Better) 75 89 60 75 -07
Current Ratio (Higher is Better) 141 141 139 140 -001
Quick Ratio (Higher is Better) 113 109 099 107 -007
Appendix C ndash Porterrsquos Five-Forces Analysis
17 of 29 Last Modified 1162012 1014 PM
Porterrsquos Five-Forces Analysis
Rivalry
Fresh Market Actions ndash There are on-going actions by all of the major players as they
work to increase market share There seems to be two approaches here depending on the
attributes of the company The US companies (Dell and HP) are launching efforts to
diversify into higher-margin operations The Chinese competitors (Acer and Lenovo)
seem to be willing to compete on a low-cost basis
There is almost no hope of differentiating the products as they all (but Apple) have to run
the current Microsoft OS Additionally there is full penetration in all dealer networks by
almost all brands and significant Internet sales as well
Apple seems more forward-looking and is working maintain its niche (high-quality)
while expanding into the mobile market
Force Rating 4
Similarly-Sized Competitors ndash There are essentially four players in the market as
Apple is subject to significantly different forces Again the US companies are of related
size and are both significantly larger in terms of market share than the Chinese
companies Each contingent seems to be competing in its own way Dell and HP are
diversifying while Acer and Lenovo go head-to-head in manufacturing
Force Rating 4
Rivalry Due to Slow Market Growth ndash This market is completely saturated and market
growth in terms of units sold is almost stagnate The players now face a zero-sum game
This explains why IBM chose to exit the field while Dell and HP diversify
Force Rating 4
Low Switching Costs ndash There is no switching cost except between the PC variants and
the Apple Macintosh variants Among the PC makers this leads to extreme rivalry
Force Rating 4
Threat of New Entrants
Economies of Scale Effects ndash There are great economies of scale in this industry and the
effects of this fact make it both expensive and risky for a new entrant With an industry
average ROA of 75 shrinking at a compound annual rate of -07 there is little in the
way of risk-adjusted rate of return to entice new entrants
Attractiveness Rating 0
Brand Loyalty ndash There is almost no brand loyalty in this largely commoditized market
This means that anyone can enter and make a convincing marketing pitch They will have
to understand that this pitch will be primarily on the basis of price
Attractiveness Rating 4
High Capital Requirements ndash To actually manufacture PCs requires a significant
amount of capital investment When coupled with the low net margins and high risks
inherent in this industry raising such capital in the equity market seems unlikely This is
further exacerbated by the slow industry growth
Attractiveness Rating 0
Appendix C ndash Porterrsquos Five-Forces Analysis
18 of 29 Last Modified 1162012 1014 PM
Regulatory or Tariff issues ndash There are some regulatory issues with respect to pollution
that discourage electronics manufacturing in the US These are not factors for overseas
manufacturers and there are no trade regulations or tariffs
Attractiveness Rating 3
Ability of Incumbents to Block New Entrants ndash There are certain manufacturer-
supplier relationships that may be leveraged to block new entrants It would be simple for
a company like Dell to simply buy most of Intelrsquos or AMDrsquos processor chips for a short
time thus preventing a new entrant from bringing systems to market While there would
likely be anti-trust suits filed over the infraction it would be worth the fines to the
incumbents to keep another loss-leader out of an already competitive market
Attractiveness Rating 0
Pressure from Substitutes
If there is an Achillesrsquo heel in this industry this is it The growing capabilities of mobile
devices have been documented in other sections of this report IBISWorld summarizes it
nicely
Finally substitute products are also key demand determinants Products not
classified to this industry can incorporate functions that provide computing
applications (eg mobile phones digital TVs) and therefore can potentially
adversely or positively affect demand for industry products The network
computer and on-demand computing which use central servers to provide
functionality could reduce demand in value terms (IBISWorld 2009 14)
For the time being PCs will continue to have significant application in word-processing
and business functions The primary challenge is in the home (non-business) market
Force Rating 1 (but growing in the future)
Pressure from Suppliers
Supplier Bargaining Power ndash The suppliers in this industry are in an interesting
position There are only two major players in the processor market Intel and AMD and
all manufacturers support both brands Additionally there are no major functional
differences between them This leaves the PC manufacturer agnostic with respect to
processors The other components of the PC are largely commodity items so there can be
no pressure from these suppliers either
Force Rating 0
Pressure from Buyers
Buyer Bargaining Power ndash Since the PC has become a largely commoditized item with
almost no switching cost or brand loyalty the buyers tend to by based on price While
there were times when poor manufacturing standards affected the so-called lsquoclonersquo
makers those days are gone Now buyers will buy almost any brand that matches their
price point
Force Rating 4
Appendix C ndash Porterrsquos Five-Forces Analysis
19 of 29 Last Modified 1162012 1014 PM
Summary of Competitive Forces
Force Elements Average
Rivalry 4444 4 - Fierce
Threat of New Entrants 04030 14 - Weak
Pressure from Substitutes 1 1 - Weak
Supplier Bargaining Power 0 0 - Weak
Buyer Bargaining Power 4 4 - Fierce
Grand Average 21 - Moderate
In total the five forces analysis reveals that there moderate competitive forces in this industry
This hardly comes as a surprise given the financial analysis indicating that the basis of
competition is almost entirely on price
Appendix D - Forces Driving Change
20 of 29 Last Modified 1162012 1014 PM
Forces Driving Change
There are a variety of forces driving change in this industry Some of these factors are from
within the industry itself while others originate within competing product categories
Smart Phones - The rapid pace of change in smart phones emphasized to consumers by
massive ad spending provides cross-category competition from sleek new devices that
surf the internet Mintel expects computing speed and screen size to continue to rise in
smart phones with cell phone costs often subsidized by carriers consumers eyeing
budgetary constraints may prefer to upgrade the phone and leave the PC be (Mintel
Oxygen 2009)
This is perhaps the most significant long-term force in the industry Keith Mallinson of
Wireless Week makes a strong case
Mobiles will become the primary and most pervasively used or only computing
devices for most of the worldrsquos population Much of that population hasnrsquot had a
phone for long More have not yet used or rarely used a computer or Internet
connection (Mallinson 2008)
Cloud Computing - Cloud computing is clearly gaining ground among consumers even if
the term itself is relatively unknown Most e-mail software exits in the cloud Further
developments in cloud computing are likely to ensure that processor speed and RAM will
not continue to be the driving force for sales in the future that they have been in the past
(Mintel Oxygen 2009)
Internet Sales - Computer manufacturers have become more dependent on Internet sales
over the last decade Many companies sell directly to consumers through their own Web
sites or through retailers (Hoovers nd)
Appendix E - Market Positions of Competitors
21 of 29 Last Modified 1162012 1014 PM
Market Positions of Competitors
The Personal Computer manufacturing market is highly commoditized with little differentiation
in product capabilities This leads to competition on other factors With respect to home
computers customer service seems a reasonable measure However research indicates a
negative correlation between customer service (as rated by consumer reports) and market
share The following scatter chart shows the lack of relationship between market share and
customer service
Also there does not seem to be a strong relationship between market share and any standard
profitability or performance ratio The following table demonstrates this conundrum
Note the red-highlighted items indicate a measure below the industry average
The strongest positive correlation to market share is average return on assets but there is no
theoretical financial model that would explain why companies with a higher ROA would also
Dell
HP
Acer (Gateway)
AppleLenovo
0
5
10
15
20
25
30
35
40
0 10 20 30 40 50 60 70 80 90
Mar
ket
Shar
e (
De
rriv
ed
fro
m M
inte
l)
Consumer Reports Customer Service Rating
Market Share v Customer Service
Industry Averages 2006 2007 2008 Average 3-year Slope
Financial Ratios
Revenue 1446
Gross Margin (Higher is Better) 654 636 645 645 -05
Operating Margin (Higher is Better) 57 75 68 67 06
Net Margin (Higher is Better) 51 64 53 56 01
ROA (Higher is Better) 75 89 60 75 -07
Current Ratio (Higher is Better) 141 141 139 140 -001
Quick Ratio (Higher is Better) 113 109 099 107 -007
Manufacturer
Market Share
(Derrived
from Mintel)
Average
Gross Margin
Average
Operating
Margin
Average Net
Margin Average ROA
Average
Current Ratio
Average
Quick Ratio
Consumer
Reports
Customer
Service
Rating
Dell 38 821 54 45 100 118 085 56
HP 26 758 81 69 77 118 077 47
Acer (Gateway) 14 105 21 26 52 135 111 54
Apple 5 676 168 132 125 235 194 81
Lenovo 2 865 10 09 20 095 068 66
Other 15
Correlation to Market Share 014 -010 -008 034 -033 -039 -066
Appendix E - Market Positions of Competitors
22 of 29 Last Modified 1162012 1014 PM
have greater market share One might speculate that the higher ROA implies lower capital
intensity and may free-up cash for advertising and sales promotion
An exhaustive correlation analysis shows the following characteristics of the industry
There are strong correlations between the margins but this is to be expected The strangest
correlation is between the customer service rating and the liquidity ratios
Speculation leads to the following question Since Apple is NOT subject to the same rules as the
commoditized PC makers it may sell its hardware at a premium if people want the operating
system perhaps Apple should be removed from the analysis
The following table shows the correlations between the various factors without including apple
in the data set
Now we see a strong positive correlation (100) between average ROA and market share ROA is
calculated as Net Income divided by total assets and is a measure of how efficiently a company
is using its assets High efficiency implies low operating costs This is further supported by the
low correlation to average gross margin (everyone is buying the same inputs) and the high
correlation to average operating margin as the operations of the companies with the highest
market share are also the most efficient All of this implies that the PC market with the
exception of Applersquos niche is driven primarily by price and other factors such as customer
service are secondary
Market Share and ROA
The following strategic group map shows the relationship between ROA and market share
CorrelationMarket Share
Average
Gross Margin
Average
Operating
Margin
Average Net
Margin Average ROA
Average
Current Ratio
Average
Quick Ratio
Customer
Service
Rating
Market Share 014 -010 -008 034 -033 -039 -066
Average Gross Margin 019 013 013 -016 -024 019
Average Operating Margin 100 087 089 083 058
Average Net Margin 087 090 083 054
Average ROA 075 069 034
Average Current Ratio 099 074
Average Quick Ratio 076
Customer Service Rating
Correlation
(wo Apple) Market Share
Average
Gross Margin
Average
Operating
Margin
Average Net
Margin Average ROA
Average
Current Ratio
Average
Quick Ratio
Customer
Service
Rating
Market Share 019 077 075 100 042 012 -061
Average Gross Margin 031 016 013 -081 -094 027
Average Operating Margin 099 078 023 -019 -083
Average Net Margin 077 037 -005 -090
Average ROA 047 017 -066
Average Current Ratio 091 -068
Average Quick Ratio -033
Customer Service Rating
Appendix E - Market Positions of Competitors
23 of 29 Last Modified 1162012 1014 PM
The strong correlation between efficiency and market share implies a market with paper-thin
margins and this is supported by the financial ratios of both the industry and the individual
players shown earlier This is further supported by the following strategic group map
ROA and Customer Support
From the above group map clearly shows that ROA is a primary driver of market size (bubble
size) while the larger players hover around mediocre customer service ratings This means that
there is no financial incentive to differentiate one brand from another by offering better customer
support
Dell
HP
Acer (Gateway)
Apple
Lenovo
00
20
40
60
80
100
120
140
160
0 5 10 15 20 25 30 35 40 45 50
Ave
rage
RO
A
Market Share
Market Positions of Major Companies
Dell
HP
Acer (Gateway)
Apple
Lenovo
00
20
40
60
80
100
120
140
160
0 10 20 30 40 50 60 70 80 90 100
Ave
rage
RO
A
Consumer Reports Customer Service Rating
Market Positions of Major Companies
Appendix F - Probable Strategic Moves by Competitors
24 of 29 Last Modified 1162012 1014 PM
Probable Strategic Moves by Competitors
This section attempts to predict strategic moves by the various major players in this industry
These predictions are a mixture of new items financial analysis and conjecture The following
tables derived from company financial statements provide the basis of the financial analysis
Dell
In terms of market share Dell is the largest player in this analysis Yet like the other players
(except Apple) the three-year trend in ROA is downward When coupled with dells lack-luster
revenue growth 113 below the industry average Dell is likely to diversify into related
opportunities that may offer a higher margin than hardware This would be consistent with
IBMrsquos exit from the market to focus services such as consulting With this in mind the following
excerpt from a Dell press release should come as no surprise
ROUND ROCK and PLANO Texas Sept 21 2009 mdash Dell and Perot Systems have
entered a definitive agreement for Dell to acquire Perot Systems in a transaction valued at
approximately $39 billion Terms of the agreement were approved yesterday by the
boards of directors of both companies
Manufacturer
Market Share
(Derrived
from Mintel)
Average
Gross Margin
Average
Operating
Margin
Average Net
Margin Average ROA
Average
Current Ratio
Average
Quick Ratio
Consumer
Reports
Customer
Service
Rating
Dell 38 821 54 45 100 118 085 56
HP 26 758 81 69 77 118 077 47
Acer (Gateway) 14 105 21 26 52 135 111 54
Apple 5 676 168 132 125 235 194 81
Lenovo 2 865 10 09 20 095 068 66
Other 15
Correlation to Market Share 014 -010 -008 034 -033 -039 -066
Dell 2006 2007 2008 Average 3-year Slope
Financial Ratios
Revenue 57420 61133 61101 59885 316
Gross Margin (Higher is Better) 834 809 821 821 -07
Operating Margin (Higher is Better) 53 56 52 54 -01
Net Margin (Higher is Better) 45 48 41 45 -02
ROA (Higher is Better) 101 107 94 100 -04
Current Ratio (Higher is Better) 112 107 136 118 012
Quick Ratio (Higher is Better) 090 078 087 085 -002
Appendix F - Probable Strategic Moves by Competitors
25 of 29 Last Modified 1162012 1014 PM
The acquisition will result in a compelling combination of two iconic information-
technology brands The expanded Dell will be even better positioned for immediate and
long-term growth and efficiency driven by
Providing a broader range of IT services and solutions and optimizing how theyrsquore
delivered
Extending the reach of Perot Systemsrsquo capabilities including in the most dynamic
customer segments around the world and
Supplying leading Dell computer systems to even more Perot Systems customers6
At some point Dell will probably outsource its PC manufacturing to China
Hewlett-Packard
Like Dell Hewlett-Packard has also diversified into consulting and IT outsourcing In the 2008
annual report the CEO Mark V Hurd writes of the recent (August 2008) acquisition of EDS
The EDS AcquisitionmdashDisciplined Execution of a Multi-year Strategy In August HP
completed its acquisition of EDS a global technology services outsourcing and
consulting leader for a purchase price of $13 billion The EDS integration is at or ahead
of the operational plans we announced in September and customer response to the
acquisition remains very positive (Hewlett-Packard 2008)
In terms of strategic moves HP seems likely to simply focus on expanding market share in the
consulting industry It would not be surprising if at some point HP outsources its PC
manufacturing to China
6 httpcontentdellcomusencorpdsecure2009-09-21-Perot-Systemsaspx accessed 9302009 845 PM
HP 2006 2007 2008 Average 3-year Slope
Financial Ratios
Revenue 91658 104286 118364 104769 1364
Gross Margin (Higher is Better) 757 756 760 758 01
Operating Margin (Higher is Better) 72 84 88 81 08
Net Margin (Higher is Better) 68 70 70 69 01
ROA (Higher is Better) 76 82 73 77 -01
Current Ratio (Higher is Better) 135 121 098 118 -018
Quick Ratio (Higher is Better) 092 078 059 077 -017
Appendix F - Probable Strategic Moves by Competitors
26 of 29 Last Modified 1162012 1014 PM
It is entertaining to note that EDS (Electronic Data Systems Corp) was founded in 1962 by Ross
Perot formerly of IBM As noted above Dell recently purchased Perot systems founded in 1988
by Ross Perot formerly of IBM
Acer Group
While Acer has growing revenues and a significant 14 market share there are almost no
positive aspects to its financial ratios There could be two options at play here
Acer may be operating as a loss leader in order to grow market share
Acer may be poorly managed and simple a bad company This seems unlikely with their
high quick ratio indicating a strong cash position
Between the two I would suspect the former It would also not be a surprise to see Acer acquire
Lenovo
Apple
Acer 2006 2007 2008 Average 3-year Slope
Financial Ratios HK$US
Revenue (HK$) 44976 59239 70035 58084 2479 78
Gross Margin (Higher is Better) 109 103 105 105 -02
Operating Margin (Higher is Better) 18 22 22 21 02
Net Margin (Higher is Better) 29 28 21 26 -04
ROA (Higher is Better) 54 53 48 52 -03
Current Ratio (Higher is Better) 147 134 125 135 -004
Quick Ratio (Higher is Better) 123 110 098 111 -004
Apple 2006 2007 2008 Average 3-year Slope
Financial Ratios
Revenue 19315 24006 32479 25267 2967
Gross Margin (Higher is Better) 710 660 657 676 -27
Operating Margin (Higher is Better) 127 184 193 168 33
Net Margin (Higher is Better) 103 146 149 132 23
ROA (Higher is Better) 116 138 122 125 03
Current Ratio (Higher is Better) 224 236 246 235 011
Quick Ratio (Higher is Better) 197 200 184 194 -006
Appendix F - Probable Strategic Moves by Competitors
27 of 29 Last Modified 1162012 1014 PM
Apple is going to continue to grow in consumer electronics and telephony Microsoft does not
dominate the operating system environment for mobile devices and Apple has a strong position
in mobile devices and mobile devices are the most likely candidate for the future of computing
platforms These facts would lead one to believe that Apple is well positioned for the future This
is also supported by the fact that of all of the companies in this analysis Apple is the only one
that is above industry averages in every financial ratio considered by this analysis They also top
the list in consumer service
Watch for Apple to continue doing what it has been doing
Lenovo
Between the two Chinese manufacturers Lenovo has the highest gross margin and the lowest
operating margin With these inefficiencies low liquidity ratios and the lowest ROA of any of
the companies examined here it seems likely that Acer will acquire Lenovo
Lenovo 2006 2007 2008 Average 3-year Slope
Financial Ratios
Revenue 14590 16352 14901 15281 106
Gross Margin (Higher is Better) 860 850 883 865 11
Operating Margin (Higher is Better) 13 31 -14 10 -14
Net Margin (Higher is Better) 11 30 -15 09 -13
ROA (Higher is Better) 30 67 -36 20 -33
Current Ratio (Higher is Better) 087 105 092 095 003
Quick Ratio (Higher is Better) 063 076 067 068 002
Appendix G - Key Success Factors
28 of 29 Last Modified 1162012 1014 PM
Key Success Factors
There are certain activities and attributes that a company must engage in and attain in order to be
successful in this industry According to IBISWorld the key success factors in this industry
include
Establishing brand names
Production of goods currently favored by the market
Economies of scale
Ensuring pricing policy is appropriate
Establishing brand names and associated reputations for quality are critical for success Brands
that have a reputation for low quality incompatibility and other negative aspects tend to
disappear from the market fairly quickly
The second two factors Economies of Scale and appropriate pricing policy are interrelated and
synergistic This means that large firms with significant economies of scale are also able to
reduce costs and by extension prices while maintaining an acceptable margin
The other KSFs cited by IBISWorld include supplier relations distribution systems and
innovation These factors are also important but perhaps not actually lsquokeyrsquo and are thus noted in
the five-forces analysis but not analyzed in any depth here
It is interesting to note that the key success factors are also responsible for the commoditization
that caused IBM to exit the market This observation bears significantly in the five-forces
analysis above
29 of 29 Last Modified 1162012 1014 PM
Works Cited
EDN PC Market to Slump 6 in 2009 EDN Aug 6 2009 54
Gubbins Ed When TVs and PCs collide Telephony Jan 3 2008 2-3
Hewlett-Packard HewlettPackard_2008_ARpdf Hewlett Packard 12 18 2008
httpmediacorporate-irnetmedia_filesirol7171087HewlettPackard_2008_ARpdf (accessed
9 30 2009)
Hoovers Computer Manufactur Industry Hoovers Online
httpwwwlibraryohiouedu2862subscribeindfrprofilebasicxhtmlID=212 (accessed 9 30
2009)
IBISWorld 33411 - Computer amp Peripheral Manufacturing in the US - Industry Report Santa
Monica IBISWorld 7 28 2009
Mallinson Keith Disruptive Innovation WirelessWeek September 2008 1431
Microsoft Explore the features Windows Media Center Microsoft 9 29 2009
httpwwwmicrosoftcomwindowswindows-vistafeaturesmedia-centeraspx (accessed 9 29
2009)
Mintel Oxygen Consumer Electronics Holiday Shopping - US - September 2009 Mintel
Oxygen 9 2009
httpwwwlibraryohiouedu2718sinatraoxygen_academicsearch_resultsdisplayid=297980amp
list=wh_itemsdisplayid=474804displayid=481151select_section=474804 (accessed 9 29
2009)
mdash Home Personal Computers - US - December 2008 Mintel Oxygen 12 2008
httpwwwlibraryohiouedu2718sinatraoxygen_academicsearch_resultsdisplayid=297980d
isplayid=434041hit1 (accessed 9 29 2009)
mdash Market Re-forecasts Technology - US - April 2009 Mintel Oxygen 4 2009
httpwwwlibraryohiouedu2718sinatraoxygen_academicsearch_resultsshowampamptype=RCIte
mampsort=relevantampaccess=accessibleamparchive=hideampsource=non_snapshotamplist=search_results
displayid=297980displayid=440938displayid=441066 (accessed Sept 29 2009)
National Bureau of Economic Research Business Cycle Dating Committee December 11 2008
httpwwwnberorgdec2008pdf (accessed September 29 2009)
mdash Business Cycle Expansions and Contractions 12 1 2008
httpwwwdevnberorgcyclescyclesmainhtml (accessed 9 29 2009)
mdash Economic Report for the President 1 2009 httpwwwnberorgerp2009_erppdf (accessed
9 29 2009)

Appendix C ndash Porterrsquos Five-Forces Analysis
18 of 29 Last Modified 1162012 1014 PM
Regulatory or Tariff issues ndash There are some regulatory issues with respect to pollution
that discourage electronics manufacturing in the US These are not factors for overseas
manufacturers and there are no trade regulations or tariffs
Attractiveness Rating 3
Ability of Incumbents to Block New Entrants ndash There are certain manufacturer-
supplier relationships that may be leveraged to block new entrants It would be simple for
a company like Dell to simply buy most of Intelrsquos or AMDrsquos processor chips for a short
time thus preventing a new entrant from bringing systems to market While there would
likely be anti-trust suits filed over the infraction it would be worth the fines to the
incumbents to keep another loss-leader out of an already competitive market
Attractiveness Rating 0
Pressure from Substitutes
If there is an Achillesrsquo heel in this industry this is it The growing capabilities of mobile
devices have been documented in other sections of this report IBISWorld summarizes it
nicely
Finally substitute products are also key demand determinants Products not
classified to this industry can incorporate functions that provide computing
applications (eg mobile phones digital TVs) and therefore can potentially
adversely or positively affect demand for industry products The network
computer and on-demand computing which use central servers to provide
functionality could reduce demand in value terms (IBISWorld 2009 14)
For the time being PCs will continue to have significant application in word-processing
and business functions The primary challenge is in the home (non-business) market
Force Rating 1 (but growing in the future)
Pressure from Suppliers
Supplier Bargaining Power ndash The suppliers in this industry are in an interesting
position There are only two major players in the processor market Intel and AMD and
all manufacturers support both brands Additionally there are no major functional
differences between them This leaves the PC manufacturer agnostic with respect to
processors The other components of the PC are largely commodity items so there can be
no pressure from these suppliers either
Force Rating 0
Pressure from Buyers
Buyer Bargaining Power ndash Since the PC has become a largely commoditized item with
almost no switching cost or brand loyalty the buyers tend to by based on price While
there were times when poor manufacturing standards affected the so-called lsquoclonersquo
makers those days are gone Now buyers will buy almost any brand that matches their
price point
Force Rating 4
Appendix C ndash Porterrsquos Five-Forces Analysis
19 of 29 Last Modified 1162012 1014 PM
Summary of Competitive Forces
Force Elements Average
Rivalry 4444 4 - Fierce
Threat of New Entrants 04030 14 - Weak
Pressure from Substitutes 1 1 - Weak
Supplier Bargaining Power 0 0 - Weak
Buyer Bargaining Power 4 4 - Fierce
Grand Average 21 - Moderate
In total the five forces analysis reveals that there moderate competitive forces in this industry
This hardly comes as a surprise given the financial analysis indicating that the basis of
competition is almost entirely on price
Appendix D - Forces Driving Change
20 of 29 Last Modified 1162012 1014 PM
Forces Driving Change
There are a variety of forces driving change in this industry Some of these factors are from
within the industry itself while others originate within competing product categories
Smart Phones - The rapid pace of change in smart phones emphasized to consumers by
massive ad spending provides cross-category competition from sleek new devices that
surf the internet Mintel expects computing speed and screen size to continue to rise in
smart phones with cell phone costs often subsidized by carriers consumers eyeing
budgetary constraints may prefer to upgrade the phone and leave the PC be (Mintel
Oxygen 2009)
This is perhaps the most significant long-term force in the industry Keith Mallinson of
Wireless Week makes a strong case
Mobiles will become the primary and most pervasively used or only computing
devices for most of the worldrsquos population Much of that population hasnrsquot had a
phone for long More have not yet used or rarely used a computer or Internet
connection (Mallinson 2008)
Cloud Computing - Cloud computing is clearly gaining ground among consumers even if
the term itself is relatively unknown Most e-mail software exits in the cloud Further
developments in cloud computing are likely to ensure that processor speed and RAM will
not continue to be the driving force for sales in the future that they have been in the past
(Mintel Oxygen 2009)
Internet Sales - Computer manufacturers have become more dependent on Internet sales
over the last decade Many companies sell directly to consumers through their own Web
sites or through retailers (Hoovers nd)
Appendix E - Market Positions of Competitors
21 of 29 Last Modified 1162012 1014 PM
Market Positions of Competitors
The Personal Computer manufacturing market is highly commoditized with little differentiation
in product capabilities This leads to competition on other factors With respect to home
computers customer service seems a reasonable measure However research indicates a
negative correlation between customer service (as rated by consumer reports) and market
share The following scatter chart shows the lack of relationship between market share and
customer service
Also there does not seem to be a strong relationship between market share and any standard
profitability or performance ratio The following table demonstrates this conundrum
Note the red-highlighted items indicate a measure below the industry average
The strongest positive correlation to market share is average return on assets but there is no
theoretical financial model that would explain why companies with a higher ROA would also
Dell
HP
Acer (Gateway)
AppleLenovo
0
5
10
15
20
25
30
35
40
0 10 20 30 40 50 60 70 80 90
Mar
ket
Shar
e (
De
rriv
ed
fro
m M
inte
l)
Consumer Reports Customer Service Rating
Market Share v Customer Service
Industry Averages 2006 2007 2008 Average 3-year Slope
Financial Ratios
Revenue 1446
Gross Margin (Higher is Better) 654 636 645 645 -05
Operating Margin (Higher is Better) 57 75 68 67 06
Net Margin (Higher is Better) 51 64 53 56 01
ROA (Higher is Better) 75 89 60 75 -07
Current Ratio (Higher is Better) 141 141 139 140 -001
Quick Ratio (Higher is Better) 113 109 099 107 -007
Manufacturer
Market Share
(Derrived
from Mintel)
Average
Gross Margin
Average
Operating
Margin
Average Net
Margin Average ROA
Average
Current Ratio
Average
Quick Ratio
Consumer
Reports
Customer
Service
Rating
Dell 38 821 54 45 100 118 085 56
HP 26 758 81 69 77 118 077 47
Acer (Gateway) 14 105 21 26 52 135 111 54
Apple 5 676 168 132 125 235 194 81
Lenovo 2 865 10 09 20 095 068 66
Other 15
Correlation to Market Share 014 -010 -008 034 -033 -039 -066
Appendix E - Market Positions of Competitors
22 of 29 Last Modified 1162012 1014 PM
have greater market share One might speculate that the higher ROA implies lower capital
intensity and may free-up cash for advertising and sales promotion
An exhaustive correlation analysis shows the following characteristics of the industry
There are strong correlations between the margins but this is to be expected The strangest
correlation is between the customer service rating and the liquidity ratios
Speculation leads to the following question Since Apple is NOT subject to the same rules as the
commoditized PC makers it may sell its hardware at a premium if people want the operating
system perhaps Apple should be removed from the analysis
The following table shows the correlations between the various factors without including apple
in the data set
Now we see a strong positive correlation (100) between average ROA and market share ROA is
calculated as Net Income divided by total assets and is a measure of how efficiently a company
is using its assets High efficiency implies low operating costs This is further supported by the
low correlation to average gross margin (everyone is buying the same inputs) and the high
correlation to average operating margin as the operations of the companies with the highest
market share are also the most efficient All of this implies that the PC market with the
exception of Applersquos niche is driven primarily by price and other factors such as customer
service are secondary
Market Share and ROA
The following strategic group map shows the relationship between ROA and market share
CorrelationMarket Share
Average
Gross Margin
Average
Operating
Margin
Average Net
Margin Average ROA
Average
Current Ratio
Average
Quick Ratio
Customer
Service
Rating
Market Share 014 -010 -008 034 -033 -039 -066
Average Gross Margin 019 013 013 -016 -024 019
Average Operating Margin 100 087 089 083 058
Average Net Margin 087 090 083 054
Average ROA 075 069 034
Average Current Ratio 099 074
Average Quick Ratio 076
Customer Service Rating
Correlation
(wo Apple) Market Share
Average
Gross Margin
Average
Operating
Margin
Average Net
Margin Average ROA
Average
Current Ratio
Average
Quick Ratio
Customer
Service
Rating
Market Share 019 077 075 100 042 012 -061
Average Gross Margin 031 016 013 -081 -094 027
Average Operating Margin 099 078 023 -019 -083
Average Net Margin 077 037 -005 -090
Average ROA 047 017 -066
Average Current Ratio 091 -068
Average Quick Ratio -033
Customer Service Rating
Appendix E - Market Positions of Competitors
23 of 29 Last Modified 1162012 1014 PM
The strong correlation between efficiency and market share implies a market with paper-thin
margins and this is supported by the financial ratios of both the industry and the individual
players shown earlier This is further supported by the following strategic group map
ROA and Customer Support
From the above group map clearly shows that ROA is a primary driver of market size (bubble
size) while the larger players hover around mediocre customer service ratings This means that
there is no financial incentive to differentiate one brand from another by offering better customer
support
Dell
HP
Acer (Gateway)
Apple
Lenovo
00
20
40
60
80
100
120
140
160
0 5 10 15 20 25 30 35 40 45 50
Ave
rage
RO
A
Market Share
Market Positions of Major Companies
Dell
HP
Acer (Gateway)
Apple
Lenovo
00
20
40
60
80
100
120
140
160
0 10 20 30 40 50 60 70 80 90 100
Ave
rage
RO
A
Consumer Reports Customer Service Rating
Market Positions of Major Companies
Appendix F - Probable Strategic Moves by Competitors
24 of 29 Last Modified 1162012 1014 PM
Probable Strategic Moves by Competitors
This section attempts to predict strategic moves by the various major players in this industry
These predictions are a mixture of new items financial analysis and conjecture The following
tables derived from company financial statements provide the basis of the financial analysis
Dell
In terms of market share Dell is the largest player in this analysis Yet like the other players
(except Apple) the three-year trend in ROA is downward When coupled with dells lack-luster
revenue growth 113 below the industry average Dell is likely to diversify into related
opportunities that may offer a higher margin than hardware This would be consistent with
IBMrsquos exit from the market to focus services such as consulting With this in mind the following
excerpt from a Dell press release should come as no surprise
ROUND ROCK and PLANO Texas Sept 21 2009 mdash Dell and Perot Systems have
entered a definitive agreement for Dell to acquire Perot Systems in a transaction valued at
approximately $39 billion Terms of the agreement were approved yesterday by the
boards of directors of both companies
Manufacturer
Market Share
(Derrived
from Mintel)
Average
Gross Margin
Average
Operating
Margin
Average Net
Margin Average ROA
Average
Current Ratio
Average
Quick Ratio
Consumer
Reports
Customer
Service
Rating
Dell 38 821 54 45 100 118 085 56
HP 26 758 81 69 77 118 077 47
Acer (Gateway) 14 105 21 26 52 135 111 54
Apple 5 676 168 132 125 235 194 81
Lenovo 2 865 10 09 20 095 068 66
Other 15
Correlation to Market Share 014 -010 -008 034 -033 -039 -066
Dell 2006 2007 2008 Average 3-year Slope
Financial Ratios
Revenue 57420 61133 61101 59885 316
Gross Margin (Higher is Better) 834 809 821 821 -07
Operating Margin (Higher is Better) 53 56 52 54 -01
Net Margin (Higher is Better) 45 48 41 45 -02
ROA (Higher is Better) 101 107 94 100 -04
Current Ratio (Higher is Better) 112 107 136 118 012
Quick Ratio (Higher is Better) 090 078 087 085 -002
Appendix F - Probable Strategic Moves by Competitors
25 of 29 Last Modified 1162012 1014 PM
The acquisition will result in a compelling combination of two iconic information-
technology brands The expanded Dell will be even better positioned for immediate and
long-term growth and efficiency driven by
Providing a broader range of IT services and solutions and optimizing how theyrsquore
delivered
Extending the reach of Perot Systemsrsquo capabilities including in the most dynamic
customer segments around the world and
Supplying leading Dell computer systems to even more Perot Systems customers6
At some point Dell will probably outsource its PC manufacturing to China
Hewlett-Packard
Like Dell Hewlett-Packard has also diversified into consulting and IT outsourcing In the 2008
annual report the CEO Mark V Hurd writes of the recent (August 2008) acquisition of EDS
The EDS AcquisitionmdashDisciplined Execution of a Multi-year Strategy In August HP
completed its acquisition of EDS a global technology services outsourcing and
consulting leader for a purchase price of $13 billion The EDS integration is at or ahead
of the operational plans we announced in September and customer response to the
acquisition remains very positive (Hewlett-Packard 2008)
In terms of strategic moves HP seems likely to simply focus on expanding market share in the
consulting industry It would not be surprising if at some point HP outsources its PC
manufacturing to China
6 httpcontentdellcomusencorpdsecure2009-09-21-Perot-Systemsaspx accessed 9302009 845 PM
HP 2006 2007 2008 Average 3-year Slope
Financial Ratios
Revenue 91658 104286 118364 104769 1364
Gross Margin (Higher is Better) 757 756 760 758 01
Operating Margin (Higher is Better) 72 84 88 81 08
Net Margin (Higher is Better) 68 70 70 69 01
ROA (Higher is Better) 76 82 73 77 -01
Current Ratio (Higher is Better) 135 121 098 118 -018
Quick Ratio (Higher is Better) 092 078 059 077 -017
Appendix F - Probable Strategic Moves by Competitors
26 of 29 Last Modified 1162012 1014 PM
It is entertaining to note that EDS (Electronic Data Systems Corp) was founded in 1962 by Ross
Perot formerly of IBM As noted above Dell recently purchased Perot systems founded in 1988
by Ross Perot formerly of IBM
Acer Group
While Acer has growing revenues and a significant 14 market share there are almost no
positive aspects to its financial ratios There could be two options at play here
Acer may be operating as a loss leader in order to grow market share
Acer may be poorly managed and simple a bad company This seems unlikely with their
high quick ratio indicating a strong cash position
Between the two I would suspect the former It would also not be a surprise to see Acer acquire
Lenovo
Apple
Acer 2006 2007 2008 Average 3-year Slope
Financial Ratios HK$US
Revenue (HK$) 44976 59239 70035 58084 2479 78
Gross Margin (Higher is Better) 109 103 105 105 -02
Operating Margin (Higher is Better) 18 22 22 21 02
Net Margin (Higher is Better) 29 28 21 26 -04
ROA (Higher is Better) 54 53 48 52 -03
Current Ratio (Higher is Better) 147 134 125 135 -004
Quick Ratio (Higher is Better) 123 110 098 111 -004
Apple 2006 2007 2008 Average 3-year Slope
Financial Ratios
Revenue 19315 24006 32479 25267 2967
Gross Margin (Higher is Better) 710 660 657 676 -27
Operating Margin (Higher is Better) 127 184 193 168 33
Net Margin (Higher is Better) 103 146 149 132 23
ROA (Higher is Better) 116 138 122 125 03
Current Ratio (Higher is Better) 224 236 246 235 011
Quick Ratio (Higher is Better) 197 200 184 194 -006
Appendix F - Probable Strategic Moves by Competitors
27 of 29 Last Modified 1162012 1014 PM
Apple is going to continue to grow in consumer electronics and telephony Microsoft does not
dominate the operating system environment for mobile devices and Apple has a strong position
in mobile devices and mobile devices are the most likely candidate for the future of computing
platforms These facts would lead one to believe that Apple is well positioned for the future This
is also supported by the fact that of all of the companies in this analysis Apple is the only one
that is above industry averages in every financial ratio considered by this analysis They also top
the list in consumer service
Watch for Apple to continue doing what it has been doing
Lenovo
Between the two Chinese manufacturers Lenovo has the highest gross margin and the lowest
operating margin With these inefficiencies low liquidity ratios and the lowest ROA of any of
the companies examined here it seems likely that Acer will acquire Lenovo
Lenovo 2006 2007 2008 Average 3-year Slope
Financial Ratios
Revenue 14590 16352 14901 15281 106
Gross Margin (Higher is Better) 860 850 883 865 11
Operating Margin (Higher is Better) 13 31 -14 10 -14
Net Margin (Higher is Better) 11 30 -15 09 -13
ROA (Higher is Better) 30 67 -36 20 -33
Current Ratio (Higher is Better) 087 105 092 095 003
Quick Ratio (Higher is Better) 063 076 067 068 002
Appendix G - Key Success Factors
28 of 29 Last Modified 1162012 1014 PM
Key Success Factors
There are certain activities and attributes that a company must engage in and attain in order to be
successful in this industry According to IBISWorld the key success factors in this industry
include
Establishing brand names
Production of goods currently favored by the market
Economies of scale
Ensuring pricing policy is appropriate
Establishing brand names and associated reputations for quality are critical for success Brands
that have a reputation for low quality incompatibility and other negative aspects tend to
disappear from the market fairly quickly
The second two factors Economies of Scale and appropriate pricing policy are interrelated and
synergistic This means that large firms with significant economies of scale are also able to
reduce costs and by extension prices while maintaining an acceptable margin
The other KSFs cited by IBISWorld include supplier relations distribution systems and
innovation These factors are also important but perhaps not actually lsquokeyrsquo and are thus noted in
the five-forces analysis but not analyzed in any depth here
It is interesting to note that the key success factors are also responsible for the commoditization
that caused IBM to exit the market This observation bears significantly in the five-forces
analysis above
29 of 29 Last Modified 1162012 1014 PM
Works Cited
EDN PC Market to Slump 6 in 2009 EDN Aug 6 2009 54
Gubbins Ed When TVs and PCs collide Telephony Jan 3 2008 2-3
Hewlett-Packard HewlettPackard_2008_ARpdf Hewlett Packard 12 18 2008
httpmediacorporate-irnetmedia_filesirol7171087HewlettPackard_2008_ARpdf (accessed
9 30 2009)
Hoovers Computer Manufactur Industry Hoovers Online
httpwwwlibraryohiouedu2862subscribeindfrprofilebasicxhtmlID=212 (accessed 9 30
2009)
IBISWorld 33411 - Computer amp Peripheral Manufacturing in the US - Industry Report Santa
Monica IBISWorld 7 28 2009
Mallinson Keith Disruptive Innovation WirelessWeek September 2008 1431
Microsoft Explore the features Windows Media Center Microsoft 9 29 2009
httpwwwmicrosoftcomwindowswindows-vistafeaturesmedia-centeraspx (accessed 9 29
2009)
Mintel Oxygen Consumer Electronics Holiday Shopping - US - September 2009 Mintel
Oxygen 9 2009
httpwwwlibraryohiouedu2718sinatraoxygen_academicsearch_resultsdisplayid=297980amp
list=wh_itemsdisplayid=474804displayid=481151select_section=474804 (accessed 9 29
2009)
mdash Home Personal Computers - US - December 2008 Mintel Oxygen 12 2008
httpwwwlibraryohiouedu2718sinatraoxygen_academicsearch_resultsdisplayid=297980d
isplayid=434041hit1 (accessed 9 29 2009)
mdash Market Re-forecasts Technology - US - April 2009 Mintel Oxygen 4 2009
httpwwwlibraryohiouedu2718sinatraoxygen_academicsearch_resultsshowampamptype=RCIte
mampsort=relevantampaccess=accessibleamparchive=hideampsource=non_snapshotamplist=search_results
displayid=297980displayid=440938displayid=441066 (accessed Sept 29 2009)
National Bureau of Economic Research Business Cycle Dating Committee December 11 2008
httpwwwnberorgdec2008pdf (accessed September 29 2009)
mdash Business Cycle Expansions and Contractions 12 1 2008
httpwwwdevnberorgcyclescyclesmainhtml (accessed 9 29 2009)
mdash Economic Report for the President 1 2009 httpwwwnberorgerp2009_erppdf (accessed
9 29 2009)
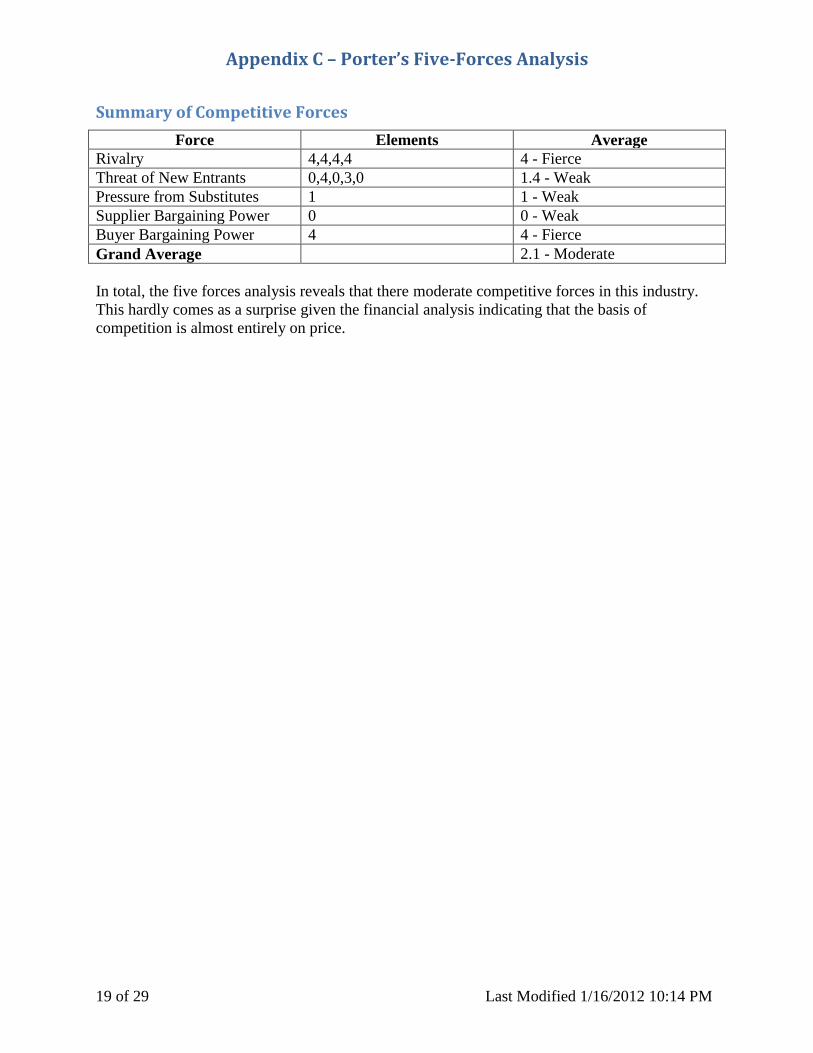
Appendix C ndash Porterrsquos Five-Forces Analysis
19 of 29 Last Modified 1162012 1014 PM
Summary of Competitive Forces
Force Elements Average
Rivalry 4444 4 - Fierce
Threat of New Entrants 04030 14 - Weak
Pressure from Substitutes 1 1 - Weak
Supplier Bargaining Power 0 0 - Weak
Buyer Bargaining Power 4 4 - Fierce
Grand Average 21 - Moderate
In total the five forces analysis reveals that there moderate competitive forces in this industry
This hardly comes as a surprise given the financial analysis indicating that the basis of
competition is almost entirely on price
Appendix D - Forces Driving Change
20 of 29 Last Modified 1162012 1014 PM
Forces Driving Change
There are a variety of forces driving change in this industry Some of these factors are from
within the industry itself while others originate within competing product categories
Smart Phones - The rapid pace of change in smart phones emphasized to consumers by
massive ad spending provides cross-category competition from sleek new devices that
surf the internet Mintel expects computing speed and screen size to continue to rise in
smart phones with cell phone costs often subsidized by carriers consumers eyeing
budgetary constraints may prefer to upgrade the phone and leave the PC be (Mintel
Oxygen 2009)
This is perhaps the most significant long-term force in the industry Keith Mallinson of
Wireless Week makes a strong case
Mobiles will become the primary and most pervasively used or only computing
devices for most of the worldrsquos population Much of that population hasnrsquot had a
phone for long More have not yet used or rarely used a computer or Internet
connection (Mallinson 2008)
Cloud Computing - Cloud computing is clearly gaining ground among consumers even if
the term itself is relatively unknown Most e-mail software exits in the cloud Further
developments in cloud computing are likely to ensure that processor speed and RAM will
not continue to be the driving force for sales in the future that they have been in the past
(Mintel Oxygen 2009)
Internet Sales - Computer manufacturers have become more dependent on Internet sales
over the last decade Many companies sell directly to consumers through their own Web
sites or through retailers (Hoovers nd)
Appendix E - Market Positions of Competitors
21 of 29 Last Modified 1162012 1014 PM
Market Positions of Competitors
The Personal Computer manufacturing market is highly commoditized with little differentiation
in product capabilities This leads to competition on other factors With respect to home
computers customer service seems a reasonable measure However research indicates a
negative correlation between customer service (as rated by consumer reports) and market
share The following scatter chart shows the lack of relationship between market share and
customer service
Also there does not seem to be a strong relationship between market share and any standard
profitability or performance ratio The following table demonstrates this conundrum
Note the red-highlighted items indicate a measure below the industry average
The strongest positive correlation to market share is average return on assets but there is no
theoretical financial model that would explain why companies with a higher ROA would also
Dell
HP
Acer (Gateway)
AppleLenovo
0
5
10
15
20
25
30
35
40
0 10 20 30 40 50 60 70 80 90
Mar
ket
Shar
e (
De
rriv
ed
fro
m M
inte
l)
Consumer Reports Customer Service Rating
Market Share v Customer Service
Industry Averages 2006 2007 2008 Average 3-year Slope
Financial Ratios
Revenue 1446
Gross Margin (Higher is Better) 654 636 645 645 -05
Operating Margin (Higher is Better) 57 75 68 67 06
Net Margin (Higher is Better) 51 64 53 56 01
ROA (Higher is Better) 75 89 60 75 -07
Current Ratio (Higher is Better) 141 141 139 140 -001
Quick Ratio (Higher is Better) 113 109 099 107 -007
Manufacturer
Market Share
(Derrived
from Mintel)
Average
Gross Margin
Average
Operating
Margin
Average Net
Margin Average ROA
Average
Current Ratio
Average
Quick Ratio
Consumer
Reports
Customer
Service
Rating
Dell 38 821 54 45 100 118 085 56
HP 26 758 81 69 77 118 077 47
Acer (Gateway) 14 105 21 26 52 135 111 54
Apple 5 676 168 132 125 235 194 81
Lenovo 2 865 10 09 20 095 068 66
Other 15
Correlation to Market Share 014 -010 -008 034 -033 -039 -066
Appendix E - Market Positions of Competitors
22 of 29 Last Modified 1162012 1014 PM
have greater market share One might speculate that the higher ROA implies lower capital
intensity and may free-up cash for advertising and sales promotion
An exhaustive correlation analysis shows the following characteristics of the industry
There are strong correlations between the margins but this is to be expected The strangest
correlation is between the customer service rating and the liquidity ratios
Speculation leads to the following question Since Apple is NOT subject to the same rules as the
commoditized PC makers it may sell its hardware at a premium if people want the operating
system perhaps Apple should be removed from the analysis
The following table shows the correlations between the various factors without including apple
in the data set
Now we see a strong positive correlation (100) between average ROA and market share ROA is
calculated as Net Income divided by total assets and is a measure of how efficiently a company
is using its assets High efficiency implies low operating costs This is further supported by the
low correlation to average gross margin (everyone is buying the same inputs) and the high
correlation to average operating margin as the operations of the companies with the highest
market share are also the most efficient All of this implies that the PC market with the
exception of Applersquos niche is driven primarily by price and other factors such as customer
service are secondary
Market Share and ROA
The following strategic group map shows the relationship between ROA and market share
CorrelationMarket Share
Average
Gross Margin
Average
Operating
Margin
Average Net
Margin Average ROA
Average
Current Ratio
Average
Quick Ratio
Customer
Service
Rating
Market Share 014 -010 -008 034 -033 -039 -066
Average Gross Margin 019 013 013 -016 -024 019
Average Operating Margin 100 087 089 083 058
Average Net Margin 087 090 083 054
Average ROA 075 069 034
Average Current Ratio 099 074
Average Quick Ratio 076
Customer Service Rating
Correlation
(wo Apple) Market Share
Average
Gross Margin
Average
Operating
Margin
Average Net
Margin Average ROA
Average
Current Ratio
Average
Quick Ratio
Customer
Service
Rating
Market Share 019 077 075 100 042 012 -061
Average Gross Margin 031 016 013 -081 -094 027
Average Operating Margin 099 078 023 -019 -083
Average Net Margin 077 037 -005 -090
Average ROA 047 017 -066
Average Current Ratio 091 -068
Average Quick Ratio -033
Customer Service Rating
Appendix E - Market Positions of Competitors
23 of 29 Last Modified 1162012 1014 PM
The strong correlation between efficiency and market share implies a market with paper-thin
margins and this is supported by the financial ratios of both the industry and the individual
players shown earlier This is further supported by the following strategic group map
ROA and Customer Support
From the above group map clearly shows that ROA is a primary driver of market size (bubble
size) while the larger players hover around mediocre customer service ratings This means that
there is no financial incentive to differentiate one brand from another by offering better customer
support
Dell
HP
Acer (Gateway)
Apple
Lenovo
00
20
40
60
80
100
120
140
160
0 5 10 15 20 25 30 35 40 45 50
Ave
rage
RO
A
Market Share
Market Positions of Major Companies
Dell
HP
Acer (Gateway)
Apple
Lenovo
00
20
40
60
80
100
120
140
160
0 10 20 30 40 50 60 70 80 90 100
Ave
rage
RO
A
Consumer Reports Customer Service Rating
Market Positions of Major Companies
Appendix F - Probable Strategic Moves by Competitors
24 of 29 Last Modified 1162012 1014 PM
Probable Strategic Moves by Competitors
This section attempts to predict strategic moves by the various major players in this industry
These predictions are a mixture of new items financial analysis and conjecture The following
tables derived from company financial statements provide the basis of the financial analysis
Dell
In terms of market share Dell is the largest player in this analysis Yet like the other players
(except Apple) the three-year trend in ROA is downward When coupled with dells lack-luster
revenue growth 113 below the industry average Dell is likely to diversify into related
opportunities that may offer a higher margin than hardware This would be consistent with
IBMrsquos exit from the market to focus services such as consulting With this in mind the following
excerpt from a Dell press release should come as no surprise
ROUND ROCK and PLANO Texas Sept 21 2009 mdash Dell and Perot Systems have
entered a definitive agreement for Dell to acquire Perot Systems in a transaction valued at
approximately $39 billion Terms of the agreement were approved yesterday by the
boards of directors of both companies
Manufacturer
Market Share
(Derrived
from Mintel)
Average
Gross Margin
Average
Operating
Margin
Average Net
Margin Average ROA
Average
Current Ratio
Average
Quick Ratio
Consumer
Reports
Customer
Service
Rating
Dell 38 821 54 45 100 118 085 56
HP 26 758 81 69 77 118 077 47
Acer (Gateway) 14 105 21 26 52 135 111 54
Apple 5 676 168 132 125 235 194 81
Lenovo 2 865 10 09 20 095 068 66
Other 15
Correlation to Market Share 014 -010 -008 034 -033 -039 -066
Dell 2006 2007 2008 Average 3-year Slope
Financial Ratios
Revenue 57420 61133 61101 59885 316
Gross Margin (Higher is Better) 834 809 821 821 -07
Operating Margin (Higher is Better) 53 56 52 54 -01
Net Margin (Higher is Better) 45 48 41 45 -02
ROA (Higher is Better) 101 107 94 100 -04
Current Ratio (Higher is Better) 112 107 136 118 012
Quick Ratio (Higher is Better) 090 078 087 085 -002
Appendix F - Probable Strategic Moves by Competitors
25 of 29 Last Modified 1162012 1014 PM
The acquisition will result in a compelling combination of two iconic information-
technology brands The expanded Dell will be even better positioned for immediate and
long-term growth and efficiency driven by
Providing a broader range of IT services and solutions and optimizing how theyrsquore
delivered
Extending the reach of Perot Systemsrsquo capabilities including in the most dynamic
customer segments around the world and
Supplying leading Dell computer systems to even more Perot Systems customers6
At some point Dell will probably outsource its PC manufacturing to China
Hewlett-Packard
Like Dell Hewlett-Packard has also diversified into consulting and IT outsourcing In the 2008
annual report the CEO Mark V Hurd writes of the recent (August 2008) acquisition of EDS
The EDS AcquisitionmdashDisciplined Execution of a Multi-year Strategy In August HP
completed its acquisition of EDS a global technology services outsourcing and
consulting leader for a purchase price of $13 billion The EDS integration is at or ahead
of the operational plans we announced in September and customer response to the
acquisition remains very positive (Hewlett-Packard 2008)
In terms of strategic moves HP seems likely to simply focus on expanding market share in the
consulting industry It would not be surprising if at some point HP outsources its PC
manufacturing to China
6 httpcontentdellcomusencorpdsecure2009-09-21-Perot-Systemsaspx accessed 9302009 845 PM
HP 2006 2007 2008 Average 3-year Slope
Financial Ratios
Revenue 91658 104286 118364 104769 1364
Gross Margin (Higher is Better) 757 756 760 758 01
Operating Margin (Higher is Better) 72 84 88 81 08
Net Margin (Higher is Better) 68 70 70 69 01
ROA (Higher is Better) 76 82 73 77 -01
Current Ratio (Higher is Better) 135 121 098 118 -018
Quick Ratio (Higher is Better) 092 078 059 077 -017
Appendix F - Probable Strategic Moves by Competitors
26 of 29 Last Modified 1162012 1014 PM
It is entertaining to note that EDS (Electronic Data Systems Corp) was founded in 1962 by Ross
Perot formerly of IBM As noted above Dell recently purchased Perot systems founded in 1988
by Ross Perot formerly of IBM
Acer Group
While Acer has growing revenues and a significant 14 market share there are almost no
positive aspects to its financial ratios There could be two options at play here
Acer may be operating as a loss leader in order to grow market share
Acer may be poorly managed and simple a bad company This seems unlikely with their
high quick ratio indicating a strong cash position
Between the two I would suspect the former It would also not be a surprise to see Acer acquire
Lenovo
Apple
Acer 2006 2007 2008 Average 3-year Slope
Financial Ratios HK$US
Revenue (HK$) 44976 59239 70035 58084 2479 78
Gross Margin (Higher is Better) 109 103 105 105 -02
Operating Margin (Higher is Better) 18 22 22 21 02
Net Margin (Higher is Better) 29 28 21 26 -04
ROA (Higher is Better) 54 53 48 52 -03
Current Ratio (Higher is Better) 147 134 125 135 -004
Quick Ratio (Higher is Better) 123 110 098 111 -004
Apple 2006 2007 2008 Average 3-year Slope
Financial Ratios
Revenue 19315 24006 32479 25267 2967
Gross Margin (Higher is Better) 710 660 657 676 -27
Operating Margin (Higher is Better) 127 184 193 168 33
Net Margin (Higher is Better) 103 146 149 132 23
ROA (Higher is Better) 116 138 122 125 03
Current Ratio (Higher is Better) 224 236 246 235 011
Quick Ratio (Higher is Better) 197 200 184 194 -006
Appendix F - Probable Strategic Moves by Competitors
27 of 29 Last Modified 1162012 1014 PM
Apple is going to continue to grow in consumer electronics and telephony Microsoft does not
dominate the operating system environment for mobile devices and Apple has a strong position
in mobile devices and mobile devices are the most likely candidate for the future of computing
platforms These facts would lead one to believe that Apple is well positioned for the future This
is also supported by the fact that of all of the companies in this analysis Apple is the only one
that is above industry averages in every financial ratio considered by this analysis They also top
the list in consumer service
Watch for Apple to continue doing what it has been doing
Lenovo
Between the two Chinese manufacturers Lenovo has the highest gross margin and the lowest
operating margin With these inefficiencies low liquidity ratios and the lowest ROA of any of
the companies examined here it seems likely that Acer will acquire Lenovo
Lenovo 2006 2007 2008 Average 3-year Slope
Financial Ratios
Revenue 14590 16352 14901 15281 106
Gross Margin (Higher is Better) 860 850 883 865 11
Operating Margin (Higher is Better) 13 31 -14 10 -14
Net Margin (Higher is Better) 11 30 -15 09 -13
ROA (Higher is Better) 30 67 -36 20 -33
Current Ratio (Higher is Better) 087 105 092 095 003
Quick Ratio (Higher is Better) 063 076 067 068 002
Appendix G - Key Success Factors
28 of 29 Last Modified 1162012 1014 PM
Key Success Factors
There are certain activities and attributes that a company must engage in and attain in order to be
successful in this industry According to IBISWorld the key success factors in this industry
include
Establishing brand names
Production of goods currently favored by the market
Economies of scale
Ensuring pricing policy is appropriate
Establishing brand names and associated reputations for quality are critical for success Brands
that have a reputation for low quality incompatibility and other negative aspects tend to
disappear from the market fairly quickly
The second two factors Economies of Scale and appropriate pricing policy are interrelated and
synergistic This means that large firms with significant economies of scale are also able to
reduce costs and by extension prices while maintaining an acceptable margin
The other KSFs cited by IBISWorld include supplier relations distribution systems and
innovation These factors are also important but perhaps not actually lsquokeyrsquo and are thus noted in
the five-forces analysis but not analyzed in any depth here
It is interesting to note that the key success factors are also responsible for the commoditization
that caused IBM to exit the market This observation bears significantly in the five-forces
analysis above
29 of 29 Last Modified 1162012 1014 PM
Works Cited
EDN PC Market to Slump 6 in 2009 EDN Aug 6 2009 54
Gubbins Ed When TVs and PCs collide Telephony Jan 3 2008 2-3
Hewlett-Packard HewlettPackard_2008_ARpdf Hewlett Packard 12 18 2008
httpmediacorporate-irnetmedia_filesirol7171087HewlettPackard_2008_ARpdf (accessed
9 30 2009)
Hoovers Computer Manufactur Industry Hoovers Online
httpwwwlibraryohiouedu2862subscribeindfrprofilebasicxhtmlID=212 (accessed 9 30
2009)
IBISWorld 33411 - Computer amp Peripheral Manufacturing in the US - Industry Report Santa
Monica IBISWorld 7 28 2009
Mallinson Keith Disruptive Innovation WirelessWeek September 2008 1431
Microsoft Explore the features Windows Media Center Microsoft 9 29 2009
httpwwwmicrosoftcomwindowswindows-vistafeaturesmedia-centeraspx (accessed 9 29
2009)
Mintel Oxygen Consumer Electronics Holiday Shopping - US - September 2009 Mintel
Oxygen 9 2009
httpwwwlibraryohiouedu2718sinatraoxygen_academicsearch_resultsdisplayid=297980amp
list=wh_itemsdisplayid=474804displayid=481151select_section=474804 (accessed 9 29
2009)
mdash Home Personal Computers - US - December 2008 Mintel Oxygen 12 2008
httpwwwlibraryohiouedu2718sinatraoxygen_academicsearch_resultsdisplayid=297980d
isplayid=434041hit1 (accessed 9 29 2009)
mdash Market Re-forecasts Technology - US - April 2009 Mintel Oxygen 4 2009
httpwwwlibraryohiouedu2718sinatraoxygen_academicsearch_resultsshowampamptype=RCIte
mampsort=relevantampaccess=accessibleamparchive=hideampsource=non_snapshotamplist=search_results
displayid=297980displayid=440938displayid=441066 (accessed Sept 29 2009)
National Bureau of Economic Research Business Cycle Dating Committee December 11 2008
httpwwwnberorgdec2008pdf (accessed September 29 2009)
mdash Business Cycle Expansions and Contractions 12 1 2008
httpwwwdevnberorgcyclescyclesmainhtml (accessed 9 29 2009)
mdash Economic Report for the President 1 2009 httpwwwnberorgerp2009_erppdf (accessed
9 29 2009)
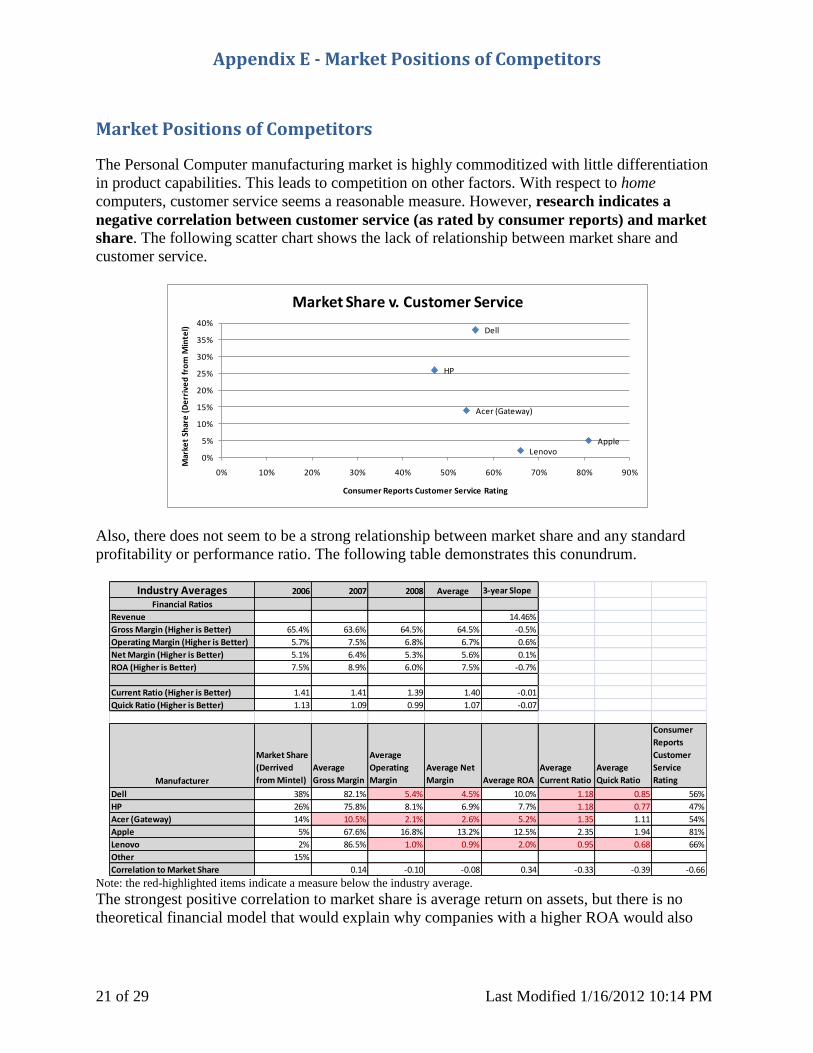
Appendix E - Market Positions of Competitors
21 of 29 Last Modified 1162012 1014 PM
Market Positions of Competitors
The Personal Computer manufacturing market is highly commoditized with little differentiation
in product capabilities This leads to competition on other factors With respect to home
computers customer service seems a reasonable measure However research indicates a
negative correlation between customer service (as rated by consumer reports) and market
share The following scatter chart shows the lack of relationship between market share and
customer service
Also there does not seem to be a strong relationship between market share and any standard
profitability or performance ratio The following table demonstrates this conundrum
Note the red-highlighted items indicate a measure below the industry average
The strongest positive correlation to market share is average return on assets but there is no
theoretical financial model that would explain why companies with a higher ROA would also
Dell
HP
Acer (Gateway)
AppleLenovo
0
5
10
15
20
25
30
35
40
0 10 20 30 40 50 60 70 80 90
Mar
ket
Shar
e (
De
rriv
ed
fro
m M
inte
l)
Consumer Reports Customer Service Rating
Market Share v Customer Service
Industry Averages 2006 2007 2008 Average 3-year Slope
Financial Ratios
Revenue 1446
Gross Margin (Higher is Better) 654 636 645 645 -05
Operating Margin (Higher is Better) 57 75 68 67 06
Net Margin (Higher is Better) 51 64 53 56 01
ROA (Higher is Better) 75 89 60 75 -07
Current Ratio (Higher is Better) 141 141 139 140 -001
Quick Ratio (Higher is Better) 113 109 099 107 -007
Manufacturer
Market Share
(Derrived
from Mintel)
Average
Gross Margin
Average
Operating
Margin
Average Net
Margin Average ROA
Average
Current Ratio
Average
Quick Ratio
Consumer
Reports
Customer
Service
Rating
Dell 38 821 54 45 100 118 085 56
HP 26 758 81 69 77 118 077 47
Acer (Gateway) 14 105 21 26 52 135 111 54
Apple 5 676 168 132 125 235 194 81
Lenovo 2 865 10 09 20 095 068 66
Other 15
Correlation to Market Share 014 -010 -008 034 -033 -039 -066
Appendix E - Market Positions of Competitors
22 of 29 Last Modified 1162012 1014 PM
have greater market share One might speculate that the higher ROA implies lower capital
intensity and may free-up cash for advertising and sales promotion
An exhaustive correlation analysis shows the following characteristics of the industry
There are strong correlations between the margins but this is to be expected The strangest
correlation is between the customer service rating and the liquidity ratios
Speculation leads to the following question Since Apple is NOT subject to the same rules as the
commoditized PC makers it may sell its hardware at a premium if people want the operating
system perhaps Apple should be removed from the analysis
The following table shows the correlations between the various factors without including apple
in the data set
Now we see a strong positive correlation (100) between average ROA and market share ROA is
calculated as Net Income divided by total assets and is a measure of how efficiently a company
is using its assets High efficiency implies low operating costs This is further supported by the
low correlation to average gross margin (everyone is buying the same inputs) and the high
correlation to average operating margin as the operations of the companies with the highest
market share are also the most efficient All of this implies that the PC market with the
exception of Applersquos niche is driven primarily by price and other factors such as customer
service are secondary
Market Share and ROA
The following strategic group map shows the relationship between ROA and market share
CorrelationMarket Share
Average
Gross Margin
Average
Operating
Margin
Average Net
Margin Average ROA
Average
Current Ratio
Average
Quick Ratio
Customer
Service
Rating
Market Share 014 -010 -008 034 -033 -039 -066
Average Gross Margin 019 013 013 -016 -024 019
Average Operating Margin 100 087 089 083 058
Average Net Margin 087 090 083 054
Average ROA 075 069 034
Average Current Ratio 099 074
Average Quick Ratio 076
Customer Service Rating
Correlation
(wo Apple) Market Share
Average
Gross Margin
Average
Operating
Margin
Average Net
Margin Average ROA
Average
Current Ratio
Average
Quick Ratio
Customer
Service
Rating
Market Share 019 077 075 100 042 012 -061
Average Gross Margin 031 016 013 -081 -094 027
Average Operating Margin 099 078 023 -019 -083
Average Net Margin 077 037 -005 -090
Average ROA 047 017 -066
Average Current Ratio 091 -068
Average Quick Ratio -033
Customer Service Rating
Appendix E - Market Positions of Competitors
23 of 29 Last Modified 1162012 1014 PM
The strong correlation between efficiency and market share implies a market with paper-thin
margins and this is supported by the financial ratios of both the industry and the individual
players shown earlier This is further supported by the following strategic group map
ROA and Customer Support
From the above group map clearly shows that ROA is a primary driver of market size (bubble
size) while the larger players hover around mediocre customer service ratings This means that
there is no financial incentive to differentiate one brand from another by offering better customer
support
Dell
HP
Acer (Gateway)
Apple
Lenovo
00
20
40
60
80
100
120
140
160
0 5 10 15 20 25 30 35 40 45 50
Ave
rage
RO
A
Market Share
Market Positions of Major Companies
Dell
HP
Acer (Gateway)
Apple
Lenovo
00
20
40
60
80
100
120
140
160
0 10 20 30 40 50 60 70 80 90 100
Ave
rage
RO
A
Consumer Reports Customer Service Rating
Market Positions of Major Companies
Appendix F - Probable Strategic Moves by Competitors
24 of 29 Last Modified 1162012 1014 PM
Probable Strategic Moves by Competitors
This section attempts to predict strategic moves by the various major players in this industry
These predictions are a mixture of new items financial analysis and conjecture The following
tables derived from company financial statements provide the basis of the financial analysis
Dell
In terms of market share Dell is the largest player in this analysis Yet like the other players
(except Apple) the three-year trend in ROA is downward When coupled with dells lack-luster
revenue growth 113 below the industry average Dell is likely to diversify into related
opportunities that may offer a higher margin than hardware This would be consistent with
IBMrsquos exit from the market to focus services such as consulting With this in mind the following
excerpt from a Dell press release should come as no surprise
ROUND ROCK and PLANO Texas Sept 21 2009 mdash Dell and Perot Systems have
entered a definitive agreement for Dell to acquire Perot Systems in a transaction valued at
approximately $39 billion Terms of the agreement were approved yesterday by the
boards of directors of both companies
Manufacturer
Market Share
(Derrived
from Mintel)
Average
Gross Margin
Average
Operating
Margin
Average Net
Margin Average ROA
Average
Current Ratio
Average
Quick Ratio
Consumer
Reports
Customer
Service
Rating
Dell 38 821 54 45 100 118 085 56
HP 26 758 81 69 77 118 077 47
Acer (Gateway) 14 105 21 26 52 135 111 54
Apple 5 676 168 132 125 235 194 81
Lenovo 2 865 10 09 20 095 068 66
Other 15
Correlation to Market Share 014 -010 -008 034 -033 -039 -066
Dell 2006 2007 2008 Average 3-year Slope
Financial Ratios
Revenue 57420 61133 61101 59885 316
Gross Margin (Higher is Better) 834 809 821 821 -07
Operating Margin (Higher is Better) 53 56 52 54 -01
Net Margin (Higher is Better) 45 48 41 45 -02
ROA (Higher is Better) 101 107 94 100 -04
Current Ratio (Higher is Better) 112 107 136 118 012
Quick Ratio (Higher is Better) 090 078 087 085 -002
Appendix F - Probable Strategic Moves by Competitors
25 of 29 Last Modified 1162012 1014 PM
The acquisition will result in a compelling combination of two iconic information-
technology brands The expanded Dell will be even better positioned for immediate and
long-term growth and efficiency driven by
Providing a broader range of IT services and solutions and optimizing how theyrsquore
delivered
Extending the reach of Perot Systemsrsquo capabilities including in the most dynamic
customer segments around the world and
Supplying leading Dell computer systems to even more Perot Systems customers6
At some point Dell will probably outsource its PC manufacturing to China
Hewlett-Packard
Like Dell Hewlett-Packard has also diversified into consulting and IT outsourcing In the 2008
annual report the CEO Mark V Hurd writes of the recent (August 2008) acquisition of EDS
The EDS AcquisitionmdashDisciplined Execution of a Multi-year Strategy In August HP
completed its acquisition of EDS a global technology services outsourcing and
consulting leader for a purchase price of $13 billion The EDS integration is at or ahead
of the operational plans we announced in September and customer response to the
acquisition remains very positive (Hewlett-Packard 2008)
In terms of strategic moves HP seems likely to simply focus on expanding market share in the
consulting industry It would not be surprising if at some point HP outsources its PC
manufacturing to China
6 httpcontentdellcomusencorpdsecure2009-09-21-Perot-Systemsaspx accessed 9302009 845 PM
HP 2006 2007 2008 Average 3-year Slope
Financial Ratios
Revenue 91658 104286 118364 104769 1364
Gross Margin (Higher is Better) 757 756 760 758 01
Operating Margin (Higher is Better) 72 84 88 81 08
Net Margin (Higher is Better) 68 70 70 69 01
ROA (Higher is Better) 76 82 73 77 -01
Current Ratio (Higher is Better) 135 121 098 118 -018
Quick Ratio (Higher is Better) 092 078 059 077 -017
Appendix F - Probable Strategic Moves by Competitors
26 of 29 Last Modified 1162012 1014 PM
It is entertaining to note that EDS (Electronic Data Systems Corp) was founded in 1962 by Ross
Perot formerly of IBM As noted above Dell recently purchased Perot systems founded in 1988
by Ross Perot formerly of IBM
Acer Group
While Acer has growing revenues and a significant 14 market share there are almost no
positive aspects to its financial ratios There could be two options at play here
Acer may be operating as a loss leader in order to grow market share
Acer may be poorly managed and simple a bad company This seems unlikely with their
high quick ratio indicating a strong cash position
Between the two I would suspect the former It would also not be a surprise to see Acer acquire
Lenovo
Apple
Acer 2006 2007 2008 Average 3-year Slope
Financial Ratios HK$US
Revenue (HK$) 44976 59239 70035 58084 2479 78
Gross Margin (Higher is Better) 109 103 105 105 -02
Operating Margin (Higher is Better) 18 22 22 21 02
Net Margin (Higher is Better) 29 28 21 26 -04
ROA (Higher is Better) 54 53 48 52 -03
Current Ratio (Higher is Better) 147 134 125 135 -004
Quick Ratio (Higher is Better) 123 110 098 111 -004
Apple 2006 2007 2008 Average 3-year Slope
Financial Ratios
Revenue 19315 24006 32479 25267 2967
Gross Margin (Higher is Better) 710 660 657 676 -27
Operating Margin (Higher is Better) 127 184 193 168 33
Net Margin (Higher is Better) 103 146 149 132 23
ROA (Higher is Better) 116 138 122 125 03
Current Ratio (Higher is Better) 224 236 246 235 011
Quick Ratio (Higher is Better) 197 200 184 194 -006
Appendix F - Probable Strategic Moves by Competitors
27 of 29 Last Modified 1162012 1014 PM
Apple is going to continue to grow in consumer electronics and telephony Microsoft does not
dominate the operating system environment for mobile devices and Apple has a strong position
in mobile devices and mobile devices are the most likely candidate for the future of computing
platforms These facts would lead one to believe that Apple is well positioned for the future This
is also supported by the fact that of all of the companies in this analysis Apple is the only one
that is above industry averages in every financial ratio considered by this analysis They also top
the list in consumer service
Watch for Apple to continue doing what it has been doing
Lenovo
Between the two Chinese manufacturers Lenovo has the highest gross margin and the lowest
operating margin With these inefficiencies low liquidity ratios and the lowest ROA of any of
the companies examined here it seems likely that Acer will acquire Lenovo
Lenovo 2006 2007 2008 Average 3-year Slope
Financial Ratios
Revenue 14590 16352 14901 15281 106
Gross Margin (Higher is Better) 860 850 883 865 11
Operating Margin (Higher is Better) 13 31 -14 10 -14
Net Margin (Higher is Better) 11 30 -15 09 -13
ROA (Higher is Better) 30 67 -36 20 -33
Current Ratio (Higher is Better) 087 105 092 095 003
Quick Ratio (Higher is Better) 063 076 067 068 002
Appendix G - Key Success Factors
28 of 29 Last Modified 1162012 1014 PM
Key Success Factors
There are certain activities and attributes that a company must engage in and attain in order to be
successful in this industry According to IBISWorld the key success factors in this industry
include
Establishing brand names
Production of goods currently favored by the market
Economies of scale
Ensuring pricing policy is appropriate
Establishing brand names and associated reputations for quality are critical for success Brands
that have a reputation for low quality incompatibility and other negative aspects tend to
disappear from the market fairly quickly
The second two factors Economies of Scale and appropriate pricing policy are interrelated and
synergistic This means that large firms with significant economies of scale are also able to
reduce costs and by extension prices while maintaining an acceptable margin
The other KSFs cited by IBISWorld include supplier relations distribution systems and
innovation These factors are also important but perhaps not actually lsquokeyrsquo and are thus noted in
the five-forces analysis but not analyzed in any depth here
It is interesting to note that the key success factors are also responsible for the commoditization
that caused IBM to exit the market This observation bears significantly in the five-forces
analysis above
29 of 29 Last Modified 1162012 1014 PM
Works Cited
EDN PC Market to Slump 6 in 2009 EDN Aug 6 2009 54
Gubbins Ed When TVs and PCs collide Telephony Jan 3 2008 2-3
Hewlett-Packard HewlettPackard_2008_ARpdf Hewlett Packard 12 18 2008
httpmediacorporate-irnetmedia_filesirol7171087HewlettPackard_2008_ARpdf (accessed
9 30 2009)
Hoovers Computer Manufactur Industry Hoovers Online
httpwwwlibraryohiouedu2862subscribeindfrprofilebasicxhtmlID=212 (accessed 9 30
2009)
IBISWorld 33411 - Computer amp Peripheral Manufacturing in the US - Industry Report Santa
Monica IBISWorld 7 28 2009
Mallinson Keith Disruptive Innovation WirelessWeek September 2008 1431
Microsoft Explore the features Windows Media Center Microsoft 9 29 2009
httpwwwmicrosoftcomwindowswindows-vistafeaturesmedia-centeraspx (accessed 9 29
2009)
Mintel Oxygen Consumer Electronics Holiday Shopping - US - September 2009 Mintel
Oxygen 9 2009
httpwwwlibraryohiouedu2718sinatraoxygen_academicsearch_resultsdisplayid=297980amp
list=wh_itemsdisplayid=474804displayid=481151select_section=474804 (accessed 9 29
2009)
mdash Home Personal Computers - US - December 2008 Mintel Oxygen 12 2008
httpwwwlibraryohiouedu2718sinatraoxygen_academicsearch_resultsdisplayid=297980d
isplayid=434041hit1 (accessed 9 29 2009)
mdash Market Re-forecasts Technology - US - April 2009 Mintel Oxygen 4 2009
httpwwwlibraryohiouedu2718sinatraoxygen_academicsearch_resultsshowampamptype=RCIte
mampsort=relevantampaccess=accessibleamparchive=hideampsource=non_snapshotamplist=search_results
displayid=297980displayid=440938displayid=441066 (accessed Sept 29 2009)
National Bureau of Economic Research Business Cycle Dating Committee December 11 2008
httpwwwnberorgdec2008pdf (accessed September 29 2009)
mdash Business Cycle Expansions and Contractions 12 1 2008
httpwwwdevnberorgcyclescyclesmainhtml (accessed 9 29 2009)
mdash Economic Report for the President 1 2009 httpwwwnberorgerp2009_erppdf (accessed
9 29 2009)
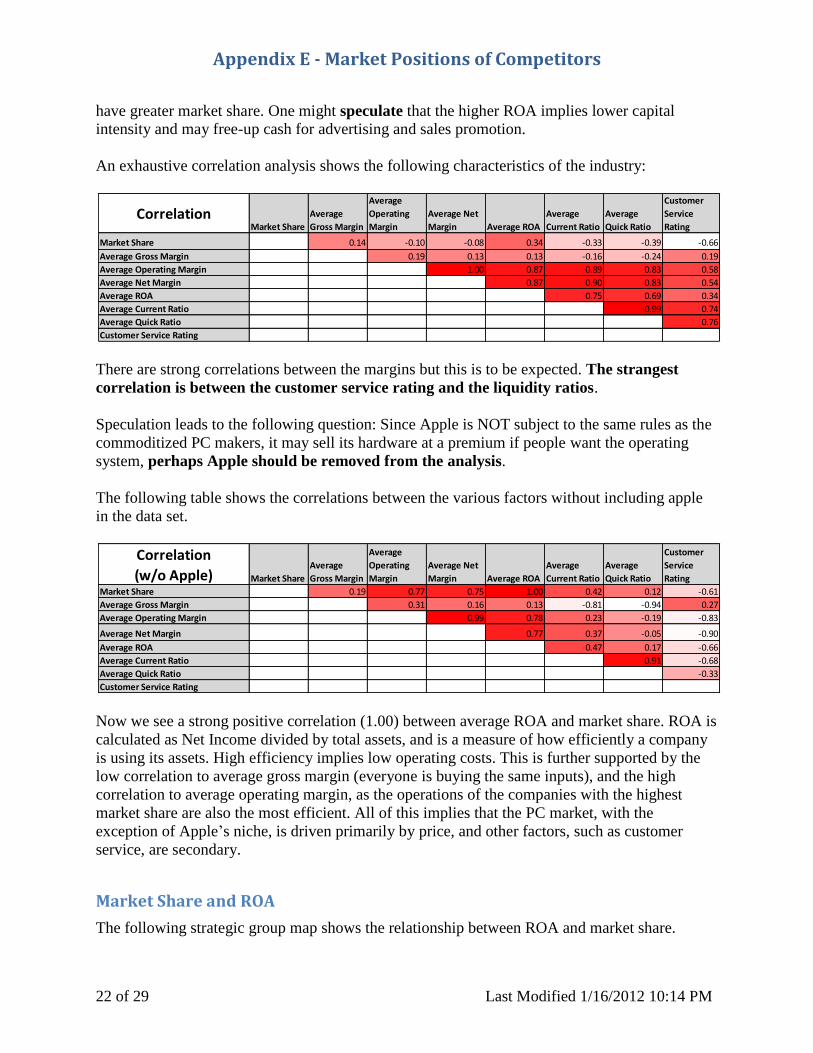
Appendix E - Market Positions of Competitors
23 of 29 Last Modified 1162012 1014 PM
The strong correlation between efficiency and market share implies a market with paper-thin
margins and this is supported by the financial ratios of both the industry and the individual
players shown earlier This is further supported by the following strategic group map
ROA and Customer Support
From the above group map clearly shows that ROA is a primary driver of market size (bubble
size) while the larger players hover around mediocre customer service ratings This means that
there is no financial incentive to differentiate one brand from another by offering better customer
support
Dell
HP
Acer (Gateway)
Apple
Lenovo
00
20
40
60
80
100
120
140
160
0 5 10 15 20 25 30 35 40 45 50
Ave
rage
RO
A
Market Share
Market Positions of Major Companies
Dell
HP
Acer (Gateway)
Apple
Lenovo
00
20
40
60
80
100
120
140
160
0 10 20 30 40 50 60 70 80 90 100
Ave
rage
RO
A
Consumer Reports Customer Service Rating
Market Positions of Major Companies
Appendix F - Probable Strategic Moves by Competitors
24 of 29 Last Modified 1162012 1014 PM
Probable Strategic Moves by Competitors
This section attempts to predict strategic moves by the various major players in this industry
These predictions are a mixture of new items financial analysis and conjecture The following
tables derived from company financial statements provide the basis of the financial analysis
Dell
In terms of market share Dell is the largest player in this analysis Yet like the other players
(except Apple) the three-year trend in ROA is downward When coupled with dells lack-luster
revenue growth 113 below the industry average Dell is likely to diversify into related
opportunities that may offer a higher margin than hardware This would be consistent with
IBMrsquos exit from the market to focus services such as consulting With this in mind the following
excerpt from a Dell press release should come as no surprise
ROUND ROCK and PLANO Texas Sept 21 2009 mdash Dell and Perot Systems have
entered a definitive agreement for Dell to acquire Perot Systems in a transaction valued at
approximately $39 billion Terms of the agreement were approved yesterday by the
boards of directors of both companies
Manufacturer
Market Share
(Derrived
from Mintel)
Average
Gross Margin
Average
Operating
Margin
Average Net
Margin Average ROA
Average
Current Ratio
Average
Quick Ratio
Consumer
Reports
Customer
Service
Rating
Dell 38 821 54 45 100 118 085 56
HP 26 758 81 69 77 118 077 47
Acer (Gateway) 14 105 21 26 52 135 111 54
Apple 5 676 168 132 125 235 194 81
Lenovo 2 865 10 09 20 095 068 66
Other 15
Correlation to Market Share 014 -010 -008 034 -033 -039 -066
Dell 2006 2007 2008 Average 3-year Slope
Financial Ratios
Revenue 57420 61133 61101 59885 316
Gross Margin (Higher is Better) 834 809 821 821 -07
Operating Margin (Higher is Better) 53 56 52 54 -01
Net Margin (Higher is Better) 45 48 41 45 -02
ROA (Higher is Better) 101 107 94 100 -04
Current Ratio (Higher is Better) 112 107 136 118 012
Quick Ratio (Higher is Better) 090 078 087 085 -002
Appendix F - Probable Strategic Moves by Competitors
25 of 29 Last Modified 1162012 1014 PM
The acquisition will result in a compelling combination of two iconic information-
technology brands The expanded Dell will be even better positioned for immediate and
long-term growth and efficiency driven by
Providing a broader range of IT services and solutions and optimizing how theyrsquore
delivered
Extending the reach of Perot Systemsrsquo capabilities including in the most dynamic
customer segments around the world and
Supplying leading Dell computer systems to even more Perot Systems customers6
At some point Dell will probably outsource its PC manufacturing to China
Hewlett-Packard
Like Dell Hewlett-Packard has also diversified into consulting and IT outsourcing In the 2008
annual report the CEO Mark V Hurd writes of the recent (August 2008) acquisition of EDS
The EDS AcquisitionmdashDisciplined Execution of a Multi-year Strategy In August HP
completed its acquisition of EDS a global technology services outsourcing and
consulting leader for a purchase price of $13 billion The EDS integration is at or ahead
of the operational plans we announced in September and customer response to the
acquisition remains very positive (Hewlett-Packard 2008)
In terms of strategic moves HP seems likely to simply focus on expanding market share in the
consulting industry It would not be surprising if at some point HP outsources its PC
manufacturing to China
6 httpcontentdellcomusencorpdsecure2009-09-21-Perot-Systemsaspx accessed 9302009 845 PM
HP 2006 2007 2008 Average 3-year Slope
Financial Ratios
Revenue 91658 104286 118364 104769 1364
Gross Margin (Higher is Better) 757 756 760 758 01
Operating Margin (Higher is Better) 72 84 88 81 08
Net Margin (Higher is Better) 68 70 70 69 01
ROA (Higher is Better) 76 82 73 77 -01
Current Ratio (Higher is Better) 135 121 098 118 -018
Quick Ratio (Higher is Better) 092 078 059 077 -017
Appendix F - Probable Strategic Moves by Competitors
26 of 29 Last Modified 1162012 1014 PM
It is entertaining to note that EDS (Electronic Data Systems Corp) was founded in 1962 by Ross
Perot formerly of IBM As noted above Dell recently purchased Perot systems founded in 1988
by Ross Perot formerly of IBM
Acer Group
While Acer has growing revenues and a significant 14 market share there are almost no
positive aspects to its financial ratios There could be two options at play here
Acer may be operating as a loss leader in order to grow market share
Acer may be poorly managed and simple a bad company This seems unlikely with their
high quick ratio indicating a strong cash position
Between the two I would suspect the former It would also not be a surprise to see Acer acquire
Lenovo
Apple
Acer 2006 2007 2008 Average 3-year Slope
Financial Ratios HK$US
Revenue (HK$) 44976 59239 70035 58084 2479 78
Gross Margin (Higher is Better) 109 103 105 105 -02
Operating Margin (Higher is Better) 18 22 22 21 02
Net Margin (Higher is Better) 29 28 21 26 -04
ROA (Higher is Better) 54 53 48 52 -03
Current Ratio (Higher is Better) 147 134 125 135 -004
Quick Ratio (Higher is Better) 123 110 098 111 -004
Apple 2006 2007 2008 Average 3-year Slope
Financial Ratios
Revenue 19315 24006 32479 25267 2967
Gross Margin (Higher is Better) 710 660 657 676 -27
Operating Margin (Higher is Better) 127 184 193 168 33
Net Margin (Higher is Better) 103 146 149 132 23
ROA (Higher is Better) 116 138 122 125 03
Current Ratio (Higher is Better) 224 236 246 235 011
Quick Ratio (Higher is Better) 197 200 184 194 -006
Appendix F - Probable Strategic Moves by Competitors
27 of 29 Last Modified 1162012 1014 PM
Apple is going to continue to grow in consumer electronics and telephony Microsoft does not
dominate the operating system environment for mobile devices and Apple has a strong position
in mobile devices and mobile devices are the most likely candidate for the future of computing
platforms These facts would lead one to believe that Apple is well positioned for the future This
is also supported by the fact that of all of the companies in this analysis Apple is the only one
that is above industry averages in every financial ratio considered by this analysis They also top
the list in consumer service
Watch for Apple to continue doing what it has been doing
Lenovo
Between the two Chinese manufacturers Lenovo has the highest gross margin and the lowest
operating margin With these inefficiencies low liquidity ratios and the lowest ROA of any of
the companies examined here it seems likely that Acer will acquire Lenovo
Lenovo 2006 2007 2008 Average 3-year Slope
Financial Ratios
Revenue 14590 16352 14901 15281 106
Gross Margin (Higher is Better) 860 850 883 865 11
Operating Margin (Higher is Better) 13 31 -14 10 -14
Net Margin (Higher is Better) 11 30 -15 09 -13
ROA (Higher is Better) 30 67 -36 20 -33
Current Ratio (Higher is Better) 087 105 092 095 003
Quick Ratio (Higher is Better) 063 076 067 068 002
Appendix G - Key Success Factors
28 of 29 Last Modified 1162012 1014 PM
Key Success Factors
There are certain activities and attributes that a company must engage in and attain in order to be
successful in this industry According to IBISWorld the key success factors in this industry
include
Establishing brand names
Production of goods currently favored by the market
Economies of scale
Ensuring pricing policy is appropriate
Establishing brand names and associated reputations for quality are critical for success Brands
that have a reputation for low quality incompatibility and other negative aspects tend to
disappear from the market fairly quickly
The second two factors Economies of Scale and appropriate pricing policy are interrelated and
synergistic This means that large firms with significant economies of scale are also able to
reduce costs and by extension prices while maintaining an acceptable margin
The other KSFs cited by IBISWorld include supplier relations distribution systems and
innovation These factors are also important but perhaps not actually lsquokeyrsquo and are thus noted in
the five-forces analysis but not analyzed in any depth here
It is interesting to note that the key success factors are also responsible for the commoditization
that caused IBM to exit the market This observation bears significantly in the five-forces
analysis above
29 of 29 Last Modified 1162012 1014 PM
Works Cited
EDN PC Market to Slump 6 in 2009 EDN Aug 6 2009 54
Gubbins Ed When TVs and PCs collide Telephony Jan 3 2008 2-3
Hewlett-Packard HewlettPackard_2008_ARpdf Hewlett Packard 12 18 2008
httpmediacorporate-irnetmedia_filesirol7171087HewlettPackard_2008_ARpdf (accessed
9 30 2009)
Hoovers Computer Manufactur Industry Hoovers Online
httpwwwlibraryohiouedu2862subscribeindfrprofilebasicxhtmlID=212 (accessed 9 30
2009)
IBISWorld 33411 - Computer amp Peripheral Manufacturing in the US - Industry Report Santa
Monica IBISWorld 7 28 2009
Mallinson Keith Disruptive Innovation WirelessWeek September 2008 1431
Microsoft Explore the features Windows Media Center Microsoft 9 29 2009
httpwwwmicrosoftcomwindowswindows-vistafeaturesmedia-centeraspx (accessed 9 29
2009)
Mintel Oxygen Consumer Electronics Holiday Shopping - US - September 2009 Mintel
Oxygen 9 2009
httpwwwlibraryohiouedu2718sinatraoxygen_academicsearch_resultsdisplayid=297980amp
list=wh_itemsdisplayid=474804displayid=481151select_section=474804 (accessed 9 29
2009)
mdash Home Personal Computers - US - December 2008 Mintel Oxygen 12 2008
httpwwwlibraryohiouedu2718sinatraoxygen_academicsearch_resultsdisplayid=297980d
isplayid=434041hit1 (accessed 9 29 2009)
mdash Market Re-forecasts Technology - US - April 2009 Mintel Oxygen 4 2009
httpwwwlibraryohiouedu2718sinatraoxygen_academicsearch_resultsshowampamptype=RCIte
mampsort=relevantampaccess=accessibleamparchive=hideampsource=non_snapshotamplist=search_results
displayid=297980displayid=440938displayid=441066 (accessed Sept 29 2009)
National Bureau of Economic Research Business Cycle Dating Committee December 11 2008
httpwwwnberorgdec2008pdf (accessed September 29 2009)
mdash Business Cycle Expansions and Contractions 12 1 2008
httpwwwdevnberorgcyclescyclesmainhtml (accessed 9 29 2009)
mdash Economic Report for the President 1 2009 httpwwwnberorgerp2009_erppdf (accessed
9 29 2009)

Appendix F - Probable Strategic Moves by Competitors
27 of 29 Last Modified 1162012 1014 PM
Apple is going to continue to grow in consumer electronics and telephony Microsoft does not
dominate the operating system environment for mobile devices and Apple has a strong position
in mobile devices and mobile devices are the most likely candidate for the future of computing
platforms These facts would lead one to believe that Apple is well positioned for the future This
is also supported by the fact that of all of the companies in this analysis Apple is the only one
that is above industry averages in every financial ratio considered by this analysis They also top
the list in consumer service
Watch for Apple to continue doing what it has been doing
Lenovo
Between the two Chinese manufacturers Lenovo has the highest gross margin and the lowest
operating margin With these inefficiencies low liquidity ratios and the lowest ROA of any of
the companies examined here it seems likely that Acer will acquire Lenovo
Lenovo 2006 2007 2008 Average 3-year Slope
Financial Ratios
Revenue 14590 16352 14901 15281 106
Gross Margin (Higher is Better) 860 850 883 865 11
Operating Margin (Higher is Better) 13 31 -14 10 -14
Net Margin (Higher is Better) 11 30 -15 09 -13
ROA (Higher is Better) 30 67 -36 20 -33
Current Ratio (Higher is Better) 087 105 092 095 003
Quick Ratio (Higher is Better) 063 076 067 068 002
Appendix G - Key Success Factors
28 of 29 Last Modified 1162012 1014 PM
Key Success Factors
There are certain activities and attributes that a company must engage in and attain in order to be
successful in this industry According to IBISWorld the key success factors in this industry
include
Establishing brand names
Production of goods currently favored by the market
Economies of scale
Ensuring pricing policy is appropriate
Establishing brand names and associated reputations for quality are critical for success Brands
that have a reputation for low quality incompatibility and other negative aspects tend to
disappear from the market fairly quickly
The second two factors Economies of Scale and appropriate pricing policy are interrelated and
synergistic This means that large firms with significant economies of scale are also able to
reduce costs and by extension prices while maintaining an acceptable margin
The other KSFs cited by IBISWorld include supplier relations distribution systems and
innovation These factors are also important but perhaps not actually lsquokeyrsquo and are thus noted in
the five-forces analysis but not analyzed in any depth here
It is interesting to note that the key success factors are also responsible for the commoditization
that caused IBM to exit the market This observation bears significantly in the five-forces
analysis above
29 of 29 Last Modified 1162012 1014 PM
Works Cited
EDN PC Market to Slump 6 in 2009 EDN Aug 6 2009 54
Gubbins Ed When TVs and PCs collide Telephony Jan 3 2008 2-3
Hewlett-Packard HewlettPackard_2008_ARpdf Hewlett Packard 12 18 2008
httpmediacorporate-irnetmedia_filesirol7171087HewlettPackard_2008_ARpdf (accessed
9 30 2009)
Hoovers Computer Manufactur Industry Hoovers Online
httpwwwlibraryohiouedu2862subscribeindfrprofilebasicxhtmlID=212 (accessed 9 30
2009)
IBISWorld 33411 - Computer amp Peripheral Manufacturing in the US - Industry Report Santa
Monica IBISWorld 7 28 2009
Mallinson Keith Disruptive Innovation WirelessWeek September 2008 1431
Microsoft Explore the features Windows Media Center Microsoft 9 29 2009
httpwwwmicrosoftcomwindowswindows-vistafeaturesmedia-centeraspx (accessed 9 29
2009)
Mintel Oxygen Consumer Electronics Holiday Shopping - US - September 2009 Mintel
Oxygen 9 2009
httpwwwlibraryohiouedu2718sinatraoxygen_academicsearch_resultsdisplayid=297980amp
list=wh_itemsdisplayid=474804displayid=481151select_section=474804 (accessed 9 29
2009)
mdash Home Personal Computers - US - December 2008 Mintel Oxygen 12 2008
httpwwwlibraryohiouedu2718sinatraoxygen_academicsearch_resultsdisplayid=297980d
isplayid=434041hit1 (accessed 9 29 2009)
mdash Market Re-forecasts Technology - US - April 2009 Mintel Oxygen 4 2009
httpwwwlibraryohiouedu2718sinatraoxygen_academicsearch_resultsshowampamptype=RCIte
mampsort=relevantampaccess=accessibleamparchive=hideampsource=non_snapshotamplist=search_results
displayid=297980displayid=440938displayid=441066 (accessed Sept 29 2009)
National Bureau of Economic Research Business Cycle Dating Committee December 11 2008
httpwwwnberorgdec2008pdf (accessed September 29 2009)
mdash Business Cycle Expansions and Contractions 12 1 2008
httpwwwdevnberorgcyclescyclesmainhtml (accessed 9 29 2009)
mdash Economic Report for the President 1 2009 httpwwwnberorgerp2009_erppdf (accessed
9 29 2009)