Embed Size (px)
Citation preview
University of St. Thomas, MinnesotaUST Research Online
Social Work Faculty Publications School of Social Work
3-5-2015
Attrition In Psychotherapy: A Survival AnalysisDavid J. [email protected]
Follow this and additional works at: http://ir.stthomas.edu/ssw_pub
Part of the Clinical and Medical Social Work Commons, and the Social Work Commons
This Article is brought to you for free and open access by the School of Social Work at UST Research Online. It has been accepted for inclusion inSocial Work Faculty Publications by an authorized administrator of UST Research Online. For more information, please [email protected].
Recommended CitationRoseborough, David J., "Attrition In Psychotherapy: A Survival Analysis" (2015). Social Work Faculty Publications. 39.http://ir.stthomas.edu/ssw_pub/39
1
Attrition in Outpatient Psychotherapy: A Survival Analysis
Key words: attrition, survival analysis, deterioration, community mental health, drop out,
Outcome Questionnaire (OQ 45.2), longitudinal, premature termination, outpatient
psychotherapy.
David Roseborough, Ph.D.
Jeff McLeod, Ph.D.
Florence Wright, M.S.W. Cand.
Correspondence can be addressed to:
David Roseborough, Ph.D., LICSW
School of Social Work
St. Catherine University and the University of St. Thomas
2115 Summit Avenue
St. Paul, Minnesota 55105-1096

2
Abstract
Attrition is a common problem in outpatient mental health care settings, and can be understood
as situations in which clients end treatment before achieving a clinically significant response.
This archival study used a longitudinal method to look at the nature of attrition in an outpatient
clinic, utilizing data for 3,728 clients, using the OQ 45.2. A Cox regression proportional hazards
model was used in order to better understand who is likely to attrit when considering: (1)
demographic groups, (2) diagnostic categories, and (3) process variables (e.g. overall and recent
symptom change), using hazard ratios. A pattern emerged, with younger clients and those
reporting less education and lower incomes tending to be more likely to end treatment.
Consistent with the large scale STAR*D treatment of depression study, clients with more social
and economic challenges demonstrated more risk. Adults diagnosed with a substance or OCD-
related disorder showed the most elevated risk. Clients who demonstrated overall improvement
and, in particular, a recent status change were more likely to remain. Engagement strategies are
discussed, with the goal of better supporting recovery. Findings suggest that attrition is
something that can be anticipated, identified, and reduced.
3
Introduction
Attrition, defined broadly as ending treatment prior to optimal benefit, continues to be a
significant problem in outpatient psychotherapy. A recent meta-analysis summarizing 669
studies and 83,834 clients pointed to attrition rates ranging from 18% when measured by a
predetermined number of sessions to nearly 40% when measured by clinician report (Swift &
Greenberg, 2012). Authors of the “Sequenced Treatment Alternatives to Relieve Depression,” or
STAR*D Report, a national, federally funded study with 4,041 participants noted this
phenomenon (Warden, et al. 2009) and Corning & Malofeeva (2004) concluded “premature
termination appears to be a relatively frequent occurrence with broad consequences” (p. 354).
The STAR*D study explored this problem particularly in relation to major depression.
Regardless of demographics examined in STAR*D, remission rates for depressed adults were
found to be lower for those who dropped out of treatment prematurely. This was demonstrated
also by Curren, et al. (2002) where major depressive disorder was similarly associated with early
termination from intensive outpatient substance abuse treatment in a Veterans Administration
(VA) program for adult participants. This latter study specifically called for attention to early
identification and management of depression and for more research into better understanding
earlier versus later attrition as perhaps distinct phenomena.
Defining what constitutes attrition has been a challenge as well. However, Allison’s
(2010) survival analysis offers a relevant statistical approach. Corning & Malofeeva (2004)
applied this method to psychotherapy termination, concluding, “Psychotherapy termination is a
longitudinal process and, as such, its data are best represented longitudinally.” (p. 355).

4
The following study sought to weigh in not only on prior, inconclusive findings regarding
demographics that may be important in understanding attrition, but gave explicit attention to the
strength of their relative contributions. It also gave attention to the potential role of process
variables (e.g. recent status changes such as clinically reliable improvement or deterioration,
defined as a clinically significant worsening of symptoms), using a Cox proportional hazards
model of survival analysis. Authors such as Warden, et al. (2009) have spoken to the potential
importance of such process variables, noting that a number of “potentially meaningful predictors,
however, can or do vary over the course of therapy, for example, symptom level, relationship
quality with therapist, medication adherence, ability to pay for sessions, and number of sessions
already attended” (p. 355). This study was able to give attention to the potential role of some of
these variables that may offer benefit to clinicians practicing in outpatient mental health settings.
Similarly, sources such as Harvard University’s Institute for Quantitative Social Science have
pointed to the recent “movement of quantification” across disciplines (Shaw, 2014, p. 30) and to
the importance of statistically and visually mapping larger data sets in this way.
Literature Review
Attrition
Dropping out of treatment, also referred to as “premature discontinuation” (Swift &
Greenberg, 2012, p.547), “premature termination” (Corning & Malofeeva, 2004, p.354) or
attrition, has been identified by current literature as a common occurrence that both introduces a
significant barrier to the delivery of effective psychotherapy (Barrett, Chua, Crits-Christoph,
Gibbons, & Thompson, 2008; Reis & Brown, 1999), and reduces the likelihood of recovery
(Anderson & Lambert, 2001; Warden, et al., 2009). Additionally, it appears that attrition
impacts more than client outcomes (Reis & Brown; Swift & Greenberg, 2012), as drop-out also
5
influences mental health agencies themselves, by way of underutilization (Swift & Greenberg)
and by “wasting limited mental health resources” (Barrett, et al., p.248). Society as a whole is
burdened by attrition as others in need are denied access to treatment (Barrett, et al.; Swift &
Greenberg), and by submitting to the “continued impairment” (Swift & Greenberg, p.547) of its
members.
In one of the earliest and more comprehensive studies surrounding attrition, Baekland &
Lundwall (1975) sought to closely examine the “vexing” (p.738) predicament of attrition among
clients who underwent a broad spectrum of treatments, including inpatient and outpatient therapy
for chronic psychological and medical conditions. The authors estimated that between 20-57% of
all clients across populations and settings discontinued treatment before receiving the benefits of
an effective intervention (Barrett, et al., 2009; Swift & Greenberg, 2012). More recent studies
surrounding premature discontinuation indicate that somewhere between 30-60% of clients
terminate psychotherapy prematurely across settings, populations, and therapeutic modalities
(Corning & Malofeeva, 2004; DuBrin & Zastowny, 1988; Reis & Bown, 1999; Romans, et al.,
2009; Warden, et al., 2009; Wierzbicki & Pekarik, 1993). A recent meta-analysis (2012) revealed
that therapists report 40% of clients discontinue psychotherapy prematurely, with dropout
estimates at 17% in efficacy studies and 26% in effectiveness studies respectively (Swift &
Greenberg, 2012).
Predicting Attrition
Difficulty in predicting who will attrit has been consistently reported in the literature
(Barrett, et al., 2009; DuBrin & Zastowny, 1988; Reis & Brown, 1999). In their 1975 study,
Baekland & Lundwall concluded that the probability of client dropout increased based on both

6
specific client demographics (younger, female, non-white, lower educational attainment, lower
socioeconomic status), and therapist characteristics (less experienced, male, ethnocentric).
However, due to the large scope and “unusually ambitious” (Garfield, 1977, p. 306) nature of
Baekland & Lundwall’s study (which included various populations, settings, practitioners, and
treatment modalities), current research has been critical of the broad and varied conclusions that
ultimately lack replication. Several studies focusing on attrition have built upon the work of
Baekland & Lundwall by focusing on the demographic characteristics of clients related to
premature discontinuation of psychotherapy (e.g. Barett, et al., DuBrin & Zastowny, Swift &
Greenberg, 2012; Wierzbicki & Pekarik, 1993).
Demographic variables such as socioeconomic status, race (cultural background), and
educational attainment have been historically associated with client attrition rates (Buttell, 2012;
Warden, et al., 2009; Wierzbicki & Pekarik, 1993), while other characteristics such as age
(Edlund, Wang, Berglund, Katz, Lin, and Kessler, 2002; Reis & Brown, 1999;
Thormählen,Weinryb, Noren, Vinnars & Bagedahl-Strindlund, 2010), gender (Reis & Brown,
1999), and treatment modality have produced less consistent findings (Garfield, 1977; Barrett, et
al., 2009).
Education. Increased educational attainment is negatively correlated with rates of attrition
as demonstrated in several independent studies. Buttell (2012) sought to identify differences
between participants who completed a mandatory batterer intervention program, and those who
prematurely dropped out. Results indicated that higher levels of education acted as a significant
protective factor, which ultimately predicted program completion. Similarly, using data from 125
independent attrition studies, Wierzbicki & Pekarik (1993) completed two analyses in order to
examine both the relationship between attrition rate and client demographic characteristics, and

7
the effect size of the relationship. Authors found across studies, the mean rate of attrition was
near 50% and that increased attrition risk was associated with lower levels of education as well
as minority and low socioeconomic status, although the effect size was described by the authors
as “only of moderate magnitude” (p.193). Three client demographics yielded a significant effect
size, including client age (with younger clients tending to drop out of therapy more often than
did older clients) marital status (single clients were more likely than their married counterparts to
dropout), and gender (females dropping out of treatment more often than males (Wierzbicki &
Pekarik).
Age Although findings have been mixed, younger adults appear more likely than their
older adults to attrit. Warden, et al. (2009) tracked client progress in an outpatient therapy
program for depression (STAR*D), while aiming to identify predictors of premature
discontinuation, and assessed whether attrition predictors varied across income levels. After
analyzing data from approximately 3,500 participants, younger age alone “independently
predicted greater likelihood of attrition” for all income levels (p.626). Edlund, et al. (2002) used
survival analysis to examine data collected in in-person interviews with over 1,000 individuals
suffering from “self-defined problems with ‘emotions, nerves, mental health, or use of alcohol or
drugs’ at some time during the 12 months preceding their interview” (p.846). Thormählen, et al.
(2010) similarly found that young adults were more likely than older adults to drop out of
treatment.
Swift & Greenberg (2012) combined data from nearly 700 independent attrition studies,
including 83,834 clients, in order to explore differences between treatment completers and drop
outs, and to identify predictors of attrition. Their meta-analysis revealed that individuals who
dropped out of and those who completed treatment differed in terms of educational attainment,

8
but not in gender, marital status, or race. Meta-regression within the study “indicated that both
gender and marital status predicted therapy drop out, but race, employment, and education did
not” (p.556).
The mixed conclusions regarding demographic predictors of attrition invite additional
attention and research as they have been primarily explained by the literature as a result of
conflicting methodologies, various existing operational definitions of psychotherapy attrition,
(Barrett et al., 2009; Garfield, 1977; Swift & Greenberg, 2012; Wierzbicki & Pekarik, 1993) and
the repeated application of “suboptimal analytic techniques” (Corning & Malofeeva, 2004,
p.354).
Dose Response
Several researchers (Barrett, et al., 2009; Hatchett & Park, 2003; Swift & Greenberg,
2012) have attributed the conflicting findings in independent attrition studies to a divergence
among scholars in the ways they have operationalized the construct of attrition. One popular
model used to understand the construct of attrition defines individuals who prematurely
discontinue therapy as those clients who attend less than a specified number of therapeutic
sessions (Hansen, Lambert & Forman, 2002; Hatchett & Park; Swift & Greenberg). This model
is based on the theory of the dose-effect relationship, wherein the dose is calculated by the
number of sessions attended by the client, and the effect is measured using the percentage of
clients with improved outcomes, which can also be understood as “the normalized probability of
improvement for one patient” (Howard, Kopta, Krause, & Orlinsky, 1986, p.1009). “Dose-
response methods have been widely adopted in medical research and have been adapted to
psychotherapy research” more recently (Hansen, Lambert & Forman, 2002, p. 331). The dose-
effect relationship suggests that a “minimum number of sessions are required for clients to show

9
improvement in therapy” (Swift & Greenberg, p.548). It is commonly assumed that more therapy
is better, and after examining 156 findings spanning the last 65 years, 100 “indicated a positive
relationships between therapy duration and outcome” (Anderson & Lambert, 2001).
Despite the finding that increased therapeutic treatment often yields superior outcomes,
the number of sessions required for clients to benefit has been contested. In response to the lack
of evidence-based direction detailing the number of treatment sessions required to achieve
clinically significant change, several researchers have sought to quantify the amount of therapy
needed to produce positive and meaningful client outcomes. Using data from over 850 clients
suffering mostly from depression and anxiety, Kopta, Howard, Lowry, & Beutler (1994) reported
that upon completion of 11th the therapeutic session, 50% of clients reported achieving clinically
significant change. It was not until after the 58th session that 75% of clients reached the same
status. Similarly, Kadera et al. (1996) studied a smaller sample of clients (N=64) with
comparable diagnoses (depression, anxiety), and reported that clinically significant change was
attained in 50% of clients attending 16 sessions, and 75% of clients made meaningful progress
by session 26.
In Anderson and Lambert’s 2001 study, questions surrounded not only establishing the
number of sessions required for clinically significant change, but also the number necessary for
the achievement of reliable and lasting change, which was defined by the authors as the point at
which “[clients have] met clinically significant change at every subsequent session” (p.878).
Researchers utilized a self-report measure, the Outcome Questionnaire (OQ-45) to track,
longitudinally, participants’ (N=75) level of symptomatic distress, interpersonal functioning, and
role performance over the course of psychotherapy. Researchers concluded that before 50% of
the clients were able to attain meaningful therapeutic change, 11 sessions of psychotherapy were

10
required, and that the median number of sessions needed to achieve lasting (reliable) change
within the sample was 9 (Anderson & Lambert, 2001).
Lambert (2007) later went on to collect data from independent clinical samples including
nearly 6,000 clients who “received routine clinical care” (p.3) in order to further explore the
dose-response relationship theory within psychotherapy. Similar to previous research, Lambert
utilized data from studies that tracked client progress via the OQ 45 at each session. Following
the combination of data sets, he concluded that 11-21 sessions were needed for 50% of clients to
reach clinically significant change, and that 25 – 45 sessions were required in order for 75% to
reach this point (Lambert, 2007), supporting previous findings. However, these studies included
predominately clients who were suffering from anxiety and depression, and researchers have
noted that “highly distressed outpatient clientele need more than the 11-16 sessions that may
suffice for a large portion of less-disturbed clientele… [and thus] those who are suffering the
most, and are in most need of help, require at least 20 sessions to have a good chance of
recovering” (Anderson & Lambert, 2001, p.885).
A consensus finding in the research on the dose-effect relationship seems to suggest that
a minimum of 11 sessions are required for one-half of clients to show lasting and meaningful
change (Anderson & Lambert, 2001; Barrett, et al., 2009; Hansen, Lambert & Forman; 2002,
Lambert, 2007). Therefore, it may seem reasonable to assume that consumers attend at least as
many sessions as are needed for improvement. However, Gibbons, et al. (2011) examined actual
psychotherapy utilization and discovered this is not necessarily the case. Participants in the study
included two cohorts of clients (N=1,479 in 1993 and N=5,912 In 2003) seeking treatment for
major depressive disorder in the Philadelphia community mental health system over a span of ten
years. Using descriptive statistics to analyze service claims records, researchers discerned that

11
the “modal number of sessions attended for either psychotherapy or medication treatment was
only one session… [and] the median number of psychotherapy sessions remained stable at five
sessions across the decade” (Gibbons, et al., p.6). Other studies (Duncan, 2010) similarly suggest
that clients often come late to treatment and do not, on average, attend enough sessions, resulting
in suboptimal treatment. In light of these findings, a major concern emerges from existing
literature: clients often attend an insufficient number of sessions in comparison to the number of
sessions required for clinically reliable change or for recovery.
Clients discontinue psychotherapy a variety of reasons. Some terminate prematurely
because of dissatisfaction, because they have recovered, or due to an exhaustion of third-part
payment assistance (Anderson & Lambert, 2001; Gibbons, et al., 2011; DuBrin & Zastowny,
1988;). Over the last two decades, “changes in the organization and financing of services for all
mental disorders…[has] resulted in limits on the number of visits and the amount of
reimbursement per visit for psychotherapeutic services” (Gibbons, et al., 2011, p.2). Based on
the prevailing assumption that clients can realize positive outcomes in only a few sessions
(Lambert, 2007), reimbursement for psychological treatment has commonly been capped at four
to eight sessions (Lambert, 2007), although the positive outcomes demonstrated in “clinical trial
treatments that [clinicians] are attempting to duplicate were based on 12-14 sessions, not four to
eight” (Lambert, 2007, p.3). In effect, it can be assumed that many clients who seek
psychotherapy do not obtain the therapeutic “dosage” necessary for beneficial change, and thus
the likelihood of positive outcomes is threatened. Difficulties in closing the gap between
research and policy here have been widely recognized (Hansen, Lambert & Forman, 2002;
Layard & Clark, 2015).

12
Method
Procedure
This study utilized a secondary data analysis of archival data, looking at the course of
psychotherapy for 3,728 clients in a community mental health clinic. In this way the study
utilized an intent to treat design, looking at psychotherapy as it naturally occurred in this
treatment setting without prescribing its duration in advance. Inclusion criteria consisted of all
clients who had one or more Outcome Questionnaire (“OQ”) score on record between 1999 and
2013. All participants had at least an initial baseline OQ from their first intake session. The OQ
was administered quarterly, at approximately three month intervals thereafter, as long as clients
remained in treatment. Status variables were created to mark participants’ final scores as their
point of attrition. SAS system version 9.3 was used in order to carry out a Cox regression
proportional hazards survival analysis to look broadly at the nature of attrition, at what
demographics and diagnostic categories moderated outcome, and at process variables such as
session frequency and recent changes in symptomology as status variables.
Setting & Intervention
The data were gathered over the course of fourteen years (from 1999 to 2013) at a
Midwestern outpatient community mental health clinic, founded in the 1950’s. This clinic sees
an average of over 700 clients annually, is an American Psychological Association (APA)
accredited training site, and at the time the data were queried represented treatments carried out
by 16 full time therapists. The clinic hosts approximately 12 graduate trainees annually, who also
see clients, representing the fields of psychology, social work, and psychiatry. Staff therapists at
the clinic are highly trained, committed to, and skilled in the administration of psychotherapy.
Many of the staff therapists supervise trainees, who include graduate level students in both

13
psychology and in clinical social work. Third and fourth year psychiatric residents (G3 and G4)
also train at this clinic under the supervision of three staff psychiatrists. The clinic is relationally
focused, historically psychodynamic, and increasingly integrative in its practice orientation.
Both staff and trainees participate in weekly interdisciplinary teams to review and to consult on
cases. Staff and trainees additionally receive individual supervision in relation to their work.
The clinic has three primary foci: offering quality care for uninsured and underinsured clients,
training graduate student and community practitioners, and conducting research. The clinic has
had a formal research program for over twenty years and collaborates in this capacity with
university-based researchers, two of whom are authors of this study.
The clinic provides weekly, interdisciplinary supervision, where relationally-based,
integrative psychotherapy is the common theoretical framework. At least one psychiatrist is
present at each of these team meetings. Administrators at this clinic are licensed clinicians who
see clients in addition to their administrative roles. The clinic is strongly interdisciplinary with
psychiatrists, psychologists, and clinical social workers consulting in relation to shared clients.
Clients are considered clinic clients and psychiatrists are on site, providing consultation and
psychotherapy in addition to medication management. The treatment, though not manualized, is
carried out with a large degree of shared treatment orientation (evidenced in individual
interviews with all staff therapists and a sample of interns in 2010) with weekly sessions as the
clinic’s standard of care. This approach is akin to that laid out in Summers & Barber’s 2009
book, Psychodynamic therapy: A guide to evidence-based practice. While the treatment is not
formally manualized, studies such as those by Vinnars, et al. have called into question whether
this is necessary for the purposes of researching an intervention. Vinnars, et al. (2005), for
instance, found comparable outcomes between manualized and non-manualized treatments in a

14
community mental health setting with many similarities to this one. We were most interested in
understanding outcomes associated with practice as it occurred, naturally, in this setting.
Measure- The Outcome Questionnaire (OQ 45.2)
The OQ 45.2 (Outcome Questionnaire) is a 45 item client-administered adult
questionnaire developed by Lambert, et al. (2004) specifically to measure outcomes particularly
relevant to adult psychotherapy. Its use has since become widespread, now having been studied
with over 100,000 people. Each item utilizes a five point Likert scale. The OQ provides both an
overall score (ranging from 0 – 180) as well as three subscales, which measure symptom distress,
interpersonal relations, and social role functioning. Lower scores represent less severity and
higher scores represent more psychiatric distress, with 63 representing a clinical cut-off and
measure of caseness. Clients scoring at or above 63 are seen as warranting treatment in contrast
to community norm scores, which average 45. The measure has strong psychometric properties
and has been applied to psychiatrically well community populations, to students in college
counseling centers, with EAP clients, clients in outpatient mental health centers, and with
psychiatric inpatients. It has also been tested for reliability across gender, race, and with various
ethnicities. Its alpha coefficients for internal consistency range between .84 and .93 for OQ total
scores. Its test-retest reliability is .84 for OQ Total scores. The OQ is able to speak not only to
recovery (a score in the range of community norms) but to clinically reliable change (RCI) as
well, defined as a decrease of 14 or more points in total score, and to deterioration, defined as a
14 or greater point increase in total score.
Survival Analysis
The Cox regression model was selected as the method of survival analysis. This
technique has two advantages for present purposes. The first is its relative flexibility as a semi-
parametric model that does not require a choice of particular probability distribution of survival

15
times. Termination times in psychotherapy do not suggest an a priori probability function;
therefore a nonparametric model is preferred in order to fit the data more closely even at the cost
of increased error variance which is the essential cost of semi- or nonparametric methods.
The second advantage of the Cox regression model is that it can incorporate time-varying
covariates. While other techniques such as Kaplan-Meier can estimate termination patterns by
subgroups based on fixed attributes of patients (such as education or diagnosis), Cox regression
can incorporate predictor variables that change over time. In this paper the researchers describe
an approach where a client’s long and short term symptom changes during the course of
psychotherapy are identified as potential predictors of the likelihood of termination at a given
time. These risk indicators vary in intensity over the course of therapy, and thus are referred to as
time-varying, or time-dependent covariates.
A final methodological decision involved the censoring of values. The data for this study
were collected from all client records between October, 1999, and December, 2013. This data set
included a number of clients who had terminated over the last decade, but also included a subset
of clients who were still in treatment at the time of data collection and must not be counted as
terminated. Thus, a censoring flag was set for clients who had a valid OQ-45 assessment on file
from September 2012 through the date of data collection. This is referred to as right censoring. It
is used to protect the accuracy of the parameter estimates for those whose outcome is not yet
known. In addition, the EFRON method of tie-breaking was used as recommended by Allison
(2010). The SAS® System version 9.3 software PROC PHREG was used in the analysis.
The following model was chosen:
Equation 1.

16
ℎ𝑖(𝑡) = 𝛼(𝑡)𝑒𝛽1𝑥𝑖1+𝛽2𝑥𝑖2(𝑡)+⋯+𝛽1𝑘𝑥𝑖𝑘(𝑡)
This says that the hazard h of termination for person i at time t (t is session number) is a product
of some base probability function 𝛼(𝑡)which has no particular parametric form, e.g., exponential
or Gompertz, times the exponential of a linear combination of explanatory variables, some of
which can be functions of time, as seen in predictor variable x2 which is represented as 𝛽2𝑥𝑖2(𝑡).
The hazard of termination is the odds ratio of termination relative to survival. For
example, the hazard ratio of 1.5 means that a client with a particular configuration of covariates
is 1.5 more likely to terminate treatment at time t compared to other clients who do not share this
particular configuration. The hazard ratio for a client dropping out at time 2, for instance, might
depend on marital status, as well as the magnitude of symptom change experienced recently.
The Cox regression model estimates coefficients for this model by taking the logarithm
of equation 1 to make a linear model:
Equation 2.
𝑙𝑜𝑔 ℎ𝑖(𝑡) = 𝛼(𝑡) + 𝛽1𝑥𝑖1 + 𝛽2𝑥𝑖2(𝑡) + ⋯ + 𝛽1𝑘𝑥𝑖𝑘(𝑡)
After converting the model in this way, it is possible to understand the results by analogy
with multiple regression models. The dependent variable is the log of the odds of termination at
treatment session number t. The covariates of the model are:
𝛼(𝑡): The Intercept term, the expected log of the odds of termination without respect to any of
the covariates, I,e., all other things being equal.
βx: The set of fixed covariates to predict termination included
(1) demographic factors such as education, ethnicity, relationship status, and gender.
17
(2) diagnostic factors including depression, anxiety, OCD, trauma, and substance related
disorders
βx(t): The set of time-varying covariates to predict termination based on local change in status
in time included:
(1) The change in OQ-45 total score from the previous assessment to the most current
assessment on record
(2) The cumulative change in the OQ-44 total score from intake to the most current
assessment on record
A first stage model entered all of the proposed covariates in the model to see which, if any,
predicted termination above and beyond the level of the baseline termination risk.
Time Varying Covariates
There are four time-varying covariates in the research model.
Long Term OQ Change. Long term OQ change is the cumulative change in OQ status from the
beginning of treatment to the present time. It is the current OQ-45 total score minus the intake
score. If a client makes gains over time, this number will be negative because lower scores on the
OQ-45 represent less symptom severity. A large negative number over the course of treatment
would indicate that symptom severity is decreasing. This variable is thought to capture sustained,
enduring change.
Short Term OQ Change. This metric is similar to the previous one except that it is localized in its
duration. It is the change in OQ-45 score since the previous OQ-45 measure. Thus, a client could
have both a significant long term OQ change, showing long lasting improvement that the client

18
retains, but also a short term deterioration in symptoms, resulting in an increase in the short term
score. This variable is thought to capture brief, recent, and transient change.
Surge. This is an improvement of at least 10 points over the previous OQ-45 measurement. It is
meant to capture a clinically significant movement in a short time. It should be noted that the
researchers did not use the OQ’s normative “14 points” reliable change index (RCI) as published
in the OQ-45 Scoring Manual. Instead, we used the local sample to estimate the reliability and
standard deviation, and computed a local reliable change threshold, which was 10 points.
Relapse. The opposite of a surge is a deterioration of at least 10 points on the OQ-45 since the
immediately preceding OQ-45 score. It is meant to suggest an abrupt, clinically meaningful
worsening, which is clinically significant even in the context of significant long term gain. We
sought to differentiate this event from either short or long term OQ change.
Power Analysis
Because a Cox proportional hazard regression function is not a fully parametric model,
statistical power is difficult to estimate. Some authors such as Castelloe (2000) argue that it is
necessary to use computer simulation to determine statistical power. A model offered by
Schoenfeld (1983) suggests that the minimum sample size for comparing the survival curves of
two different groups can be determined using the normal distribution approximation. Using this
approximation shows that 90% statistical power is achieved in subgroup comparisons of hazard
rates with a sample size of around 800. The current study has a much larger size and therefore a
lack of statistical power was not a significant threat.
Results
Demographics

19
The sample consisted of 3,728 clients, predominantly female (63%, n = 2,345) with an
average age of 38.5 (SD = 13.3). About 15% of the sample was young (age < 25) while another
7% was older (age > 60). The typical age could be characterized as middle adult. A plurality of
the sample had an unspecified ethnic status (47%, n = 1,469), followed by Caucasian (39%, n =
1,474) and Hispanic (7%, n = 253). There were small numbers of African Americans (4%, n =
139), Multi-Racial (1%, n = 54), Asian/Pacific Islander (1%, n = 49), and Native
American/Alaskan (<1%, n = 21) participants. Relationship status was also mostly unspecified
(46%, n = 1,713) with the majority of known status being single (26%, n = 989), followed by
married (16%, n = 597), divorced (6%, n = 226), long-term civil union (4%, n = 142), separated
(1%, n = 37) and widowed (<1%, n = 24). Educational status for most was unspecified (47%, n
= 1,748), but the majority of those for whom data were available were college educated (23%, n
= 856), followed by high school (14%, n = 527), graduate school (10%, n = 363) and two-year
college or vocational school (3%, n = 133). In keeping with national norms, the mean baseline
OQ score for clients in this sample was 75.33 (SD = 25.59).
Table 1 below shows the effects of demographic variables on the hazard function. The B
coefficients are those referred to in Equation 2 above. The significance of the coefficients is
computed using the Wald statistic, and the p-values show whether the coefficient differs from 0
as posited in the null hypothesis. It is evident that several levels of the demographic factors are
statistically significant. The Hazard coefficient h results from taking the anti-log of the B
coefficient. It is directly analogous to an effect size in ANOVA and regression models. The
hazard coefficient can be interpreted as an odds ratio. It is the increase or decrease in likelihood
of drop out for clients having the demographic characteristic. This number equals 1 where the
odds are even that members of this class will attrit. When the coefficient is greater than one, it

20
means the class is more likely to drop out of treatment over time, and when the coefficient is less
than one, it means the class is less likely to attrit, all other things being equal.
As an example, the effect of “less than high school education” is significant (B = 1.18,
Wald (1) = 88.11, p < .001, h = 3.28), indicating that a client reporting less than high school
education was 3.28 times more likely to drop out at any given time compared to the baseline
survival rate. The general trend in this data set is that less educated clients had a higher risk of
dropout, while those with some college or higher education have a lower risk. This group
attended an average number of 12 sessions (SD = 40.99).
Race, or ethnic categories showed another clear pattern, in that Caucasians (B = -.46,
Wald (1) = 35.72, p < .001, h = .63) and Hispanics (B = -.45, Wald (1) = 24.80, p < .001, h = .64)
were more likely to remain in treatment. A way to interpret hazard ratios less than 1.0 is to take h
– 1, which for Hispanics is .64-1 = -.36 and take the absolute value times 100 for a percentage,
giving 36%. Hispanics were 36% more likely to remain in treatment than other racial categories,
with a mean number of 25 sessions (SD = 57.53).
The age demographic analysis demonstrated a fairly clear pattern in which clients over 30
and less than 50 years old were more likely to remain in treatment. The age category 40-49 was
significant in this sample (B = -.695, Wald (1) = 7.5, p = .006, h = .50), with 1.50 suggesting that
middle aged adults are 50% more likely to remain in treatment than older and much younger
counterparts. This age group had a mean of 25 sessions (SD = 53.73).

21
Table 1.
Demographic Variable Effects
Parameter Level df B SE Wald p Hazard Interpretation
Education Less than High School 1 1.188 0.13 88.11 <.0001 3.28
Education Trade/Vocational 1 0.454 0.12 14.87 0.000 1.58 less educated have greater dropout risk
Education High School 1 0.288 0.08 11.69 0.001 1.33
Education Graduate School 1 -0.083 0.09 0.80 0.371 0.92 not significant
Education College 1 -0.233 0.08 8.37 0.004 0.79 college educated have decreased dropout risk
Race Asian/Pacific Is 1 0.342 0.17 4.20 0.041 1.41 Asian at greater risk of dropout
Race Native American/Alaskan 1 -0.051 0.24 0.04 0.834 0.95 not significant
Race African American 1 -0.107 0.11 0.89 0.344 0.90 not significant
Race Hispanic 1 -0.450 0.10 20.48 <.0001 0.64
ethnic groups likely to remain in treatment Race Caucasian/White 1 -0.459 0.08 35.72 <.0001 0.63
Race Multi-racial 1 -0.593 0.17 12.32 0.000 0.55
Age Less than 18 1 0.118 0.33 0.13 0.720 1.13 not significant
Age 18 to 29 1 -0.203 0.25 0.64 0.422 0.82 not significant
Age Over 60 1 -0.366 0.26 1.97 0.160 0.69 not significant
Age 30 to 39 1 -0.510 0.25 4.06 0.044 0.60 adults over age 30 tend to remain in treatment
Age 50 to 59 1 -0.640 0.26 6.26 0.012 0.53
Age 40 to 49 1 -0.695 0.25 7.50 0.006 0.50

22
Diagnostic Categories
Specific diagnostic categories were well represented, with depression and anxiety being
common among the sample, each with around 10-15% frequency, depending on the criteria used
(DSM versus therapist designation). There was also a relatively large subgroup who were
admitted for trauma and stress related conditions (4%, n = 137).
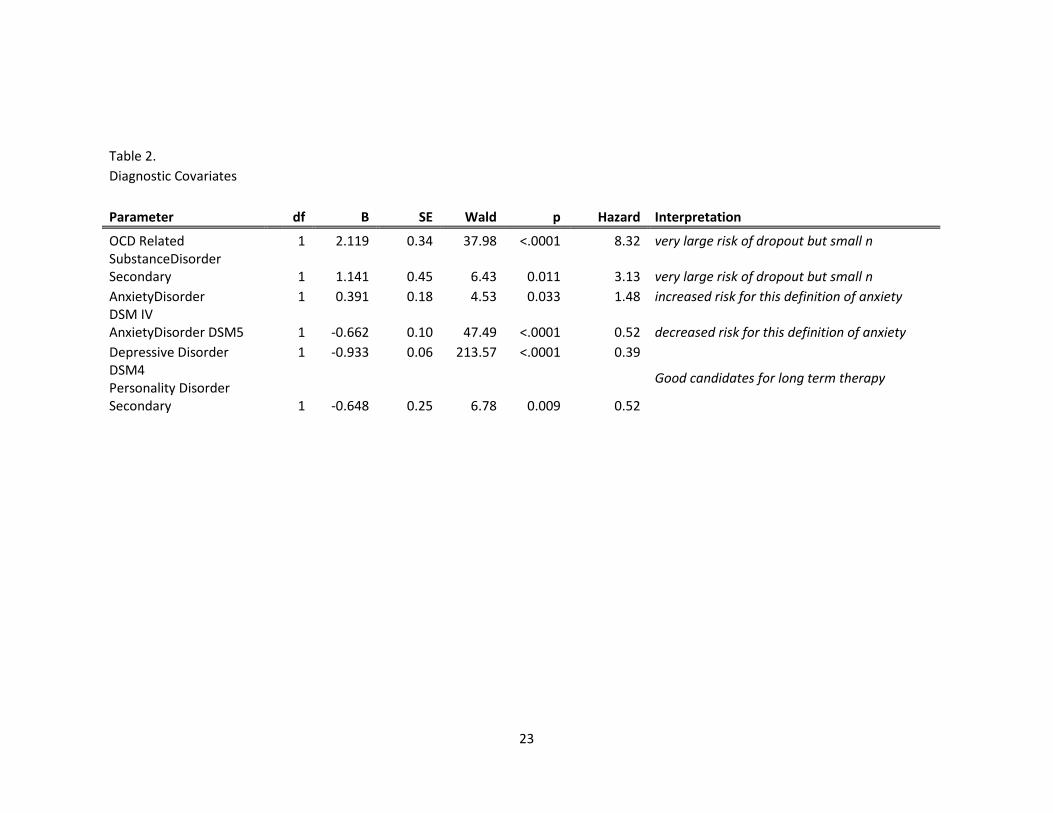
All of the diagnostic categories shown in Table 2 below were statistically significant,
meaning that all of them increased or decreased the risk of attrition over time. OCD related
disorders appeared to be at a particularly high-risk for drop out (B = 2.12, Wald(1) = 37.98, p <
.0001 h = 8.32). Clients within this cluster were over eight times more likely to drop out of
treatment compared to the baseline survival curve, with a mean of only 2 sessions (SD = 7.00).
Hazard coefficients this large might be influenced by having a small number of clients in this
subcategory (n = 25).
Those with substance use as a secondary diagnosis (B = 1.14, Wald(1) = 6.43, p =.011 h
= 3.13) and anxiety disorders (B = .39, Wald(1) = 4.53, p < .033 h = 1.48) similarly constituted
higher risk groups. An important qualifier is that anxiety disorders as defined by DSM-5 criteria
actually constituted a better prognosis for remaining in treatment (B = -.66, Wald(1) = 47.49, p <
.0001 h = .52) than when the analysis used DSM-IV criteria.
Depressive disorders (B = -.933, Wald(1) = 213.57, p < .0001 h = .39) and DSM-IV
personality disorder as a secondary diagnosis (B = -.65, Wald(1) = 6.78, p < .009 h = .52)
appeared to improve the probability of remaining in treatment. The mean number of sessions for
clients in each of these categories is represented in summary form on Table 4.
23
Table 2.
Diagnostic Covariates
Parameter df B SE Wald p Hazard Interpretation
OCD Related 1 2.119 0.34 37.98 <.0001 8.32 very large risk of dropout but small n SubstanceDisorder Secondary 1 1.141 0.45 6.43 0.011 3.13 very large risk of dropout but small n
AnxietyDisorder 1 0.391 0.18 4.53 0.033 1.48 increased risk for this definition of anxiety DSM IV AnxietyDisorder DSM5 1 -0.662 0.10 47.49 <.0001 0.52 decreased risk for this definition of anxiety
Depressive Disorder 1 -0.933 0.06 213.57 <.0001 0.39
Good candidates for long term therapy DSM4 Personality Disorder Secondary 1 -0.648 0.25 6.78 0.009 0.52

24
Process Variables
OQ-45 Measures. The number of OQ-45 assessments in the sample ranged from 1 to 27. The
measure was administered approximately quarterly for the duration of treatment. The modal
number of OQ 45 assessments was one, meaning that a majority (56%, n = 2,094), terminated
treatment between the first and second OQ administration. Of those who continued, many more
ended by the time of the third OQ-45 assessment (26%, n = 954). The remaining participants
continued in treatment for longer term psychotherapy.
Number of Sessions. The unit of time in this study was the treatment session. The question
posed by the researchers was whether the number of sessions until termination was predicted by
demographic, diagnostic, or factors related to client progress. The cumulative number of sessions
was established for each client. As noted above, most clients ended during the first three months
of treatment. The mean number of sessions was 21.27 (SD = 51.85), but again this distribution is
skewed by the large number of clients discontinuing during the first three months of treatment. A
separate analysis of the distribution for only those who continued in treatment beyond the first
quarter showed that for the 1,588 clients who continued, the mean number of sessions was 49.89
(SD = 69.65, 50th percentile = 24, 75th percentile = 57, 90th percentile = 125, 99th percentile =
360).
One way to define the attrition rate is as the proportion of clients who attrited before the
average number of sessions. Using only those who continued in treatment at least until the
second OQ 45.2 administration, the average number of sessions was 50. Of these clients, 70.4%
(n = 1,118) ended before the mean number of sessions.
25
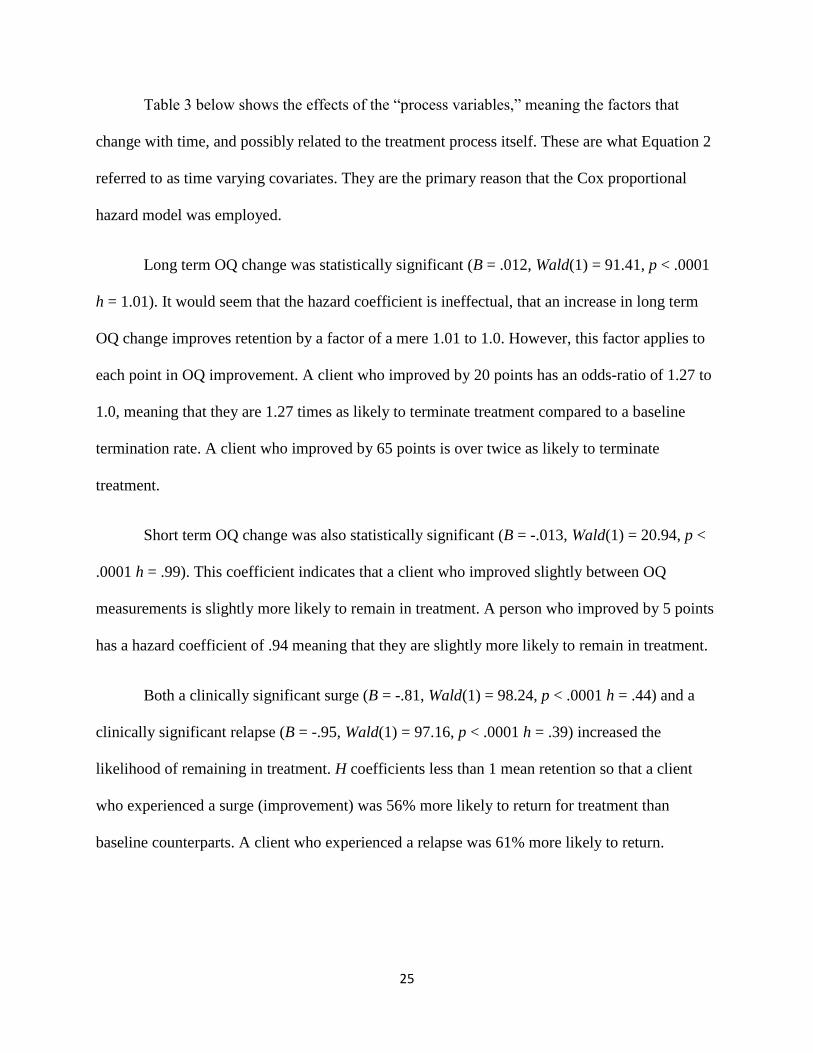
Table 3 below shows the effects of the “process variables,” meaning the factors that
change with time, and possibly related to the treatment process itself. These are what Equation 2
referred to as time varying covariates. They are the primary reason that the Cox proportional
hazard model was employed.
Long term OQ change was statistically significant (B = .012, Wald(1) = 91.41, p < .0001
h = 1.01). It would seem that the hazard coefficient is ineffectual, that an increase in long term
OQ change improves retention by a factor of a mere 1.01 to 1.0. However, this factor applies to
each point in OQ improvement. A client who improved by 20 points has an odds-ratio of 1.27 to
1.0, meaning that they are 1.27 times as likely to terminate treatment compared to a baseline
termination rate. A client who improved by 65 points is over twice as likely to terminate
treatment.
Short term OQ change was also statistically significant (B = -.013, Wald(1) = 20.94, p <
.0001 h = .99). This coefficient indicates that a client who improved slightly between OQ
measurements is slightly more likely to remain in treatment. A person who improved by 5 points
has a hazard coefficient of .94 meaning that they are slightly more likely to remain in treatment.
Both a clinically significant surge (B = -.81, Wald(1) = 98.24, p < .0001 h = .44) and a
clinically significant relapse (B = -.95, Wald(1) = 97.16, p < .0001 h = .39) increased the
likelihood of remaining in treatment. H coefficients less than 1 mean retention so that a client
who experienced a surge (improvement) was 56% more likely to return for treatment than
baseline counterparts. A client who experienced a relapse was 61% more likely to return.

26
Table 3. Time Varying Covariates
Parameter Level df B SE Wald p Hazard Interpretation
Long term OQ change positive = lacking progress 1 0.012 0.00 91.41 <.0001 1.01 long term deterioration increases dropout
Short term OQ change positive = symptom deterioration 1 -0.013 0.00 20.94 <.0001 0.99 short term deterioration increases continuation
surge = +1 RC > 10 pt symptom improvement OQ-45 1 -0.812 0.08 98.24 <.0001 0.44
significant change in OQ -- better or worse -- increases continuation relapse = -1 RC > 10 pt deterioration OQ-45 1 -0.951 0.10 97.16 <.0001 0.39
RC was computed to be 10 points for this sample using local test-retest reliability of the OQ 45.2

27
Table 4. Mean OQ 45.2 Scores at Intake and at Termination Baseline OQ Number of Sessions Termination OQ
OQ Post-Pre
M SD N M SD N M SD N Change Education College 74.29 23.22 850 32.37 68.79 847 68.93 23.82 836 -5.36
Graduate School 67.65 22.61 357 30.81 57.09 355 61.88 22.36 351 -5.77
High School 82.58 25.17 522 19.04 51.54 520 77.82 27.10 516 -4.76
Less than High School 83.48 25.92 100 12.11 40.99 100 80.85 26.93 99 -2.63
Trade/Vocational School 76.59 26.97 133 10.80 24.89 131 74.93 27.75 132 -1.66
Unknown 74.68 26.64 1735 15.77 40.73 1697 70.32 27.44 1720 -4.35
Race African American 85.80 25.58 138 13.09 36.08 138 83.15 27.70 137 -2.65
Asian/Pacific Islander 82.61 28.73 49 14.16 42.04 49 79.04 31.18 48 -3.57
Caucasian/White 75.06 24.00 1459 29.22 62.72 1452 69.75 24.98 1438 -5.31
Hispanic 74.35 25.03 252 24.71 57.53 250 70.70 24.81 244 -3.65
Multi-racial 83.19 20.73 54 30.11 100.97 54 80.33 20.51 54 -2.85
Native American/Alaskan 75.81 26.93 21 25.57 80.39 21 73.71 29.29 21 -2.10
Unknown 74.41 26.75 1724 14.46 35.77 1686 69.94 27.50 1712 -4.47
Age Less than 18 66.13 20.27 24 9.00 29.38 24 63.17 20.04 23 -2.95
18 to 29 78.26 24.70 1153 16.73 46.59 1139 72.45 26.48 1147 -5.82
30 to 39 75.05 25.80 1003 22.74 56.63 994 70.63 26.88 990 -4.41
40 to 49 75.11 25.81 770 24.63 53.73 755 71.84 25.81 760 -3.27
50 to 59 75.35 26.22 495 25.94 54.57 490 70.47 26.47 487 -4.88
Unknown 70.72 24.61 18 4.81 19.25 16 72.39 25.86 18 1.67
Over 60 64.09 24.18 234 18.91 43.77 232 59.64 25.06 229 -4.45
OCDRelated NO 75.34 25.59 3688 21.32 51.90 3641 70.70 26.49 3645 -4.64
YES 70.33 26.19 9 2.33 7.00 9 71.22 26.46 9 0.89
AnxietyDisorder NO 75.34 25.59 3636 21.35 52.04 3591 70.65 26.52 3594 -4.69
YES 74.77 25.76 61 16.59 38.56 59 73.62 23.86 60 -1.15
DSMIVAnxietyDisorder NO 75.20 25.74 3465 20.68 50.96 3419 70.51 26.63 3424 -4.69
YES 77.27 23.05 232 30.04 63.06 231 73.53 23.99 230 -3.74
DepressiveDisorder NO 74.21 25.68 3260 16.93 41.01 3213 69.58 26.52 3222 -4.63
YES 83.71 23.25 437 53.23 94.57 437 79.06 24.64 432 -4.65
DSMIVpersonalitysecondary NO 75.31 25.59 3667 20.82 50.30 3620 70.62 26.52 3623 -4.69
YES 78.03 25.86 30 75.57 139.26 30 80.52 19.23 31 2.48

28
SubstanceDisorder NO 75.36 25.58 3691 21.29 51.88 3644 70.73 26.48 3648 -4.63
YES 59.50 28.20 6 8.00 18.63 6 55.17 27.47 6 -4.33
TOTAL Total 75.33 25.59 3697 21.27 51.85 3650 70.70 26.48 3654 -4.63

29
Discussion
Summary of findings:
Results suggest that a number of demographics, diagnostic categories, and factors
related to client progress (i.e. process variables treated as time-dependent covariates) were
associated with clients ending treatment. Demographics that increased the risk of ending in a
statistically significant way included: participants reporting less than high school, high
school, or trade/vocational schooling as the highest level of education achieved. Participants
reporting college or graduate school education were more likely to continue in treatment.
Gender did not emerge as a significant variable in predicting attrition. Those identifying as
Hispanic, African American, Caucasian, or multi-racial were the most likely to continue in
treatment. Among these groups, Caucasian, Hispanic, and multi-racial clients achieved
statistically significant protection against ending. Those identifying as Asian/Pacific Islander
were more likely to attrit. The latter was the only group to demonstrate statistical significance in
terms of increased risk when looking at race and ethnicity. When examining age, two categories
stood out as statistically important: adolescents (those under age 18) were more likely to attrit,
and the age category 30 – 39 emerged as an important “cut point” whereby clients older than 30
were more likely to continue in treatment. Older adult clients (those 60 and older) were similarly
more likely to remain in treatment than those under 60.
A number of diagnostic categories emerged as significant as well. Participants with
unipolar depressive and personality disorders emerged as good candidates for longer-term
psychotherapy (were more likely to remain in treatment), while those diagnosed with OCD and
substance-related disorders were significantly more likely to attrit. Interestingly, anxiety emerged
as a relatively low risk of attrition based on its DSM-5 categorization, but became a risk of
ending using the DSM-IV categorization. This may reflect the reorganization of OCD in the

30
DSM-5, particularly in light of the strong hazard or risk it posed for attrition in this sample. In
terms of process variables, two significant findings emerged. First, long term deterioration
predicted drop out. Second, a recent change in OQ 45 score, whether positive or negative,
predicted continuation in treatment. This in itself may point to the importance of clinicians
simply monitoring for clinically reliable change using measures such as the OQ as part of routine
practice, for which Lambert and others have called (Layard & Clark, 2015).
Relationship to existing studies
In keeping with Swift and Greenberg’s (2012) recent meta-analysis, we found a
significant rate of attrition. While Swift and Greenberg found an overall drop-out rate of nearly
20%, we found that approximately 70% of clients attrited before the mean number of sessions in
this sample for those continuing beyond the first OQ administration. We similarly found age and
diagnostic category to be meaningful moderators. In contrast to Swift and Greenberg who found
personality disorders to be associated with an increased risk of attrition, we did not. This may
reflect this clinic’s strong relational, collaborative and interdisciplinary focus. The clinic has
significant experience in offering longer-term care for clients diagnosed with personality
disorders. The experience and prognosis of this group may be worth further attention in future
research. We lacked sufficient numbers to look at the role of individual diagnoses such as
eating disorders in the way Swift & Greenberg were able to, but we were able to look at broader
diagnostic categories, such as: unipolar mood, anxiety, substance psychotic, and OCD-related
disorders. Our analysis points to the particular importance of substance and OCD-related
disorders in this community mental health setting as particularly powerful potential moderators
of outcome.
Our findings are also consistent with those reported by Warden (2009) from the
federally funded Sequenced Treatment Alternatives to Relieve Depression (STAR*D) study,
which pointed to the importance of younger age, socioeconomic status (lower income), and less

31
education as all associated with increases in attrition. STAR*D served as a particularly important
point of comparison in that both studies had a comparable sample size of approximately 4,000.
We found two of these three variables to predict attrition, with education exerting a particularly
strong effect (risk) for those client participants with less than a high school education and for
those with trade or vocational training. Participants in this study under age eighteen were at
particular risk, as were those reporting lower incomes. In keeping with older, classic studies in
attrition such as Baekland & Lundwall (1975), these risk factors begin to point to a general risk
profile of a younger, less educated, lower income client as a potentially less socially advantaged
client with less social and economic capital. While the STAR*D study found these risks
operating in relation to adult clients with major depression, we found these to be important
moderators more broadly and with adolescent clients in addition to adults. The STAR*D study
similarly speaks to the importance of identifying these potential risk groups in that Warden, et al.
(2009) reported that both “remission rates were lower for participants who dropped out of
treatment” (p 622) and “attrition rates increased as income decreased” (622), finding that simply
utilizing a public insurance was associated with a poorer income. Both Warden, et al. (2009) and
Swift & Greenberg (2012) call for more intentional outreach and prevention efforts tailored to
participants in these risk groups.
Our findings in relation to race and ethnicity were more mixed. While Connolly
Gibbons, et al. (2011) found race to be “a significant predictor of both treatment type received
and length of treatment” (p. 495) in community mental health systems, our findings
were less clear, with several racial and ethnic groups demonstrating longevity and more
protection against attrition (seen in the form of hazard ratios less than the benchmark of 1.0). For
instance, in contrast to the STAR*D study, we did not find African Americans to be at increased

32
risk of attrition (hazard = .90). Caucasian, Hispanic, and multi-racial clients were all likely to
remain in treatment. However, clients identifying as Asian had the highest rate of attrition. This
discrepancy may be understood, in part, as a result of this clinic’s conscious and intentional
effort to better serve an ethnically and racially diverse clientele. As evidence of this, the clinic
offers Spanish-speaking therapists, administrative staff, and psychiatrists. Clients may undertake
psychotherapy and utilize psychiatric consultation entirely in Spanish. The clinic has made
similar efforts to reach out to an increasing number of Hmong and older adult clients, offering an
older adult program. It is worth noting that older adults in this sample were similarly less likely
to attrit, with adults age 30 and older being more likely to remain in treatment. It may serve as
an example of the potential for clinics to reduce attrition by way of such efforts and may be
worth further exploration in future studies.
Strengths:
The strengths of this study are particularly tied to its relatively large sample size and
longitudinal nature. With nearly 4,000 participants and over a decade of data, we were able to
explore not only at the role of demographics such as age, race, income, and diagnostic clustering
in the way other studies have, but we were able to add attention to process variables in the form
of looking at both the role or potential predictive value of both “overall improvement” and
“recent change” (clinically reliable improvement or deterioration) in predicting the risk of
attrition, building on the work of Roos (2011), who similarly brought attention to process
variables in better understanding the risk of attrition. We were also able to respond to the call of
Corning & Malofeeva (2004) to apply survival analysis to better understand both attrition and
termination in psychotherapy. We did so using a measure of clinically reliable change (defined
as a 10 or more point increase or decrease from one’s baseline score) calculated specifically for

33
this clinic sample. We found that clinically reliable change in either direction correlated with a
greater likelihood of remaining in treatment. Those clients who were either recently improving
or worsening were less likely to attrit.
The study also benefitted from its naturalistic and “real life” clinical setting. Previous
studies such as Swift & Greenberg’s 2012 meta-analysis pointed to the “setting for the
intervention” (p. 547) and “type of study” (efficacy vs. effectiveness) (p. 547) as important
moderators of outcome. This study was able to offer a form of replication and to serve as an
effectiveness study, looking at actual, open-ended and community based treatments as they
naturally occurred in a community mental health setting. The clinic also has a historically
psychodynamically grounded and fairly uniform theoretical orientation. Swift and Greenberg
pointed to theoretical orientation as not necessarily predictive of attrition. With our attention to a
large group of psychodynamically oriented practitioners in this study, with findings comparable
to other studies, our findings add strength to this assertion. The large number (n = 437) of
participants presenting with a depressive disorder allowed for comparisons with studies such as
Connolly Gibbons, et al. (2011) and Warden, et al. (2009), who gave exclusive attention to the
risk of attrition for this specific diagnostic cluster. We were able to make some direct
comparisons and contrasts with this large, federally funded study.
The study had associated limitations as well. While a quantitative method offers a good
deal of information as to when people leave, it tells little about the contextual variables that may
speak to why people leave. That is, clients end therapy for a multitude of reasons, including the
successful resolution (or “enough” of a resolution to) a presenting concern and sufficient
symptom improvement. Authors such as Duncan (2010) have written speaking to the often brief
nature of actual psychotherapy. The clinic’s modal number of sessions being 3 adds weight to

34
this assertion as well. We witnessed a large percentage of clients ending treatment between the
first and second administration of the OQ 45.2. It would be beneficial to hear from those clients
who did not return after even a first session. This absence of this information also points to the
potential benefit of a qualitative study giving attention to better understanding the nature of and
reasons for endings at the clinic. This study has prompted the clinic to formally reach out to and
to study more formally the reasons clients end.
This study also suffered from a lack of some diagnostic specificity. The electronic health
record used tracked largely intake diagnoses. We thus lacked a post-treatment confirmation of
diagnosis as well as a lack of axis II diagnoses we would have expected due to both the size of
this data set and the nature of an outpatient mental health setting, where authors such as Black
and Andreasen (2010) predict 30 % present with a personality-related component to their
treatment. Lastly, despite a large sample that represents both student/trainee and staff clinicians
as providers, we were not able to parse the data set by student trainee versus staff provider. This
may be worth doing in the future in that both Hansen, Lambert, & Forman (2002) and Swift &
Greenberg’s 2012 meta-analysis pointed to differences in attrition between these two groups.
Lambert has pointed to a general need for more attention to trainee outcomes broadly.
Potential Practice Implications:
The study, building upon an existing literature begins to suggest some potential practice
implications. While there is broad agreement in the literature that premature discontinuation of
psychotherapy is a fairly widespread and expected phenomenon, this study (in keeping with
others), suggests that there are particular groups of clients, identifiable by education, income, and
possibly age, that may benefit from particular attention and efforts aimed at reducing attrition.

35
Both Duncan (2012) and Whipple, et al. (2003) have published findings pointing to the
importance of feedback effects and of feedback-informed practice, with both authors
demonstrating reduced attrition and improved treatment outcomes in cases where clinicians give
explicit, in-session attention to a client’s progress or lack of progress, making adjustments
accordingly. Whipple, et al. (2003) have offered clinicians ways to identify early treatment
failure and associated problem-solving strategies as part of routine clinical practice. Lambert
(2010) has pointed to the importance of using a clinical measure such as the OQ 45.2 in doing so
in that clinicians tend to be poor judges of who is likely to attrit, based solely on observation or
clinical impression. In some ways these findings call for what Dr. David Eagleman refers to as
“guided clinical judgment.” This study’s findings support others that suggest younger age and
lower income matter as relevant demographics. In addition, the broader literature’s identification
of: a lack of insurance, younger age, lower income, ask risks or “hazards”, may speak to a
broader clinical presentation of a less advantaged client sub-population. Our additional finding
that recent change matters, suggests in line with Lambert, that less than weekly meetings may
not be a sufficient standard of care and that those clients who simply maintain or “stall” in
middle phase work may pose a risk as well.
Finally, these findings point to the general importance of explicit treatment engagement
strategies in outpatient clinic settings. Authors such as Nock (2012) and Lizardi & Stanley
(2010) have outlined the importance of facilitating treatment engagement specifically in relation
to clients presenting for outpatient mental health care after a suicide attempt. These interventions
are often relatively practical and involve strategies such as making phone contact with a client
before a first session. Similarly, in the context of practice evaluation, mental health providers
such as Darnall (2013) and others have pointed to systematic efforts to reach out in writing to

36
clients who stop attending outpatient psychotherapy, with an associated significant reduction in
attrition. Darnall, in particular, points to the danger of “out of sight, out of mind” (personal
communication) and to clinicians’ implicit theories behind why clients leave that are often
inaccurate. Because a substance-related diagnosis emerged as a particular risk in this setting, it
may be worth noting that Monras & Gual (2000) echo this finding and conclude, in their study of
329 adults diagnosed with alcohol dependence that the first three months of treatment were
particularly important in partcipants’ deciding whether or not to commit to therapy.
The diagnostic factors that emerged as important are worth noting in a couple ways.
OCD-related disorders emerging as a particular risk for attrition is a good reminder for
community clinicians that OCD is conceived of by many as a specific disorder calling for a
specific treatment (e.g. exposure and response prevention). The role of substance as a risk is an
important reminder that substance is often missed in clinical settings and can complicate a
clinical relationship (Freimuth, 2008). If this finding holds in other settings, it may serve as a
reminder to assess for substance abuse or dependence with clients and to the importance of
staffing clinics with clinicians with expertise here (i.e. with licensed alcohol and drug counselors
or LADC’s). Lastly, our findings pointing to the predictive value of not only diagnostic
categories, but of overall change and recent change in particular. They suggest value in looking,
even descriptively, at change over time and at recent attendance, using measures such as the OQ
45.2, that offer software packages such as the OQ Analyst to assist clinicians in identifying
recent changes in status that may signal the risk of attrition or treatment failure.

37
References
Allison, P. D. (2010). Survival analysis using SAS: A practical guide, 2nd Ed. Cary: SAS
Institute.
Anker, M., Duncan, B., & Sparks, J. (2009). Using client feedback to improve couples therapy
outcomes: A randomized clinical trial in a naturalistic setting. Journal of Consulting and Clinical
Psychology, 77, 693–704.
Anderson, E. M., & Lambert, M. J. (2001). A survival analysis of clinically significant change in
outpatient psychotherapy. Journal of Clinical Psychology, 57(7), 875-888.
doi:10.1002/jclp.1056
Baekeland, F., & Lundwall, L. (1975). Dropping out of treatment: A critical review.
Psychological Bulletin, 82(5), 738-783. doi:10.1037/h0077132
Barrett, M. S., Chua, W., Crits-Christoph, P., Gibbons, M. B., & Thompson, D. (2008). Early
withdrawal from mental health treatment: Implications for psychotherapy practice.
Psychotherapy: Theory, Research, Practice, Training, 45(2), 247-267. doi:10.1037/0033-
3204.45.2.247
Black, D. W., & Andreasen, N. C. (2010). Introductory textbook of psychiatry, 5th Ed.
Washington, DC. American Psychiatric Press.
Buttell, F.P. (2012). Evaluating predictors of program attrition among women mandated into
batterer intervention treatment.(2012). Research on Social Work Practice, 22(1), 20-28.
doi:10.1177/1049731511413473.
Castelloe, J. (2000), “Sample Size Computations and Power Analysis with the SAS System”,
Paper 265-25, in Proceedings of the Twenty Fifth Annual SAS Users Group International,
Cary, NC: SAS Institute. Inc.
Corning, A. F., & Malofeeva, E. V. (2004). The application of survival analysis to the study of
psychotherapy termination. Journal of Counseling Psychology, 51(3), 354-367.
doi:10.1037/0022-0167.51.3.354
Crane, C. & Williams, J. M. G. (2010). Factors associated with attrition from mindfulness-based
cognitive therapy in patients with a history of suicidal depression. Mindfulness, 1: 10 –
20.
Curran, et al. (2002). Depressive symptomology and early attrition from intensive outpatient
substance use treatment. The Journal of Behavioral Health Services & Research, 29(2),
138 – 143.
Darnall, K. (2013). Personal communication. September 13. Minneapolis, Minnesota.

38
DuBrin, J. R., & Zastowny, T. R. (1988). Predicting early attrition from psychotherapy: An
analysis of a large private-practice cohort. Psychotherapy: Theory, Research, Practice,
Training, 25(3), 393-408. doi:10.1037/h0085361
Duncan, B. (2010). On becoming a better therapist. Washington, DC. American Psychological
Association.
Edlund, M. J., Wang, P. S., Berglund, P. A., Katz, S. J., Lin, E., & Kessler, R. C. (2002).
Dropping out of mental health treatment: Patterns and predictors among epidemiological
survey respondents in the United States and Ontario. The American Journal of Psychiatry,
159(5), 845-851. doi:10.1176/appi.ajp.159.5.845
Freimuth, M. (2008). Another missed opportunity: Recognition of alcohol use problems by
mental health providers. Psychotherapy: Theory, Research, Practice, Training, 45, 405-409.
Garfield, S. L. (1977). Further comments on "dropping out of treatment": Reply to Baekeland
and Lundwall. Psychological Bulletin, 84(2), 306-308. doi:10.1037/0033-2909.84.2.306
Gibbons, M.B.C., Rothbard, A., Farris, K.D., Stirman, S.W., Thompson, S.M., Scott, K., Heintz,
L.E., Gallop, R., Crits-Christoph, P. (2011). Changes in psychotherapy utilization among
consumers of services for major depressive disorder in the community mental health system.
Adm Policy Ment Health, 38(6): 495–503. doi: 10.1007/s10488-011-0336-1
Hatchett, G.T. & Park, H.L. (2003). Comparison of four operational definitions of premature
termination. Psychotherapy: Theory, Research, Practice, Training [PsycARTICLES], 40(3),
226-231. doi:10.1037/0033-3204.40.3.226
Howard, K I., Kopta, M. S., Krause, M. S., & Orlinsky. D. E. (1986). The dose-effect
relationship in psychotherapy. American Psychologist, 41(2), 159 – 64.
Hansen, N. B., Lambert, M. J., & Forman, E. M. (2002). The psychotherapy dose-response effect and its
implications for treatment delivery services. Clinical Psychology: Science and Practice, 9, 329–
343.
Kleinbaum, D. G., & Klein, M. (2005). Survival Analysis: A self-learning text, 2nd Ed. NY:
Springer Press.
Kopta, S. M., Howard, K. I., Lowry, J. L., & Beutler, L. E. (1994). Patterns of symptomatic
recovery in psychotherapy. Journal of Consulting and Clinical Psychology, 62(5), 1009-
1016. doi:10.1037/0022-006X.62.5.1009
Lambert, M. J., Whipple, J. L., Vermeersch, D. L., Smart, D. L., Hawkins, E. J., Lars Nielsen, S.,
Goates, M. (2002). Enhancing psychotherapy outcomes via providing feedback on client
progress: A replication. Clinical Psychology & Psychotherapy, 9, 91 – 103.
39
Lambert, M. J. (2007). Presidential address: What we have learned from a decade of research
aimed at improving psychotherapy outcome in routine care. Psychotherapy Research, 17(1),
1-14. doi:10.1080/10503300601032506
Lambert, M. J. (2012). Helping clinicians to use and learn from research-based systems: The
OQ-analyst. Psychotherapy, 49(2),109-114. doi: 10.1037/a0027110
Layard, R. & Clark, D. M. (2015). Thrive: The power of evidence-based psychotherapies.
Penguin Press.
Lizardi, D. & Stanley, B. (2010). Treatment engagement: a Neglected aspect in the care of
psychiatric patients. Psychiatric Services, 61(12), 1183 – 1191.
Monras, M. & Gual, A. (2000). Attrition in group therapy with alcoholics: A survival analysis.
Drug & Alcohol Review, 1: 55 – 63.
Nock, M. K. (2012). Future directions for the study of suicide and self-injury. Journal of Clinical
Child and Adolescent Psychology, 41, 255-259.
Pekarik, G. (1983). Follow up adjustment of outpatient drop-outs. Journal of Orthopsychiatry,
53, 501 – 511.
Reis, B.F. & Brown, L.G. (1999). Reducing psychotherapy dropouts: Maximizing perspective
convergence in the psychotherapy dyad. Psychotherapy: Theory, Research, Practice,
Training [PsycARTICLES], 36(2), 123. doi:10.1037/0033-3204.36.2.123
Romans, White, Harrist, Boswell, Sims, & Murn. (2009). Predicting attrition from counseling
in a university counseling center sample using the OQ 45.2. Internet J. of Mental Health,
7(1).
Roos, J. (2011). Left behind: A review of therapist and process variables influencing drop out
from individual psychotherapy. PSYKOTERAPEUTPROGRAMMET, T6, VT. Stokholm
University, 1 – 24.
Sayre, S. L., Schmitz, J. M., Stotts, A. L., Averill, P. M., Rhoades, H. M., & Grabowski, J. J.
(2002). Determining predictors of attrition in an outpatient substance abuse program. The
American Journal of Drug and Alcohol Abuse, 28(1), 55-72. doi:10.1081/ADA-120001281
Schoenfeld, D. A. (1983). Sample-size formula for the proportional-hazards regression model.
Biometrics, 39, 2, 499-503.
Self, R., Oates, P., Pinnock-Hamilton, T. & Leach, C. (2010). The relationship between social
deprivation and unilateral termination (attrition) from psychotherapy at various stages of
the health care pathway. Psychology and Psychotherapy: Theory, Research, & Practice,
78(1), 95 – 111.

40
Shaw, J. (2014). Why ‘big data’ is a big deal: Information science promises to change the world.
Harvard Magazine, March-April, 30 – 35, 74 – 75.
Swift, J. K., & Greenberg, R. P. (2012). Premature discontinuation in adult psychotherapy: A
meta-analysis. Journal of Consulting and Clinical Psychology, 80(4), 547-559.
Thormählen, B., Weinryb, R.M., Norén, K., Vinnars, B., & Bagedahl-Strindlund. (2010). Patient
factors predicting dropout from supportive-expressive psychotherapy from patients with
personality disorders. Psychotherapy Research, 13(4), 493-509.
Vinnars, B., Barber, J. P., Noren, K., Gallop R., & Weinryb, R. M. (2005). Manualized
supportive expressive psychotherapy versus non-manualized community delivered
psychodynamic therapies for patients with personality disorders: bridging efficacy and
effectiveness. American Journal of Psychiatry, 162(10), 1933 – 40.
Warden, D., Rush, A. J., Wisniewski, S. R., Lesser, I. M., Thase, M. E., Balasubramani, G. K., et
al. (2009). Income and attrition in the treatment of depression: A STARD report. Depression
and Anxiety, 26(7), 622-633. doi:10.1002/da.20541
Whipple, J. L. Lambert, M. J., Vermeersch, D. A., Smart, D. W., Nielsen, S. L., & Hawkins, E. J.
(2003). Improving the effects of psychotherapy: The use of early identification of treatment
failure and problem solving strategies in routine practice. J. of Counseling Psychology,
50(1), 59 – 68.
Wierzbicki, M., & Pekarik, G. (1993). A meta-analysis of psychotherapy dropout. Professional
Psychology: Research and Practice, 24(2), 190-195. doi:10.1037/0735-7028.24.2.190