Embed Size (px)
Citation preview
ATWOOD OCEANICS, INC.
2007 ANNUAL REPORT

2007 ANNUAL REPORT TO SHAREHOLDERSTHE COMPANY
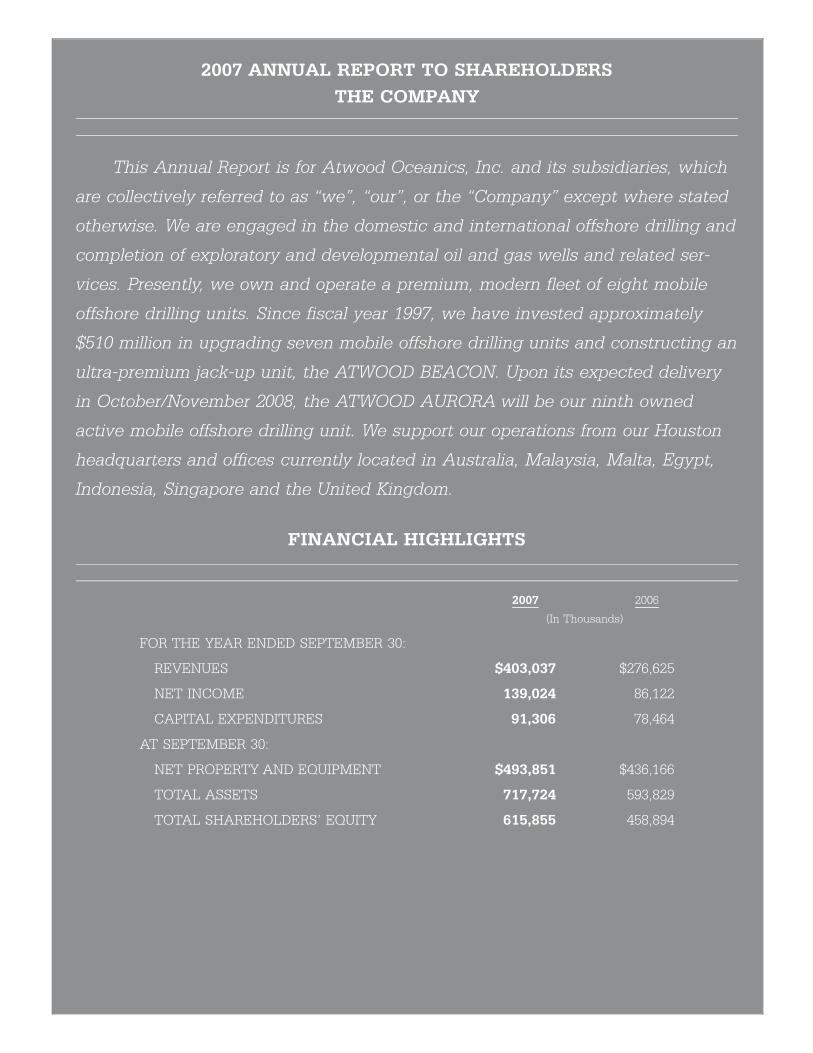
This Annual Report is for Atwood Oceanics, Inc. and its subsidiaries, which
are collectively referred to as “we”, “our”, or the “Company” except where stated
otherwise. We are engaged in the domestic and international offshore drilling and
completion of exploratory and developmental oil and gas wells and related ser-
vices. Presently, we own and operate a premium, modern fleet of eight mobile
offshore drilling units. Since fiscal year 1997, we have invested approximately
$510 million in upgrading seven mobile offshore drilling units and constructing an
ultra-premium jack-up unit, the ATWOOD BEACON. Upon its expected delivery
in October/November 2008, the ATWOOD AURORA will be our ninth owned
active mobile offshore drilling unit. We support our operations from our Houston
headquarters and offices currently located in Australia, Malaysia, Malta, Egypt,
Indonesia, Singapore and the United Kingdom.
FINANCIAL HIGHLIGHTS
2007 2006
(In Thousands)
FOR THE YEAR ENDED SEPTEMBER 30:
REVENUES $403,037 $276,625
NET INCOME 139,024 86,122
CAPITAL EXPENDITURES 91,306 78,464
AT SEPTEMBER 30:
NET PROPERTY AND EQUIPMENT $493,851 $436,166
TOTAL ASSETS 717,724 593,829
TOTAL SHAREHOLDERS’ EQUITY 615,855 458,894

2
0
60
120
180
240
300
360
420
2005 2006 200720042003
0
25
50
75
100
125
150
175
200
2005 200620042003 2007-15.0
0.5
16.0
31.5
47.0
62.5
78.0
93.5
109.0
124.5
140.0
2005 200620042003 2007
0
10
20
30
40
50
60
70
80
90
100
110
2005 200620042003 2007
CONTRACT REVENUES($ MILLIONS)
NET INCOME (LOSS)($ MILLIONS)
CAPITAL EXPENDITURES($ MILLIONS)
OPERATING INCOME($ MILLIONS)
TO OUR SHAREHOLDERS AND EMPLOYEES:
We are pleased to report that 2007 was another record fiscal year for the Company with notableachievements in many areas. Revenues, operating cash flows and net income for fiscal year 2007 were thehighest in our history. Our net income of $139 million, or $4.37 per diluted share, improved on our previousrecord net income of $86 million, or $2.74 per diluted share, for fiscal year 2006. Based upon our strongcurrent financial position and market outlook, we believe that continuing to pursue our current strategy willfurther enhance shareholder value in the future.
Our strategy focuses on safe, quality operations; premium equipment; meeting the needs of our clientsand being leveraged to attractive international markets. This strategy has served us well by enhancingshareholder value and continuing to guide our path forward. The Company is well-positioned for the futurewith a distinct strategy and position in the industry, particularly given our size.
Our existing fleet of eight owned operating units is working with key clients in some of the world’s mostattractive offshore markets. During the past fiscal year, we achieved fleet utilization of 100%. Our currentestimated contract backlog in terms of available rig days for our eight units is approximately 87% for fiscalyear 2008 and 33% for fiscal 2009. This backlog provides a combination of earnings visibility and futureearnings upside potential, particularly with our deepwater and international leverage. Our new ultra-premiumjack-up, the ATWOOD AURORA, now under construction in Brownsville, Texas, with expected delivery inOctober/November 2008, will offer growth potential when it commences operation as our ninth offshoredrilling unit.
We continue to strengthen our balance sheet and the Company currently has no outstanding term debt.In October 2007, we replaced our then existing credit agreement with a five-year $300 million revolving loanfacility. This new facility, which is on more favorable terms than our previous facility, will provide funding forfuture growth opportunities and for general corporate needs.
With our strong balance sheet and the likelihood of record cash flows and financial results, we expect tobe in a position to consider opportunities when the times are right. Based on longer-term expectations forenergy demand, the outlook for the markets we serve is positive, particularly our international deep watermarkets. Accordingly, we are working to identify and pursue value-enhancing growth opportunities as well asevaluating the best use of future cash flow. In considering growth opportunities, we want to remain leveragedto our international deepwater markets, particularly for conventionally moored semisubmersibles in the rangeof 6,000 to 8,000 feet of water supported by acceptable term contract opportunities. We estimate currentproject costs (including capitalized interest) of $550,000,000 to $600,000,000 to construct a new semi-submersible with the specifications to meet our clients’ future deepwater needs. Time for rig constructionwill put new rig delivery approximately four years after commitment.
Our international scope of activities means much to us, as does our involvement in many differentcommunities where we operate or maintain offices. Atwood Oceanics is proud of its long operating historyand reputation — and it’s long-standing relationships with clients. We owe much to the talent and contribu-tions of both our U.S. and international employees for our performance during 2007. Each day, our agendaemphasizes safe, high standards of performance, the value of our committed workforce and continueddevelopment of our organization for the future. We aspire to continue building our longer-term position as aleader in our industry.
We are grateful for our shareholders trust and the successes delivered by our talented and dedicatedmulti-national employees during fiscal year 2007.
JOHN R. IRWIN
3

4
RICHMOND
SEAHAWK
Corporate Headquarters
Office / Shorebase
Rig
Legend
C
Malta
Great
WORLD WIDE
* Rig locations are as of November 28, 2007.

5
ATWOOD EAGLE
VICKSBURG
ATWOOD FALCON
ATWOOD SOUTHERN CROSS
ATWOOD BEACON
Jakarta
Kuala Lumpur
Singapore
Perth
Cairo
t Yarmouth
ATWOOD HUNTER
OPERATIONS*

6
ATWOOD BEACON
The ATWOOD BEACON is currently workingoffshore India under a contract commitment
that extends to January 2009.
ATWOOD SOUTHERN CROSS
The ATWOOD SOUTHERNCROSS is currently working in the Black Sea. The pictureshows the rig under tow to the Black Sea from theMediterranean Sea. The rig is expected to move back to the Mediterranean Sea in Januuary 2008.

7
ATWOOD FALCON
The ATWOOD FALCON is currently working offshore Malaysia under a contract commitment that extends to July 2009.

Atwood Oceanics, Inc. and Subsidiaries
FIVE YEAR FINANCIAL REVIEW
(In thousands, except per share amounts, fleetdata and ratios) 2007 2006 2005 2004 2003
At or For the Years Ended September 30,
STATEMENTS OF OPERATIONS DATA:Revenues. . . . . . . . . . . . . . . . . . . . . . . . . . . . $ 403,037 $ 276,625 $ 176,156 $163,454 $144,765
Contract drilling costs . . . . . . . . . . . . . . . . . (186,949) (144,366) (102,849) (98,936) (98,500)
Depreciation . . . . . . . . . . . . . . . . . . . . . . . . . (33,366) (26,401) (26,735) (31,582) (25,758)
General and administrative expenses . . . . . (23,929) (20,630) (14,245) (11,389) (14,015)
Gain on sale of equipment . . . . . . . . . . . . . . 414 10,548 — — —
OPERATING INCOME . . . . . . . . . . . . . . . . . 159,207 95,776 32,327 21,547 6,492
Other (expense) income . . . . . . . . . . . . . . . . 752 (3,940) (6,719) (9,145) (4,856)
Tax (provision) benefit . . . . . . . . . . . . . . . . . (20,935) (5,714) 403 (4,815) (14,438)
NET INCOME (LOSS) . . . . . . . . . . . . . . . . $ 139,024 $ 86,122 $ 26,011 $ 7,587 $ (12,802)
PER SHARE DATA:Earnings (loss) per common share:
Basic . . . . . . . . . . . . . . . . . . . . . . . . . . . . . $ 4.44 $ 2.78 $ 0.86 $ 0.27 $ (0.46)
Diluted . . . . . . . . . . . . . . . . . . . . . . . . . . . . $ 4.37 $ 2.74 $ 0.83 $ 0.27 $ (0.46)
Average common shares outstanding:
Basic . . . . . . . . . . . . . . . . . . . . . . . . . . . . . 31,343 30,936 30,412 27,718 27,692
Diluted . . . . . . . . . . . . . . . . . . . . . . . . . . . . 31,814 31,442 31,220 28,064 27,692
FLEET DATA:Number of rigs owned or managed, at end
of period . . . . . . . . . . . . . . . . . . . . . . . . . . 8 10 11 11 11
Utilization rate for in-service rigs(1) . . . . . . . 100% 100% 98% 93% 92%
BALANCE SHEET DATA:Cash and cash equivalents. . . . . . . . . . . . . . $ 100,361 $ 32,276 $ 18,982 $ 16,416 $ 21,551
Working capital . . . . . . . . . . . . . . . . . . . . . . . 158,549 86,308 35,894 32,913 26,063
Net property and equipment . . . . . . . . . . . . 493,851 436,166 390,778 401,141 443,102
Total assets . . . . . . . . . . . . . . . . . . . . . . . . . . 717,724 593,829 495,694 498,936 522,674
Total long-term debt (including currentportion) . . . . . . . . . . . . . . . . . . . . . . . . . . . 18,000 64,000 90,000 181,000 205,000
Shareholders’ equity(2)(3) . . . . . . . . . . . . . . . 615,855 458,894 362,137 271,589 263,467
Ratio of current assets to currentliabilities . . . . . . . . . . . . . . . . . . . . . . . . . . 3.75 2.41 1.64 1.55 1.52
Notes —(1) Excludes managed rigs, the SEASCOUT (sold in fiscal year 2006), and contractual downtime
on rigs upgraded.
(2) We have never paid any cash dividends on our common stock.
(3) In October 2004, we sold 2,350,000 shares of common stock in a public offering.
8

OF
FS
HO
RE
DR
ILL
ING
OP
ER
AT
ION
S
Rig
Nam
eY
ear
Up
gra
ded
Max
imu
mW
ater
Dep
th
Per
cen
tag
eof
FY
2007
Rev
enu
es(1
)
Loc
atio
nat
Nov
emb
er27
,20
07C
ust
omer
Con
trac
tS
tatu
sat
Nov
emb
er27
,20
07
SE
MIS
UB
ME
RS
IBL
ES
—
AT
WO
OD
EA
GL
E20
00/2
002
5,00
0F
t.14
%O
ffsh
ore
Au
stra
liaB
HP
BIL
LIT
ON
PE
TR
OL
EU
MP
TY
(“B
HP
B”)
Th
eri
gis
curr
entl
yw
orki
ng
un
der
ad
rilli
ng
pro
gra
mfo
rB
HP
Bw
hic
his
exp
ecte
dto
exte
nd
toM
ay20
08.
Up
onco
mp
leti
onof
this
dri
llin
gco
mm
itm
ent,
the
rig
has
aon
e(1
)w
ellc
ontr
act
com
mit
men
tw
ith
EN
IA
ust
ralia
BV,
follo
wed
by
atw
o(2
)ye
arco
ntr
act
com
mit
men
tw
ith
Woo
dsi
de
En
erg
y,L
td(“
Woo
dsi
de”
).It
shou
ldta
keu
nti
lJu
ne/
July
2010
bef
ore
thes
ed
rilli
ng
com
mit
men
tsar
eco
mp
lete
d.
AT
WO
OD
HU
NT
ER
1997
/200
15,
000
Ft.
21%
Off
shor
eE
gyp
tB
UR
UL
LU
SG
AS
CO
.(“
BU
RU
LL
US
”)
Th
eri
gis
curr
entl
yw
orki
ng
un
der
ad
rilli
ng
pro
gra
mfo
rB
uru
llus
wh
ich
shou
ldta
keu
nti
lmid
Dec
emb
er20
07to
com
ple
te.
Fol
low
ing
the
com
ple
tion
ofth
eB
uru
llus
con
trac
t,th
eri
gw
illb
em
oved
toa
ship
yard
inM
alta
tou
nd
erg
oan
esti
mat
ed20
day
equ
ipm
ent
up
gra
de
and
will
then
mov
eto
Mau
rita
nia
toco
mp
lete
the
pre
viou
sly
susp
end
edW
ood
sid
eco
ntr
act
wh
ich
shou
ldex
ten
dto
July
2008
.
AT
WO
OD
FAL
CO
N19
98/2
006
5,00
0F
t.13
%O
ffsh
ore
Mal
aysi
aS
AR
AW
AK
SH
EL
LB
ER
HA
D(“
SH
EL
L”)
Th
eri
gis
curr
entl
yw
orki
ng
un
der
alo
ng
-ter
md
rilli
ng
com
mit
men
tw
ith
Sh
ellw
hic
hex
ten
ds
toJu
ly20
09.
AT
WO
OD
SO
UT
HE
RN
CR
OS
S19
97/2
006
2,00
0F
t.15
%O
ffsh
ore
Bu
lgar
iaan
dTu
rkey
ME
LR
OS
ER
ES
OU
RC
ES
(“M
EL
RO
SE
”)A
ND
TU
RK
IYE
PE
TR
OL
LE
RI
A.O
.(“
TPA
O”)
Th
eri
gis
curr
entl
yw
orki
ng
un
der
dri
llin
gco
mm
itm
ents
wit
hM
elro
sean
dT
PAO
wh
ich
shou
ldta
keu
nti
lFeb
ruar
y20
08to
com
ple
te.
Up
onco
mp
leti
onof
this
com
mit
men
t,th
eri
gh
asa
con
trac
tco
mm
itm
ent
wit
hE
NI
Sp
aA
GIP
Exp
lora
tion
&P
rod
uct
ion
Div
isio
nto
dri
lltw
o(2
)fi
rmw
ells
plu
stw
o(2
)op
tion
wel
lsw
hic
hsh
ould
take
app
roxi
mat
ely
six
mon
ths
toco
mp
lete
ifb
oth
opti
onw
ells
are
dri
lled
.
CA
NT
ILE
VE
RJA
CK
-UP
S—
AT
WO
OD
BE
AC
ON
Con
stru
cted
in20
0340
0F
t.10
%O
ffsh
ore
Ind
iaG
UJA
RA
TS
TAT
EP
ET
RO
LE
UM
CO
RP
OR
AT
ION
LTD
.(“
GS
PC
”)
Th
eri
gis
curr
entl
yw
orki
ng
un
der
ad
rilli
ng
com
mit
men
tfo
rG
SP
Cw
hic
hex
ten
ds
toJa
nu
ary
2009
.
VIC
KS
BU
RG
1998
300
Ft.
10%
Off
shor
eT
hai
lan
dC
HE
VR
ON
OV
ER
SE
AS
PE
TR
OL
EU
M(“
CH
EV
RO
N”)
Th
eri
gis
curr
entl
yw
orki
ng
un
der
ad
rilli
ng
com
mit
men
tfo
rC
hev
ron
wh
ich
exte
nd
sto
Jun
e20
09.
AT
WO
OD
AU
RO
RA
Un
der
Con
stru
ctio
n35
0F
t.0%
N/A
N/A
Th
eri
gis
un
der
con
stru
ctio
nin
Bro
wn
svill
e,Te
xas
wit
hex
pec
ted
del
iver
yin
Oct
ober
/Nov
emb
er20
08.
SU
BM
ER
SIB
LE
—
RIC
HM
ON
D20
00/2
002/
2007
70F
t.7%
Sh
ipya
rdH
EL
ISO
IL&
GA
S(“
HE
LIS
”)
Th
eri
gis
curr
entl
yin
ash
ipya
rdin
Mis
siss
ipp
iu
nd
erg
oin
ga
life
enh
ance
men
tu
pg
rad
e,w
hic
his
exp
ecte
dto
be
com
ple
ted
inD
ecem
ber
2007
.T
he
rig
has
one
(1)r
emai
nin
gw
ellt
od
rill
for
Hel
is.
9

Rig
Nam
eY
ear
Up
gra
ded
Max
imu
mW
ater
Dep
th
Per
cen
tag
eof
FY
2007
Rev
enu
es(1
)
Loc
atio
nat
Nov
emb
er27
,20
07C
ust
omer
Con
trac
tS
tatu
sat
Nov
emb
er27
,20
07
SE
MIS
UB
ME
RS
IBL
ET
EN
DE
RA
SS
IST
UN
IT—
SE
AH
AW
K19
92/1
999/
2006
600
Ft.
8%O
ffsh
ore
Eq
uat
oria
lG
uin
ea
AM
ER
AD
AH
ES
SE
QU
AT
OR
IAL
GU
INE
A,
INC
.(“
HE
SS
”)
Th
eri
gis
curr
entl
yw
orki
ng
un
der
aco
ntr
actu
alco
mm
itm
ent
wit
hH
ess
wh
ich
exte
nd
sto
Sep
tem
ber
2008
.H
ess
also
has
fou
r(4
)si
x-m
onth
opti
ons.
(1)
Per
cen
tag
esd
on
otad
dto
100%
asth
eta
ble
doe
sn
otin
clu
de
2%of
fisc
alye
ar20
07re
ven
ues
earn
edp
urs
uan
tto
our
Au
stra
liaM
anag
emen
tC
ontr
acts
pri
orto
thei
rte
rmin
atio
nd
uri
ng
fisc
alye
ar20
07.
10

SECURITIES LITIGATION SAFE HARBOR STATEMENT
Statements included in this report which arenot historical facts (including any statementsconcerning plans and objectives of managementfor future operations or economic performance, orassumptions related thereto) are “forward-lookingstatements” within the meaning of the PrivateSecurities Litigation Reform Act of 1995. In addi-tion, we and our representatives may from totime to time make other oral or written state-ments which are also forward-looking statements.
These forward-looking statements are madebased upon management’s current plans, expec-tations, estimates, assumptions and beliefs con-cerning future events impacting us and thereforeinvolve a number of risks and uncertainties. Wecaution that forward-looking statements are notguarantees and that actual results could differmaterially from those expressed or implied in theforward-looking statements.
Important factors that could cause our actualresults of operations or our actual financial condi-tions to differ include, but are not necessarilylimited to:
• our dependence on the oil and gasindustry;
• the operational risks involved in drilling foroil and gas;
• changes in rig utilization and dayrates inresponse to the level of activity in the oiland gas industry, which is significantlyaffected by indications and expectationsregarding the level and volatility of oil andgas prices, which in turn are affected bysuch things as political, economic andweather conditions affecting or potentiallyaffecting regional or worldwide demandfor oil and gas, actions or anticipatedactions by OPEC, inventory levels, deliver-ability constraints, and future marketactivity;
• the extent to which customers and poten-tial customers continue to pursue deepwa-ter drilling;
• exploration success or lack of explorationsuccess by our customers and potentialcustomers;
• the highly competitive and cyclical natureof our business, with periods of lowdemand and excess rig availability;
• the impact of the war with Iraq or othermilitary operations, terrorist acts or embar-goes elsewhere;
• our ability to enter into and the terms offuture drilling contracts;
• the availability of qualified personnel;
• our failure to retain the business of one ormore significant customers;
• the termination or renegotiation of con-tracts by customers;
• the availability of adequate insurance at areasonable cost;
• the occurrence of an uninsured loss;
• the risks of international operations,including possible economic, political,social or monetary instability, and compli-ance with foreign laws;
• the effect public health concerns couldhave on our international operations andfinancial results;
• compliance with or breach of environmen-tal laws;
• the incurrence of secured debt or addi-tional unsecured indebtedness or otherobligations by us or our subsidiaries;
• the adequacy of sources of liquidity;
• currently unknown rig repair needs and/oradditional opportunities to accelerateplanned maintenance expenditures due topresently unanticipated rig downtime;
• higher than anticipated accruals for perfor-mance-based compensation due to betterthan anticipated performance by us,higher than anticipated severance
11
expenses due to unanticipated employeeterminations, higher than anticipated legaland accounting fees due to unanticipatedfinancing or other corporate transactions,and other factors that could increase gen-eral and administrative expenses;
• the actions of our competitors in the off-shore drilling industry, which could signif-icantly influence rig dayrates andutilization;
• changes in the geographic areas in whichour customers plan to operate, which inturn could change our expected effectivetax rate;
• changes in oil and gas drilling technologyor in our competitors’ drilling rig fleetsthat could make our drilling rigs less com-petitive or require major capital invest-ments to keep them competitive;
• rig availability;
• the effects and uncertainties of legal andadministrative proceedings and othercontingencies;
• the impact of governmental laws and reg-ulations and the uncertainties involved intheir administration, particularly in someforeign jurisdictions;
• changes in accepted interpretations ofaccounting guidelines and other account-ing pronouncements and tax laws;
• the risks involved in the construction,upgrade, and repair of our drillingunits; and
• such other factors as may be discussed inour reports filed with the Securities andExchange Commission, or SEC.
These factors are not necessarily all of theimportant factors that could cause actual resultsto differ materially from those expressed in any ofour forward-looking statements. Other unknownor unpredictable factors could also have materialadverse effects on future results. The words“believe,” “impact,” “intend,” “estimate,” “antici-pate,” “plan” and similar expressions identify for-ward-looking statements. These forward-lookingstatements are found at various places through-out this report. When considering any forward-looking statement, you should also keep in mindthe risk factors described in our Form 10-K forthe year ended September 30, 2007, particularlyin Item 1A Risk Factors, to which this AnnualReport is an exhibit, and in other reports orfilings we make with the SEC from time to time.Undue reliance should not be placed on theseforward-looking statements, which are applicableonly on the date hereof. Neither we nor ourrepresentatives have a general obligation torevise or update these forward-looking state-ments to reflect events or circumstances thatarise after the date hereof or to reflect the occur-rence of unanticipated events.
12

MANAGEMENT’S DISCUSSION AND ANALYSISOF FINANCIAL CONDITION AND RESULTS OF OPERATIONS
MARKET OUTLOOK
Revenues, operating cash flows and netincome for fiscal year 2007 were the highest inour history. Currently, we have approximately87% of our available rig days contracted for fiscalyear 2008. A comparison of the average per dayrevenues for fiscal year 2007 and 2006 for each ofour eight active drilling units to their highestcurrently contracted dayrate commitment is asfollows:
FiscalYear2006
FiscalYear2007
CurrentHighest
ContractedDayrate
Commitment(1)
PercentageChange
from FiscalYear 2007to HighestCurrently
ContractedDayrate
Commitment
Average Per DayRevenues(1)
ATWOOD EAGLE . . . $129,000 $160,000 $405,000 153%ATWOOD HUNTER . . 172,000 234,000 240,000 3%ATWOOD FALCON . . 83,000 138,000 187,000(2) 36%ATWOOD SOUTHERN
CROSS . . . . . . . . 82,000 171,000 380,000 122%ATWOOD BEACON . . 88,000 109,000 133,500 22%VICKSBURG. . . . . . . 82,000 110,000 154,000 40%SEAHAWK . . . . . . . 32,000 84,000 93,000(3) 11%RICHMOND . . . . . . . 55,000 81,000 80,000 —
(1) Average per day revenues include dayrate andservice revenues and amortized deferred feeswhile the highest currently contracted dayratecommitment includes estimated amortizeddeferred fees where noted.
(2) At a certain water depth, the dayrate wouldincrease to $200,000; however we currentlyexpect most, if not all, work will be at the$160,000 dayrate level which, with estimatedamortized deferred fees of $27,000 per dayresults in the commitment amount of $187,000.
(3) Includes estimated amortized deferred fees of$17,000 per day.
With our backlog of contracted days atincreasing rates on a fleetwide basis, we antici-pate that revenues, operating cash flows andearnings for fiscal year 2008 will reflect a
significant improvement over fiscal year 2007operating results and thus, would be the highestin our history. In addition, our balance sheetcontinues to strengthen with no outstandingterm debt as of November 27, 2007.
In October 2007, we entered into a new5-year $300,000,000 non-amortizing revolvingcredit facility. This new facility will provide fund-ing for future growth opportunities and for gen-eral corporate cash needs. We believe we are in aposition to be opportunistic when the time isright, and accordingly, we continue to pursueand explore various growth opportunities. Inaddition to our ultra premium jack-up, ATWOODAURORA, currently under construction inBrownsville, Texas, with an expected deliverydate in October/November 2008 at a total cost(including capitalized interest) of approximately$160 million, we are interested in expanding oursemisubmersible fleet if we can identify accept-able term contract opportunities. We estimatetotal costs (including capitalized interest) to con-struct a conventionally moored semisubmersibledrilling unit with a maximum water depth capa-bility of 6,000 to 8,000 feet would range from$550 million to $600 million and take approxi-mately four years to construct.
Besides focusing on new growth, we alsoremain focused on increasing the backlog of ourexisting drilling units at dayrates that providegood returns on our investments. The ATWOODEAGLE is currently working under a contractualcommitment offshore Australia at dayrates rang-ing from $160,000 to $170,000 which couldextend to May 2008. Following completion of thiscontract commitment, the rig will drill one well ata dayrate of $360,000 (estimated to take 45 daysto complete) and then commence a two-yearcontract commitment (estimated June/July2008) at a dayrate of $405,000. Immediately fol-lowing the current contract commitment offshoreEgypt that should extend until mid December2007, the ATWOOD HUNTER will be moved to a
13
shipyard in Malta to undergo an estimated 20 dayequipment upgrade and will then move to Mauri-tania to complete the previously suspendedWoodside contract at a dayrate of $240,000,which should extend to July 2008; however, thecontract term can be extended up to one addi-tional year subject to agreement on dayrate. TheATWOOD FALCON has a contractual commit-ment, which extends to July 2009, offshoreMalaysia at a current dayrate of $160,000 (over acertain water depth the dayrate will be $200,000;however, we believe that most, if not all, wellsdrilled will be at the $160,000 dayrate level). TheATWOOD SOUTHERN CROSS is currently work-ing in the Black Sea under contract commitmentswhich should extend to December 2007 or Janu-ary 2008 at dayrate levels ranging from $145,000to $380,000. Following completion of the BlackSea commitments, the rig will drill one well at adayrate of $320,000 in the Mediterranean Sea.Upon completion of the Mediterranean Sea well,the rig has a commitment to work offshore Italyfor two firm wells plus two option wells at adayrate of $406,000 which should take approxi-mately six months to complete if both optionwells are drilled. The ATWOOD BEACON is cur-rently working offshore India under contract com-mitments that extend to January 2009 atdayrates ranging from $113,000 to $133,500. TheVICKSBURG has a contract commitment offshoreThailand at a dayrate of $154,000 that extends toJune 2009. The SEAHAWK is working offshoreWest Africa under a drilling contract that extendsto September 2008; however, this contract pro-vides for four six-month options at the currentcontracted dayrate plus certain cost escalations.The rig’s current dayrate is approximately$76,000, which with amortized deferred fees of$17,000 per day results in the total daily revenuesof $93,000. Our only rig in the U.S. Gulf of Mex-ico, the RICHMOND, is currently in a shipyardundergoing an approximate $14 million lifeenhancing upgrade, which is expected to becompleted in mid December 2007. Following theshipyard work, the RICHMOND has one well to
drill at a dayrate of $80,000. The RICHMOND hasbeen 100% utilized in the Gulf of Mexico formany years and we expect high utilization of thisrig during fiscal year 2008; however, we currentlyexpect the rig’s dayrate to decline from $80,000to the mid to high $60,000’s.
The continuing strong market environmentis not only supporting high equipment utilizationwith historically high dayrates, but also continuesto reflect increasing operating costs. Total drillingcosts for fiscal year 2007 ($187 million) comparedto fiscal year 2006 ($144 million) increased 29%;however, a significant portion of this increase isattributable to higher than anticipated operatingcosts for the SEAHAWK while working in WestAfrica during the current fiscal year compared tothe prior fiscal year when the SEAHAWKincurred lower operating costs as the rig was idleapproximately five months while undergoing anupgrade and relocating to West Africa. Despiteour operating results for fiscal year 2007 beingthe highest in our history, operating costs on theSEAHAWK during the current fiscal yearexceeded revenues on that rig by approximately$4 million. We expect to incur operating costs forthis rig in excess of revenue in the range of $1 to$2 million in fiscal year 2008. We currently expecta 10% to 12% fleetwide increase in total drillingcosts for fiscal year 2008 compared to fiscal year2007.
In addition to the estimated 70 days and20 days of zero rate time to be incurred by theRICHMOND and the ATWOOD HUNTER, respec-tively, during the first quarter of fiscal year 2008while undergoing their upgrades, we expect thefollowing drilling units to incur planned zero ratetime during fiscal year 2008:
ATWOOD EAGLE 15 days of zero rate timeduring the first quarter forrequired regulatoryinspections andmaintenance
14

ATWOOD FALCON 5 to 10 zero rate days dur-ing the fourth quarter forrequired regulatoryinspections and mainte-nance; however, this zerorate period could beincurred during the firstquarter of fiscal year 2009
ATWOODSOUTHERN CROSS 4 to 10 zero rate days dur-
ing the second quarter forsome maintenance work
ATWOOD BEACON 3 zero rate days duringthe second quarter forrequired inspections
In addition to the above planned zero ratedays that could be incurred during fiscal year2008, unplanned zero rate days can occur at anytime. In recent fiscal years, we have incurredapproximately 1% to 2% of unplanned zero ratedays per year, however, we have already incurred16 zero rate days and 3 zero rate days on theSEAHAWK and ATWOOD HUNTER, respectively,due to unplanned equipment downtime duringthe first quarter of fiscal year 2008 throughNovember 27, 2007.
Despite increasing drilling costs, plannedzero rate time and the continuing risk ofunplanned zero rate time, we expect operatingresults for fiscal year 2008 will reflect significantimprovement over fiscal year 2007 results andassuming no new growth, we could end fiscalyear 2008 with increased cash and no outstand-ing term debt. With our strong balance sheet andcontinuing trend for improvement in cash flowsand financial results at historic levels, we remainfocused on identifying value enhancing growthopportunities, as well as evaluating the best useof future cash flows. We remain optimistic thatwe will identify one or more growth opportunitiesduring fiscal year 2008, with required funding tobe supported by our new $300 million creditfacility and internally generated funds.
RESULTS OF OPERATIONS
Fiscal Year 2007 Versus Fiscal Year 2006
Revenues for fiscal year 2007 increased 46%compared to the prior fiscal year. A comparativeanalysis of revenues by rig for fiscal years 2007and 2006 is as follows:
FiscalYear 2007
FiscalYear 2006 Variance
REVENUES(In millions)
ATWOOD SOUTHERNCROSS . . . . . . . . . . . . . . . $ 62.3 $ 29.9 $ 32.4
ATWOOD HUNTER . . . . . . . 85.4 62.8 22.6ATWOOD FALCON . . . . . . . . 50.5 30.1 20.4SEAHAWK . . . . . . . . . . . . . . 30.6 11.6 19.0ATWOOD EAGLE . . . . . . . . . 58.4 47.0 11.4VICKSBURG . . . . . . . . . . . . . 40.0 30.0 10.0RICHMOND . . . . . . . . . . . . . 29.5 20.2 9.3ATWOOD BEACON . . . . . . . 39.8 32.1 7.7AUSTRALIA MANAGEMENT
CONTRACTS . . . . . . . . . . 6.5 12.9 (6.4)
$403.0 $276.6 $126.4
The increase in fleetwide revenues duringfiscal year 2007 when compared to fiscal year2006 is primarily attributable to the increase inaverage dayrates due to improving market condi-tions and strong demand for offshore drillingequipment as noted in Market Outlook. Increasesin revenues for the ATWOOD SOUTHERNCROSS, ATWOOD HUNTER, ATWOOD FALCON,SEAHAWK, ATWOOD EAGLE, VICKSBURG,RICHMOND, and the ATWOOD BEACON wererelated to each of these drilling units workingunder higher dayrate contracts during the currentfiscal year compared to the prior fiscal year. Inaddition, for approximately five months of fiscalyear 2006, the SEAHAWK earned virtually norevenue as the rig was in a shipyard undergoinga life-enhancing upgrade and then relocated toWest Africa. Revenue for the AUSTRALIA MAN-AGEMENT CONTRACTS was lower for the cur-rent fiscal year when compared to the prior fiscalyear due to decreased activity as the most recentdrilling program was completed at the end of thefirst quarter of fiscal year 2007 with the
15

management contracts terminating during thethird quarter of fiscal year 2007.
Contract drilling costs for fiscal year 2007increased 29% compared to the prior fiscal year.A comparative analysis of contract drilling costsby rig for fiscal years 2007 and 2006 is as follows:
FiscalYear 2007
FiscalYear 2006 Variance
CONTRACT DRILLING COSTS(In millions)
SEAHAWK . . . . . . . . . . . . . . $ 28.2 $ 8.4 $19.8ATWOOD EAGLE . . . . . . . . . 35.0 26.8 8.2ATWOOD FALCON . . . . . . . . 23.6 16.5 7.1ATWOOD HUNTER . . . . . . . . 25.2 18.8 6.4ATWOOD BEACON. . . . . . . . 15.5 10.4 5.1RICHMOND . . . . . . . . . . . . . 13.1 10.4 2.7VICKSBURG . . . . . . . . . . . . . 14.0 11.9 2.1ATWOOD SOUTHERN
CROSS . . . . . . . . . . . . . . . 20.7 24.2 (3.5)AUSTRALIA MANAGEMENT
CONTRACTS . . . . . . . . . . 5.1 10.8 (5.7)OTHER. . . . . . . . . . . . . . . . . 6.5 6.2 0.3
$186.9 $144.4 $42.5
On a fleetwide basis, wage increases andextra personnel for training and developmenthave resulted in higher personnel costs duringfiscal year 2007 for virtually every rig when com-pared to the prior fiscal year. With the SEAHAWKand ATWOOD HUNTER currently working off-shore West and North Africa, respectively, bothrigs have experienced increased travel, freightand shorebase costs due to higher transportationand living expenses in West and North Africa.Contract drilling costs for the SEAHAWK alsoreflect amortization of approximately $5.1 millionof deferred expenses during fiscal year 2007 com-pared to $0.9 million during fiscal year 2006. Inaddition, as previously noted, the SEAHAWKincurred significantly less operating costs forapproximately five months of the prior fiscal yearas the rig was in a shipyard undergoing a lifeenhancing upgrade and then relocated to WestAfrica. The ATWOOD HUNTER incurred addi-tional maintenance costs during a planned regu-latory inspection period in December 2006. Inaddition to the rising personnel costs mentioned
above, the ATWOOD EAGLE and RICHMONDincurred higher maintenance costs during fiscalyear 2007 due to the amount and timing ofcertain maintenance projects when compared tothe prior fiscal year. The increase in drilling costsfor the ATWOOD FALCON is primarily attribut-able to planned maintenance during its waterdepth upgrade which was completed during thefirst quarter of the current fiscal year. TheATWOOD BEACON has experienced highermaintenance costs in the current fiscal year as itwas in a Singapore shipyard having its last legsections reattached during the first quarter offiscal year 2007. Drilling costs for the VICKSBURGhave remained relatively consistent other thanhigher personnel costs. Current fiscal year con-tract drilling costs for the ATWOOD SOUTHERNCROSS have decreased primarily due to $8.6 mil-lion of mobilization expense amortization duringthe prior fiscal year compared to none during thecurrent fiscal year. AUSTRALIA MANAGEMENTCONTRACTS costs have decreased due to thedecreased activity resulting from the completionof the current drilling program at the end of thefirst quarter of the current fiscal year and termi-nation of the contracts during the third quarter offiscal year 2007. Other drilling costs were rela-tively consistent with the prior fiscal year.
16

Depreciation expense for fiscal year 2007increased 27% as compared to the prior fiscalyear. A comparative analysis of depreciationexpense by rig for fiscal years 2007 and 2006 isas follows:
FiscalYear 2007
FiscalYear 2006 Variance
DEPRECIATION EXPENSE(In millions)
SEAHAWK . . . . . . . . . $ 6.1 $ 1.6 $ 4.5ATWOOD FALCON . . . 4.4 2.8 1.6ATWOOD SOUTHERN
CROSS . . . . . . . . . . 3.4 2.9 0.5ATWOOD HUNTER. . . 5.7 5.4 0.3VICKSBURG . . . . . . . . 2.9 2.8 0.1RICHMOND . . . . . . . . 1.0 0.9 0.1ATWOOD EAGLE . . . . 4.5 4.6 (0.1)ATWOOD BEACON . . 5.1 5.3 (0.2)OTHER. . . . . . . . . . . . 0.3 0.1 0.2
$33.4 $26.4 $ 7.0
Depreciation expense increased for the SEA-HAWK, ATWOOD FALCON and ATWOODSOUTHERN CROSS as these rigs have recentlyundergone upgrades during the current and priorfiscal years, while depreciation expense for allother rigs has remained relatively consistent withthe prior fiscal year. The SEAHAWK was almostfully depreciated prior to its upgrade; accordingly,ongoing depreciation expense will approximatefiscal year 2007 levels.
General and administrative expenses for thecurrent fiscal year increased compared to theprior fiscal year primarily due to rising personnelcosts and additions to the corporate staff. Thefiscal year 2007 increase also includes an approx-imate $0.7 million increase in annual bonus com-pensation over the prior fiscal year. The decreasein the gain on sale of equipment reflects the saleof our semisubmersible hull, SEASCOUT, for$10 million (net after certain expenses) and ourspare 15,000 P.S.I. BOP Stack for approximately$15 million for a gain of approximately $10.1 mil-lion in the prior fiscal year compared to a gain onsale of equipment of $0.4 million during thecurrent fiscal year. Interest expense has
decreased during the current year primarily dueto the reduction of our outstanding debt and dueto $2.6 million of capitalized interest chargesrelated to the construction of the ATWOODAURORA during fiscal year 2007 compared toonly $1.1 million during fiscal year 2006. Interestincome has increased when compared to theprior fiscal year due to interest earned on highercash balances.
Virtually all of our tax provision for fiscal year2007 relates to taxes in foreign jurisdictions.Accordingly, due to the high level of operatingincome earned in certain nontaxable and deemedprofit tax jurisdictions during both the currentand prior fiscal years, our effective tax rate forthese periods was significantly less than theUnited States federal statutory rate. In addition,during the prior fiscal year, we reversed a$1.8 million tax contingent liability due to theexpiration of the statute of limitations in a foreignjurisdiction and recognized a $4.6 million taxbenefit due to the acceptance of certain amendedprior year tax returns by a foreign tax authority,both of which contributed to the low effective taxrates in the prior fiscal year.
During July 2007, we were notified by theMalaysian tax authorities regarding a potentialproposed adjustment relating to fiscal years 2000to 2003. Although we believe we are in compli-ance with applicable rules and regulations, weare currently evaluating the merit of the asser-tions by the Malaysian tax authorities and cur-rently plan to vigorously contest these assertions.While we cannot predict or provide assurance asto the final outcome of these allegations, we donot expect them to have a material adverse effecton our consolidated financial position, results ofoperations or cash flows.
17

Fiscal Year 2006 Versus Fiscal Year 2005
Revenues for fiscal year 2006 increased 57%compared to the prior fiscal year. A comparativeanalysis of revenues by rig for fiscal years 2006and 2005 is as follows:
FiscalYear 2006
FiscalYear 2005 Variance
REVENUES(In millions)
ATWOOD HUNTER . . . . . . . . $ 62.8 $ 22.1 $ 40.7ATWOOD SOUTHERN
CROSS . . . . . . . . . . . . . . . 29.9 10.8 19.1ATWOOD EAGLE . . . . . . . . . 47.0 34.6 12.4RICHMOND . . . . . . . . . . . . . 20.2 11.9 8.3ATWOOD BEACON. . . . . . . . 32.1 24.2 7.9AUSTRALIA MANAGEMENT
CONTRACTS . . . . . . . . . . 12.9 5.2 7.7VICKSBURG . . . . . . . . . . . . . 30.0 23.6 6.4ATWOOD FALCON . . . . . . . . 30.1 29.8 0.3SEAHAWK . . . . . . . . . . . . . . 11.6 13.9 (2.3)
$276.6 $176.1 $100.5
The increase in fleetwide revenues is prima-rily attributable to the increase in average day-rates due to improving market conditions andstrong demand for offshore drilling equipment asnoted in Market Outlook. Unless otherwise notedbelow, the increase in revenues for each rig isdue to the increases in contractual dayrates infiscal year 2006 compared to fiscal year 2005.
During the last quarter of fiscal year 2005,the ATWOOD SOUTHERN CROSS was relocatedfrom Southeast Asia to the Mediterranean Seawith no revenues being realized during this relo-cation period. This relocation resulted in earnedmobilization fees for the ATWOOD SOUTHERNCROSS increasing from $0.8 million in fiscal year2005 to $8.1 million in fiscal year 2006, which,along with increases in contracted dayratesaccounts for its increase in revenues. Increasesin revenues for the ATWOOD HUNTER,ATWOOD EAGLE, VICKSBURG, ATWOOD BEA-CON, ATWOOD FALCON and the RICHMONDwere related to each of these drilling units work-ing under higher dayrate contracts in fiscal year2006 compared to fiscal year 2005. The increase
in revenues from the AUSTRALIA MANAGE-MENT CONTRACTS was due to one of thesemanaged rigs returning to active drilling. Thedecline in revenues for the SEAHAWK was dueto the unit being upgraded in fiscal year 2006,with no revenues being realized during thisupgrade period.
Contract drilling costs for fiscal year 2006increased 40% compared to the prior fiscal year.A comparative analysis of contract drilling costsby rig for fiscal years 2006 and 2005 is as follows:
FiscalYear 2006
FiscalYear 2005 Variance
(In millions)CONTRACT DRILLING COSTS
ATWOOD SOUTHERNCROSS . . . . . . . . . . . . . . . $ 24.2 $ 9.1 $15.1
ATWOOD HUNTER . . . . . . . . 18.8 11.9 6.9AUSTRALIA MANAGEMENT
CONTRACTS . . . . . . . . . . 10.8 4.7 6.1ATWOOD EAGLE . . . . . . . . . 26.8 21.9 4.9VICKSBURG . . . . . . . . . . . . . 11.9 8.8 3.1ATWOOD BEACON. . . . . . . . 10.4 8.5 1.9ATWOOD FALCON . . . . . . . . 16.5 14.6 1.9RICHMOND . . . . . . . . . . . . . 10.4 8.9 1.5SEAHAWK . . . . . . . . . . . . . . 8.4 9.9 (1.5)OTHER. . . . . . . . . . . . . . . . . 6.2 4.5 1.7
$144.4 $102.8 $41.6
The increase in fleetwide drilling costs wasprimarily attributable to the following areas: ris-ing personnel costs due to wage increases,increased repairs and maintenance expenses andfreight costs due to the amount and timing ofvarious repairs and maintenance projects andequipment enhancements, and rising insurancecosts due to increased premiums. Unless other-wise noted below, the increase in drilling costsfor each rig is primarily due to the areas men-tioned above.
Besides the four areas discussed above, theincrease in drilling costs for the ATWOODSOUTHERN CROSS is also due to $8.6 million ofmobilization expense amortization during the fis-cal year 2006, compared to $0.8 million of
18

deferred mobilization expense during fiscal year2005, as the rig relocated from Southeast Asia tothe Mediterranean during the fourth quarter offiscal year 2005. The increase in drilling costs forthe ATWOOD HUNTER also includes higheragent commissions due to increased revenueswhen compared to fiscal year 2005 and due to itsrelocation from Egypt to Mauritania where oper-ating costs are higher. As previously mentioned,one of our managed platform rigs in Australiacommenced a new drilling program during fiscalyear 2006, and thus, service activities for ourAUSTRALIA MANAGEMENT CONTRACTS haveincreased accordingly when compared to fiscalyear 2005. The decrease in drilling costs for theSEAHAWK is due to $4.0 million of deferredmobilization costs for fiscal year 2006 due to therelocation of the rig from Southeast Asia to WestAfrica compared to no deferred mobilization costsin fiscal year 2005. Other drilling costs for fiscalyear 2006 have increased primarily due to therecording of stock option compensation expense(resulting from adoption of Statement of FinancialAccounting Standards No. 123(R), “Share-BasedPayment”, or SFAS 123(R) on October 1, 2005) forfield personnel.
Depreciation expense for fiscal year 2006decreased 1% as compared to the prior fiscalyear. A comparative analysis of depreciationexpense by rig for fiscal years 2006 and 2005 isas follows:
FiscalYear 2006
FiscalYear 2005 Variance
DEPRECIATION EXPENSE(In millions)
SEAHAWK . . . . . . . . . $ 1.6 $ 0.5 $ 1.1ATWOOD HUNTER. . . 5.4 5.3 0.1VICKSBURG . . . . . . . . 2.8 2.7 0.1ATWOOD BEACON . . 5.3 5.2 0.1RICHMOND . . . . . . . . 0.9 0.9 —ATWOOD FALCON . . . 2.8 2.8 —ATWOOD EAGLE . . . . 4.6 4.7 (0.1)ATWOOD SOUTHERN
CROSS . . . . . . . . . . 2.9 4.5 (1.6)OTHER. . . . . . . . . . . . 0.1 0.1 —
$26.4 $26.7 $(0.3)
The increase in depreciation expense for theSEAHAWK was due to the completion of a$16 million life enhancing upgrade during thefourth quarter of fiscal year 2006. During the firstquarter of the fiscal year 2006, the ATWOODSOUTHERN CROSS underwent a life enhancingupgrade whereby the useful life of the rig wasextended from approximately two to five years.Depreciation expense for our other units wasrelatively unchanged in fiscal year 2006 as com-pared to fiscal year 2005.
In October 2005, we sold our semisubmersi-ble hull, SEASCOUT, for $10 million (net aftercertain expenses) and our spare 15,000 P.S.I. BOPStack for approximately $15 million. For the 2006fiscal year period, gains on the sales of these twoassets and other excess equipment totaledapproximately $10.5 million in the aggregate. Wehad no operations or revenues associated withthese assets prior to their sale.
General and administrative expenses for fis-cal year 2006 increased 45% compared to fiscalyear 2005 due primarily to the following: $3.7 mil-lion of stock option compensation expense(resulting from adoption of SFAS 123(R) on Octo-ber 1, 2005), a $1.5 million increase in profes-sional fees primarily related to higherSarbanes-Oxley compliance costs, and a $0.6 mil-lion increase in annual bonus compensation.Interest expense has decreased primarily due tothe reduction of our outstanding debt, whileinterest income has increased when compared tofiscal year 2005 due to higher interest ratesearned on higher cash balances.
Virtually all of our tax provision for fiscal year2006 relates to taxes in foreign jurisdictions. As aresult of working in foreign jurisdictions, weearned a high level of operating income in certainnontaxable and deemed profit tax jurisdictionswhich significantly reduced our effective tax ratefor the current fiscal year when compared to theUnited States statutory rate. In addition, wereversed a $1.8 million tax contingent liabilitydue to the expiration of the statute of limitations
19

in a foreign jurisdiction. Also, we were advisedby a foreign tax authority that it had approvedacceptance of certain amended prior year taxreturns. The acceptance of these amended taxreturns, along with the fiscal year 2005 tax returnin this foreign jurisdiction, resulted in the recog-nition of a $4.6 million tax benefit in the thirdquarter. Including the two previously mentioneddiscrete items, which reduced our rate by 7%,our effective tax rate for fiscal year 2006 wasapproximately 6%.
LIQUIDITY AND CAPITAL RESOURCES
As of September 30, 2007, we had $18 millionoutstanding under the term portion of our seniorsecured credit facility and no funds borrowedunder the $100 million revolving portion of oursenior secured credit facility. We were in compli-ance with all financial covenants at September 30,2007 and at all times during fiscal years 2007,2006 and 2005. At September 30, 2007, the collat-eral for our credit facility consisted primarily ofpreferred mortgages on all eight of our activedrilling units (with an aggregate net book valueat September 30, 2007 totaling approximately$378 million). Under the facility, we were notrequired to maintain compensating balances;however, we were required to pay a fee ofapproximately 0.60% per annum on the unusedrevolving portion of our credit facility and certainother administrative costs.
Subsequent to September 30, 2007, weentered into a new credit agreement with severalbanks with Nordea Bank Finland PLC, New YorkBranch, as Administrative Agent for the lenders,as well as Lead Arranger and Book Runner andterminated our prior senior secured credit facility.The new credit agreement provides for a secured5-year $300,000,000 non-amortizing revolving loanfacility with maturity in October 2012, subject toacceleration upon certain specified events ofdefaults, including breaches of representations orcovenants. Loans under the new facility will bearinterest at varying rates ranging from 0.70% to
1.25% over the Eurodollar Rate, depending uponthe ratio of outstanding debt to earnings beforeinterest, taxes and depreciation. The collateral forthe new credit agreement consists primarily ofpreferred mortgages on three of our active drillingunits (ATWOOD EAGLE, ATWOOD HUNTER andATWOOD BEACON). The new credit agreementcontains various financial covenants that, amongother things, require the maintenance of certainleverage and interest expense coverage ratios.This new credit facility will provide funding forfuture growth opportunities and for general cor-porate needs. As of November 27, 2007, no fundshave been borrowed under the new credit facility.In conjunction with the establishment of the newcredit agreement, we terminated our prior seniorsecured credit facility, and we repaid the $18 mil-lion then outstanding on our prior senior securedcredit facility at the time of termination. We willwrite off the remaining unamortized loan costs ofapproximately $0.4 million related to the priorsenior secured credit facility in the first quarterof fiscal year 2008.
Since we operate in a very cyclical industry,maintaining high equipment utilization in up, aswell as down, cycles is a key factor in generatingcash to satisfy current and future obligations. Forfiscal years 2001 through 2006, net cash providedby operating activities ranged from a low ofapproximately $13.7 million in fiscal year 2003 toa high of approximately $85.5 million in fiscalyear 2006. For fiscal year 2007, net cash providedby operating activities totaled approximately$190.8 million. Our operating cash flows are pri-marily driven by our operating income, whichreflects dayrates and rig utilization. During fiscalyear 2007, we used internally generated cash toexpend approximately $63 million toward theconstruction of the ATWOOD AURORA, approxi-mately $9 million on completing the water depthupgrade and equipment maintenance of theATWOOD FALCON and approximately $19 millionin other capital expenditures. In fiscal year 2008,we currently expect to expend approximately$70 million in completing the construction of the
20

ATWOOD AURORA, approximately $14 millionfor the life enhancing upgrade for the RICH-MOND and approximately $20 million for othercapital expenditures.
With approximately 87% of our availableoperating rig days committed for fiscal year 2008and approximately 33% committed for fiscal year2009 at historically high dayrates, we anticipatesignificant increases in cash flows and earningsduring fiscal years 2008 and 2009 when com-pared to fiscal year 2007. As we repaid the$18 million remaining term portion of our priorsenior secured credit facility during October 2007and have not borrowed against our new seniorsecured credit facility to date, the only additionalfirm cash commitment for fiscal year 2008, out-side of funding current rig operations, is ourexpected capital expenditures of approximately$104 million as noted above. We expect to gener-ate more than sufficient cash flows from opera-tions to satisfy these obligations.
Our portfolio of accounts receivable is com-prised of major international corporate entitieswith stable payment experience. Historically, wehave not encountered significant difficulty in col-lecting receivables and typically do not requirecollateral for our receivables. As of September 30,2007, we have an unbilled receivable balance of$13.1 million with one customer. This balancerelates to contract drilling services performed inAugust and September 2007, for which billingwas postponed awaiting receipt of tax-exemptstatus from a foreign government. Such amountswere billed subsequent to the current fiscal yearend and are expected to be collected in the firstquarter of fiscal year 2008. The insurance receiv-able of $0.6 million at September 30, 2006 relatedto repairs made to the ATWOOD BEACON duringthe first quarter of fiscal year 2007.
Accrued liabilities have increased by$14.7 million from September 30, 2006 primarilydue to the increase of accrued, but unpaid, agentfees and current income tax liabilities.
Commitments
The following table summarizes our obliga-tions and commitments (in thousands) at Sep-tember 30, 2007:
Fiscal2008
Fiscal2009
Fiscal2010
Fiscal2011
Fiscal2012 andthereafter
Long-Term Debt(1) . . . . . $ 18,000 $ — $ — $ — $ —Purchase
Commitments(2) . . . . . 83,000 — — — —Operating Leases . . . . . . 1,644 1,029 854 842 2,730
$102,644 $1,029 $854 $842 $2,730
(1) Remaining balance repaid during October 2007.
(2) Rig construction and upgrade commitments forthe ATWOOD AURORA and the RICHMOND,respectively.
CRITICAL ACCOUNTING POLICIES
Significant accounting policies are includedin Note 2 to our consolidated financial statementsfor the year ended September 30, 2007. Thesepolicies, along with the underlying assumptionsand judgments made by management in theirapplication, have a significant impact on ourconsolidated financial statements. We identifyour most critical accounting policies as thosethat are the most pervasive and important to theportrayal of our financial position and results ofoperations, and that require the most difficult,subjective and/or complex judgments by manage-ment regarding estimates about matters that areinherently uncertain. Our most critical account-ing policies are those related to revenue recogni-tion, property and equipment, impairment ofassets, income taxes, and employee stock-basedcompensation.
We account for contract drilling revenue inaccordance with the terms of the underlying drill-ing contract. These contracts generally providethat revenue is earned and recognized on a dailyrate (i.e. “dayrate”) basis and dayrates are typi-cally earned for a particular level of service overthe life of a contract. Dayrate contracts can be fora specified period of time or the time required to
21

drill a specified well or number of wells. Reve-nues from dayrate drilling operations, which areclassified under contract drilling services, are rec-ognized on a per day basis as the workprogresses. In addition, lump-sum fees receivedat commencement of the drilling contract ascompensation for the cost of relocating drillingrigs from one major operating area to another, aswell as equipment and upgrade costs reimbursedby the customer are recognized as earned on astraight-line method over the term of the relateddrilling contract, as are the dayrates associatedwith such contract. However, lump-sum feesreceived upon termination of a drilling contractare recognized as earned during the period termi-nation occurs. In addition, we defer the mobiliza-tion costs relating to moving a drilling rig to anew area and customer requested equipmentpurchases that will revert to the customer at theend of the applicable drilling contract. We amor-tize such costs on a straight-line basis over thelife of the applicable drilling contract.
We currently operate eight active offshoredrilling units. These assets are premium equip-ment and should provide many years of qualityservice. At September 30, 2007, the carryingvalue of our property and equipment totaled$493.9 million, which represents 69% of our totalassets. This carrying value reflects the applica-tion of our property and equipment accountingpolicies, which incorporate estimates, assump-tions and judgments by management relative tothe useful lives and salvage values of our units.Once a rig is placed in service, it is depreciatedon the straight-line method over its estimateduseful life, with depreciation discontinued onlyduring the period when a drilling unit is out ofservice while undergoing a significant upgradethat extends its useful life. The estimated usefullives of our drilling units and related equipmentrange from 3 years to 25 years and our salvagevalues are generally based on 5% of capitalizedcosts. Any future increases in our estimates ofuseful lives or salvage values will have the effectof decreasing future depreciation expense in
future years and spreading the expense to lateryears. Any future decreases in our useful lives orsalvage values will have the effect of acceleratingfuture depreciation expense.
We evaluate the carrying value of our prop-erty and equipment when events or changes incircumstances indicate that the carrying value ofsuch assets may be impaired. Asset impairmentevaluations are, by nature, highly subjective.Operations of our drilling equipment are subjectto the offshore drilling requirements of oil andgas exploration and production companies andagencies of foreign governments. These require-ments are, in turn, subject to fluctuations ingovernment policies, world demand and price forpetroleum products, proved reserves in relation tosuch demand and the extent to which suchdemand can be met from onshore sources. Thecritical estimates which result from these dynam-ics include projected utilization, dayrates, andoperating expenses, each of which impact ourestimated future cash flows. Over the last tenyears, our equipment utilization rate has aver-aged approximately 90%; however, if a drillingunit incurs significant idle time or receivesdayrates below operating costs, its carrying valuecould become impaired. The estimates, assump-tions and judgments used by management in theapplication of our property and equipment andasset impairment policies reflect both historicalexperience and expectations regarding futureindustry conditions and operations. The use ofdifferent estimates, assumptions and judgments,especially those involving the useful lives of ourrigs and vessels and expectations regardingfuture industry conditions and operations, wouldlikely result in materially different carrying valuesof assets and results of operations.
We conduct operations and earn income innumerous foreign countries and are subject tothe laws of taxing jurisdictions within thosecountries, as well as United States federal andstate tax laws. At September 30, 2007, we have a$14.3 million net deferred income tax liability.
22

This balance reflects the application of ourincome tax accounting policies in accordancewith statement of Financial Accounting Stan-dards No. 109, “Accounting for Income Taxes”.Such accounting policies incorporate estimates,assumptions and judgments by management rel-ative to the interpretation of applicable tax laws,the application of accounting standards, andfuture levels of taxable income. The estimates,assumptions and judgments used by manage-ment in connection with accounting for incometaxes reflect both historical experience andexpectations regarding future industry conditionsand operations. Changes in these estimates,assumptions and judgments could result in mate-rially different provisions for deferred and currentincome taxes.
Effective October 1, 2005, we adopted State-ment of Financial Accounting StandardsNo. 123(R), “Share-Based Payment”, orSFAS 123(R), using the modified prospectiveapplication transition method. Under this method,stock-based compensation cost is measured atthe grant date, based on the calculated fair valueof the award, and is recognized as an expenseover the requisite service period (generally thevesting period of the equity grant). In addition,stock-based compensation cost recognizedincludes compensation cost for unvestedstock-based awards as of October 1, 2005. Priorto October 1, 2005, we accounted for share-basedcompensation in accordance with AccountingPrinciples Board Opinion No. 25, “Accounting forStock Issued to Employees”, or APB No. 25. Noshare-based employee compensation cost hasbeen reflected in net income prior to October 1,2005. Before that date, we reported the entire taxbenefit related to the exercise of stock options asan operating cash flow. SFAS 123(R) requires usto report the tax benefit from the tax deductionthat is in excess of recognized compensationcosts (excess tax benefits) as a financing cashflow rather than as an operating cash flow. Thecumulative effect of the change in accounting
principle from APB No. 25 to FAS 123(R) was notmaterial.
RECENTLY ISSUED ACCOUNTINGPRONOUNCEMENTS
In June 2006, the Financial Accounting Stan-dards Board issued FIN 48, “Accounting forUncertainty in Income Taxes — an Interpretationof FASB Statement 109.” FIN 48 prescribes acomprehensive model for recognizing, measuring,presenting, and disclosing uncertain tax positionswithin the financial statements. The provisions ofFIN 48 are effective for fiscal years beginningafter December 15, 2006. While we are still final-izing our evaluation of the impact of the adoptionof FIN 48, we believe the adoption will result in adecrease to shareholders equity of approximately$4 to $5 million at October 1, 2007.
In February 2007, the FASB issuedSFAS No. 159, “The Fair Value Option for Finan-cial Assets and Financial Liabilities”, which pro-vides companies with an option to reportselected financial assets and liabilities at fairvalue and establishes presentation and disclosurerequirements to facilitate comparisons betweencompanies that choose different measurementattributes for similar types of assets and liabili-ties. GAAP has required different measurementattributes for different assets and liabilities thatcan create artificial volatility in earnings. Theobjective of SFAS No. 159 is to help mitigate thistype of volatility in the earnings by enablingcompanies to report related assets and liabilitiesat fair value, which would likely reduce the needfor companies to comply with complex hedgeaccounting provisions. SFAS No. 159 is effectivefor fiscal years beginning after November 15,2007. We are currently analyzing the provisions ofSFAS No. 159 and determining how it will affectaccounting policies and procedures, but we havenot yet made a determination of the impact theadoption will have on our consolidated financialposition, results of operations and cash flows.
23

In September 2005, the FASB issuedSFAS No. 157, “Fair Value Measurements”, whichdefines fair value, establishes methods used tomeasure fair value and expands disclosurerequirements about fair value measurements.SFAS No. 157 is effective for financial statementsissued for fiscal years beginning after Novem-ber 15, 2007, and interim periods within thosefiscal periods. We are currently analyzing theprovisions of SFAS No. 157 and determining howit will affect accounting policies and procedures,but we have not yet made a determination of theimpact the adoption will have on our consoli-dated financial position, results of operations andcash flows.
DISCLOSURES ABOUT MARKET RISK
We are exposed to market risk, includingadverse changes in interest rates and foreigncurrency exchange rates as discussed below.
Interest Rate Risk
All of the $18 million of long-term debt out-standing under our prior credit facility at Septem-ber 30, 2007, was floating rate debt. Any debt weincur under our new credit facility will also befloating rate debt. As a result, our annual interestcosts in fiscal year 2008 will fluctuate based on
interest rate changes. Because the interest rateon our long-term debt is a floating rate and dueto the fact that our debt maturing under our priorcredit facility would have matured in 2008, thefair value of our long-term debt approximatedcarrying value as of September 30, 2007. Theimpact on annual cash flow of a 10% change inthe floating rate (approximately 70 basis points)would be immaterial. We did not have any openderivative contracts relating to our floating ratedebt at September 30, 2007.
Foreign Currency Risk
Certain of our subsidiaries have monetaryassets and liabilities that are denominated in acurrency other than their functional currencies.Based on September 30, 2007 amounts, adecrease in the value of 10% in the foreigncurrencies relative to the United States dollarfrom the year-end exchange rates would result ina foreign currency transaction gain of approxi-mately $0.3 million. Thus, we consider our cur-rent risk exposure to foreign currency exchangerate movements, based on net cash flows, to beimmaterial. We did not have any open derivativecontracts relating to foreign currencies at Sep-tember 30, 2007.
24

MANAGEMENT’S REPORT ON INTERNAL CONTROLOVER FINANCIAL REPORTING
Company management is responsible for establishing and maintaining adequate internal controlover financial reporting as defined in Rules 13a-15(f) and 15d-15(f) under the Securities Exchange Act of1934. Our internal control over financial reporting was designed by management, under the supervisionof the Chief Executive Officer and Chief Financial Officer, to provide reasonable assurance regarding thereliability of financial reporting and the preparation of financial statements for external purposes inaccordance with accounting principles generally accepted in the United States, and includes thosepolicies and procedures that:
(i) pertain to the maintenance of records that in reasonable detail accurately and fairly reflectthe transactions and dispositions of the assets of the Company;
(ii) provide reasonable assurance that transactions are recorded as necessary to permit prepa-ration of financial statements in accordance with accounting principles generally accepted in theUnited States, and that receipts and expenditures of the Company are being made only inaccordance with authorizations of management and directors of the Company; and
(iii) provide reasonable assurance regarding prevention or timely detection of unauthorizedacquisition, use or disposition of the Company’s assets that could have a material effect on thefinancial statements.
Because of its inherent limitations, internal control over financial reporting may not prevent ordetect misstatements. Also, projections of any evaluation of effectiveness to future periods are subjectto the risk that controls may become inadequate because of changes in conditions, or that the degree ofcompliance with the policies and procedures may deteriorate.
Management assessed the effectiveness of the Company’s internal control over financial reportingas of September 30, 2007. In making this assessment, management used the criteria set forth by theCommittee of Sponsoring Organizations of the Treadway Commission (COSO) in Internal Control-Integrated Framework.
Based on our evaluation under the framework in Internal Control — Integrated Framework, manage-ment has concluded that the Company maintained effective internal control over financial reporting asof September 30, 2007. PricewaterhouseCoopers LLP, our independent registered public accounting firm,has audited our assessment of the effectiveness of the Company’s internal control over financialreporting as of September 30, 2007, as stated in their report, which appears on the following page.
ATWOOD OCEANICS, INC.
by
John R. IrwinDirector, Presidentand Chief Executive Officer
James M. HollandSenior Vice President, ChiefFinancial Officer and Secretary
November 29, 2007
25
REPORT OF INDEPENDENT REGISTERED PUBLIC ACCOUNTING FIRM
To the Board of Directors and Shareholders of Atwood Oceanics, Inc.
In our opinion, the accompanying consolidated balance sheets and the related consolidatedstatements of operations, of cash flows and of changes in shareholders’ equity present fairly, in allmaterial respects, the financial position of Atwood Oceanics, Inc. and its subsidiaries at September 30,2007 and 2006, and the results of their operations and their cash flows for each of the three years in theperiod ended September 30, 2007 in conformity with accounting principles generally accepted in theUnited States of America. Also in our opinion, the Company maintained, in all material respects,effective internal control over financial reporting as of September 30, 2007, based on criteria establishedin Internal Control — Integrated Framework issued by the Committee of Sponsoring Organizations of theTreadway Commission (COSO). The Company’s management is responsible for these financial state-ments, for maintaining effective internal control over financial reporting and for its assessment of theeffectiveness of internal control over financial reporting, included in the accompanying Management’sReport on Internal Control Over Financial Reporting, which appears on the preceding page. Ourresponsibility is to express opinions on these financial statements and on the Company’s internal controlover financial reporting based on our integrated audits. We conducted our audits in accordance withthe standards of the Public Company Accounting Oversight Board (United States). Those standardsrequire that we plan and perform the audits to obtain reasonable assurance about whether the financialstatements are free of material misstatement and whether effective internal control over financialreporting was maintained in all material respects. Our audits of the financial statements includedexamining, on a test basis, evidence supporting the amounts and disclosures in the financial state-ments, assessing the accounting principles used and significant estimates made by management, andevaluating the overall financial statement presentation. Our audit of internal control over financialreporting included obtaining an understanding of internal control over financial reporting, assessing therisk that a material weakness exists, and testing and evaluating the design and operating effectivenessof internal control based on the assessed risk. Our audits also included performing such otherprocedures as we considered necessary in the circumstances. We believe that our audits provide areasonable basis for our opinions.
As discussed in Note 3 to the consolidated financial statements, in 2006 the company charged itsmethod of accounting for share-based compensation as a result of adopting the provisions of theStatement of Financial Standards No. 123(R), “Share-Based Payment.”
26

A company’s internal control over financial reporting is a process designed to provide reasonableassurance regarding the reliability of financial reporting and the preparation of financial statements forexternal purposes in accordance with generally accepted accounting principles. A company’s internalcontrol over financial reporting includes those policies and procedures that (i) pertain to the mainte-nance of records that, in reasonable detail, accurately and fairly reflect the transactions and dispositionsof the assets of the company; (ii) provide reasonable assurance that transactions are recorded asnecessary to permit preparation of financial statements in accordance with generally accepted account-ing principles, and that receipts and expenditures of the company are being made only in accordancewith authorizations of management and directors of the company; and (iii) provide reasonable assuranceregarding prevention or timely detection of unauthorized acquisition, use, or disposition of thecompany’s assets that could have a material effect on the financial statements.
Because of its inherent limitations, internal control over financial reporting may not prevent ordetect misstatements. Also, projections of any evaluation of effectiveness to future periods are subjectto the risk that controls may become inadequate because of changes in conditions, or that the degree ofcompliance with the policies or procedures may deteriorate.
PricewaterhouseCoopers LLPHouston, TexasNovember 28, 2007
27

Atwood Oceanics, Inc. and Subsidiaries
CONSOLIDATED BALANCE SHEETS
(In thousands) 2007 2006
September 30,
ASSETSCURRENT ASSETS:
Cash and cash equivalents . . . . . . . . . . . . . . . . . . . . . . . . . . . . . . . . . . . . . . . . . . $100,361 $ 32,276Accounts receivable, net of an allowance of $164 and $750 at September 30,
2007 and 2006, respectively . . . . . . . . . . . . . . . . . . . . . . . . . . . . . . . . . . . . . . . . 76,597 80,222Income tax receivable . . . . . . . . . . . . . . . . . . . . . . . . . . . . . . . . . . . . . . . . . . . . . . 1,870 65Insurance receivable. . . . . . . . . . . . . . . . . . . . . . . . . . . . . . . . . . . . . . . . . . . . . . . . — 550Inventories of materials and supplies . . . . . . . . . . . . . . . . . . . . . . . . . . . . . . . . . . 26,721 22,124Deferred tax assets . . . . . . . . . . . . . . . . . . . . . . . . . . . . . . . . . . . . . . . . . . . . . . . . . 390 2,563Prepaid expenses and deferred costs . . . . . . . . . . . . . . . . . . . . . . . . . . . . . . . . . . 10,240 9,873
Total Current Assets . . . . . . . . . . . . . . . . . . . . . . . . . . . . . . . . . . . . . . . . . . . . . . 216,179 147,673
NET PROPERTY AND EQUIPMENT . . . . . . . . . . . . . . . . . . . . . . . . . . . . . . . . . . . . . 493,851 436,166DEFERRED COSTS AND OTHER ASSETS . . . . . . . . . . . . . . . . . . . . . . . . . . . . . . . . 7,694 9,990
$717,724 $593,829
LIABILITIES AND SHAREHOLDERS’ EQUITYCURRENT LIABILITIES:
Current maturities of notes payable. . . . . . . . . . . . . . . . . . . . . . . . . . . . . . . . . . . . $ 18,000 $ 36,000Accounts payable . . . . . . . . . . . . . . . . . . . . . . . . . . . . . . . . . . . . . . . . . . . . . . . . . . 11,769 11,760Accrued liabilities. . . . . . . . . . . . . . . . . . . . . . . . . . . . . . . . . . . . . . . . . . . . . . . . . . 27,861 13,201Deferred credits . . . . . . . . . . . . . . . . . . . . . . . . . . . . . . . . . . . . . . . . . . . . . . . . . . . — 404
Total Current Liabilities . . . . . . . . . . . . . . . . . . . . . . . . . . . . . . . . . . . . . . . . . . . 57,630 61,365
LONG-TERM DEBT, net of current maturities: . . . . . . . . . . . . . . . . . . . . . . . . . . . . . — 28,000
LONG TERM LIABILITIES:Deferred income taxes . . . . . . . . . . . . . . . . . . . . . . . . . . . . . . . . . . . . . . . . . . . . . . 14,729 18,591Deferred credits . . . . . . . . . . . . . . . . . . . . . . . . . . . . . . . . . . . . . . . . . . . . . . . . . . . 24,093 23,284Other . . . . . . . . . . . . . . . . . . . . . . . . . . . . . . . . . . . . . . . . . . . . . . . . . . . . . . . . . . . . 5,417 3,695
44,239 45,570
COMMITMENTS AND CONTENGENCIES (SEE NOTE 11)SHAREHOLDERS’ EQUITY:
Preferred stock, no par value; 1,000 shares authorized, none outstanding . . . . . . — —Common stock, $1 par value, 50,000 shares authorized with 31,675 and 31,046
issued and outstanding at September 30, 2007 and 2006, respectively . . . . . . 31,675 31,046Paid-in capital. . . . . . . . . . . . . . . . . . . . . . . . . . . . . . . . . . . . . . . . . . . . . . . . . . . . . 133,224 115,916Retained earnings. . . . . . . . . . . . . . . . . . . . . . . . . . . . . . . . . . . . . . . . . . . . . . . . . . 450,956 311,932
Total Shareholders’ Equity . . . . . . . . . . . . . . . . . . . . . . . . . . . . . . . . . . . . . . . . . 615,855 458,894
$717,724 $593,829
The accompanying notes are an integral part of these consolidated financial statements.
28

Atwood Oceanics, Inc. and Subsidiaries
CONSOLIDATED STATEMENTS OF OPERATIONS
(In thousands, except per share amounts) 2007 2006 2005
For Years Ended September 30,
REVENUES:Contract drilling . . . . . . . . . . . . . . . . . . . . . . . . . . . . . . . . . . . . . . . . . . $400,479 $276,625 $168,500Business interruption proceeds . . . . . . . . . . . . . . . . . . . . . . . . . . . . . . 2,558 — 7,656
403,037 276,625 176,156COSTS AND EXPENSES:
Contract drilling . . . . . . . . . . . . . . . . . . . . . . . . . . . . . . . . . . . . . . . . . . 186,949 144,366 102,849Depreciation . . . . . . . . . . . . . . . . . . . . . . . . . . . . . . . . . . . . . . . . . . . . . 33,366 26,401 26,735General and administrative . . . . . . . . . . . . . . . . . . . . . . . . . . . . . . . . . 23,929 20,630 14,245Gain on sale of equipment . . . . . . . . . . . . . . . . . . . . . . . . . . . . . . . . . . (414) (10,548) —
243,830 180,849 143,829
OPERATING INCOME . . . . . . . . . . . . . . . . . . . . . . . . . . . . . . . . . . . . . . . 159,207 95,776 32,327
OTHER INCOME (EXPENSE):Interest expense, net of capitalized interest . . . . . . . . . . . . . . . . . . . . (1,689) (5,166) (7,352)Interest income . . . . . . . . . . . . . . . . . . . . . . . . . . . . . . . . . . . . . . . . . . 2,441 1,226 633
752 (3,940) (6,719)
INCOME BEFORE INCOME TAXES . . . . . . . . . . . . . . . . . . . . . . . . . . . . 159,959 91,836 25,608PROVISION (BENEFIT) FOR INCOME TAXES . . . . . . . . . . . . . . . . . . . . 20,935 5,714 (403)
NET INCOME . . . . . . . . . . . . . . . . . . . . . . . . . . . . . . . . . . . . . . . . . . . . . $139,024 $ 86,122 $ 26,011
EARNINGS PER COMMON SHARE:Basic . . . . . . . . . . . . . . . . . . . . . . . . . . . . . . . . . . . . . . . . . . . . . . . . . . . $ 4.44 $ 2.78 $ 0.86Diluted . . . . . . . . . . . . . . . . . . . . . . . . . . . . . . . . . . . . . . . . . . . . . . . . . 4.37 2.74 0.83
AVERAGE COMMON SHARES OUTSTANDING:Basic . . . . . . . . . . . . . . . . . . . . . . . . . . . . . . . . . . . . . . . . . . . . . . . . . . . 31,343 30,936 30,412Diluted . . . . . . . . . . . . . . . . . . . . . . . . . . . . . . . . . . . . . . . . . . . . . . . . . 31,814 31,442 31,220
The accompanying notes are an integral part of these consolidated financial statements.
29

Atwood Oceanics, Inc. and Subsidiaries
CONSOLIDATED STATEMENTS OF CASH FLOWS
(In thousands) 2007 2006 2005
For Years Ended September 30,
CASH FLOW FROM OPERATING ACTIVITIES:Net income . . . . . . . . . . . . . . . . . . . . . . . . . . . . . . . . . . . . . . . . . . . . . . . . . . . $139,024 $ 86,122 $ 26,011Adjustments to reconcile net income to net cash provided by operating
activities:Depreciation . . . . . . . . . . . . . . . . . . . . . . . . . . . . . . . . . . . . . . . . . . . . . . . . 33,366 26,401 26,735Amortization of debt issuance costs. . . . . . . . . . . . . . . . . . . . . . . . . . . . . . . 804 804 804Amortization of deferred items . . . . . . . . . . . . . . . . . . . . . . . . . . . . . . . . . . . (25,729) (1,254) 292Provision for doubtful accounts . . . . . . . . . . . . . . . . . . . . . . . . . . . . . . . . . . 127 726 189Provision for inventory obsolescence . . . . . . . . . . . . . . . . . . . . . . . . . . . . . . 240 — —Deferred federal income tax benefit . . . . . . . . . . . . . . . . . . . . . . . . . . . . . . . (2,169) (1,032) (1,580)Stock-based compensation expense . . . . . . . . . . . . . . . . . . . . . . . . . . . . . . . 5,005 4,568 —Gain on sale of assets . . . . . . . . . . . . . . . . . . . . . . . . . . . . . . . . . . . . . . . . . (414) (10,548) —
Changes in assets and liabilities:(Increase) decrease in accounts receivable . . . . . . . . . . . . . . . . . . . . . . . . . . 3,498 (41,083) (7,579)Decrease in insurance receivable . . . . . . . . . . . . . . . . . . . . . . . . . . . . . . . . . — — 9,133(Increase) decrease in income tax receivable . . . . . . . . . . . . . . . . . . . . . . . . (1,805) 3,213 (3,278)Increase in inventory . . . . . . . . . . . . . . . . . . . . . . . . . . . . . . . . . . . . . . . . . . (4,837) (6,484) (2,839)(Increase) decrease in prepaid expenses . . . . . . . . . . . . . . . . . . . . . . . . . . . (1,454) (5,061) 1,585Increase in deferred costs and other assets . . . . . . . . . . . . . . . . . . . . . . . . . (4,506) (11,419) (10,422)Increase (decrease) in accounts payable. . . . . . . . . . . . . . . . . . . . . . . . . . . . 9 5,287 (2,925)Increase (decrease) in accrued liabilities . . . . . . . . . . . . . . . . . . . . . . . . . . . 14,660 3,985 (2,734)Increase in deferred credits and other liabilities . . . . . . . . . . . . . . . . . . . . . . 34,941 31,226 5,429Tax benefit from the exercise of stock options . . . . . . . . . . . . . . . . . . . . . . . — — 2,250Other . . . . . . . . . . . . . . . . . . . . . . . . . . . . . . . . . . . . . . . . . . . . . . . . . . . . . . — 1 21
51,736 (670) 15,081
Net Cash Provided by Operating Activities . . . . . . . . . . . . . . . . . . . . . . . 190,760 85,452 41,092
CASH FLOW FROM INVESTING ACTIVITIES:Capital expenditures . . . . . . . . . . . . . . . . . . . . . . . . . . . . . . . . . . . . . . . . . . . . (91,306) (78,464) (25,563)Collection of insurance receivable . . . . . . . . . . . . . . . . . . . . . . . . . . . . . . . . . . 550 — 15,750Proceeds from sale of assets . . . . . . . . . . . . . . . . . . . . . . . . . . . . . . . . . . . . . . 669 26,239 —
Net Cash Used by Investing Activities . . . . . . . . . . . . . . . . . . . . . . . . . . . (90,087) (52,225) (9,813)
CASH FLOW FROM FINANCING ACTIVITIES:Proceeds from debt . . . . . . . . . . . . . . . . . . . . . . . . . . . . . . . . . . . . . . . . . . . . . — 20,000 10,000Principal payments on debt . . . . . . . . . . . . . . . . . . . . . . . . . . . . . . . . . . . . . . . (46,000) (46,000) (101,000)Proceeds from common stock offering . . . . . . . . . . . . . . . . . . . . . . . . . . . . . . . — — 53,607Tax benefit from the exercise of stock options . . . . . . . . . . . . . . . . . . . . . . . . . 3,432 — —Proceeds from exercise of stock options . . . . . . . . . . . . . . . . . . . . . . . . . . . . . 9,980 6,067 8,680
Net Cash Used by Financing Activities . . . . . . . . . . . . . . . . . . . . . . . . . . (32,588) (19,933) (28,713)
NET INCREASE IN CASH AND CASH EQUIVALENTS . . . . . . . . . . . . . . . . . . . . $ 68,085 $ 13,294 $ 2,566CASH AND CASH EQUIVALENTS, at beginning of period . . . . . . . . . . . . . . . . . $ 32,276 $ 18,982 $ 16,416
CASH AND CASH EQUIVALENTS, at end of period . . . . . . . . . . . . . . . . . . . . . . $100,361 $ 32,276 $ 18,982
Supplemental disclosure of cash flow information:Cash paid during the year for domestic and foreign income taxes . . . . . . . . . . $ 13,095 $ 2,654 $ 5,977
Cash paid during the year for interest, net of amounts capitalized. . . . . . . . . . $ 1,822 $ 5,033 $ 7,705
The accompanying notes are an integral part of these consolidated financial statements.
30

Atwood Oceanics, Inc. and Subsidiaries
CONSOLIDATED STATEMENTS OF CHANGES IN SHAREHOLDERS’ EQUITY
(In thousands) Shares AmountPaid-inCapital
RetainedEarnings
TotalStockholders’
EquityCommon Stock
September 30, 2004 . . . . . . . . . . . . . . . . . . . . . . . . 27,746 $27,746 $ 44,044 $199,799 $271,589Net income . . . . . . . . . . . . . . . . . . . . . . . . . . . . . . . — — — 26,011 26,011Exercise of employee stock options . . . . . . . . . . . . 586 586 8,094 — 8,680Common stock offering . . . . . . . . . . . . . . . . . . . . . 2,350 2,350 51,257 — 53,607Tax benefit from exercise of employee stock
options . . . . . . . . . . . . . . . . . . . . . . . . . . . . . . . . — — 2,250 — 2,250
September 30, 2005 . . . . . . . . . . . . . . . . . . . . . . . . 30,682 $30,682 $105,645 $225,810 $362,137Net income . . . . . . . . . . . . . . . . . . . . . . . . . . . . . . . — — — 86,122 86,122Restricted stock awards . . . . . . . . . . . . . . . . . . . . . 5 5 (5) — —Exercise of employee stock options . . . . . . . . . . . . 359 359 5,708 — 6,067Stock option and restricted stock award
compensation expense . . . . . . . . . . . . . . . . . . . . — — 4,568 — 4,568
September 30, 2006 . . . . . . . . . . . . . . . . . . . . . . . . 31,046 $31,046 $115,916 $311,932 $458,894Net income . . . . . . . . . . . . . . . . . . . . . . . . . . . . . . . — — — 139,024 139,024Restricted stock awards . . . . . . . . . . . . . . . . . . . . . 7 7 (7) — —Exercise of employee stock options . . . . . . . . . . . . 622 622 9,358 — 9,980Stock option and restricted stock award
compensation expense . . . . . . . . . . . . . . . . . . . . — — 5,005 — 5,005Tax benefit from exercise of employee stock
options . . . . . . . . . . . . . . . . . . . . . . . . . . . . . . . . — — 2,952 — 2,952
September 30, 2007 . . . . . . . . . . . . . . . . . . . . . . . . 31,675 $31,675 $133,224 $450,956 $615,855
The accompanying notes are an integral part of these consolidated financial statements.
31

Atwood Oceanics, Inc. and Subsidiaries
NOTES TO CONSOLIDATED FINANCIAL STATEMENTS
NOTE 1 — NATURE OF OPERATIONS
Atwood Oceanics, Inc., together with itssubsidiaries (collectively referred to herein as“we,” “our” or the “Company”), is engaged inoffshore drilling and completion of exploratoryand developmental oil and gas wells and relatedsupport, management and consulting servicesprincipally in international locations. Presently,we own and operate a premium, modern fleet ofeight mobile offshore drilling units. Upon itsexpected delivery in October/November 2008, theATWOOD AURORA will be our ninth ownedactive mobile offshore drilling unit. Currently, weare involved in active operations in the territorialwaters of Australia, Malaysia, Thailand, India,Bulgaria, Egypt, Equatorial Guinea and theUnited States.
NOTE 2 — SUMMARY OF SIGNIFICANTACCOUNTING POLICIES
Consolidation
The consolidated financial statementsinclude the accounts of Atwood Oceanics, Inc.and all of its domestic and foreign subsidiaries.All significant intercompany accounts and trans-actions have been eliminated in consolidation.
Cash and cash equivalents
Cash and cash equivalents consist of cash inbanks and highly liquid debt instruments, whichmature within three months of the date ofpurchase.
Foreign exchange
The United States dollar is the functionalcurrency for all areas of our operations. Accord-ingly, monetary assets and liabilities denominatedin foreign currency are converted to United Statesdollars at the rate of exchange in effect at the endof the fiscal year, items of income and expenseare remeasured at average monthly rates, andproperty and equipment and other nonmonetaryamounts are remeasured at historical rates. Gainsand losses on foreign currency transactions and
remeasurements are included in contract drillingcosts in our consolidated statements of operations.While we did not record a foreign exchange gainor loss during fiscal year 2007, we did record aforeign exchange loss of $0.1 million during fiscalyear 2006 and a foreign exchange gain of$0.1 million during fiscal year 2005.
Accounts Receivable
We record trade accounts receivable at theamount we invoice our customers. Our portfolioof accounts receivable is comprised of majorinternational corporate entities and governmentorganizations with stable payment experience.Included within our accounts receivable atSeptember 30, 2007 is an unbilled receivable bal-ance totaling $13.1 million that representsamounts for which contract drilling services havebeen performed, revenue has been earned basedon contractual dayrate provisions and for whichcollection is deemed probable. Such unbilledamounts were billed subsequent to the currentfiscal year end. Historically, our uncollectibleaccounts receivable have been immaterial, andtypically, we do not require collateral for ourreceivables. We provide an allowance for uncol-lectible accounts, as necessary, on a specificidentification basis. We had an allowance fordoubtful accounts of $0.2 million and $0.8 million,as of September 30, 2007 and 2006, respectively.
Insurance receivable
We had an insurance receivable of$0.6 million as of September 30, 2006, related to aclaim filed as a result of damage sustained by theATWOOD BEACON in July 2004 while position-ing for a well offshore Indonesia. We collected theremaining receivable during fiscal year 2007. SeeNote 4 for further discussion regarding theATWOOD BEACON incident.
Inventories of Material and Supplies
Inventories consist of spare parts, materialand supplies held for consumption and are statedprincipally at the lower of average cost or market,
32

net of reserves for excess and obsolete inventoryof $1.2 million and $1.3 million at September 30,2007 and 2006, respectively.
Income taxes
We account for income taxes in accordancewith Statement of Financial Accounting Stan-dards (“SFAS”) No. 109 “Accounting for IncomeTaxes.” Under SFAS No. 109, deferred incometaxes are recorded to reflect the tax conse-quences on future years of differences betweenthe tax basis of assets and liabilities and theirfinancial reporting amounts at each year-endgiven the provisions of enacted tax laws in eachrespective jurisdiction. Deferred tax assets arereduced by a valuation allowance when, basedupon management’s estimates, it is more likelythan not that a portion of the deferred tax assetswill not be realized in a future period.
Property and equipment
Property and equipment are recorded at cost.Interest costs related to property under construc-tion are capitalized as a component of construc-tion costs. Interest capitalized during fiscal years2007 and 2006 was $2.6 million and $1.6 million,respectively. We had no capitalized interest dur-ing fiscal year 2005.
Once a rig is placed in service, it is depreci-ated on the straight-line method over its esti-mated useful life, with depreciation discontinuedonly during the period when a drilling unit is outof service while undergoing a significant upgradethat extends its useful life. Our estimated usefullives of our various classifications of assets are asfollows:
Years
Drilling vessels and related equipment . . . . . . . . . 5-25
Drill pipe . . . . . . . . . . . . . . . . . . . . . . . . . . . . . . . 3
Furniture and other . . . . . . . . . . . . . . . . . . . . . . . 3-10
Maintenance, repairs and minor replace-ments are charged against income as incurred;major replacements and upgrades are capitalizedand depreciated over the remaining useful life of
the asset as determined upon completion of thework. The cost and related accumulated depreci-ation of assets sold, retired or otherwise disposedare removed from the accounts at the time ofdisposition, and any resulting gain or loss isreflected in the Consolidated Statements of Oper-ations for the applicable period.
Impairment of property and equipment
We periodically evaluate our property andequipment to determine that their net carryingvalue is not in excess of their net realizable value.These evaluations are performed when we havesustained significant declines in utilization anddayrates and recovery is not contemplated in thenear future. We consider a number of factorssuch as estimated future cash flows, appraisalsand current market value analysis in determiningan asset’s fair value. Assets are written down totheir fair value if the carrying amount of the assetis not recoverable and exceeds its fair value.
Deferred drydocking costs
We defer the costs of scheduled drydockingand charge such costs to expense over the periodto the next scheduled drydocking (normally30 months). At September 30, 2007 and 2006,deferred drydocking costs totaling $1.9 millionand $0.6 million, respectively, were included inDeferred Costs and Other Assets in the accompa-nying Consolidated Balance Sheets.
Revenue recognition
We account for drilling and managementcontract revenue in accordance with the term ofthe underlying drilling or management contract.These contracts generally provide that revenue isearned and recognized on a daily basis. Weprovide crewed rigs to customers on a daily rate(i.e. “dayrate”) basis. Dayrate contracts can be fora specified period of time or the time required todrill a specified well or number of wells. Reve-nues from dayrate drilling operations, which areclassified under contract drilling services, are rec-ognized on a per day basis as the work
33
Atwood Oceanics, Inc. and Subsidiaries
NOTES TO CONSOLIDATED FINANCIAL STATEMENTS — (Cont.)

progresses. In addition, business interruption pro-ceeds are also recognized on a per day basis. SeeNote 4 for further discussion of the ATWOODBEACON incident.
Deferred fees and costs
Lump-sum fees received at commencementof the drilling contract as compensation for thecost of relocating drilling rigs from one majoroperating area to another, as well as equipmentand upgrade costs reimbursed by the customerare recognized as earned on a straight-linemethod over the term of the related drilling con-tract, as are the dayrates associated with suchcontract. However, lump-sum fees received upontermination of a drilling contract are recognizedas earned during the period termination occurs.In addition, we defer the mobilization costs relat-ing to moving a drilling rig to a new area andcustomer requested equipment purchases thatwill revert to the customer at the end of theapplicable drilling contract. We amortize suchcosts on a straight-line basis over the life of theapplicable drilling contract. Contract revenuesand drilling costs are reported in the Statementsof Operations at their gross amounts.
At September 30, 2007 and 2006, deferredfees associated with mobilization as well asequipment purchases and upgrades totaled$24.1 million and $23.7 million, respectively. AtSeptember 30, 2007 and 2006, deferred costsassociated with mobilization and equipment pur-chases and deferred mobilization costs totaled$4.8 million and $9.0 million, respectively.Deferred fees and deferred costs are classified ascurrent or long-term in the accompanying Con-solidated Balance Sheets based on the expectedterm of the applicable drilling contracts.
Share-based compensation
Effective October 1, 2005, we adopted State-ment of Financial Accounting StandardsNo. 123(R), “Share-Based Payment”, orSFAS 123(R), using the modified prospectiveapplication transition method. Under this method,
stock-based compensation cost is measured atthe grant date, based on the calculated fair valueof the award, and is recognized as an expenseover the requisite service period (generally thevesting period of the equity grant). In addition,stock-based compensation cost recognizedincludes compensation cost for unvestedstock-based awards as of October 1, 2005. Priorto October 1, 2005, we accounted for share-basedcompensation in accordance with AccountingPrinciples Board Opinion No. 25, “Accounting forStock Issued to Employees”, or APB No. 25. Noshare-based employee compensation cost hasbeen reflected in net income prior to October 1,2005. Before that date, we reported the entire taxbenefit related to the exercise of stock options asan operating cash flow. SFAS 123(R) requires usto report the tax benefit from the tax deductionthat is in excess of recognized compensationcosts (excess tax benefits) as a financing cashflow rather than as an operating cash flow. Thecumulative effect of the change in accountingprinciple from APB No. 25 to SFAS 123(R) wasnot material. See Note 3 for additionalinformation.
Earnings per common share
Basic and diluted earnings per share havebeen computed in accordance with SFAS No. 128,“Earnings per Share” (EPS). “Basic” EPS excludesdilution and is computed by dividing net income(loss) by the weighted-average number of com-mon shares outstanding for the period. “Diluted”EPS reflects the issuance of additional shares inconnection with the assumed conversion of stockoptions. Under the modified prospective applica-tion transition method of SFAS 123(R), we haveincluded the impact of pro forma deferred taxassets in calculating the potential windfall andshortfall tax benefits to determine the amount ofdiluted shares using the treasury stock method.
34
Atwood Oceanics, Inc. and Subsidiaries
NOTES TO CONSOLIDATED FINANCIAL STATEMENTS — (Cont.)

The computation of basic and diluted earn-ings per share under SFAS No. 128 for each ofthe past three fiscal years is as follows (in thou-sands, except per share amounts):
Net Income SharesPer ShareAmount
Fiscal 2007:Basic earnings per
share . . . . . . . . . . $139,024 31,343 $ 4.44Effect of dilutive
securities — Stockoptions. . . . . . . . . — 471 (0.07)
Diluted earnings pershare . . . . . . . . . . $139,024 31,814 $ 4.37
Fiscal 2006:Basic earnings per
share . . . . . . . . . . $ 86,122 30,936 $ 2.78Effect of dilutive
securities — Stockoptions. . . . . . . . . — 506 (0.04)
Diluted earnings pershare . . . . . . . . . . $ 86,122 31,442 $ 2.74
Fiscal 2005:Basic earnings per
share . . . . . . . . . . $ 26,011 30,412 $ 0.86Effect of dilutive
securities — Stockoptions. . . . . . . . . — 808 (0.03)
Diluted earnings pershare . . . . . . . . . . $ 26,011 31,220 $ 0.83
The calculation of diluted earnings per sharefor the years ended September 30, 2006 excludesconsideration of shares of common shares whichmay be issued in connection with outstandingstock options of 125,200 because such optionswere antidilutive. These options could potentiallydilute basic EPS in the future. For the yearsended September 30, 2007 and 2005, there wereno antidilutive options.
Use of estimates
The preparation of financial statements inconformity with accounting principles generallyaccepted in the United States requires manage-ment to make extensive use of estimates andassumptions that affect the reported amounts of
assets and liabilities and disclosure of contingentassets and liabilities at the date of the financialstatements and the reported amounts of revenuesand expenses during the reporting period. Actualresults could differ from those estimates.
NOTE 3 — SHARE-BASED COMPENSATION
Effective October 1, 2005, we adoptedSFAS 123(R), using the modified prospectiveapplication transition method. Under this method,stock-based compensation cost is measured atthe grant date, based on the calculated fair valueof the award, and is recognized as an expenseover the requisite service period (generally thevesting period of the equity grant). In addition,stock-based compensation cost recognizedincludes compensation cost for unvestedstock-based awards as of October 1, 2005. Priorto October 1, 2005, we accounted for share-basedcompensation in accordance with APB No. 25.No share-based employee compensation cost hasbeen reflected in net income prior to October 1,2005. Before that date, we reported the entire taxbenefit related to the exercise of stock options asan operating cash flow. SFAS 123(R) requires usto report the tax benefit from the tax deductionthat is in excess of recognized compensationcosts (excess tax benefits) as a financing cashflow rather than as an operating cash flow. Thecumulative effect of the change in accountingprinciple from APB No. 25 to FAS 123(R) was notmaterial.
On December 7, 2006, our Board of Directorsadopted, and our shareholders subsequentlyapproved on February 8, 2007, the AtwoodOceanics, Inc. 2007 Long-Term Incentive Plan,which is referred to herein as the “2007 Plan.”The effective date of the 2007 Plan was Decem-ber 7, 2006, and awards may be made under the2007 Plan through December 6, 2017. Under our2007 Plan, up to 2,000,000 shares of commonstock may be issued to eligible participants inthe form of restricted stock awards or upon exer-cise of stock options granted pursuant to the2007 Plan. We also have two other stock
35
Atwood Oceanics, Inc. and Subsidiaries
NOTES TO CONSOLIDATED FINANCIAL STATEMENTS — (Cont.)

incentive plans, the 2001 Plan and the 1996 Plan,under which there are outstanding stock optionsand restricted stock awards. However, no addi-tional options or restricted stock will be awardedunder the 2001 or 1996 plans.
A summary of share and stock option datafor our three stock incentive plans as ofSeptember 30, 2007 is as follows:
2007Plan
2001Plan
1996Plan
Shares available for futureawards or grants . . . . . . . 1,997,636 — —
Outstanding stock optiongrants . . . . . . . . . . . . . . . — 737,638 143,750
Outstanding unvestedrestricted stock awards . . 2,364 158,050 —
Awards of restricted stock and stock optionshave both been granted under our stock incen-tive plans as of September 30, 2007. We delivernewly issued shares of common stock forrestricted stock awards upon vesting and uponexercise of stock options. All stock incentiveplans currently in effect have been approved bythe shareholders of our outstanding commonstock.
The recognition of share-based compensa-tion expense had the following effect on ourconsolidated statements of operations (in thou-sands, except per share amounts):
2007 2006
Year EndedSeptember 30,
Increase in contract drillingexpenses. . . . . . . . . . . . . . . . . . . . $ 1,277 $ 840
Increase in general andadministrative expenses . . . . . . . . 3,728 3,728
Decrease in income tax provision . . . (1,305) (1,305)
Decrease in net income . . . . . . . . . . 3,700 3,263
Decrease in earnings per share:Basic . . . . . . . . . . . . . . . . . . . . . . $ 0.12 $ 0.11Diluted . . . . . . . . . . . . . . . . . . . . . $ 0.12 $ 0.10
We recognize compensation expense ongrants of share-based compensation awards on astraight-line basis over the required serviceperiod for each award. Unrecognized
compensation cost, net of estimated forfeitures,related to stock options and restricted stockawards and the relating remaining weightedaverage service period is as follows:
2007 2006September 30,
Unrecognized Compensation CostStock options . . . . . . . . . . . . . . . . . $3,674 $4,546Restricted stock awards . . . . . . . . . . 3,902 2,710
Total . . . . . . . . . . . . . . . . . . . . . . . . . . $7,576 $7,256
Remaining weighted average serviceperiod (Years) . . . . . . . . . . . . . . . . . 2.1 2.4
Stock Options
Under our stock incentive plans, the exerciseprice of each stock option must be equal to orgreater than the fair market value of one share ofour common stock on the date of grant, with alloutstanding options having a maximum term of10 years. Options vest ratably over a period fromthe end of the first to the fourth year from thedate of grant under the 2007 and 2001 Plans andfrom the end of the second to the fifth year fromthe date of grant under the 1996 Plan. Eachoption is for the purchase of one share of ourcommon stock.
The total fair value of stock options vestedduring years ended September 30, 2007, 2006and 2005 was $2.1 million, $3.2 million and$2.9 million, respectively. The per share weightedaverage fair value of stock options granted duringyears ended September 30, 2007, 2006 and 2005was $23.64, $17.87 and $10.22, respectively. Weestimated the fair value of each stock option onthe date of grant using the Black-Scholes pricingmodel and the following assumptions:
Fiscal2007
Fiscal2006
Fiscal2005
Risk-Free Interest Rate . . . . . 4.53% 4.50% 4.27%
Expected Volatility . . . . . . . . 45.96% 41.62% 35.00%
Expected Life (Years) . . . . . . 5.25 6 6
Dividend Yield . . . . . . . . . . . None None None
The average risk-free interest rate is basedon the five-year United States treasury security
36
Atwood Oceanics, Inc. and Subsidiaries
NOTES TO CONSOLIDATED FINANCIAL STATEMENTS — (Cont.)

rate in effect as of the grant date. We determinedexpected volatility using a two to six year histor-ical volatility figure and determined the expectedterm of the stock options using 10 to 15 years of
historical data. The expected dividend yield isbased on the expected annual dividend as apercentage of the market value of our commonstock as of the grant date.
A summary of stock option activity for years ended September 30, 2005, 2006 and 2007 is asfollows:
Numberof
Options
Wtd. Avg.Exercise
Price
Wtd. Avg.RemainingContractualLife (Years)
AggregateIntrinsic
Value (000s)
Outstanding at October 1, 2004 . . . . . . . . . . . . . . . . . . . . . . . . . . 1,965,350 $ 15.46Granted . . . . . . . . . . . . . . . . . . . . . . . . . . . . . . . . . . . . . . . . . . . 340,000 25.16Exercised . . . . . . . . . . . . . . . . . . . . . . . . . . . . . . . . . . . . . . . . . . (586,800) 14.69 $ 10,095Forfeited . . . . . . . . . . . . . . . . . . . . . . . . . . . . . . . . . . . . . . . . . . . (15,250) 17.85
Outstanding at September 30, 2005 . . . . . . . . . . . . . . . . . . . . . . . 1,703,300 $ 17.64 6.5 $ 42,342
Exercisable at September 30, 2005 . . . . . . . . . . . . . . . . . . . . . . . . 934,926 $ 16.27 5.1 $ 24,527
Outstanding at October 1, 2005 . . . . . . . . . . . . . . . . . . . . . . . . . . 1,703,300 $ 17.64Granted . . . . . . . . . . . . . . . . . . . . . . . . . . . . . . . . . . . . . . . . . . . 130,300 38.21Exercised . . . . . . . . . . . . . . . . . . . . . . . . . . . . . . . . . . . . . . . . . . (359,450) 16.93 $ 10,184Forfeited . . . . . . . . . . . . . . . . . . . . . . . . . . . . . . . . . . . . . . . . . . . (37,200) 22.64
Outstanding at September 30, 2006 . . . . . . . . . . . . . . . . . . . . . . . 1,436,950 $ 19.56 6.4 $ 36,518
Exercisable at September 30, 2006 . . . . . . . . . . . . . . . . . . . . . . . . 889,500 $ 16.61 5.3 $ 25,227
Outstanding at October 1, 2006 . . . . . . . . . . . . . . . . . . . . . . . 1,436,950 $19.56Granted. . . . . . . . . . . . . . . . . . . . . . . . . . . . . . . . . . . . . . . . . . . 79,400 49.97Exercised . . . . . . . . . . . . . . . . . . . . . . . . . . . . . . . . . . . . . . . . . (621,874) 16.05 $27,680Forfeited . . . . . . . . . . . . . . . . . . . . . . . . . . . . . . . . . . . . . . . . . . (13,088) 32.95
Outstanding at September 30, 2007 . . . . . . . . . . . . . . . . . . . . 881,388 $24.54 6.5 $45,854
Exercisable at September 30, 2007 . . . . . . . . . . . . . . . . . . . . . 480,245 $19.62 5.5 $27,345
Restricted Stock
We have also awarded restricted stock tocertain employees and to our non-employeedirectors. The awards of restricted stock toemployees are subject to three year vesting.Awards of restricted stock to non-employee direc-tors prior to March 2007 vested immediatelywhile awards granted in March 2007 are subjectto three year vesting. All restricted stock awardsgranted to date are restricted from transfer forthree years from the date of grant, whethervested or unvested. We value restricted stockawards at fair market value of our common stockon the date of grant.
37
Atwood Oceanics, Inc. and Subsidiaries
NOTES TO CONSOLIDATED FINANCIAL STATEMENTS — (Cont.)

A summary of restricted stock activity forthe years ended September 30, 2006 and 2007 isas follows:
Number ofShares
Wtd. Avg.Fair Value
Unvested at October 1, 2005 . . —Granted . . . . . . . . . . . . . . . . . 102,151 $38.46Vested . . . . . . . . . . . . . . . . . . (5,151) 46.57Forfeited . . . . . . . . . . . . . . . . . (4,400) 37.15
Unvested at September 30,2006 . . . . . . . . . . . . . . . . . . 92,600 $38.07
Granted . . . . . . . . . . . . . . . . . 78,314 $49.99Vested . . . . . . . . . . . . . . . . . . (7,300) 45.58Forfeited . . . . . . . . . . . . . . . . . (3,200) 45.96
Unvested at September 30,2007 . . . . . . . . . . . . . . . . . . 160,414 $43.39
Prior Year Pro Forma Expense
The following table illustrates the effect onnet income and earnings per share as if the fairvalue-based method provided by SFAS 123(R)had been applied for all outstanding andunvested awards for periods prior to our adoptionof SFAS 123(R) as of October 1, 2005 (in thou-sands, except per share amounts):
Fiscal2005
Net income, as reported . . . . . . . . . . . . . . . . . . $26,011Deduct: Total stock-based employee
compensation expense determined under fairvalue based method for all awards, net ofrelated tax effects . . . . . . . . . . . . . . . . . . . . . (1,671)
Pro Forma, net income . . . . . . . . . . . . . . . . . . . $24,340
Earnings per share:Basic — as reported . . . . . . . . . . . . . . . . . . . . . $ 0.86Basic — pro forma . . . . . . . . . . . . . . . . . . . . . . $ 0.80Diluted — as reported . . . . . . . . . . . . . . . . . . . . $ 0.83Diluted — pro forma . . . . . . . . . . . . . . . . . . . . . $ 0.78
NOTE 4 — PROPERTY AND EQUIPMENT
A summary of property and equipment byclassification is as follows (in thousands):
2007 2006
September 30,
Drilling vessels and relatedequipment
Cost . . . . . . . . . . . . . . . . . . . $ 778,469 $ 691,289
Accumulated depreciation . . . (292,790) (261,682)
Net book value . . . . . . . . 485,679 429,607
Drill Pipe
Cost . . . . . . . . . . . . . . . . . . . 15,587 13,271
Accumulated depreciation . . . (9,970) (8,257)
Net book value . . . . . . . . 5,617 5,014
Furniture and other
Cost . . . . . . . . . . . . . . . . . . . 9,211 7,920
Accumulated depreciation . . . (6,656) (6,375)
Net book value . . . . . . . . . . 2,555 1,545
NET PROPERTY ANDEQUIPMENT . . . . . . . . . . . . $ 493,851 $ 436,166
ATWOOD BEACON
The ATWOOD BEACON incurred damage toall three legs and its derrick while positioning fora well offshore of Indonesia in July 2004. The rigand its damaged legs were transported to thebuilder’s shipyard in Singapore for inspectionsand repairs. We had loss of hire insurance cover-age of $70,000 per day up to 180 days, whichbegan after a 30-day waiting period commencingJuly 28, 2004. Revenue recognized from thisinsurance coverage totaled approximately$7.7 million in fiscal year 2005 and is reflected asbusiness interruption proceeds on the Consoli-dated Statement of Operations. The rig subse-quently went back to work and continued towork through the beginning of fiscal year 2007,when we completed the remaining work to repairthe rig, and recognized additional loss of hirerevenue of $2.6 million, which is reflected asbusiness interruption proceeds on the Consoli-dated Statement of Operations. As of
38
Atwood Oceanics, Inc. and Subsidiaries
NOTES TO CONSOLIDATED FINANCIAL STATEMENTS — (Cont.)

September 30, 2007 and 2006, all costs incurredto date and business interruption proceedsearned related to this incident had been reim-bursed by the insurance carrier.
NOTE 5 — LONG-TERM DEBT
A summary of long-term debt is as follows(in thousands):
2007 2006
September 30,
Credit facility, bearing interest(market adjustable) atapproximately 7% per annum atSeptember 30, 2007 and 2006. . . . . $18,000 $64,000
Less — current maturities . . . . . . . . . 18,000 36,000
$ — $28,000
Our $250 million senior secured credit facil-ity in place at September 30, 2007, consisted of a5-year $150 million amortizing term loan facilityand a 5-year $100 million non-amortizing revolv-ing loan facility. The term portion of that creditfacility required quarterly payments of $9 millionuntil maturity on April 1, 2008. The credit facilitypermitted prepayment of principal at anytimewithout incurring a penalty. At September 30,2006, we had $54 million outstanding under theterm portion of our credit facility and $10 millionoutstanding under the revolving portion of ourcredit facility while at September 30, 2007, wehad $18 million outstanding under the term por-tion of our credit facility and none outstandingunder the revolving portion of our credit facility.The collateral at September 30, 2007 for the creditfacility consisted primarily of preferred mortgageson all eight of our active drilling units (with anaggregate net book value at September 30, 2007totaling approximately $378 million). We were notrequired to maintain compensating balances;however, we were required to pay a fee ofapproximately 0.60% per annum on the unusedportion of the revolving portion of our credit facil-ity and certain other administrative costs.
The credit facility in place at September 30,2007, contained financial covenants, including
but not limited to, requirements for maintainingcertain net worth and other financial ratios, andrestrictions on disposing of any material assets,paying cash dividends or repurchasing any of ouroutstanding common stock and incurring anyadditional indebtedness in excess of $3 million.We were in compliance with all financial cove-nants at September 30, 2007. Further, at all timesduring fiscal year 2005, 2006 and 2007 when wewere required to determine compliance with ourfinancial covenants, we were in compliance withthe covenants. Aside from the financial cove-nants, no other provisions existed in the creditfacility that could have resulted in acceleration ofthe April 1, 2008 maturity date.
The credit facility also supported issuance,when required, of standby letters of credit. AtSeptember 30, 2007, standby letters of credit inthe aggregate amount of approximately $7.1 mil-lion were outstanding.
Subsequent to September 30, 2007, weentered into a new credit agreement with severalbanks with Nordea Bank Finland PLC, New YorkBranch, as Administrative Agent for the lenders,as well as Lead Arranger and Book Runner. Thenew credit agreement provides for a secured5-year $300,000,000 non-amortizing revolving loanfacility with maturity in October 2012, subject toacceleration upon certain specified events ofdefaults, including breaches of representations orcovenants. Loans under the new facility will bearinterest at varying rates ranging from 0.70% to1.25% over Eurodollar Rate , depending upon theratio of outstanding debt to earnings before inter-est, taxes and depreciation. The new creditagreement supports the issuance, when required,of standby letters of credit. The standby letters ofcredit previously outstanding under our priorcredit facility were incorporated into our newcredit facility and are deemed issued thereunder.
The collateral for the new credit agreementconsists primarily of preferred mortgages on threeof our active drilling units (ATWOOD EAGLE,ATWOOD HUNTER and ATWOOD BEACON).The new credit agreement contains various
39
Atwood Oceanics, Inc. and Subsidiaries
NOTES TO CONSOLIDATED FINANCIAL STATEMENTS — (Cont.)

financial covenants that, among other things,require the maintenance of certain leverage andinterest expense coverage ratios. Under the newcredit agreement, we are required to pay a feeranging from 0.225% to 0.375% per annum on theunused portion of the credit facility and certainother administrative costs. The credit facility willprovide funding for future growth opportunitiesand for general corporate needs. As of Novem-ber 27, 2007, no funds have been borrowed underthe new credit facility. In conjunction with theestablishment of the new credit agreement, weterminated our prior senior secured credit facilityand repaid the remaining $18 million outstandingin October 2007. We will write off the remainingunamortized loan costs of approximately $0.4 mil-lion related to the prior credit facility in the firstquarter of fiscal year 2008.
NOTE 6 — INCOME TAXES
Domestic and foreign income before incometaxes for the three-year period ended Septem-ber 30, 2007 is as follows (in thousands):
Fiscal2007
Fiscal2006
Fiscal2005
Domestic income (loss) . . $ 8,788 $ 5,738 $ (45)
Foreign income . . . . . . . . 151,171 86,098 25,653
$159,959 $91,836 $25,608
The provision (benefit) for domestic and for-eign taxes on income consists of the following (inthousands):
Fiscal2007
Fiscal2006
Fiscal2005
Current — domestic. . . . . . $ 3,432 $ 58 $(3,278)
Deferred — domestic . . . . . (1,921) (392) (270)
Current — foreign . . . . . . . 19,672 6,688 2,205
Deferred — foreign . . . . . . (248) (640) 940
$20,935 $5,714 $ (403)
The components of the deferred income taxassets (liabilities) as of September 30, 2007 and2006 are as follows (in thousands):
2007 2006
September 30,
Deferred tax assets —Net operating loss
carryforwards . . . . . . . . . . . . . $ 1,110 $ 2,550Tax credit carryforwards . . . . . . 708 1,400Stock option compensation
expense . . . . . . . . . . . . . . . . . 1,944 1,215Book accruals . . . . . . . . . . . . . . 266 —-
4,028 5,165
Deferred tax liabilities -Difference in book and tax basis
of equipment . . . . . . . . . . . . . (16,937) (20,553)Unrecognized currency
exchange gain . . . . . . . . . . . . (722) —
(17,659) (20,553)
Net deferred tax liabilities beforevaluation allowance . . . . . . . . . . (13,631) (15,388)
Valuation allowance. . . . . . . . . . . . (708) (640)
$(14,339) $(16,028)
Net current deferred tax assets . . . $ 390 $ 2,563Net noncurrent deferred tax
liabilities . . . . . . . . . . . . . . . . . . (14,729) (18,591)
$(14,339) $(16,028)
The $1.1 million of net operating loss carry-forward (“NOL’s”), relates to the Australian NOLwhich does not expire. Management does notexpect that the tax credit carryforward of $0.7 mil-lion will be utilized to offset future tax obligationsbefore the credits begin to expire in 2012. Thus,a corresponding $0.7 million valuation allowanceis recorded as of September 30, 2007. An analysisof the change in the valuation allowance duringthe current fiscal year is as follows (inthousands):
Valuation Allowance as of September 30, 2006 . . . . $640
Foreign tax credit carryforwards generated . . . . . 68
Valuation Allowance as of September 30, 2007 . . . . $708
Under SFAS 123(R), $7.3 million ofUnited States NOL’s relates to windfall tax bene-fits, which will not be realized or recorded until
40
Atwood Oceanics, Inc. and Subsidiaries
NOTES TO CONSOLIDATED FINANCIAL STATEMENTS — (Cont.)

the deduction reduces our United States incometaxes payable. At such time, the amount will berecorded as an increase to paid-in-capital. Weapply the “with-and-without” approach when uti-lizing certain tax attributes whereby windfall taxbenefits are used last to offset taxable income.
We do not record federal income taxes onthe undistributed earnings of our foreign subsid-iaries that we consider to be permanently rein-vested in foreign operations. The cumulativeamount of such undistributed earnings wasapproximately $128 million at September 30,2007. It is not practicable to estimate the amountof any deferred tax liability associated with theundistributed earnings. If these earnings were tobe remitted to us, any United States incometaxes payable would be substantially reduced byforeign tax credits generated by the repatriationof the earnings. Such foreign tax credits totaledapproximately $57 million at September 30, 2007.
The differences between the United Statesstatutory and our effective income tax rate are asfollows:
Fiscal2007
Fiscal2006
Fiscal2005
Statutory income tax rate. . . . . . 35% 35% 35%
Resolution of prior period taxitems . . . . . . . . . . . . . . . . . . . (1) (7) (23)
Decrease in tax rate resultingfrom - Foreign tax ratedifferentials, net of foreign taxcredit utilization . . . . . . . . . . . (21) (22) (14)
Effective income tax rate . . . . . . 13% 6% (2)%
As a result of working in foreign jurisdic-tions, we earned a high level of operating incomeearned in certain nontaxable and deemed profittax jurisdictions which significantly reduced oureffective tax rate for fiscal years 2007, 2006 and2005 when compared to the United States statu-tory rate. There were no significant transactionsthat impacted our effective tax rate from thecurrent fiscal year; however, other significant
transactions that impacted our effective tax ratefrom prior fiscal years are as follows:
We reversed a $1.8 million tax contin-gent liability due to the expiration of thestatute of limitations in a foreign jurisdictionduring the third quarter of fiscal year 2006.In addition, we were advised by a foreigntax authority that it had approved accep-tance of certain amended prior year taxreturns. The acceptance of these amendedtax returns, along with the fiscal year 2005tax return in this foreign jurisdiction,resulted in the recognition of a $4.6 milliontax benefit in the third quarter of fiscal year2006.
During the first quarter of fiscal year2005, we received a $1.7 million tax refundin Malaysia related to a previously reservedtax receivable. A $1.0 million deferred taxbenefit was recognized in June 2005 due tothe filing and subsequent acceptance by thelocal tax authority, of amended prior year taxreturns. We received notification from theUnited States Department of Treasury that apreviously reserved United States income taxrefund we had been pursuing for over twoyears had been approved for payment. Basedupon this approval, we reduced our incometax provision by the refund amount of$3.3 million for the year ended September 30,2005.
During July 2007, we were notified by theMalaysian tax authorities regarding a potentialproposed adjustment relating to fiscal years 2000to 2003. Although we believe we are in compli-ance with applicable rules and regulations, weare currently evaluating the merit of the asser-tions by the Malaysian tax authorities and cur-rently plan to vigorously contest these assertions.While we cannot predict or provide assurance asto the final outcome of these allegations, we donot expect them to have a material adverse effecton our consolidated financial position, results ofoperations or cash flows.
41
Atwood Oceanics, Inc. and Subsidiaries
NOTES TO CONSOLIDATED FINANCIAL STATEMENTS — (Cont.)

NOTE 7 — CAPITAL STOCK
Preferred Stock
In 1975, 1,000,000 shares of preferred stockwith no par value were authorized. In October2002, we designated Series A Junior ParticipatingPreferred Stock. No preferred shares have beenissued.
Common Stock
In February 2006, our shareholders approveda proposal to increase the authorized shares ofour common stock from 20,000,000 shares to50,000,000 shares.
Rights Agreement
In September 2002, we authorized anddeclared a dividend of one Right (as defined inRights Agreement effective October 18, 2002,which governs the Rights) for each outstandingshare of common stock as of November 5, 2002,subject to lender approval and consent, whichwas obtained. One Right will also be associatedwith each share of common stock that becomesoutstanding after November 5, 2002 but beforethe earliest of the Distribution Date, the Redemp-tion Date and the Final Expiration Date (asdefined in Rights Agreement). The Rights are notexercisable until a person or group of affiliated orassociated persons begin to acquire or acquiresbeneficial ownership of 15 percent or more of ouroutstanding common stock. This provision doesnot apply to shareholders already holding 15 per-cent or more of our outstanding common stockas of November 5, 2002 until they acquire anadditional 5 percent.
In connection with our 2006 stock split, andin accordance with the Rights Agreement, wedecreased from one one-thousandth to one two-thousandth of a share the number of shares ofour Series A Junior Participating Preferred Stock,no par value, purchasable at a price of $150 uponthe exercise of each Right, when exercisable.The redemption price of the Rights was alsodecreased from $0.01 to $0.005 in connection
with the stock split. The Rights are subject tofurther adjustment for certain future eventsincluding any future stock splits. The Rights willexpire on November 5, 2012. At September 30,2007, 500,000 preferred shares have beenreserved for issuance in the event that Rights areexercised.
NOTE 8 — RETIREMENT PLANS
We have two contributory retirement plans(the “Plans”) under which qualified participantsmay make contributions, which together with ourcontributions, can be up to 100% of their com-pensation, as defined, to a maximum of $40,000.After six consecutive months of service, anemployee can elect to become a participant in aPlan. Participants must contribute from 1 to 5 per-cent of their earnings as a required contribution(“the basic contribution”). We make contributionsto the Plans equal to twice the basic contribu-tions. Our contributions vest 100% to each partic-ipant after three years of service with usincluding any period of ineligibility mandated bythe Plans. If a participant terminates employmentbefore becoming fully vested, the unvested por-tion is credited to our account and can be usedonly to offset our future contribution require-ments. During fiscal years 2007, 2006 and 2005,no forfeitures were utilized to reduce our cashcontribution requirements. In fiscal years 2007,2006 and 2005, our actual cash contributionstotaled approximately $3.5 million, $3.1 millionand $2.7 million, respectively. As of September 30,2007, there were approximately $0.2 million ofcontribution forfeitures, which can be utilized toreduce our future cash contributionrequirements.
NOTE 9 — FAIR VALUE OF FINANCIALINSTRUMENTS
The carrying values of cash and cash equiv-alents, accounts receivable, accounts payableand accrued liabilities included in the accompa-nying Consolidated Balance Sheets approximatefair value due to the short maturity of these
42
Atwood Oceanics, Inc. and Subsidiaries
NOTES TO CONSOLIDATED FINANCIAL STATEMENTS — (Cont.)

instruments. Since our prior credit facility (asdescribed in Note 5) had a market adjustableinterest rate, the carrying value approximated fairvalue as of September 30, 2007 and 2006.
NOTE 10 — CONCENTRATION OF MARKETAND CREDIT RISK
All of our customers are in the oil and gasoffshore exploration and production industry. Thisindustry concentration has the potential toimpact our overall exposure to market and creditrisks, either positively or negatively, in that ourcustomers could be affected by similar changesin economic, industry or other conditions. How-ever, we believe that the credit risk posed by thisindustry concentration is offset by the creditwor-thiness of our customer base.
Revenues from significant customers fromthe prior three fiscal years are as follows (inthousands):
Fiscal2007
Fiscal2006
Fiscal2005
Woodside Energy Ltd. . . $68,032 $78,442 $30,757
BHP Billiton PetoleumPTY. . . . . . . . . . . . . . . 53,410 5,151 9,070
Sarawak Shell Bhd . . . . . 50,502 32,841 24,446
Burullus Gas Company . . 12,991 39,053 22,118
Hoang Long & Hoan VuJoint OperatingCompanies . . . . . . . . . 2,800 32,114 16,557
NOTE 11 — COMMITMENTS ANDCONTINGENCIES
Operating Leases
Future minimum lease payments for operat-ing leases for fiscal years ending September 30are as follows (in thousands):
2008 . . . . . . . . . . . . . . . . . . . 1,644
2009 . . . . . . . . . . . . . . . . . . . 1,029
2010 . . . . . . . . . . . . . . . . . . . 854
2011 . . . . . . . . . . . . . . . . . . . 842
2012 and thereafter . . . . . . . 2,730
Total rent expense under operating leaseswas approximately $3.6 million, $3.5 million and$1.8 million for fiscal years ended September 30,2007, 2006, and 2005, respectively.
Litigation
We are party to a number of lawsuits whichare ordinary, routine litigation incidental to ourbusiness, the outcome of which, individually, orin the aggregate, is not expected to have a mate-rial adverse effect on our financial position,results of operations or cash flows.
NOTE 12 — RECENTLY ISSUED ACCOUNT-ING PRONOUNCEMENTS
In June 2006, the Financial Accounting Stan-dards Board issued FIN 48, “Accounting forUncertainty in Income Taxes — an Interpretationof FASB Statement 109.” FIN 48 prescribes acomprehensive model for recognizing, measuring,presenting, and disclosing uncertain tax positionswithin the financial statements. The provisions ofFIN 48 are effective for fiscal years beginningafter December 15, 2006. While we are still final-izing our evaluation of the impact of the adoptionof FIN 48, we believe the adoption will result in adecrease to shareholders equity of approximately$4 to $5 million at October 1, 2007.
In February 2007, the FASB issuedSFAS No. 159, “The Fair Value Option for Finan-cial Assets and Financial Liabilities”, which pro-vides companies with an option to reportselected financial assets and liabilities at fairvalue and establishes presentation and disclosurerequirements to facilitate comparisons betweencompanies that choose different measurementattributes for similar types of assets and liabili-ties. GAAP has required different measurementattributes for different assets and liabilities thatcan create artificial volatility in earnings. Theobjective of SFAS No. 159 is to help mitigate thistype of volatility in the earnings by enablingcompanies to report related assets and liabilitiesat fair value, which would likely reduce the needfor companies to comply with complex hedgeaccounting provisions. SFAS No. 159 is effective
43
Atwood Oceanics, Inc. and Subsidiaries
NOTES TO CONSOLIDATED FINANCIAL STATEMENTS — (Cont.)

for fiscal years beginning after November 15,2007. We are currently analyzing the provisions ofSFAS No. 159 and determining how it will affectaccounting policies and procedures, but we havenot yet made a determination of the impact theadoption will have on our consolidated financialposition, results of operations and cash flows.
In September 2005, the FASB issuedSFAS No. 157, “Fair Value Measurements”, whichdefines fair value, establishes methods used tomeasure fair value and expands disclosurerequirements about fair value measurements.SFAS No. 157 is effective for financial statementsissued for fiscal years beginning after Novem-ber 15, 2007, and interim periods within thosefiscal periods. We are currently analyzing theprovisions of SFAS No. 157 and determining howit will affect accounting policies and procedures,but we have not yet made a determination of the
impact the adoption will have on our consoli-dated financial position, results of operations andcash flows.
NOTE 13 — OPERATIONS BY GEOGRAPHICAREAS
We are engaged in offshore contract drilling.Our contract drilling operations consist of con-tracting owned or managed offshore drillingequipment primarily to major oil and gas explora-tion companies. Operating income is contractrevenues less operating costs, general andadministrative expenses and depreciation. Incomputing operating income (expense) for eachgeographic area, other income (expense) anddomestic and foreign income taxes were not con-sidered. Total assets are those assets that we usein operations in each geographic area.
A summary of revenues and operating margin for the fiscal years ended September 30, 2007, 2006and 2005 and identifiable assets by geographic areas as of September 30, 2007, 2006 and 2005 is asfollows (in thousands):
Fiscal2007
Fiscal2006
Fiscal2005
REVENUES:United States . . . . . . . . . . . . . . . . . . . . . . . . . . . . . . . . . . . . . . . . . . . . . . . . . . . . . $ 29,484 $ 20,249 $ 11,869Southeast Asia & India . . . . . . . . . . . . . . . . . . . . . . . . . . . . . . . . . . . . . . . . . . . . . 130,390 99,884 100,631Mediterranean & Black Sea . . . . . . . . . . . . . . . . . . . . . . . . . . . . . . . . . . . . . . . . . . 112,385 68,970 23,829Africa . . . . . . . . . . . . . . . . . . . . . . . . . . . . . . . . . . . . . . . . . . . . . . . . . . . . . . . . . . 65,893 27,676 —Australia . . . . . . . . . . . . . . . . . . . . . . . . . . . . . . . . . . . . . . . . . . . . . . . . . . . . . . . . 64,885 59,846 39,827
$403,037 $276,625 $176,156
OPERATING INCOME (EXPENSE):United States . . . . . . . . . . . . . . . . . . . . . . . . . . . . . . . . . . . . . . . . . . . . . . . . . . . . . $ 8,484 $ 6,778 $ (622)Southeast Asia & India . . . . . . . . . . . . . . . . . . . . . . . . . . . . . . . . . . . . . . . . . . . . . 106,544 68,875 45,432Mediterranean & Black Sea . . . . . . . . . . . . . . . . . . . . . . . . . . . . . . . . . . . . . . . . . . 27,471 25,592 2,142Africa . . . . . . . . . . . . . . . . . . . . . . . . . . . . . . . . . . . . . . . . . . . . . . . . . . . . . . . . . . 27,528 4,768 —Australia . . . . . . . . . . . . . . . . . . . . . . . . . . . . . . . . . . . . . . . . . . . . . . . . . . . . . . . . 13,109 10,393 (380)Coporate general and administrative expenses . . . . . . . . . . . . . . . . . . . . . . . . . . . . (23,929) (20,630) (14,245)
$159,207 $ 95,776 $ 32,327
TOTAL ASSETS:United States . . . . . . . . . . . . . . . . . . . . . . . . . . . . . . . . . . . . . . . . . . . . . . . . . . . . . $182,687 $ 69,651 $ 32,583Southeast Asia & India . . . . . . . . . . . . . . . . . . . . . . . . . . . . . . . . . . . . . . . . . . . . . 241,754 241,655 302,354Mediterranean & Black Sea . . . . . . . . . . . . . . . . . . . . . . . . . . . . . . . . . . . . . . . . . . 126,214 42,447 36,980Africa . . . . . . . . . . . . . . . . . . . . . . . . . . . . . . . . . . . . . . . . . . . . . . . . . . . . . . . . . . 36,074 117,760 980Australia . . . . . . . . . . . . . . . . . . . . . . . . . . . . . . . . . . . . . . . . . . . . . . . . . . . . . . . . 121,968 117,637 115,523General corporate and other . . . . . . . . . . . . . . . . . . . . . . . . . . . . . . . . . . . . . . . . . . 9,027 4,679 7,274
$717,724 $593,829 $495,694
44
Atwood Oceanics, Inc. and Subsidiaries
NOTES TO CONSOLIDATED FINANCIAL STATEMENTS — (Cont.)

NOTE 14 — QUARTERLY FINANCIAL DATA (UNAUDITED)
Summarized quarterly results for fiscal years 2007 and 2006 are as follows (in thousands, except pershare amounts):
December 31, March 31, June 30, September 30,QUARTERS ENDED(1)
Fiscal 2007
Revenues . . . . . . . . . . . . . . . . . . . . . . . . . . . . . . . . . . . . . . . . . $88,800 $94,262 $98,371 $121,604Income before income taxes . . . . . . . . . . . . . . . . . . . . . . . . . . . 24,463 37,618 36,569 61,309Net income . . . . . . . . . . . . . . . . . . . . . . . . . . . . . . . . . . . . . . . 21,085 31,757 32,033 54,149Earnings per common share —
Basic . . . . . . . . . . . . . . . . . . . . . . . . . . . . . . . . . . . . . . . . . . 0.68 1.02 1.02 1.71Diluted . . . . . . . . . . . . . . . . . . . . . . . . . . . . . . . . . . . . . . . . . 0.67 1.01 1.00 1.69
Fiscal 2006
Revenues . . . . . . . . . . . . . . . . . . . . . . . . . . . . . . . . . . . . . . . . . $55,414 $67,529 $71,865 $ 81,817Income before income taxes . . . . . . . . . . . . . . . . . . . . . . . . . . . 17,027 18,318 28,606 27,885Net income . . . . . . . . . . . . . . . . . . . . . . . . . . . . . . . . . . . . . . . 14,523 15,629 32,791 23,179Earnings per common share —
Basic . . . . . . . . . . . . . . . . . . . . . . . . . . . . . . . . . . . . . . . . . . 0.47 0.51 1.06 0.75Diluted . . . . . . . . . . . . . . . . . . . . . . . . . . . . . . . . . . . . . . . . . 0.47 0.50 1.04 0.74
(1) The sum of the individual quarterly net income per common share amounts may not agree withyear-to-date net income per common share as each quarterly computation is based on the weightedaverage number of common shares outstanding during that period.
45
Atwood Oceanics, Inc. and Subsidiaries
NOTES TO CONSOLIDATED FINANCIAL STATEMENTS — (Cont.)

DIRECTORS AND OFFICERS
DIRECTORSDEBORAH A. BECK (2, 3, 4)
Corporate Executive, RetiredMilwaukee, Wisconsin
ROBERT W. BURGESS (2, 3, 4)Financial Executive, RetiredOrleans, Massachusetts
GEORGE S. DOTSON (1, 2, 3, 4)Corporate Executive, RetiredTulsa, Oklahoma
HANS HELMERICH (1, 4)President, Chief Executive OfficerHelmerich & Payne, Inc.Tulsa, Oklahoma
JOHN R. IRWIN (1)President, Chief Executive OfficerAtwood Oceanics, Inc.Houston, Texas
JAMES M. MONTAGUE (3, 4)Corporate Executive, RetiredHouston, Texas
WILLIAM J. MORRISSEY (2, 4)Bank Executive, RetiredElkhorn, Wisconsin
(1) Executive Committee(2) Audit Committee(3) Compensation Committee(4) Nominating & Corporate Governance Committee
OFFICERSJOHN R. IRWIN
President, Chief Executive Officer
JAMES M. HOLLANDSenior Vice President, Chief Financial Officer andSecretary
GLEN P. KELLEYSenior Vice President — Marketing and Administration
DARRYL SMITHVice President — Operations
ALAN QUINTEROVice President — Engineering
ANNUAL MEETING
The annual meeting of stockholders will be held at10:00 A.M., Central Standard Time, on Thursday, Febru-ary 14, 2008 at our principal office: 15835 Park Ten PlaceDrive, Houston, Texas, 77084. A formal notice of the meetingtogether with a proxy statement and form of proxy will bemailed to stockholders on or about January 15, 2008.
TRANSFER AGENT AND REGISTRARContinental Stock Transfer & Trust Company2 BroadwayNew York, New York 10004
FORM 10-K
A copy of our Form 10-K to which this Annual Reportis an exhibit is filed with the Securities and ExchangeCommission and is available free on request by writing to:
Secretary, Atwood Oceanics, Inc.P. O. Box 218350Houston, Texas 77218
We file our annual report on Form 10-K, quarterly andcurrent reports, proxy statements, and other informationwith the SEC. Our annual report on Form 10-K for the yearended September 30, 2007 includes as exhibits all requiredSarbanes-Oxley Act Section 302 certifications by our CEOand CFO regarding the quality of our public disclosure.Our SEC filings are available to the public over the internetat the SEC’s web site at http://www.sec.gov. Our websiteaddress is www.atwd.com. We make available free ofcharge on or through our website our annual report onForm 10-K, quarterly reports on Form 10-Q, and currentreports on Form 8-K, and amendments to those reportsfiled or furnished pursuant to Section 13(a) or 15(d) of theExchange Act as soon as reasonably practicable after weelectronically file such material with, or furnish it to, theSEC. Information on our website is not incorporated byreference into this report or made a part hereof for anypurpose. You may also read and copy any document wefile, including our Form 10-K, at the SEC’s Public ReferenceRoom at 100F Street, NE, Washington, DC 20549. Pleasecall the SEC at 1-800-SEC-0330 for further information onthe public reference rooms and copy charges.
Each year, our CEO must certify to the NYSE that heis not aware of any violations of NYSE corporate gover-nance listing standards by us. Our CEO’s certification forfiscal year 2006 was submitted to the NYSE during fiscalyear 2007, and our CEO will certify fiscal year 2007 duringfiscal year 2008.
STOCK PRICE INFORMATION —
The common stock of Atwood Oceanics, Inc. is tradedon the New York Stock Exchange (“NYSE”) under thesymbol “ATW”. No cash dividends on common stock werepaid in fiscal year 2006 or 2007, and none are anticipatedin the foreseeable future. We have approximately 10,700beneficial owners of our common stock based upon infor-mation provided to us by a third party shareholder servicesprovider dated November 20, 2007. As of November 27,2007, the closing sale price of the common stock ofAtwood Oceanics, Inc., as reported by NYSE, was $76.22per share. The following table sets forth the range of highand low sales prices per share of common stock asreported by the NYSE for the periods indicated.
Quarters Ended Low High Low High
Fiscal 2007 Fiscal 2006
December 31 . . . . . . $40.72 $52.12 $32.55 $42.75
March 31 . . . . . . . . 43.77 58.97 39.90 51.66
June 30 . . . . . . . . . . 58.11 70.12 42.29 58.44
September 30 . . . . . 61.02 81.60 39.86 50.64
46

COMMON STOCK PRICE PERFORMANCE GRAPH
BELOW IS A COMPARISON OF FIVE (5) YEAR CUMULATIVE TOTAL RETURNS* AMONG ATWOODOCEANICS, INC. AND THE CENTER FOR RESEARCH IN SECURITY PRICES (“CRSP”) INDEX FOR THE NYSE/AMEX/NASDAQ STOCK MARKETS, AND OUR SELF-DETERMINED PEER GROUP OF DRILLING COMPANIES.
0
100
200
300
400
500
600
9/28/079/29/069/30/059/30/049/30/039/30/02
Self-Determined Peer Group
NYSE/AMEX/NASDAQStock Market (U.S. Companies)
ATWOOD OCEANICS, INC.9/30/02 9/30/03 9/30/04 9/30/05 9/29/06 9/28/07
100.00 82.0 162.5 287.9 307.5 523.5
100.00 126.6 144.9 165.9 183.1 213.3
100.00 107.4 151.9 240.6 260.3 389.1
Constituents of the Self-Determined Peer Group (weighted according to market capitalization):
Diamond Offshore Drilling, Inc. GlobalSantaFe Corporation Rowan Companies, Inc. Transocean, Inc.
ENSCO International, Inc. Noble Corporation Pride International, Inc.
* Assumptions: (1) $100 invested on September 30, 2002; (2) dividends, if any, were reinvested; and (3) aSeptember 30 fiscal year end.
47


Atwood Oceanics, Inc.15835 Park Ten Place DriveP.O. Box 218350Houston, Texas 77218
ANNUAL REPORT FOR 2007