Embed Size (px)
Citation preview
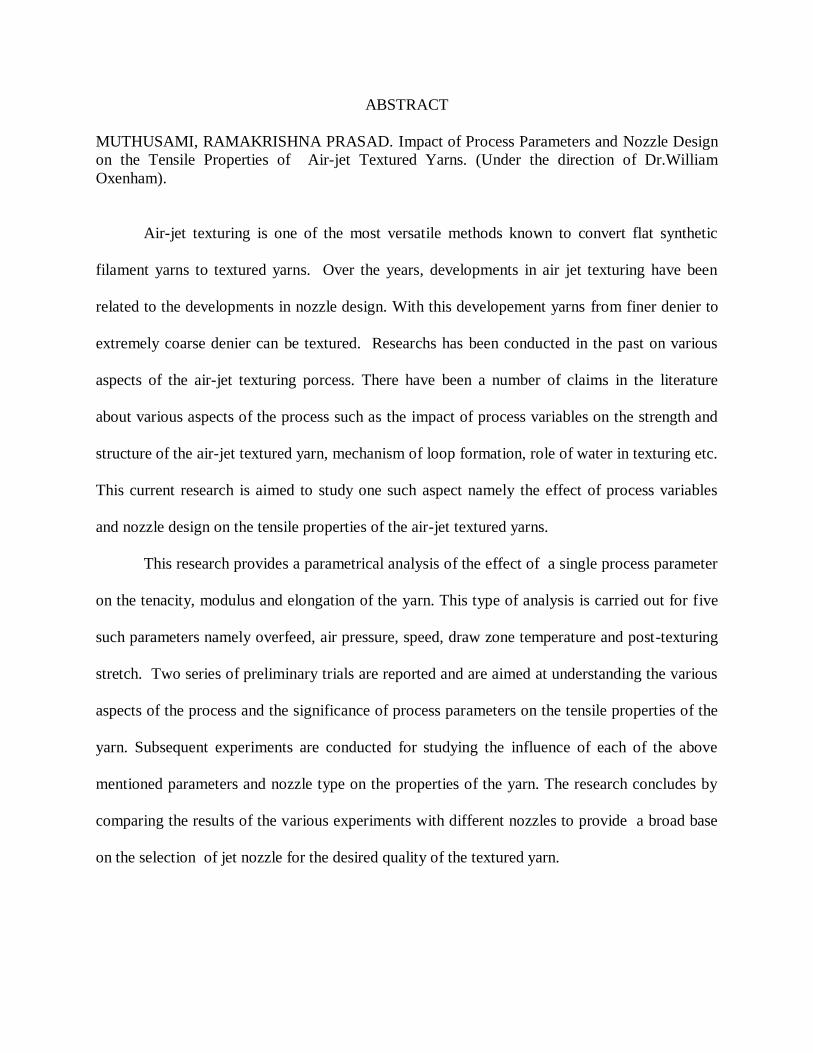
ABSTRACT
MUTHUSAMI, RAMAKRISHNA PRASAD. Impact of Process Parameters and Nozzle Design
on the Tensile Properties of Air-jet Textured Yarns. (Under the direction of Dr.William
Oxenham).
Air-jet texturing is one of the most versatile methods known to convert flat synthetic
filament yarns to textured yarns. Over the years, developments in air jet texturing have been
related to the developments in nozzle design. With this developement yarns from finer denier to
extremely coarse denier can be textured. Researchs has been conducted in the past on various
aspects of the air-jet texturing porcess. There have been a number of claims in the literature
about various aspects of the process such as the impact of process variables on the strength and
structure of the air-jet textured yarn, mechanism of loop formation, role of water in texturing etc.
This current research is aimed to study one such aspect namely the effect of process variables
and nozzle design on the tensile properties of the air-jet textured yarns.
This research provides a parametrical analysis of the effect of a single process parameter
on the tenacity, modulus and elongation of the yarn. This type of analysis is carried out for five
such parameters namely overfeed, air pressure, speed, draw zone temperature and post-texturing
stretch. Two series of preliminary trials are reported and are aimed at understanding the various
aspects of the process and the significance of process parameters on the tensile properties of the
yarn. Subsequent experiments are conducted for studying the influence of each of the above
mentioned parameters and nozzle type on the properties of the yarn. The research concludes by
comparing the results of the various experiments with different nozzles to provide a broad base
on the selection of jet nozzle for the desired quality of the textured yarn.
Impact of Process Parameters and Nozzle Design on the Tensile Properties of Air-jet
Textured Yarns.
by
Ramakrishna Prasad Muthusami
A thesis submitted to the Graduate Faculty of
North Carolina State University
in partial fulfillment of the
requirements for the Degree of
Master of Science
Textiles
Raleigh, North Carolina
2011
APPROVED BY:
_______________________________ ______________________________
Dr. Pamela Banks-Lee Prof. Nancy Powell
Dr. William Oxenham
Chair of Advisory Committee

ii
BIOGRAPHY
The author, Ramakrishna Prasad Muthusami, was born on 2nd
July, 1985 in a town called
Erode in Southern India to his parents Mr. Muthusami Sengodan and Mrs. Poongodi Muthusami.
He graduated his high school from Bharathi Vidya Bhavan in his hometown. He graduated with
his Bachelor degree in Textile Technology from the prestigious Anna University in Chennai. He
then pursued his Master‘s degree in North Carolina State University, Raleigh, North Carolina.
He wishes to take over and expand his family business of yarn manufacturing with the help of
knowledge he acquired throught out his education.
iii
ACKNOWLEDGEMENTS
First and foremost, I would like to offer my sincere thanks to my advisor Dr.William
Oxenham for all his support and encouragement through out the course of the research. I would
also like to extend my gratitude towards Prof. Nancy Powell and Dr. Pamela Banks-Lee for
helping me complete my two and a half year education here at North Carolina State Universtity
with wonderful experience and great knowledge.
I also take this opportunity to acknowledge the great support rendered to me through out
the course of the research by Mr.Edmir Silva and Mr.Michael Whitaker of Unifi Inc,
Yadkinville, North Carolina. Special thanks to both of them.
Also, I thank all my friends and fellow graduate students for being with me for the past
two years sharing my experience and helping me in everyway possible when the situation
demanded. Special thanks to Ms. Liu lu for helping me with SAS program.
Finally I would like to thank my parents and my family for their continuous support and
care which encouraged me in doing this research.
iv
TABLE OF CONTENTS
LIST OF TABLES ......................................................................................................................v
LIST OF FIGURES ................................................................................................................. vii
1.INTRODUCTION AND OVERVIEW .................................................................................. 1
1.1 INTRODUCTION ................................................................................................................................................. 1
1.2 OVERVIEW OF THE PROJECT.................................................................................................................................. 2
1.3 PURPOSE OF TEXTURING ...................................................................................................................................... 3
1.4 CLASSIFICATIONS IN TEXTURING............................................................................................................................. 4
1.4.1 Thermo-mechanical texturing ................................................................................................................ 4
1.4.2 Mechanical texturing ............................................................................................................................. 4
1.4.3 Other Texturing Techniques ................................................................................................................... 5
1.4.3.1 Bi-component filament texturing..................................................................................................................... 5 1.4.3.2 Differential Shrinkage Texturing ...................................................................................................................... 6 1.4.3.3 Chemical Texturing ......................................................................................................................................... 6
1.5 FALSE- TWIST TEXTURING .................................................................................................................................... 6
1.6 AIR-JET TEXTURING ........................................................................................................................................... 7
1.6.1 Principle of air-jet texturing ................................................................................................................... 7
1.6.2 Scope of present study ........................................................................................................................... 9
2. LITERATURE REVIEW ................................................................................................... 10
2.1 STATE OF THE AIR-JET TEXTURING PROCESS ........................................................................................................... 10
2.2 EVOLUTION OF AIR-JET TEXTURING PROCESS .......................................................................................................... 10
2.2.1Nozzle development ............................................................................................................................. 11
2.2.2Wetting of the supply yarn ................................................................................................................... 13
2.2.2.1 Effects of wetting on the airflow ....................................................................................................................14 2.2.2.2 Effects of wetting on friction in air-jet texturing process .................................................................................14 2.2.2.3 Effect of wetting on the physical properties of the yarn ..................................................................................14 2.2.2.4 Significance of quantity of water ....................................................................................................................15 2.2.2.5 Issue with the previous explanations for the role of water in texturing ............................................................15
2.2.3 Loop formation mechanism ................................................................................................................. 16
2.2.3.1 Mechanism according to Acar, Turton and Wray .............................................................................................16 2.2.3.2 Mechanism according to Sengupta, Kothari and Srinivvasan ...........................................................................17
2.2.4 Factors affecting loop formation .......................................................................................................... 17
2.2.4.1 Effects of air pressure ....................................................................................................................................17 2.2.4.2 Effects of overfeed .........................................................................................................................................18
2.2.4.3 Effects of texturing speed ..............................................................................................................................18 2.2.4.4 Effects of other elements ...............................................................................................................................19
2.2.5 Air jet textured yarns ........................................................................................................................... 19
2.2.5.1 Single-end air-jet textured yarns ....................................................................................................................20 2.2.5.2 Parallel-end air-jet texturing yarns .................................................................................................................20 2.2.5.3 Core and effect air-jet textured yarns .............................................................................................................20
2.2.6 Applications of air-jet textured yarns ................................................................................................... 20
v
3. EXPERIMENTAL ............................................................................................................. 22
3.1 INTRODUCTION ............................................................................................................................................... 22
3.2 MATERIAL USED .............................................................................................................................................. 22
3.3 AIR-JET TEXTURING MACHINE ............................................................................................................................. 22
3.4 NOZZLES ....................................................................................................................................................... 26
3.4.1 Nozzle maintenance ............................................................................................................................ 27
3.5 OPERATING PROCEDURE ................................................................................................................................... 27
3.6 TESTING ........................................................................................................................................................ 31
4. RESULTS AND DISCUSSIONS ........................................................................................ 33
4.1 INTRODUCTION ............................................................................................................................................... 33
4.2 PRELIMINARY TRIALS WITH OLD JETS ..................................................................................................................... 33
4.2.1- T100 trials .......................................................................................................................................... 33
4.2.2- T351 trials .......................................................................................................................................... 35
4.3 PRELIMINARY TRIALS WITH NEW JETS .................................................................................................................... 38
4.4 HIGH SPEED TEXTURING .................................................................................................................................. 40
4.5 S325 EXPERIMENTS ........................................................................................................................................ 40
4.5.1 Overfeed ............................................................................................................................................. 40
4.5.2 Pressure .............................................................................................................................................. 43
4.5.3 Take up speed ..................................................................................................................................... 46
4.5.4 Temperature ....................................................................................................................................... 48
4.5.5 Post- Texturing Stabilization ................................................................................................................ 50
4.6 S315 EXPERIMENTS ........................................................................................................................................ 53
4.6.1 Overfeed ............................................................................................................................................. 53
4.6.2 Pressure .............................................................................................................................................. 55
4.6.3 Take-up speed ..................................................................................................................................... 57
4.6.4 Temperature ....................................................................................................................................... 59
4.6.5 Post-Texturing Stablization .................................................................................................................. 61
4.7 A317 EXPERIMENTS ........................................................................................................................................ 63
4.7.1 Overfeed ............................................................................................................................................. 63
4.5.2 Pressure .............................................................................................................................................. 65
4.7.3 Take-up speed ..................................................................................................................................... 67
4.7.4 Temperature ....................................................................................................................................... 69
4.7.5 Post-Texturing Stabilization ................................................................................................................. 71
5.CONCLUSION AND RECOMMENDATIONS ................................................................. 74
REFERENCES........................................................................................................................ 80
APPENDICES ......................................................................................................................... 82
APPENDIX I ........................................................................................................................... 83
APPENDIX II.......................................................................................................................... 89
vi
LIST OF TABLES
TABLE 1: PROPERTY AND APPLICATIONS OF DIFFERENT AIR-TEXTURED YARNS........................ 21
TABLE 2: SPECIFICATIONS OF DIFFERENT JET NOZZLES.............................................................. 26
TABLE 2A: SPECIFICATIONS OF T-SERIES JET NOZZLES USED IN PRELIMINARY TRIALS ............... 27
TABLE 3: PARAMETERS FOR EFFECT OF OVERFEED T100 JET ...................................................... 33
TABLE 4: EFFECT OF OVERFEED WITH T100 JET .......................................................................... 34
TABLE 5: PARAMETERS FOR EFFECT OF PRESSURE WITH T351................................................... 36
TABLE 6: EFFECT OF PRESSURE WITH T351 ................................................................................. 36
TABLE 7: DESIGN OF EXPERIMENT (L18 ARRAY) ......................................................................... 39
TABLE 8: PARAMETERS USED FOR PRELIMINARY TRIALS WITH NEW JETS .................................. 39
TABLE 9: INFLUENCE OF PARAMETERS ON THE YARN PROPERTIES ............................................ 40
TABLE 10: PARAMETERS FOR EFFECT OF OVERFEED WITH S325 .................................................. 41
TABLE 11: EFFECT OF OVERFEED ON S325 YARNS ....................................................................... 41
TABLE 12: PARAMETERS FOR EFFECT OF PRESSURE WITH S325 ................................................... 43
TABLE 13: EFFECT OF PRESSURE ON S325 YARNS ........................................................................ 43
TABLE 14: PARAMETERS FOR EFFECT OF TAKE UP SPEED WITH S325........................................... 46
TABLE 15: EFFECT OF TAKE UP SPEED ON S325 YARNS ................................................................ 46
TABLE 16: PARAMETERS FOR EFFECT OF DRAW ZONE TEMPERATURE WITH S325 ....................... 48
TABLE 17: EFFECT OF DRAW ZONE TEMPERATURE ON S325 YARNS ............................................ 49
TABLE 18: PARAMETERS FOR EFFECT OF POST-TEXTURING STRETCH WITH S325 ........................ 51
TABLE 19: EFFECT OF POST-TEXTURING STRETCH ON S325 YARNS ............................................. 51
TABLE 20: PARAMETERS FOR EFFECT OF OVERFEED WITH S315 .................................................. 53
TABLE 21: EFFECT OF OVERFEED ON S315 YARNS ....................................................................... 53
TABLE 22: PARAMETERS FOR EFFECT OF PRESSURE WITH S315 ................................................... 55
TABLE 23: EFFECT OF PRESSURE ON S315 YARNS ........................................................................ 55
TABLE 24: PARAMETERS FOR EFFECT OF TAKE UP SPEED WITH S315........................................... 57
TABLE 25: EFFECT OF TAKE UP SPEED ON S315 YARNS ................................................................ 57
vii
TABLE 26: PARAMETERS FOR EFFECT OF DRAW ZONE TEMPERATURE WITH S315 ....................... 59
TABLE 27: EFFECT OF DRAW ZONE TEMPERATURE ON S315 YARNS ............................................ 59
TABLE 28: PARAMETERS FOR EFFECT OF POS-TEXTURING STRETCH WITH S315 .......................... 61
TABLE 29: EFFECT OF POST-TEXTURING STRETCH ON S315 YARNS ............................................. 61
TABLE 30: PARAMETERS FOR EFFECT OF OVERFEED WITH A317 ................................................. 63
TABLE 31: EFFECT OF OVERFEED ON A317 YARNS ...................................................................... 64
TABLE 32: PARAMETERS FOR EFFECT OF PRESSURE WITH A317 .................................................. 65
TABLE 33: EFFECT OF PRESSURE ON A317 YARNS ....................................................................... 66
TABLE 34: PARAMETERS FOR EFFECT OF TAKE UP SPEED WITH A317 .......................................... 67
TABLE 35: EFFECT OF TAKE UP SPEED ON A317 YARNS ............................................................... 68
TABLE 36: PARAMETERS FOR EFFECT OF DRAW ZONE TEMPERATURE WITH A317 ....................... 69
TABLE 37: EFFECT OF DRAW ZONE TEMPERATURE ON A317 YARNS ............................................ 70
TABLE 38: PARAMETERS FOR EFFECT OF POST-TEXTURING STRETCH WITH A317 ........................ 71
TABLE 39: EFFECT OF POST-TEXTURING STRETCH ON A317 YARNS ............................................. 72
TABLE 40: IMPORTANCE OF THE PARAMETER IN INFLUENCING THE TENACITY OF THE YARN
FROM DIFFERENT JET NOZZLES ................................................................................................................... 72
viii
LIST OF FIGURES
FIGURE 1.1 PROCESS FLOW OF AIR-JET TEXTURING ...................................................................... 8
FIGURE 2.1 TASLAN IX JET NOZZLE WITH AXIAL AIR FLOW ........................................................ 12
FIGURE 2.2: MECHANISM OF LOOP FORMATION ACCORDING TO ACAR ET AL ............................. 16
FIGURE 2.3: EFFECT OF OVERFEED ON LOOP FORMATION ........................................................... 18
FIGURE 3.1: STÄHLE-ELTEX AIR TEXTURING MACHINE............................................................... 23
FIGURE 3.2: CREEL STAND .......................................................................................................... 23
FIGURE 3.3: CERAMIC GUIDE WITH AN ELECTRONIC YARN BREAKAGE DETECTOR ..................... 23
FIGURE 3.4: GUIDE TUBES .......................................................................................................... 24
FIGURE 3.5: GODET ROLLERS ..................................................................................................... 24
FIGURE 3.6: TEXTURING BOX ..................................................................................................... 25
FIGURE 3.7: STRETCH-ZONE ....................................................................................................... 25
FIGURE 3.8: TRAVERSE GUIDE .................................................................................................... 25
FIGURE 3.9: NOZZLES USED IN RESEARCH .................................................................................. 26
FIGURE 3.10: NOZZLES USED IN PRELIMINARY TRIALS ........................................................................... 26
FIGURE 3.11 ULTRASONIC CLEANER ........................................................................................... 27
FIGURE 3.12: POWER SUPPLY SWITCH ......................................................................................... 28
FIGURE 3.13: ELECTRIC PANEL SWITCH ...................................................................................... 28
FIGURE 3.14: CONTROL VOLTAGE SWITCH.................................................................................. 28
FIGURE 3.15: START BUTTON PANEL ........................................................................................... 29
FIGURE 3.16: AIR SUPPLY CONTROLS .......................................................................................... 29
FIGURE 3.17: STÄEHLE TEXTURING SOFTWARE .......................................................................... 30
FIGURE 3.18: SAVING AND LOADING RECIPES ON STÄEHLE TEXTURING ..................................... 30
FIGURE 3.19: EDITING PARAMETER FOR A RECIPE IN STÄEHLE TEXTURING ................................ 31
FIGURE 3.20: MTS® TENSILE TESTER .......................................................................................... 32
FIGURE 4.1: INFLUENCE OF OVERFEED ON TENACITY OF T100 YARNS ......................................... 34
FIGURE 4.2: INFLUENCE OF OVERFEED ON MODULUS OF T100 YARNS ......................................... 35
ix
FIGURE 4.3: INFLUENCE OF OVERFEED ON ELONGATION OF T100 YARNS .................................... 35
FIGURE 4.4 INFLUENCE OF PRESSURE ON TENACITY OF T351 YARNS .......................................... 36
FIGURE 4.5 INFLUENCE OF PRESSURE ON MODULUS OF T351 YARNS ........................................... 37
FIGURE 4.6 INFLUENCE OF PRESSURE ON ELONGATION OF T351 YARNS ...................................... 37
FIGURE 4.7: TENACITY OF S325 YARNS WITH DIFFERENT OVERFEED PERCENTAGE ..................... 42
FIGURE 4.8: MODULUS OF S325 YARNS WITH DIFFERENT OVERFEED PERCENTAGE ..................... 42
FIGURE 4.9: ELONGATION OF S325 YARNS WITH DIFFERENT OVERFEED PERCENTAGE ................ 43
FIGURE 4.10: TENACITY OF S325 YARNS WITH DIFFERENT PRESSURE SETTING ............................ 44
FIGURE 4.11: MODULUS OF S325 YARNS WITH DIFFERENT PRESSURE SETTING ............................ 45
FIGURE 4.12: ELONGATION OF S325 YARNS WITH DIFFERENT PRESSURE SETTING ....................... 45
FIGURE 4.13: TENACITY OF S325 YARNS AT DIFFERENT TAKE UP SPEEDS .................................... 47
FIGURE 4.14: MODULUS OF S325 YARNS AT DIFFERENT TAKE UP SPEEDS .................................... 47
FIGURE 4.15: ELONGATIONS OF S325 YARNS AT DIFFERENT TAKE UP SPEEDS ............................. 47
FIGURE 4.16: TENACITY OF S325 YARNS WITH DIFFERENT DRAW ZONE TEMPERATURE SETTING 49
FIGURE 4.17: MODULUS OF S325 YARNS WITH DIFFERENT DRAW ZONE TEMPERATURE SETTING 50
FIGURE 4.18: ELONGATION OF S325 YARNS WITH DIFFERENT DRAW ZONE TEMPERATURE SETTING
................................................................................................................................................. 50
FIGURE 4.19: TENACITY OF S325 YARNS WITH DIFFERENT MECHANICAL STRETCH ..................... 51
FIGURE 4.20: MODULUS OF S325 YARNS WITH DIFFERENT MECHANICAL STRETCH...................... 52
FIGURE 4.21: ELONGATION OF S325 YARNS WITH DIFFERENT MECHANICAL STRETCH................. 52
FIGURE 4.22: TENACITY OF S315 YARNS WITH DIFFERENT OVERFEED PERCENTAGE................... 54
FIGURE 4.23: MODULUS OF S315 YARNS WITH DIFFERENT OVERFEED PERCENTAGE ................... 54
FIGURE 4.24: ELONGATION OF S315 YARNS WITH DIFFERENT OVERFEED PERCENTAGE............... 54
FIGURE 4.25: TENACITY OF S315 YARNS WITH DIFFERENT PRESSURE SETTING ............................ 56
FIGURE 4.26: MODULUS OF S315 YARNS WITH DIFFERENT PRESSURE SETTING ............................ 56
FIGURE 4.27: ELONGATION OF S315 YARNS WITH DIFFERENT PRESSURE SETTING ....................... 56
FIGURE 4.28: TENACITY OF S315 YARNS AT DIFFERENT TAKE UP SPEEDS .................................... 58
FIGURE 4.29: MODULUS OF S315 YARNS AT DIFFERENT TAKE UP SPEEDS .................................... 58
FIGURE 4.30: ELONGATION OF S315 YARNS AT DIFFERENT TAKE UP SPEEDS ............................... 58
x
FIGURE 4.31: TENACITY OF S315 YARNS WITH DIFFERENT DRAW ZONE TEMPERATURE SETTING 60
FIGURE 4.32: MODULUS OF S315 YARNS WITH DIFFERENT DRAW ZONE TEMPERATURE SETTING 60
FIGURE 4.33: ELONGATION OF S315 YARNS WITH DIFFERENT DRAW ZONE TEMPERATURE SETTING
................................................................................................................................................. 60
FIGURE 4.34: TENACITY OF S315 YARNS WITH DIFFERENT MECHANICAL STRETCH ..................... 62
FIGURE 4.35: MODULUS OF S315 YARNS WITH DIFFERENT MECHANICAL STRETCH...................... 62
FIGURE 4.36: ELONGATION OF S315 YARNS WITH DIFFERENT MECHANICAL STRETCH................. 63
FIGURE 4.37: TENACITY OF A317 YARNS WITH DIFFERENT OVERFEED PERCENTAGE ................... 64
FIGURE 4.38: MODULUS OF A317 YARNS WITH DIFFERENT OVERFEED PERCENTAGE ................... 64
FIGURE 4.39: ELONGATION OF A317 YARNS WITH DIFFERENT OVERFEED PERCENTAGE .............. 65
FIGURE 4.40: TENACITY OF A317 YARNS WITH DIFFERENT PRESSURE SETTING ........................... 66
FIGURE 4.41: MODULUS OF A317 YARNS WITH DIFFERENT PRESSURE SETTING ........................... 66
FIGURE 4.42: ELONGATION OF A317 YARNS WITH DIFFERENT PRESSURE SETTING ...................... 67
FIGURE 4.43: TENACITY OF A317 YARNS AT DIFFERENT TAKE UP SPEEDS ................................... 68
FIGURE 4.44: MODULUS OF A317 YARNS AT DIFFERENT TAKE UP SPEEDS .................................... 68
FIGURE 4.45: ELONGATION OF A317 YARNS AT DIFFERENT TAKE UP SPEEDS ............................... 69
FIGURE 4.46: TENACITY OF A317 YARNS WITH DIFFERENT DRAW ZONE TEMPERATURE SETTING
................................................................................................................................................. 70
FIGURE 4.47: MODULUS OF A317 YARNS WITH DIFFERENT DRAW ZONE TEMPERATURE SETTING 70
FIGURE 4.48: ELONGTION OF A317 YARNS WITH DIFFERENT DRAW ZONE TEMPERATURE SETTING
................................................................................................................................................. 71
FIGURE 4.49: TENACITY OF A317 YARNS WITH DIFFERENT MECHANICAL STRETCH ..................... 72
FIGURE 4.50: MODULUS OF A317 YARNS WITH DIFFERENT MECHANICAL STRETCH ..................... 72
FIGURE 4.51: ELONGATION OF A317 YARNS WITH DIFFERENT MECHANICAL STRETCH ................ 73
FIGURE 5.1: COMPARISON OF TENACITY VS OVERFEED .............................................................. 74
FIGURE 5.2: COMPARISON OF MODULUS VS OVERFEED .............................................................. 74
FIGURE 5.3: COMPARISON OF ELONGATION VS OVERFEED ......................................................... 75
FIGURE5.4: COMPARISON OF TENACITY VS PRESSURE ................................................................ 75
FIGURE 5.5:COMPARISON OF MODULUS VS PRESSURE ................................................................ 75
FIGURE 5.6: COMPARISON OF ELONGATION VS PRESSURE .......................................................... 75
xi
FIGURE 5.7: COMPARISON OF TENACITY VS SPEED ..................................................................... 75
FIGURE 5.8 : COMPARISON OF MODULUS VS SPEED .................................................................... 75
FIGURE 5.9:COMPARISON OF ELONGATION VS SPEED ................................................................. 76
FIGURE5.10:COMPARISON OF TENACITY VS TEMPERATURE........................................................ 76
FIGURE5.11:COMPARISON OF MODULUS VS TEMPERATURE ........................................................ 76
FIGURE5.12:COMPARISON OF ELONGATION VS TEMPERATURE ................................................... 76
FIGURE 5.13: COMPARISON OF TENACITY VS STRETCH ............................................................... 76
FIGURE 5.14: COMPARISON OF MODULUS VS STRETCH ............................................................... 76
FIGURE 5.15: COMPARISON OF ELONGATION VS STRETCH .......................................................... 77
FIGURE 5.16 APPERANCE TEST FOR A317 YARNS WITH DIFFERENT OVERFEED ........................... 78
FIGURE 5.17 : COMPARISON OF THE APPEARANCE OF A317 YARNS OF 16% AND 24% OVERFEED .. 78
1
1.INTRODUCTION AND OVERVIEW
1.1 Introduction
Air jet texturing is one of the several process used to convert flat synthetic filament yarns
to textured yarns and it is the most versatile of all known methods. This technique has been in
practice for more than half century. The yarns produced using this method are used for
applications such as car seat cover fabrics, sewing threads, sportswear, upholstery, automotive
textiles, decorator fabrics etc but there is little use in apparel. Because of the limited range of
applications of air-textured yarn in the apparel area there was restricted research and thus
limited understanding of the process.
In recent years with extended uses for the products of this process, there has been an
improvement in the study of air-jet texturing process and developments in the nozzle design.
These studies and research have enabled yarns varying from very fine denier to extremely coarse
denier to be textured using air-jet texturing process. Air-jet textured yarns are produced with
characteristics resembling to those of the conventional staple-fiber product. At one time the yarns
were referred to as ―spun-like yarns‖.
2
1.2 Overview of the project
According to Ali Demir and Hassan Mohamed Behery ―The term ‗texture‘ defines and
describes those attributes of an object that can be recognized by the human sight or touch‖. [1]
The main texture properties desired in apparel and domestic textiles are warmth, opacity,
flexibility, and good wearing properties, coupled with an attractive appearance and easy
maintenance. Because of the growing world demand for textile goods and decreasing natural
resources, synthetically produced yarns are a major raw material for the textile industry today.
However, these synthetic yarns, such as polyamide and polyester continuous filament yarns as
spun from the spinnerets lack the previously discussed human appeal (primarily aesthetics).
These filament yarns either extruded, or indeed lightly twisted are often referred to as flat yarns.
Textured filament yarns offer some superior properties, such as high strength, good elasticity,
stretch, and abrasion resistance though the magnitudes of these parameters depend on the
texturing technology.
Therefore, the primary objective of all synthetic filament yarn conversion processes, for
yarns that are to be used in apparel industry, is to imitate the features of the natural fiber yarns
while maintaining the desirable properties of synthetic fibers. One method of achieving this is to
cut the continuous filaments into staple fibers and then process them into yarn form using
conventional spinning methods as for cotton and wool. This is a time-consuming and therefore
wasteful process, although it is useful for blends of man-made fibers with the natural fibers.
Alternatively, continuous filaments can be converted into yarns by various texturing methods at
lower costs but often these inadequately simulate spun yarns. Texturing, in general, is the
modification process of regular structure of synthetic filaments into somewhat random structures.
3
This is achieved in many ways, such as thermal, mechanical, and chemical deformation of the
individual filaments, and their spatial arrangement in the yarn bundle.
1.3 Purpose of texturing
The majority of filament yarns used today is synthetic fibers that need texturing although
there are some that need no modification. The texturing process creates bulk, stretch and texture
on the yarn surface. Bulk of yarn or fabric is generally the volume it occupies in free space. More
bulky the yarn more air permeable the resultant fabric. Bulk is very important for breathability of
a fabric, hence fabrics manufactured from bulkier yarns are comfortable to wear and handle.
Stretch which is also referred to as comfort stretch, of a yarn attributes to the aesthetic and
functional properties of the fabric manufactured from it. Texture of a yarn is defined as the
quality of the yarn which can be recognized by touch or sight by the humans. The prime purpose
of texturing filament yarn is to create a structure that is desirable for the following reasons [2]:
The open structure cause the material to have good insulation properties
Less organized structure of textured yarn gives a desirable matte appearance.
Textured materials feel softer than the lean twisted flat yarn.
The crimped filament structure gives a lower effective modulus of elasticity to the
structure when compared with that of a flat yarn.
Whether a yarn is primarily given bulk, stretch or texture or combination of these three
attributes is mainly governed by the fiber type, texturing technology and processing conditions.
4
1.4 Classifications in texturing
The three basic classifications of texturing techniques are
Thermo-mechanical texturing
Mechanical texturing
Other texturing techniques like chemical treatment, bi-component forming
and production of irregular-shaped individual filaments.
1.4.1 Thermo-mechanical texturing
Thermo-mechanical texturing method makes use of the thermoplastic property of most
synthetic yarns and basically consists of mechanical deformation, i.e, twist or torque
deformation, stuffing and bending, of the filaments while heating them to semi-plastic condition
and setting this deformation by cooling to ambient conditions. Thus permanent crimps are
imparted to the yarn, and these are due to the reforming of the molecular cross-links while the
filaments are in their distorted shape. It is claimed that false-twist, stuffer box, knife-edge
crimping, gear and knit-de knit texturing techniques are in this category of texturing with false-
twist technique accounts for about 85% of all texturing process [1].
1.4.2 Mechanical texturing
The parallel arrangement of the filaments can also be changed by purely mechanical
means to create spun-like yarns with an entangled core and surface loops imitating the protruding
hairs of spun staple yarns. This is achieved by a unique method known as air-jet texturing. In this
process, any filament yarn, not necessarily thermoplastic, is overfed through a specially designed
nozzle that creates supersonic, highly turbulent air jet. The extra length of the filaments provided
by the overfeed is taken up as entanglement in the yarn core, and loops and arcs at the surface of
5
the yarn. In contrast to the yarns textured by other texturing techniques, air-jet textured yarns are
uniquely not stretchable and with properties similar to spun-staple yarns.
1.4.3 Other Texturing Techniques
Regular arrangement of the synthetic filaments may also be changed by various other
techniques, such as chemical treatment, differential heat treatment, bi-component forming and
the production of irregular-shaped individual filaments, so as to give certain amount of texture.
While these types of texturing are usually achieved by treating the yarn (for example with
chemicals or heat), the ability to create the texture is inherent in the parent yarn (such as being
composed of two components which act differently to extended effects [heat, chemical, etc]).
This type of yarn is generally called producer- modified textured yarn.
1.4.3.1 Bi-component filament texturing
In the case of synthetic fibers, the bi-component fiber is such that the material on one side
tends to shrink preferentially during either its manufacturing or on activation during texturing or
some equivalent process. The principle is that two polymers differing in chemical structure,
melting point, co-monomer content, molecular weight, or some other properties produce an
oriented filament in which the two oriented components undergo differential shrinkage when
subjected to some thermal or other relaxing treatment. This method is often called as self-
crimping and is a man –made version of what occurs naturally in wool fibers.
6
1.4.3.2 Differential Shrinkage Texturing
This type of texturing process is often used in the production of high-bulk staple-spun
yarns. These yarns can be produced with two types of fibers, one with a high potential shrinkage
and one with little potential shrinkage blended together before the spinning process and the
resultant yarn is heated under relaxed conditions. The differential shrinkage causes the low
shrinkage components to buckle into crimps and loops in the yarn, causing it to become bulky.
These kinds of yarns are mainly used in knitting industry.
1.4.3.3 Chemical Texturing
The thermo-mechanical texturing process involves weakening of the intermolecular links
in the fiber causing a deformation and then retaining the deformation. The deformation process
involves the dissipation of the internal strains induced by mechanical stressing. For this a high-
thermal input is required and it constitutes a major cost in the operation. But in chemical
texturing or chemo-mechanical texturing the strain dissipative environment need not, necessarily,
be thermal in nature. Here a suitable solvent can be used as a medium to relax the fibers and
hence the deformation could be retained.
1.5 False-Twist Texturing
False twist texturing is one of the most important types of yarn modification. False-twist
process evolved from the conventional, twist-untwist texturing. The major breakthrough in false-
twist texturing was achieved in the mid -1970s with the commercial introduction of friction false
twisters [2]. False-twisting process helps in creating bulk without creating twists in the yarn.
This is done by twisting and untwisting the yarn and heat setting it between these two processes.
False-twist device has two sets of rollers through which the yarn continuously moves at a certain
speed. A twisting device is placed between these two rollers to impart twist to the yarn on both
7
sides of the twisting device. But the twists on both the sides are different in direction. Since the
yarn is continuously moving the resultant twist in the yarn is zero as each twist on one side of the
twisting device cancels out to the twist on the other side of the device as the yarn moves. The
heating arrangements are placed between the twisting device and the feed rollers. With this the
yarn twisted between the feed rollers and the twisting device is heat set before the untwisting
process on the other side. The yarn is also cooled before reaching the false-twisting device thus
producing bulk in the resultant yarn.
1.6 Air-Jet Texturing
The air-jet texturing process converts flat, continuous filament yarns into entangled,
convoluted, bulky, spun-like structured yarns. This process is by far the most versatile of all
yarn texturing methods in that it can blend filaments together during processing, and it, therefore,
simulates a desirable attribute of spun fiber yarns. Air-jet textured yarns are produced from
thermoplastic, cellulosic or inorganic filament yarns using a turbulent fluid, which is usually
compressed air. Loops are formed on the surface of the filament yarn, giving it a voluminous
character. Thus, in its simplest form, the air-jet texturing machine consists of no more than a
supply of yarn, suitable winding unit and an air-jet interposed between the two.
1.6.1 Principle of air-jet texturing
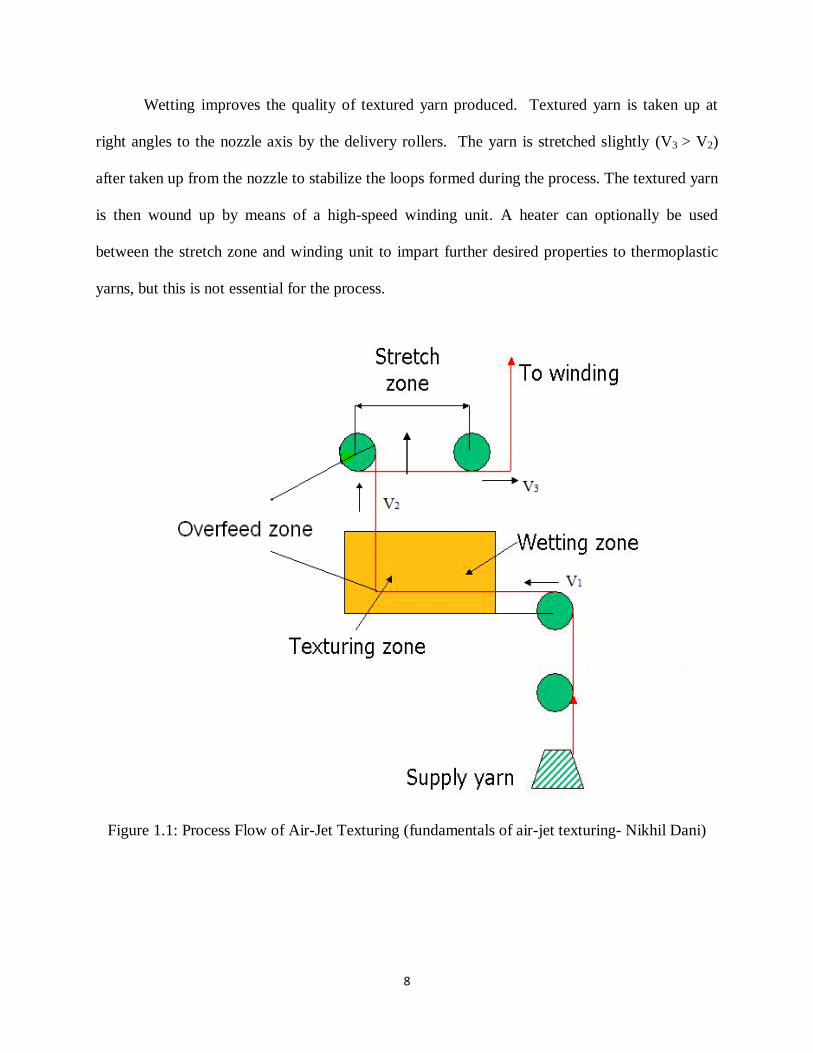
The processes of air-jet texturing are illustrated schematically in figure 1; When overfed
(V1 > V2) filaments enter the texturing nozzle, they are carried along through the nozzle, blown
out from the texturing end, and are formed into loops which are mutually trapped in the yarn
structure by the effect of the supersonic and turbulent air stream and forms a textured yarn
structure. The supply yarn is normally wetted just before it is fed into the texturing nozzle by
passing it through a wetting unit.
8
Wetting improves the quality of textured yarn produced. Textured yarn is taken up at
right angles to the nozzle axis by the delivery rollers. The yarn is stretched slightly (V3 > V2)
after taken up from the nozzle to stabilize the loops formed during the process. The textured yarn
is then wound up by means of a high-speed winding unit. A heater can optionally be used
between the stretch zone and winding unit to impart further desired properties to thermoplastic
yarns, but this is not essential for the process.
Figure 1.1: Process Flow of Air-Jet Texturing (fundamentals of air-jet texturing- Nikhil Dani)
9
1.6.2 Scope of present study
The current research attempts to find the effect of process parameters on the quality and
structure of the textured yarn. This is of interest with the availability of finer feedstock coupled
with newer jet designs which potentially enable a significant increase in production speed. These
in turn could lead to yarns which could find greater application in the apparel sector. Partially
oriented polyester yarn is used as the raw material for this research. The objectives of the
research are as follows:
To find the optimum process parameters that are suitable for manufacturing high quality
textured yarns at high speed.
To test the yarns for changes in the properties compared to feed yarn as well as to find any
new properties the yarns may have acquired.
10
2. LITERATURE REVIEW
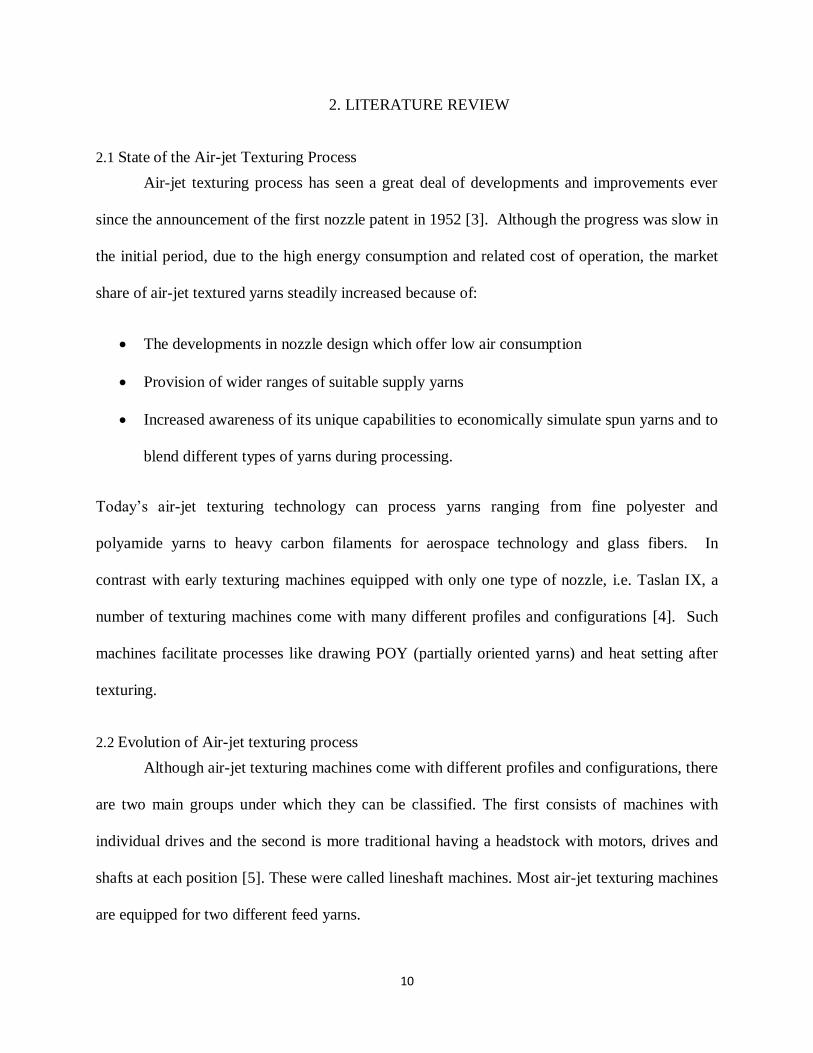
2.1 State of the Air-jet Texturing Process
Air-jet texturing process has seen a great deal of developments and improvements ever
since the announcement of the first nozzle patent in 1952 [3]. Although the progress was slow in
the initial period, due to the high energy consumption and related cost of operation, the market
share of air-jet textured yarns steadily increased because of:
The developments in nozzle design which offer low air consumption
Provision of wider ranges of suitable supply yarns
Increased awareness of its unique capabilities to economically simulate spun yarns and to
blend different types of yarns during processing.
Today‘s air-jet texturing technology can process yarns ranging from fine polyester and
polyamide yarns to heavy carbon filaments for aerospace technology and glass fibers. In
contrast with early texturing machines equipped with only one type of nozzle, i.e. Taslan IX, a
number of texturing machines come with many different profiles and configurations [4]. Such
machines facilitate processes like drawing POY (partially oriented yarns) and heat setting after
texturing.
2.2 Evolution of Air-jet texturing process
Although air-jet texturing machines come with different profiles and configurations, there
are two main groups under which they can be classified. The first consists of machines with
individual drives and the second is more traditional having a headstock with motors, drives and
shafts at each position [5]. These were called lineshaft machines. Most air-jet texturing machines
are equipped for two different feed yarns.
11
Machines with individual drives are very flexible in terms of the different range of products that
can be produced. They allow the addition of different components to the machine so that
different process technologies can be performed. Line shaft machines have winding unit similar
to those used in a false-twist processing and are therefore commonly doffed in groups. These
machines are now available with automatic doffing, which makes random doffing a feasible
alternative. The simplest of air-jet texturing machine has three shafts and a winder and the most
complex possesses seven shafts and a winder [5]. The machine used for this research work,
Stähle RMT-D (SSM) has individual drives for the shafts.
2.2.1Nozzle development
The jet is the heart of the air-jet texturing process. Stähle RMT-D machine is capable of
processing yarns from 50-5000 denier but individual jets are limited to a narrower range [5].
The choice of jet is also determined by the type of the materials to be processed, the end use and
the characteristics of the yarn to be produced. The continuous evolution of texturing nozzles may
be broadly divided into four major groupings [6]:
Early stage and ‗false start‘ with Taslan IX nozzle;
Upsurge of improved nozzles, i.e. Taslan X and XI;
Further improvements to the Taslan nozzles (Taslan XIV and XV) with impact
elements, and interest from textile companies other than Du Pont;
The contemporary stage with the Taslan XIV, XV and XX, and cylindrical type
nozzles, e.g. Hemajets.
Nozzles developed during the first stage were inefficient in their utilization of the-
12
compressed air. This kind of inadequate designs occupied the first ten years of development.
Therefore this first stage of the development was called a ‗false start‘ by researchers Phillips and
Isaacs [7] [8].
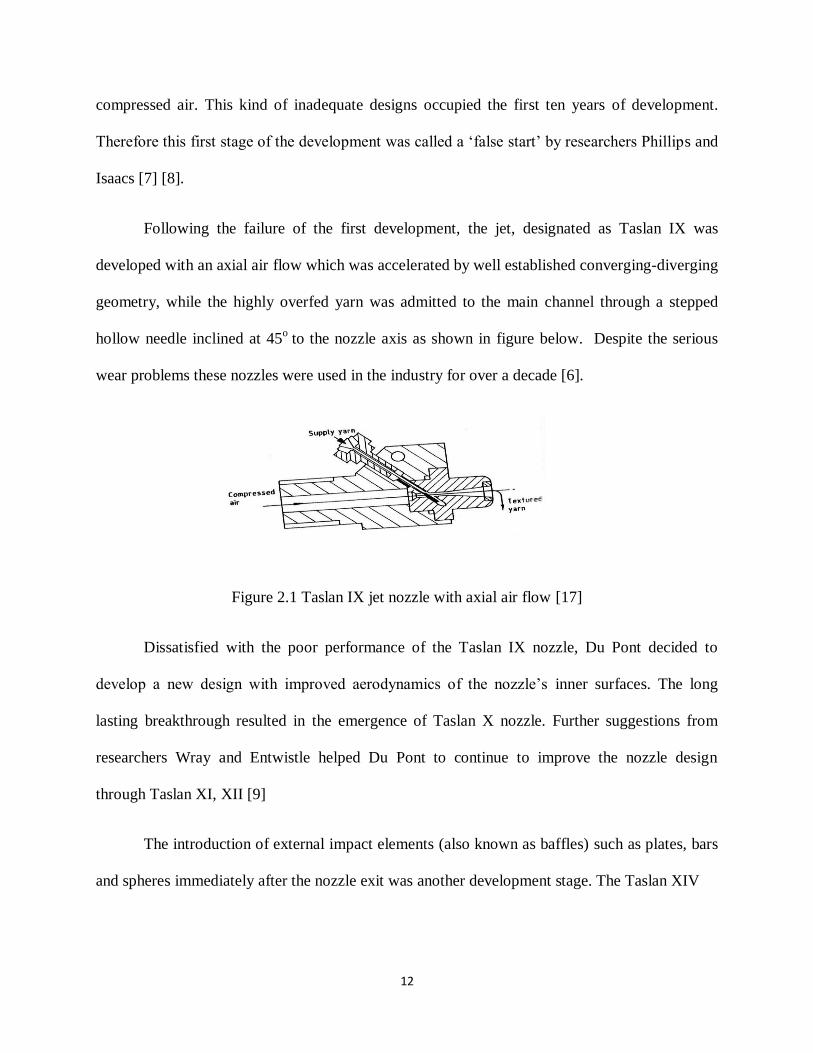
Following the failure of the first development, the jet, designated as Taslan IX was
developed with an axial air flow which was accelerated by well established converging-diverging
geometry, while the highly overfed yarn was admitted to the main channel through a stepped
hollow needle inclined at 45o
to the nozzle axis as shown in figure below. Despite the serious
wear problems these nozzles were used in the industry for over a decade [6].
Figure 2.1 Taslan IX jet nozzle with axial air flow [17]
Dissatisfied with the poor performance of the Taslan IX nozzle, Du Pont decided to
develop a new design with improved aerodynamics of the nozzle‘s inner surfaces. The long
lasting breakthrough resulted in the emergence of Taslan X nozzle. Further suggestions from
researchers Wray and Entwistle helped Du Pont to continue to improve the nozzle design
through Taslan XI, XII [9]
The introduction of external impact elements (also known as baffles) such as plates, bars
and spheres immediately after the nozzle exit was another development stage. The Taslan XIV
13
and XV were introduced with impact plate and bar respectively. Despite the continuous
developments and improvement attempts, there are still certain drawbacks such as high
compressed air consumption and frequent contamination of the air vent in the nozzle with spin
finish. This problem arose due to the spin finish being washed from the yarn surface and thus the
jet needed frequent cleaning (usually ultrasonic) and maintenance. This is still somewhat a
problem today.
The above discussed drawbacks thus have induced some other manufacturers to develop
new nozzle jets. Most significant development in the nozzle design took place in 1970s.
Heberlein took over the air-jet technology developed by Berliner Maschinenbau A.G. of
Switzerland in 1977 and introduced its first Hemajet nozzle in 1978 [10]. Heberlein later
introduced six other nozzles designated as T100, T311, T110, T140, and T350 with the first digit
indicating the provision of either one or three inlet holes [4].
Recent developments from Heberlein offer jet nozzles capable of high texturing speeds at
the rate of 1000 m/min. In addition to the T-series, Heberlein has developed two other series of
jets called S-series and A-series which are compatible for high overfeed texturing to produce
softer yarns and compact stable yarns at high texturing speed respectively [18].
2.2.2 Wetting of the supply yarn
Wetting of the supply yarn is an indispensable part of the air-jet texturing process today.
There have been several methods of water application developed along with other developments
in air jet texturing. In the early days of the process, the conventional way of wetting the yarn
was by threading it through a water bath. Today a wetting head or a spray unit either integrated
with texturing nozzle or as a separate unit is used. Several wetting agents have been tested for
14
their effects on texturing in the past. But any improvement witnessed was too unsubstantial to
draw positive conclusion. However, by reducing the surface tension of the water, its wetting
properties could be improved so as to wet the individual filament surfaces more effectively and
thereby further reduce the friction and this was claimed to result in better texturing [11].
2.2.2.1 Effects of wetting on the airflow
A substantial amount of water carried by the yarn from the wetting unit is blown away at
the entrance of the nozzle by secondary air-flow of the texturing process. So only a small
fraction of water is allowed into the nozzle which upon meeting the incoming air jet is blown
away into fine particles of mist. These particles will presumably have an effect on the primary
flow. In order study this effect researchers Acar, Turton and Wray calculated the flow velocity at
the exit plane of the nozzle for only air flow and for air-water mixtures. This was repeated for
various operating pressures. From the results of this study they concluded that wetting of the
yarn has only a slight effect on the exit flow velocity [11].
2.2.2.2 Effects of wetting on friction in air-jet texturing process
It is claimed that for most of the materials, pre-wetting reduces the inter-filament friction
and also friction between filaments and contacting surfaces [12]. This leads to an increase in the
resultant forces acting on the individual filaments and easier longitudinal displacement of the
filaments with respect to each other. This in turn encourages the formation of loops, which then
become entangled as they emerge from the nozzle [12].
2.2.2.3 Effect of wetting on the physical properties of the yarn
According to W.E. Morton and J.W.S. Hearle ―generally as the moisture regain increases,
bending stiffness and torsional stiffness of the filaments reduces [13]. There is also an increase in
15
diameter and some change in density of the fiber‖. While this is claimed to represent the
‗general situation‘ this is obviously only true for certain fibers which absorb water and
furthermore increase in fiber diameter when wet- this is only true of a limited number of filament
yarns. Furthermore, according to S.Chand [13], wet texturing was better due to reduced rigidity
and increased diameter or change in specific volume of the filaments is highly unlikely due to
short time span of the wetting process under normal conditions.
2.2.2.4 Significance of quantity of water
Earlier experiments by researchers Bock and Lunenschloss [14] show that beyond a
certain small threshold there is no significant change in the properties of the textured yarn with
respect to the quantity of water used in the wetting process. This is because, if more water is
used, most of it gets blown away in the primary flow and the remaining amount (not absorbed by
yarn) is thrown out of the nozzle through the secondary flow. Using more water is hence, a
redundancy which could be easily avoided. With this it therefore appears that only a small
amount of water is needed to have the desired effect on the texturing process, and hence on the
resultant yarn properties.
2.2.2.5 Issue with the previous explanations for the role of water in texturing
According to Nikhil P.Dani, the explanations given for the role of water in texturing in
the literature have not pointed out the specific property of the yarn which has been improved by
the use of water. For example, the explanations in the literature were not specific if the
improvement in the quality of the yarn is in terms of its overall diameter, stability or a uniform
structure and strength of the yarn. According to him, the major roles of water in texturing were
to impart cohesion between the filaments, forming filament groups which results in loop
16
formation, and to remove spin finish from the yarn.
2.2.3 Loop formation mechanism
It is claimed that inside the air-jet nozzles, shock waves occur in the flow, the
strength of which varies depending on the type of the nozzle [15]. These shocks are at least
partially destroyed by the presence of the filaments in the nozzle during the texturing process;
nozzles providing varying degrees of shock strength are equally effective in the texturing
process. Therefore, the effect of shock waves on the filament motion is negligible [15] [2].
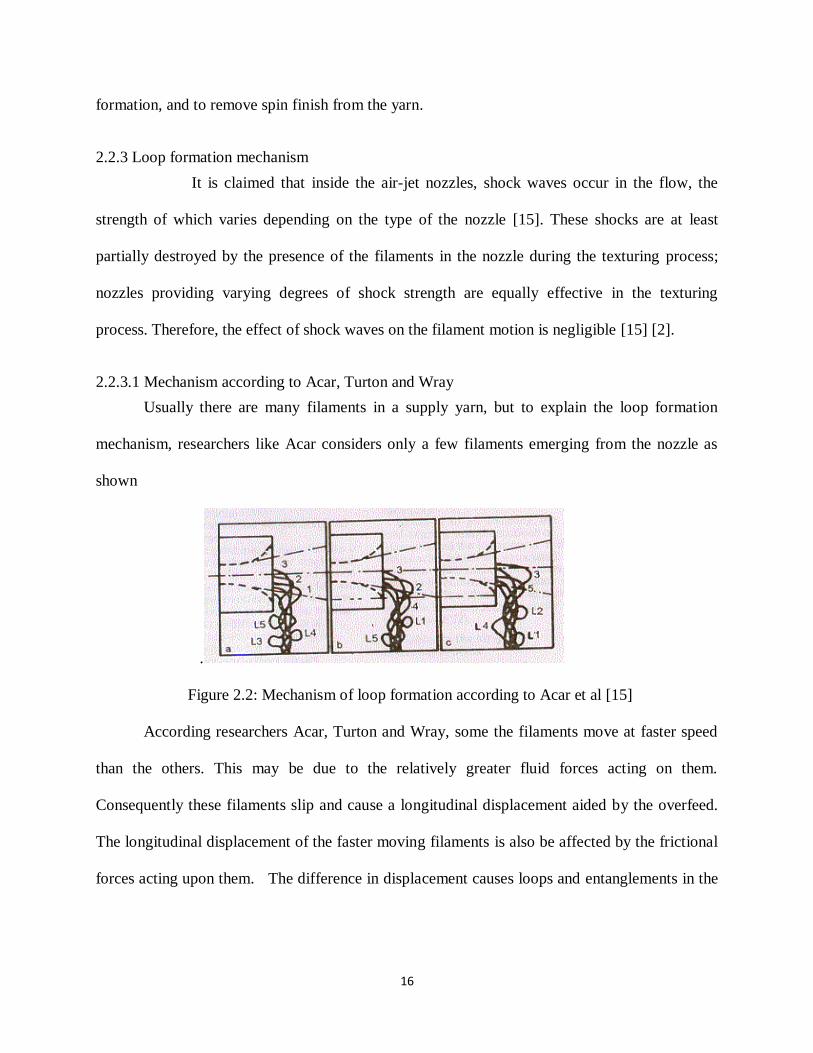
2.2.3.1 Mechanism according to Acar, Turton and Wray
Usually there are many filaments in a supply yarn, but to explain the loop formation
mechanism, researchers like Acar considers only a few filaments emerging from the nozzle as
shown
.
Figure 2.2: Mechanism of loop formation according to Acar et al [15]
According researchers Acar, Turton and Wray, some the filaments move at faster speed
than the others. This may be due to the relatively greater fluid forces acting on them.
Consequently these filaments slip and cause a longitudinal displacement aided by the overfeed.
The longitudinal displacement of the faster moving filaments is also be affected by the frictional
forces acting upon them. The difference in displacement causes loops and entanglements in the
17
filaments. When the textured yarn is withdrawn at right angles to the axis of the nozzle these
entanglements creates tension and the textured yarn is shortened from its original length.
Therefore on the one hand the emerging filaments are thrown out of the nozzle at much
higher speed than the texturing speed and on the other hand the tension created in the yarns pulls
the leading edge of the emerging filaments towards yarn delivery. Since the filaments are kept
close to the core of the delivery yarn they are forced into bows and arc shapes by the fluid forces
acting upon them from the inside of the nozzle. These are then entangled with other emerging
filaments, which are formed into fixed stable loops within the textured yarn.
2.2.3.2 Mechanism according to Sengupta, Kothari and Srinivvasan
According to other researchers, like Sengupta, Kothari and Srinivasan, turbulent,
asymmetric fluid forces in association with intermittent compression shock waves open up the
filaments and blow the overfed lengths out of the texturing nozzle at speeds much greater than
the delivery speed of the yarn. The difference in the speeds between the ‗leading‘ and ‗trailing
ends‘ of the section of filaments under the action of fluid forces, causes the bending of the
filaments in the form of loops and arcs.
2.2.4 Factors affecting loop formation
In order to analyze the effects of various parameters on the loop formation mechanism
researchers Acar, Turton and Wray considered a single filament emerging out from the nozzle.
The effects of any changes in the texturing conditions on that filament were analyzed in the light
of the described mechanism of loop formation.
18
2.2.4.1 Effects of air pressure
When the air pressure is increased, the speed of the filament is also increased as a result
of increased air velocity, and therefore, the ‗trailing end‘ will move rapidly and the time taken to
blow out the free length of the filament will also become shorter. High air pressure will also
enhance the differences between the forces acting on the filaments and cause greater relative
longitudinal displacements. The increased filament speed increase the frequency of the loop
formation and the entanglement process could then become more effective in flows with high
velocities and intensified turbulence. Therefore, more effective texturing is likely to be achieved
by increasing the air pressure.
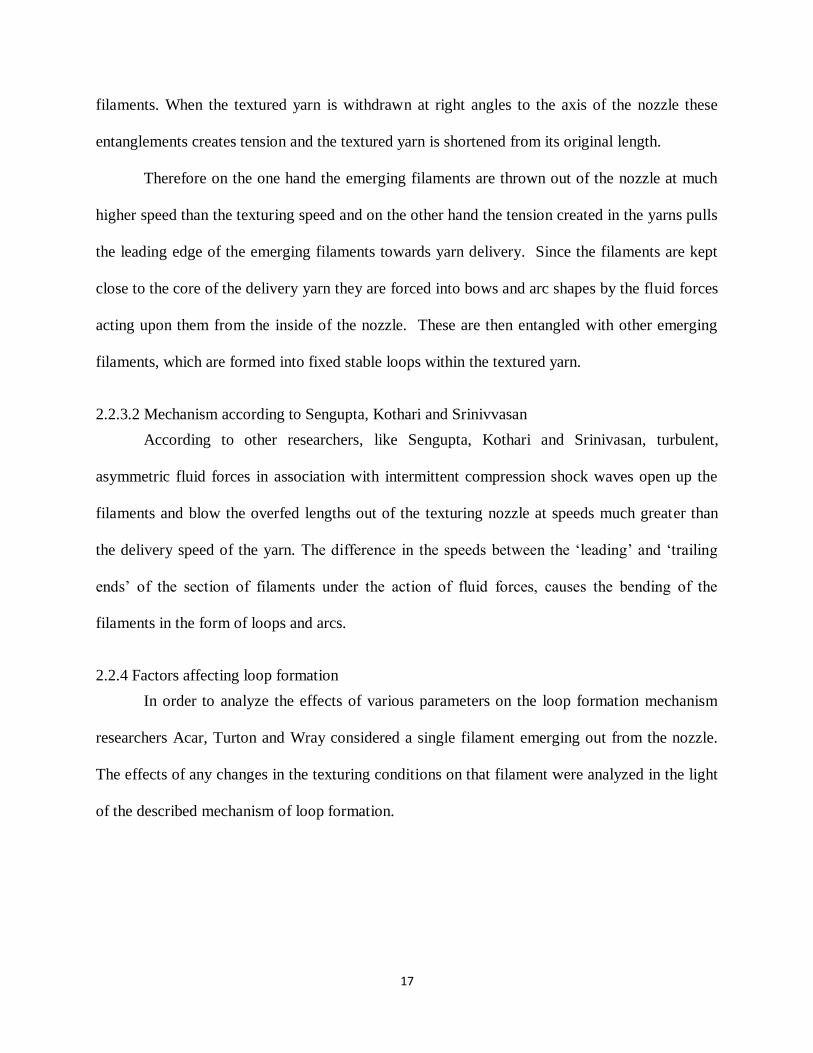
2.2.4.2 Effects of overfeed
When overfeed is increased, it gives a possibility of longer length of the filament to be
blown out of the nozzle in a given time interval. If the texturing speed is not changed the
‗leading end‘ of the filament will not move very far and hence the extra length of the overfed
yarn will either form a larger loop or several loops in this unit time. Increasing the overfeed will
therefore result in an increase in loop size and loop frequency. This in turn causes increase in the
linear density. It also results in increase in the instability of the yarn because greater the number
of entangled loops greater becomes the chance of these loops being pulled out when the yarn is
tensioned. But when the overfeed is excessively high, the filaments and the textured yarn is
allowed to be blown away from the nozzle causing no loop formation as shown in Figure 2.3.
Figure 2.3: Effect of overfeed on loop formation [15]
19
2.2.4.3 Effects of texturing speed
Increasing the texturing speed will cause both the ‗leading‘ and ‗trailing ends‘ to move
faster and a given length of filament will be exposed to the air-flow for a shorter time. Because
of this, any loops that are formed will be less stable and may be removed easily under subsequent
tensioning of the textured yarn. Consequently, the number of stable loops formed will be
reduced, the tension in the yarn in the delivery zone will drop, and the filaments will be blown
away from the nozzle, so that failures will be caused in the continuity of the texturing process.
In order to counteract the adverse effects of increased texturing speeds, at least partly, the
air-flow velocity could be increased. This could cause the process to become more effective, but
the very high operating pressures required could make it uneconomical. The scope for increasing
productivity by further increases of production speed therefore appears to be very limited with
existing jet technology.
2.2.4.4 Effects of other elements
Although it is claimed that the baffle arrangement (also known as impact element) at the
nozzle exit is believed to improve the process stability and hence the yarn quality in the texturing
of certain fibers, it is unlikely to have significant effects on the flow inside texturing nozzles,
since any such element is usually situated at a distance of about one nozzle diameter from the
exit. It is thus remote from the immediate nozzle-exit region, where loop formation actually takes
place. One possible minor role of this impact element is to act as a physical barrier to those
filaments that are blown well away from the nozzle.
2.2.5 Air jet textured yarns
Air –jet textured yarns are of different characteristics of their parent yarns. Textured
yarns possess high physical bulk, high linear density and subdued luster.
20
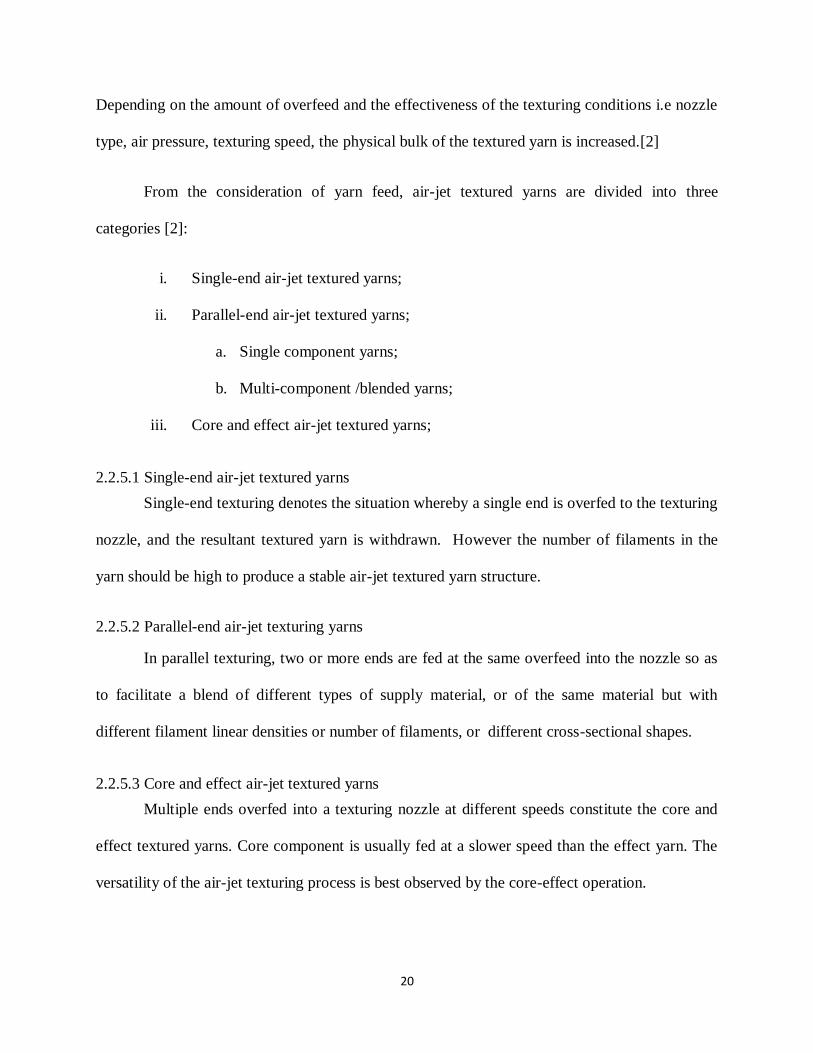
Depending on the amount of overfeed and the effectiveness of the texturing conditions i.e nozzle
type, air pressure, texturing speed, the physical bulk of the textured yarn is increased.[2]
From the consideration of yarn feed, air-jet textured yarns are divided into three
categories [2]:
i. Single-end air-jet textured yarns;
ii. Parallel-end air-jet textured yarns;
a. Single component yarns;
b. Multi-component /blended yarns;
iii. Core and effect air-jet textured yarns;
2.2.5.1 Single-end air-jet textured yarns
Single-end texturing denotes the situation whereby a single end is overfed to the texturing
nozzle, and the resultant textured yarn is withdrawn. However the number of filaments in the
yarn should be high to produce a stable air-jet textured yarn structure.
2.2.5.2 Parallel-end air-jet texturing yarns
In parallel texturing, two or more ends are fed at the same overfeed into the nozzle so as
to facilitate a blend of different types of supply material, or of the same material but with
different filament linear densities or number of filaments, or different cross-sectional shapes.
2.2.5.3 Core and effect air-jet textured yarns
Multiple ends overfed into a texturing nozzle at different speeds constitute the core and
effect textured yarns. Core component is usually fed at a slower speed than the effect yarn. The
versatility of the air-jet texturing process is best observed by the core-effect operation.
21
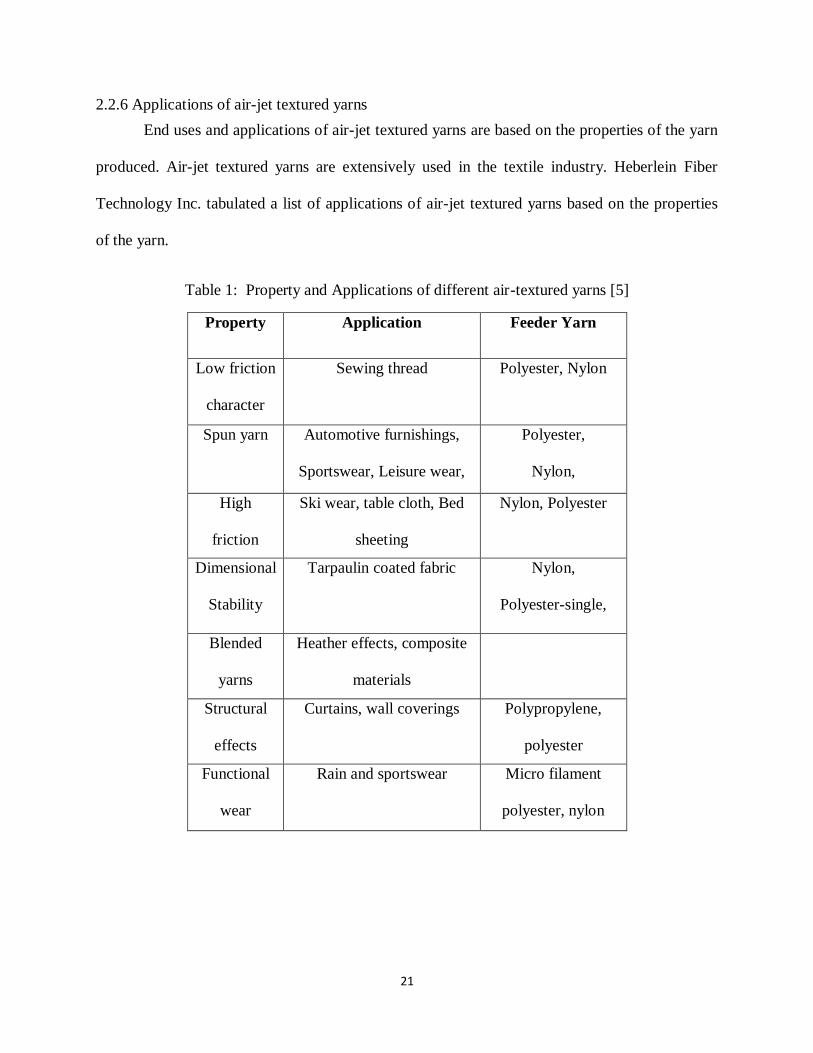
2.2.6 Applications of air-jet textured yarns
End uses and applications of air-jet textured yarns are based on the properties of the yarn
produced. Air-jet textured yarns are extensively used in the textile industry. Heberlein Fiber
Technology Inc. tabulated a list of applications of air-jet textured yarns based on the properties
of the yarn.
Table 1: Property and Applications of different air-textured yarns [5]
Property Application Feeder Yarn
Low friction
character
Sewing thread Polyester, Nylon
Spun yarn Automotive furnishings,
Sportswear, Leisure wear,
Interior furnishing
Polyester,
Nylon,
Polypropylene, low
dpf and sub-denier
yarns
High
friction
Ski wear, table cloth, Bed
sheeting
Nylon, Polyester
Dimensional
Stability
Tarpaulin coated fabric Nylon,
Polyester-single,
parallel and
Core/effect
Blended
yarns
Heather effects, composite
materials
Structural
effects
Curtains, wall coverings Polypropylene,
polyester
Functional
wear
Rain and sportswear Micro filament
polyester, nylon
22
3. EXPERIMENTAL
3.1 Introduction
This section describes the experimental aspects of the research. It includes experimental
components such as texturing machine and testing instruments along with supply yarns and
techniques used for the analysis of textured yarn.
3.2 Material used
Yarn packages of 115 denier, 136 filaments, POY Dacron® polyester produced by UNIFI
were used for this research.
3.3 Air-Jet Texturing machine
The experimental setup used in this research was Stähle-Eltex air texturing machine. The
model of this machine is RMT-D single end unit. This is one of the popular and widely used
modern day machine with a complete computer controlled accessibility. The main components
of this machine are:
Creel stand
Yarn guides
Four heated godet rollers, two for core
yarn feed and two for the effect yarn
feed.
Texturing box
o Water jet
o Air-jet with air-jet nozzle
o Yarn guides
Two rubber covered stretch rollers
Finish applicator
Yarn traverse guide
Secondary heating zone
Precision winding unit
Water draining system
Computer
23
Figure 3.1: Stähle-Eltex air texturing machine Figure 3.2: Creel stand
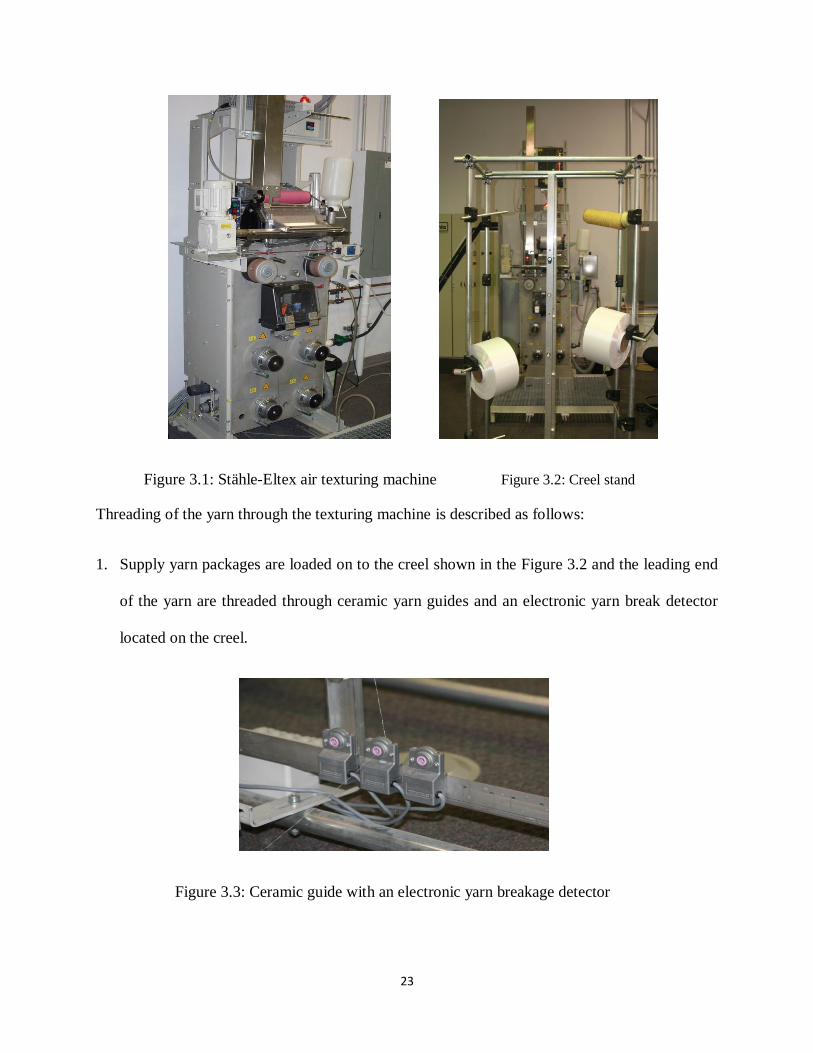
Threading of the yarn through the texturing machine is described as follows:
1. Supply yarn packages are loaded on to the creel shown in the Figure 3.2 and the leading end
of the yarn are threaded through ceramic yarn guides and an electronic yarn break detector
located on the creel.
Figure 3.3: Ceramic guide with an electronic yarn breakage detector
24
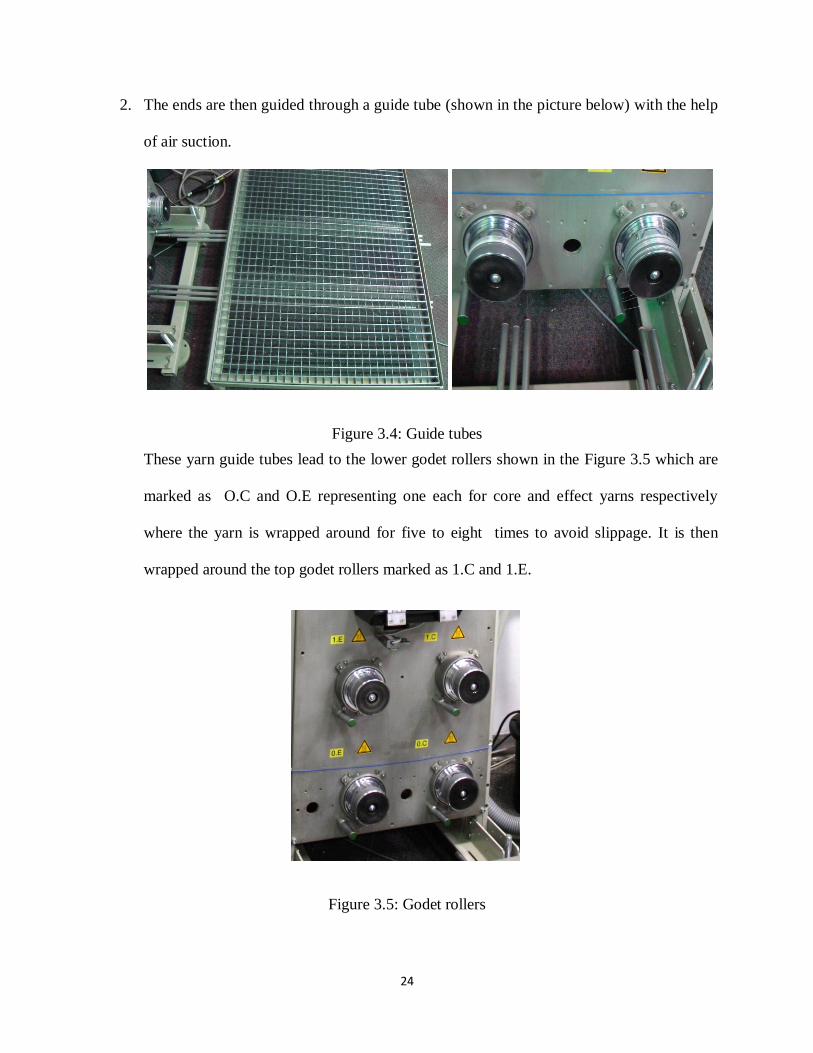
2. The ends are then guided through a guide tube (shown in the picture below) with the help
of air suction.
Figure 3.4: Guide tubes
These yarn guide tubes lead to the lower godet rollers shown in the Figure 3.5 which are
marked as O.C and O.E representing one each for core and effect yarns respectively
where the yarn is wrapped around for five to eight times to avoid slippage. It is then
wrapped around the top godet rollers marked as 1.C and 1.E.
Figure 3.5: Godet rollers
25
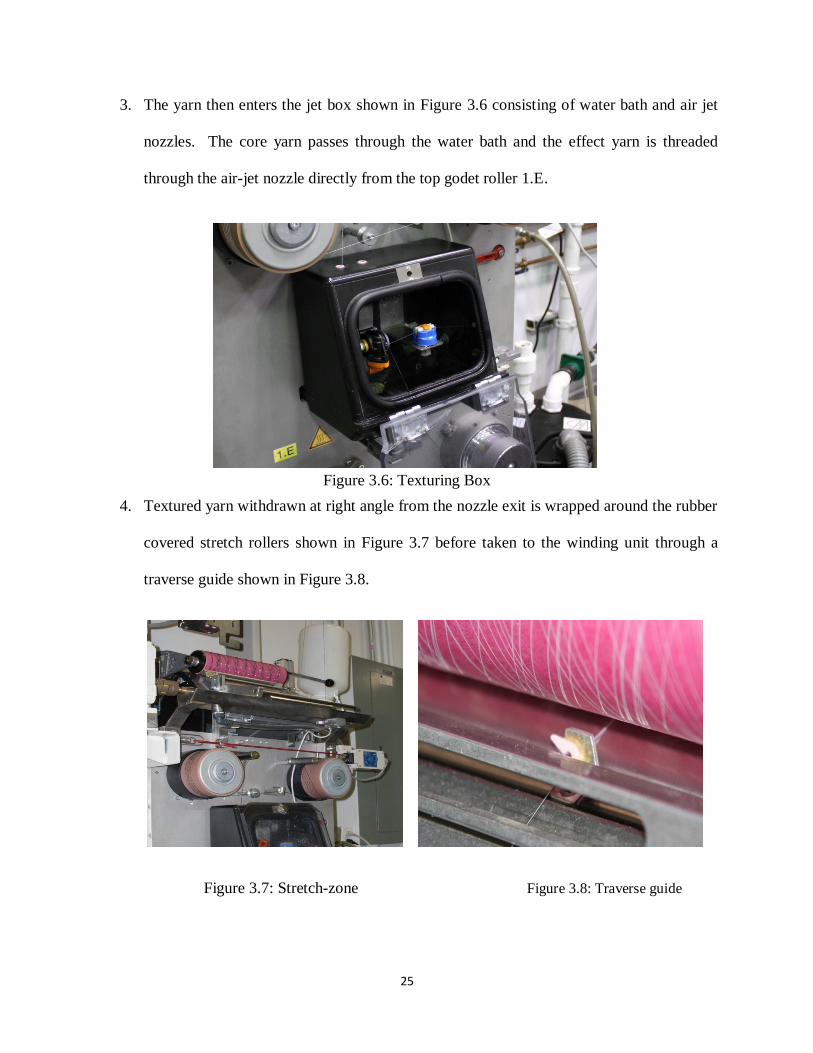
3. The yarn then enters the jet box shown in Figure 3.6 consisting of water bath and air jet
nozzles. The core yarn passes through the water bath and the effect yarn is threaded
through the air-jet nozzle directly from the top godet roller 1.E.
Figure 3.6: Texturing Box
4. Textured yarn withdrawn at right angle from the nozzle exit is wrapped around the rubber
covered stretch rollers shown in Figure 3.7 before taken to the winding unit through a
traverse guide shown in Figure 3.8.
Figure 3.7: Stretch-zone Figure 3.8: Traverse guide
26
All the rollers in the texturing machine are driven by separate motors and are controlled
by the computer. The secondary heating system of the machine was not used as the partially
oriented yarns were fully drawn before entering the texturing yarn.
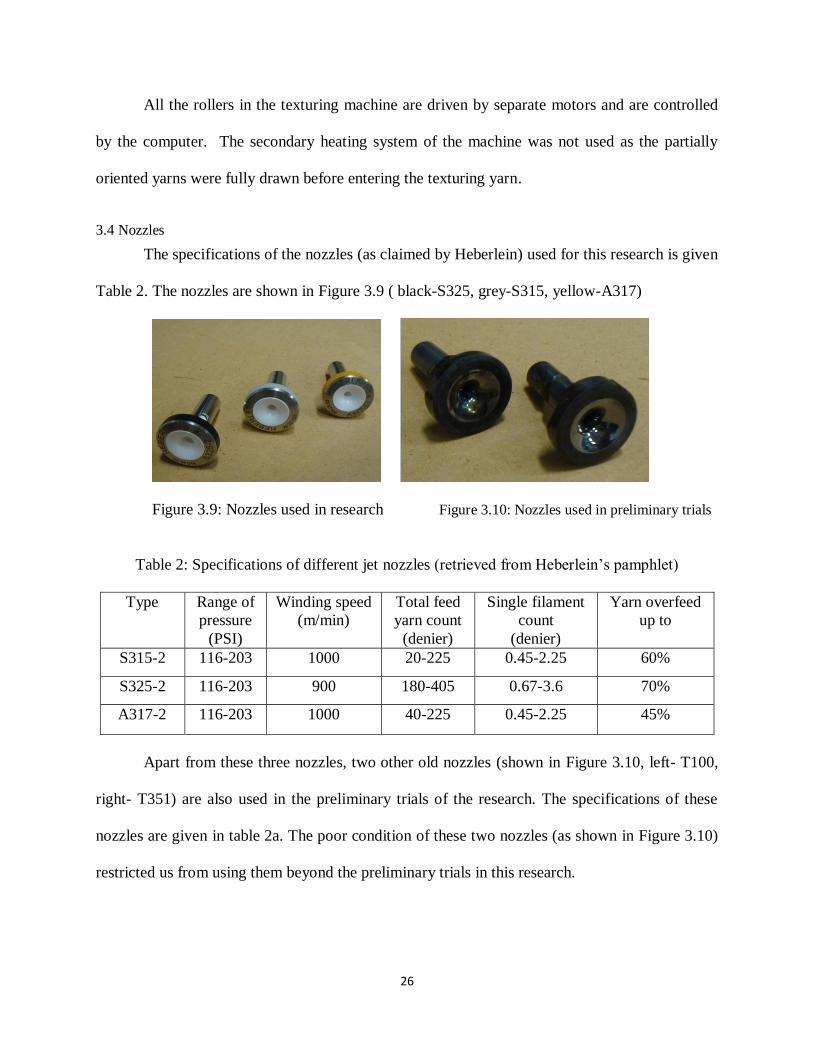
3.4 Nozzles
The specifications of the nozzles (as claimed by Heberlein) used for this research is given
Table 2. The nozzles are shown in Figure 3.9 ( black-S325, grey-S315, yellow-A317)
Figure 3.9: Nozzles used in research Figure 3.10: Nozzles used in preliminary trials
Table 2: Specifications of different jet nozzles (retrieved from Heberlein‘s pamphlet)
Type Range of
pressure
(PSI)
Winding speed
(m/min)
Total feed
yarn count
(denier)
Single filament
count
(denier)
Yarn overfeed
up to
S315-2 116-203 1000 20-225 0.45-2.25 60%
S325-2 116-203 900 180-405 0.67-3.6 70%
A317-2 116-203 1000 40-225 0.45-2.25 45%
Apart from these three nozzles, two other old nozzles (shown in Figure 3.10, left- T100,
right- T351) are also used in the preliminary trials of the research. The specifications of these
nozzles are given in table 2a. The poor condition of these two nozzles (as shown in Figure 3.10)
restricted us from using them beyond the preliminary trials in this research.
27
Table 2a: Specifications of T-series jet nozzles used in preliminary trials
Type
Range of
pressure
(PSI)
Winding
speed
(m/min)
Total feed
yarn count
(denier)
Single
filament
count
(denier)
Yarn
overfeed up
to
T 100 58-203 650 45-630 1.4-2.3 30%
T 351 58-203 500 450-4500 Up to 19.8 80%
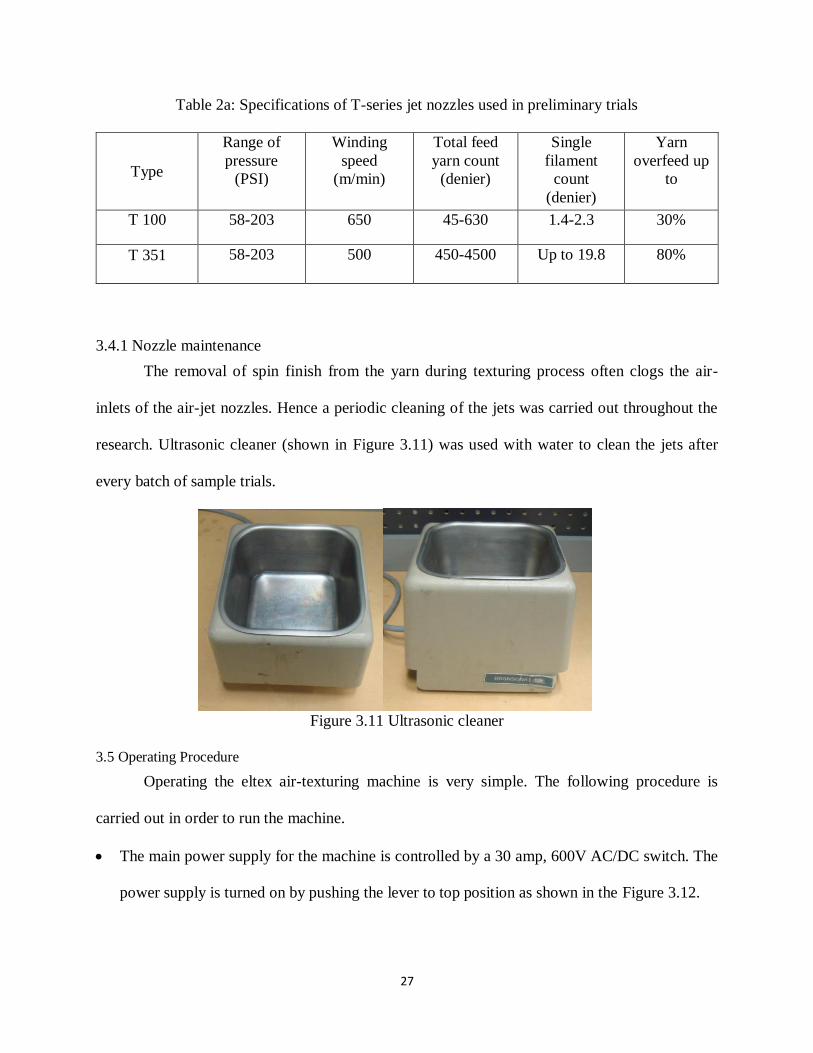
3.4.1 Nozzle maintenance
The removal of spin finish from the yarn during texturing process often clogs the air-
inlets of the air-jet nozzles. Hence a periodic cleaning of the jets was carried out throughout the
research. Ultrasonic cleaner (shown in Figure 3.11) was used with water to clean the jets after
every batch of sample trials.
Figure 3.11 Ultrasonic cleaner
3.5 Operating Procedure
Operating the eltex air-texturing machine is very simple. The following procedure is
carried out in order to run the machine.
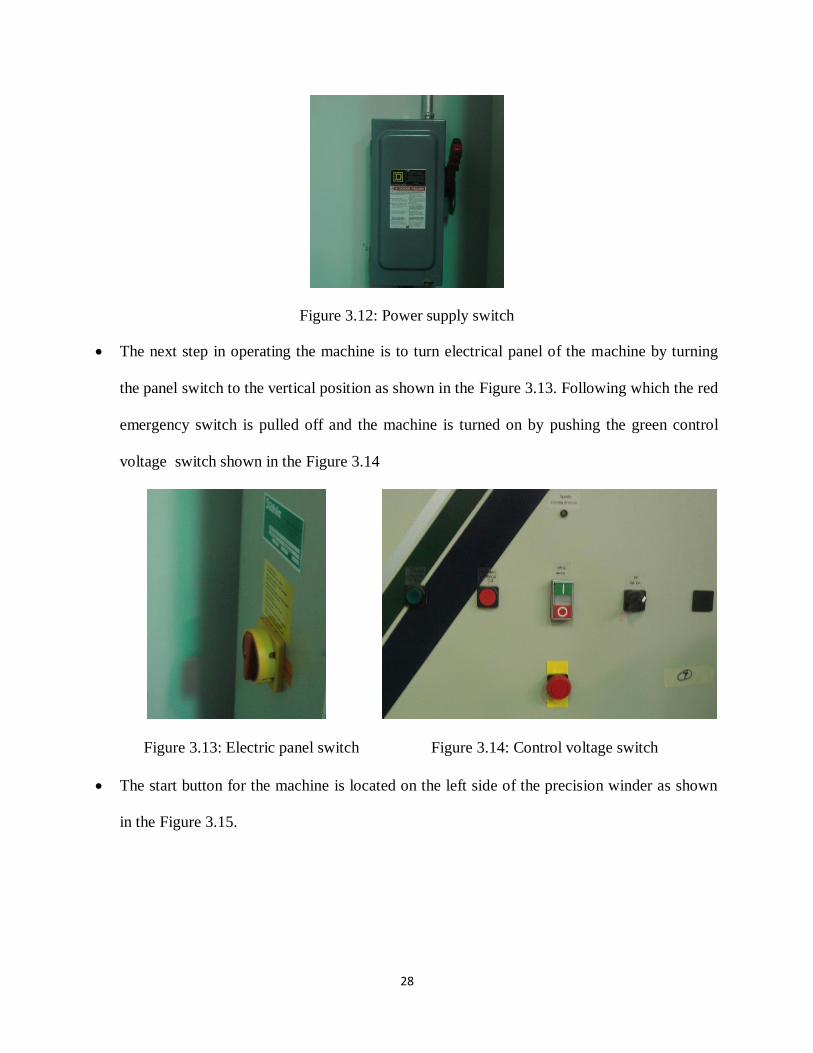
The main power supply for the machine is controlled by a 30 amp, 600V AC/DC switch. The
power supply is turned on by pushing the lever to top position as shown in the Figure 3.12.
28
Figure 3.12: Power supply switch
The next step in operating the machine is to turn electrical panel of the machine by turning
the panel switch to the vertical position as shown in the Figure 3.13. Following which the red
emergency switch is pulled off and the machine is turned on by pushing the green control
voltage switch shown in the Figure 3.14
Figure 3.13: Electric panel switch Figure 3.14: Control voltage switch
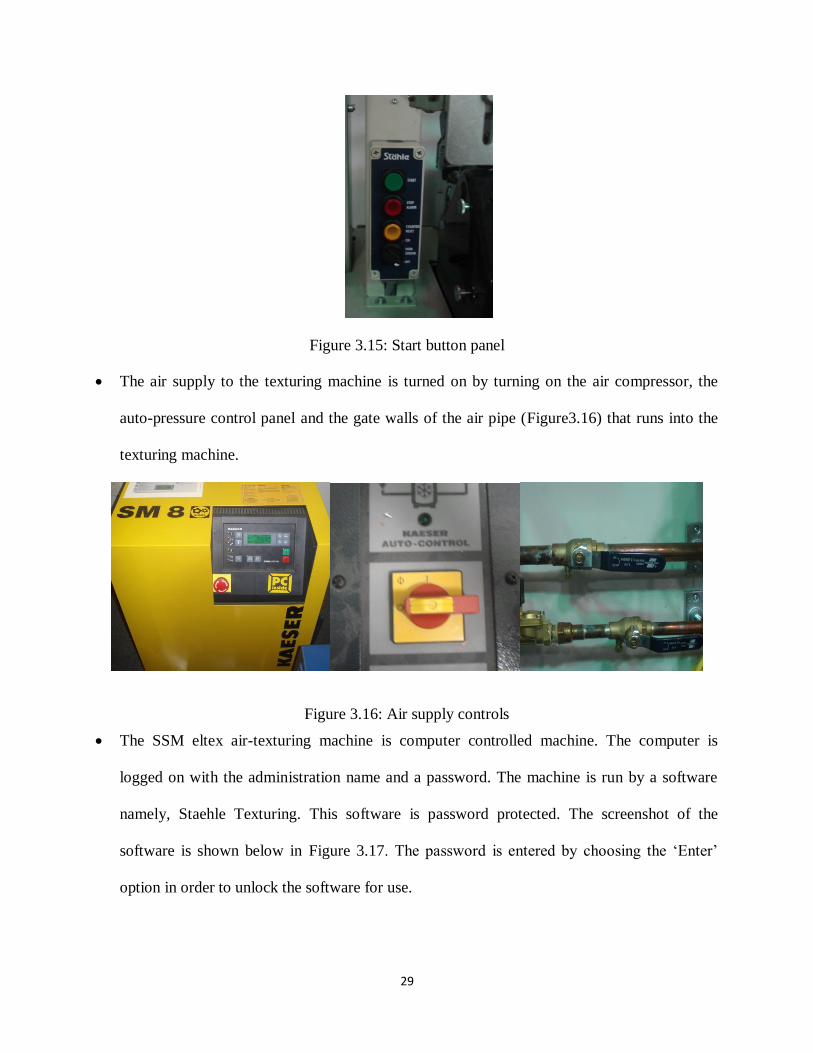
The start button for the machine is located on the left side of the precision winder as shown
in the Figure 3.15.
29
Figure 3.15: Start button panel
The air supply to the texturing machine is turned on by turning on the air compressor, the
auto-pressure control panel and the gate walls of the air pipe (Figure3.16) that runs into the
texturing machine.
Figure 3.16: Air supply controls
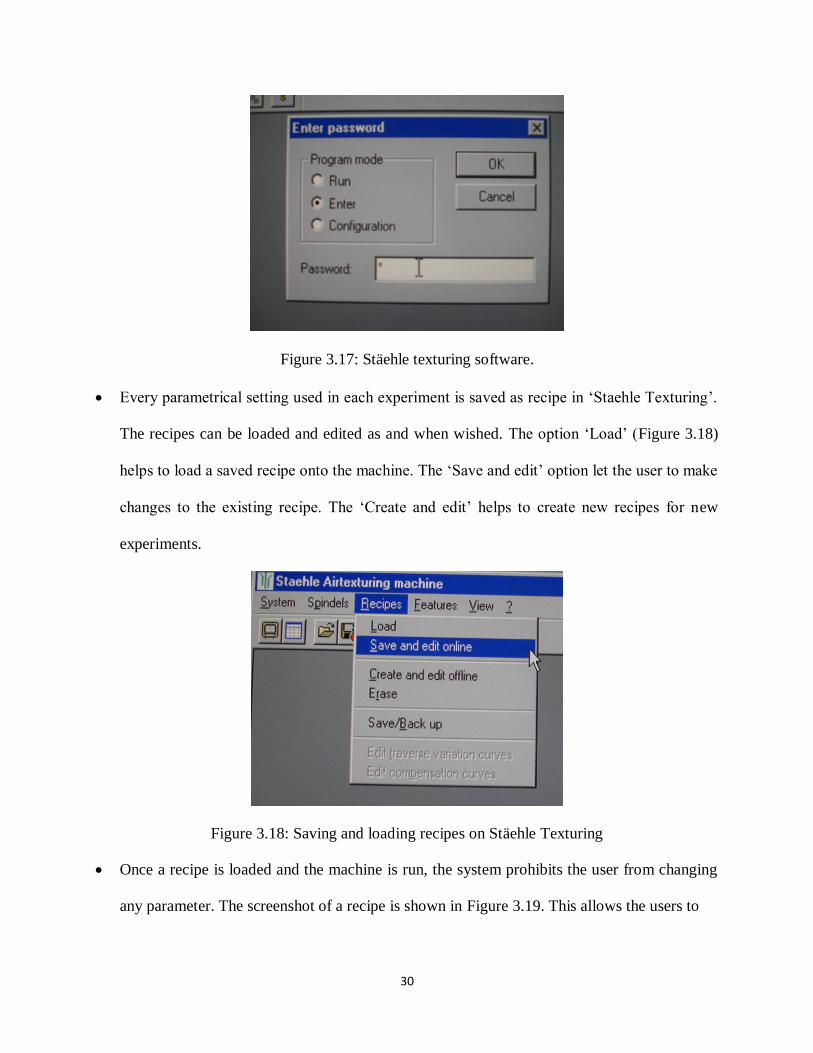
The SSM eltex air-texturing machine is computer controlled machine. The computer is
logged on with the administration name and a password. The machine is run by a software
namely, Staehle Texturing. This software is password protected. The screenshot of the
software is shown below in Figure 3.17. The password is entered by choosing the ‗Enter‘
option in order to unlock the software for use.
30
Figure 3.17: Stäehle texturing software.
Every parametrical setting used in each experiment is saved as recipe in ‗Staehle Texturing‘.
The recipes can be loaded and edited as and when wished. The option ‗Load‘ (Figure 3.18)
helps to load a saved recipe onto the machine. The ‗Save and edit‘ option let the user to make
changes to the existing recipe. The ‗Create and edit‘ helps to create new recipes for new
experiments.
Figure 3.18: Saving and loading recipes on Stäehle Texturing
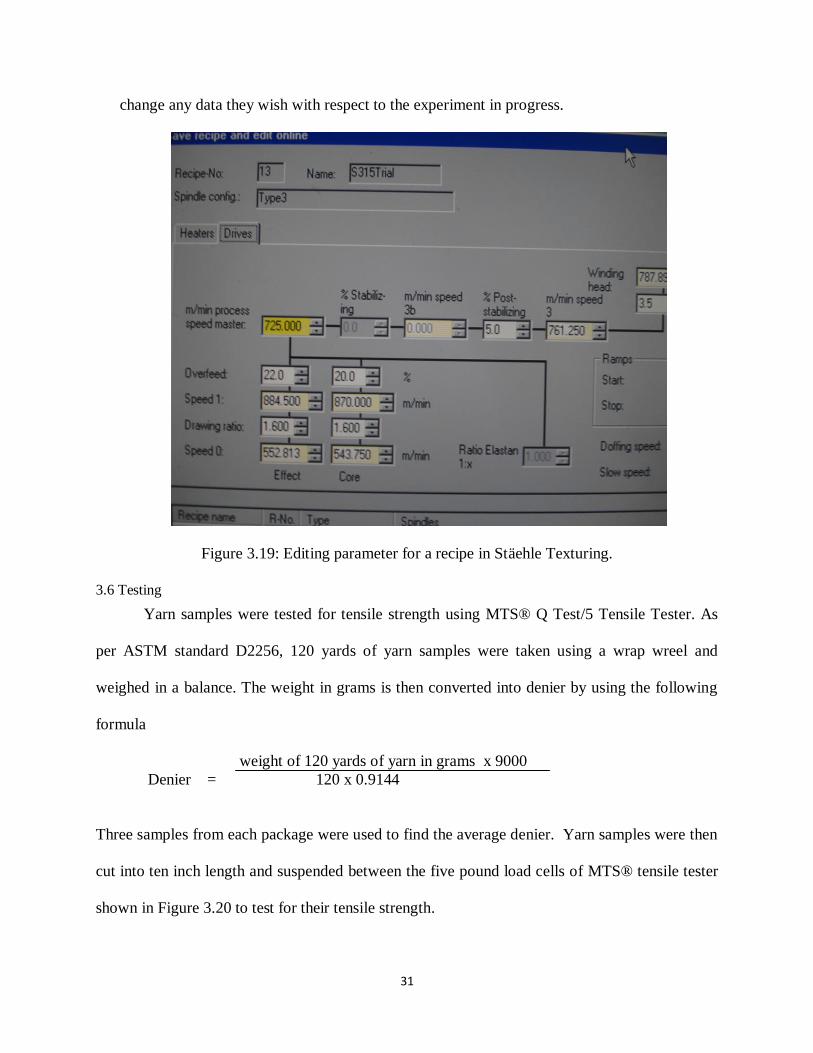
Once a recipe is loaded and the machine is run, the system prohibits the user from changing
any parameter. The screenshot of a recipe is shown in Figure 3.19. This allows the users to
31
change any data they wish with respect to the experiment in progress.
Figure 3.19: Editing parameter for a recipe in Stäehle Texturing.
3.6 Testing
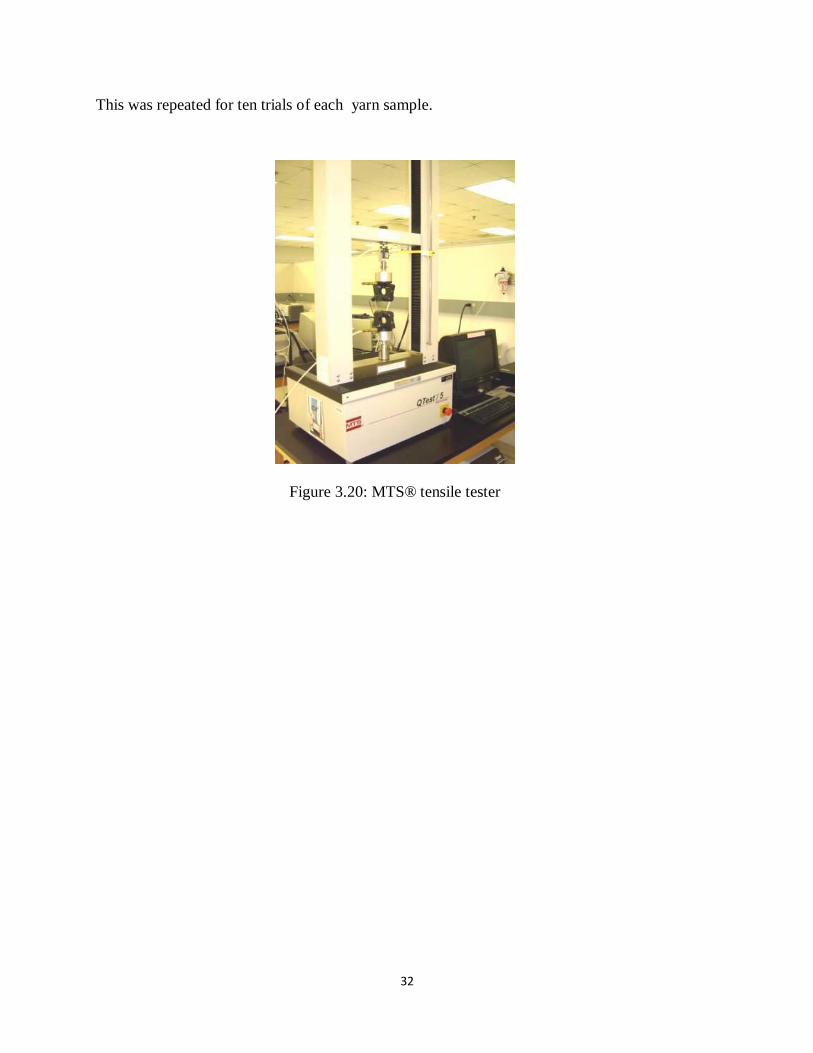
Yarn samples were tested for tensile strength using MTS® Q Test/5 Tensile Tester. As
per ASTM standard D2256, 120 yards of yarn samples were taken using a wrap wreel and
weighed in a balance. The weight in grams is then converted into denier by using the following
formula
weight of 120 yards of yarn in grams x 9000
Denier = 120 x 0.9144
Three samples from each package were used to find the average denier. Yarn samples were then
cut into ten inch length and suspended between the five pound load cells of MTS® tensile tester
shown in Figure 3.20 to test for their tensile strength.
32
This was repeated for ten trials of each yarn sample.
Figure 3.20: MTS® tensile tester
33
4. RESULTS AND DISCUSSIONS
4.1 Introduction
Two series of preliminary trials were carried out in this research. The first set of
experiments was carried out using the available T-series jet in the laboratory. These jets were
used to texture the yarns at low speeds. Because these jets were not been used for a long time,
most of the jets were corroded and have become inefficient. This led to the purchase of new set
of hemajets from Heberlein. Thus new jets were used for the further study in this research.
4.2 Preliminary trials with old jets
This research was started with two old Heberlein jets T100 and T351. Owing to the poor
condition of the jet cores, these jets were used only to get the basic understanding of the
texturing process. Also the limitations of these jets with the speed at which they can be operated
allowed very minimal number of samples to be obtained for the study.
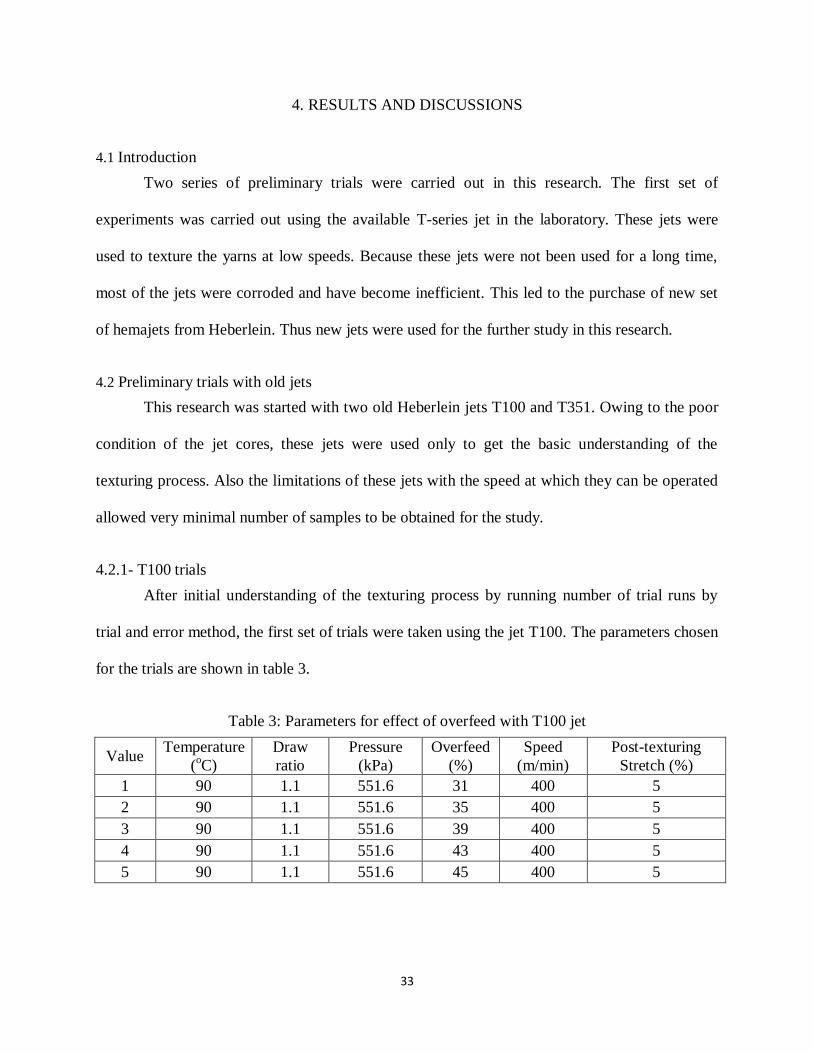
4.2.1- T100 trials
After initial understanding of the texturing process by running number of trial runs by
trial and error method, the first set of trials were taken using the jet T100. The parameters chosen
for the trials are shown in table 3.
Table 3: Parameters for effect of overfeed with T100 jet
Value Temperature
(oC)
Draw
ratio
Pressure
(kPa)
Overfeed
(%)
Speed
(m/min)
Post-texturing
Stretch (%)
1 90 1.1 551.6 31 400 5
2 90 1.1 551.6 35 400 5
3 90 1.1 551.6 39 400 5
4 90 1.1 551.6 43 400 5
5 90 1.1 551.6 45 400 5
34
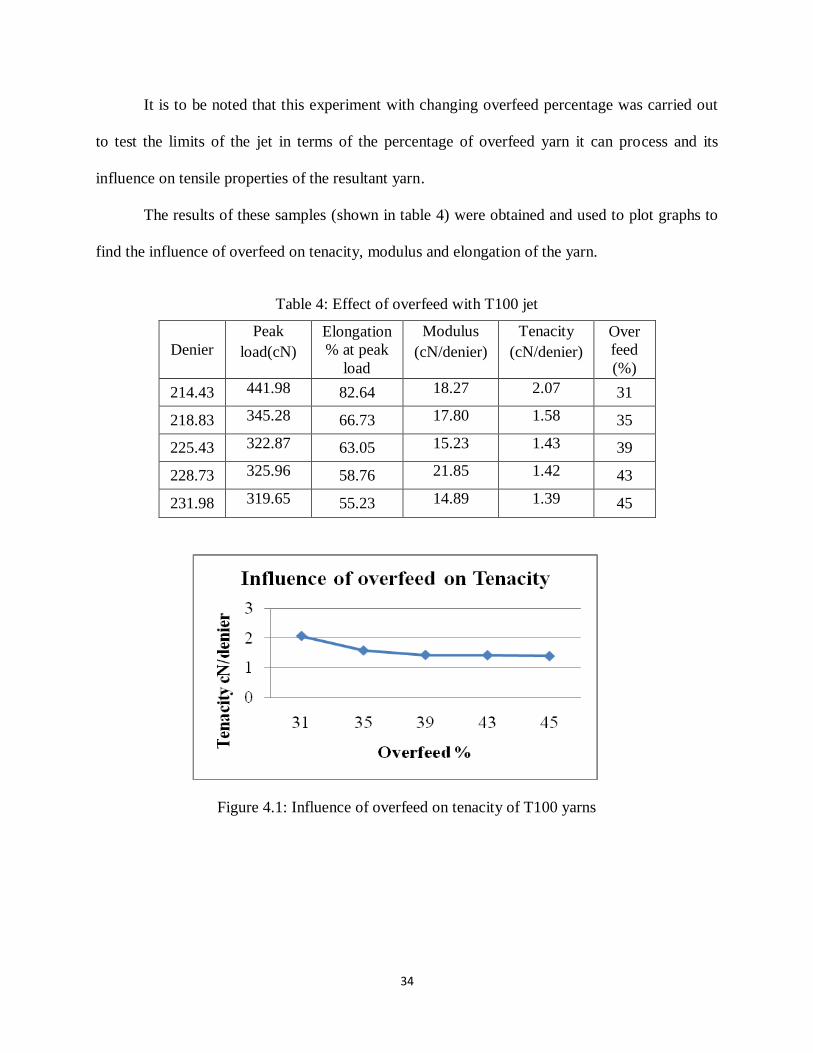
It is to be noted that this experiment with changing overfeed percentage was carried out
to test the limits of the jet in terms of the percentage of overfeed yarn it can process and its
influence on tensile properties of the resultant yarn.
The results of these samples (shown in table 4) were obtained and used to plot graphs to
find the influence of overfeed on tenacity, modulus and elongation of the yarn.
Table 4: Effect of overfeed with T100 jet
Denier
Peak
load(cN)
Elongation
% at peak
load
Modulus
(cN/denier)
Tenacity
(cN/denier)
Over
feed
(%)
214.43 441.98 82.64 18.27 2.07 31
218.83 345.28 66.73 17.80 1.58 35
225.43 322.87 63.05 15.23 1.43 39
228.73 325.96 58.76 21.85 1.42 43
231.98 319.65 55.23 14.89 1.39 45
Figure 4.1: Influence of overfeed on tenacity of T100 yarns
35
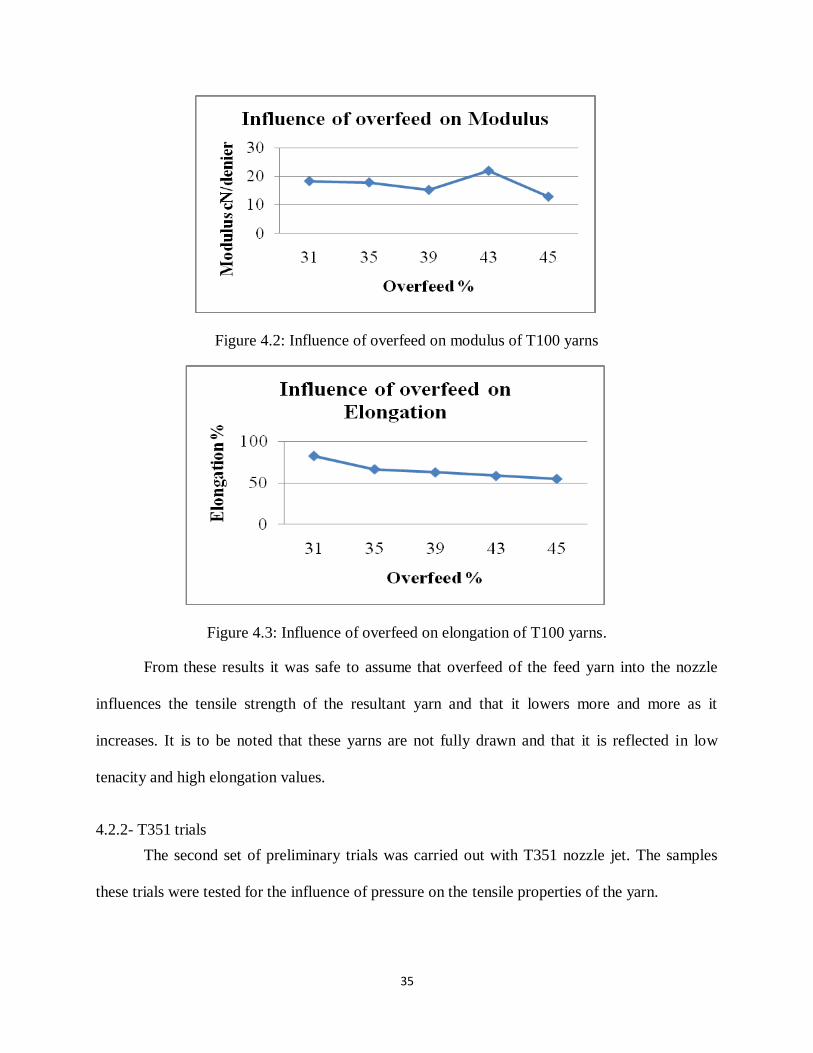
Figure 4.2: Influence of overfeed on modulus of T100 yarns
Figure 4.3: Influence of overfeed on elongation of T100 yarns.
From these results it was safe to assume that overfeed of the feed yarn into the nozzle
influences the tensile strength of the resultant yarn and that it lowers more and more as it
increases. It is to be noted that these yarns are not fully drawn and that it is reflected in low
tenacity and high elongation values.
4.2.2- T351 trials
The second set of preliminary trials was carried out with T351 nozzle jet. The samples
these trials were tested for the influence of pressure on the tensile properties of the yarn.
36
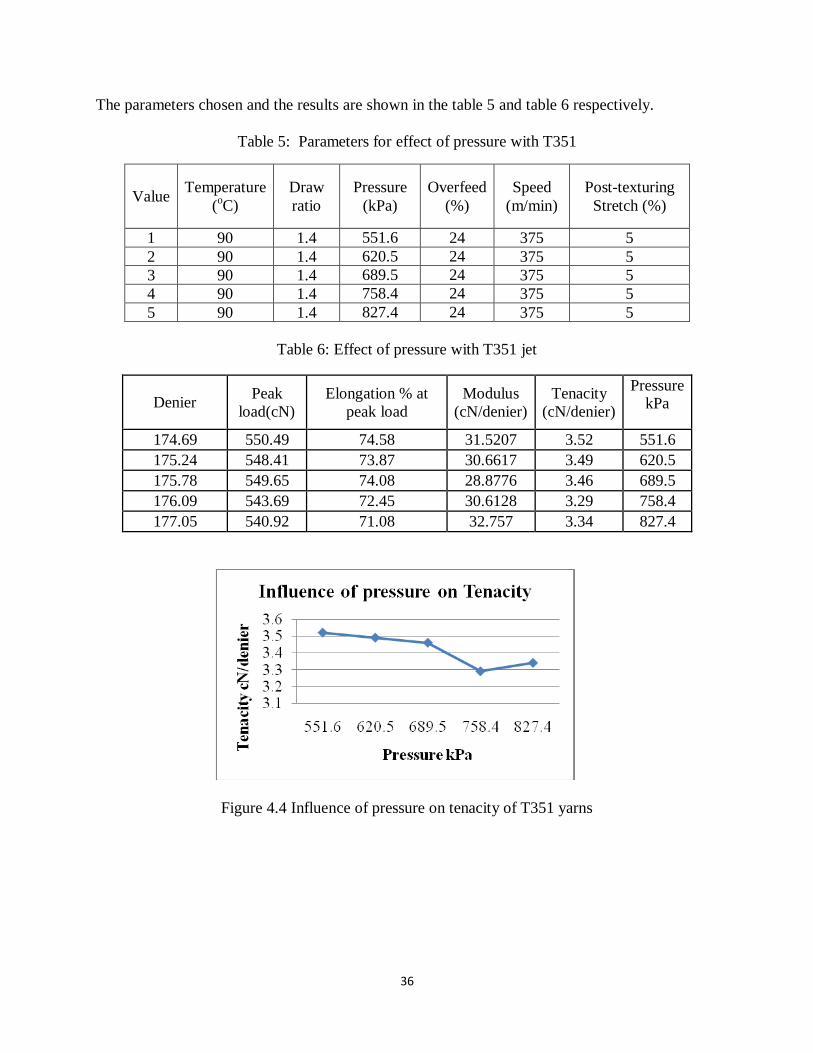
The parameters chosen and the results are shown in the table 5 and table 6 respectively.
Table 5: Parameters for effect of pressure with T351
Value Temperature
(oC)
Draw
ratio
Pressure
(kPa)
Overfeed
(%)
Speed
(m/min)
Post-texturing
Stretch (%)
1 90 1.4 551.6 24 375 5
2 90 1.4 620.5 24 375 5
3 90 1.4 689.5 24 375 5
4 90 1.4 758.4 24 375 5
5 90 1.4 827.4 24 375 5
Table 6: Effect of pressure with T351 jet
Denier Peak
load(cN)
Elongation % at
peak load
Modulus
(cN/denier)
Tenacity
(cN/denier)
Pressure kPa
174.69 550.49 74.58 31.5207 3.52 551.6
175.24 548.41 73.87 30.6617 3.49 620.5
175.78 549.65 74.08 28.8776 3.46 689.5
176.09 543.69 72.45 30.6128 3.29 758.4
177.05 540.92 71.08 32.757 3.34 827.4
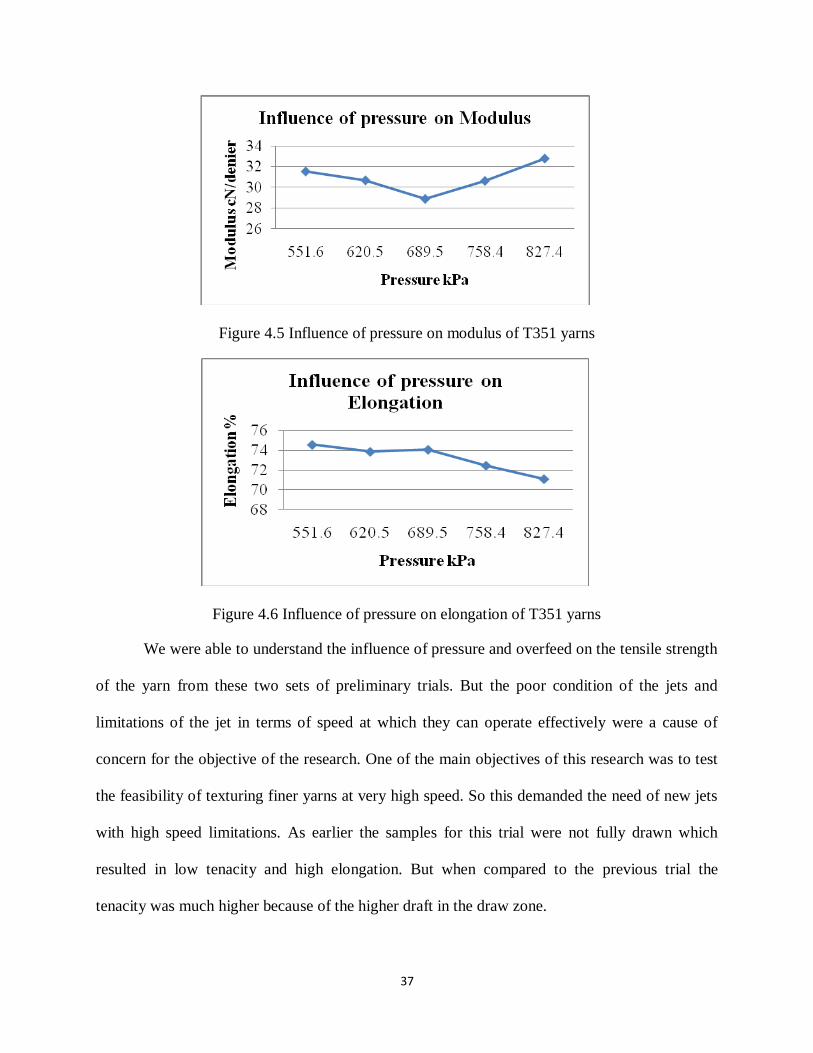
Figure 4.4 Influence of pressure on tenacity of T351 yarns
37
Figure 4.5 Influence of pressure on modulus of T351 yarns
Figure 4.6 Influence of pressure on elongation of T351 yarns
We were able to understand the influence of pressure and overfeed on the tensile strength
of the yarn from these two sets of preliminary trials. But the poor condition of the jets and
limitations of the jet in terms of speed at which they can operate effectively were a cause of
concern for the objective of the research. One of the main objectives of this research was to test
the feasibility of texturing finer yarns at very high speed. So this demanded the need of new jets
with high speed limitations. As earlier the samples for this trial were not fully drawn which
resulted in low tenacity and high elongation. But when compared to the previous trial the
tenacity was much higher because of the higher draft in the draw zone.
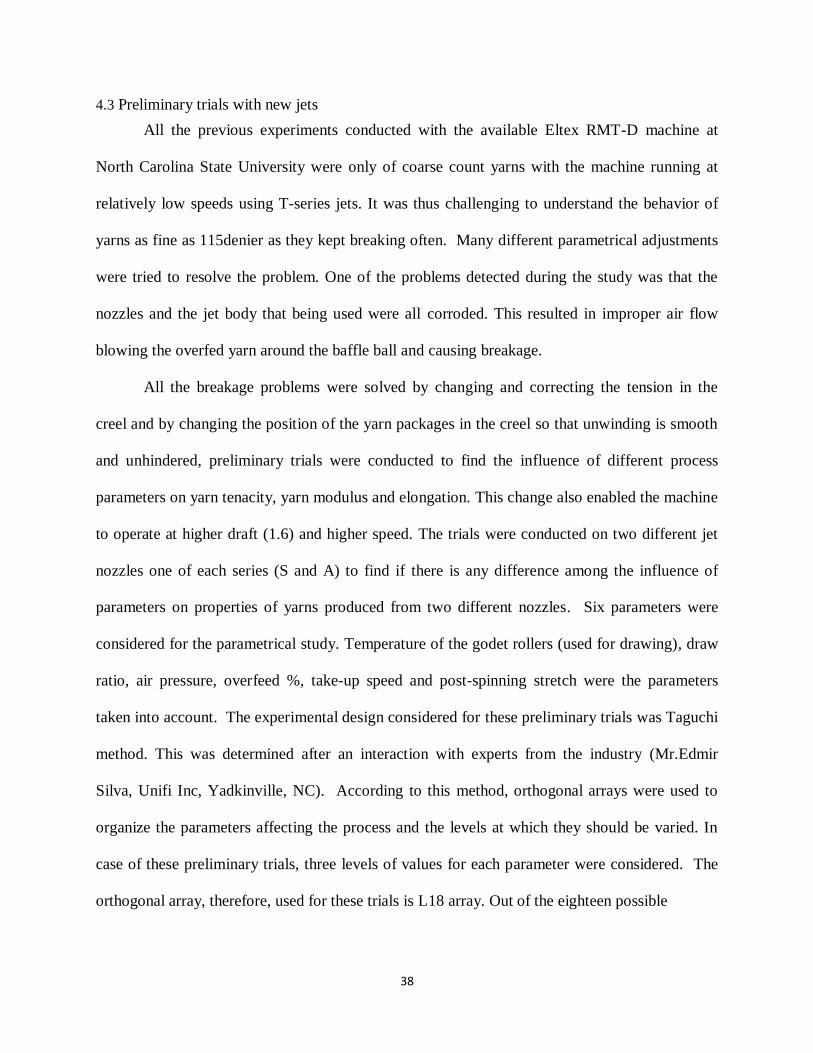
38
4.3 Preliminary trials with new jets
All the previous experiments conducted with the available Eltex RMT-D machine at
North Carolina State University were only of coarse count yarns with the machine running at
relatively low speeds using T-series jets. It was thus challenging to understand the behavior of
yarns as fine as 115denier as they kept breaking often. Many different parametrical adjustments
were tried to resolve the problem. One of the problems detected during the study was that the
nozzles and the jet body that being used were all corroded. This resulted in improper air flow
blowing the overfed yarn around the baffle ball and causing breakage.
All the breakage problems were solved by changing and correcting the tension in the
creel and by changing the position of the yarn packages in the creel so that unwinding is smooth
and unhindered, preliminary trials were conducted to find the influence of different process
parameters on yarn tenacity, yarn modulus and elongation. This change also enabled the machine
to operate at higher draft (1.6) and higher speed. The trials were conducted on two different jet
nozzles one of each series (S and A) to find if there is any difference among the influence of
parameters on properties of yarns produced from two different nozzles. Six parameters were
considered for the parametrical study. Temperature of the godet rollers (used for drawing), draw
ratio, air pressure, overfeed %, take-up speed and post-spinning stretch were the parameters
taken into account. The experimental design considered for these preliminary trials was Taguchi
method. This was determined after an interaction with experts from the industry (Mr.Edmir
Silva, Unifi Inc, Yadkinville, NC). According to this method, orthogonal arrays were used to
organize the parameters affecting the process and the levels at which they should be varied. In
case of these preliminary trials, three levels of values for each parameter were considered. The
orthogonal array, therefore, used for these trials is L18 array. Out of the eighteen possible
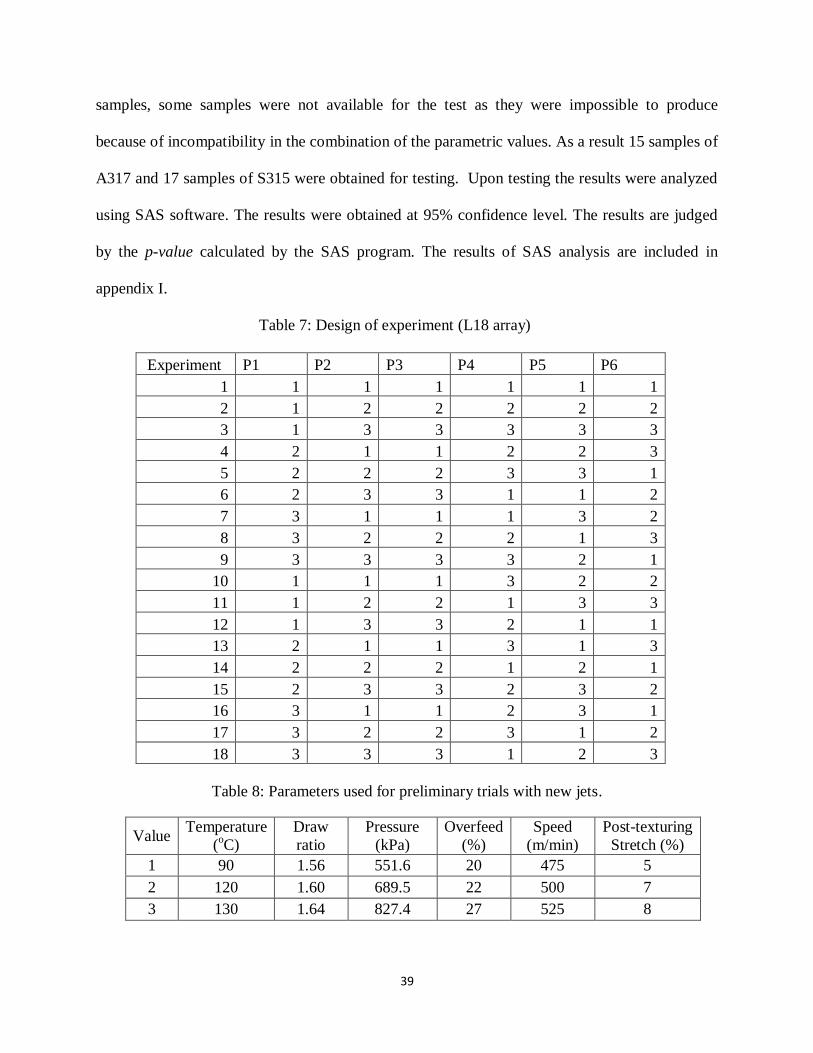
39
samples, some samples were not available for the test as they were impossible to produce
because of incompatibility in the combination of the parametric values. As a result 15 samples of
A317 and 17 samples of S315 were obtained for testing. Upon testing the results were analyzed
using SAS software. The results were obtained at 95% confidence level. The results are judged
by the p-value calculated by the SAS program. The results of SAS analysis are included in
appendix I.
Table 7: Design of experiment (L18 array)
Experiment P1 P2 P3 P4 P5 P6
1 1 1 1 1 1 1
2 1 2 2 2 2 2
3 1 3 3 3 3 3
4 2 1 1 2 2 3
5 2 2 2 3 3 1
6 2 3 3 1 1 2
7 3 1 1 1 3 2
8 3 2 2 2 1 3
9 3 3 3 3 2 1
10 1 1 1 3 2 2
11 1 2 2 1 3 3
12 1 3 3 2 1 1
13 2 1 1 3 1 3
14 2 2 2 1 2 1
15 2 3 3 2 3 2
16 3 1 1 2 3 1
17 3 2 2 3 1 2
18 3 3 3 1 2 3
Table 8: Parameters used for preliminary trials with new jets.
Value Temperature
(oC)
Draw
ratio
Pressure
(kPa)
Overfeed
(%)
Speed
(m/min)
Post-texturing
Stretch (%)
1 90 1.56 551.6 20 475 5
2 120 1.60 689.5 22 500 7
3 130 1.64 827.4 27 525 8
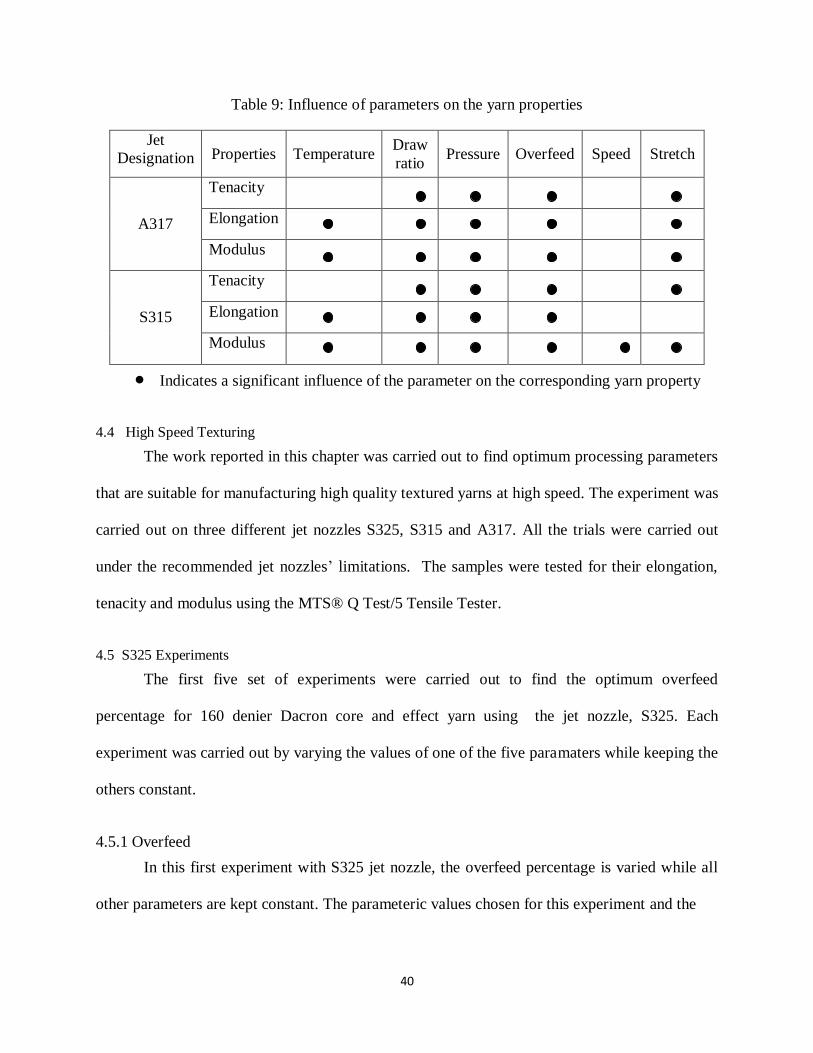
40
Table 9: Influence of parameters on the yarn properties
Jet
Designation Properties Temperature Draw
ratio Pressure Overfeed Speed Stretch
A317
Tenacity
Elongation
Modulus
S315
Tenacity
Elongation
Modulus
Indicates a significant influence of the parameter on the corresponding yarn property
4.4 High Speed Texturing
The work reported in this chapter was carried out to find optimum processing parameters
that are suitable for manufacturing high quality textured yarns at high speed. The experiment was
carried out on three different jet nozzles S325, S315 and A317. All the trials were carried out
under the recommended jet nozzles‘ limitations. The samples were tested for their elongation,
tenacity and modulus using the MTS® Q Test/5 Tensile Tester.
4.5 S325 Experiments
The first five set of experiments were carried out to find the optimum overfeed
percentage for 160 denier Dacron core and effect yarn using the jet nozzle, S325. Each
experiment was carried out by varying the values of one of the five paramaters while keeping the
others constant.
4.5.1 Overfeed
In this first experiment with S325 jet nozzle, the overfeed percentage is varied while all
other parameters are kept constant. The parameteric values chosen for this experiment and the
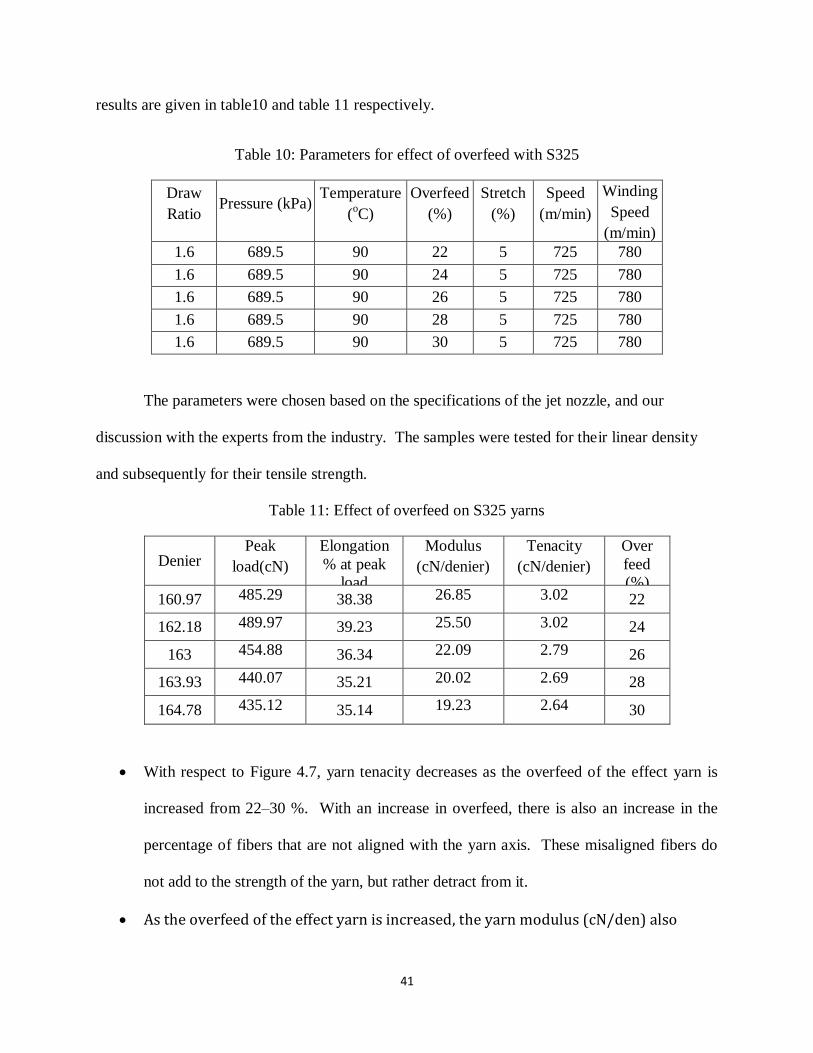
41
results are given in table10 and table 11 respectively.
Table 10: Parameters for effect of overfeed with S325
Draw
Ratio Pressure (kPa)
Temperature
(oC)
Overfeed
(%)
Stretch
(%)
Speed
(m/min)
Winding
Speed
(m/min)
1.6 689.5 90 22 5 725 780
1.6 689.5 90 24 5 725 780
1.6 689.5 90 26 5 725 780
1.6 689.5 90 28 5 725 780
1.6 689.5 90 30 5 725 780
The parameters were chosen based on the specifications of the jet nozzle, and our
discussion with the experts from the industry. The samples were tested for their linear density
and subsequently for their tensile strength.
Table 11: Effect of overfeed on S325 yarns
Denier Peak
load(cN)
Elongation
% at peak
load
Modulus
(cN/denier)
Tenacity
(cN/denier)
Over
feed
(%) 160.97 485.29 38.38 26.85 3.02 22
162.18 489.97 39.23 25.50 3.02 24
163 454.88 36.34 22.09 2.79 26
163.93 440.07 35.21 20.02 2.69 28
164.78 435.12 35.14 19.23 2.64 30
With respect to Figure 4.7, yarn tenacity decreases as the overfeed of the effect yarn is
increased from 22–30 %. With an increase in overfeed, there is also an increase in the
percentage of fibers that are not aligned with the yarn axis. These misaligned fibers do
not add to the strength of the yarn, but rather detract from it.
As the overfeed of the effect yarn is increased, the yarn modulus (cN/den) also
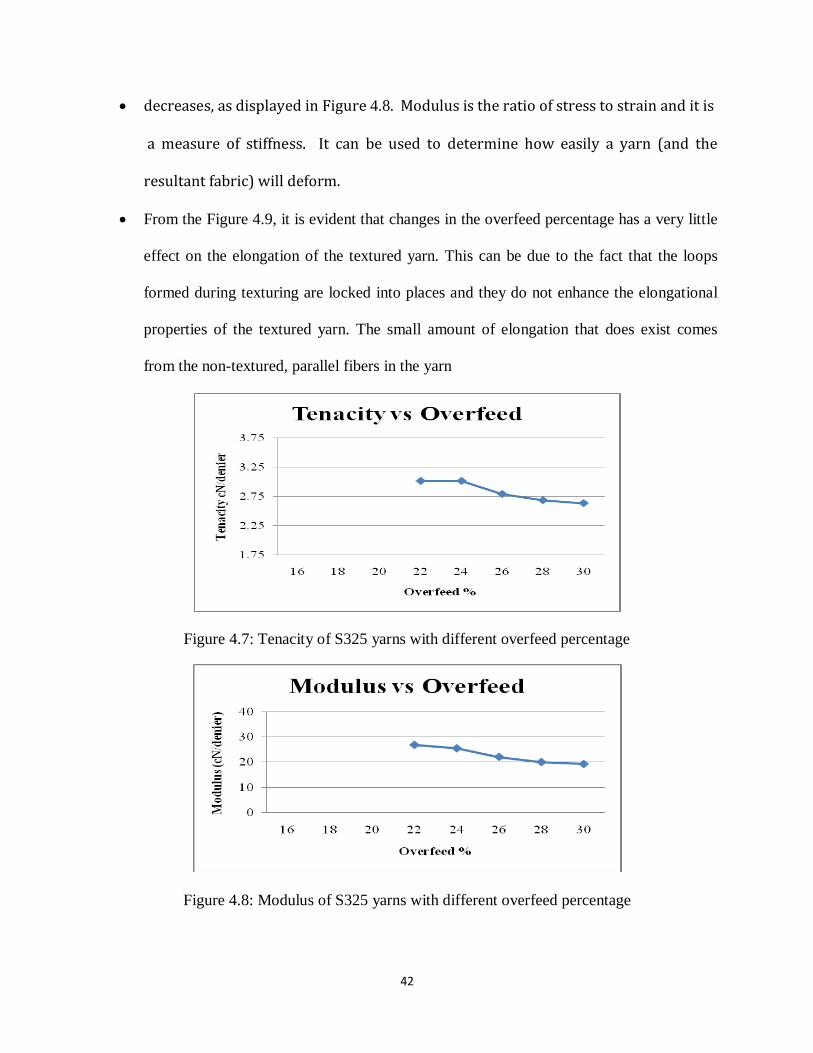
42
decreases, as displayed in Figure 4.8. Modulus is the ratio of stress to strain and it is
a measure of stiffness. It can be used to determine how easily a yarn (and the
resultant fabric) will deform.
From the Figure 4.9, it is evident that changes in the overfeed percentage has a very little
effect on the elongation of the textured yarn. This can be due to the fact that the loops
formed during texturing are locked into places and they do not enhance the elongational
properties of the textured yarn. The small amount of elongation that does exist comes
from the non-textured, parallel fibers in the yarn
Figure 4.7: Tenacity of S325 yarns with different overfeed percentage
Figure 4.8: Modulus of S325 yarns with different overfeed percentage
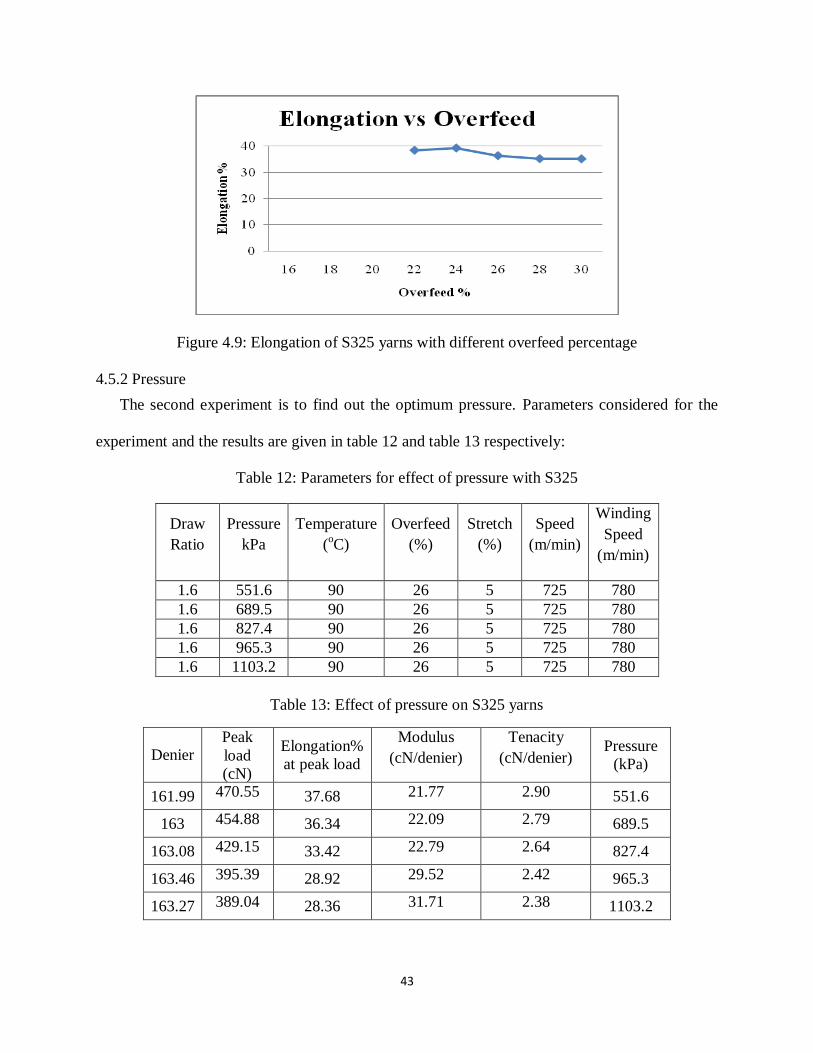
43
Figure 4.9: Elongation of S325 yarns with different overfeed percentage
4.5.2 Pressure
The second experiment is to find out the optimum pressure. Parameters considered for the
experiment and the results are given in table 12 and table 13 respectively:
Table 12: Parameters for effect of pressure with S325
Draw
Ratio
Pressure
kPa
Temperature
(oC)
Overfeed
(%)
Stretch
(%)
Speed
(m/min)
Winding
Speed
(m/min)
1.6 551.6 90 26 5 725 780
1.6 689.5 90 26 5 725 780
1.6 827.4 90 26 5 725 780
1.6 965.3 90 26 5 725 780
1.6 1103.2 90 26 5 725 780
Table 13: Effect of pressure on S325 yarns
Denier Peak
load
(cN)
Elongation%
at peak load
Modulus
(cN/denier)
Tenacity
(cN/denier) Pressure
(kPa)
161.99 470.55 37.68 21.77 2.90 551.6
163 454.88 36.34 22.09 2.79 689.5
163.08 429.15 33.42 22.79 2.64 827.4
163.46 395.39 28.92 29.52 2.42 965.3
163.27 389.04 28.36 31.71 2.38 1103.2
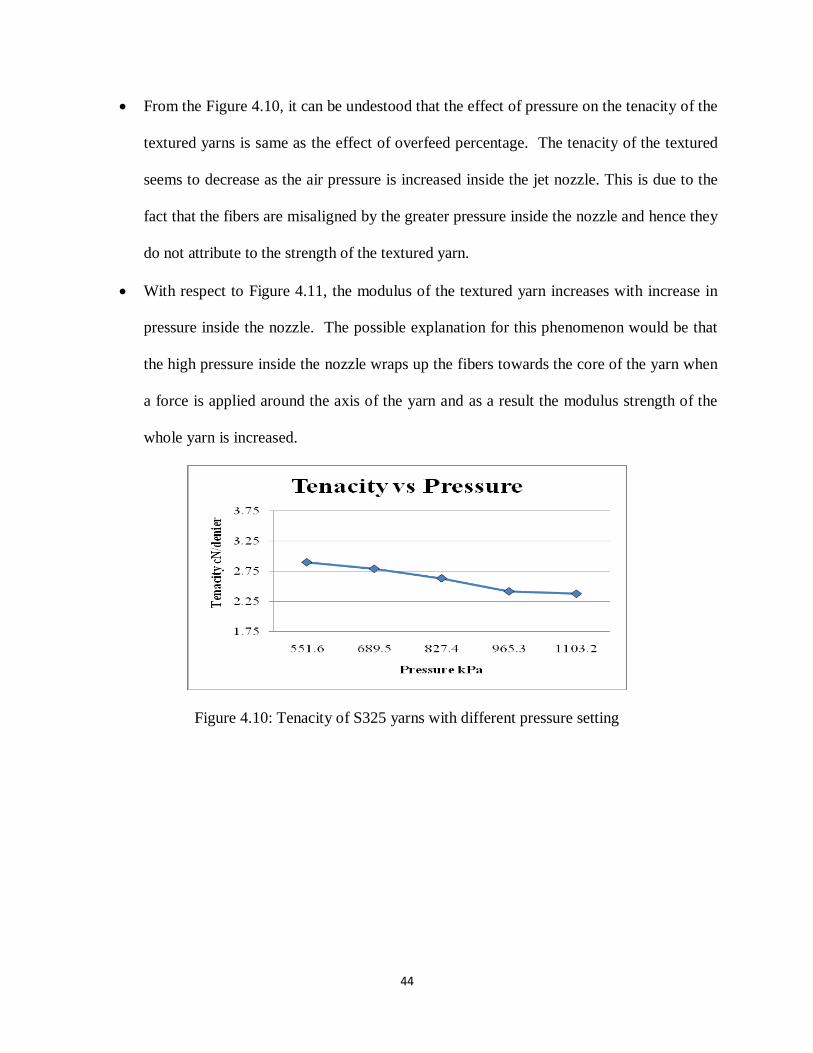
44
From the Figure 4.10, it can be undestood that the effect of pressure on the tenacity of the
textured yarns is same as the effect of overfeed percentage. The tenacity of the textured
seems to decrease as the air pressure is increased inside the jet nozzle. This is due to the
fact that the fibers are misaligned by the greater pressure inside the nozzle and hence they
do not attribute to the strength of the textured yarn.
With respect to Figure 4.11, the modulus of the textured yarn increases with increase in
pressure inside the nozzle. The possible explanation for this phenomenon would be that
the high pressure inside the nozzle wraps up the fibers towards the core of the yarn when
a force is applied around the axis of the yarn and as a result the modulus strength of the
whole yarn is increased.
Figure 4.10: Tenacity of S325 yarns with different pressure setting
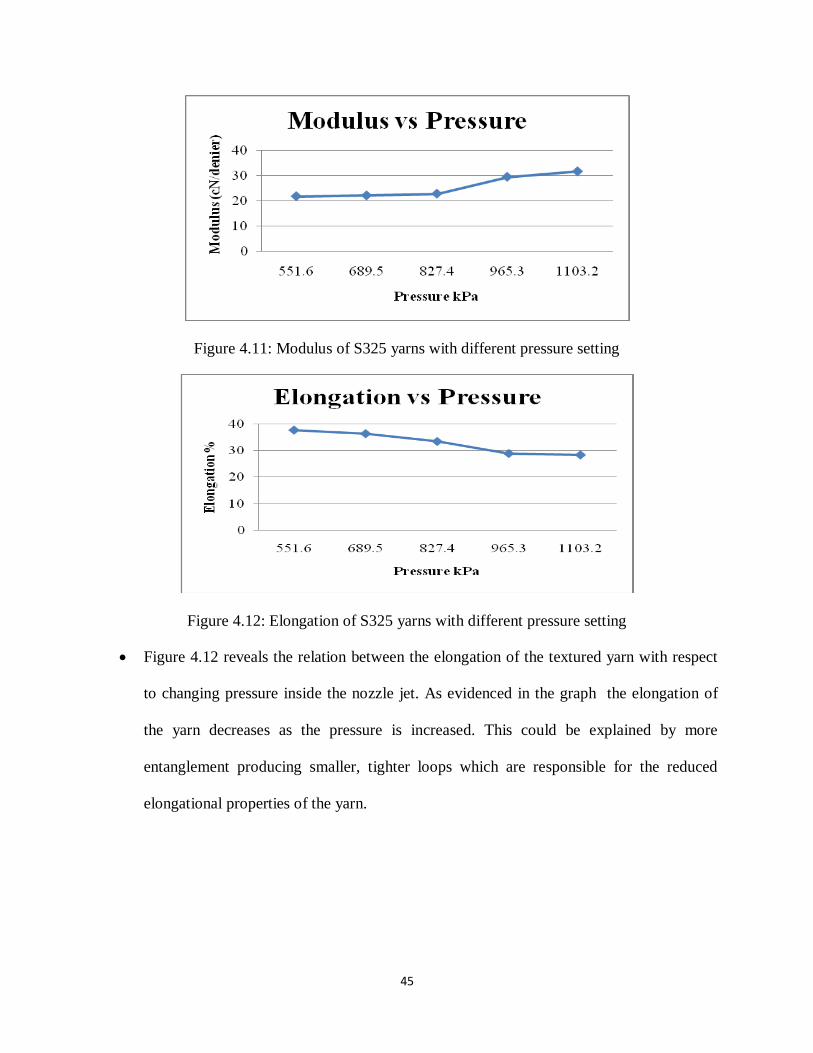
45
Figure 4.11: Modulus of S325 yarns with different pressure setting
Figure 4.12: Elongation of S325 yarns with different pressure setting
Figure 4.12 reveals the relation between the elongation of the textured yarn with respect
to changing pressure inside the nozzle jet. As evidenced in the graph the elongation of
the yarn decreases as the pressure is increased. This could be explained by more
entanglement producing smaller, tighter loops which are responsible for the reduced
elongational properties of the yarn.
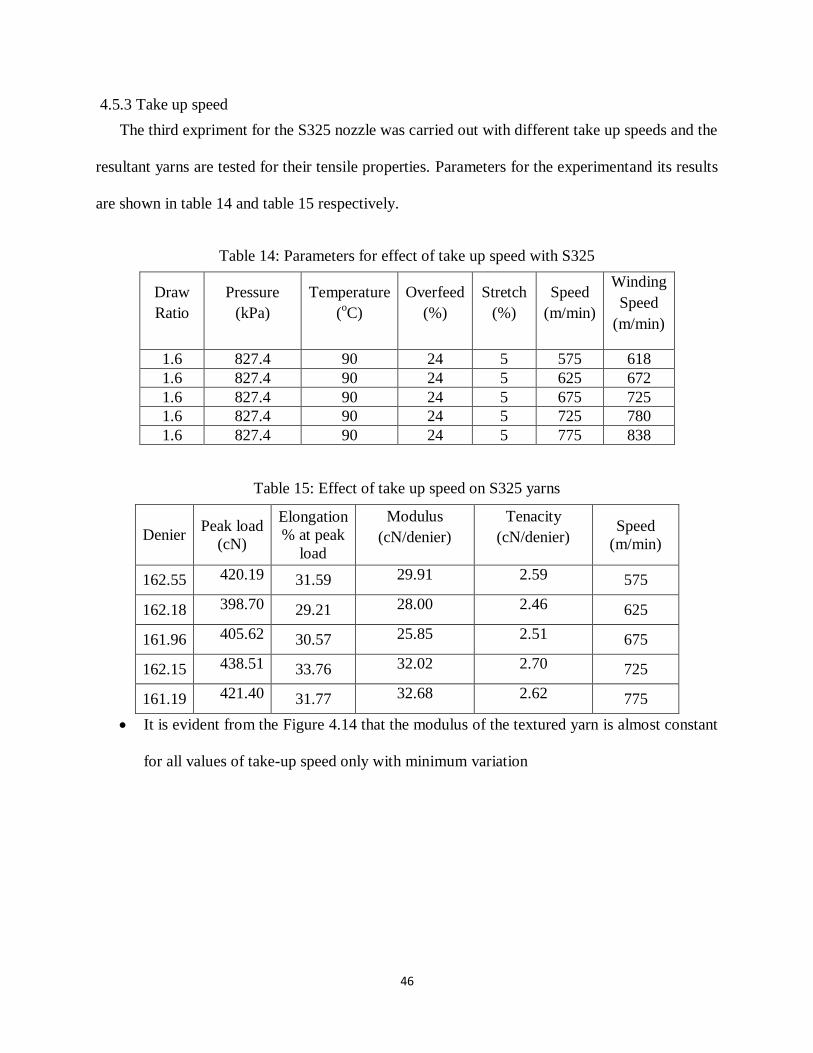
46
4.5.3 Take up speed
The third expriment for the S325 nozzle was carried out with different take up speeds and the
resultant yarns are tested for their tensile properties. Parameters for the experimentand its results
are shown in table 14 and table 15 respectively.
Table 14: Parameters for effect of take up speed with S325
Draw
Ratio
Pressure
(kPa)
Temperature
(oC)
Overfeed
(%)
Stretch
(%)
Speed
(m/min)
Winding
Speed
(m/min)
1.6 827.4 90 24 5 575 618
1.6 827.4 90 24 5 625 672
1.6 827.4 90 24 5 675 725
1.6 827.4 90 24 5 725 780
1.6 827.4 90 24 5 775 838
Table 15: Effect of take up speed on S325 yarns
Denier Peak load
(cN)
Elongation
% at peak
load
Modulus
(cN/denier)
Tenacity
(cN/denier) Speed
(m/min)
162.55 420.19 31.59 29.91 2.59 575
162.18 398.70 29.21 28.00 2.46 625
161.96 405.62 30.57 25.85 2.51 675
162.15 438.51 33.76 32.02 2.70 725
161.19 421.40 31.77 32.68 2.62 775
It is evident from the Figure 4.14 that the modulus of the textured yarn is almost constant
for all values of take-up speed only with minimum variation
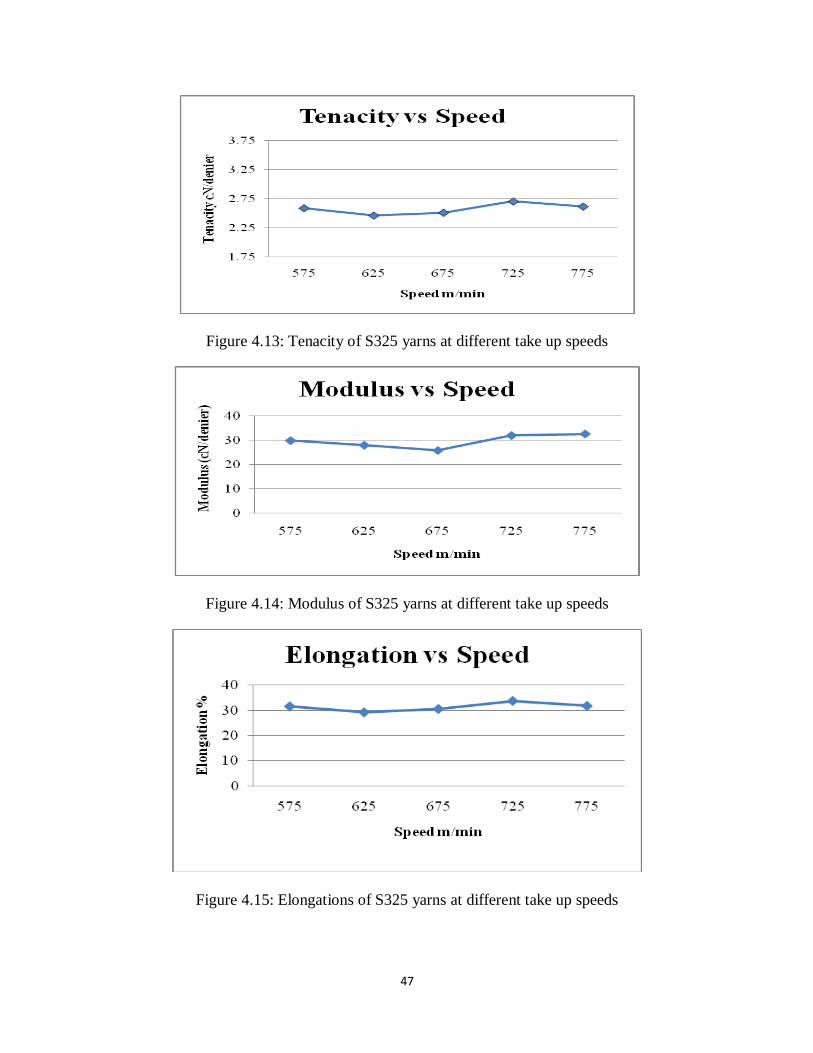
47
Figure 4.13: Tenacity of S325 yarns at different take up speeds
Figure 4.14: Modulus of S325 yarns at different take up speeds
Figure 4.15: Elongations of S325 yarns at different take up speeds
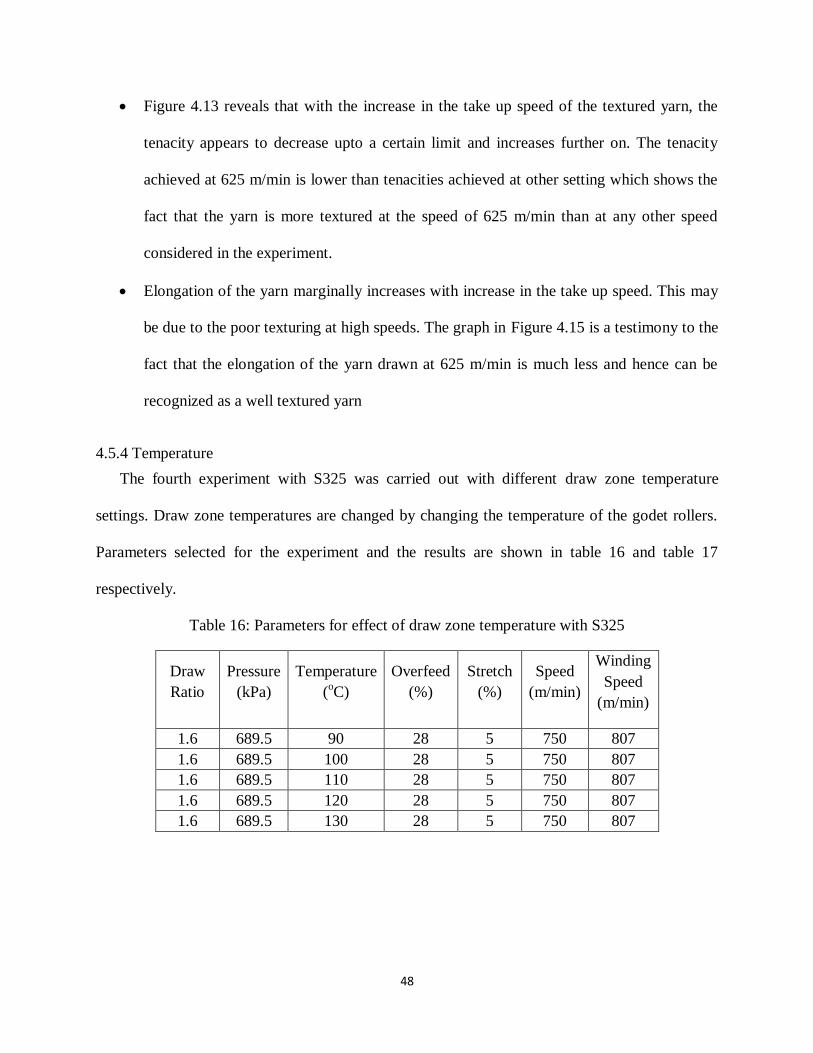
48
Figure 4.13 reveals that with the increase in the take up speed of the textured yarn, the
tenacity appears to decrease upto a certain limit and increases further on. The tenacity
achieved at 625 m/min is lower than tenacities achieved at other setting which shows the
fact that the yarn is more textured at the speed of 625 m/min than at any other speed
considered in the experiment.
Elongation of the yarn marginally increases with increase in the take up speed. This may
be due to the poor texturing at high speeds. The graph in Figure 4.15 is a testimony to the
fact that the elongation of the yarn drawn at 625 m/min is much less and hence can be
recognized as a well textured yarn
4.5.4 Temperature
The fourth experiment with S325 was carried out with different draw zone temperature
settings. Draw zone temperatures are changed by changing the temperature of the godet rollers.
Parameters selected for the experiment and the results are shown in table 16 and table 17
respectively.
Table 16: Parameters for effect of draw zone temperature with S325
Draw
Ratio
Pressure
(kPa)
Temperature
(oC)
Overfeed
(%)
Stretch
(%)
Speed
(m/min)
Winding
Speed
(m/min)
1.6 689.5 90 28 5 750 807
1.6 689.5 100 28 5 750 807
1.6 689.5 110 28 5 750 807
1.6 689.5 120 28 5 750 807
1.6 689.5 130 28 5 750 807
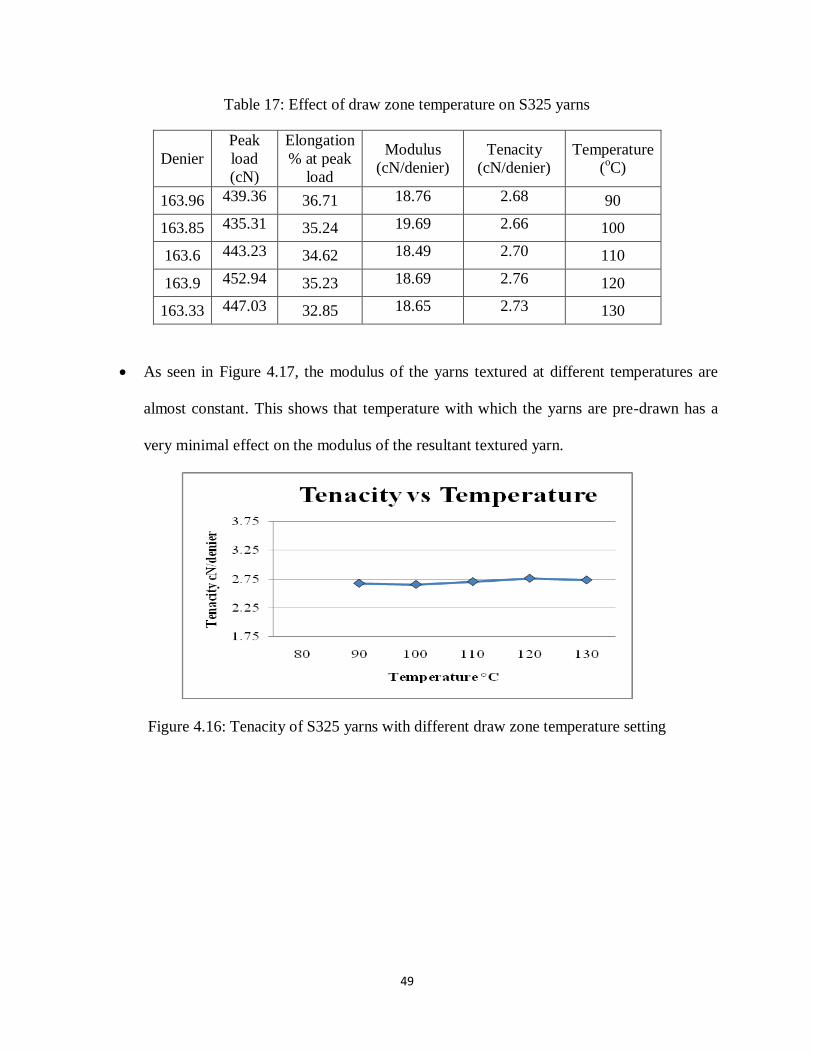
49
Table 17: Effect of draw zone temperature on S325 yarns
Denier
Peak
load
(cN)
Elongation
% at peak
load
Modulus
(cN/denier)
Tenacity
(cN/denier)
Temperature
(oC)
163.96 439.36 36.71 18.76 2.68 90
163.85 435.31 35.24 19.69 2.66 100
163.6 443.23 34.62 18.49 2.70 110
163.9 452.94 35.23 18.69 2.76 120
163.33 447.03 32.85 18.65 2.73 130
As seen in Figure 4.17, the modulus of the yarns textured at different temperatures are
almost constant. This shows that temperature with which the yarns are pre-drawn has a
very minimal effect on the modulus of the resultant textured yarn.
Figure 4.16: Tenacity of S325 yarns with different draw zone temperature setting
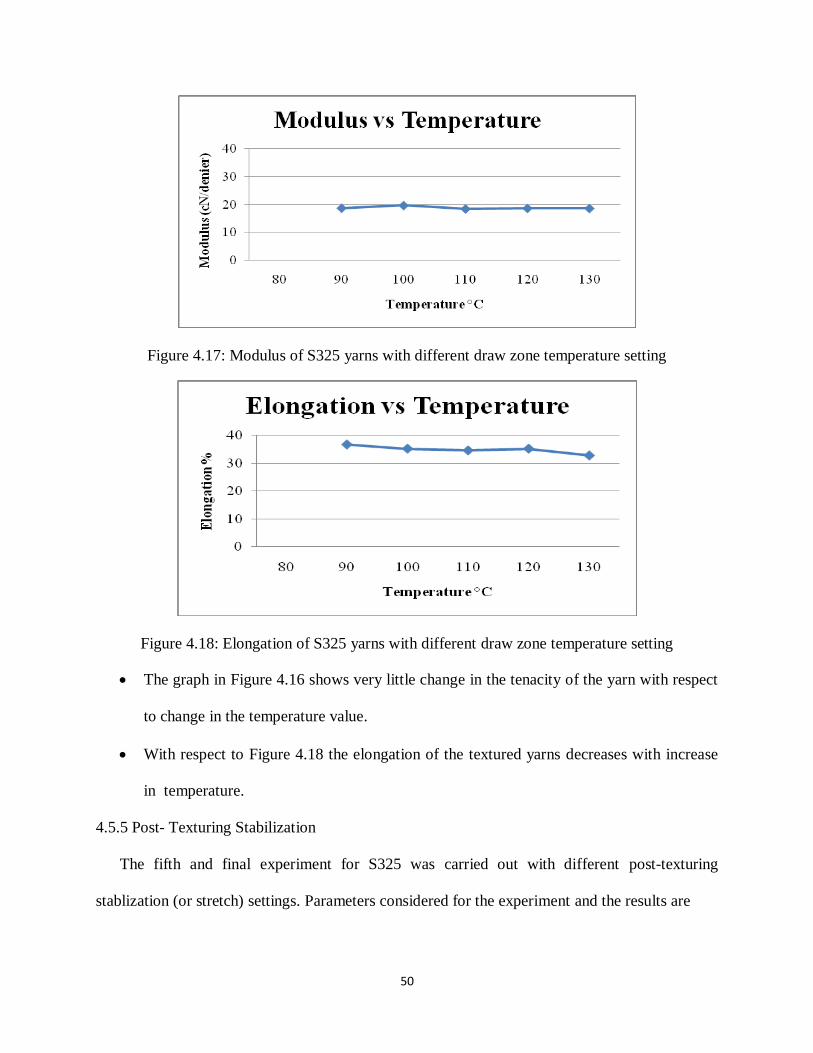
50
Figure 4.17: Modulus of S325 yarns with different draw zone temperature setting
Figure 4.18: Elongation of S325 yarns with different draw zone temperature setting
The graph in Figure 4.16 shows very little change in the tenacity of the yarn with respect
to change in the temperature value.
With respect to Figure 4.18 the elongation of the textured yarns decreases with increase
in temperature.
4.5.5 Post- Texturing Stabilization
The fifth and final experiment for S325 was carried out with different post-texturing
stablization (or stretch) settings. Parameters considered for the experiment and the results are
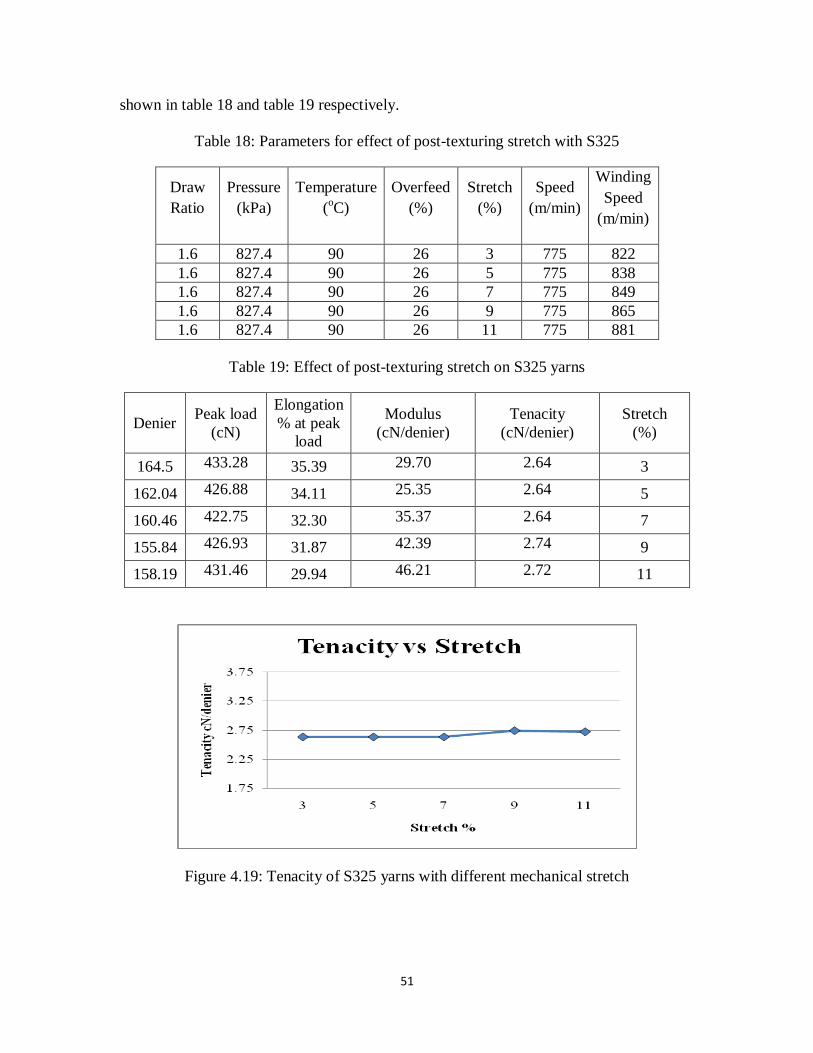
51
shown in table 18 and table 19 respectively.
Table 18: Parameters for effect of post-texturing stretch with S325
Draw
Ratio
Pressure
(kPa)
Temperature
(oC)
Overfeed
(%)
Stretch
(%)
Speed
(m/min)
Winding
Speed
(m/min)
1.6 827.4 90 26 3 775 822
1.6 827.4 90 26 5 775 838
1.6 827.4 90 26 7 775 849
1.6 827.4 90 26 9 775 865
1.6 827.4 90 26 11 775 881
Table 19: Effect of post-texturing stretch on S325 yarns
Denier Peak load
(cN)
Elongation
% at peak
load
Modulus
(cN/denier)
Tenacity
(cN/denier)
Stretch
(%)
164.5 433.28 35.39 29.70 2.64 3
162.04 426.88 34.11 25.35 2.64 5
160.46 422.75 32.30 35.37 2.64 7
155.84 426.93 31.87 42.39 2.74 9
158.19 431.46 29.94 46.21 2.72 11
Figure 4.19: Tenacity of S325 yarns with different mechanical stretch
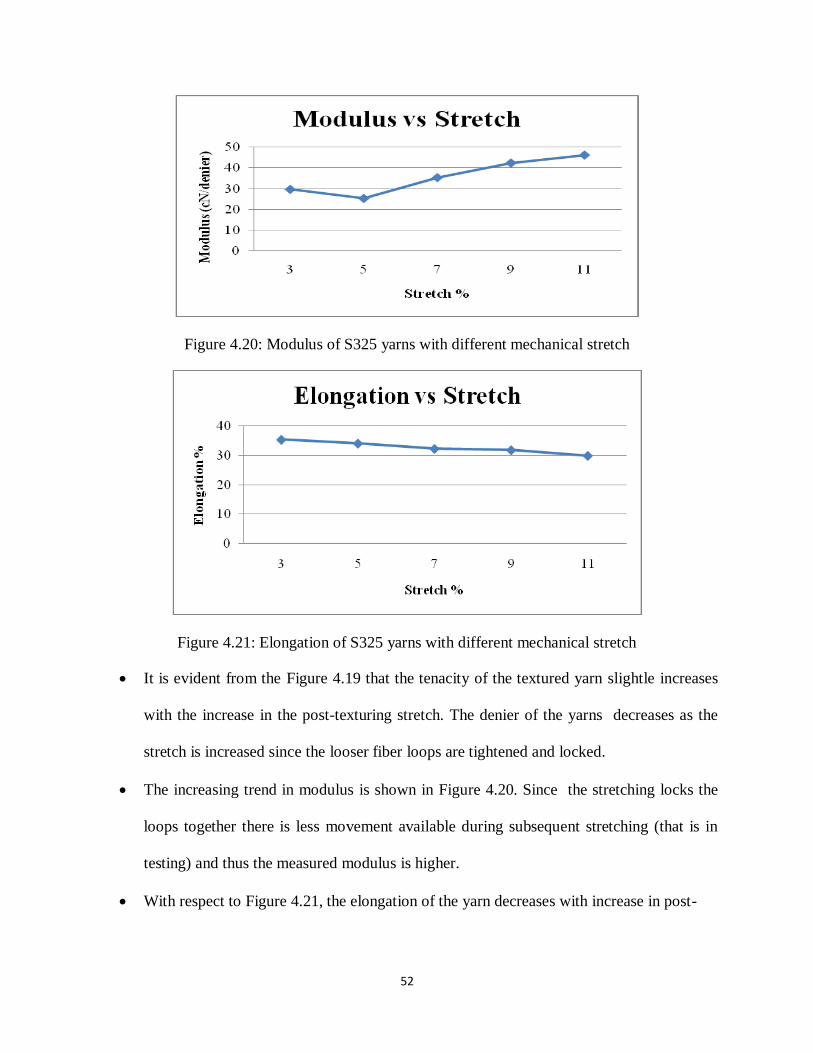
52
Figure 4.20: Modulus of S325 yarns with different mechanical stretch
Figure 4.21: Elongation of S325 yarns with different mechanical stretch
It is evident from the Figure 4.19 that the tenacity of the textured yarn slightle increases
with the increase in the post-texturing stretch. The denier of the yarns decreases as the
stretch is increased since the looser fiber loops are tightened and locked.
The increasing trend in modulus is shown in Figure 4.20. Since the stretching locks the
loops together there is less movement available during subsequent stretching (that is in
testing) and thus the measured modulus is higher.
With respect to Figure 4.21, the elongation of the yarn decreases with increase in post-
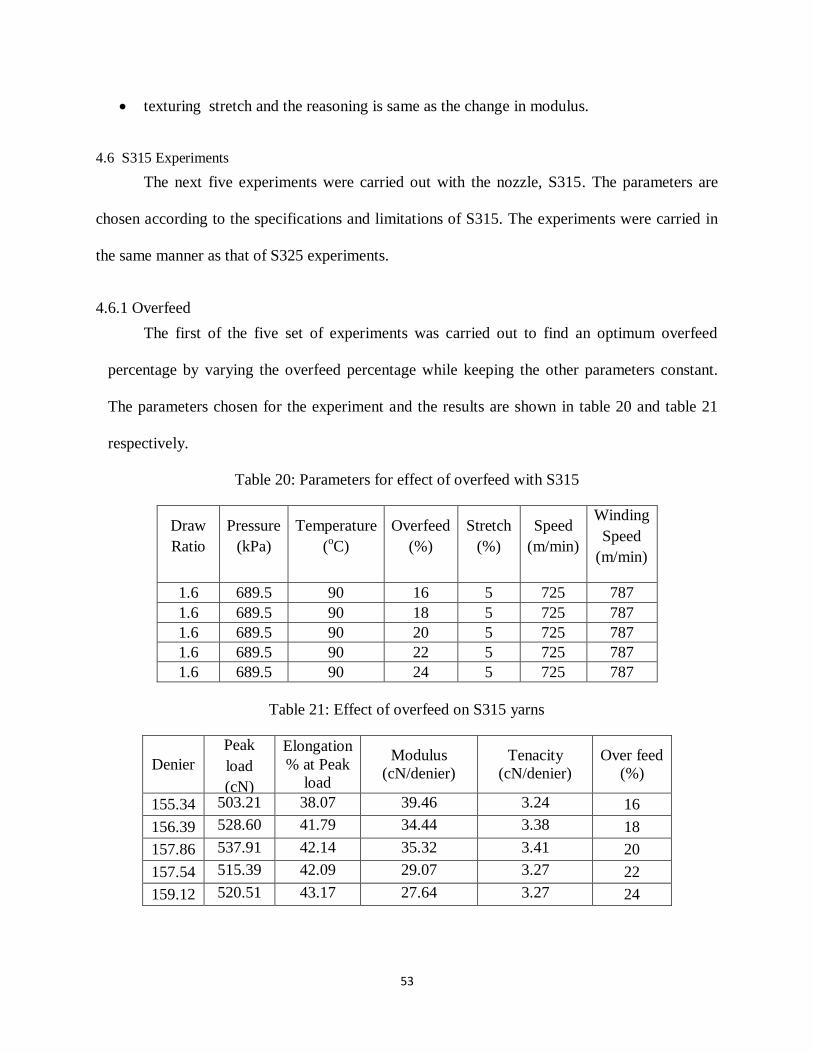
53
texturing stretch and the reasoning is same as the change in modulus.
4.6 S315 Experiments
The next five experiments were carried out with the nozzle, S315. The parameters are
chosen according to the specifications and limitations of S315. The experiments were carried in
the same manner as that of S325 experiments.
4.6.1 Overfeed
The first of the five set of experiments was carried out to find an optimum overfeed
percentage by varying the overfeed percentage while keeping the other parameters constant.
The parameters chosen for the experiment and the results are shown in table 20 and table 21
respectively.
Table 20: Parameters for effect of overfeed with S315
Draw
Ratio
Pressure
(kPa)
Temperature
(oC)
Overfeed
(%)
Stretch
(%)
Speed
(m/min)
Winding
Speed
(m/min)
1.6 689.5 90 16 5 725 787
1.6 689.5 90 18 5 725 787
1.6 689.5 90 20 5 725 787
1.6 689.5 90 22 5 725 787
1.6 689.5 90 24 5 725 787
Table 21: Effect of overfeed on S315 yarns
Denier
Peak
load
(cN)
Elongation
% at Peak
load
Modulus
(cN/denier)
Tenacity
(cN/denier)
Over feed
(%)
155.34 503.21 38.07 39.46 3.24 16
156.39 528.60 41.79 34.44 3.38 18
157.86 537.91 42.14 35.32 3.41 20
157.54 515.39 42.09 29.07 3.27 22
159.12 520.51 43.17 27.64 3.27 24
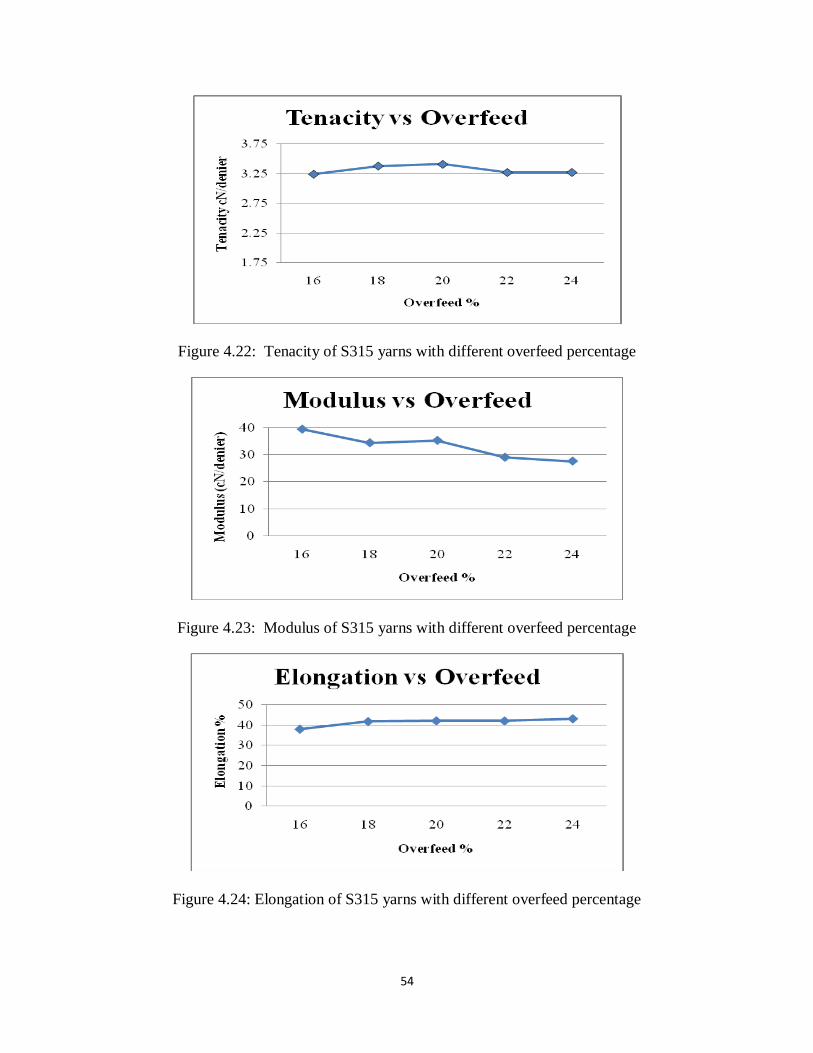
54
Figure 4.22: Tenacity of S315 yarns with different overfeed percentage
Figure 4.23: Modulus of S315 yarns with different overfeed percentage
Figure 4.24: Elongation of S315 yarns with different overfeed percentage
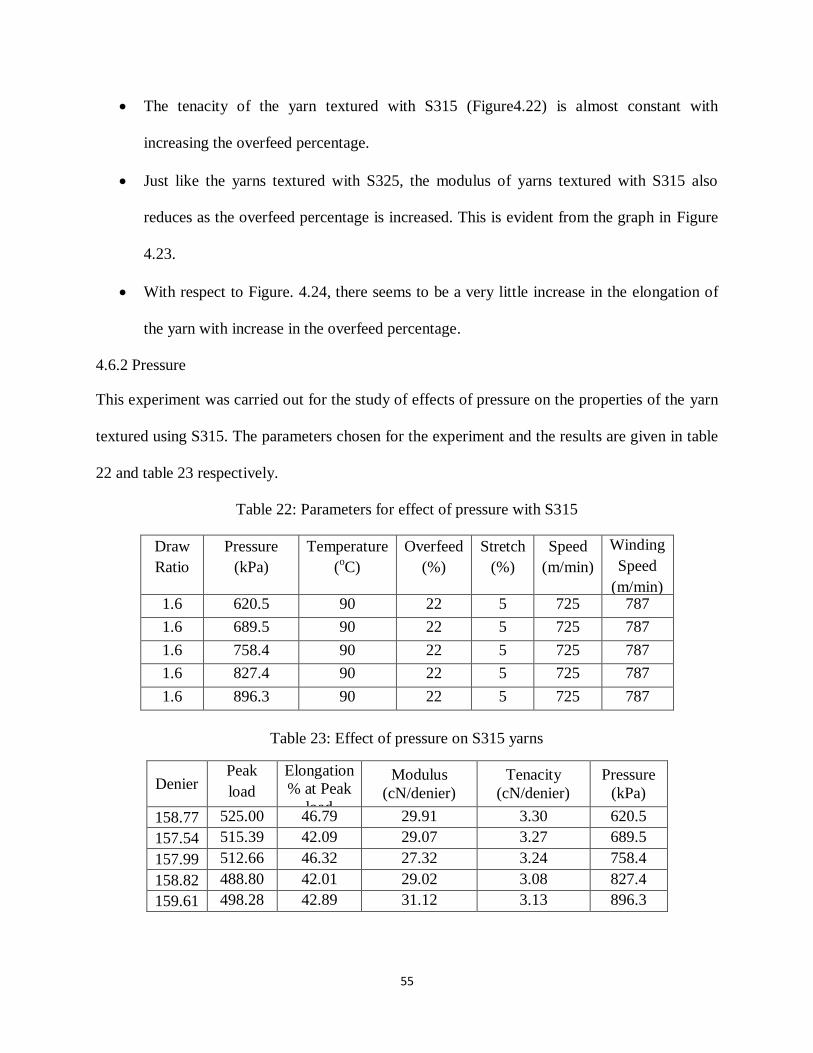
55
The tenacity of the yarn textured with S315 (Figure4.22) is almost constant with
increasing the overfeed percentage.
Just like the yarns textured with S325, the modulus of yarns textured with S315 also
reduces as the overfeed percentage is increased. This is evident from the graph in Figure
4.23.
With respect to Figure. 4.24, there seems to be a very little increase in the elongation of
the yarn with increase in the overfeed percentage.
4.6.2 Pressure
This experiment was carried out for the study of effects of pressure on the properties of the yarn
textured using S315. The parameters chosen for the experiment and the results are given in table
22 and table 23 respectively.
Table 22: Parameters for effect of pressure with S315
Draw
Ratio
Pressure
(kPa)
Temperature
(oC)
Overfeed
(%)
Stretch
(%)
Speed
(m/min)
Winding
Speed
(m/min) 1.6 620.5 90 22 5 725 787
1.6 689.5 90 22 5 725 787
1.6 758.4 90 22 5 725 787
1.6 827.4 90 22 5 725 787
1.6 896.3 90 22 5 725 787
Table 23: Effect of pressure on S315 yarns
Denier Peak
load
(cN)
Elongation
% at Peak
load
Modulus
(cN/denier)
Tenacity
(cN/denier)
Pressure
(kPa)
158.77 525.00 46.79 29.91 3.30 620.5
157.54 515.39 42.09 29.07 3.27 689.5
157.99 512.66 46.32 27.32 3.24 758.4
158.82 488.80 42.01 29.02 3.08 827.4
159.61 498.28 42.89 31.12 3.13 896.3
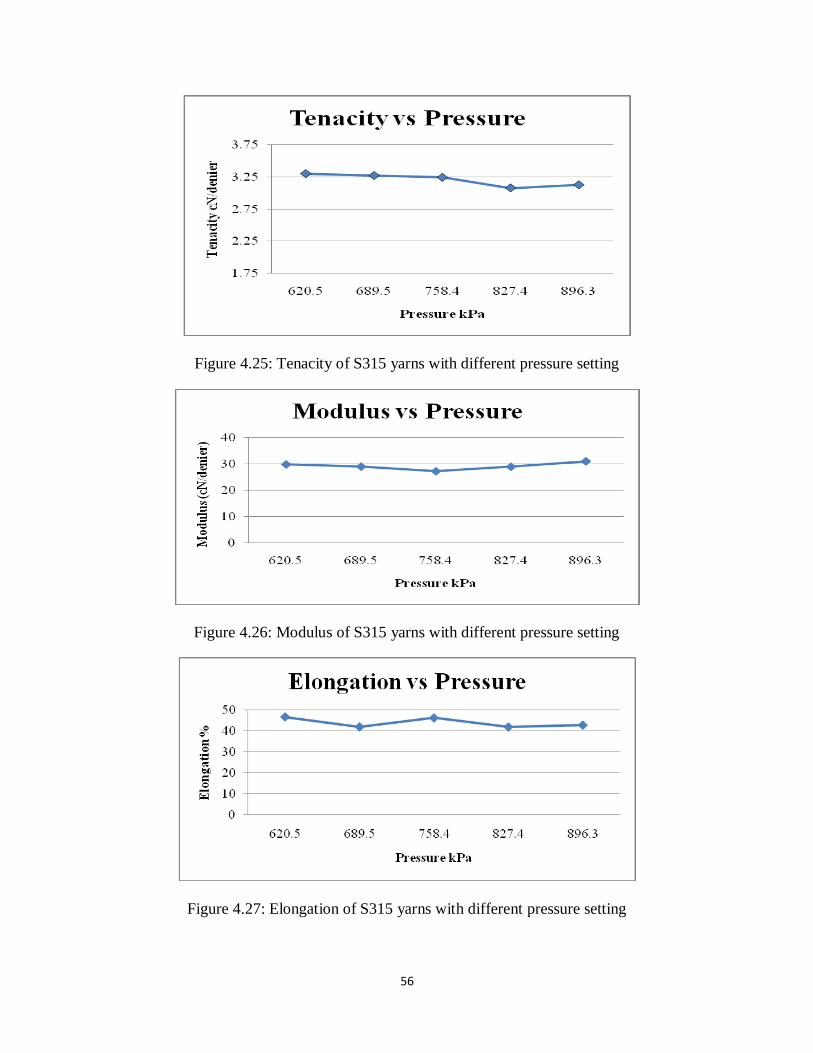
56
Figure 4.25: Tenacity of S315 yarns with different pressure setting
Figure 4.26: Modulus of S315 yarns with different pressure setting
Figure 4.27: Elongation of S315 yarns with different pressure setting
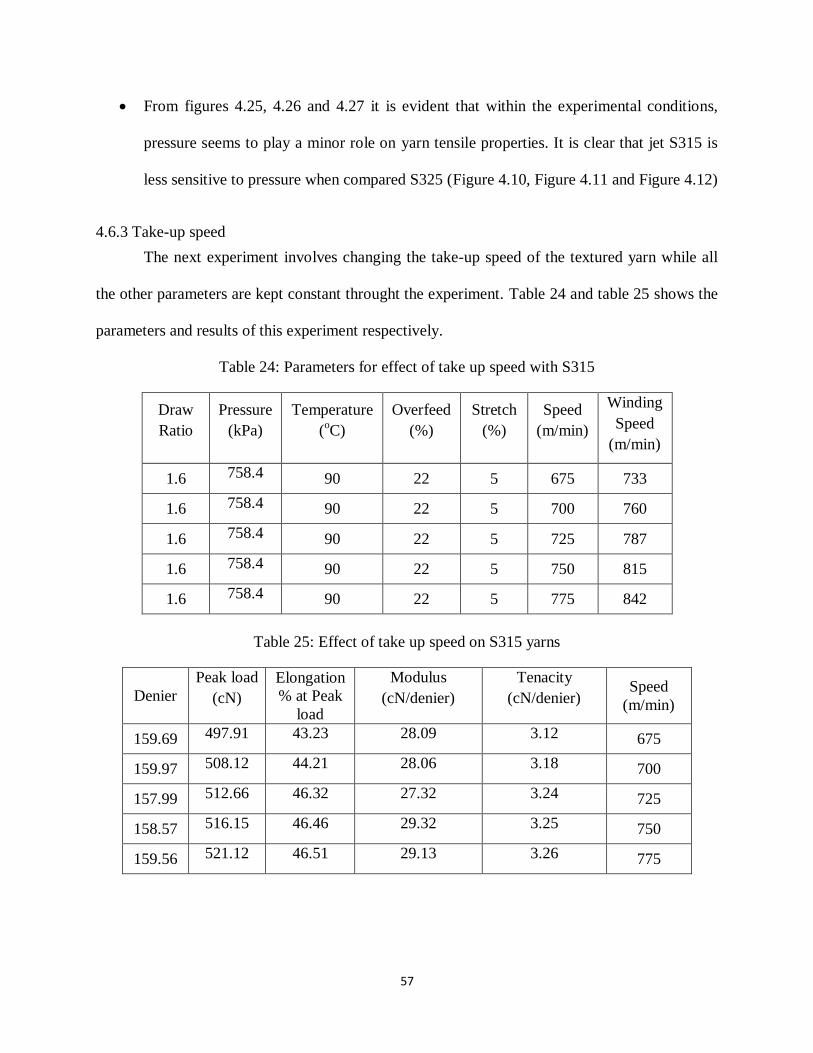
57
From figures 4.25, 4.26 and 4.27 it is evident that within the experimental conditions,
pressure seems to play a minor role on yarn tensile properties. It is clear that jet S315 is
less sensitive to pressure when compared S325 (Figure 4.10, Figure 4.11 and Figure 4.12)
4.6.3 Take-up speed
The next experiment involves changing the take-up speed of the textured yarn while all
the other parameters are kept constant throught the experiment. Table 24 and table 25 shows the
parameters and results of this experiment respectively.
Table 24: Parameters for effect of take up speed with S315
Draw
Ratio
Pressure
(kPa)
Temperature
(oC)
Overfeed
(%)
Stretch
(%)
Speed
(m/min)
Winding
Speed
(m/min)
1.6 758.4 90 22 5 675 733
1.6 758.4 90 22 5 700 760
1.6 758.4 90 22 5 725 787
1.6 758.4 90 22 5 750 815
1.6 758.4 90 22 5 775 842
Table 25: Effect of take up speed on S315 yarns
Denier
Peak load
(cN)
Elongation
% at Peak
load
Modulus
(cN/denier)
Tenacity
(cN/denier) Speed
(m/min)
159.69 497.91 43.23 28.09 3.12 675
159.97 508.12 44.21 28.06 3.18 700
157.99 512.66 46.32 27.32 3.24 725
158.57 516.15 46.46 29.32 3.25 750
159.56 521.12 46.51 29.13 3.26 775
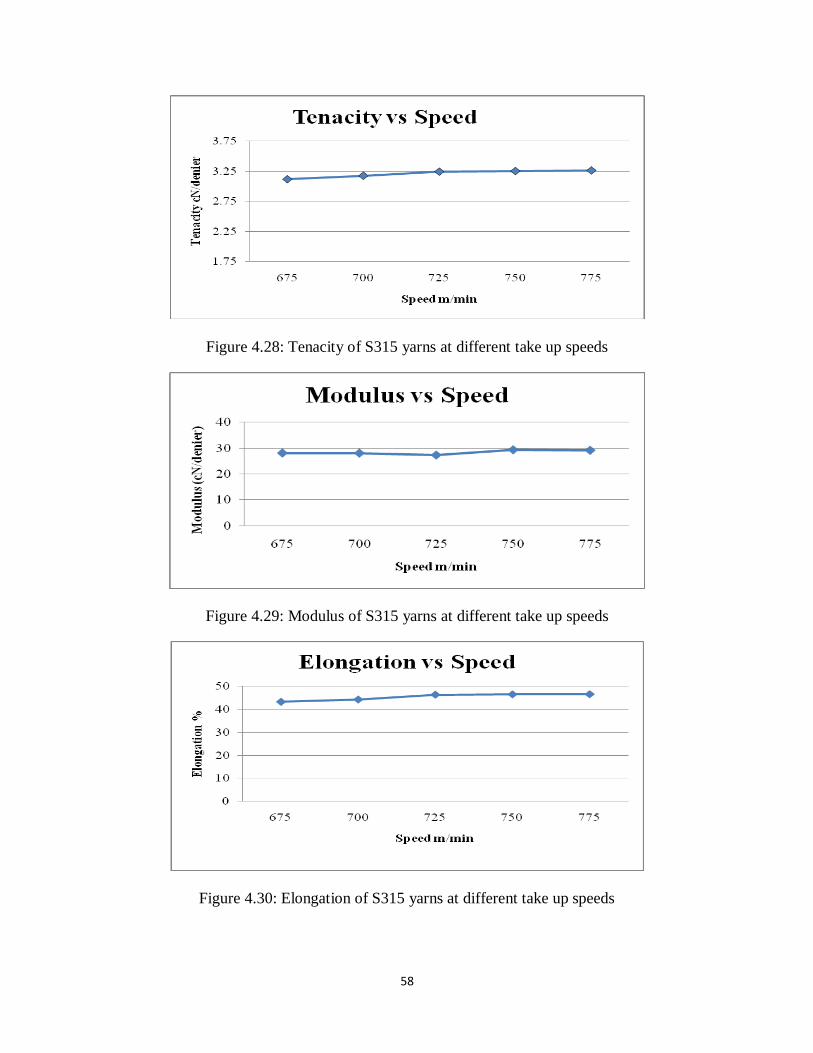
58
Figure 4.28: Tenacity of S315 yarns at different take up speeds
Figure 4.29: Modulus of S315 yarns at different take up speeds
Figure 4.30: Elongation of S315 yarns at different take up speeds
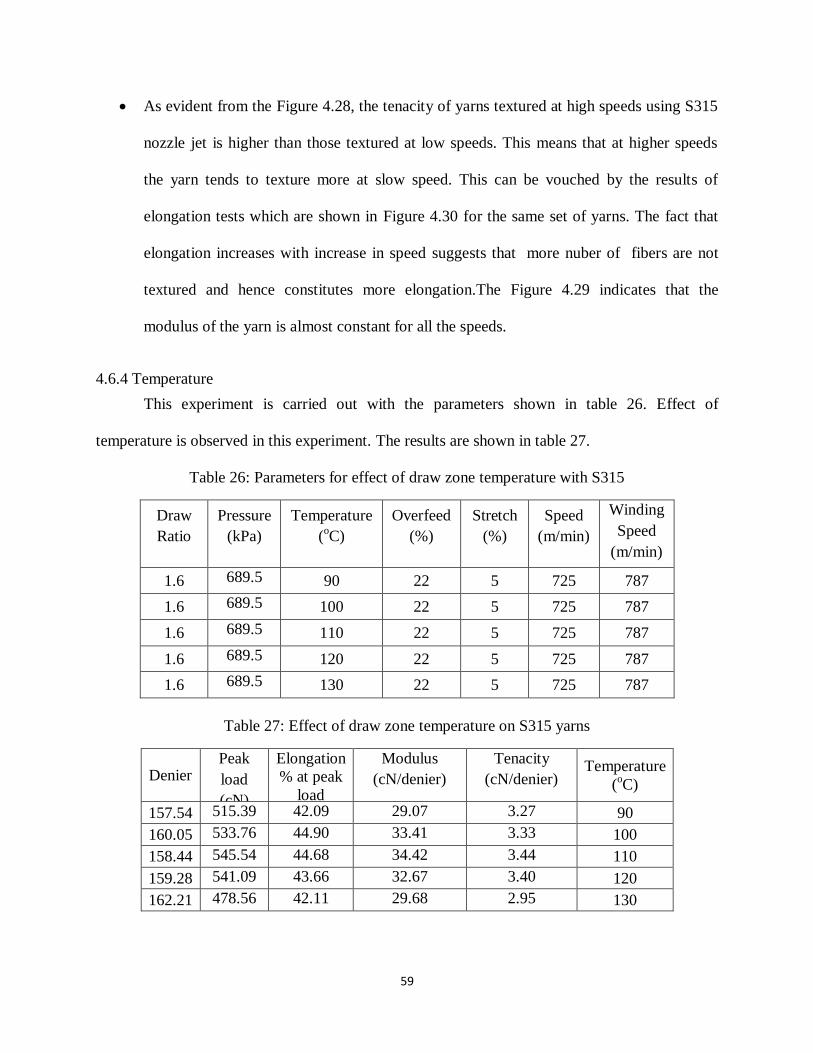
59
As evident from the Figure 4.28, the tenacity of yarns textured at high speeds using S315
nozzle jet is higher than those textured at low speeds. This means that at higher speeds
the yarn tends to texture more at slow speed. This can be vouched by the results of
elongation tests which are shown in Figure 4.30 for the same set of yarns. The fact that
elongation increases with increase in speed suggests that more nuber of fibers are not
textured and hence constitutes more elongation.The Figure 4.29 indicates that the
modulus of the yarn is almost constant for all the speeds.
4.6.4 Temperature
This experiment is carried out with the parameters shown in table 26. Effect of
temperature is observed in this experiment. The results are shown in table 27.
Table 26: Parameters for effect of draw zone temperature with S315
Draw
Ratio
Pressure
(kPa)
Temperature
(oC)
Overfeed
(%)
Stretch
(%)
Speed
(m/min)
Winding
Speed
(m/min)
1.6 689.5 90 22 5 725 787
1.6 689.5 100 22 5 725 787
1.6 689.5 110 22 5 725 787
1.6 689.5 120 22 5 725 787
1.6 689.5 130 22 5 725 787
Table 27: Effect of draw zone temperature on S315 yarns
Denier Peak
load
(cN)
Elongation
% at peak
load
Modulus
(cN/denier)
Tenacity
(cN/denier) Temperature
(oC)
157.54 515.39 42.09 29.07 3.27 90
160.05 533.76 44.90 33.41 3.33 100
158.44 545.54 44.68 34.42 3.44 110
159.28 541.09 43.66 32.67 3.40 120
162.21 478.56 42.11 29.68 2.95 130
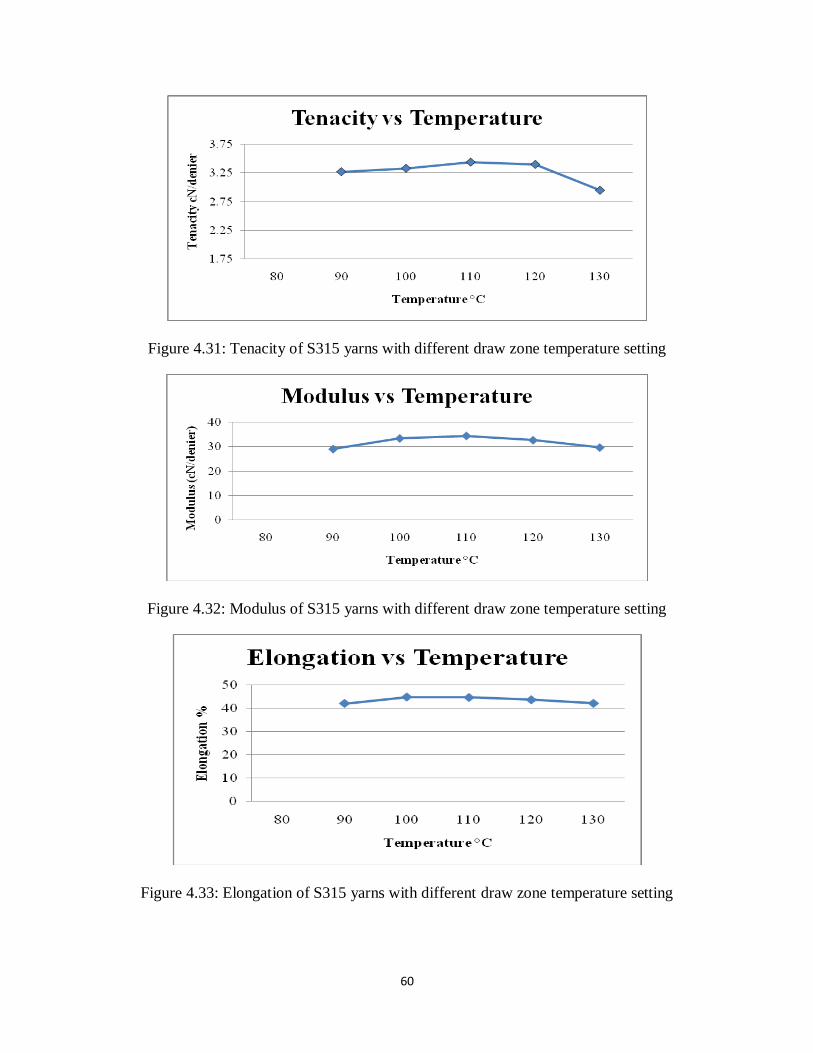
60
Figure 4.31: Tenacity of S315 yarns with different draw zone temperature setting
Figure 4.32: Modulus of S315 yarns with different draw zone temperature setting
Figure 4.33: Elongation of S315 yarns with different draw zone temperature setting
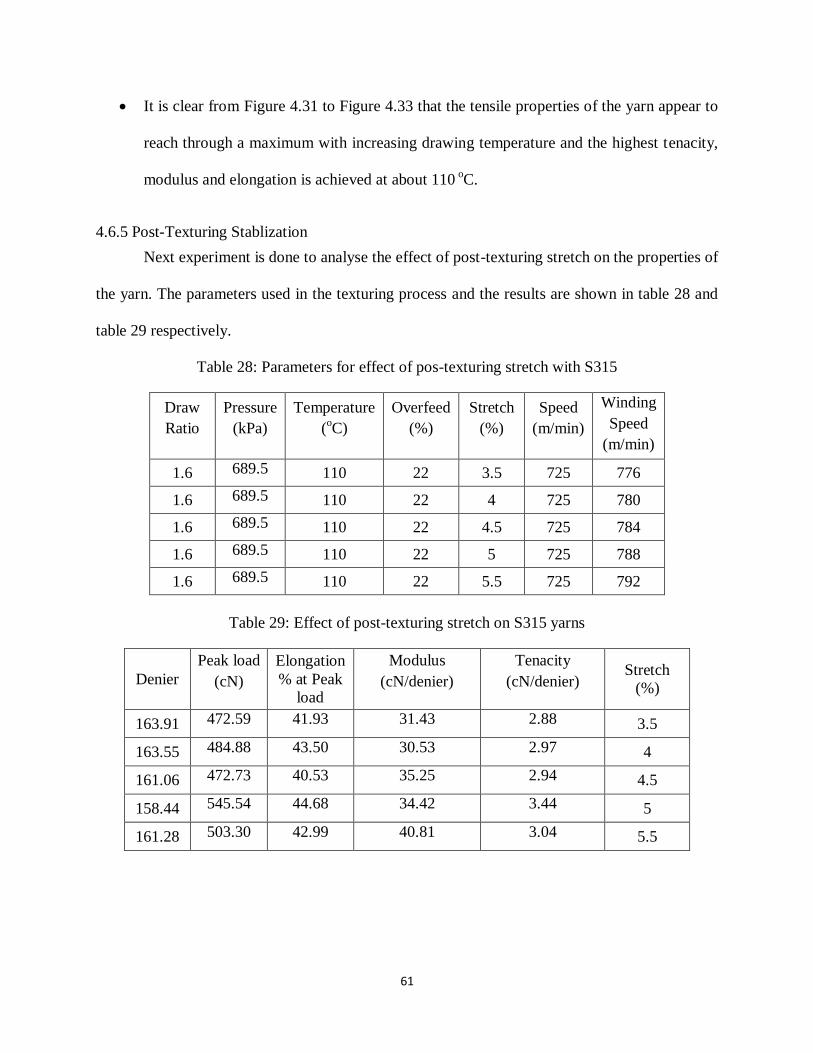
61
It is clear from Figure 4.31 to Figure 4.33 that the tensile properties of the yarn appear to
reach through a maximum with increasing drawing temperature and the highest tenacity,
modulus and elongation is achieved at about 110 oC.
4.6.5 Post-Texturing Stablization
Next experiment is done to analyse the effect of post-texturing stretch on the properties of
the yarn. The parameters used in the texturing process and the results are shown in table 28 and
table 29 respectively.
Table 28: Parameters for effect of pos-texturing stretch with S315
Draw
Ratio
Pressure
(kPa)
Temperature
(oC)
Overfeed
(%)
Stretch
(%)
Speed
(m/min)
Winding
Speed
(m/min)
1.6 689.5 110 22 3.5 725 776
1.6 689.5 110 22 4 725 780
1.6 689.5 110 22 4.5 725 784
1.6 689.5 110 22 5 725 788
1.6 689.5 110 22 5.5 725 792
Table 29: Effect of post-texturing stretch on S315 yarns
Denier
Peak load
(cN)
Elongation
% at Peak
load
Modulus
(cN/denier)
Tenacity
(cN/denier) Stretch
(%)
163.91 472.59 41.93 31.43 2.88 3.5
163.55 484.88 43.50 30.53 2.97 4
161.06 472.73 40.53 35.25 2.94 4.5
158.44 545.54 44.68 34.42 3.44 5
161.28 503.30 42.99 40.81 3.04 5.5
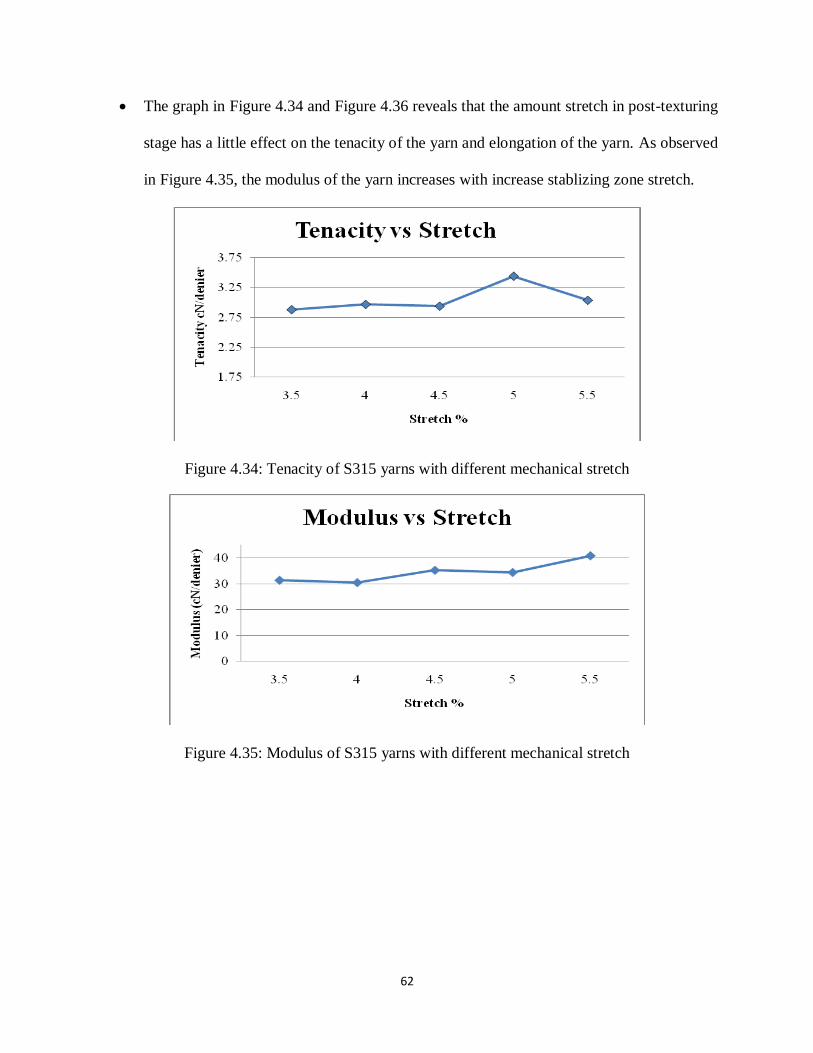
62
The graph in Figure 4.34 and Figure 4.36 reveals that the amount stretch in post-texturing
stage has a little effect on the tenacity of the yarn and elongation of the yarn. As observed
in Figure 4.35, the modulus of the yarn increases with increase stablizing zone stretch.
Figure 4.34: Tenacity of S315 yarns with different mechanical stretch
Figure 4.35: Modulus of S315 yarns with different mechanical stretch
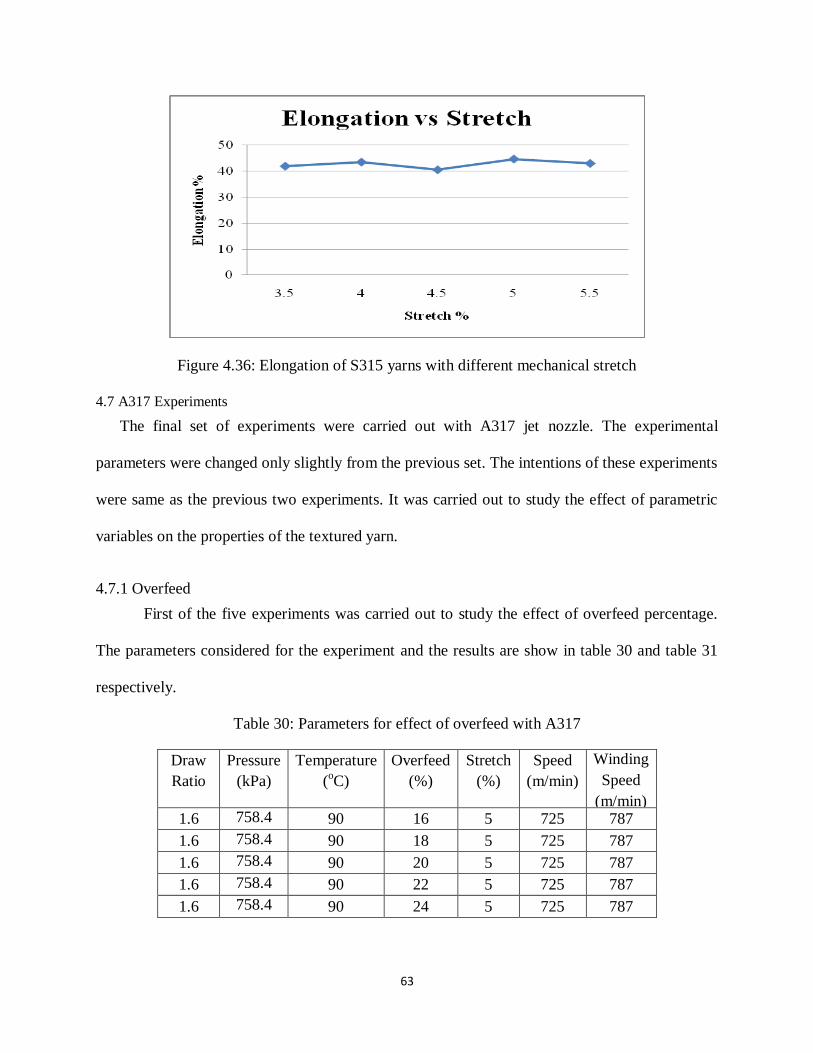
63
Figure 4.36: Elongation of S315 yarns with different mechanical stretch
4.7 A317 Experiments
The final set of experiments were carried out with A317 jet nozzle. The experimental
parameters were changed only slightly from the previous set. The intentions of these experiments
were same as the previous two experiments. It was carried out to study the effect of parametric
variables on the properties of the textured yarn.
4.7.1 Overfeed
First of the five experiments was carried out to study the effect of overfeed percentage.
The parameters considered for the experiment and the results are show in table 30 and table 31
respectively.
Table 30: Parameters for effect of overfeed with A317
Draw
Ratio
Pressure
(kPa)
Temperature
(oC)
Overfeed
(%)
Stretch
(%)
Speed
(m/min)
Winding
Speed
(m/min) 1.6 758.4 90 16 5 725 787
1.6 758.4 90 18 5 725 787
1.6 758.4 90 20 5 725 787
1.6 758.4 90 22 5 725 787
1.6 758.4 90 24 5 725 787
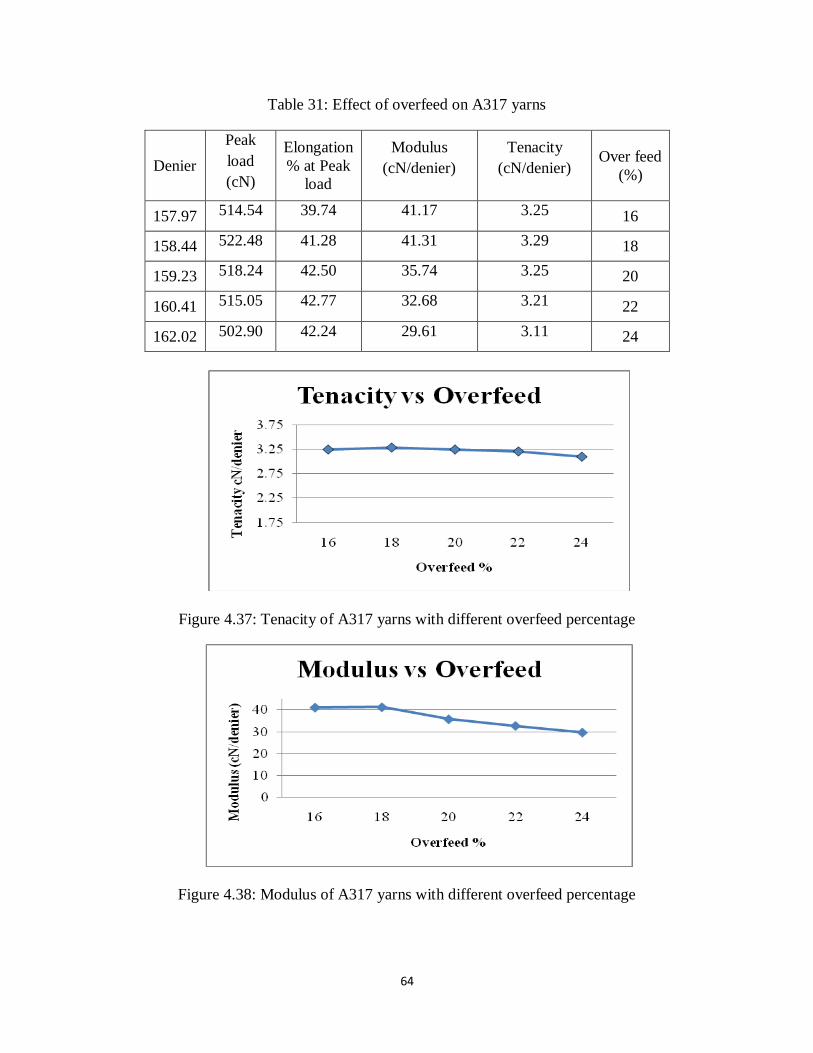
64
Table 31: Effect of overfeed on A317 yarns
Denier
Peak
load
(cN)
Elongation
% at Peak
load
Modulus
(cN/denier)
Tenacity
(cN/denier) Over feed
(%)
157.97 514.54 39.74 41.17 3.25 16
158.44 522.48 41.28 41.31 3.29 18
159.23 518.24 42.50 35.74 3.25 20
160.41 515.05 42.77 32.68 3.21 22
162.02 502.90 42.24 29.61 3.11 24
Figure 4.37: Tenacity of A317 yarns with different overfeed percentage
Figure 4.38: Modulus of A317 yarns with different overfeed percentage
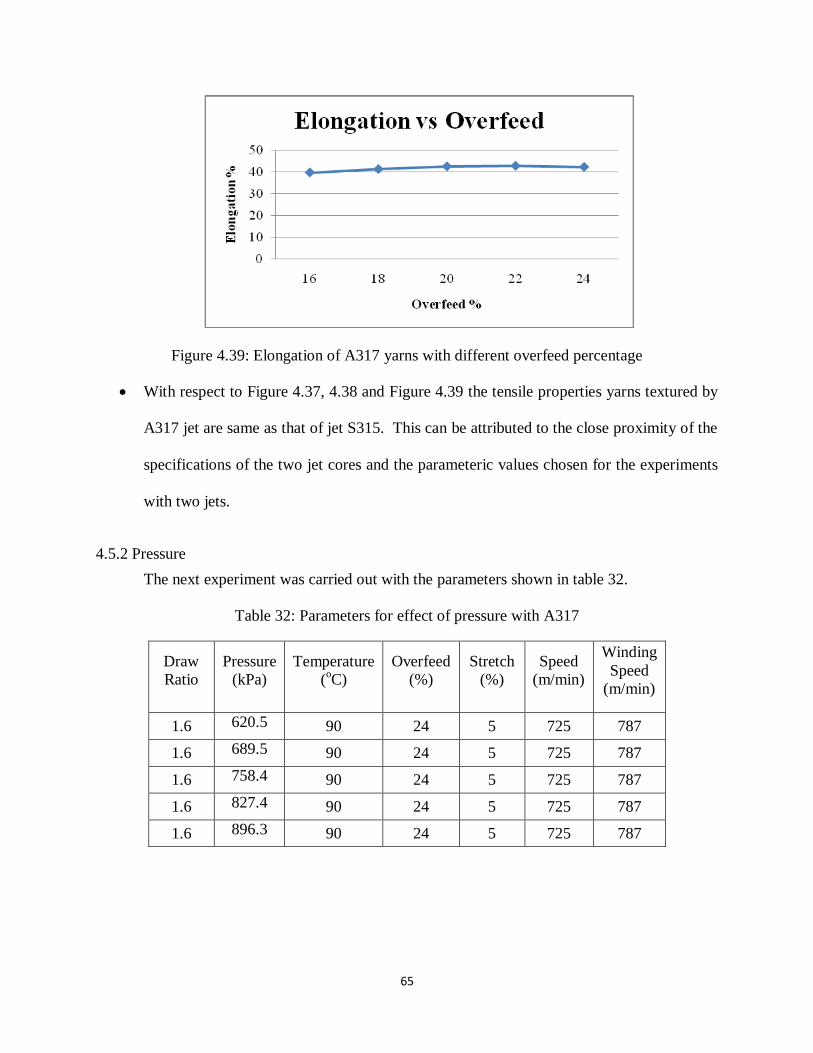
65
Figure 4.39: Elongation of A317 yarns with different overfeed percentage
With respect to Figure 4.37, 4.38 and Figure 4.39 the tensile properties yarns textured by
A317 jet are same as that of jet S315. This can be attributed to the close proximity of the
specifications of the two jet cores and the parameteric values chosen for the experiments
with two jets.
4.5.2 Pressure
The next experiment was carried out with the parameters shown in table 32.
Table 32: Parameters for effect of pressure with A317
Draw
Ratio
Pressure
(kPa)
Temperature
(oC)
Overfeed
(%)
Stretch
(%)
Speed
(m/min)
Winding
Speed
(m/min)
1.6 620.5 90 24 5 725 787
1.6 689.5 90 24 5 725 787
1.6 758.4 90 24 5 725 787
1.6 827.4 90 24 5 725 787
1.6 896.3 90 24 5 725 787
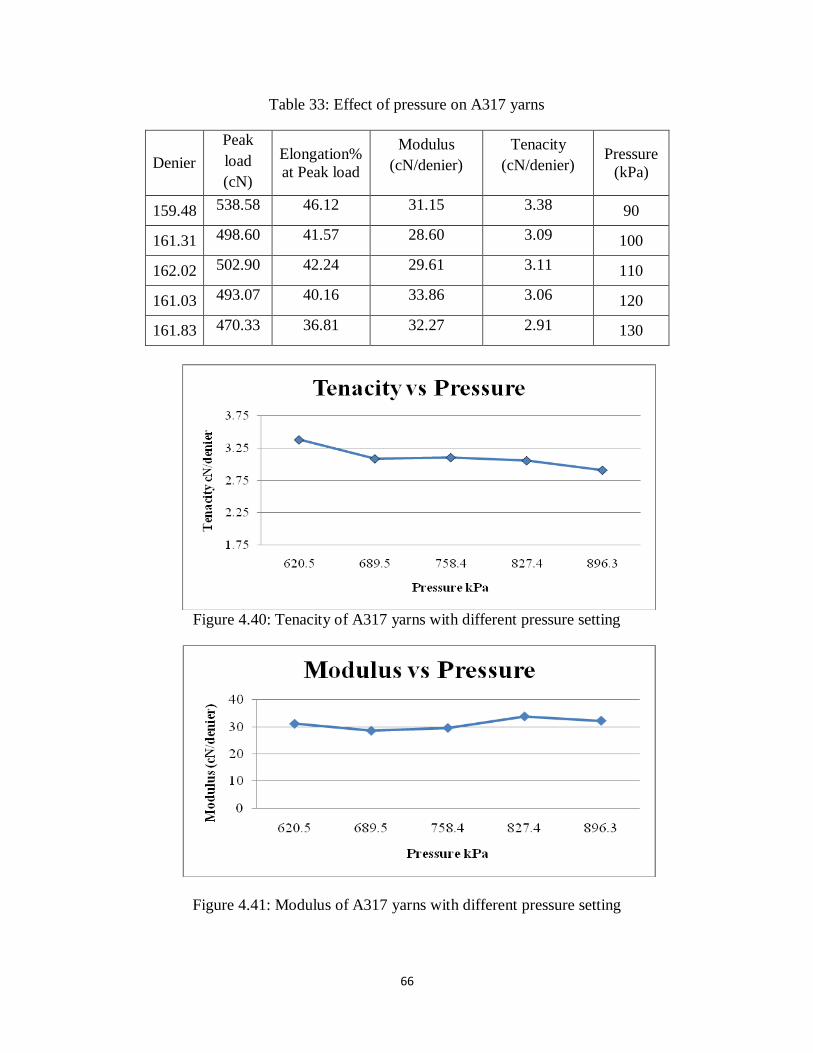
66
Table 33: Effect of pressure on A317 yarns
Denier
Peak
load
(cN)
Elongation%
at Peak load
Modulus
(cN/denier)
Tenacity
(cN/denier) Pressure
(kPa)
159.48 538.58 46.12 31.15 3.38 90
161.31 498.60 41.57 28.60 3.09 100
162.02 502.90 42.24 29.61 3.11 110
161.03 493.07 40.16 33.86 3.06 120
161.83 470.33 36.81 32.27 2.91 130
Figure 4.40: Tenacity of A317 yarns with different pressure setting
Figure 4.41: Modulus of A317 yarns with different pressure setting
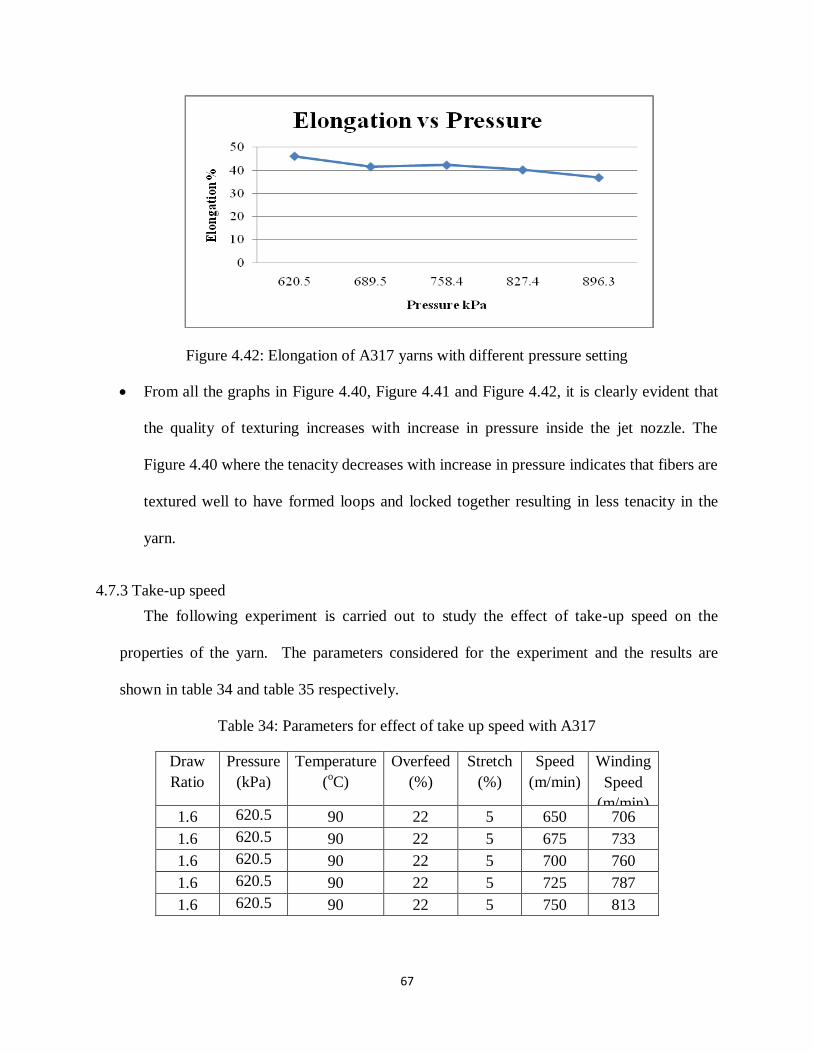
67
Figure 4.42: Elongation of A317 yarns with different pressure setting
From all the graphs in Figure 4.40, Figure 4.41 and Figure 4.42, it is clearly evident that
the quality of texturing increases with increase in pressure inside the jet nozzle. The
Figure 4.40 where the tenacity decreases with increase in pressure indicates that fibers are
textured well to have formed loops and locked together resulting in less tenacity in the
yarn.
4.7.3 Take-up speed
The following experiment is carried out to study the effect of take-up speed on the
properties of the yarn. The parameters considered for the experiment and the results are
shown in table 34 and table 35 respectively.
Table 34: Parameters for effect of take up speed with A317
Draw
Ratio
Pressure
(kPa)
Temperature
(oC)
Overfeed
(%)
Stretch
(%)
Speed
(m/min)
Winding
Speed
(m/min) 1.6 620.5 90 22 5 650 706
1.6 620.5 90 22 5 675 733
1.6 620.5 90 22 5 700 760
1.6 620.5 90 22 5 725 787
1.6 620.5 90 22 5 750 813
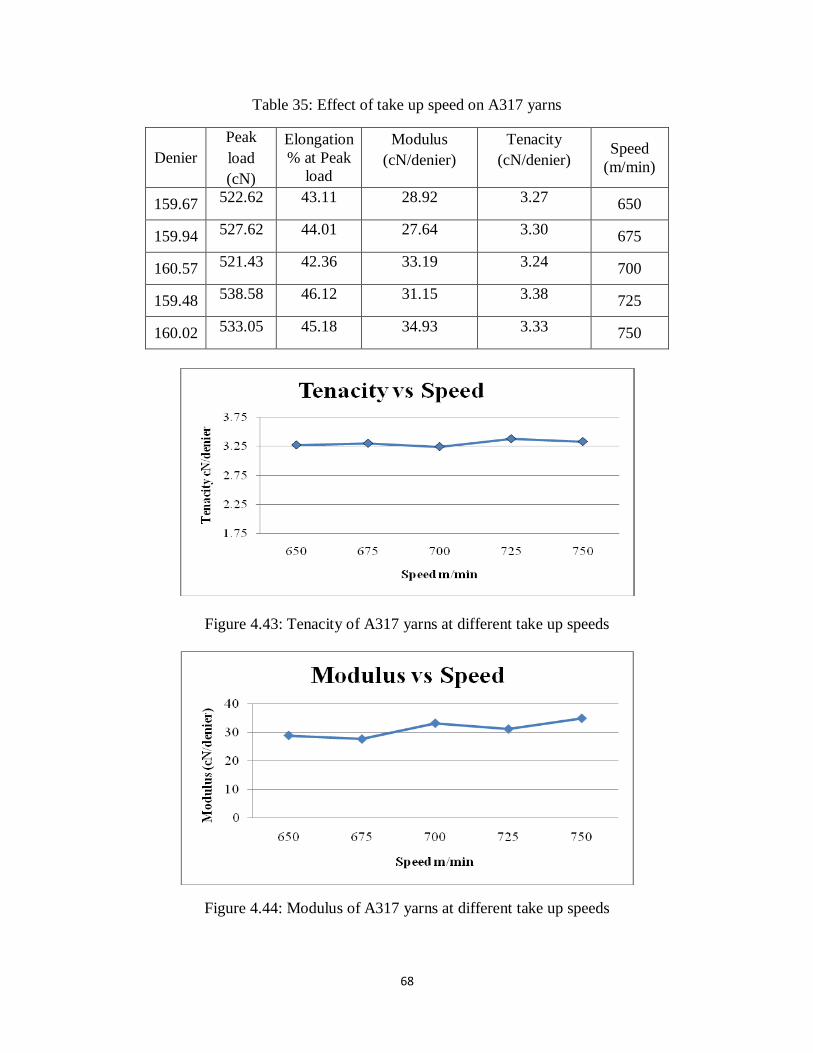
68
Table 35: Effect of take up speed on A317 yarns
Denier
Peak
load
(cN)
Elongation
% at Peak
load
Modulus
(cN/denier)
Tenacity
(cN/denier) Speed
(m/min)
159.67 522.62 43.11 28.92 3.27 650
159.94 527.62 44.01 27.64 3.30 675
160.57 521.43 42.36 33.19 3.24 700
159.48 538.58 46.12 31.15 3.38 725
160.02 533.05 45.18 34.93 3.33 750
Figure 4.43: Tenacity of A317 yarns at different take up speeds
Figure 4.44: Modulus of A317 yarns at different take up speeds
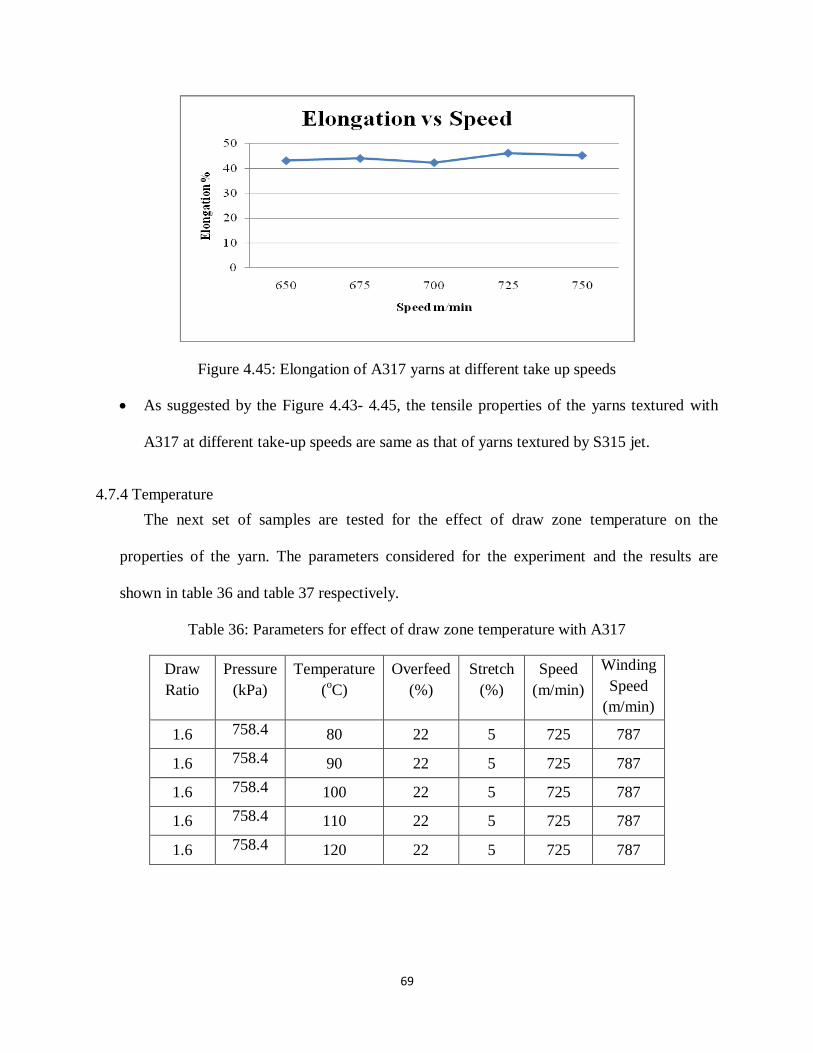
69
Figure 4.45: Elongation of A317 yarns at different take up speeds
As suggested by the Figure 4.43- 4.45, the tensile properties of the yarns textured with
A317 at different take-up speeds are same as that of yarns textured by S315 jet.
4.7.4 Temperature
The next set of samples are tested for the effect of draw zone temperature on the
properties of the yarn. The parameters considered for the experiment and the results are
shown in table 36 and table 37 respectively.
Table 36: Parameters for effect of draw zone temperature with A317
Draw
Ratio
Pressure
(kPa)
Temperature
(oC)
Overfeed
(%)
Stretch
(%)
Speed
(m/min)
Winding
Speed
(m/min)
1.6 758.4 80 22 5 725 787
1.6 758.4 90 22 5 725 787
1.6 758.4 100 22 5 725 787
1.6 758.4 110 22 5 725 787
1.6 758.4 120 22 5 725 787
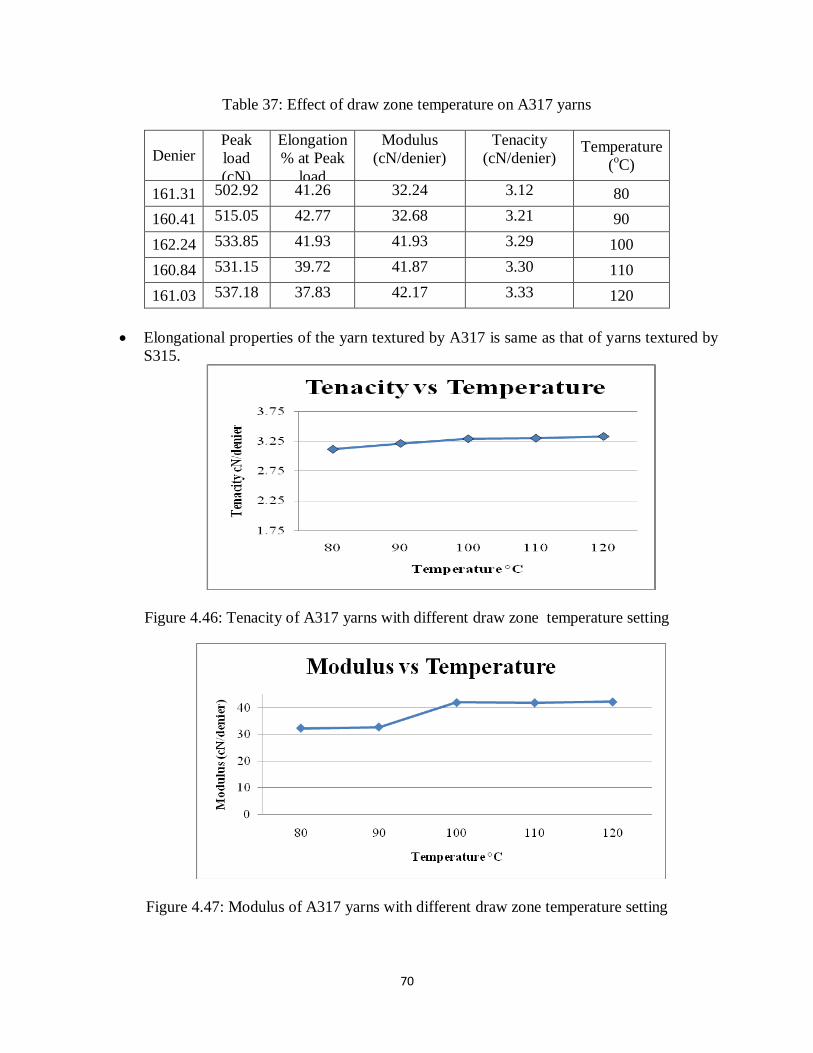
70
Table 37: Effect of draw zone temperature on A317 yarns
Denier Peak
load
(cN)
Elongation
% at Peak
load
Modulus
(cN/denier)
Tenacity
(cN/denier) Temperature
(oC)
161.31 502.92 41.26 32.24 3.12 80
160.41 515.05 42.77 32.68 3.21 90
162.24 533.85 41.93 41.93 3.29 100
160.84 531.15 39.72 41.87 3.30 110
161.03 537.18 37.83 42.17 3.33 120
Elongational properties of the yarn textured by A317 is same as that of yarns textured by
S315.
Figure 4.46: Tenacity of A317 yarns with different draw zone temperature setting
Figure 4.47: Modulus of A317 yarns with different draw zone temperature setting
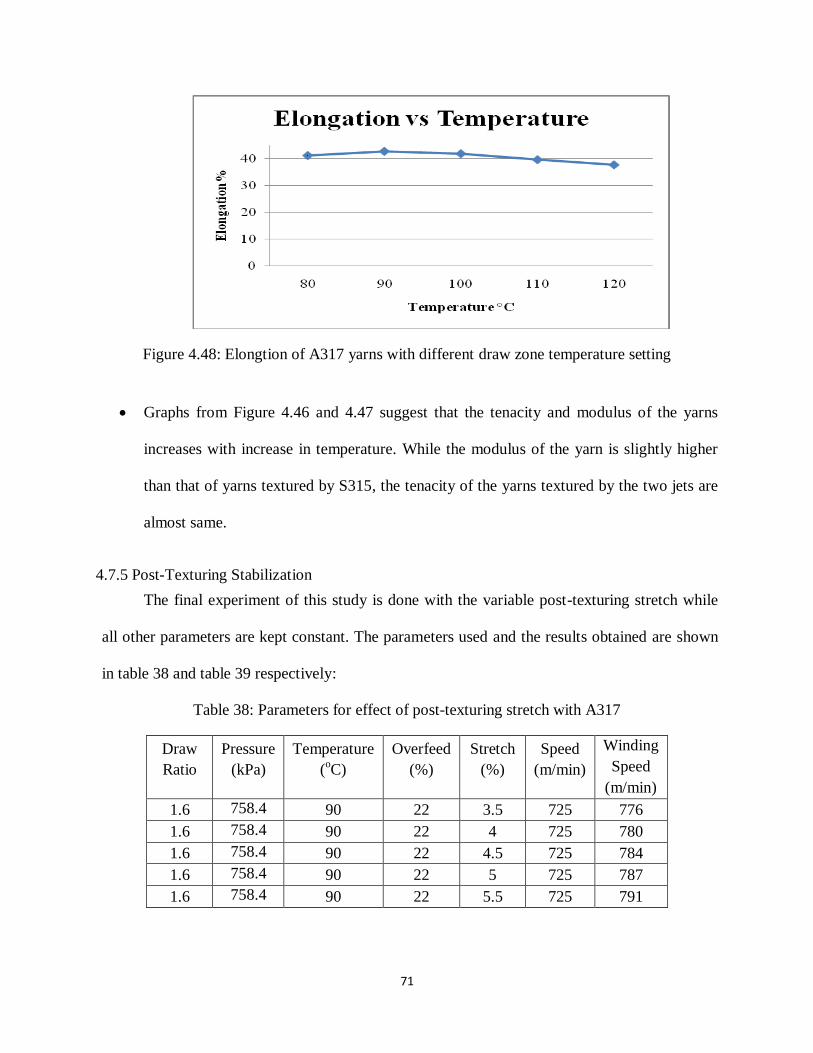
71
Figure 4.48: Elongtion of A317 yarns with different draw zone temperature setting
Graphs from Figure 4.46 and 4.47 suggest that the tenacity and modulus of the yarns
increases with increase in temperature. While the modulus of the yarn is slightly higher
than that of yarns textured by S315, the tenacity of the yarns textured by the two jets are
almost same.
4.7.5 Post-Texturing Stabilization
The final experiment of this study is done with the variable post-texturing stretch while
all other parameters are kept constant. The parameters used and the results obtained are shown
in table 38 and table 39 respectively:
Table 38: Parameters for effect of post-texturing stretch with A317
Draw
Ratio
Pressure
(kPa)
Temperature
(oC)
Overfeed
(%)
Stretch
(%)
Speed
(m/min)
Winding
Speed
(m/min)
1.6 758.4 90 22 3.5 725 776
1.6 758.4 90 22 4 725 780
1.6 758.4 90 22 4.5 725 784
1.6 758.4 90 22 5 725 787
1.6 758.4 90 22 5.5 725 791
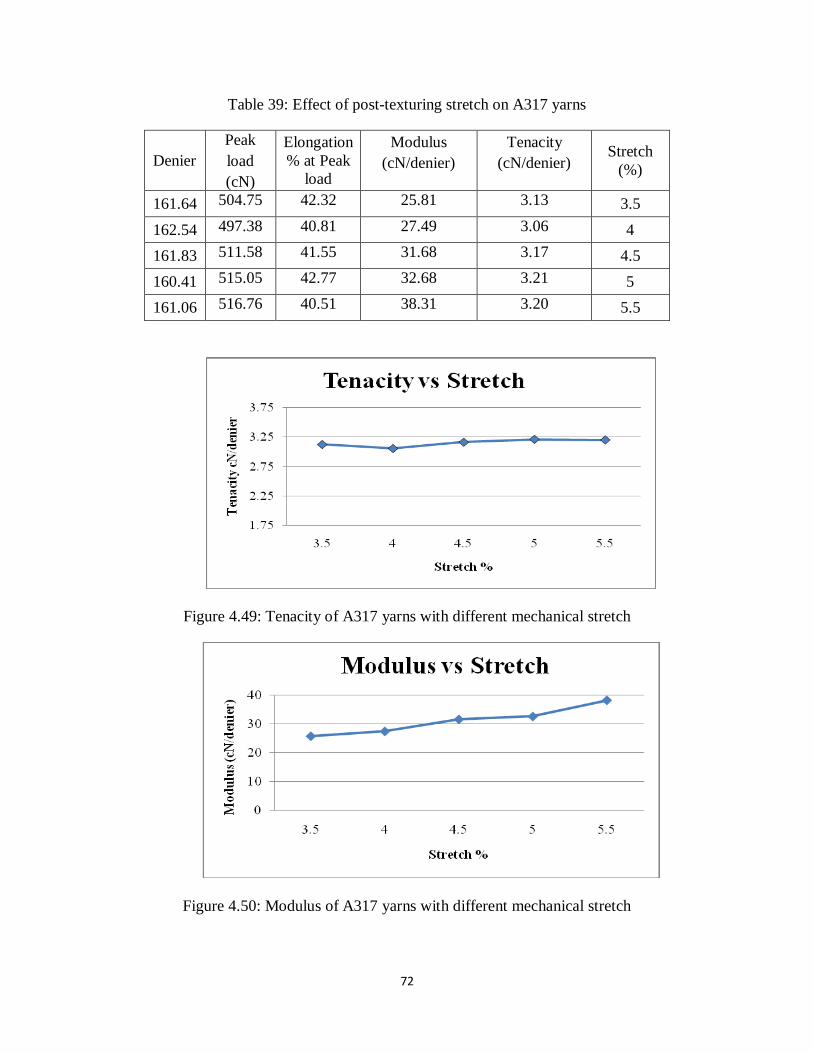
72
Table 39: Effect of post-texturing stretch on A317 yarns
Denier
Peak
load
(cN)
Elongation
% at Peak
load
Modulus
(cN/denier)
Tenacity
(cN/denier) Stretch
(%)
161.64 504.75 42.32 25.81 3.13 3.5
162.54 497.38 40.81 27.49 3.06 4
161.83 511.58 41.55 31.68 3.17 4.5
160.41 515.05 42.77 32.68 3.21 5
161.06 516.76 40.51 38.31 3.20 5.5
Figure 4.49: Tenacity of A317 yarns with different mechanical stretch
Figure 4.50: Modulus of A317 yarns with different mechanical stretch
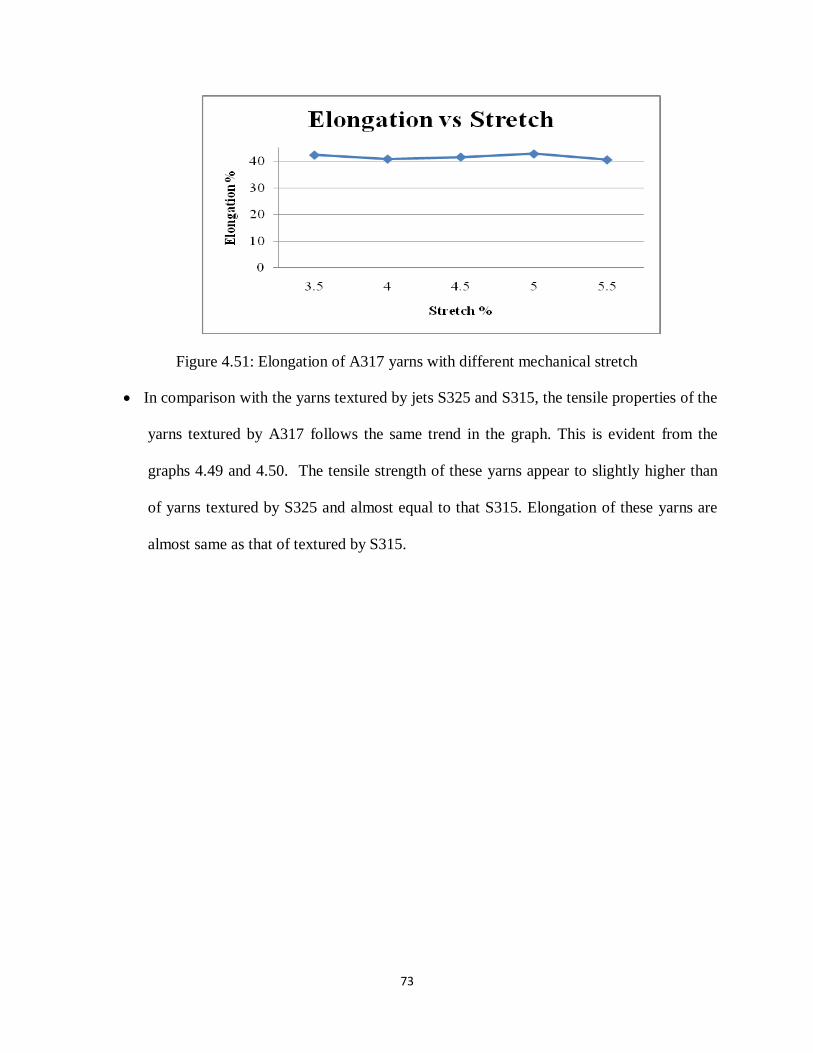
73
Figure 4.51: Elongation of A317 yarns with different mechanical stretch
In comparison with the yarns textured by jets S325 and S315, the tensile properties of the
yarns textured by A317 follows the same trend in the graph. This is evident from the
graphs 4.49 and 4.50. The tensile strength of these yarns appear to slightly higher than
of yarns textured by S325 and almost equal to that S315. Elongation of these yarns are
almost same as that of textured by S315.
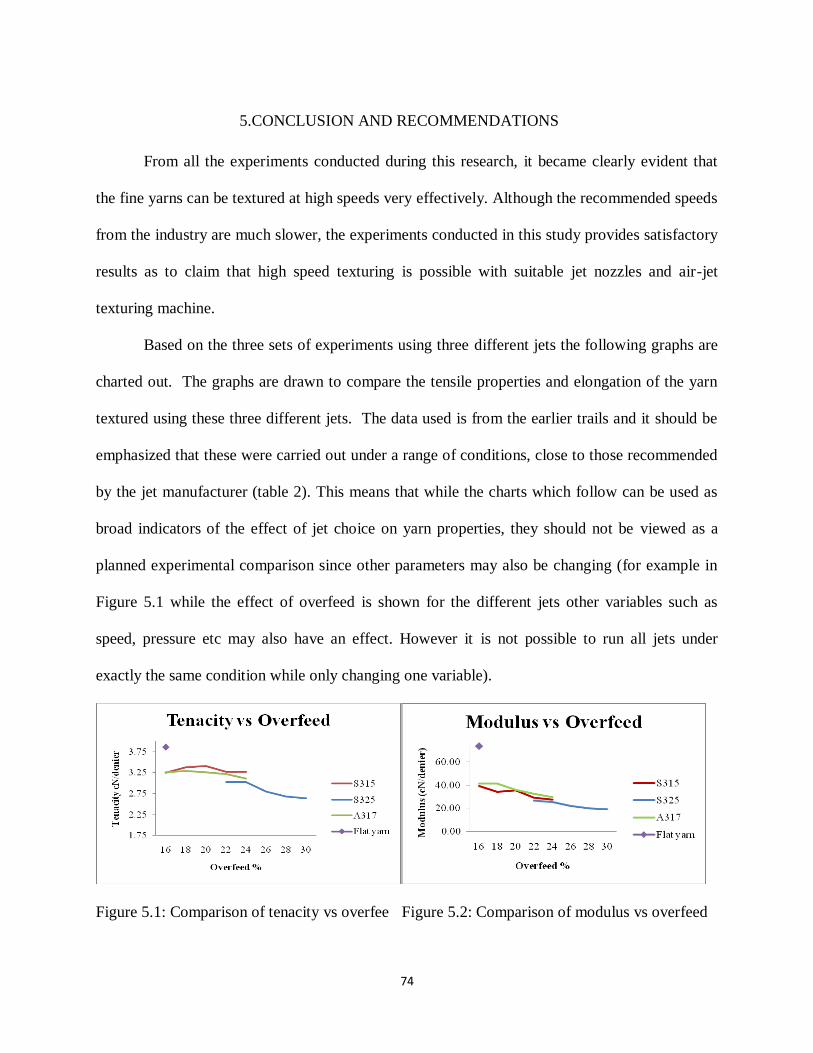
74
5.CONCLUSION AND RECOMMENDATIONS
From all the experiments conducted during this research, it became clearly evident that
the fine yarns can be textured at high speeds very effectively. Although the recommended speeds
from the industry are much slower, the experiments conducted in this study provides satisfactory
results as to claim that high speed texturing is possible with suitable jet nozzles and air-jet
texturing machine.
Based on the three sets of experiments using three different jets the following graphs are
charted out. The graphs are drawn to compare the tensile properties and elongation of the yarn
textured using these three different jets. The data used is from the earlier trails and it should be
emphasized that these were carried out under a range of conditions, close to those recommended
by the jet manufacturer (table 2). This means that while the charts which follow can be used as
broad indicators of the effect of jet choice on yarn properties, they should not be viewed as a
planned experimental comparison since other parameters may also be changing (for example in
Figure 5.1 while the effect of overfeed is shown for the different jets other variables such as
speed, pressure etc may also have an effect. However it is not possible to run all jets under
exactly the same condition while only changing one variable).
Figure 5.1: Comparison of tenacity vs overfee Figure 5.2: Comparison of modulus vs overfeed
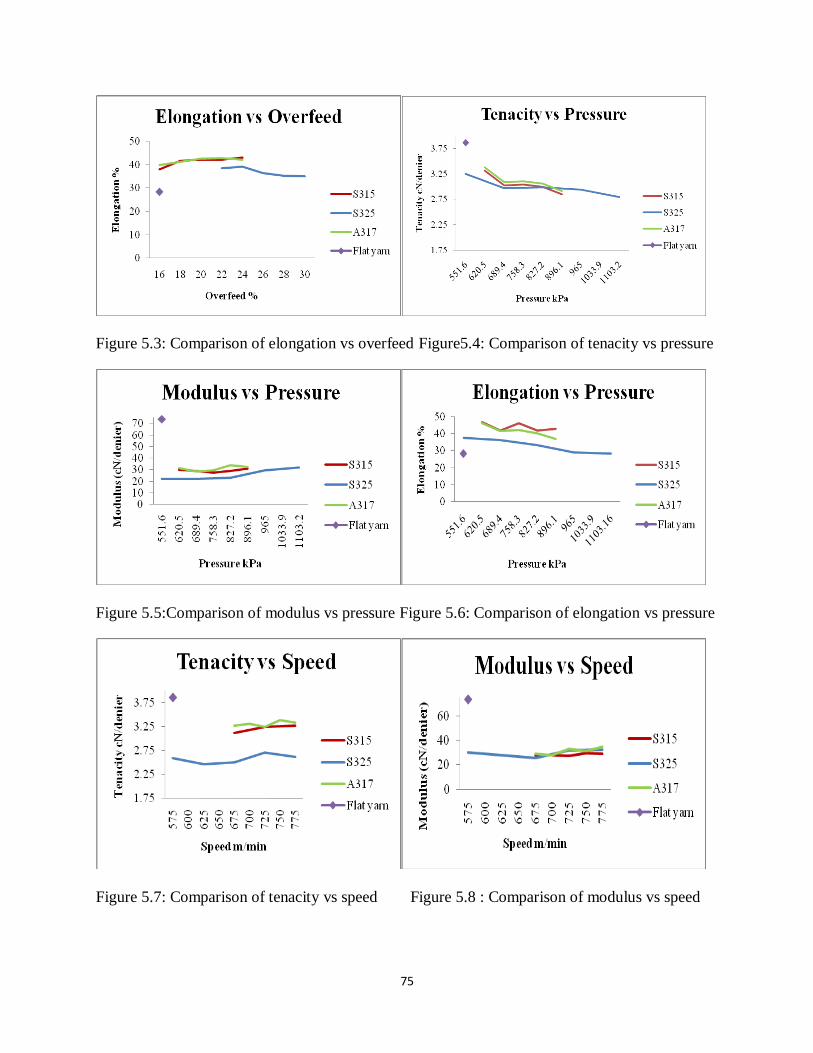
75
Figure 5.3: Comparison of elongation vs overfeed Figure5.4: Comparison of tenacity vs pressure
Figure 5.5:Comparison of modulus vs pressure Figure 5.6: Comparison of elongation vs pressure
Figure 5.7: Comparison of tenacity vs speed Figure 5.8 : Comparison of modulus vs speed
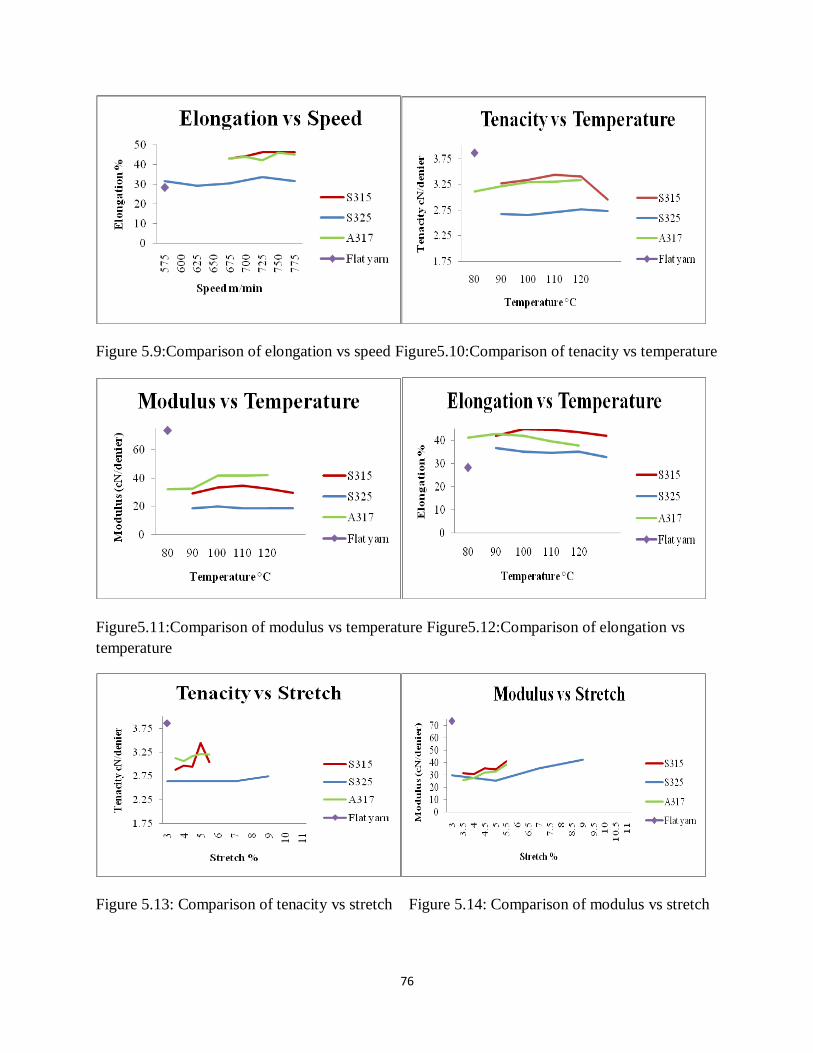
76
Figure 5.9:Comparison of elongation vs speed Figure5.10:Comparison of tenacity vs temperature
Figure5.11:Comparison of modulus vs temperature Figure5.12:Comparison of elongation vs
temperature
Figure 5.13: Comparison of tenacity vs stretch Figure 5.14: Comparison of modulus vs stretch
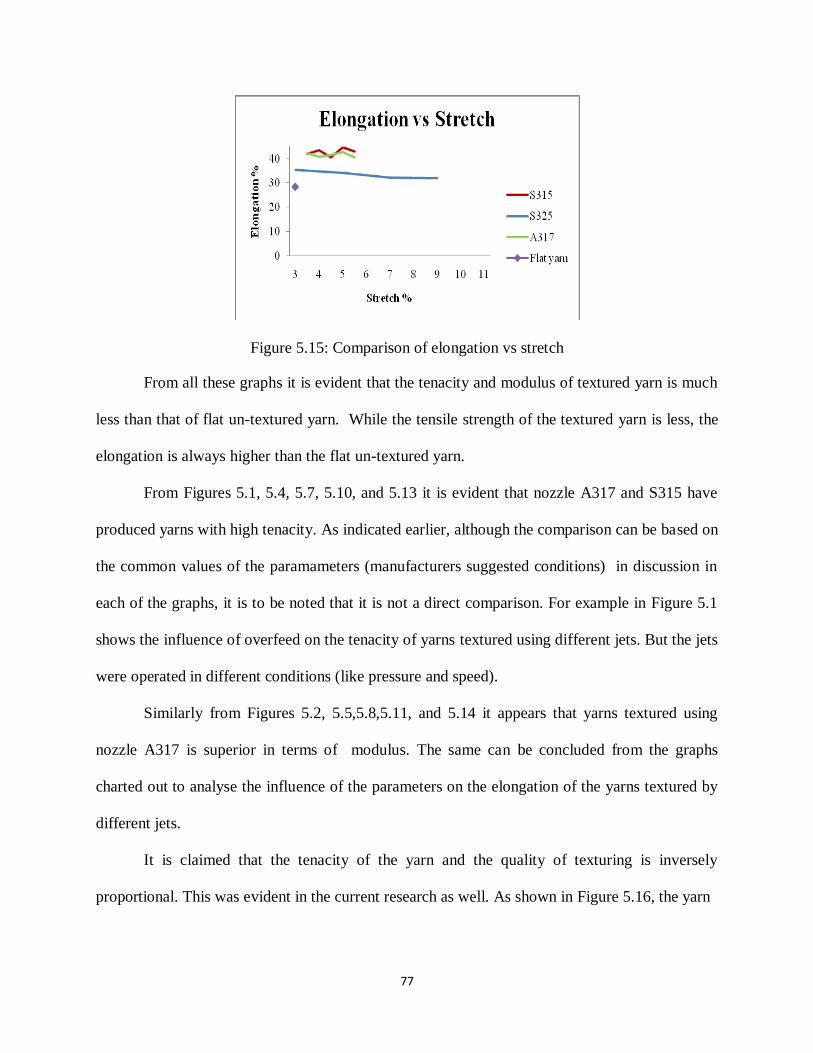
77
Figure 5.15: Comparison of elongation vs stretch
From all these graphs it is evident that the tenacity and modulus of textured yarn is much
less than that of flat un-textured yarn. While the tensile strength of the textured yarn is less, the
elongation is always higher than the flat un-textured yarn.
From Figures 5.1, 5.4, 5.7, 5.10, and 5.13 it is evident that nozzle A317 and S315 have
produced yarns with high tenacity. As indicated earlier, although the comparison can be based on
the common values of the paramameters (manufacturers suggested conditions) in discussion in
each of the graphs, it is to be noted that it is not a direct comparison. For example in Figure 5.1
shows the influence of overfeed on the tenacity of yarns textured using different jets. But the jets
were operated in different conditions (like pressure and speed).
Similarly from Figures 5.2, 5.5,5.8,5.11, and 5.14 it appears that yarns textured using
nozzle A317 is superior in terms of modulus. The same can be concluded from the graphs
charted out to analyse the influence of the parameters on the elongation of the yarns textured by
different jets.
It is claimed that the tenacity of the yarn and the quality of texturing is inversely
proportional. This was evident in the current research as well. As shown in Figure 5.16, the yarn
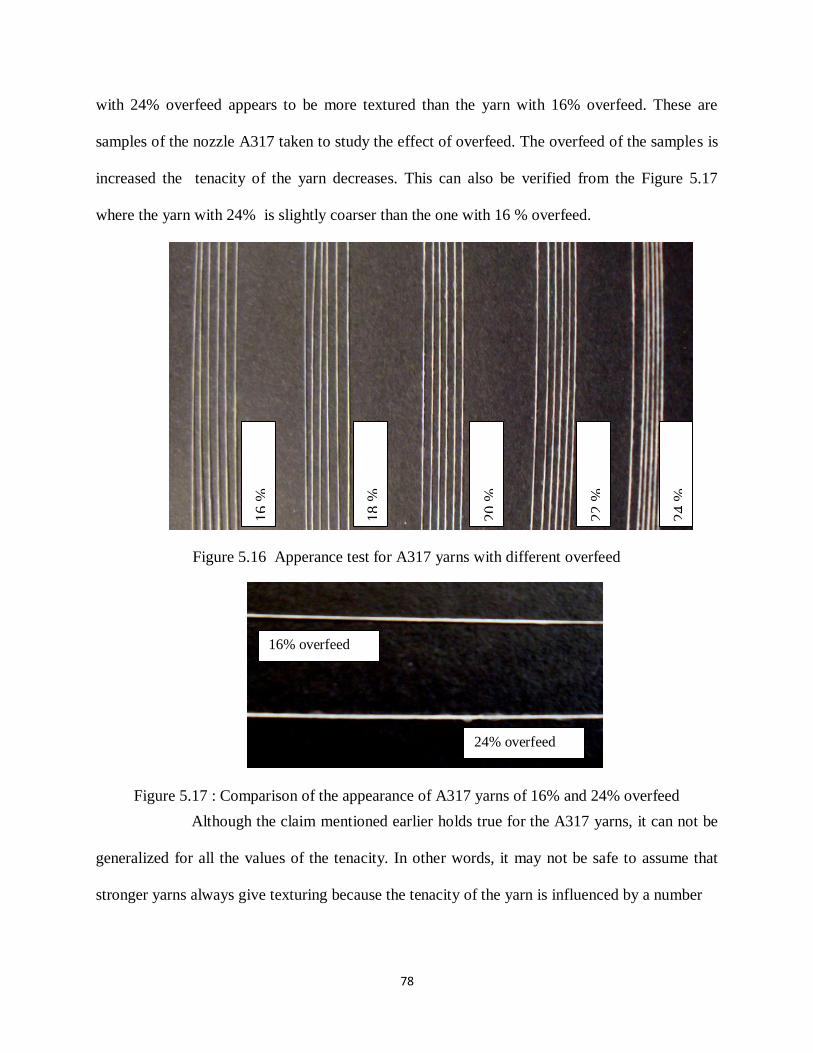
78
with 24% overfeed appears to be more textured than the yarn with 16% overfeed. These are
samples of the nozzle A317 taken to study the effect of overfeed. The overfeed of the samples is
increased the tenacity of the yarn decreases. This can also be verified from the Figure 5.17
where the yarn with 24% is slightly coarser than the one with 16 % overfeed.
Figure 5.16 Apperance test for A317 yarns with different overfeed
Figure 5.17 : Comparison of the appearance of A317 yarns of 16% and 24% overfeed
Although the claim mentioned earlier holds true for the A317 yarns, it can not be
generalized for all the values of the tenacity. In other words, it may not be safe to assume that
stronger yarns always give texturing because the tenacity of the yarn is influenced by a number
16 %
Over
feed
18 %
Over
feed
20 %
Over
feed
22 %
Over
feed
24 %
Over
feed
16% overfeed
24% overfeed
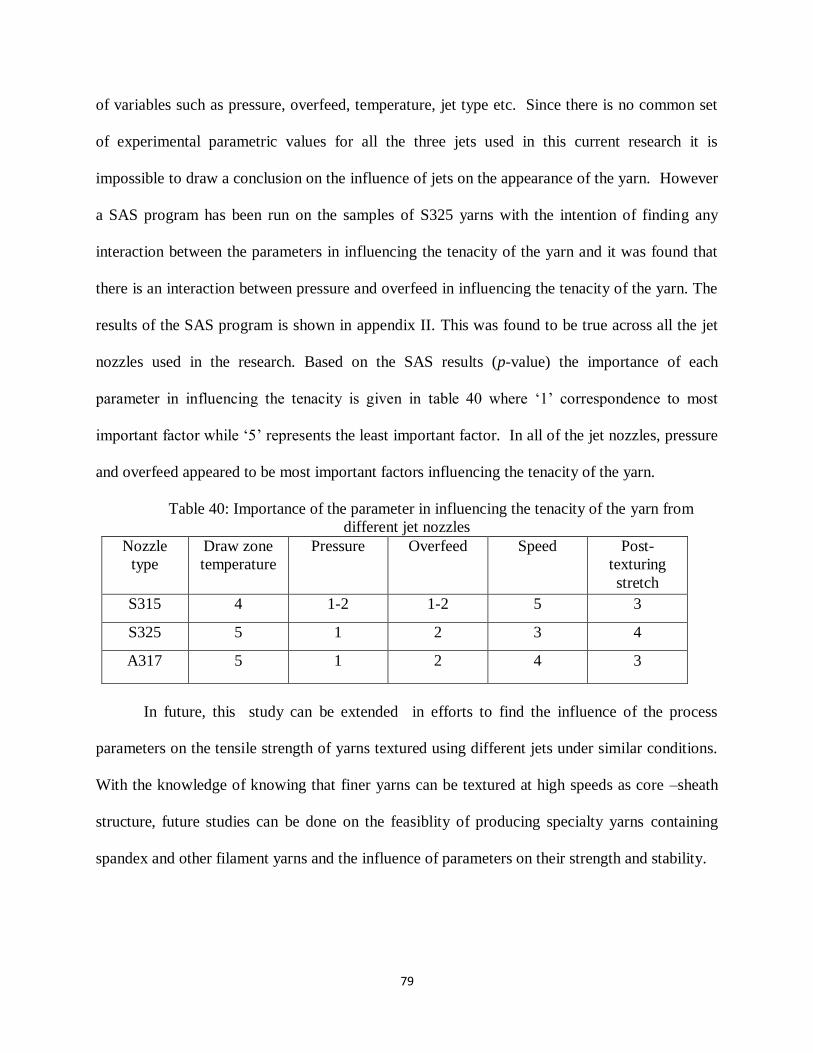
79
of variables such as pressure, overfeed, temperature, jet type etc. Since there is no common set
of experimental parametric values for all the three jets used in this current research it is
impossible to draw a conclusion on the influence of jets on the appearance of the yarn. However
a SAS program has been run on the samples of S325 yarns with the intention of finding any
interaction between the parameters in influencing the tenacity of the yarn and it was found that
there is an interaction between pressure and overfeed in influencing the tenacity of the yarn. The
results of the SAS program is shown in appendix II. This was found to be true across all the jet
nozzles used in the research. Based on the SAS results (p-value) the importance of each
parameter in influencing the tenacity is given in table 40 where ‗1‘ correspondence to most
important factor while ‗5‘ represents the least important factor. In all of the jet nozzles, pressure
and overfeed appeared to be most important factors influencing the tenacity of the yarn.
Table 40: Importance of the parameter in influencing the tenacity of the yarn from
different jet nozzles
Nozzle
type
Draw zone
temperature
Pressure Overfeed Speed Post-
texturing
stretch
S315 4 1-2 1-2 5 3
S325 5 1 2 3 4
A317 5 1 2 4 3
In future, this study can be extended in efforts to find the influence of the process
parameters on the tensile strength of yarns textured using different jets under similar conditions.
With the knowledge of knowing that finer yarns can be textured at high speeds as core –sheath
structure, future studies can be done on the feasiblity of producing specialty yarns containing
spandex and other filament yarns and the influence of parameters on their strength and stability.
80
REFERENCES
1. Demir, Ali, and Hasan M Behery. Synthetic Filament Yarn Texturing Technology. 1. 1.
upper saddle river: 1997. Print.
2. Lord, P. (2003). Handbook of yarn production. Woodhead Publishing Limited.
3. Demir, Ali and Prof. Wray G.R, ―An overview of the Air-jet Texturing Process‖,
Loughborough University of Technology (LUT)
4. Steinman A J, Air Jet Texturing, Air Jet Texturing Conference, Clemson University,
Greenville, S.C, 1985
5. Hearle, JWS, L Hollick, and DK Wilson. Yarn Texturing Technology. 1. 1.
WashingtonDC: Woodhead Publishing Limited, 2001. Print.
6. Hoffsommer K P, Air Texturing for the 1980’s: A look backward and forward, Fiber
producer, 1980, Vol.8, (6), 22-77
7. Phillips M, Air Texturing: Where are the fabrics?, America‘s Textile, 1983, vol 12,(5),
17-20
8. Isaaca III A, Air Texturing Prepares for Lift-off Again, Textile World, 1984, (10), 48-55
9. Wray G R and Entwistle J H, The modification of a Taslan jet to operate low air
pressures, Journal of Textile Institute,1969, vol 60, (10), 411-419
10. U.S Patent, 4 097 875. Heberlein Maschinenfabrik, July 19, 1977
11. Acar, M. , Turton, R. K. and Wray, G. R.(1986), ‗An Analysis of the Air-jet Yarn
Texturing process Part V: The Effect of Wetting the yarns’,, Journal of the Textile
Institute, 77: 6, 359 -370
81
12. M.J Schik, Textile Research Journal, 1973, 43,pages 103,342, 254
13. S.Chand, The Role of Water in Air-jet Texturing (A critical review), Journal of Textile
Institute, 1986, 3, pages 438-444
14. Bock G and Lunenschloss J, An Analysis of the Mechanism of Air-jet Texturing, Textile
Machinery : Investing for the Future, The Textile Institute, Manchester, 1982
15. Acar, M. , Turton, R. K. and Wray, G. R.(1986) 'An Analysis of the Air-jet Yarn
Texturing part IV: The Mechanism of Loop Formation‘, Journal of the Textile Institute,
77: 6,371 — 376
16. Sengupta, Kothari, Srinivasan (1990). Man Made Fiber Year Book of
Chemiefasern/Textile industries: 74
17. Acar, M. , Turton, R. K. and Wray, G. R.(1986) 'An Analysis of the Air-jet Yarn
Texturing part I : A brief history of developments in the process‖ Journal of textile
institute No.1, 19-27
18. "Taslan™ Air Texturing Heberlein® Hemajet-Jet cores." Oerlikon Textile components.
Oerlikon, n.d. Web. 16 Jun 2010.
<http://www.components.oerlikontextile.com/Portaldata/1/Resources/otc/pl_heberlein/do
wnloads/pdb/740371_03-HemaJet-Jet-Cores-Series-2-compr.pdf>.

82
APPENDICES
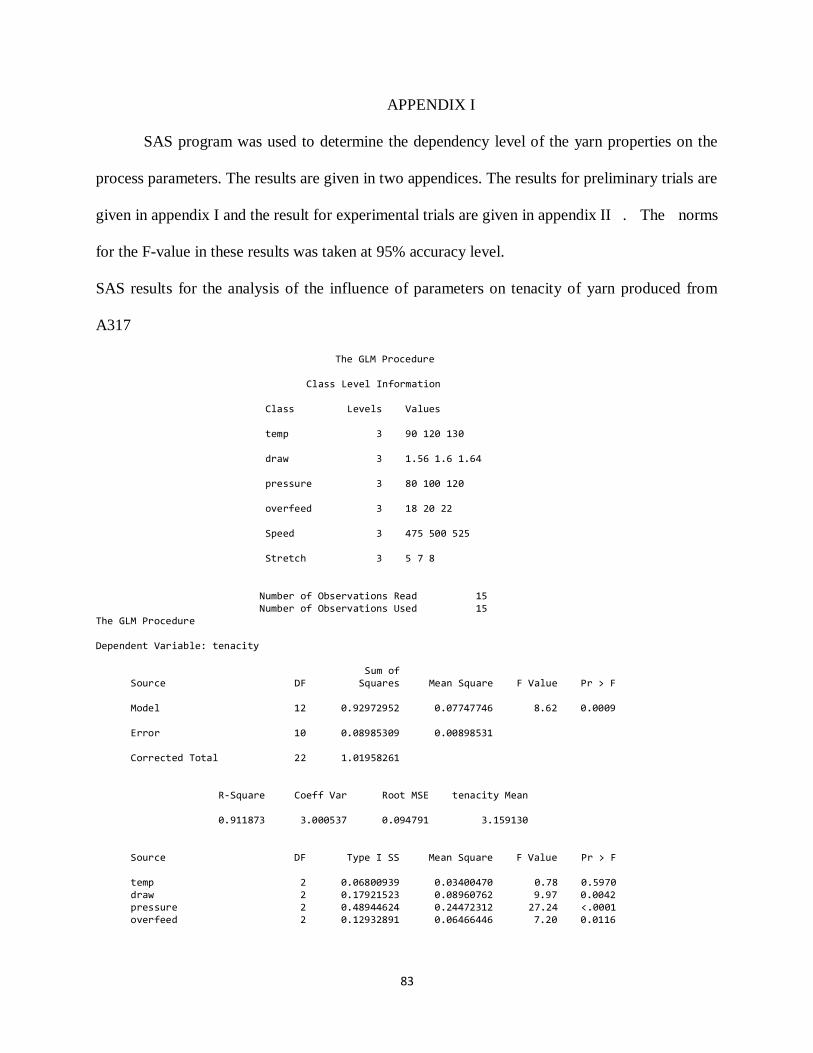
83
APPENDIX I
SAS program was used to determine the dependency level of the yarn properties on the
process parameters. The results are given in two appendices. The results for preliminary trials are
given in appendix I and the result for experimental trials are given in appendix II . The norms
for the F-value in these results was taken at 95% accuracy level.
SAS results for the analysis of the influence of parameters on tenacity of yarn produced from
A317
The GLM Procedure Class Level Information Class Levels Values temp 3 90 120 130 draw 3 1.56 1.6 1.64 pressure 3 80 100 120 overfeed 3 18 20 22 Speed 3 475 500 525 Stretch 3 5 7 8 Number of Observations Read 15 Number of Observations Used 15 The GLM Procedure Dependent Variable: tenacity Sum of Source DF Squares Mean Square F Value Pr > F Model 12 0.92972952 0.07747746 8.62 0.0009 Error 10 0.08985309 0.00898531 Corrected Total 22 1.01958261 R-Square Coeff Var Root MSE tenacity Mean 0.911873 3.000537 0.094791 3.159130 Source DF Type I SS Mean Square F Value Pr > F temp 2 0.06800939 0.03400470 0.78 0.5970 draw 2 0.17921523 0.08960762 9.97 0.0042 pressure 2 0.48944624 0.24472312 27.24 <.0001 overfeed 2 0.12932891 0.06466446 7.20 0.0116
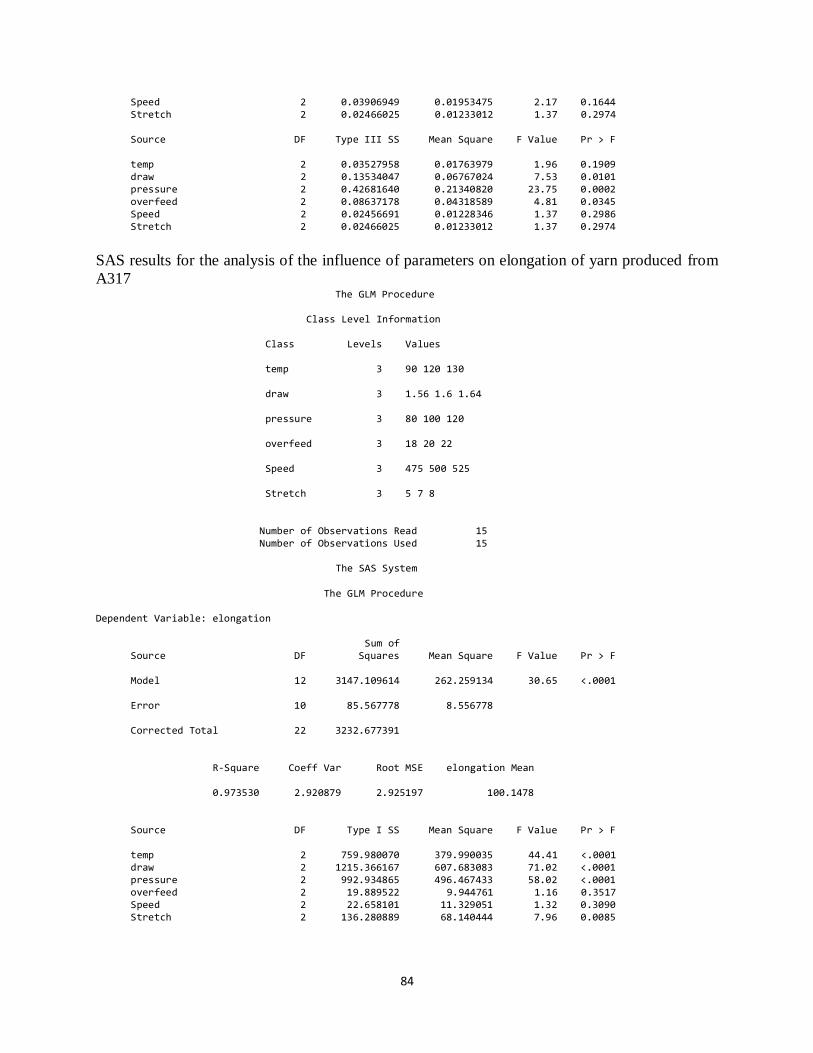
84
Speed 2 0.03906949 0.01953475 2.17 0.1644 Stretch 2 0.02466025 0.01233012 1.37 0.2974 Source DF Type III SS Mean Square F Value Pr > F temp 2 0.03527958 0.01763979 1.96 0.1909 draw 2 0.13534047 0.06767024 7.53 0.0101 pressure 2 0.42681640 0.21340820 23.75 0.0002 overfeed 2 0.08637178 0.04318589 4.81 0.0345 Speed 2 0.02456691 0.01228346 1.37 0.2986 Stretch 2 0.02466025 0.01233012 1.37 0.2974
SAS results for the analysis of the influence of parameters on elongation of yarn produced from
A317 The GLM Procedure
Class Level Information Class Levels Values temp 3 90 120 130 draw 3 1.56 1.6 1.64 pressure 3 80 100 120 overfeed 3 18 20 22 Speed 3 475 500 525 Stretch 3 5 7 8 Number of Observations Read 15 Number of Observations Used 15 The SAS System The GLM Procedure Dependent Variable: elongation Sum of Source DF Squares Mean Square F Value Pr > F Model 12 3147.109614 262.259134 30.65 <.0001 Error 10 85.567778 8.556778 Corrected Total 22 3232.677391 R-Square Coeff Var Root MSE elongation Mean 0.973530 2.920879 2.925197 100.1478 Source DF Type I SS Mean Square F Value Pr > F temp 2 759.980070 379.990035 44.41 <.0001 draw 2 1215.366167 607.683083 71.02 <.0001 pressure 2 992.934865 496.467433 58.02 <.0001 overfeed 2 19.889522 9.944761 1.16 0.3517 Speed 2 22.658101 11.329051 1.32 0.3090 Stretch 2 136.280889 68.140444 7.96 0.0085
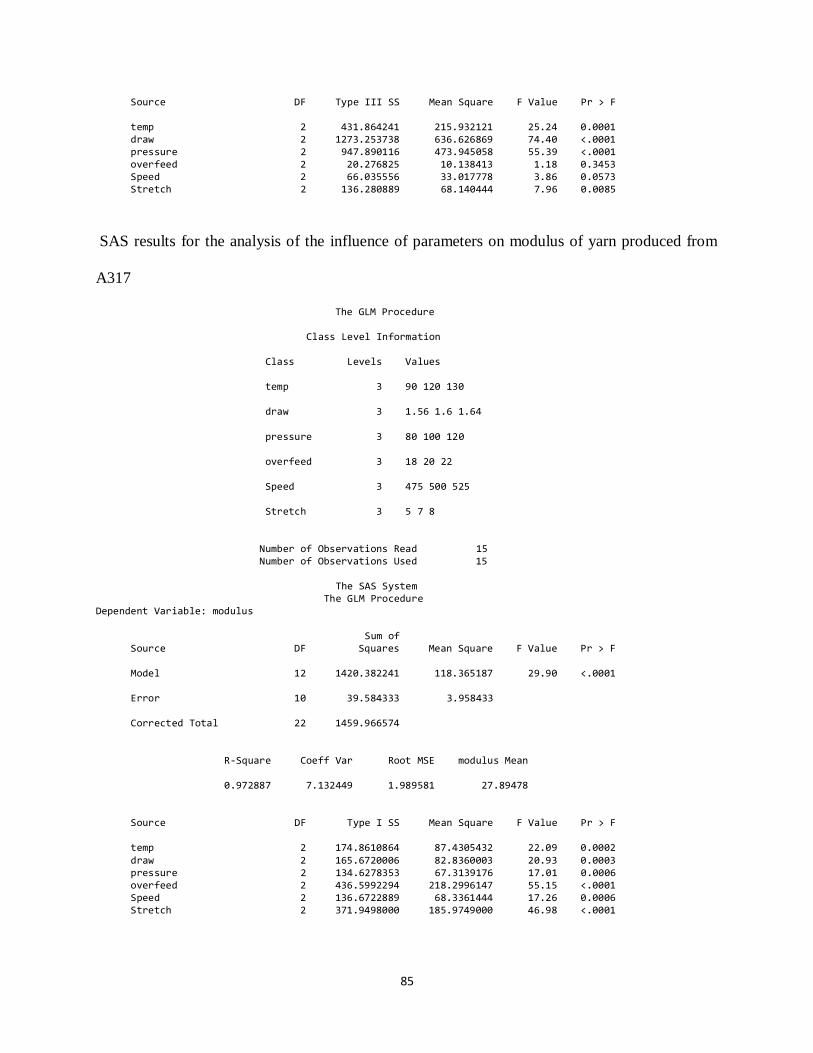
85
Source DF Type III SS Mean Square F Value Pr > F temp 2 431.864241 215.932121 25.24 0.0001 draw 2 1273.253738 636.626869 74.40 <.0001 pressure 2 947.890116 473.945058 55.39 <.0001 overfeed 2 20.276825 10.138413 1.18 0.3453 Speed 2 66.035556 33.017778 3.86 0.0573 Stretch 2 136.280889 68.140444 7.96 0.0085
SAS results for the analysis of the influence of parameters on modulus of yarn produced from
A317
The GLM Procedure Class Level Information Class Levels Values temp 3 90 120 130 draw 3 1.56 1.6 1.64 pressure 3 80 100 120 overfeed 3 18 20 22 Speed 3 475 500 525 Stretch 3 5 7 8 Number of Observations Read 15 Number of Observations Used 15 The SAS System The GLM Procedure Dependent Variable: modulus Sum of Source DF Squares Mean Square F Value Pr > F Model 12 1420.382241 118.365187 29.90 <.0001 Error 10 39.584333 3.958433 Corrected Total 22 1459.966574 R-Square Coeff Var Root MSE modulus Mean 0.972887 7.132449 1.989581 27.89478 Source DF Type I SS Mean Square F Value Pr > F temp 2 174.8610864 87.4305432 22.09 0.0002 draw 2 165.6720006 82.8360003 20.93 0.0003 pressure 2 134.6278353 67.3139176 17.01 0.0006 overfeed 2 436.5992294 218.2996147 55.15 <.0001 Speed 2 136.6722889 68.3361444 17.26 0.0006 Stretch 2 371.9498000 185.9749000 46.98 <.0001
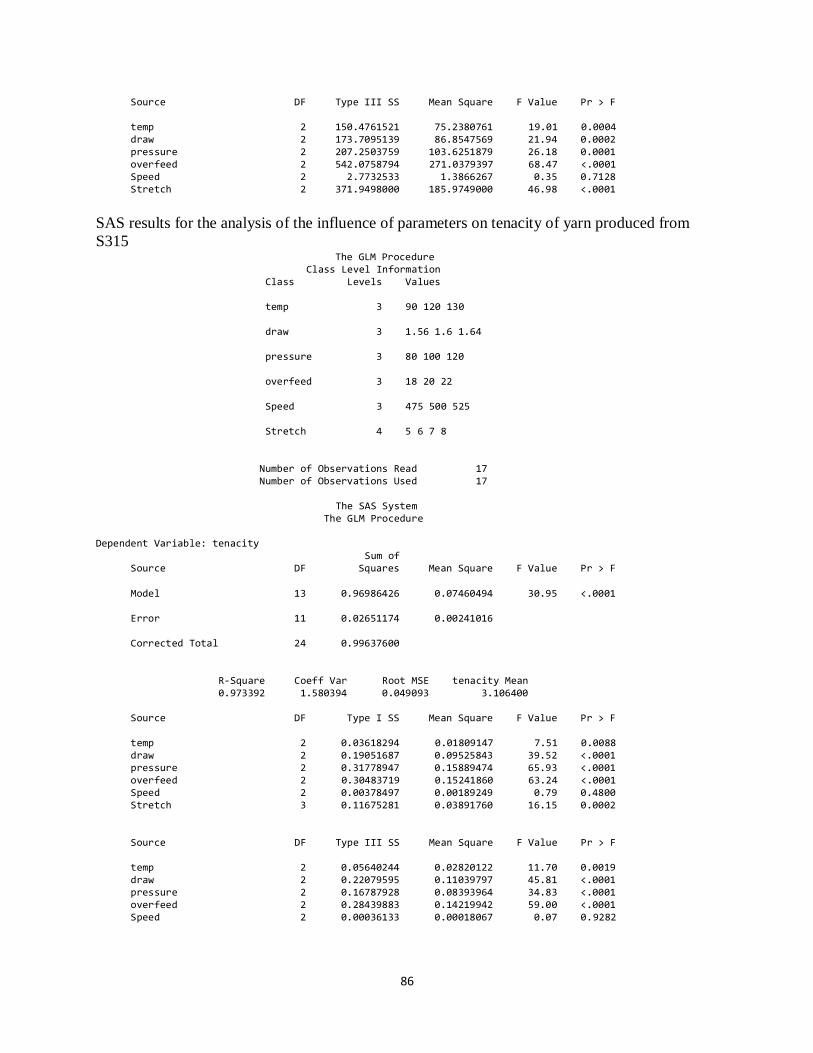
86
Source DF Type III SS Mean Square F Value Pr > F temp 2 150.4761521 75.2380761 19.01 0.0004 draw 2 173.7095139 86.8547569 21.94 0.0002 pressure 2 207.2503759 103.6251879 26.18 0.0001 overfeed 2 542.0758794 271.0379397 68.47 <.0001 Speed 2 2.7732533 1.3866267 0.35 0.7128 Stretch 2 371.9498000 185.9749000 46.98 <.0001
SAS results for the analysis of the influence of parameters on tenacity of yarn produced from
S315
The GLM Procedure Class Level Information Class Levels Values temp 3 90 120 130 draw 3 1.56 1.6 1.64 pressure 3 80 100 120 overfeed 3 18 20 22 Speed 3 475 500 525 Stretch 4 5 6 7 8 Number of Observations Read 17 Number of Observations Used 17 The SAS System The GLM Procedure Dependent Variable: tenacity Sum of Source DF Squares Mean Square F Value Pr > F Model 13 0.96986426 0.07460494 30.95 <.0001 Error 11 0.02651174 0.00241016 Corrected Total 24 0.99637600 R-Square Coeff Var Root MSE tenacity Mean 0.973392 1.580394 0.049093 3.106400 Source DF Type I SS Mean Square F Value Pr > F temp 2 0.03618294 0.01809147 7.51 0.0088 draw 2 0.19051687 0.09525843 39.52 <.0001 pressure 2 0.31778947 0.15889474 65.93 <.0001 overfeed 2 0.30483719 0.15241860 63.24 <.0001 Speed 2 0.00378497 0.00189249 0.79 0.4800 Stretch 3 0.11675281 0.03891760 16.15 0.0002 Source DF Type III SS Mean Square F Value Pr > F temp 2 0.05640244 0.02820122 11.70 0.0019 draw 2 0.22079595 0.11039797 45.81 <.0001 pressure 2 0.16787928 0.08393964 34.83 <.0001 overfeed 2 0.28439883 0.14219942 59.00 <.0001 Speed 2 0.00036133 0.00018067 0.07 0.9282
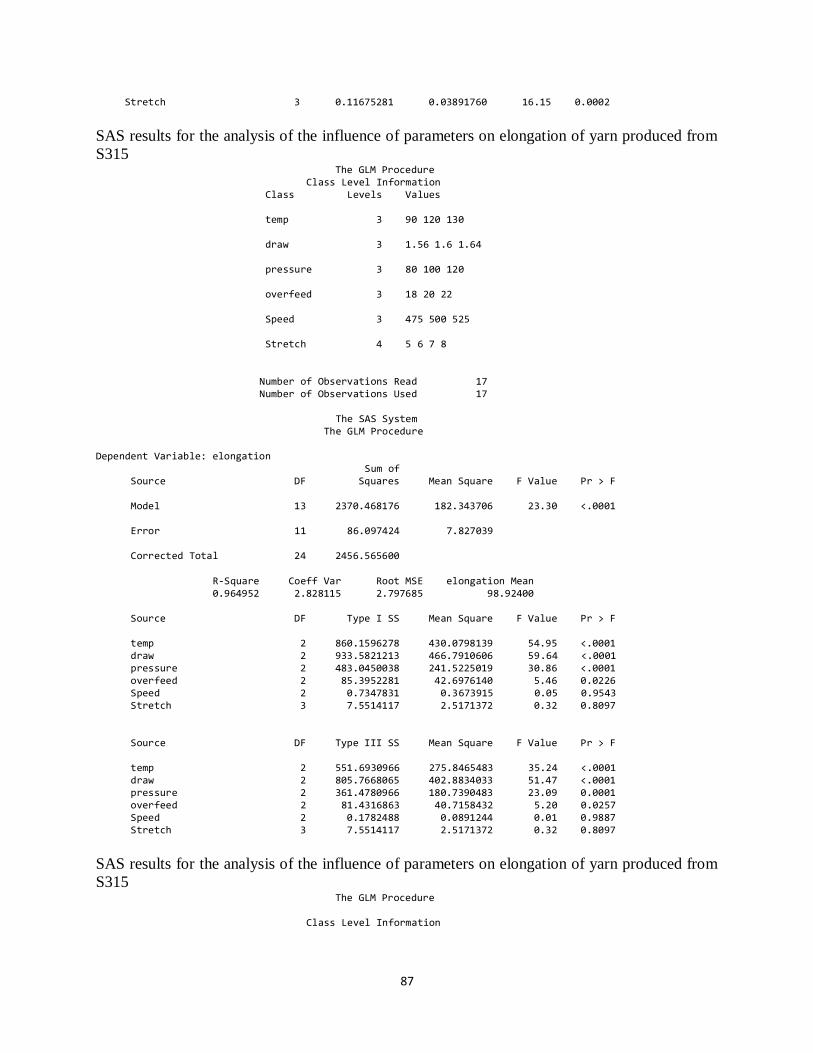
87
Stretch 3 0.11675281 0.03891760 16.15 0.0002
SAS results for the analysis of the influence of parameters on elongation of yarn produced from
S315 The GLM Procedure
Class Level Information Class Levels Values temp 3 90 120 130 draw 3 1.56 1.6 1.64 pressure 3 80 100 120 overfeed 3 18 20 22 Speed 3 475 500 525 Stretch 4 5 6 7 8 Number of Observations Read 17 Number of Observations Used 17 The SAS System The GLM Procedure Dependent Variable: elongation Sum of Source DF Squares Mean Square F Value Pr > F Model 13 2370.468176 182.343706 23.30 <.0001 Error 11 86.097424 7.827039 Corrected Total 24 2456.565600 R-Square Coeff Var Root MSE elongation Mean 0.964952 2.828115 2.797685 98.92400 Source DF Type I SS Mean Square F Value Pr > F temp 2 860.1596278 430.0798139 54.95 <.0001 draw 2 933.5821213 466.7910606 59.64 <.0001 pressure 2 483.0450038 241.5225019 30.86 <.0001 overfeed 2 85.3952281 42.6976140 5.46 0.0226 Speed 2 0.7347831 0.3673915 0.05 0.9543 Stretch 3 7.5514117 2.5171372 0.32 0.8097 Source DF Type III SS Mean Square F Value Pr > F temp 2 551.6930966 275.8465483 35.24 <.0001 draw 2 805.7668065 402.8834033 51.47 <.0001 pressure 2 361.4780966 180.7390483 23.09 0.0001 overfeed 2 81.4316863 40.7158432 5.20 0.0257 Speed 2 0.1782488 0.0891244 0.01 0.9887 Stretch 3 7.5514117 2.5171372 0.32 0.8097
SAS results for the analysis of the influence of parameters on elongation of yarn produced from
S315 The GLM Procedure
Class Level Information
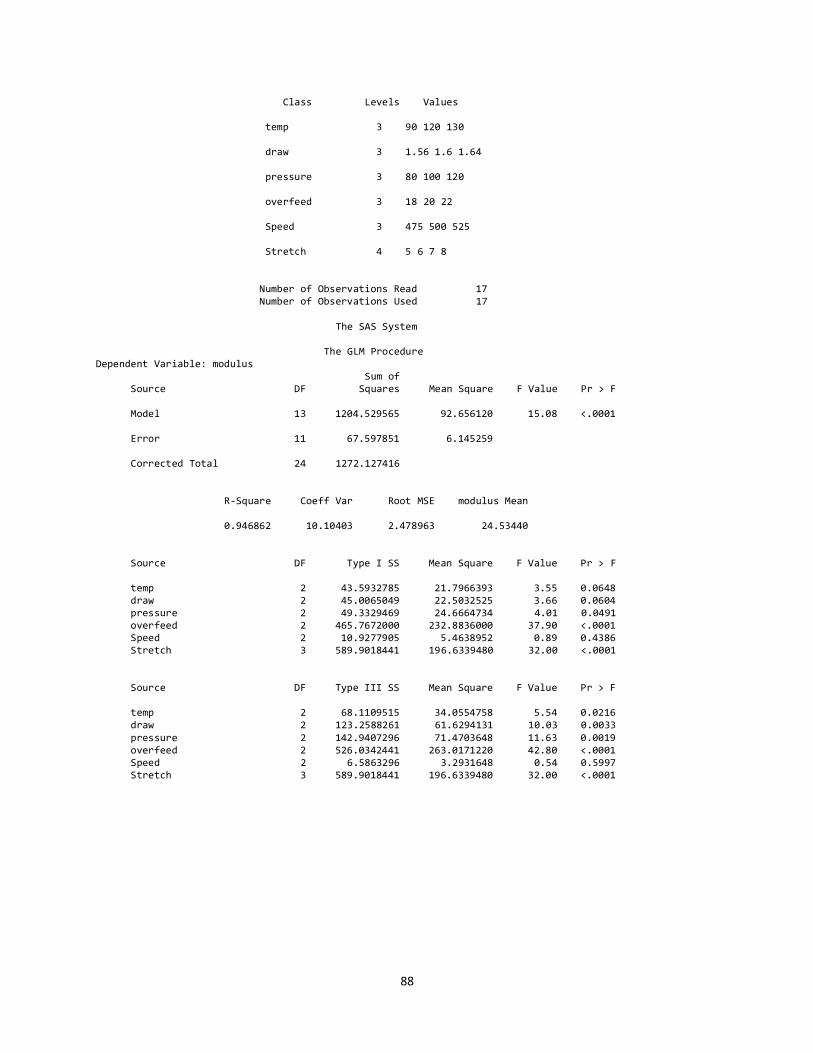
88
Class Levels Values temp 3 90 120 130 draw 3 1.56 1.6 1.64 pressure 3 80 100 120 overfeed 3 18 20 22 Speed 3 475 500 525 Stretch 4 5 6 7 8 Number of Observations Read 17 Number of Observations Used 17 The SAS System The GLM Procedure Dependent Variable: modulus Sum of Source DF Squares Mean Square F Value Pr > F Model 13 1204.529565 92.656120 15.08 <.0001 Error 11 67.597851 6.145259 Corrected Total 24 1272.127416 R-Square Coeff Var Root MSE modulus Mean 0.946862 10.10403 2.478963 24.53440 Source DF Type I SS Mean Square F Value Pr > F temp 2 43.5932785 21.7966393 3.55 0.0648 draw 2 45.0065049 22.5032525 3.66 0.0604 pressure 2 49.3329469 24.6664734 4.01 0.0491 overfeed 2 465.7672000 232.8836000 37.90 <.0001 Speed 2 10.9277905 5.4638952 0.89 0.4386 Stretch 3 589.9018441 196.6339480 32.00 <.0001 Source DF Type III SS Mean Square F Value Pr > F temp 2 68.1109515 34.0554758 5.54 0.0216 draw 2 123.2588261 61.6294131 10.03 0.0033 pressure 2 142.9407296 71.4703648 11.63 0.0019 overfeed 2 526.0342441 263.0171220 42.80 <.0001 Speed 2 6.5863296 3.2931648 0.54 0.5997 Stretch 3 589.9018441 196.6339480 32.00 <.0001
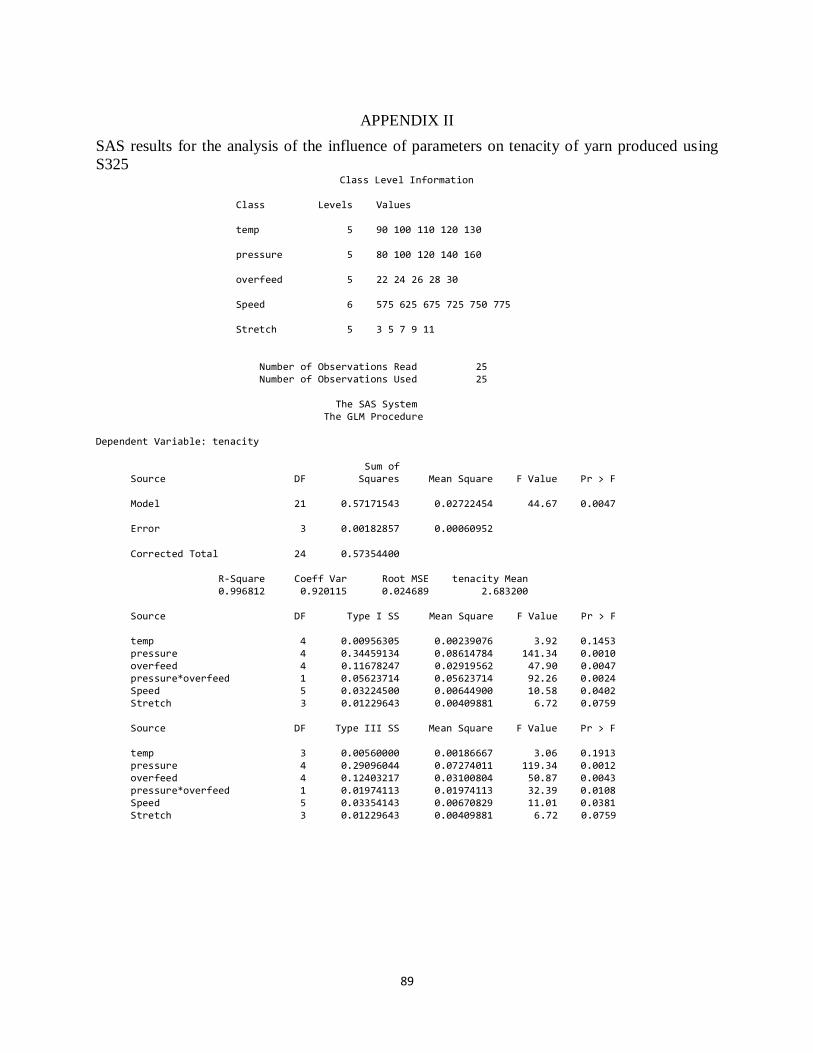
89
APPENDIX II
SAS results for the analysis of the influence of parameters on tenacity of yarn produced using
S325 Class Level Information
Class Levels Values temp 5 90 100 110 120 130 pressure 5 80 100 120 140 160 overfeed 5 22 24 26 28 30 Speed 6 575 625 675 725 750 775 Stretch 5 3 5 7 9 11 Number of Observations Read 25 Number of Observations Used 25 The SAS System The GLM Procedure Dependent Variable: tenacity Sum of Source DF Squares Mean Square F Value Pr > F Model 21 0.57171543 0.02722454 44.67 0.0047 Error 3 0.00182857 0.00060952 Corrected Total 24 0.57354400 R-Square Coeff Var Root MSE tenacity Mean 0.996812 0.920115 0.024689 2.683200 Source DF Type I SS Mean Square F Value Pr > F temp 4 0.00956305 0.00239076 3.92 0.1453 pressure 4 0.34459134 0.08614784 141.34 0.0010 overfeed 4 0.11678247 0.02919562 47.90 0.0047 pressure*overfeed 1 0.05623714 0.05623714 92.26 0.0024 Speed 5 0.03224500 0.00644900 10.58 0.0402 Stretch 3 0.01229643 0.00409881 6.72 0.0759 Source DF Type III SS Mean Square F Value Pr > F temp 3 0.00560000 0.00186667 3.06 0.1913 pressure 4 0.29096044 0.07274011 119.34 0.0012 overfeed 4 0.12403217 0.03100804 50.87 0.0043 pressure*overfeed 1 0.01974113 0.01974113 32.39 0.0108 Speed 5 0.03354143 0.00670829 11.01 0.0381 Stretch 3 0.01229643 0.00409881 6.72 0.0759