Embed Size (px)
Citation preview
AUGUSTA UNIVERSITY
Annual Financial Report
Fiscal Year 2018
Including Independent Auditor's Report


AUGUSTA UNIVERSITY
TABLE OF CONTENTS
For the Fiscal Year Ended June 30, 2018
Financial Section ............................................................................................................................................
Independent Auditor's Report ............................................................................................................... 2
Management's Discussion and Analysis ............................................................................................... 5
Financial Statements (GAAP Basis) ..................................................................................................
Statement of Net Position ............................................................................................................... 20
Statement of Revenues, Expenses, and Changes in Net Position ................................................ 22
Statement of Cash Flows ............................................................................................................... 24
Statement of Fiduciary Net Position ............................................................................................... 26
Statement of Changes in Fiduciary Net Position ............................................................................ 27
Component Units ........................................................................................................................
Combining Statement of Net Position ........................................................................................ 28
Combining Statement of Revenues, Expenses, and Changes in Net Position .......................... 30
Notes to the Financial Statements ................................................................................................. 32
Required Supplementary Information ..........................................................................................................
Schedule of Contributions for Defined Benefit Pension Plan ................................................................ 68
Schedule of Proportionate Share of Net Pension Liability .................................................................... 69
Schedule of Employers' and Nonemployers' Net Pension Liability ....................................................... 70
Schedule of Changes in Net Pension Liability ...................................................................................... 71
Schedule of Investment Returns ........................................................................................................... 72
Notes to the Required Supplementary Information for Pension Plans ................................................. 73
Schedule of Contributions for OPEB Plan............................................................................................. 74
Schedule of Proportionate Share of the Net OPEB Liability ................................................................. 75
Notes to the Required Supplementary Information for OPEB Plan ...................................................... 76
Supplementary Information ...........................................................................................................................
Balance Sheet (Non-GAAP Basis) ....................................................................................................... 78
Statement of Funds Available and Expenditures Compared to Budget (Non-GAAP Basis) ................. 79
Statement of Changes to Fund Balance by Program and Funding Source (Non-GAAP Basis)........... 81


2018 Annual Financial Report 1
Financial Section

2 Augusta University
GREG S. GRIFFIN STATE AUDITOR
(404) 656-2174
DEPARTMENT OF AUDITS AND ACCOUNTS
270 Washington Street, S.W., Suite 1-156
Atlanta, Georgia 30334-8400
Independent Auditor's Report
The Honorable Brian P. Kemp, Governor of Georgia Members of the General Assembly of the State of Georgia Members of the Board of Regents of the University System of Georgia
and Dr. Brooks Keel, President Augusta University
Report on the Financial Statements
We have audited the accompanying financial statements of the business-type activities, the aggregate discretely presented component units, and the aggregate remaining fund information of Augusta University (University), a unit of the University System of Georgia, as of and for the year ended June 30, 2018, and the related notes to the financial statements, which collectively comprise the University’s basic financial statements as listed in the table of contents.
Management's Responsibility for the Financial Statements
Management is responsible for the preparation and fair presentation of these financial statements in accordance with accounting principles generally accepted in the United States of America; this includes the design, implementation, and maintenance of internal control relevant to the preparation and fair presentation of financial statements that are free from material misstatement, whether due to fraud or error.
Auditor's Responsibility
Our responsibility is to express opinions on these financial statements based on our audit. We did not audit the financial statements of the aggregate discretely presented component units. Those statements were audited by other auditors whose reports have been furnished to us, and our opinion, insofar as it relates to the amounts included for the aggregate discretely presented component units, is based solely on the reports of the other auditors. We conducted our audit in accordance with auditing standards generally accepted in the United States of America and the standards applicable to financial audits contained in Government Auditing Standards, issued by the Comptroller General of the United States. Those standards require that we plan and perform the audit to obtain reasonable assurance about whether the financial statements are free from material misstatement. The financial statements of the discretely presented component units of the University that were audited by other auditors upon whose reports we are relying on were audited in accordance with Government Auditing Standards, except for Georgia Health Sciences Foundation.
An audit involves performing procedures to obtain audit evidence about the amounts and University’s disclosures in the financial statements. The procedures selected depend on the auditor's judgment, including the assessment of the risks of material misstatement of the financial statements, whether due to fraud or error. In making those risk assessments, the auditor considers internal control relevant to the entity's preparation and fair presentation of the financial statements in order to design audit procedures that

2018 Annual Financial Report 3
are appropriate in the circumstances, but not for the purpose of expressing an opinion on the effectiveness of the University’s internal control. Accordingly, we express no such opinion. An audit also includes evaluating the appropriateness of accounting policies used and the reasonableness of significant accounting estimates made by management, as well as evaluating the overall presentation of the financial statements.
We believe that the audit evidence we have obtained is sufficient and appropriate to provide a basis for our audit opinions.
Opinions
In our opinion, based on our audit and the report of other auditors, the financial statements referred to above present fairly, in all material respects, the respective financial position of the of the business-type activities, the aggregate discretely presented component units, and the aggregate remaining fund information of the University as of June 30, 2018, and the respective changes in financial position and where applicable, cash flows thereof for the year then ended in accordance with accounting principles generally accepted in the United States of America.
Emphasis of Matter
As discussed in Note 1, the financial statements of the University are intended to present the financial position, the changes in financial position, and where applicable, cash flows of only those portions of the business-type activities and aggregate discretely presented component units of the State of Georgia that are attributable to the transactions of the University. They do not purport to, and do not, present fairly the financial position of the State of Georgia as of June 30, 2018, the changes in its financial position, or, where applicable, its cash flows for the year then ended, in conformity with accounting principles generally accepted in the United States of America. Our opinions are not modified with respect to this matter.
As described in Note 1 to the financial statements, in 2018, the University adopted new accounting guidance, Governmental Accounting Standards Board (GASB) Statement No. 75, Accounting and Financial Reporting for Postemployment Benefits Other Than Pensions, GASB Statement No. 81, Irrevocable Split- Interest Agreements, GASB Statement No. 85, Omnibus 2017, and GASB Statement No. 86, Certain Debt Extinguishment Issues. Our opinions are not modified with respect to these matters.
Other Matters
Required Supplementary Information
Accounting principles generally accepted in the United States of America require that the Management's Discussion and Analysis, Schedule of Contributions for Defined Benefit Pension Plans, Schedule of Proportionate Share of the Net Pension Liability, Schedule of Employers’ and Nonemployers’ Net Pension Liability, Schedule of Changes in Net Pension Liability, Schedule of Investment Returns, Schedule of Contributions for OPEB Plan, Schedule of Proportionate Share of the Net OPEB Liability and the Notes to the required Supplementary Information, as listed in the table of contents, be presented to supplement the basic financial statements. Such information, although not a part of the basic financial statements, is required by the Governmental Accounting Standards Board, who considers it to be an essential part of financial reporting for placing the basic financial statements in an appropriate operational, economic, or historical context. We have applied certain limited procedures to the required supplementary information in accordance with auditing standards generally accepted in the United States of America, which consisted of inquiries of management about the methods of preparing the information for consistency with management's responses to our inquiries, the basic financial statements, and other knowledge we obtained during our audit of the basic financial statements. We do not express an opinion or provide any assurance on the information because the limited procedures do not provide us with sufficient evidence to express an opinion or provide any assurance.

4 Augusta University
Other Information
Our audit was conducted for the purpose of forming opinions on the financial statements that collectively comprise the University’s basic financial statements. The introductory section and accompanying supplementary information as listed in the table of contents are presented for the purposes of additional analysis and are not a required part of the basic financial statements.
The accompanying supplementary information is the responsibility of management and was derived from and relates directly to the underlying accounting and other records used to prepare the basic financial statements. Such information has been subjected to the auditing procedures applied in the audit of the basic financial statements and certain additional procedures, including comparing and reconciling such information directly to the underlying accounting and other records used to prepare the basic financial statements or to the basic financial statements themselves, and other additional procedures in accordance with auditing standards generally accepted in the United States of America. In our opinion, based on our audit, the procedures performed as described above, the accompanying supplementary information is fairly stated, in all material respects, in relation to the basic financial statements taken as a whole.
The introductory section has not been subjected to the auditing procedures applied in the audit of the basic financial statements, and accordingly, we do not express an opinion or provide any assurance on it.
Other Reporting Required by Government Auditing Standards
In accordance with Government Auditing Standards, we have also issued our report dated January 18, 2019 on our consideration of the University’s internal control over financial reporting and on our tests of its compliance with certain provisions of laws, regulations, contracts, and grant agreements and other matters. The purpose of that report is solely to describe the scope of our testing of internal control over financial reporting and compliance and the results of that testing, and not to provide an opinion on the effectiveness of the University’s internal control over financial reporting or on compliance. That report is an integral part of an audit performed in accordance with Government Auditing Standards in considering the University’s internal control over financial reporting and compliance.
A copy of this report has been filed as a permanent record in the office of the State Auditor and made available to the press of the State, as provided for by Official Code of Georgia Annotated section 50-6-24.
Respectfully submitted,
Greg S. Griffin
State Auditor
January 18, 2019
2018 Annual Financial Report 5
AUGUSTA UNIVERSITY
Management’s Discussion and Analysis Introduction
Founded in 1828 and located in Augusta, Richmond County, Georgia, Augusta University (University) is a public
research university and medical center dedicated to training the next generation of innovators, leaders, and health
care providers. Home to three campuses in Augusta and various satellite locations across Georgia, Augusta University
is at the forefront of groundbreaking research focused on improving and enriching the human experience. The University
is one of the 26 institutions of higher education of the University System of Georgia.
Offering undergraduate programs in the liberal arts and sciences, business and education, as well as a full range of
graduate programs and hands-on clinical research opportunities, Augusta University is Georgia's innovation center for
education and health care. The combination of nationally ranked business and nursing schools as well as the state's
flagship public medical school and only dental school makes Augusta University a destination of choice for students
of today and leaders of tomorrow.
Augusta University's mission is to provide leadership and excellence in teaching, discovery, clinical care, and service
as a student-centered comprehensive research university and academic health center with a wide range of programs
from learning assistance through postdoctoral studies.
Augusta University offers more than 146 degree programs in ten colleges and schools, including one of the nation's
oldest medical schools, the Medical College of Georgia (MCG); the state's sole dental college; the nationally ranked
James M. Hull College of Business; the Katherine Reese Pamplin School of Arts, Humanities, and Social Sciences;
Education; Science and Mathematics; Allied Health Sciences; Graduate Studies; Nursing; and the School of Computer
and Cyber Sciences.
Augusta University's more than 8,800 students come from countries around the globe and nearly all of Georgia's 159
counties. Students are taught by some of the most prestigious scientists, clinicians, artists, and scholars in the nation.
Over 1,000 full-time faculty members not only convey vital information, many also conduct extensive research. Augusta
University has a strong commitment to medical research, building on a proud tradition that boasts such breakthroughs
as fertility treatments and beta-blocking drugs for cardiac arrhythmias. Graduate and undergraduate students have
opportunities to conduct and present research, and many participate in faculty-led research.
Research plays an important role in the University's mission of providing leadership and excellence in teaching,
discovery, clinical care, and service. Augusta University's clinical and translational research programs focus on three
key areas: cancer, cardiometabolic disease, and neurological disease. Augusta University researchers are also
developing three emerging areas of research strength: regenerative and reparative medicine, personalized medicine
and genomics, and public and preventive health.
Augusta University's state-of-the-art research facilities help embody the vision of being a top-tier university that is a
destination for education, health care, discovery, creativity, and innovation. The University has developed strong
regional partnerships with the Charlie Norwood Veterans Affairs Medical Center, the Augusta Warrior Project, the
Savannah River National Laboratory, and the Dwight D. Eisenhower Army Medical Center. This structure and
partnership combined with Augusta University's collaborative environment and outstanding clinical resources place
Augusta University at the leading edge of new scientific advancements targeting diseases that directly impact its
patients.
Augusta University fields teams in NCAA Division I men's and women's golf, and the men's team claimed back-to-back
national championships in 2010 and 2011. In 11 other sports, the Jaguars compete in the Peach Belt Conference in
Division II in basketball (AU men's basketball has had 9 NCAA Tournament appearances and 3 Elite Eights), baseball,
cross country, softball, volleyball, tennis, and outdoor track and field.
Augusta University is committed to creating and sharing new knowledge as a university and to growing national and
international stature in education, research, and health care.

6 Augusta University
The University continues to grow as shown by the comparison numbers that follow.
STUDENT HEADCOUNT
STUDENT FTE
FY 2018 8,824 8,153
FY 2017 8,532 7,931
FY 2016 8,333 7,749
Overview of the Financial Statements and Financial Analysis
The University is pleased to present its financial statements for fiscal year 2018. The emphasis of discussions about
these statements will be on current year data. There are three financial statements presented: the Statement of Net
Position; the Statement of Revenues, Expenses, and Changes in Net Position; and the Statement of Cash Flows. This
discussion and analysis of the University’s financial statements provides an overview of its financial activities for the
year. Comparative data is provided for fiscal year 2018 and fiscal year 2017. However, the comparative data for fiscal
year 2017 does not reflect the effects of the restatement of July 1, 2017 net position. This restatement is predominately
related to the implementation of Governmental Accounting Standards Board (GASB) Statement No. 75, Accounting
and Financial Reporting for Postemployment Benefits Other Than Pensions. The adoption of this Statement resulted
in the accrual of the University's proportionate share of the net other post-employment benefit (OPEB) liability for the
Board of Regents Retiree Health Benefit Plan, changes to the related OPEB note disclosures, additional OPEB required
supplementary information, and the restatement of the July 1, 2017 net position balance. See Note 1 in the Notes to
the Financial Statements for additional information related to the effects of the restatement of July 1, 2017 net position.
Statement of Net Position
The Statement of Net Position is a financial condition snapshot as of June 30, 2018 and includes all assets, deferred
outflows of resources, liabilities, and deferred inflows of resources, both current and noncurrent. The differences
between current and non-current assets are discussed in the Notes to the Financial Statements. The Statement of
Net Position is prepared under the accrual basis of accounting which requires revenue and asset recognition when
the service is provided, and expense and liability recognition when goods or services are received despite when cash
is actually exchanged.
From the data presented, readers of the Statement of Net Position are able to determine the assets available to continue
the operations of the University and how much the University owes vendors. The difference between assets, deferred
outflows of resources, liabilities, and deferred inflows of resources (net position) is one indicator of the University’s
financial health. Increases or decreases in net position provide an indicator of the improvement or decline of the
University’s financial health when considered in conjunction with other non-financial conditions, such as facilities and
enrollment. Net Position is divided into three major categories.
The first category, net investment in capital assets, provides the University’s equity in property, plant, and equipment
owned by the University.
The next category is restricted, which is divided into two categories, non-expendable and expendable. The corpus of
non-expendable, restricted resources is available only for investment purposes. Expendable, restricted resources are
available for expenditure by the University, but must be spent for purposes as determined by donors and/or external
entities that have placed time or purpose restrictions on the use of the assets.
The final category is unrestricted. Unrestricted resources are available to the University for any lawful purpose.

2018 Annual Financial Report 7
Statement of Net Position for the Years Ended June 30, 2018 and June 30, 2017, Condensed
CONDENSED STATEMENT OF NET
POSITION
June 30, 2018
June 30, 2017
Increase/ (Decrease)
% Change
ASSETS Current Assets $ 132,428,478 $ 107,353,853 $ 25,074,625 23.36 %
Capital Assets, Net 537,217,308 526,986,011 10,231,297 1.94 %
Other Assets 92,358,103 87,686,377 4,671,726 5.33 %
TOTAL ASSETS 762,003,889 722,026,241 39,977,648 5.54 %
DEFERRED OUTFLOWS 92,008,272 94,788,212 (2,779,940) (2.93)%
LIABILITIES Current Liabilities 102,415,112 96,602,397 5,812,715 6.02 %
Non-Current Liabilities 930,526,767 475,435,433 455,091,334 95.72 %
TOTAL LIABILITIES 1,032,941,879 572,037,830 460,904,049 80.57 %
DEFERRED INFLOWS 54,136,573 14,044,713 40,091,860 285.46 %
NET POSITION Net Investment in Capital Assets 485,453,028 472,466,154 12,986,874 2.75 %
Restricted, Non-Expendable 2,558,310 2,408,636 149,674 6.21 %
Restricted, Expendable 33,662,268 43,789,490 (10,127,222) (23.13)%
Unrestricted (Deficit) (754,739,897) (287,932,370) (466,807,527) 162.12 %
TOTAL NET POSITION $ (233,066,291) $ 230,731,910 $ (463,798,201) (201.01)%
The June 30, 2017 amounts do not reflect the effects of the restatement of July 1, 2017 net position related to the
implementation of GASB 75. See Note 1 in the Notes to the Financial Statements for more information.
Total assets increased $39,977,648 which was due to an increase in current assets of $25,074,625, an increase in
net capital assets of $10,231,297, and an increase in other assets of $4,671,726. There was an overall increase in
total cash and investments, however, externally restricted cash and cash equivalents are shown separately in fiscal
year 2018. Unrestricted cash and investments show a slight decrease, but this decrease was minimal and a reflection
of the prudent spending practiced by the University. Accounts receivables decreased overall with the largest decrease
in student tuition and fees which was the result of strategic initiatives to lower receivables. However, there was an
increase in receivables from component units. This increase was due to the fact Augusta University Medical Center
is required to pay an annual performance-based service fee (margin allocation) to support delivery of services described
in the Master Affiliation Agreement and provide the many resources needed to continue its operation. The service fee
is based on the percentage of Augusta University Medical Center's net income to operating revenue and for fiscal year
2018 is $6,638,215. No service fee was received in fiscal year 2017.
Total deferred outflows of resources decreased by $(2,779,940) which was primarily due to the University's change in
proportionate share of the actuarially determined deferred loss on defined benefit pension plans administered by
Teachers Retirement System of Georgia and the Early Retirement Plan.
Total liabilities increased $460,904,049 which was due to an increase in current liabilities of $5,812,715 and an increase
in non-current liabilities of $455,091,334. Accounts payable increased $4,264,562, which was largely attributable to
amounts due at the end of the fiscal year for fall tuition and timing of payment of payroll withholdings. Compensated
absences increased $215,482 which was related to a combination of an increase in salaries and an increase in unused
vacation leave. The largest increase was due to the implementation of Governmental Accounting Standards Board
(GASB) Statement No. 75, Accounting and Financial Reporting for Postemployment Benefits Other Than Pensions
which increased liability by $500,127,185.
8 Augusta University
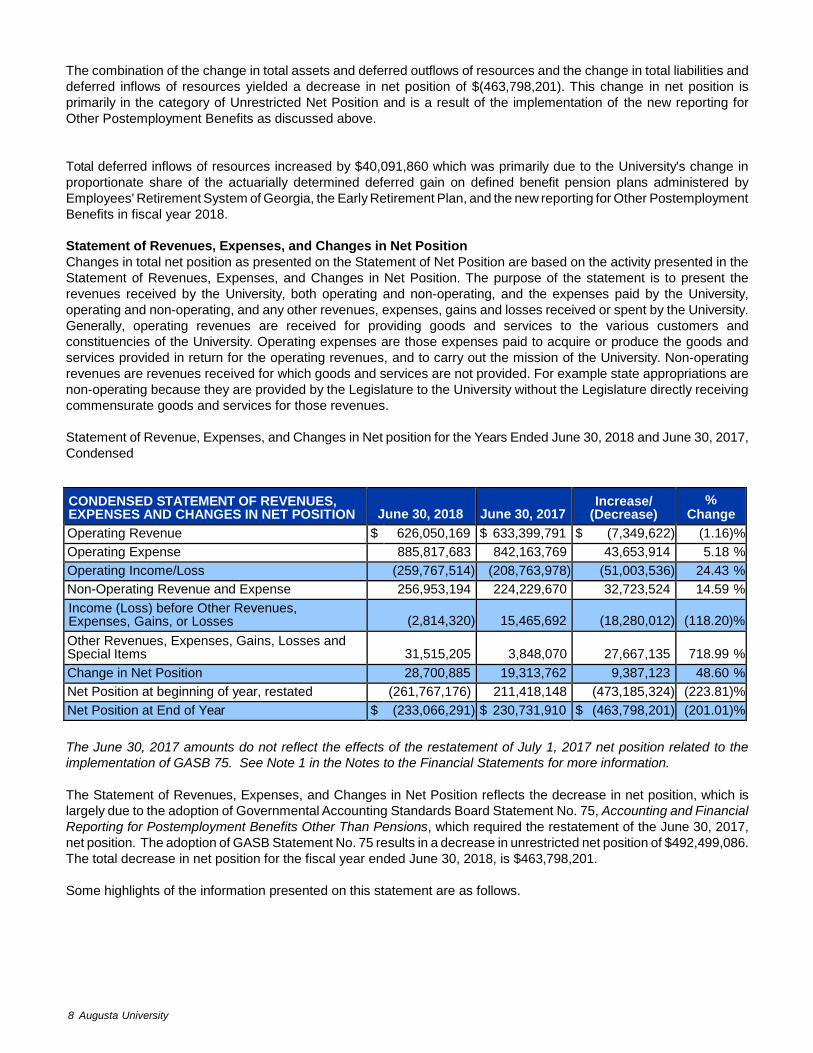
The combination of the change in total assets and deferred outflows of resources and the change in total liabilities and
deferred inflows of resources yielded a decrease in net position of $(463,798,201). This change in net position is
primarily in the category of Unrestricted Net Position and is a result of the implementation of the new reporting for
Other Postemployment Benefits as discussed above.
Total deferred inflows of resources increased by $40,091,860 which was primarily due to the University's change in
proportionate share of the actuarially determined deferred gain on defined benefit pension plans administered by
Employees' Retirement System of Georgia, the Early Retirement Plan, and the new reporting for Other Postemployment
Benefits in fiscal year 2018.
Statement of Revenues, Expenses, and Changes in Net Position
Changes in total net position as presented on the Statement of Net Position are based on the activity presented in the
Statement of Revenues, Expenses, and Changes in Net Position. The purpose of the statement is to present the
revenues received by the University, both operating and non-operating, and the expenses paid by the University,
operating and non-operating, and any other revenues, expenses, gains and losses received or spent by the University.
Generally, operating revenues are received for providing goods and services to the various customers and
constituencies of the University. Operating expenses are those expenses paid to acquire or produce the goods and
services provided in return for the operating revenues, and to carry out the mission of the University. Non-operating
revenues are revenues received for which goods and services are not provided. For example state appropriations are
non-operating because they are provided by the Legislature to the University without the Legislature directly receiving
commensurate goods and services for those revenues.
Statement of Revenue, Expenses, and Changes in Net position for the Years Ended June 30, 2018 and June 30, 2017,
Condensed
CONDENSED STATEMENT OF REVENUES, EXPENSES AND CHANGES IN NET POSITION
June 30, 2018
June 30, 2017
Increase/ (Decrease)
% Change
Operating Revenue $ 626,050,169 $ 633,399,791 $ (7,349,622) (1.16)%
Operating Expense 885,817,683 842,163,769 43,653,914 5.18 %
Operating Income/Loss (259,767,514) (208,763,978) (51,003,536) 24.43 %
Non-Operating Revenue and Expense 256,953,194 224,229,670 32,723,524 14.59 %
Income (Loss) before Other Revenues, Expenses, Gains, or Losses
(2,814,320)
15,465,692
(18,280,012)
(118.20)%
Other Revenues, Expenses, Gains, Losses and Special Items
31,515,205
3,848,070
27,667,135
718.99 %
Change in Net Position 28,700,885 19,313,762 9,387,123 48.60 %
Net Position at beginning of year, restated (261,767,176) 211,418,148 (473,185,324) (223.81)%
Net Position at End of Year $ (233,066,291) $ 230,731,910 $ (463,798,201) (201.01)%
The June 30, 2017 amounts do not reflect the effects of the restatement of July 1, 2017 net position related to the
implementation of GASB 75. See Note 1 in the Notes to the Financial Statements for more information.
The Statement of Revenues, Expenses, and Changes in Net Position reflects the decrease in net position, which is
largely due to the adoption of Governmental Accounting Standards Board Statement No. 75, Accounting and Financial
Reporting for Postemployment Benefits Other Than Pensions, which required the restatement of the June 30, 2017,
net position. The adoption of GASB Statement No. 75 results in a decrease in unrestricted net position of $492,499,086.
The total decrease in net position for the fiscal year ended June 30, 2018, is $463,798,201.
Some highlights of the information presented on this statement are as follows.
2018 Annual Financial Report 9
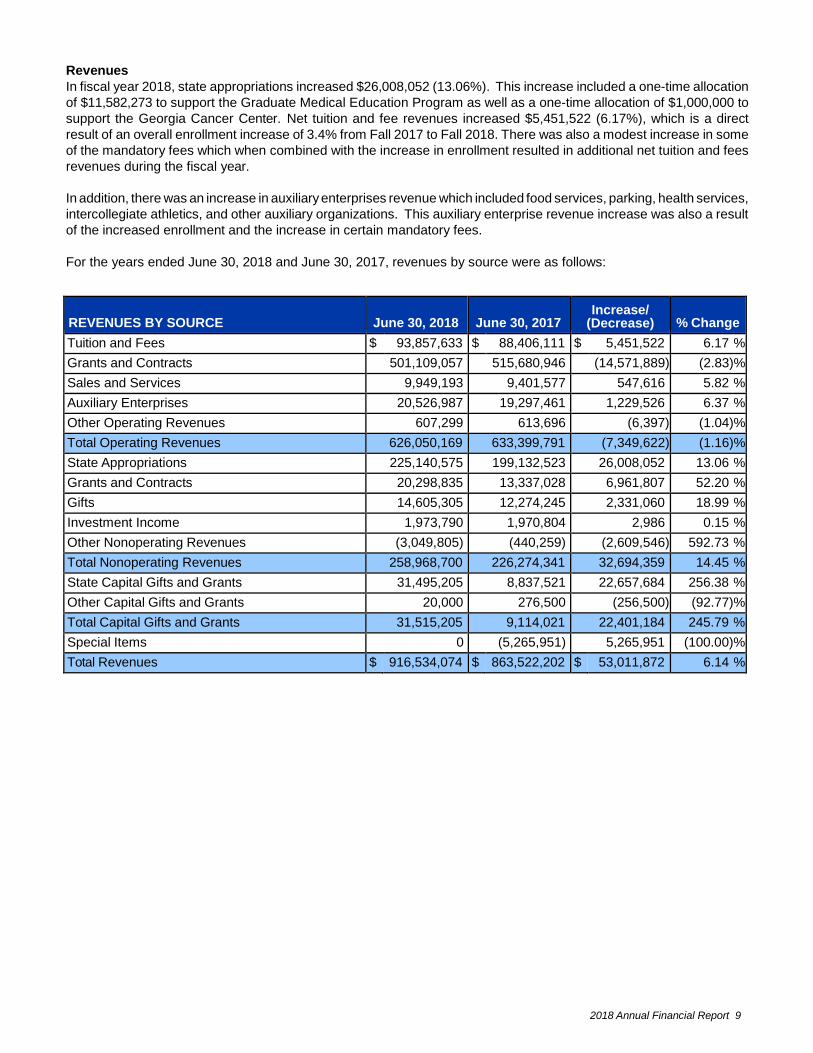
Revenues
In fiscal year 2018, state appropriations increased $26,008,052 (13.06%). This increase included a one-time allocation
of $11,582,273 to support the Graduate Medical Education Program as well as a one-time allocation of $1,000,000 to
support the Georgia Cancer Center. Net tuition and fee revenues increased $5,451,522 (6.17%), which is a direct
result of an overall enrollment increase of 3.4% from Fall 2017 to Fall 2018. There was also a modest increase in some
of the mandatory fees which when combined with the increase in enrollment resulted in additional net tuition and fees
revenues during the fiscal year.
In addition, there was an increase in auxiliary enterprises revenue which included food services, parking, health services,
intercollegiate athletics, and other auxiliary organizations. This auxiliary enterprise revenue increase was also a result
of the increased enrollment and the increase in certain mandatory fees.
For the years ended June 30, 2018 and June 30, 2017, revenues by source were as follows:
REVENUES BY SOURCE
June 30, 2018
June 30, 2017
Increase/ (Decrease)
% Change
Tuition and Fees $ 93,857,633 $ 88,406,111 $ 5,451,522 6.17 %
Grants and Contracts 501,109,057 515,680,946 (14,571,889) (2.83)%
Sales and Services 9,949,193 9,401,577 547,616 5.82 %
Auxiliary Enterprises 20,526,987 19,297,461 1,229,526 6.37 %
Other Operating Revenues 607,299 613,696 (6,397) (1.04)%
Total Operating Revenues 626,050,169 633,399,791 (7,349,622) (1.16)%
State Appropriations 225,140,575 199,132,523 26,008,052 13.06 %
Grants and Contracts 20,298,835 13,337,028 6,961,807 52.20 %
Gifts 14,605,305 12,274,245 2,331,060 18.99 %
Investment Income 1,973,790 1,970,804 2,986 0.15 %
Other Nonoperating Revenues (3,049,805) (440,259) (2,609,546) 592.73 %
Total Nonoperating Revenues 258,968,700 226,274,341 32,694,359 14.45 %
State Capital Gifts and Grants 31,495,205 8,837,521 22,657,684 256.38 %
Other Capital Gifts and Grants 20,000 276,500 (256,500) (92.77)%
Total Capital Gifts and Grants 31,515,205 9,114,021 22,401,184 245.79 %
Special Items 0 (5,265,951) 5,265,951 (100.00)%
Total Revenues $ 916,534,074 $ 863,522,202 $ 53,011,872 6.14 %

10 Augusta University
Revenue by source (state appropriations, grants and contracts, tuition and fees, auxiliaries, gifts and other sources)
is depicted by the following chart:
• Tuition and Fees • Grants and Contracts • Sales and Services
• Auxiliary Enterprises • State Appropriations • Capital Gifts and Grants
Revenue by Major Source
$225 ,140,575 $31,515 ,205
$93,857 ,633
$20,526,987
$9,949 ,193
$501,109 ,057

2018 Annual Financial Report 11
Revenue by major source for the years ended June 30, 2018 and June 30, 2017 is depicted by the following chart:
Revenue by Major Source
$600 ,000,000
$500 ,000,000
$400 ,000,000
$300 ,000,000
$200 ,000,000
$100 ,000,000
$0
• June 30, 2018 • June 30, 2017
12 Augusta University
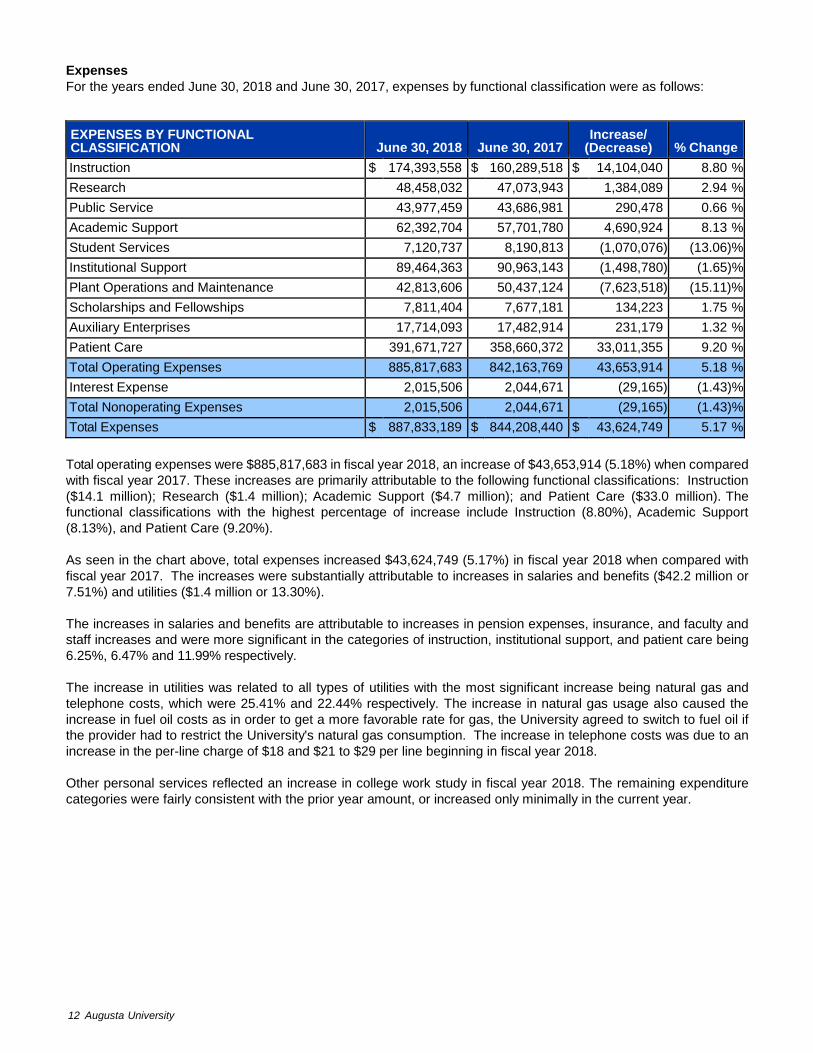
Expenses
For the years ended June 30, 2018 and June 30, 2017, expenses by functional classification were as follows:
EXPENSES BY FUNCTIONAL CLASSIFICATION
June 30, 2018
June 30, 2017
Increase/ (Decrease)
% Change
Instruction $ 174,393,558 $ 160,289,518 $ 14,104,040 8.80 %
Research 48,458,032 47,073,943 1,384,089 2.94 %
Public Service 43,977,459 43,686,981 290,478 0.66 %
Academic Support 62,392,704 57,701,780 4,690,924 8.13 %
Student Services 7,120,737 8,190,813 (1,070,076) (13.06)%
Institutional Support 89,464,363 90,963,143 (1,498,780) (1.65)%
Plant Operations and Maintenance 42,813,606 50,437,124 (7,623,518) (15.11)%
Scholarships and Fellowships 7,811,404 7,677,181 134,223 1.75 %
Auxiliary Enterprises 17,714,093 17,482,914 231,179 1.32 %
Patient Care 391,671,727 358,660,372 33,011,355 9.20 %
Total Operating Expenses 885,817,683 842,163,769 43,653,914 5.18 %
Interest Expense 2,015,506 2,044,671 (29,165) (1.43)%
Total Nonoperating Expenses 2,015,506 2,044,671 (29,165) (1.43)%
Total Expenses $ 887,833,189 $ 844,208,440 $ 43,624,749 5.17 %
Total operating expenses were $885,817,683 in fiscal year 2018, an increase of $43,653,914 (5.18%) when compared
with fiscal year 2017. These increases are primarily attributable to the following functional classifications: Instruction
($14.1 million); Research ($1.4 million); Academic Support ($4.7 million); and Patient Care ($33.0 million). The
functional classifications with the highest percentage of increase include Instruction (8.80%), Academic Support
(8.13%), and Patient Care (9.20%).
As seen in the chart above, total expenses increased $43,624,749 (5.17%) in fiscal year 2018 when compared with
fiscal year 2017. The increases were substantially attributable to increases in salaries and benefits ($42.2 million or
7.51%) and utilities ($1.4 million or 13.30%).
The increases in salaries and benefits are attributable to increases in pension expenses, insurance, and faculty and
staff increases and were more significant in the categories of instruction, institutional support, and patient care being
6.25%, 6.47% and 11.99% respectively.
The increase in utilities was related to all types of utilities with the most significant increase being natural gas and
telephone costs, which were 25.41% and 22.44% respectively. The increase in natural gas usage also caused the
increase in fuel oil costs as in order to get a more favorable rate for gas, the University agreed to switch to fuel oil if
the provider had to restrict the University's natural gas consumption. The increase in telephone costs was due to an
increase in the per-line charge of $18 and $21 to $29 per line beginning in fiscal year 2018.
Other personal services reflected an increase in college work study in fiscal year 2018. The remaining expenditure
categories were fairly consistent with the prior year amount, or increased only minimally in the current year.

2018 Annual Financial Report 13
Auxiliary Enterprises :
2 .0%
Scholarships and
Fellowships: 0.9%
Patient Care: 44 .2%
Plant Operations and
Maintenance : 4 .8%
Institutional Support:
10.1%
Student Services:
0.8%
Academic Support:
7.0%
Public Service: 5.0%
Research : 5.5%
Instruction: 19.7%
The following chart depicts the fiscal year 2018 operating expenses by functional classification.
Operati ng Expenses by Functional Classification
14 Augusta University
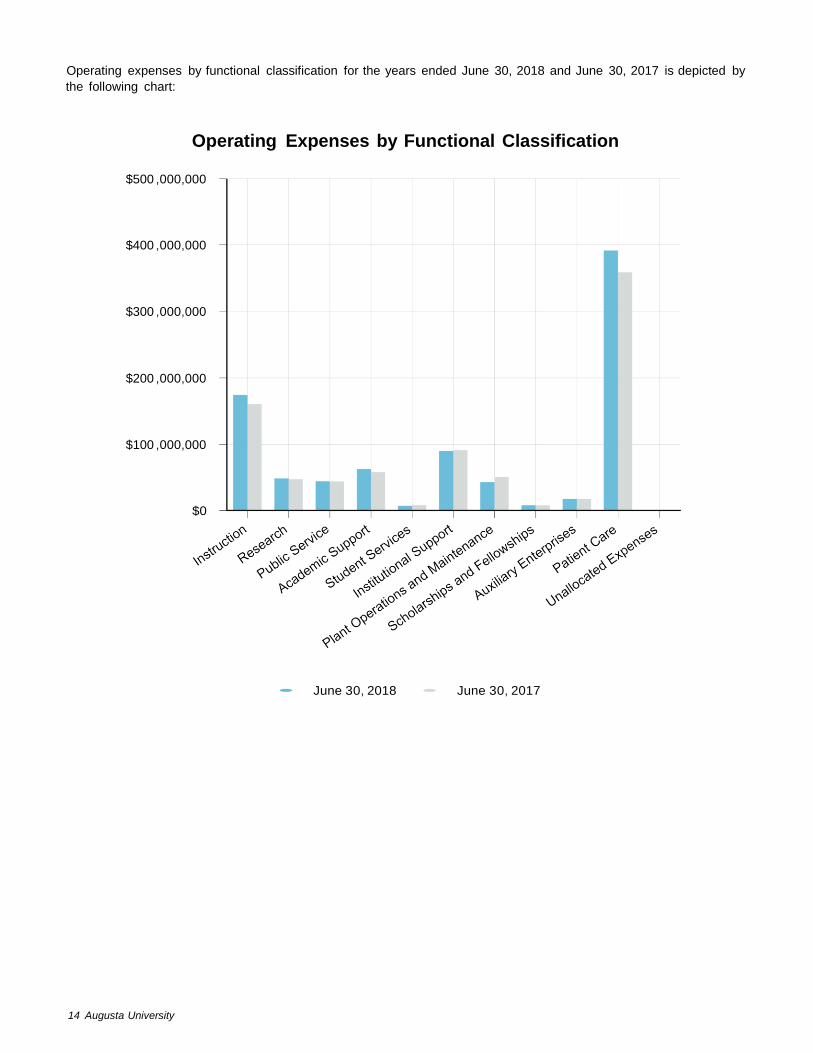
Operating expenses by functional classification for the years ended June 30, 2018 and June 30, 2017 is depicted by
the following chart:
Operating Expenses by Functional Classification
$500 ,000,000
$400 ,000,000
$300 ,000,000
$200 ,000,000
$100 ,000,000
$0
• June 30, 2018 • June 30, 2017
2018 Annual Financial Report 15
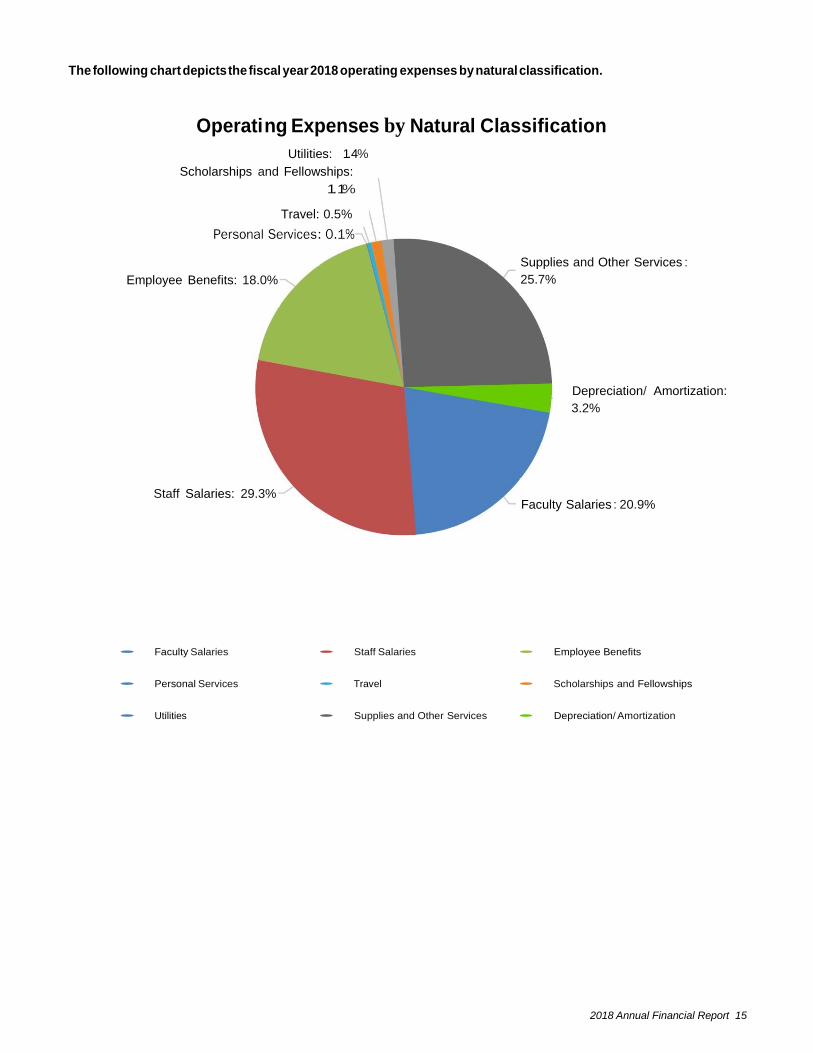
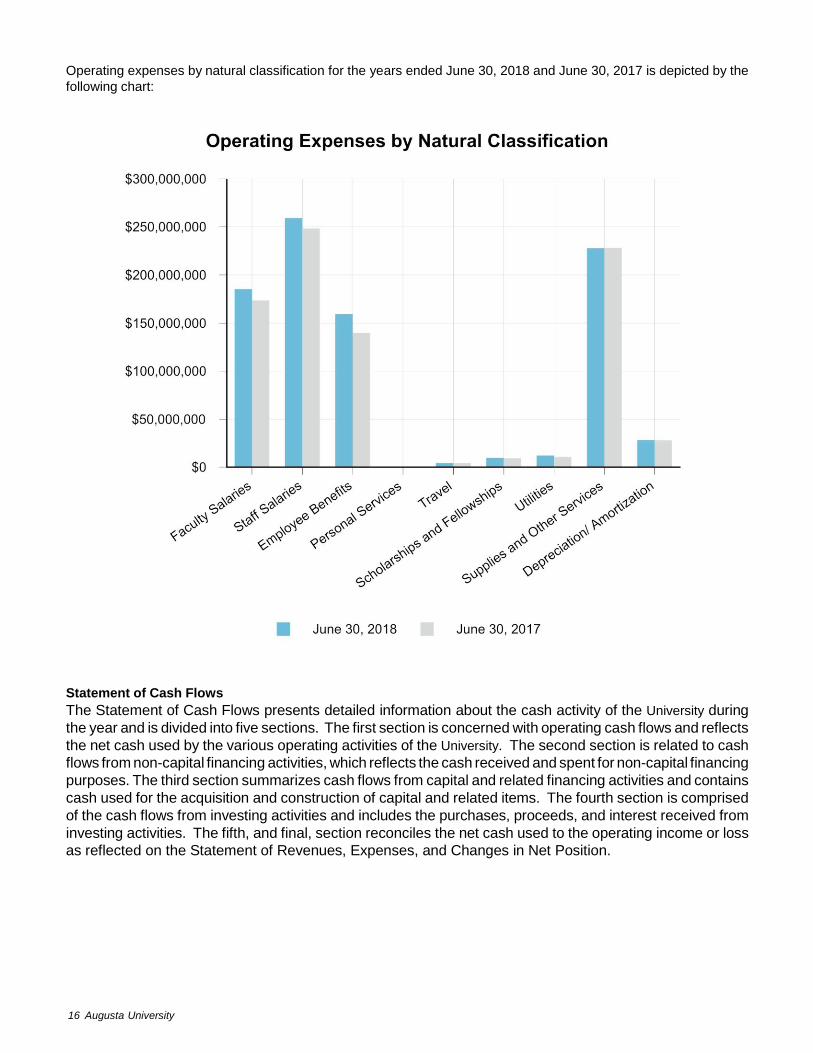
The following chart depicts the fiscal year 2018 operating expenses by natural classification.
Operati ng Expenses by Natural Classification
Utilities: 1.4%
Scholarships and Fellowships:
1.1%
Travel: 0.5%
Employee Benefits: 18.0%
Supplies and Other Services :
25.7%
Depreciation/ Amortization:
3.2%
Staff Salaries: 29.3% Faculty Salaries : 20.9%
• Faculty Salaries • Staff Salaries • Employee Benefits
• Personal Services • Travel • Scholarships and Fellowships
• Utilities • Supplies and Other Services • Depreciation/ Amortization
16 Augusta University
Operating expenses by natural classification for the years ended June 30, 2018 and June 30, 2017 is depicted by the
following chart:
Statement of Cash Flows
The Statement of Cash Flows presents detailed information about the cash activity of the University during
the year and is divided into five sections. The first section is concerned with operating cash flows and reflects
the net cash used by the various operating activities of the University. The second section is related to cash
flows from non-capital financing activities, which reflects the cash received and spent for non-capital financing
purposes. The third section summarizes cash flows from capital and related financing activities and contains
cash used for the acquisition and construction of capital and related items. The fourth section is comprised
of the cash flows from investing activities and includes the purchases, proceeds, and interest received from
investing activities. The fifth, and final, section reconciles the net cash used to the operating income or loss
as reflected on the Statement of Revenues, Expenses, and Changes in Net Position.

2018 Annual Financial Report 17
Cash Flows for the Years Ended June 30, 2018 and June 30, 2017, Condensed
CONDENSED STATEMENT OF NET CASH FLOWS
June 30, 2018
June 30, 2017
Cash Provided (Used) by: Operating Activities $ (205,775,400) $ (204,801,851)
Non-Capital Financing Activities 251,512,759 229,181,689
Capital and Related Financing Activities (14,573,800) (21,388,416)
Investing Activities (3,111,463) (7,825,066)
NET CHANGE IN CASH 28,052,096 (4,833,644)
Cash, beginning of year (restated) 13,058,900 17,892,544
CASH, end of year $ 41,110,996 $ 13,058,900
Capital Assets
Capital assets, net of accumulated depreciation, at June 30, 2018 and June 30, 2017 were as follows:
CAPITAL ASSETS, net of accumulated
depreciation
June 30, 2018
June 30, 2017
Increase (Decrease)
% Change
Land $ 23,214,737 $ 23,214,736 $ 1 0.00 %
Capitalized Collections 87,006 87,006 0.00 %
Construction Work-in-Progress 12,823,779 18,425,893 (5,602,114) (30.40)%
Infrastructure 5,180,379 4,641,544 538,835 11.61 %
Building and Building Improvements 447,338,615 435,497,293 11,841,322 2.72 %
Facilities and Other Improvements 15,363,745 11,552,203 3,811,542 32.99 %
Equipment 27,290,148 27,136,328 153,820 0.57 %
Library Collections 5,918,899 6,431,008 (512,109) (7.96)%
Capital Assets, net of accumulated depreciation
$
537,217,308
$
526,986,011
$
10,231,297
1.94 %
University managed capital projects for building and building improvements, site development, and equipment in fiscal
year 2018 totaled $6,308,214, including the Campus Wayfinding and Signage project and the Riverfront Property Site
Development project. In addition, building and building improvements, equipment, and research and development
infrastructure totaling $31,943,769 were funded by Georgia State Financing and Investment Commission (GSFIC) and
included $5,000 prepaid by the University to complete the Ambulatory Surgery Center in the College of Dental Medicine.
Included in the Georgia State Financing and Investment Commission funded total were two GSFIC-managed projects
which were substantially completed and transferred to the University during the fiscal year. The most significant of
these projects was the Roosevelt Warm Springs Health Facility Improvements at a cost of $25,675,861. Also completed
was the Wrightsboro Road Site Expansion project at a cost of $821,009.
Other on-going projects funded by GSFIC included capital expenditures of $898,889 in fiscal year 2018. Projected
funding by GSFIC for fiscal year 2019 will be approximately the same as in previous years.
For additional information concerning Capital Assets, see Notes 1, 6, 8, and 13 in the Notes to the Financial Statements.
18 Augusta University
Long-Term Liabilities
Augusta University had Long-Term Liabilities of $956,005,986 of which $25,479,219 was reflected as current liability
at June 30, 2018. Long-Term Liabilities included capital leases, compensated absences, net pension liability, and net
other post employment benefits liability.
For additional information concerning Long-Term Liabilities, see Note 8 in the Notes to the Financial Statements.
The Notes to the Financial Statements are an integral part of the basic financial statements and communicate information
essential for fair presentation. For example, the notes convey information concerning significant accounting policies
used to prepare the financial statements, detailed information on cash and investments, receivables, capital leases,
compensated absences, retirement and other postemployment benefits, capital assets, and a report of operating
expenses by function.
Economic Outlook
Augusta University continued to manage resources prudently in fiscal year 2018 and remains committed to student
affordability and strategic allocation of resources to our core mission of teaching, discovery, clinical care, and service.
For the second time since consolidation, the University saw a modest increase in enrollment of 3.4% from Fall 2017
to Fall 2018. Enrollment trends continue to suggest that a modest increase will be recognized during fiscal year 2019
which will result in additional tuition revenue. We anticipate both operating and non-operating revenues and expenses
to remain relatively consistent as compared to previous years with no significant fluctuations.
While the University is impacted by general economic conditions, management believes the University will continue
its high level of excellence in service to students, sponsors, the State of Georgia, and other constituents. The University's
financial position and internal planning processes provide the University some protection against funding reductions
and adverse economic conditions.
Dr. Brooks A. Keel, Ph.D., President Anthony E. Wagner, Executive Vice President
Augusta University Augusta University

2018 Annual Financial Report 19
Financial Statements
(GAAP Basis)
20 Augusta University
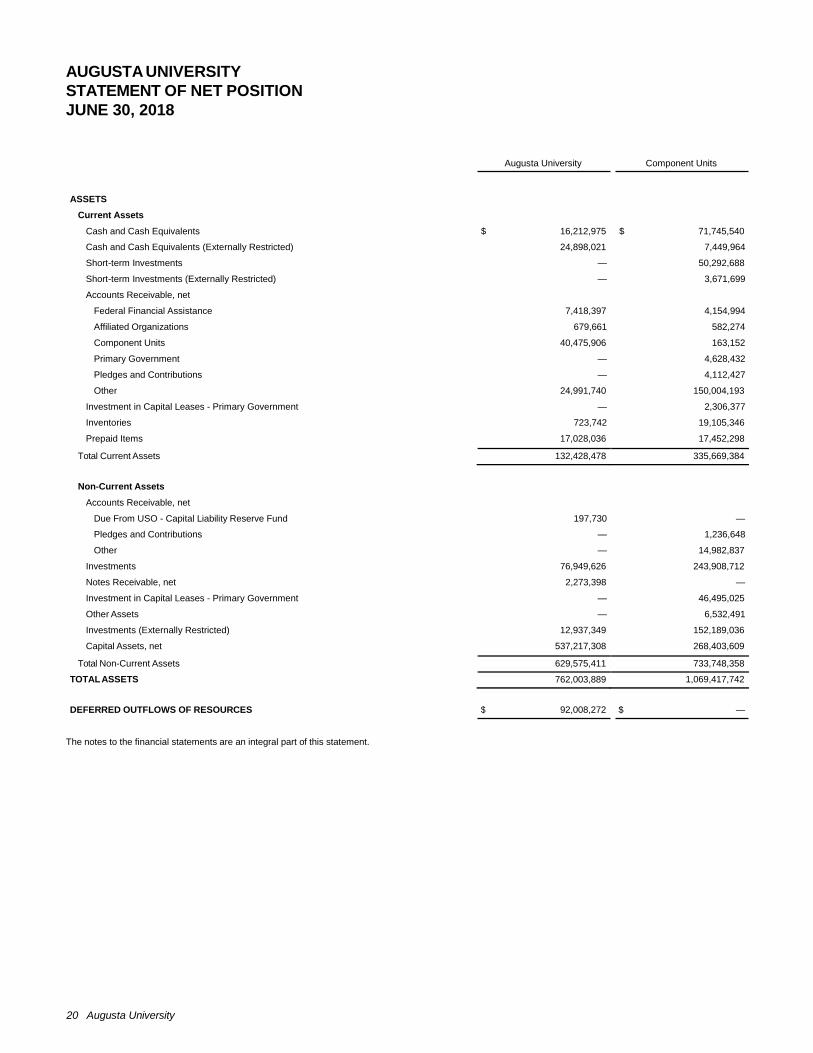
AUGUSTA UNIVERSITY
STATEMENT OF NET POSITION
JUNE 30, 2018
Augusta University Component Units
ASSETS
Current Assets
Cash and Cash Equivalents $ 16,212,975 $ 71,745,540
Cash and Cash Equivalents (Externally Restricted) 24,898,021 7,449,964
Short-term Investments — 50,292,688
Short-term Investments (Externally Restricted) — 3,671,699
Accounts Receivable, net Federal Financial Assistance 7,418,397 4,154,994
Affiliated Organizations 679,661 582,274
Component Units 40,475,906 163,152
Primary Government — 4,628,432
Pledges and Contributions — 4,112,427
Other 24,991,740 150,004,193
Investment in Capital Leases - Primary Government — 2,306,377
Inventories 723,742 19,105,346
Prepaid Items 17,028,036 17,452,298
Total Current Assets 132,428,478 335,669,384
Non-Current Assets
Accounts Receivable, net
Due From USO - Capital Liability Reserve Fund 197,730 —
Pledges and Contributions — 1,236,648
Other — 14,982,837
Investments 76,949,626 243,908,712
Notes Receivable, net 2,273,398 —
Investment in Capital Leases - Primary Government — 46,495,025
Other Assets — 6,532,491
Investments (Externally Restricted) 12,937,349 152,189,036
Capital Assets, net 537,217,308 268,403,609
Total Non-Current Assets 629,575,411 733,748,358
TOTAL ASSETS 762,003,889 1,069,417,742
DEFERRED OUTFLOWS OF RESOURCES $ 92,008,272 $ —
The notes to the financial statements are an integral part of this statement.
2018 Annual Financial Report 21
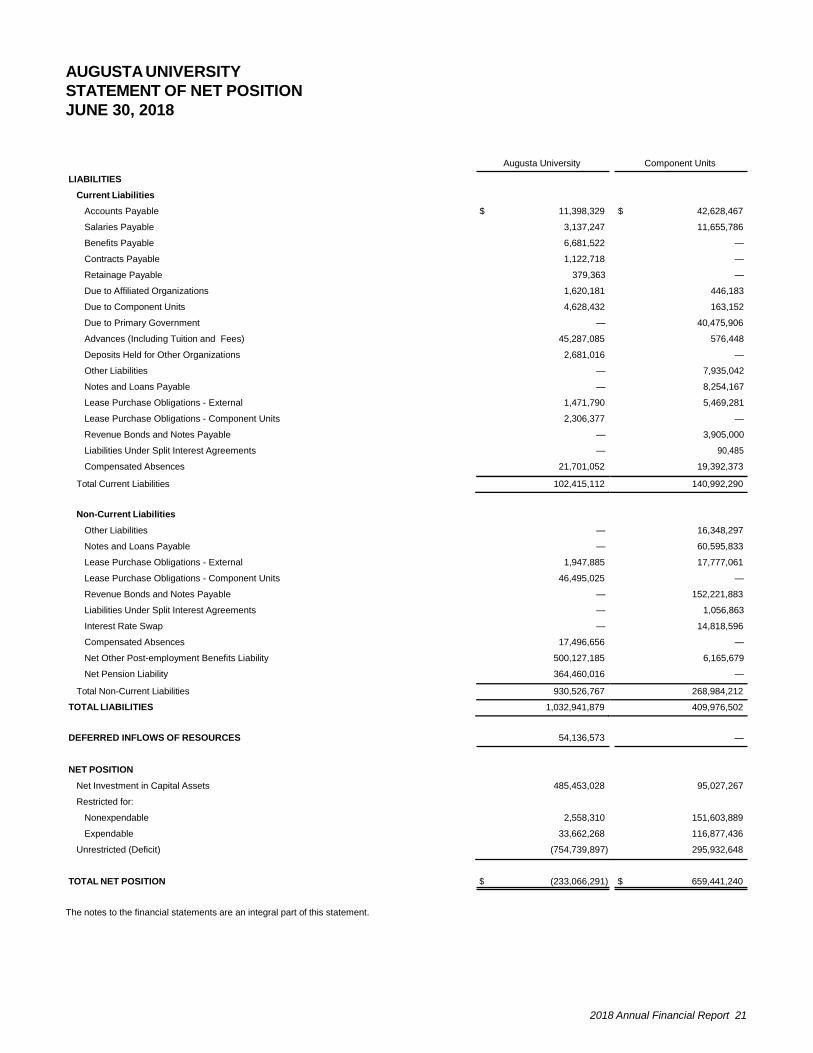
AUGUSTA UNIVERSITY
STATEMENT OF NET POSITION
JUNE 30, 2018
LIABILITIES
Current Liabilities
Augusta University Component Units
Accounts Payable $ 11,398,329 $ 42,628,467
Salaries Payable 3,137,247 11,655,786
Benefits Payable 6,681,522 —
Contracts Payable 1,122,718 —
Retainage Payable 379,363 —
Due to Affiliated Organizations 1,620,181 446,183
Due to Component Units 4,628,432 163,152
Due to Primary Government — 40,475,906
Advances (Including Tuition and Fees) 45,287,085 576,448
Deposits Held for Other Organizations 2,681,016 —
Other Liabilities — 7,935,042
Notes and Loans Payable — 8,254,167
Lease Purchase Obligations - External 1,471,790 5,469,281
Lease Purchase Obligations - Component Units 2,306,377 —
Revenue Bonds and Notes Payable — 3,905,000
Liabilities Under Split Interest Agreements — 90,485
Compensated Absences 21,701,052 19,392,373
Total Current Liabilities 102,415,112 140,992,290
Non-Current Liabilities
Other Liabilities — 16,348,297
Notes and Loans Payable — 60,595,833
Lease Purchase Obligations - External 1,947,885 17,777,061
Lease Purchase Obligations - Component Units 46,495,025 —
Revenue Bonds and Notes Payable — 152,221,883
Liabilities Under Split Interest Agreements — 1,056,863
Interest Rate Swap — 14,818,596
Compensated Absences 17,496,656 —
Net Other Post-employment Benefits Liability 500,127,185 6,165,679
Net Pension Liability 364,460,016 —
Total Non-Current Liabilities 930,526,767 268,984,212
TOTAL LIABILITIES 1,032,941,879 409,976,502
DEFERRED INFLOWS OF RESOURCES 54,136,573 —
NET POSITION
Net Investment in Capital Assets 485,453,028 95,027,267
Restricted for: Nonexpendable 2,558,310 151,603,889
Expendable 33,662,268 116,877,436
Unrestricted (Deficit) (754,739,897) 295,932,648
TOTAL NET POSITION $ (233,066,291) $ 659,441,240
The notes to the financial statements are an integral part of this statement.

22 Augusta University
AUGUSTA UNIVERSITY
STATEMENT OF REVENUES, EXPENSES AND CHANGES IN NET POSITION
FOR FISCAL YEAR ENDED JUNE 30, 2018
OPERATING REVENUES
Augusta University Component Units
Student Tuition and Fees (net) $ 93,857,633 $ —
Grants and Contracts Federal 56,886,393 55,251,659
State 249,251,459 —
Other 194,971,205 11,978,885
Sales and Services 9,949,193 818,972,282
Rents and Royalties 351,580 1,578,802
Auxiliary Enterprises Residence Halls 3,885,170 —
Bookstore 1,571,511 —
Food Services 1,747,076 2,051,622
Parking/Transportation 3,224,433 —
Health Services 2,624,941 —
Intercollegiate Athletics 3,152,835 —
Other Organizations 4,321,021 —
Gifts and Contributions — 6,721,313
Endowment Income — 912,577
Other Operating Revenues 255,719 4,616,266
Total Operating Revenues 626,050,169 902,083,406
OPERATING EXPENSES
Faculty Salaries 185,168,284 —
Staff Salaries 259,122,629 278,915,823
Employee Benefits 159,263,285 34,257,958
Other Personal Services 529,034 145,013,569
Travel 4,289,898 2,998,121
Scholarships and Fellowships 9,498,208 4,847,545
Utilities 11,999,032 4,427,680
Supplies and Other Services 227,836,534 385,660,256
Depreciation 28,110,779 36,238,771
Total Operating Expenses 885,817,683 892,359,723
Operating Income (Loss) $ (259,767,514) $ 9,723,683
The notes to the financial statements are an integral part of this statement.

2018 Annual Financial Report 23
AUGUSTA UNIVERSITY
STATEMENT OF REVENUES, EXPENSES AND CHANGES IN NET POSITION
FOR FISCAL YEAR ENDED JUNE 30, 2018
NONOPERATING REVENUES (EXPENSES)
Augusta University Component Units
State Appropriations $ 225,140,575 $ 29,932,138
Grants and Contracts Federal 10,160,620 3,083,581
State — 3,227,028
Other 10,138,215 —
Gifts 14,605,305 —
Investment Income 1,973,790 33,225,036
Interest Expense (2,015,506) (9,401,563)
Other Nonoperating Revenues (Expenses) (3,049,805) (7,404,760)
Net Nonoperating Revenues 256,953,194 52,661,460
Income (Loss) Before Other Revenues, Expenses, Gains, or Losses (2,814,320) 62,385,143
Capital Grants and Gifts
State 31,495,205 —
Other 20,000 (185,163)
Additions to Permanent and Term Endowments — 2,610,254
Total Other Revenues, Expenses, Gains or Losses
31,515,205
2,425,091
Change in Net Position
28,700,885
64,810,234
Net Position, Beginning of Year, As Originally Reported
230,731,910
628,244,114
Prior Year Adjustments (492,499,086) (33,613,108)
Net Position, Beginning of Year, Restated (261,767,176) 594,631,006
Net Position, End of Year
$ (233,066,291)
$ 659,441,240
The notes to the financial statements are an integral part of this statement.

24 Augusta University
AUGUSTA UNIVERSITY
STATEMENT OF CASH FLOWS
FOR FISCAL YEAR ENDED JUNE 30, 2018
Augusta University
CASH FLOWS FROM OPERATING ACTIVITIES Payments from Customers $ 122,703,269
Grants and Contracts (Exchange) 514,972,195
Payments to Suppliers (390,311,164)
Payments to Employees (444,055,019)
Payments for Scholarships and Fellowships (9,498,208)
Loans Issued to Students (345,078)
Collection of Loans from Students 758,605
Net Cash Used by Operating Activities (205,775,400)
CASH FLOWS FROM NON-CAPITAL FINANCING ACTIVITIES
State Appropriations 225,140,575
Agency Funds Transactions - Receipts 153,337,258
Agency Funds Transactions - Disbursements (155,230,999)
Gifts and Grants Received for Other Than Capital Purposes 28,265,925
Net Cash Flows Provided by Non-Capital Financing Activities 251,512,759
CASH FLOWS FROM CAPITAL AND RELATED FINANCING ACTIVITIES
Capital Gifts and Grants Received 4,998,335
Proceeds from Sale of Capital Assets 48,753
Purchases of Capital Assets (14,052,579)
Principal Paid on Capital Debt and Leases (3,670,912)
Interest Paid on Capital Debt and Leases (1,897,397)
Net Cash Used by Capital and Related Financing Activities (14,573,800)
CASH FLOWS FROM INVESTING ACTIVITIES
Proceeds from Sales and Maturities of Investments
1,021,011
Investment Income 2,388,426
Purchase of Investments (6,520,900)
Net Cash Used by Investing Activities (3,111,463)
Net Increase in Cash and Cash Equivalents
28,052,096
Cash and Cash Equivalents, Beginning of Year 13,058,900
Cash and Cash Equivalents, End of Year
$ 41,110,996
The notes to the financial statements are an integral part of this statement.

2018 Annual Financial Report 25
AUGUSTA UNIVERSITY
STATEMENT OF CASH FLOWS
FOR FISCAL YEAR ENDED JUNE 30, 2018
Augusta University
RECONCILIATION OF OPERATING LOSS TO NET CASH USED BY OPERATING ACTIVITIES:
Operating Loss $ (259,767,514)
Adjustments to Reconcile Net Operating Loss to Net Cash Used by Operating Activities
Depreciation 28,110,779
Change in Assets and Liabilities: Receivables, net 15,197,866
Inventories 119,916
Prepaid Items (3,888,190)
Notes Receivable, Net 413,527
Accounts Payable 3,879,998
Salaries Payable 20,412
Benefits Payable 4,290,255
Contracts Payable (479,911)
Advances (Including Tuition and Fees) (3,572,571)
Compensated Absences 215,482
Due to Affiliated Organizations 633,085
Net Pension Liability (41,448,433)
Other Post-Employment Benefit Liability (4,174,710)
Change in Deferred Inflows/Outflows of Resources:
Deferred Inflows of Resources 40,091,860
Deferred Outflows of Resources 14,582,749
Net Cash Used by Operating Activities $ (205,775,400)
NON-CASH INVESTING, NON-CAPITAL FINANCING, AND CAPITAL AND
RELATED FINANCING TRANSACTIONS
Non-Capital Financing Activities Accounts Receivable, Net of Allowances $ 6,638,215
Gift of Capital Assets $ 26,516,870
Loss on Disposal of Capital Assets $ 3,063,612
Accrual of Capital Asset Related Payables $ 1,385,872
Capital Assets Acquired by Incurring Capital Lease Obligations $ 365,788
Amortization of Deferred Gain/Loss of Capital Debt Refunded $ 118,109
Unrealized Gain/Loss on Investments $ 414,636
The notes to the financial statements are an integral part of this statement.
26 Augusta University
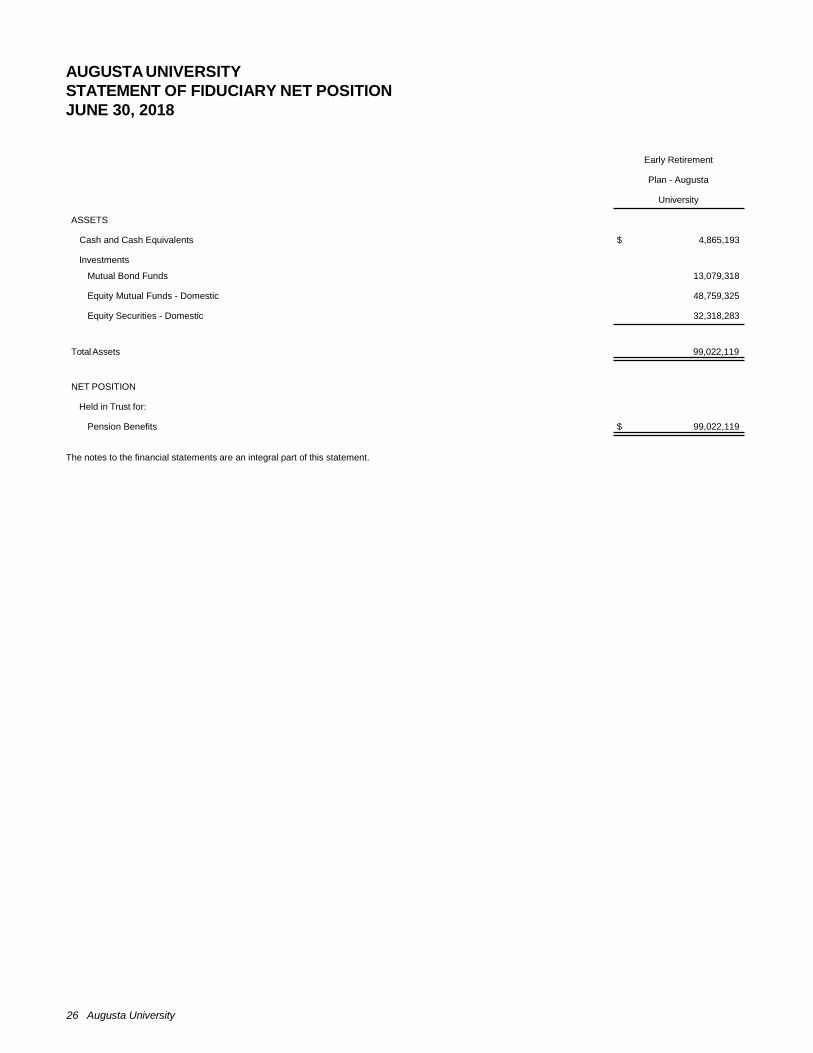
AUGUSTA UNIVERSITY
STATEMENT OF FIDUCIARY NET POSITION
JUNE 30, 2018
Early Retirement
Plan - Augusta
University
ASSETS
Cash and Cash Equivalents $ 4,865,193
Investments
Mutual Bond Funds 13,079,318
Equity Mutual Funds - Domestic 48,759,325
Equity Securities - Domestic 32,318,283
Total Assets 99,022,119
NET POSITION
Held in Trust for:
Pension Benefits $ 99,022,119
The notes to the financial statements are an integral part of this statement.
2018 Annual Financial Report 27
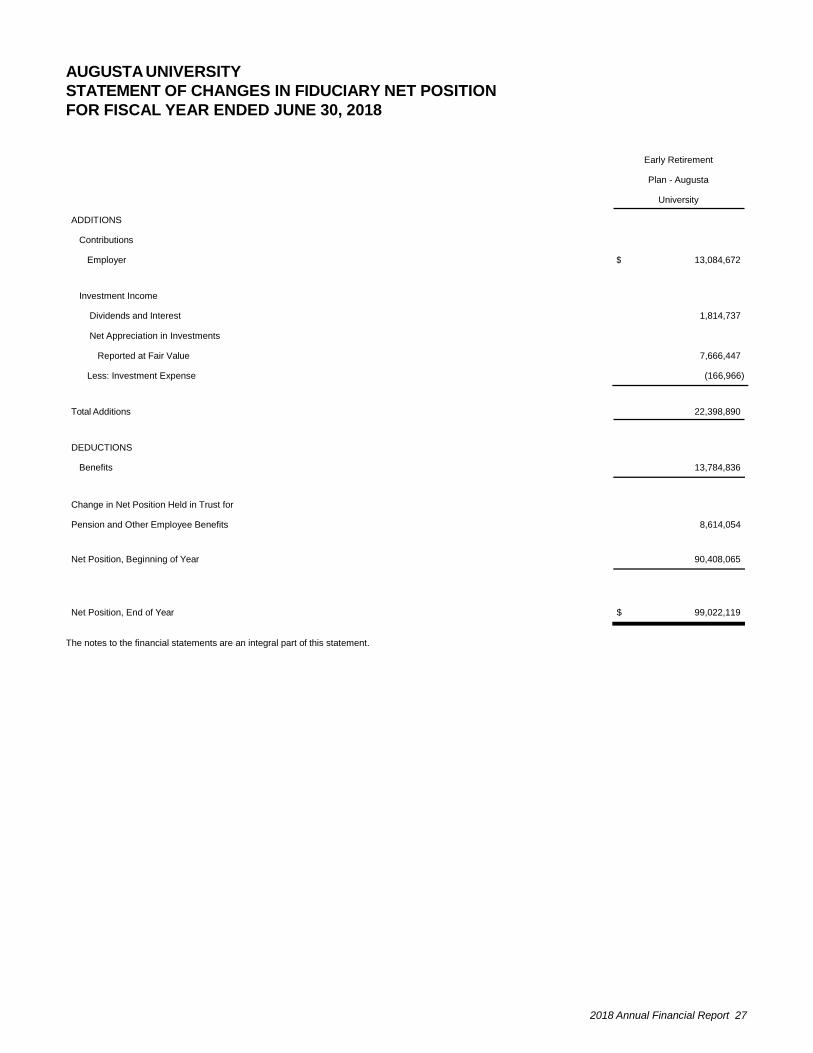
AUGUSTA UNIVERSITY
STATEMENT OF CHANGES IN FIDUCIARY NET POSITION
FOR FISCAL YEAR ENDED JUNE 30, 2018
Early Retirement
Plan - Augusta
University
ADDITIONS
Contributions
Employer $ 13,084,672
Investment Income
Dividends and Interest 1,814,737
Net Appreciation in Investments
Reported at Fair Value 7,666,447
Less: Investment Expense (166,966)
Total Additions 22,398,890
DEDUCTIONS
Benefits 13,784,836
Change in Net Position Held in Trust for
Pension and Other Employee Benefits
8,614,054
Net Position, Beginning of Year
90,408,065
Net Position, End of Year
$ 99,022,119
The notes to the financial statements are an integral part of this statement.

28 Augusta University
AUGUSTA UNIVERSITY
COMBINING STATEMENT OF NET POSITION
COMPONENT UNITS
JUNE 30, 2018
AU Health
Systems, Inc.
Augusta University
Foundation, Inc.
Augusta University Research
Institute, Inc.
Georgia Health Sciences
Foundation, Inc.
Medical College of Georgia
Foundation, Inc. Total
ASSETS
Current Assets
Cash and Cash Equivalents $ 62,015,768 $ 3,599,289 $ 4,381,937 $ 323,160 $ 1,425,386 $ 71,745,540
Cash and Cash Equivalents (Externally Restricted) 4,196,045 3,253,919 — — 7,449,964
Short-term Investments 37,961,738 1,482,318 10,848,632 — 50,292,688
Short-term Investments (Externally
Restricted) 3,671,699 — — — 3,671,699
Accounts Receivable, net
Federal Financial Assistance — 4,154,994 — — 4,154,994
Affiliated Organizations 138,785 443,489 — — 582,274
Component Units — 163,152 — 163,152
Primary Government 4,620,932 — 7,500 — — 4,628,432
Pledges and Contributions 156,166 3,358,852 597,409 4,112,427
Other 149,885,409 52,991 65,793 — 150,004,193
Investment in Capital Leases - Primary
Government 1,186,728 1,119,649 — — 2,306,377
Inventories 19,105,346 — — — 19,105,346
Prepaid Items 17,410,195 — 42,103 — 17,452,298
Total Current Assets 300,192,645 10,107,821 8,544,431 14,801,692 2,022,795 335,669,384
Non-Current Assets
Accounts Receivable, net
Pledges and Contributions 166,876 137,670 932,102 1,236,648
Other 14,966,249 — — 16,588 14,982,837
Investments 108,259,000 8,065,133 4,198,751 2,491,483 120,894,345 243,908,712
Investment in Capital Leases - Primary
Government 22,519,524 23,975,501 — — 46,495,025
Other Assets 5,518,129 749,766 — 264,596 6,532,491
Investments (Externally Restricted) 20,046,067 2,513,812 129,629,157 152,189,036
Capital Assets, net 256,138,375 — 2,330,775 9,934,459 268,403,609
Total Non-Current Assets 407,401,277 53,003,343 4,198,751 7,473,740 261,671,247 733,748,358
TOTAL ASSETS $ 707,593,922 $ 63,111,164 $ 12,743,182 $ 22,275,432 $ 263,694,042 $ 1,069,417,742
The notes to the financial statements are an integral part of this statement.
2018 Annual Financial Report 29
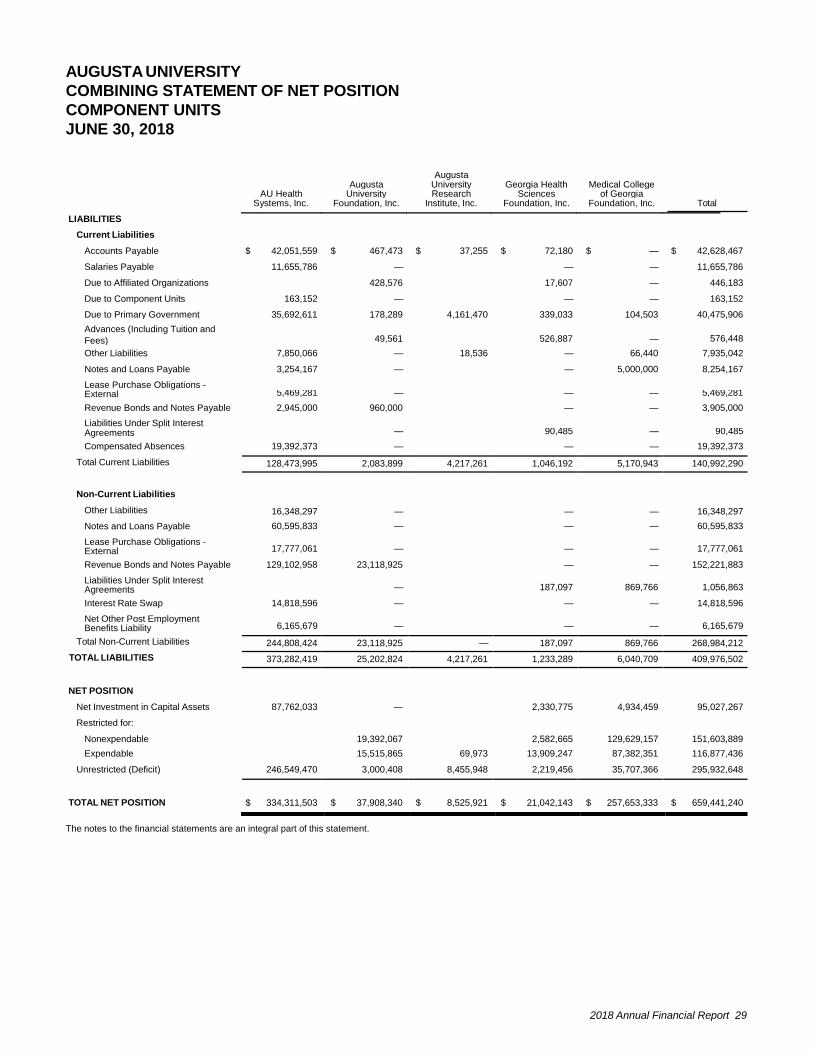
AUGUSTA UNIVERSITY
COMBINING STATEMENT OF NET POSITION
COMPONENT UNITS
JUNE 30, 2018
Augusta Augusta University Georgia Health Medical College AU Health University Research Sciences of Georgia Systems, Inc. Foundation, Inc. Institute, Inc. Foundation, Inc. Foundation, Inc. Total
LIABILITIES
Current Liabilities
Accounts Payable $ 42,051,559 $ 467,473 $ 37,255 $ 72,180 $ — $ 42,628,467
Salaries Payable 11,655,786 — — — 11,655,786
Due to Affiliated Organizations 428,576 17,607 — 446,183
Due to Component Units 163,152 — — — 163,152
Due to Primary Government 35,692,611 178,289 4,161,470 339,033 104,503 40,475,906
Advances (Including Tuition and Fees) 49,561 526,887 — 576,448
Other Liabilities 7,850,066 — 18,536 — 66,440 7,935,042
Notes and Loans Payable 3,254,167 — — 5,000,000 8,254,167
Lease Purchase Obligations - External
Revenue Bonds and Notes Payable
Liabilities Under Split Interest
The notes to the financial statements are an integral part of this statement.
5,469,281 — — — 5,469,281
2,945,000 960,000 — — 3,905,000
Agreements
Compensated Absences
Total Current Liabilities
Non-Current Liabilities
Other Liabilities
Notes and Loans Payable
Lease Purchase Obligations - External
Revenue Bonds and Notes Payable
Liabilities Under Split Interest Agreements
Interest Rate Swap
Net Other Post Employment Benefits Liability
Total Non-Current Liabilities
TOTAL LIABILITIES
—
90,485 — 90,485
19,392,373 — — — 19,392,373
128,473,995 2,083,899 4,217,261 1,046,192 5,170,943 140,992,290
16,348,297
—
—
—
16,348,297
60,595,833 — — — 60,595,833
17,777,061 — — — 17,777,061
129,102,958 23,118,925 — — 152,221,883
— 187,097 869,766 1,056,863
14,818,596 — — — 14,818,596
6,165,679 — — — 6,165,679
244,808,424 23,118,925 — 187,097 869,766 268,984,212
373,282,419 25,202,824 4,217,261 1,233,289 6,040,709 409,976,502
NET POSITION
Net Investment in Capital Assets
Restricted for:
Nonexpendable
87,762,033
—
19,392,067
2,330,775
2,582,665
4,934,459
129,629,157
95,027,267
151,603,889
Expendable 15,515,865 69,973 13,909,247 87,382,351 116,877,436
Unrestricted (Deficit) 246,549,470 3,000,408 8,455,948 2,219,456 35,707,366 295,932,648
TOTAL NET POSITION
$ 334,311,503
$ 37,908,340
$ 8,525,921
$ 21,042,143
$ 257,653,333
$ 659,441,240
30 Augusta University
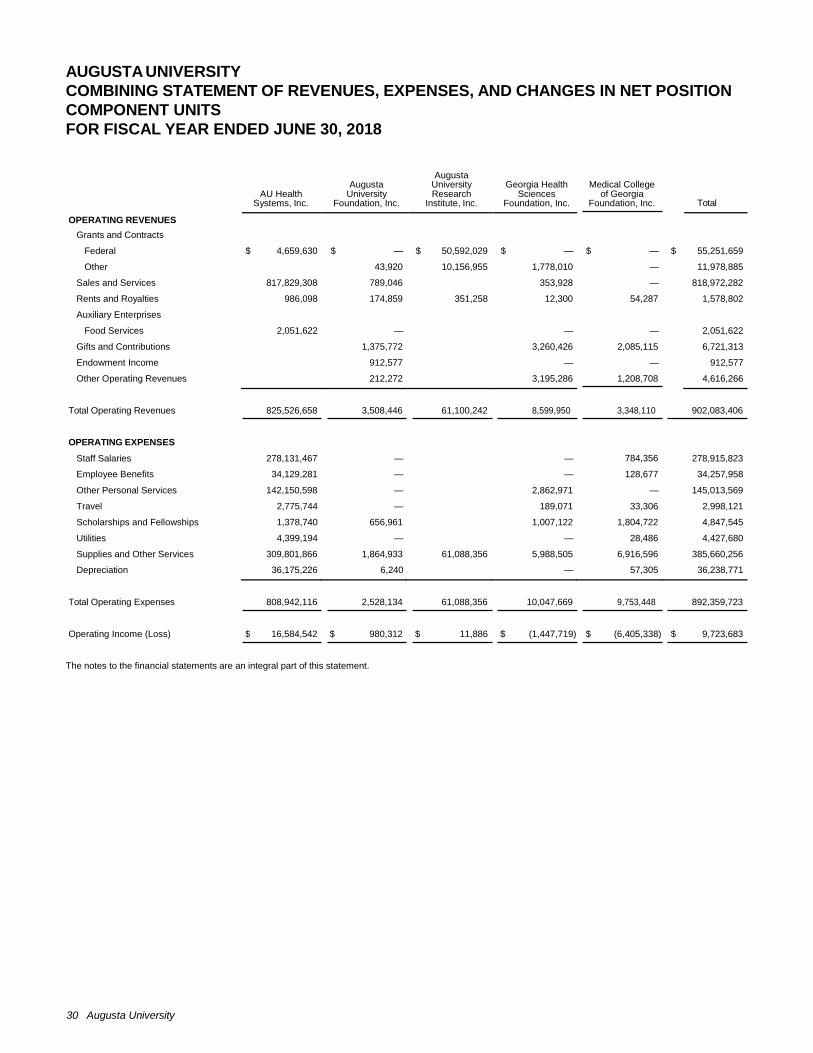
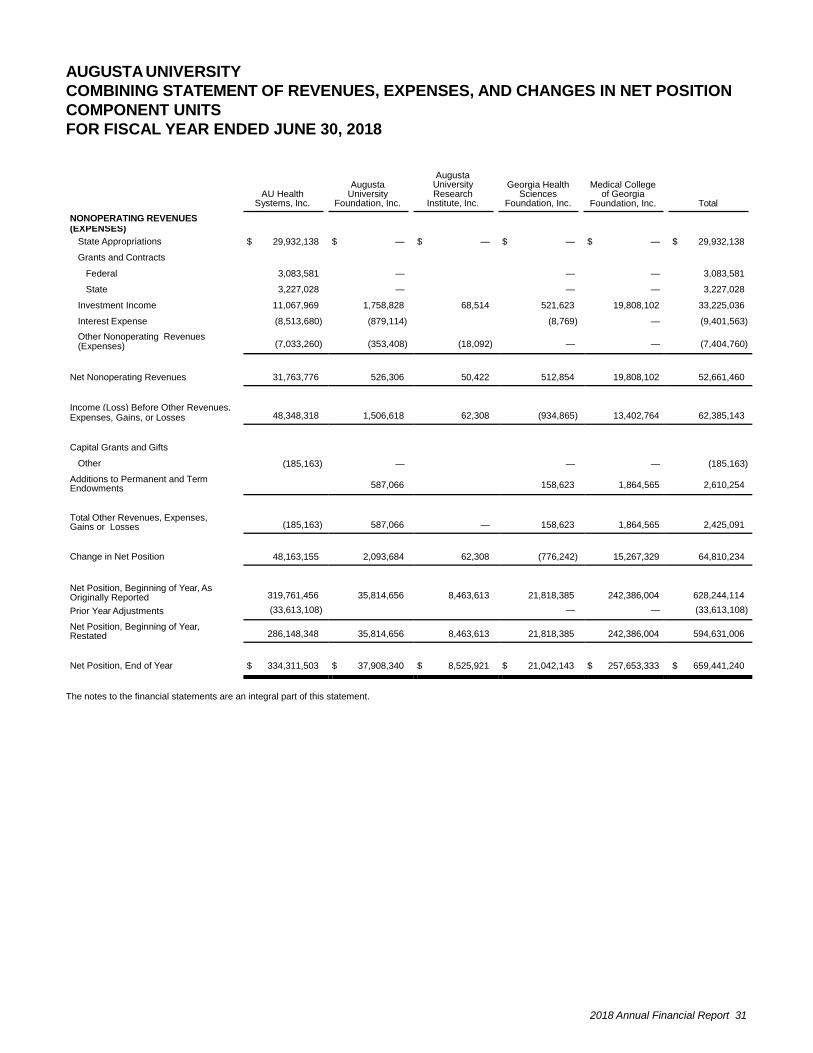
AUGUSTA UNIVERSITY
COMBINING STATEMENT OF REVENUES, EXPENSES, AND CHANGES IN NET POSITION
COMPONENT UNITS
FOR FISCAL YEAR ENDED JUNE 30, 2018
AU Health
Systems, Inc.
Augusta
University Foundation, Inc.
Augusta University Research
Institute, Inc.
Georgia Health
Sciences Foundation, Inc.
Medical College
of Georgia Foundation, Inc.
Total
OPERATING REVENUES Grants and Contracts
Federal $ 4,659,630 $ — $ 50,592,029 $ — $ — $ 55,251,659
Other 43,920 10,156,955 1,778,010 — 11,978,885
Sales and Services 817,829,308 789,046 353,928 — 818,972,282
Rents and Royalties 986,098 174,859 351,258 12,300 54,287 1,578,802
Auxiliary Enterprises Food Services 2,051,622 — — — 2,051,622
Gifts and Contributions 1,375,772 3,260,426 2,085,115 6,721,313
Endowment Income 912,577 — — 912,577
Other Operating Revenues 212,272 3,195,286 1,208,708 4,616,266
Total Operating Revenues 825,526,658 3,508,446 61,100,242 8,599,950 3,348,110 902,083,406
OPERATING EXPENSES
Staff Salaries 278,131,467 — — 784,356 278,915,823
Employee Benefits 34,129,281 — — 128,677 34,257,958
Other Personal Services 142,150,598 — 2,862,971 — 145,013,569
Travel 2,775,744 — 189,071 33,306 2,998,121
Scholarships and Fellowships 1,378,740 656,961 1,007,122 1,804,722 4,847,545
Utilities 4,399,194 — — 28,486 4,427,680
Supplies and Other Services 309,801,866 1,864,933 61,088,356 5,988,505 6,916,596 385,660,256
Depreciation 36,175,226 6,240 — 57,305 36,238,771
Total Operating Expenses 808,942,116 2,528,134 61,088,356 10,047,669 9,753,448 892,359,723
Operating Income (Loss) $ 16,584,542 $ 980,312 $ 11,886 $ (1,447,719) $ (6,405,338) $ 9,723,683
The notes to the financial statements are an integral part of this statement.
2018 Annual Financial Report 31
AUGUSTA UNIVERSITY
COMBINING STATEMENT OF REVENUES, EXPENSES, AND CHANGES IN NET POSITION
COMPONENT UNITS
FOR FISCAL YEAR ENDED JUNE 30, 2018
NONOPERATING REVENUES
AU Health
Systems, Inc.
Augusta University
Foundation, Inc.
Augusta University Research
Institute, Inc.
Georgia Health Sciences
Foundation, Inc.
Medical College of Georgia
Foundation, Inc. Total
Grants and Contracts
The notes to the financial statements are an integral part of this statement.
(EXPENSES)
State Appropriations
$ 29,932,138
$ —
$ —
$ —
$ —
$ 29,932,138
Federal
3,083,581
—
—
—
3,083,581
State 3,227,028 — — — 3,227,028
Investment Income 11,067,969 1,758,828 68,514 521,623 19,808,102 33,225,036
Interest Expense (8,513,680) (879,114) (8,769) — (9,401,563)
Other Nonoperating Revenues (Expenses) (7,033,260) (353,408) (18,092) — — (7,404,760)
Net Nonoperating Revenues
31,763,776
526,306
50,422
512,854
19,808,102
52,661,460
Income (Loss) Before Other Revenues,
Expenses, Gains, or Losses
Capital Grants and Gifts
Other
Additions to Permanent and Term Endowments
Total Other Revenues, Expenses, Gains or Losses
Change in Net Position
Net Position, Beginning of Year, As Originally Reported
Prior Year Adjustments
Net Position, Beginning of Year, Restated
Net Position, End of Year
48,348,318 1,506,618 62,308 (934,865) 13,402,764 62,385,143
(185,163)
—
—
—
(185,163)
587,066 158,623 1,864,565 2,610,254
(185,163)
587,066
—
158,623
1,864,565
2,425,091
48,163,155
2,093,684
62,308
(776,242)
15,267,329
64,810,234
319,761,456
35,814,656
8,463,613
21,818,385
242,386,004
628,244,114
(33,613,108) — — (33,613,108)
286,148,348 35,814,656 8,463,613 21,818,385 242,386,004 594,631,006
$ 334,311,503
$ 37,908,340
$ 8,525,921
$ 21,042,143
$ 257,653,333
$ 659,441,240

32 Augusta University
Notes to the Financial
Statements

2018 Annual Financial Report 33
AUGUSTA UNIVERSITY
NOTES TO THE FINANCIAL STATEMENTS
JUNE 30, 2018
Note 1 Summary of Significant Accounting Policies Nature of Operations
The Augusta University (University) serves the state and national communities by providing its students with academic
instruction that advances fundamental knowledge and by disseminating knowledge to the people of Georgia, the nation,
and throughout the world.
Reporting Entity
As defined by Official Code of Georgia Annotated (O.C.G.A) § 20-3-50, the University is part of the University System
of Georgia (USG), an organizational unit of the State of Georgia (the State) under the governance of the Board of
Regents (Board). The Board has constitutional authority to govern, control, and manage the USG. The Board is
composed of 19 members, one member from each congressional district in the State and five additional members from
the state-at-large, appointed by the Governor and confirmed by the Senate. Members of the Board serve a seven year
term, and members may be reappointed to subsequent terms by a sitting governor.
The University does not have the right to sue/be sued without recourse to the State. The University’s property is the
property of the State and subject to all the limitations and restrictions imposed upon other property of the State by the
Constitution and laws of the State. In addition, the University is not legally separate from the State. Accordingly, the
University is included within the State’s basic financial statements as part of the primary government as defined in
section 2100 of the Governmental Accounting Standards Board (GASB) Codification of Governmental Accounting and
Financial Reporting Standards.
The accompanying basic financial statements are intended to supplement the State’s Comprehensive Annual Financial
Report (CAFR) by presenting the financial position and changes in financial position and cash flows of only that portion
of the business-type activities of the State that is attributable to the transactions of the University. In addition, certain
discretely presented component units of the State, as discussed below, have been included since they have been
determined to be essential to the fair presentation to these departmental financial statements. These financial
statements do not purport to, and do not, present fairly the financial position of the State as of June 30, 2018, the
changes in its financial position or its cash flows for the year then ended, in conformity with accounting principles
generally accepted in the United States of America.
The accompanying basic financial statements should be read in conjunction with the State’s CAFR. The most recent
State of Georgia CAFR can be obtained through the State Accounting Office, 200 Piedmont Avenue, Suite 1604 (West
Tower), Atlanta, Georgia 30334 or online at sao.georgia.gov/comprehensive-annual-financial-reports.
Discretely Presented Component Units
The below organizations are legally separate, tax-exempt component units of the State. Although the State (primary
government) is not fiscally accountable for these entities, it has been determined that the nature and significance of
the relationship between the primary government and the below organizations is such that exclusion from these
departmental financial statements would render them misleading. The below organizations met the requirements for
discrete presentation as defined by GASB Codification Sections 2100 and 2600. Each of the below organization’s
fiscal year ends on June 30 each year. Separately issued financial statements are available from the following
addresses.
• Augusta University Foundation, Inc. 1120 15th Street, FI-1049, Augusta, GA, 30912
• Augusta University Research Institute, Inc. 1120 15th Street, AA 311, Richmond, Augusta, GA, 30912
• AU Health Systems, Inc. 1120 15th Street. FY139, Augusta, GA 30912
34 Augusta University
• Georgia Health Sciences Foundation, Inc., 1120 15th Street, Augusta, Georgia 30912
• Medical College of Georgia Foundation, 545 15th Street, Augusta, GA 30901
See Component Unit Note for additional information related to discretely presented component units.
Basis of Accounting and Financial Statement Presentation
The financial statements have been prepared in accordance with generally accepted accounting principles (GAAP) as
prescribed by the GASB and are presented as required by these standards to provide a comprehensive, entity-wide
perspective of the University’s assets, deferred outflows, liabilities, deferred inflows, net position, revenues, expenses,
changes in net position, and cash flows.
The University’s business-type activities and fiduciary fund financial statements have been presented using the
economic resources measurement focus and the accrual basis of accounting. Under the accrual basis, revenues are
recognized when earned, and expenses are recorded when an obligation has been incurred. Grants and similar items
are recognized as revenues in the fiscal year in which eligibility requirements imposed by the provider have been met.
All significant intra-fund transactions have been eliminated.
The University reports the following Fiduciary Fund:
Pension Trust Fund -- Accounts for the activities of the Early Retirement Plan.
New Accounting Pronouncements
For fiscal year 2018, the University adopted GASB Statement No. 86, Certain Debt Extinguishment Issues. This
Statement addresses accounting and financial reporting issues regarding in-substance defeasance of debt. The
adoption of this Statement does not have a significant impact on the University’s financial statements.
For fiscal year 2018, the University adopted GASB Statement No. 85, Omnibus 2017. This Statement addresses
practice issues identified during implementation and application of certain other GASB Statements. This Statement
addresses a variety of topics including issues related to blending component units, goodwill, fair value measurement
and application, and postemployment benefits. The adoption of this Statement does not have a significant impact on
the University’s financial statements.
For fiscal year 2018, the University adopted GASB Statement No. 81, Irrevocable Split-Interest Agreements. The
objective of this Statement is to improve accounting and financial reporting for irrevocable split-interest agreements
by providing recognition and measurement guidance for situations in which a government is a beneficiary of the
agreement. The adoption of this Statement does not have a significant impact on the University’s financial statements.
For fiscal year 2018, the University adopted GASB Statement No. 75, Accounting and Financial Reporting for
Postemployment Benefits Other Than Pensions. This Statement replaces GASB Statements No. 45, Accounting and
Financial Reporting by Employers for Postemployment Benefits Other Than Pensions, as amended, and No. 57, OPEB
Measurements by Agent Employers and Agent Multiple-Employer Plans. The objective of this Statement is to improve
the usefulness of information about post employment benefits other than pensions. The adoption of this Statement
resulted in the accrual of the University's proportionate share of the net other post-employment benefit (OPEB) liability
for the Board of Regents Retiree Health Benefit Plan, changes to the related OPEB note disclosures, additional OPEB
required supplemental information, and the restatement of the July 1, 2017 net position balance.
Cash and Cash Equivalents
Cash and Cash Equivalents consist of petty cash, demand deposits and time deposits in authorized financial institutions,
and cash management pools that have the general characteristics of demand deposit accounts. Cash and Cash
Equivalents that cannot be used to pay current liabilities are classified as non-current assets in the Statement of Net
Position. Cash and Cash Equivalents restricted as to use by a third party are reported as externally restricted.
Investments
Investments include financial instruments with terms in excess of 13 months, certain other securities for the production
of revenue, land, and other real estate held as investments by endowments. The University accounts for its investments
at fair value. Changes in unrealized gain (loss) on the carrying value of investments are reported as a component of
investment income in the Statement of Revenues, Expenses, and Changes in Net Position. The Board of Regents

2018 Annual Financial Report 35
Diversified Fund is included as investments. Investments restricted as to use by a third party are reported as externally
restricted.
Investments that cannot be used to pay current liabilities are classified as non-current assets in the Statement of Net
Position.
Accounts Receivable
Accounts receivable consists of tuition and fees charged to students and auxiliary enterprise services provided to
students, faculty and staff, the majority of whom reside in the State of Georgia. Accounts receivable also includes
amounts due from federal, state and local governments, or private sources, in connection with reimbursement of
allowable expenditures made pursuant to the University’s grants and contracts. Accounts receivable are recorded net
of estimated uncollectible amounts.
Inventories
Consumable supplies are carried at the lower of cost or market on the first-in, first-out (“FIFO”) basis. Resale inventories
are valued at cost using the first-in, first-out basis.
Prepaid Items
Payments made to vendors and state and local government organizations for services that will benefit periods beyond
June 30, 2018 are recorded as prepaid items.
Capital Assets
Capital assets are recorded at cost at the date of acquisition, or acquisition value (entry price) at the date of donation
in the case of gifts. For equipment, the University’s capitalization policy includes all items with a unit cost of $5,000 or
more, and an estimated useful life of greater than one year. Renovations to buildings, infrastructure, and land
improvements that exceed $100,000 and/or significantly increase the value or extend the useful life of the structure
are capitalized. Routine repairs and maintenance are charged to operating expense in the year in which the expense
was incurred. Depreciation, which also includes amortization of intangible assets such as water, timber, and mineral
rights, easements, patents, trademarks, and copyrights, as well as software, is computed using the straight-line method
over the estimated useful lives of the assets, generally 40 to 60 years for buildings, 20 to 25 years for infrastructure
and land improvements, 10 years for library books, and 3 to 20 years for equipment. Residual values will generally be
10% of historical costs for infrastructure, buildings and building improvements, and facilities and other improvements.
To fully understand plant additions in the University, it is necessary to look at the activities of the Georgia State Financing
and Investment Commission (GSFIC) - an organization that is external to the System. GSFIC issues bonds for and
on behalf of the State of Georgia, pursuant to powers granted to it in the Constitution of the State of Georgia and the
Act creating the GSFIC. The bonds so issued constitute direct and general obligations of the State of Georgia, to the
payment of which the full faith, credit, and taxing power of the State are pledged.
For projects managed by GSFIC, GSFIC retains construction in progress in its accounting records throughout the
construction period and transfers the entire project to the institutional unit of the University System when complete.
For projects managed by institutions of the USG, the institutions retain construction in progress on their books and are
reimbursed by GSFIC.
Capital Liability Reserve Fund
The Capital Liability Reserve Fund (Fund) was established by the Board of Regents to protect the fiscal integrity of
the USG to maintain the strongest possible credit ratings associated with Public Private Venture (PPV) projects and
to ensure that the Board of Regents can effectively support its long-term capital lease obligations. All USG institutions
participating in the PPV program finance the Fund. The Fund serves as a pooled reserve that is managed by the Board
of Regents. The Fund shall only be used to address significant shortfalls and only insofar as a requesting USG institution
is unable to make the required PPV capital lease payment to the designated affiliated organization. The Fund will
continue as long as the Board of Regents has rental obligations under the PPV program and at the conclusion of the
program, funds will be returned to each institution. The $197,730 balance included on the University’s Statement of
Net Position as Due from USO - Capital Liability Reserve Fund represents the University’s contribution to the Fund.
Deferred Outflows of Resources
Deferred outflows of resources consist of the consumption of net position that is applicable to a future reporting period.
36 Augusta University
Advances
Advances include amounts received for tuition and fees and certain auxiliary activities prior to the end of the fiscal
year, but related to the subsequent accounting period. Advances also include amounts received from grant and contract
sponsors that have not yet been earned.
Deposits Held for Other Organizations
Deposits held for other organizations result primarily from the University acting as an agent or fiduciary, for another
entity. Deposits held for others include scholarships, fellowships, study abroad deposits, and other funds held for
various governments, companies, clubs, or individuals.
Compensated Absences
Employee vacation pay is accrued at the end of the fiscal year for financial statement purposes. The liability and
expense incurred are recorded at the end of the fiscal year as compensated absences in the Statement of Net Position,
and as a component of compensation and benefit expense in the Statement of Revenues, Expenses, and Changes
in Net Position.
Non-current Liabilities
Non-current liabilities include: (1) liabilities that will not be paid within the next fiscal year; (2) capital lease obligations
with contractual maturities greater than one year; and (3) other liabilities that, although payable within one year, are
to be paid from funds that are classified as non-current assets.
Deferred Inflows of Resources
Deferred inflows of resources consist of the acquisition of net position that is applicable to a future reporting period.
Other Post-Employment Benefits (OPEB)
The net OPEB liability represents the University's proportionate share of the difference between the total OPEB liability
and the fiduciary net position or the fair value of the plan assets as of a given measurement date.
For purposes of measuring the net OPEB liability, deferred outflows of resources and deferred inflows of resources
related to OPEB, and OPEB expense, information about the fiduciary net position of the Board of Regents Retiree
Health Benefit Plan (the Plan) and additions to/deductions from the Plan's fiduciary net position have been determined
on the same basis as they are reported by the Plan. For this purpose, the Plan recognizes benefit payments when due
and payable in accordance with the benefit terms. Investments are reported at fair value, except for money market
investments and participating interest-earning investment contracts that have a maturity at the time of purchase of one
year or less, which are reported at cost.
Pensions and Net Pension Liability
The net pension liability represents the University's proportionate share of the difference between the total pension
liability as a result of the exchange for employee services for compensation and the fiduciary net position or the fair
value of the plan assets as of a given measurement date.
For purposes of measuring the net pension liability, deferred outflows of resources and deferred inflows of resources
related to pensions, and pension expense, information about the pension plans' fiduciary net position, additions to/
deductions from the plans fiduciary net position have been determined on the same basis as they are reported by
Teachers Retirement System of Georgia and Employees’ Retirement System of Georgia. Information about the Early
Retirement Plan is based on the information provided by the plan actuary. For this purpose, benefit payments (including
refunds of employee contributions) are recognized when due and payable in accordance with the benefit terms.
Investments are reported at fair value.
Net Position
The University’s net position is classified as follows:
Net investment in capital assets represents the University’s total investment in capital assets, net of outstanding debt
obligations related to those capital assets. To the extent debt has been incurred but not yet expended for capital assets,
such amounts are not included as a component of net investment in capital assets. The term “debt obligations” as
used in this definition does not include debt of the GSFIC as discussed previously in Note 1 - Capital Assets section.

2018 Annual Financial Report 37
Restricted - non-expendable net position includes endowments and similar type funds in which donors or other outside
sources have stipulated, as a condition of the gift instrument, that the principal is to be maintained inviolate and in
perpetuity, and invested for the purpose of producing present and future income, which may either be expended or
added to principal. For institution-controlled, donor-restricted endowments, the by-laws of the Board of Regents of the
University System of Georgia permits each individual institution to use prudent judgment in the spending of current
realized and unrealized endowment appreciation. Donor-restricted endowment appreciation is periodically transferred
to restricted - expendable accounts for expenditure as specified by the purpose of the endowment. The University
maintains pertinent information related to each endowment fund including donor; amount and date of donation;
restrictions by the source of limitations; limitations on investments, etc.
Restricted - expendable net position includes resources in which the University is legally or contractually obligated to
spend resources in accordance with restrictions by external third parties.
Unrestricted net position represents resources derived from student tuition and fees, state appropriations, and sales
and services of educational departments, and auxiliary enterprises. These resources are used for transactions relating
to the educational and general operations of the University, and may be used at the discretion of the governing board
or management to meet current expenses for those purposes, except for unexpended state appropriations (surplus).
Unexpended state appropriations must be refunded to the Office of the State Treasurer. These resources also include
auxiliary enterprises, which are substantially self-supporting activities that provide services for students, faculty, and
staff.
When an expense is incurred that can be paid using either restricted or unrestricted resources, the University’s policy
is to first apply the expense towards unrestricted resources, and then towards restricted resources.
Income Taxes
The University, as a political subdivision of the State of Georgia, is excluded from Federal income taxes under Section
115(1) of the Internal Revenue Code, as amended.
Classification of Revenues and Expenses
The Statement of Revenues, Expenses, and Changes in Net Position classifies fiscal year activity as operating and
nonoperating according to the following criteria:
• Operating revenue includes activities that have the characteristics of exchange transactions, such as (1) student
tuition and fees, net of scholarship allowances, (2) certain federal, state, and local grants and contracts, and
(3) sales and services.
• Nonoperating revenue includes activities that have the characteristics of non-exchange transactions, such as
gifts and contributions, and other revenue sources that are defined as non-operating revenue by GASB
Statements No. 9, Reporting Cash Flows of Proprietary and Non-expendable Trust Funds and Governmental
Entities That Use Proprietary Fund Accounting, and No. 34, Basic Financial Statements—and Management's
Discussion and Analysis—for State and Local Governments, such as state appropriations and investment
income.
• Operating expense includes activities that have the characteristics of exchange transactions.
• Nonoperating expense includes activities that have the characteristics of non-exchange transactions, such as
capital financing costs and costs related to investment activity.
Scholarship Allowances
Scholarship allowances are the difference between the stated charge for goods and services provided by the University,
and the amount that is paid by students and/or third parties making payments on the students’ behalf. Certain
governmental grants, such as Pell grants, and other Federal, state, or nongovernmental programs are recorded as
either operating or non-operating revenues in the University’s financial statements. To the extent that revenues from
such programs are used to satisfy tuition, fees, and other student charges, the University has recorded contra revenue
for scholarship allowances. Tuition, fees, and other student charges reported on the Statement of Revenues, Expenses,
and Changes in Net Position are net of discounts and allowances of $16,587,800.

38 Augusta University
Restatement of Prior Year Net Position
The University made the following restatements:
Business-type
Activities
Discretely Presented
Component Units
Net position, beginning of year, as originally reported $ 230,731,910 $ 628,244,114
Changes in financial reporting entity — (442,108)
Changes in accounting principles (492,499,086) (33,171,000)
Net position, beginning of year, restated $ (261,767,176) $ 594,631,006
Changes in Financial Reporting Entity
During the year ended June 30, 2018, the Health System, AUMC, RWSH, and AUMA completed a series of corporate
and governance changes (the Reorganization) to better align the entities within the Health System and allow for efficient
and integrated funds flow and accounting. As a result of the Reorganization, AUMA became a blended component
unit of the Health System. Prior to the Reorganization, AUMA was a component unit of the University and AUMA's
financial position and operating results were not included in the Health System financial statements. In addition, as a
result of the Reorganization, AUMC and RWSH became blended component units of the Health System. Prior to the
Reorganization, AUMC and RWSH were discretely presented component units within the Health System's financial
statements. As part of the Reorganization, MCGH/PPG Reproductive Lab, LLC became a part of the integrated health
system. This was not included in the Health System statements in the prior year as it was a joint venture between
AUMC and AUMA and as such had a separate set of financial statements. The Health System has restated its financial
statements for this change in reporting entity in the amount of $442,108.
Changes in accounting principles
For fiscal year 2018, the University made a prior period adjustment due to the adoption of GASB Statement 75,
Accounting and Financial Reporting for Postemployment Benefits Other Than Pensions, which requires the restatement
of the June 30, 2017, net position. The result is a decrease in Net Position at July 1, 2017 of $492,499,086 of which
$504,301,895 is represented in Net Pension Liability and $11,802,809 is represented in deferred outflow. This change
is made in accordance with generally accepted accounting principles.
For fiscal year 2018, the Augusta University Health System adopted GASB Statement 75, Accounting and Financial
Reporting for Postemployment Benefits Other Than Pensions, which requires the restatement of the June 30, 2017,
net position. Since the Health System determined that it was not practical to restate the year ended June 30, 2017
for the effect of GASB Statement 75, the Health System recorded a $33,171,000 reduction to net position at June 30,
2017.
Note 2 Deposits and Investments Cash and cash equivalents and investments as of June 30, 2018 are classified in the accompanying statement of net
position as follows:
Cash and Cash Equivalents $ 21,078,168
Cash and Cash Equivalents (Externally Restricted) 24,898,021
Investments 94,156,926
Non Current - Investments 76,949,626
Noncurrent Investments (Externally Restricted) 12,937,349
$ 230,020,090
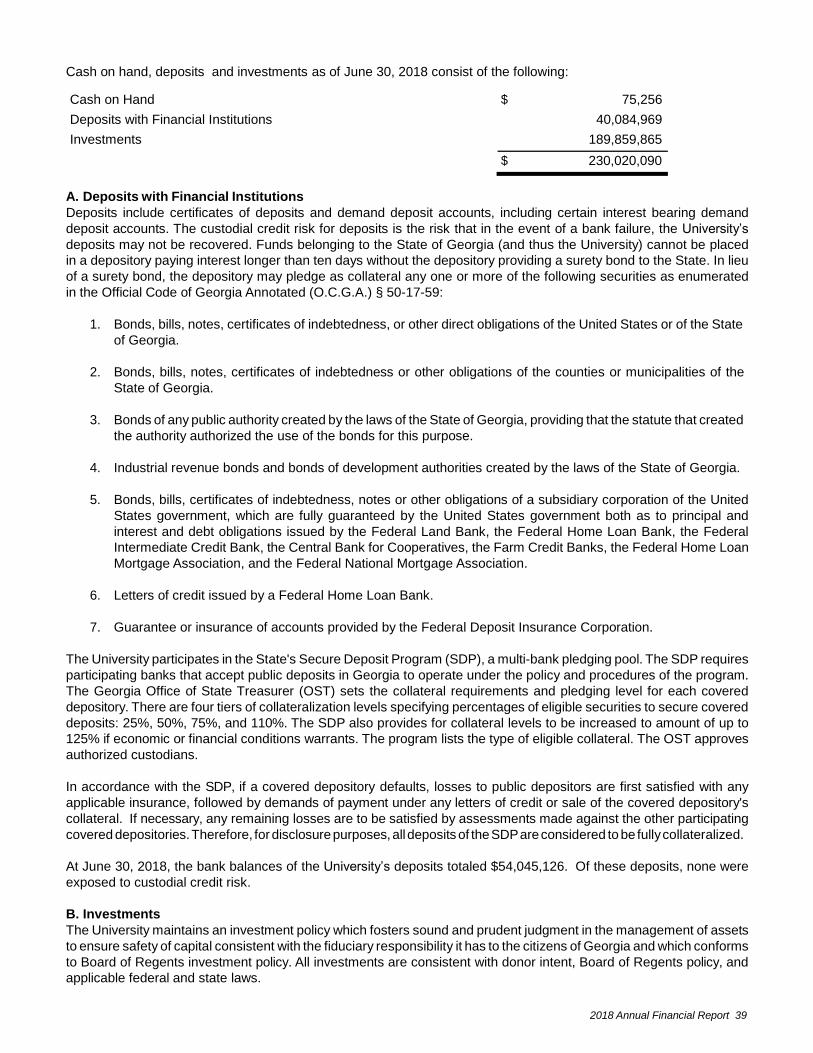
2018 Annual Financial Report 39
Cash on hand, deposits and investments as of June 30, 2018 consist of the following:
Cash on Hand $ 75,256
Deposits with Financial Institutions 40,084,969
Investments 189,859,865
$ 230,020,090
A. Deposits with Financial Institutions
Deposits include certificates of deposits and demand deposit accounts, including certain interest bearing demand
deposit accounts. The custodial credit risk for deposits is the risk that in the event of a bank failure, the University’s
deposits may not be recovered. Funds belonging to the State of Georgia (and thus the University) cannot be placed
in a depository paying interest longer than ten days without the depository providing a surety bond to the State. In lieu
of a surety bond, the depository may pledge as collateral any one or more of the following securities as enumerated
in the Official Code of Georgia Annotated (O.C.G.A.) § 50-17-59:
1. Bonds, bills, notes, certificates of indebtedness, or other direct obligations of the United States or of the State
of Georgia.
2. Bonds, bills, notes, certificates of indebtedness or other obligations of the counties or municipalities of the
State of Georgia.
3. Bonds of any public authority created by the laws of the State of Georgia, providing that the statute that created
the authority authorized the use of the bonds for this purpose.
4. Industrial revenue bonds and bonds of development authorities created by the laws of the State of Georgia.
5. Bonds, bills, certificates of indebtedness, notes or other obligations of a subsidiary corporation of the United
States government, which are fully guaranteed by the United States government both as to principal and
interest and debt obligations issued by the Federal Land Bank, the Federal Home Loan Bank, the Federal
Intermediate Credit Bank, the Central Bank for Cooperatives, the Farm Credit Banks, the Federal Home Loan
Mortgage Association, and the Federal National Mortgage Association.
6. Letters of credit issued by a Federal Home Loan Bank.
7. Guarantee or insurance of accounts provided by the Federal Deposit Insurance Corporation.
The University participates in the State's Secure Deposit Program (SDP), a multi-bank pledging pool. The SDP requires
participating banks that accept public deposits in Georgia to operate under the policy and procedures of the program.
The Georgia Office of State Treasurer (OST) sets the collateral requirements and pledging level for each covered
depository. There are four tiers of collateralization levels specifying percentages of eligible securities to secure covered
deposits: 25%, 50%, 75%, and 110%. The SDP also provides for collateral levels to be increased to amount of up to
125% if economic or financial conditions warrants. The program lists the type of eligible collateral. The OST approves
authorized custodians.
In accordance with the SDP, if a covered depository defaults, losses to public depositors are first satisfied with any
applicable insurance, followed by demands of payment under any letters of credit or sale of the covered depository's
collateral. If necessary, any remaining losses are to be satisfied by assessments made against the other participating
covered depositories. Therefore, for disclosure purposes, all deposits of the SDP are considered to be fully collateralized.
At June 30, 2018, the bank balances of the University’s deposits totaled $54,045,126. Of these deposits, none were
exposed to custodial credit risk.
B. Investments
The University maintains an investment policy which fosters sound and prudent judgment in the management of assets
to ensure safety of capital consistent with the fiduciary responsibility it has to the citizens of Georgia and which conforms
to Board of Regents investment policy. All investments are consistent with donor intent, Board of Regents policy, and
applicable federal and state laws.

40 Augusta University
GASB Statement No. 72, Fair Value Measurements and Application requires fair value measurement be classified and
disclosed in one of the following three categories (“Fair Value Hierarchy”):
Level 1 - Quoted prices are available in active markets for identical investments as of the reporting date.
Level 2 - Pricing inputs are observable for the investments, either directly or indirectly, as of the reporting date,
but are not the same as those used in Level 1; inputs include comparable market transactions, pricing of similar
instruments, values reported by the administrator, and pricing expectations based on internal modeling. Fair
value is determined through the use of models or other valuation methodologies.
Level 3 - Pricing inputs are unobservable for the investment and include situations where there is little, if any,
market activity for the investments.
The following table summarizes the valuation of the University’s investments measured at fair value on a recurring
basis and at net asset value as of June 30, 2018.
Fair Value Hierarchy
Fair Value Level 1 Level 2
Investment type:
Debt Securities
Other Investments
Equity Mutual Funds - Domestic 48,759,325 48,759,325 —
Equity Securities - Domestic 32,318,283 32,318,283 —
178,375,210 $ 103,918,553 $ 74,456,657
Investment Pools
Board of Regents
Diversified Fund 11,484,655
Total Investments $ 189,859,865
Investments classified in Level 1 are valued using prices quoted in active markets for those securities.
Investments classified in Level 2 are valued using a matrix pricing technique. Matrix pricing is used to value securities
based on the securities' relationship to benchmark quoted prices.
Board of Regents Pooled Investment Program
The USG serves as fiscal agent for various units of the University System of Georgia and affiliated organizations. The
USG pools the monies of these organizations with the USG's monies for investment purposes. The investment pool
is not registered with the U.S. Securities and Exchange Commission as an investment company. The fair value of the
investments is determined daily. The pool does not issue shares. Each participant is allocated a pro rata share of each
pooled investment fund balance at fair value along with a pro rata share of the pooled fund’s investment returns.
The USG maintains investment policy guidelines for each pooled investment fund that is offered to qualified University
System participants. These policies are intended to foster sound and prudent responsibility each institution has to the
citizens of Georgia and which conforms to the Board of Regents investment policy. All investments must be consistent
U.S. Treasuries $ 3,980,658 $ 3,980,658 $ —
U.S. Agencies Explicitly Guaranteed 22,480,006 — 22,480,006
Implicitly Guaranteed 34,360,318 2,735,392 31,624,926
Corporate Debt 20,351,725 — 20,351,725
Money Market Mutual Funds 3,045,577 3,045,577 —
Mutual Bond Funds 13,079,318 13,079,318 —
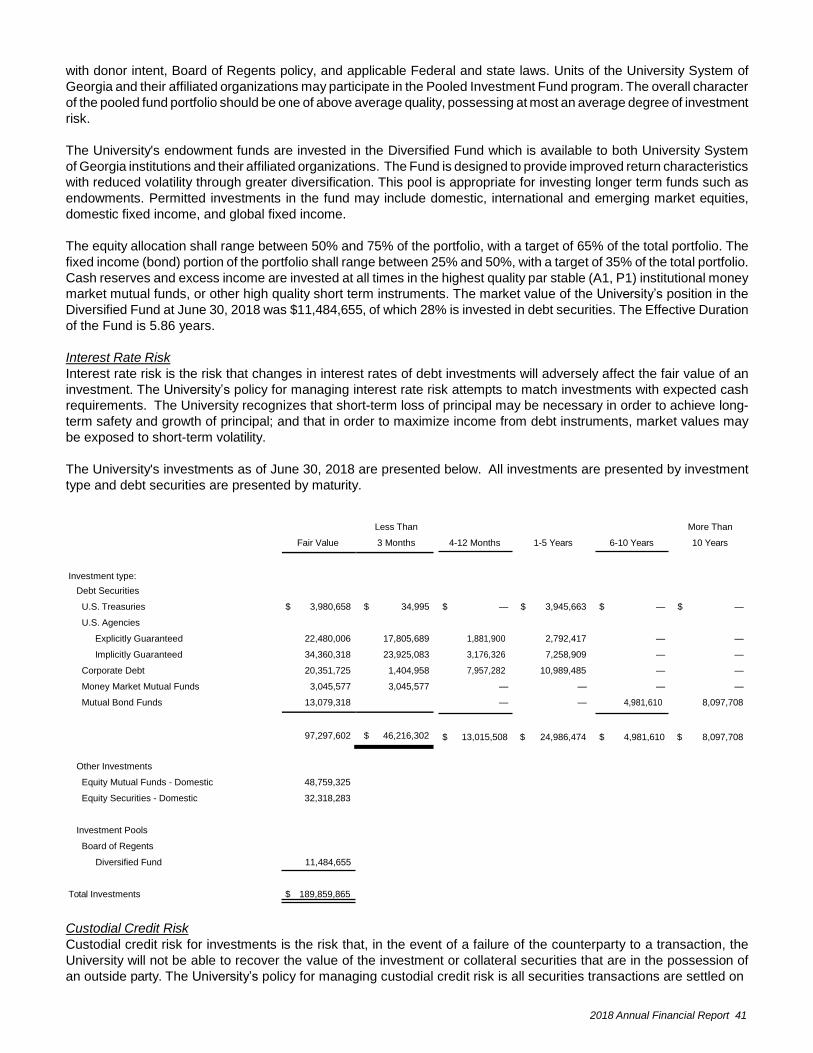
2018 Annual Financial Report 41
with donor intent, Board of Regents policy, and applicable Federal and state laws. Units of the University System of
Georgia and their affiliated organizations may participate in the Pooled Investment Fund program. The overall character
of the pooled fund portfolio should be one of above average quality, possessing at most an average degree of investment
risk.
The University's endowment funds are invested in the Diversified Fund which is available to both University System
of Georgia institutions and their affiliated organizations. The Fund is designed to provide improved return characteristics
with reduced volatility through greater diversification. This pool is appropriate for investing longer term funds such as
endowments. Permitted investments in the fund may include domestic, international and emerging market equities,
domestic fixed income, and global fixed income.
The equity allocation shall range between 50% and 75% of the portfolio, with a target of 65% of the total portfolio. The
fixed income (bond) portion of the portfolio shall range between 25% and 50%, with a target of 35% of the total portfolio.
Cash reserves and excess income are invested at all times in the highest quality par stable (A1, P1) institutional money
market mutual funds, or other high quality short term instruments. The market value of the University’s position in the
Diversified Fund at June 30, 2018 was $11,484,655, of which 28% is invested in debt securities. The Effective Duration
of the Fund is 5.86 years.
Interest Rate Risk
Interest rate risk is the risk that changes in interest rates of debt investments will adversely affect the fair value of an
investment. The University’s policy for managing interest rate risk attempts to match investments with expected cash
requirements. The University recognizes that short-term loss of principal may be necessary in order to achieve long-
term safety and growth of principal; and that in order to maximize income from debt instruments, market values may
be exposed to short-term volatility.
The University's investments as of June 30, 2018 are presented below. All investments are presented by investment
type and debt securities are presented by maturity.
Fair Value
Less Than
3 Months
4-12 Months 1-5 Years
More Than
6-10 Years 10 Years
Investment type:
Debt Securities U.S. Treasuries $ 3,980,658 $ 34,995 $ — $ 3,945,663 $ — $ —
U.S. Agencies Explicitly Guaranteed 22,480,006 17,805,689 1,881,900 2,792,417 — —
Implicitly Guaranteed 34,360,318 23,925,083 3,176,326 7,258,909 — —
Corporate Debt 20,351,725 1,404,958 7,957,282 10,989,485 — —
Money Market Mutual Funds 3,045,577 3,045,577 — — — —
Mutual Bond Funds 13,079,318 — — 4,981,610 8,097,708
97,297,602
$ 46,216,302
$ 13,015,508 $ 24,986,474
$ 4,981,610 $ 8,097,708
Other Investments
Equity Mutual Funds - Domestic 48,759,325
Equity Securities - Domestic 32,318,283
Investment Pools
Board of Regents
Diversified Fund 11,484,655
Total Investments $ 189,859,865
Custodial Credit Risk
Custodial credit risk for investments is the risk that, in the event of a failure of the counterparty to a transaction, the
University will not be able to recover the value of the investment or collateral securities that are in the possession of
an outside party. The University’s policy for managing custodial credit risk is all securities transactions are settled on
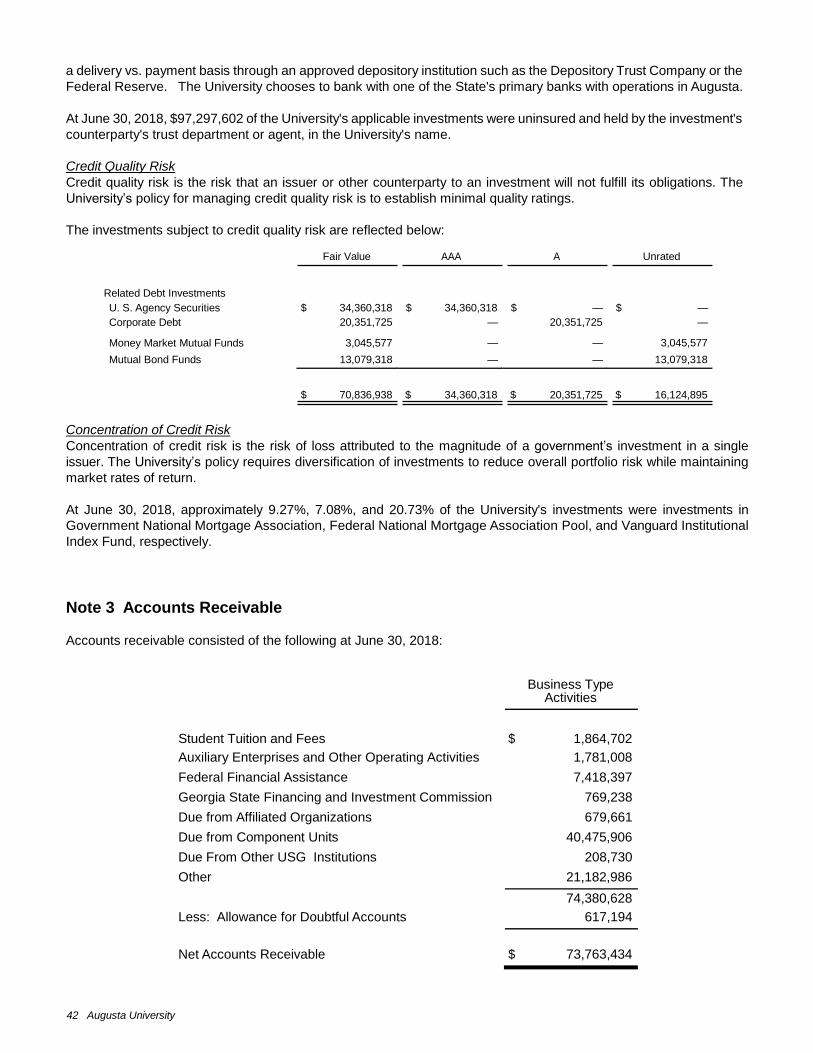
42 Augusta University
a delivery vs. payment basis through an approved depository institution such as the Depository Trust Company or the
Federal Reserve. The University chooses to bank with one of the State's primary banks with operations in Augusta.
At June 30, 2018, $97,297,602 of the University's applicable investments were uninsured and held by the investment's
counterparty's trust department or agent, in the University's name.
Credit Quality Risk
Credit quality risk is the risk that an issuer or other counterparty to an investment will not fulfill its obligations. The
University’s policy for managing credit quality risk is to establish minimal quality ratings.
The investments subject to credit quality risk are reflected below:
Fair Value AAA A Unrated
Related Debt Investments
U. S. Agency Securities $ 34,360,318 $ 34,360,318 $ — $ —
Corporate Debt 20,351,725 — 20,351,725 —
Money Market Mutual Funds 3,045,577 — — 3,045,577
Mutual Bond Funds 13,079,318 — — 13,079,318
$ 70,836,938 $ 34,360,318 $ 20,351,725 $ 16,124,895
Concentration of Credit Risk
Concentration of credit risk is the risk of loss attributed to the magnitude of a government’s investment in a single
issuer. The University’s policy requires diversification of investments to reduce overall portfolio risk while maintaining
market rates of return.
At June 30, 2018, approximately 9.27%, 7.08%, and 20.73% of the University's investments were investments in
Government National Mortgage Association, Federal National Mortgage Association Pool, and Vanguard Institutional
Index Fund, respectively.
Note 3 Accounts Receivable Accounts receivable consisted of the following at June 30, 2018:
Business Type
Activities
Student Tuition and Fees
$ 1,864,702
Auxiliary Enterprises and Other Operating Activities 1,781,008
Federal Financial Assistance 7,418,397
Georgia State Financing and Investment Commission 769,238
Due from Affiliated Organizations 679,661
Due from Component Units 40,475,906
Due From Other USG Institutions 208,730
Other 21,182,986
74,380,628
Less: Allowance for Doubtful Accounts 617,194
Net Accounts Receivable
$ 73,763,434

2018 Annual Financial Report 43
Note 4 Inventories
Inventories consisted of the following at June 30, 2018:
Consumable Supplies $ 97,562
Merchandise for Resale 626,180
Total
$ 723,742
Note 5 Notes and Loans Receivable
The Federal Perkins Loan Program (the Program) comprises substantially all of the loans receivable at June 30, 2018.
The Program provides for cancellation of a loan at rates of 10% to 30% per year up to a maximum of 100% if the
participant complies with certain provisions. The Federal government reimburses the University for amounts canceled
under these provisions. As the University determines that loans are uncollectible and not eligible for reimbursement
by the federal government, the loans are written off and assigned to the U.S. Department of Education. The University
has provided an allowance for uncollectible loans, which, in management’s opinion, is sufficient to absorb loans that
will ultimately be written off. At June 30, 2018, the allowance for uncollectible loans was $411,802.
Note 6 Capital Assets
Changes in capital assets for the year ended June 30, 2018 are shown below:
Balance
July 1, 2017
Additions
Reductions
Balance
June 30, 2018
Capital Assets, Not Being Depreciated: Land $ 23,214,736 $ 1 $ — $ 23,214,737
Capitalized Collections 87,006 — — 87,006
Construction Work-in-Progress 18,425,893 8,692,140 14,294,254 12,823,779
Total Capital Assets Not Being Depreciated 41,727,635 8,692,141 14,294,254 36,125,522
Capital Assets, Being Depreciated/Amortized:
Infrastructure 7,198,998 880,600 — 8,079,598
Building and Building Improvements 718,275,229 33,453,317 2,750,940 748,977,606
Facilities and Other Improvements 19,206,215 4,714,767 — 23,920,982
Equipment 119,481,996 7,242,858 3,449,600 123,275,254
Library Collections 28,909,792 716,259 311,998 29,314,053
Total Capital Assets Being Depreciated/Amortized 893,072,230 47,007,801 6,512,538 933,567,493
Less: Accumulated Depreciation/Amortization
Infrastructure 2,557,454 341,765 — 2,899,219
Building and Building Improvements 282,777,936 18,861,055 — 301,638,991
Facilities and Other Improvements 7,654,012 903,225 — 8,557,237
Equipment 92,345,668 6,776,366 3,136,928 95,985,106
Library Collections 22,478,784 1,228,368 311,998 23,395,154
Total Accumulated Depreciation/Amortization 407,813,854 28,110,779 3,448,926 432,475,707
Total Capital Assets, Being Depreciated/Amortized, Net
485,258,376
18,897,022
3,063,612
501,091,786
Capital Assets, net
$ 526,986,011
$ 27,589,163
$ 17,357,866
$ 537,217,308
For projects managed by GSFIC, GSFIC retains construction-in-progress on its books throughout the construction
period and transfers the entire project to the University when complete. For projects managed by the University, the
University retains construction-in-progress on its books and is reimbursed by GSFIC.

44 Augusta University
For the year ended June 30, 2018, GSFIC transferred capital additions from GSFIC managed projects valued at
$26,496,870 to the University. In addition, at June 30, 2018, GSFIC had construction in progress of approximately
$43,498,754 for incomplete GSFIC managed projects for the University.
A comparison of depreciation expense for the last three fiscal years is as follows:
Depreciation
Fiscal Year Expense
2018
$ 28,110,779
2017 $ 28,011,451
2016 $ 28,894,244
Note 7 Advances (Including Tuition and Fees) Advances, including tuition and fees, consisted of the following at June 30, 2018:
Current Liabilities
Prepaid Tuition and Fees $ 5,266,128
Research 34,286,031
Other - Advances 5,734,926
Totals $ 45,287,085
Note 8 Long-Term Liabilities Changes in long-term liability for the year ended June 30, 2018 was as follows:
Leases
(Restated)
Balance Balance Current
July 1, 2017 Additions Reductions June 30, 2018 Portion
Lease Purchase Obligations $ 55,526,201 $ 365,788 $ 3,670,912 $ 52,221,077 $ 3,778,167
Other Liabilities
Total Long-Term Obligations $1,004,718,771 $ 30,084,155 $ 78,796,940 $ 956,005,986 $ 25,479,219
Compensated Absences 38,982,226 28,157,212 27,941,730 39,197,708 21,701,052
Net Pension Liability 405,908,449 1,561,155 43,009,588 364,460,016 —
Net Other Post-employment Benefits Liability 504,301,895 — 4,174,710 500,127,185 —
Total 949,192,570 29,718,367 75,126,028 903,784,909 21,701,052
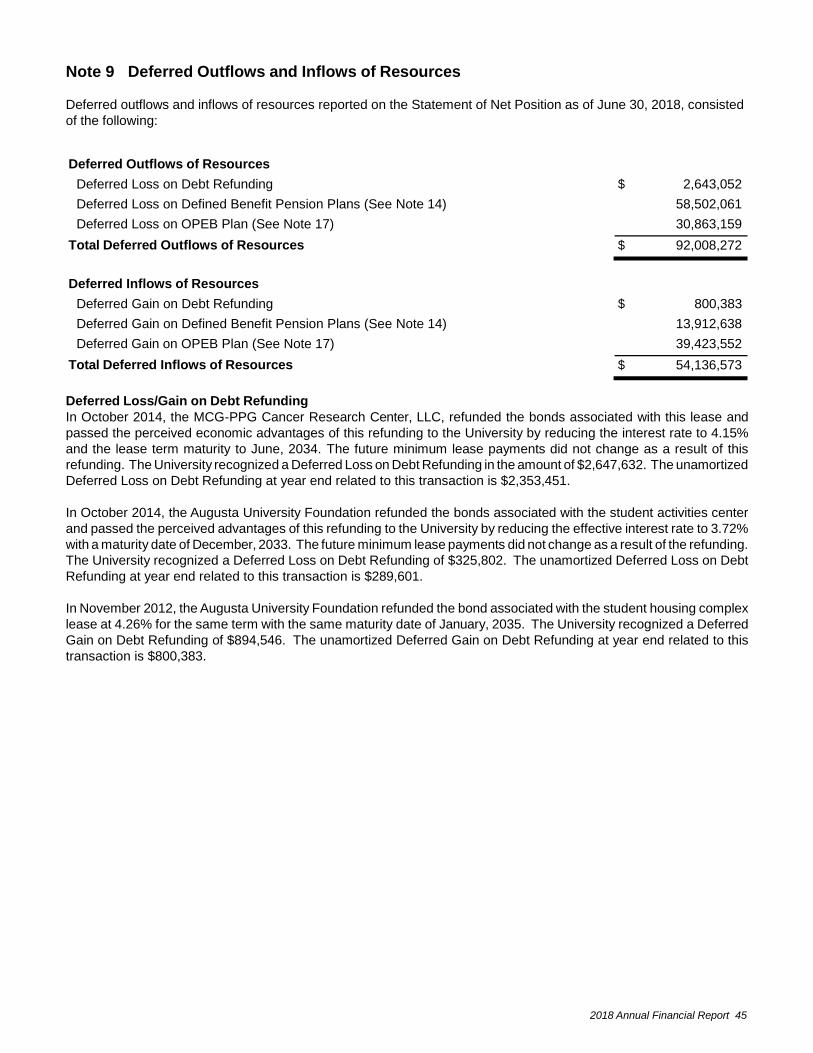
2018 Annual Financial Report 45
Note 9 Deferred Outflows and Inflows of Resources
Deferred outflows and inflows of resources reported on the Statement of Net Position as of June 30, 2018, consisted
of the following:
Deferred Outflows of Resources
Deferred Loss on Debt Refunding $ 2,643,052
Deferred Loss on Defined Benefit Pension Plans (See Note 14) 58,502,061
Deferred Loss on OPEB Plan (See Note 17) 30,863,159
Total Deferred Outflows of Resources $ 92,008,272
Deferred Inflows of Resources
Deferred Gain on Debt Refunding $ 800,383
Deferred Gain on Defined Benefit Pension Plans (See Note 14) 13,912,638
Deferred Gain on OPEB Plan (See Note 17) 39,423,552
Total Deferred Inflows of Resources $ 54,136,573
Deferred Loss/Gain on Debt Refunding
In October 2014, the MCG-PPG Cancer Research Center, LLC, refunded the bonds associated with this lease and
passed the perceived economic advantages of this refunding to the University by reducing the interest rate to 4.15%
and the lease term maturity to June, 2034. The future minimum lease payments did not change as a result of this
refunding. The University recognized a Deferred Loss on Debt Refunding in the amount of $2,647,632. The unamortized
Deferred Loss on Debt Refunding at year end related to this transaction is $2,353,451.
In October 2014, the Augusta University Foundation refunded the bonds associated with the student activities center
and passed the perceived advantages of this refunding to the University by reducing the effective interest rate to 3.72%
with a maturity date of December, 2033. The future minimum lease payments did not change as a result of the refunding.
The University recognized a Deferred Loss on Debt Refunding of $325,802. The unamortized Deferred Loss on Debt
Refunding at year end related to this transaction is $289,601.
In November 2012, the Augusta University Foundation refunded the bond associated with the student housing complex
lease at 4.26% for the same term with the same maturity date of January, 2035. The University recognized a Deferred
Gain on Debt Refunding of $894,546. The unamortized Deferred Gain on Debt Refunding at year end related to this
transaction is $800,383.
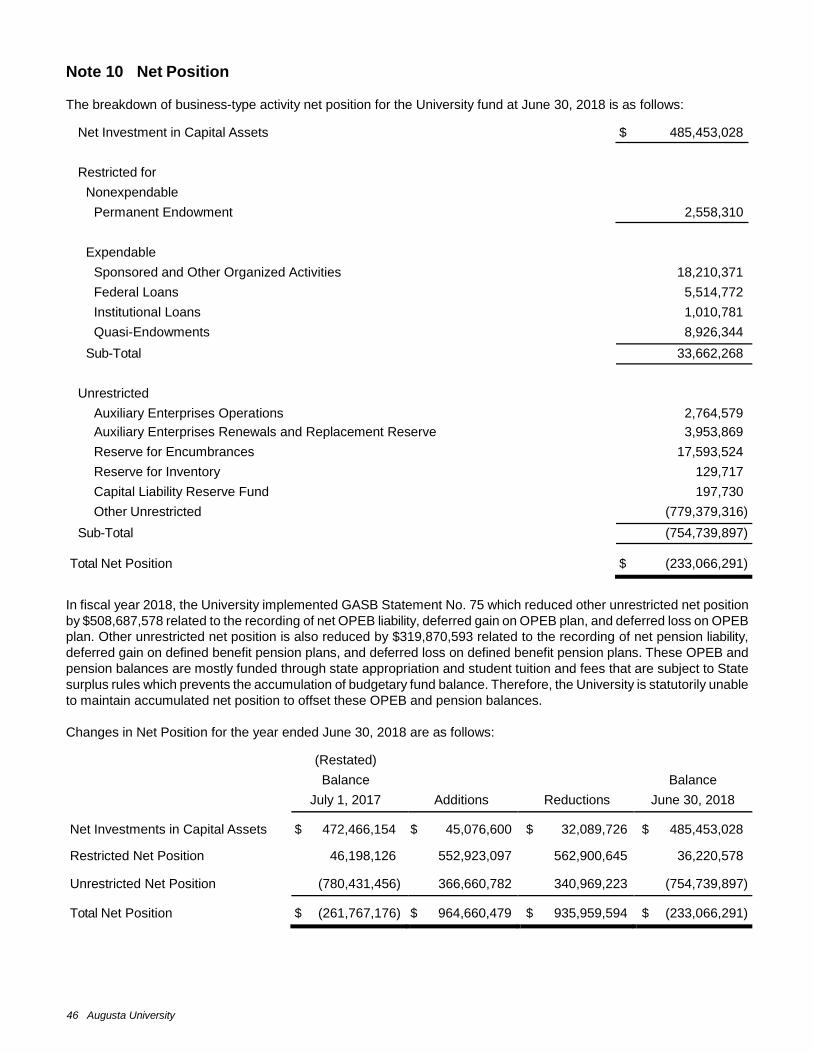
46 Augusta University
Note 10 Net Position The breakdown of business-type activity net position for the University fund at June 30, 2018 is as follows:
Net Investment in Capital Assets $ 485,453,028
Restricted for
Nonexpendable
Permanent Endowment 2,558,310
Expendable
Sponsored and Other Organized Activities 18,210,371
Federal Loans 5,514,772
Institutional Loans 1,010,781
Quasi-Endowments 8,926,344
Sub-Total 33,662,268
Unrestricted
Auxiliary Enterprises Operations
2,764,579
Auxiliary Enterprises Renewals and Replacement Reserve 3,953,869
Reserve for Encumbrances 17,593,524
Reserve for Inventory 129,717
Capital Liability Reserve Fund 197,730
Other Unrestricted (779,379,316)
Sub-Total (754,739,897)
Total Net Position $ (233,066,291)
In fiscal year 2018, the University implemented GASB Statement No. 75 which reduced other unrestricted net position
by $508,687,578 related to the recording of net OPEB liability, deferred gain on OPEB plan, and deferred loss on OPEB
plan. Other unrestricted net position is also reduced by $319,870,593 related to the recording of net pension liability,
deferred gain on defined benefit pension plans, and deferred loss on defined benefit pension plans. These OPEB and
pension balances are mostly funded through state appropriation and student tuition and fees that are subject to State
surplus rules which prevents the accumulation of budgetary fund balance. Therefore, the University is statutorily unable
to maintain accumulated net position to offset these OPEB and pension balances.
Changes in Net Position for the year ended June 30, 2018 are as follows:
(Restated)
Balance Balance
July 1, 2017 Additions Reductions June 30, 2018
Net Investments in Capital Assets $ 472,466,154 $ 45,076,600 $ 32,089,726 $ 485,453,028
Restricted Net Position 46,198,126 552,923,097 562,900,645 36,220,578
Unrestricted Net Position (780,431,456) 366,660,782 340,969,223 (754,739,897)
Total Net Position $ (261,767,176) $ 964,660,479 $ 935,959,594 $ (233,066,291)

2018 Annual Financial Report 47
Note 11 Endowments Donor Restricted Endowments
Investments of the University’s endowment funds are pooled, unless required to be separately invested by the donor.
For University controlled, donor-restricted endowments, where the donor has not provided specific instructions, the
Board of Regents permits Institutions to develop policies for authorizing and spending realized and unrealized
endowment income and appreciation as they determined to be prudent. Realized and unrealized appreciation in excess
of the amount budgeted for current spending is retained by the endowments. Current year net appreciation for the
endowment accounts was $145,685 and is reflected as expendable restricted net position.
For endowment funds where the donor has not provided specific instructions, investment return of the University’s
endowment funds is predicated under classical trust doctrines. Unless the donor has stipulated otherwise, capital gains
and losses are accounted for as part of the endowment principal and are not available for expenditure.
For the current year, the University did not incur investment losses that exceeded the related endowment’s available
accumulated income and net appreciation.
Note 12 Significant Commitments See the Net Position note for amounts reserved for outstanding encumbrances at June 30, 2018. In addition to these
encumbrances, the University had other significant unearned outstanding construction or renovation contracts in the
amount of $440,877 executed as of June 30, 2018. This amount is not reflected in the accompanying basic financial
statements.
Note 13 Leases Lease Obligations
The University is obligated under various capital and operating lease agreements for the acquisition or use of real
property and equipment.
Capital Leases
The University acquires certain real property and equipment through multi-year capital leases with varying terms and
options. In accordance with O.C.G.A. § 50-5-64, these agreements shall terminate absolutely and without further
obligation at the close of the fiscal year in which it was executed and at the close of each succeeding fiscal year for
which it may be renewed. These agreements may be renewed only by a positive action taken by the University. In
addition, these agreements shall terminate if the State does not provide adequate funding, but that is considered a
remote possibility. The University’s principal and interest expenditures related to capital leases for fiscal year 2018
were $3,661,430 and $1,897,397, respectively. In addition, a principal adjustment of $9,482 was made, bringing the
total principal reduction to $3,670,912. Interest rates range from 2.437% to 10.10%.
The University has $48,801,402 in outstanding lease obligations due to component units. Component units have
$48,801,402 in investment in capital lease receivables due from the University.
The following is a summary of the carrying values of assets held under capital lease at June 30, 2018:
Description Gross Amount
Less: Accumulated
Depreciation
Net, Capital Assets Held Under Capital Lease at June 30,
2018
Outstanding Balance per Lease Schedules at June
30, 2018
( + ) ( - ) ( = )
Leased Equipment $ 7,578,047 $ 3,917,335 $ 3,660,712 $ 3,419,675
Leased Buildings and Building Improvements 59,576,418 22,149,281 37,427,137 48,801,402
Total Assets Held Under Capital Lease $ 67,154,465 $ 26,066,616 $ 41,087,849 $ 52,221,077
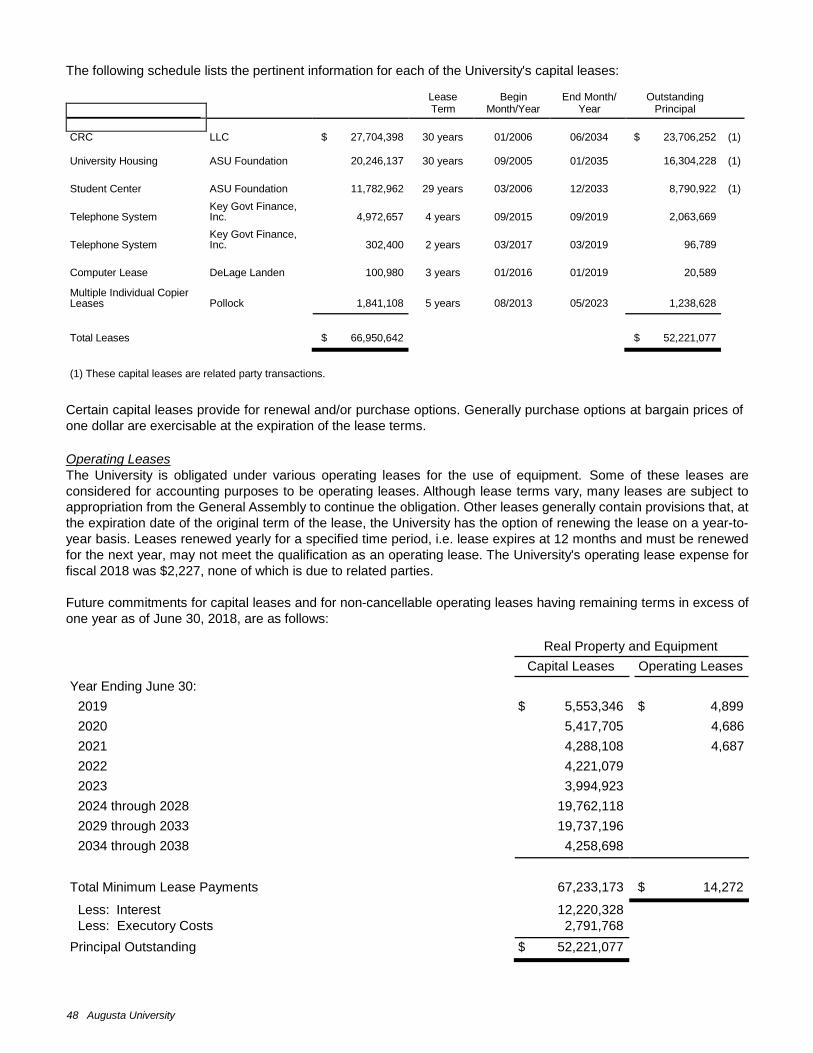
48 Augusta University
The following schedule lists the pertinent information for each of the University's capital leases:
Description Lessor Original
Principal MCG-PPG, CRC
Lease Begin End Month/ Outstanding
Term Month/Year Year Principal
CRC LLC $ 27,704,398 30 years 01/2006 06/2034 $ 23,706,252 (1)
University Housing ASU Foundation 20,246,137 30 years 09/2005 01/2035 16,304,228 (1)
Student Center ASU Foundation 11,782,962 29 years 03/2006 12/2033 8,790,922 (1)
Telephone System
Key Govt Finance, Inc.
4,972,657
4 years
09/2015
09/2019
2,063,669
Telephone System
Key Govt Finance, Inc.
302,400
2 years
03/2017
03/2019
96,789
Computer Lease DeLage Landen 100,980 3 years 01/2016 01/2019 20,589
Multiple Individual Copier Leases
Pollock
1,841,108
5 years
08/2013
05/2023
1,238,628
Total Leases
$ 66,950,642
$ 52,221,077
(1) These capital leases are related party transactions.
Certain capital leases provide for renewal and/or purchase options. Generally purchase options at bargain prices of
one dollar are exercisable at the expiration of the lease terms.
Operating Leases
The University is obligated under various operating leases for the use of equipment. Some of these leases are
considered for accounting purposes to be operating leases. Although lease terms vary, many leases are subject to
appropriation from the General Assembly to continue the obligation. Other leases generally contain provisions that, at
the expiration date of the original term of the lease, the University has the option of renewing the lease on a year-to-
year basis. Leases renewed yearly for a specified time period, i.e. lease expires at 12 months and must be renewed
for the next year, may not meet the qualification as an operating lease. The University's operating lease expense for
fiscal 2018 was $2,227, none of which is due to related parties.
Future commitments for capital leases and for non-cancellable operating leases having remaining terms in excess of
one year as of June 30, 2018, are as follows:
Year Ending June 30:
Real Property and Equipment
Capital Leases Operating Leases
2019 $ 5,553,346 $ 4,899
2020 5,417,705 4,686
2021 4,288,108 4,687
2022 4,221,079
2023 3,994,923
2024 through 2028 19,762,118
2029 through 2033 19,737,196
2034 through 2038 4,258,698
Total Minimum Lease Payments
67,233,173
$ 14,272
Less: Interest 12,220,328 Less: Executory Costs 2,791,768
Principal Outstanding $ 52,221,077

2018 Annual Financial Report 49
Note 14. Retirement Plans The University participates in various retirement plans administered by the State of Georgia under two major retirement
systems: Teachers Retirement System of Georgia (TRS) and Employees’ Retirement System of Georgia (ERS). These
two systems issue separate publicly available financial reports that include the applicable financial statements and
required supplementary information. The reports may be obtained from the respective administrative offices.
The significant retirement plans that the University participates in are described below. More detailed information can
be found in the plan agreements and related legislation. Each plan, including benefit and contribution provisions, was
established and can be amended by State law.
A. Teachers Retirement System of Georgia and Employees’ Retirement System of Georgia General Information about the Teachers Retirement System
Plan description
All teachers of the University as defined in O.C.G.A. § 47-3-60 are provided a pension through the Teachers Retirement
System of Georgia (TRS). TRS, a cost-sharing multiple-employer defined benefit pension plan, is administered by the
TRS Board of Trustees (TRS Board). Title 47 of the O.C.G.A. assigns the authority to establish and amend the benefit
provisions to the State Legislature. TRS issues a publicly available financial report that can be obtained at
trsga.com/publications.
Benefits Provided
TRS provides service retirement, disability retirement, and death benefits. Normal retirement benefits are determined
as 2% of the average of the employee’s two highest paid consecutive years of service, multiplied by the number of
years of creditable service up to 40 years. An employee is eligible for normal service retirement after 30 years of
creditable service, regardless of age, or after 10 years of service and attainment of age 60. Ten years of service is
required for disability and death benefits eligibility. Disability benefits are based on the employee’s creditable service
and compensation up to the time of disability. Death benefits equal the amount that would be payable to the employee’s
beneficiary had the employee retired on the date of death. Death benefits are based on the employee’s creditable
service and compensation up to the date of death.
Contributions
Per Title 47 of the O.C.G.A., contribution requirements of active employees and participating employers, as actuarially
determined, are established and may be amended by the TRS Board. Contributions are expected to finance the costs
of benefits earned by employees during the year, with an additional amount to finance any unfunded accrued liability.
Employees were required to contribute 6% of their annual pay during fiscal year 2018. The University’s contractually
required contribution rate for the year ended June 30, 2018 was 16.81% of the annual University payroll. The University’s
contributions to TRS totaled $34,287,410 for the year ended June 30, 2018.
General Information about the Employees’ Retirement System
Plan description
ERS is a cost-sharing multiple-employer defined benefit pension plan established by the Georgia General Assembly
during the 1949 Legislative Session for the purpose of providing retirement allowances for employees of the State of
Georgia and its political subdivisions. ERS is directed by a Board of Trustees. Title 47 of the O.C.G.A. assigns the
authority to establish and amend the benefit provisions to the State Legislature. ERS issues a publicly available financial
report that can be obtained at ers.ga.gov/financials.
50 Augusta University
Benefits provided
The ERS Plan supports three benefit tiers: Old Plan, New Plan, and Georgia State Employees’ Pension and Savings
Plan (GSEPS). Employees under the old plan started membership prior to July 1, 1982 and are subject to plan provisions
in effect prior to July 1, 1982. Members hired on or after July 1, 1982 but prior to January 1, 2009 are new plan members
subject to modified plan provisions. Effective January 1, 2009, new state employees and rehired state employees who
did not retain membership rights under the Old or New Plans are members of GSEPS. ERS members hired prior to
January 1, 2009 also have the option to irrevocably change their membership to GSEPS.
Under the old plan, the new plan, and GSEPS, a member may retire and receive normal retirement benefits after
completion of 10 years of creditable service and attainment of age 60 or 30 years of creditable service regardless of
age. Additionally, there are some provisions allowing for early retirement after 25 years of creditable service for members
under age 60.
Retirement benefits paid to members are based upon the monthly average of the member’s highest 24 consecutive
calendar months, multiplied by the number of years of creditable service, multiplied by the applicable benefit factor.
Annually, postretirement cost-of-living adjustments may also be made to members’ benefits, provided the members
were hired prior to July 1, 2009. The normal retirement pension is payable monthly for life; however, options are available
for distribution of the member’s monthly pension, at reduced rates, to a designated beneficiary upon the member’s
death. Death and disability benefits are also available through ERS.
Contributions
Member contributions under the old plan are 4% of annual compensation, up to $4,200, plus 6% of annual compensation
in excess of $4,200. Under the old plan, the State pays member contributions in excess of 1.25% of annual
compensation. Under the old plan, these State contributions are included in the members’ accounts for refund purposes
and are used in the computation of the members’ earnable compensation for the purpose of computing retirement
benefits. Member contributions under the new plan and GSEPS are 1.25% of annual compensation. The required
contribution rate for the year ended June 30, 2018 was 24.81% of annual covered payroll for old and new plan members
and 21.81% for GSEPS members. The rates include the annual actuarially determined employer contributions rate
of 24.69% of annual covered payroll for old and new plan members and 21.69% for GSEPS members, plus a 0.12%
adjustment for the HB 751 one time benefit adjustment of 3% to retired state employees. The University’s contributions
to ERS totaled $816,038 for the year ended June 30, 2018. Contributions are expected to finance the costs of benefits
earned by employees during the year, with an additional amount to finance any unfunded accrued liability.
Pension Liabilities, Pension Expense, and Deferred Outflows of Resources and Deferred Inflows of
Resources Related to Pensions
At June 30, 2018, the University reported a liability for its proportionate share of the net pension liability for TRS and
ERS. The net pension liability was measured as of June 30, 2017. The total pension liability used to calculate the net
pension liability was based on an actuarial valuation as of June 30, 2016. An expected total pension liability as of
June 30, 2017 was determined using standard roll-forward techniques. The University’s proportion of the net pension
liability was based on contributions to TRS and ERS during the fiscal year ended June 30, 2017. At June 30, 2017,
the University’s TRS proportion was 1.676517%, which was an increase of 0.000931% from its proportion measured
as of June 30, 2016. At June 30, 2017, the University’s ERS proportion was 0.074670%, which was a increase of
0.043564% from its proportion measured as of June 30, 2016.
For the year ended June 30, 2018, the University recognized pension expense of $33,137,795 for TRS and $1,106,004
for ERS. At June 30, 2018, the University reported deferred outflows of resources and deferred inflows of resources
related to pensions from the following sources:

2018 Annual Financial Report 51
TRS ERS
Deferred Outflows of Resources
Deferred Inflows of Resources
Deferred Outflows of Resources
Deferred Inflows of Resources
Differences between expected and actual experience
$ 11,655,230
$ 1,175,892
$ 33,230
$ 24
Changes of assumptions 6,830,348 — 6,904 —
Net difference between projected and actual earnings on pension plan investments
—
2,144,232
—
7,551
Changes in proportion and differences between contributions and proportionate share of
contributions 1,470,287 5,768,550 1,153,605 —
Contributions subsequent to the measurement
date 34,287,410 — 816,038 —
Total
$ 54,243,275
$ 9,088,674
$ 2,009,777
$ 7,575
The University’s contributions subsequent to the measurement date are reported as deferred outflows of resources
and will be recognized as a reduction of the net pension liability in the year ended June 30, 2018. Other amounts
reported as deferred outflows of resources and deferred inflows of resources related to pensions will be recognized
in pension expense as follows:
Year Ended June 30: TRS ERS
2019 $ (3,017,373) $ 693,727
2020 $ 14,867,945 $ 544,378
2021 $ 7,017,703 $ 34,044
2022 $ (8,192,731) $ (85,985)
2023 $ 191,647 $ —
Actuarial assumptions
The total pension liability as of June 30, 2017 was determined by an actuarial valuation as of June 30, 2016 using the
following actuarial assumptions, applied to all periods included in the measurement:
Teachers Retirement System
Inflation 2.75%
Salary increases 3.25% - 9.00%, average, including inflation
Investment rate of return 7.50%, net of pension plan investment expense, including inflation
Post–retirement mortality rates were based on the RP–2000 White Collar Mortality Table with future mortality
improvement projected to 2025 with the Society of Actuaries’ projection scale BB (set forward one year for males) for
service retirements and dependent beneficiaries. The RP–2000 Disabled Mortality Table with future mortality
improvement projected to 2025 with Society of Actuaries’ projection scale BB (set forward two years for males and
four years for females) was used for death after disability retirement. Rates of mortality in active service were based
on the RP–2000 Employee Mortality Table projected to 2025 with projection scale BB.
The actuarial assumptions used in the June 30, 2016 valuation were based on the results of an actuarial experience
study for the period July 1, 2009 – June 30, 2014.

52 Augusta University
Employees’ Retirement System
Inflation 2.75%
Salary increases 3.25 – 7.00%, including inflation
Investment rate of return 7.50%, net of pension plan investment expense, including inflation
Post–retirement mortality rates were based on the RP–2000 Combined Mortality Table with future mortality improvement
projected to 2025 with the Society of Actuaries’ projection scale BB and set forward 2 years for both males and females
for service retirements and dependent beneficiaries. The RP–2000 Disabled Mortality Table with future mortality
improvement projected to 2025 with Society of Actuaries’ projection scale BB and set back 7 years for males and set
forward 3 years for females was used for death after disability retirement. There is a margin for future mortality
improvement in the tables used by the System. Based on the results of the most recent experience study adopted by
the Board on December 17, 2015, the numbers of expected future deaths are 9–12% less than the actual number of
deaths that occurred during the study period for service retirements and beneficiaries and for disability retirements.
Rates of mortality in active service were based on the RP–2000 Employee Mortality Table projected to 2025 with
projection scale BB.
The actuarial assumptions used in the June 30, 2016 valuation were based on the results of an actuarial experience
study for the period July 1, 2009 – June 30, 2014.
The long-term expected rate of return on TRS and ERS pension plan investments was determined using a log-normal
distribution analysis in which best-estimate ranges of expected future real rates of return (expected nominal returns,
net of pension plan investment expense and the assumed rate of inflation) are developed for each major asset class.
These ranges are combined to produce the long-term expected rate of return by weighting the expected future real
rates of return by the target asset allocation percentage and by adding expected inflation. The target allocation and
best estimates of arithmetic real rates of return for each major asset class are summarized in the following table:
Asset class
TRS target allocation
ERS target allocation
Long-term expected real rate of return*
Fixed income 30.00% 30.00% (0.50)%
Domestic large equities 39.80% 37.20% 9.00 %
Domestic mid equities 3.70% 3.40% 12.00 %
Domestic small equities 1.50% 1.40% 13.50 %
International developed market equities 19.40% 17.80% 8.00 %
International emerging market equities 5.60% 5.20% 12.00 %
Alternatives —% 5.00% 10.50 %
Total 100.00% 100.00%
* Rates shown are net of the 2.75% assumed rate of inflation
Discount rate
The discount rate used to measure the total TRS and ERS pension liability was 7.50%. The projection of cash flows
used to determine the discount rate assumed that plan member contributions will be made at the current contribution
rate and that employer and State of Georgia contributions will be made at rates equal to the difference between
actuarially determined contribution rates and the member rate. Based on those assumptions, the TRS and ERS pension
plan’s fiduciary net position was projected to be available to make all projected future benefit payments of current plan
members. Therefore, the long-term expected rate of return on pension plan investments was applied to all periods of
projected benefit payments to determine the total pension liability.
Sensitivity of the University's proportionate share of the net pension liability to changes in the discount rate:
The following presents the University’s proportionate share of the net pension liability calculated using the discount
rate of 7.50%, as well as what the University’s proportionate share of the net pension liability would be if it were
2018 Annual Financial Report 53
calculated using a discount rate that is 1-percentage-point lower (6.50%) or 1-percentage-point higher (8.50%) than
the current rate:
Teachers Retirement System:
1%
Decrease
6.50%
Current
discount rate
7.50%
1%
Increase
8.50%
Proportionate share of the net pension liability $ 511,348,934 $ 311,585,848 $ 147,025,964
Employees’ Retirement System:
1%
Decrease
6.50%
Current
discount rate
7.50%
1%
Increase
8.50%
Proportionate share of the net pension liability $ 4,280,362 $ 3,032,599 $ 1,968,218
Pension plan fiduciary net position
Detailed information about the pension plan’s fiduciary net position is available in the separately issued TRS and ERS
financial reports which are publically available at trsga.com/publications and ers.ga.gov/financials, respectively.
B. Early Retirement Pension Plan
Plan Description
Augusta University Early Retirement Pension Plan (ERP) is a single-employer defined benefit pension plan administered
by Findley, Inc., formerly Findley Davies/Bryan, Pendleton, Swats, and McAlister (BPS&M). The plan was derived by
Augusta University as a means of workforce reduction and was approved by the Board of Regents of the University
System of Georgia (BOR) effective January 1, 2000.
The plan was designed to provide eligible participants additional benefits above the amounts payable through Teachers
Retirement System of Georgia (TRS). The plan was designed to allow vested employees aged 55 or employees of
any age with 25 years of creditable service to retire without penalties as applied by the Teachers Retirement System
of Georgia (TRS) for early retirement.
The plan would allow for all participants to retire as if they were vested and aged 60 or had attained 30 years of
creditable service. Any member who opted into the Optional Retirement Plan aged 55 with 10 years of service by June
30, 2000 was also eligible to participate in the plan.
The plan is closed to new entrants. There were no active plan participants. As of January 1, 2018, plan participants
consisted of the following:
Inactive Plan Participants:
Retirees and Beneficiaries Currently Receiving Benefits 618
Terminated Employees Entitled to Deferred Benefits 0
Disabled Employees Entitled to Deferred Benefits 0
Total 618
Benefits Provided
TRS provides a benefit equal to 2.0% of the participant’s average annual compensation during the two consecutive
years of creditable service which produce the highest such average, multiplied by the number of years of creditable
service, limited to 40 years. If the participant has less than 30 years of creditable service and has not attained age 60
at the time of retirement, the benefit will be reduced by the lesser of 1/12 of 7% for each month that retirement precedes
age 60 or 7% for each year or fraction of a year by which the participant has less than 30 years of creditable service
at the time of retirement. In addition, a one-time 3% increase is applied to the first $37,500 of the participant’s benefit
at retirement.

54 Augusta University
The ERP provides the additional benefits that would have been payable under TRS based on the following adjustments:
• Age of the participant was increased five years
• Participant’s creditable service was increased five years
• Participant’s annual rate of earnings as of August 1, 1999 was projected five years into the future with 3%
increases each year
ERP benefits will be increased 3% a year as a cost-of-living adjustment (COLA): 1.5% on each January 1 and July 1.
The ERP provided COLA’s for both the ERP and TRS benefits until actual eligibility for a COLA through TRS occurred.
Since that time, the ERP has provided COLA’s only on the portion of the benefit paid by the ERP, and TRS has provided
COLA’s under the terms of the TRS plan.
The ERP does not issue a standalone report.
Funding Policy
The fund sources that provided for an employee’s salary, as of December 31, 1999, would be responsible for funding
the annuity to provide for retiree benefits. There is no additional cost to the employee/retiree, USG, or State of Georgia
for this plan. Contributions are made by Augusta University based on the actuarial valuation of the plan. For fiscal year
2018, affiliated organizations contributed $5,886,802 to the plan on-behalf of the University.
Since this plan was not pre-funded, Augusta University’s approach is to collect and deposit as much into the ERP fund
in the earlier years as is possible, thereby, realizing a greater return on investment. Effective January 1, 2016, the
period to amortize the unfunded accrued liability was extended 2 years. With this change, the plan should be fully
funded by June 30, 2025. The funding policy is reasonable and in compliance with minimum funding requirements set
forth in Code Section 47-20-10 of the Public Retirement Systems Standards Law.
Investments
Augusta University maintains an investment policy which fosters sound and prudent judgment in the management of
assets to ensure safety of capital consistent with the fiduciary responsibility of the institution to the citizens of Georgia
and which conforms to the USG investment policy. All investments are consistent with USG policy and applicable
Federal and state laws.
Investments are reported at fair value. Securities traded on a national or international exchange are valued at the last
reported sales price. The Augusta University’s Investment Policy and Guidelines for managing concentration of credit
risk requires that stocks and debt issues be diversified. Augusta University also relies upon the concentration of credit
risk policy of the individual investment vehicles related to plan assets. More than 5% of the Pension Plan’s Investments
are in Western Asset Core Plus Bond Fund, Vanguard Institutional Index Fund, iShares Russell 1000 Value Exchange-
traded Fund (ETF), and iShares Russell 1000 Growth ETF. These investments are 5.52%, 40.48%, 7.69%, and 8.73%
respectively of the Plan’s total investments.
For the fiscal year ended June 30, 2018, the annual money-weighted rate of return on pension plan investments, net
of pension plan investment expense, was 10.42%.
Net Pension Liability (NPL)
The components of the net pension liability at June 30, 2018 were as follows:
Total Pension Liability $ 148,863,688
Plan Fiduciary Net Position 99,022,119
Net Pension Liability
$ 49,841,569
Plan Fiduciary Net Position as a percentage of total pension liability is 66.52%.

2018 Annual Financial Report 55
Actuarial Assumptions
The total pension liability was determined by an actuarial valuation as of January 1, 2018 with the results rolled forward
to the June 30, 2018 measurement date using the following actuarial assumptions, applied to all periods included in
the measurement: (a) rate of return of 7.50% per annum, compounded annually (b) inflation of 3 percent, and (c) cost
of living increases of 3 percent per annum.
To better recognize current and future mortality improvements, effective June 30, 2018 mortality rates were based on
the RP-2014 White Collar Mortality Table, adjusted to 2006, with generational mortality improvement projected after
year 2006 using Scale MP-2017 rather than the previously used RP-2014 Mortality Table, adjusted to 2006, with
generational mortality improvement projected after year 2006 using Scale MP-2015.
The projection of cash flows used to determine the discount rate of 7.5% per annum, compounded annually assumes
that employer contributions will be made at rates equal to the actuarially determined contribution rates. Based on that
assumption, the pension plan’s fiduciary net position was projected to be available to make all projected future benefit
payments of current plan members.Therefore, the long-term expected rate of return on pension plan investments was
applied to all periods of projected benefit payments to determine the total pension liability.
The long-term expected rate of return on pension plan investments was determined using a building- block method in
which best-estimate ranges of expected future real rates of return (expected returns, net of pension plan investment
expense and inflation) are developed for each major asset class. These ranges are combined to produce the long-
term expected rate of return by weighting the expected future real rates of return by the target asset allocation percentage
and by adding expected inflation. Best estimates of arithmetic real rates of return for each major asset class included
in the pension plan’s target asset allocation are summarized in the following table:
Asset Class
Target
Allocation
Long-Term Expected
Real Rate of Return
Domestic Equity 81.88% 6.50%
International Equity —% 7.25%
Fixed Income 13.21% 1.25%
Real Estate —% 5.75%
Cash 4.91% 0.50%
Sensitivity of Net Pension Liability to Changes in the Discount Rate
The following represents the net pension liability calculated using the stated discount rate, as well as what the net
pension liability would be if it were calculated using a discount rate that is 1-percentage-point lower or 1-percentage-
point higher than the current rate:
1% Current 1%
Decrease discount rate Increase
6.50% 7.50% 8.50%
Net Pension Liability $ 61,955,353 $ 49,841,569 $ 39,266,044

56 Augusta University
Schedule of Changes in Net Pension Liability
For the year ended June 30, 2018, the University recognized net pension liability of $49,841,569 calculated as follows:
Total Pension
Liability (a)
Plan Fiduciary
Net Position
(b)
Net Pension
Liability
(a) - (b)
Balance, June 30, 2017 $ 149,152,995 $ 90,408,065 $ 58,744,930
Interest 10,669,543 — 10,669,543
Experience losses (gains) 664,493 — 664,493
Changes of assumptions 2,161,493 — 2,161,493
Contributions - Employer — 13,084,672 (13,084,672)
Net investment income — 9,314,218 (9,314,218)
Benefit payments (13,784,836) (13,784,836) —
Net Change (289,307) 8,614,054 (8,903,361)
Balance, June 30, 2018 $ 148,863,688 $ 99,022,119 $ 49,841,569
Affiliated organizations contributed $5,886,802 to the plan on behalf of the University.
Schedule of Changes in Pension Expense
For the year ended June 30, 2018, the University recognized pension expense of $6,689,185 from the following sources:
Pension Expense
Interest $ 10,669,543
Projected investment income (6,754,349)
Recognition of experience (gain)/loss 664,493
Recognition of changes in assumptions 2,161,493
Investment losses (gains) (51,995)
Pension Expense June 30, 2018 $ 6,689,185
Deferred Outflows/Inflows of Resources
At June 30, 2018, the University reported deferred outflows of resources and deferred inflows of resources related to
pensions from the following sources:
Net difference between projected and actual
Deferred Pension Outflows of Resources
Deferred Pension Inflows of Resources
earnings on pension plan investments $ 2,249,009 $ 4,816,389
Amounts reported as deferred outflows of resources and deferred inflows of resources related to pensions will be
recognized in pension expense as follows:
Year Ending June 30:
2019 $ (51,997)
2020 $ (568,604)
2021 $ (1,434,806)
2022 $ (511,973)

2018 Annual Financial Report 57
C. Defined Contribution Plan Regents Retirement Plan
Plan Description
The Regents Retirement Plan, a single-employer defined contribution plan, is an optional retirement plan that was
created/established by the Georgia General Assembly in O.C.G.A. § 47-21-1 et.seq. and administered by the Board
of Regents of the University System of Georgia (Board). O.C.G.A. § 47-3-68(a) defines who may participate in the
Regents Retirement Plan. An “eligible university system employee” is a faculty member or all exempt full and partial
benefit eligible employees, as designated by the regulations of the Board. Under the Regents Retirement Plan, a plan
participant may purchase annuity contracts from three approved vendors (VALIC, Fidelity, and TIAA-CREF) for the
purpose of receiving retirement and death benefits. Benefits depend solely on amounts contributed to the plan plus
investment earnings. Benefits are payable to participating employees or their beneficiaries in accordance with the
terms of the annuity contracts.
Funding Policy
The institutions of the USG make monthly employer contributions to the Regents Retirement Plan on behalf of
participants at rates determined by the Board. The Board reviews the contribution amount every three (3) years. For
fiscal year 2018, the employer contribution was 9.24% for the participating employee's earnable compensation.
Employees contribute 6.00% of their earnable compensation. Amounts attributable to all plan contributions are fully
vested and non-forfeitable at all times.
The University and the covered employees made the required contributions of $13,298,125 (9.24%) and $8,635,146
(6.00%), respectively.
VALIC, Fidelity, and TIAA-CREF have separately issued financial reports which may be obtained through their respective
corporate offices.
Note 15 Risk Management The USG offers its employees and retirees under the age of 65 access to three self insured healthcare plan options
and one fully insured plan option. For the USG’s Plan Year 2018, the following self-insured health care options were
available: Blue Choice HMO plan, (Blue Cross and Blue Shield of Georgia) Consumer Choice HSA plan, and the (Blue
Cross and Blue Shield of Georgia) Comprehensive Care plan.
The University’s participating employees and eligible retirees pay premiums into the plan fund to access benefits
coverage. All units of the USG share the risk of loss for claims associated with these plans. The plan fund is considered
to be a self-sustaining risk fund. The USG has contracted with Blue Cross and Blue Shield of Georgia, a wholly owned
subsidiary of Anthem, Inc., to serve as the claims administrator for the self-insured healthcare plan options. In addition
to the self-insured healthcare plan options offered to the employees and eligible retirees of the USG, a fully insured
HMO healthcare plan option also is offered through Kaiser Permanente. The Comprehensive Care plan has a carved-
out prescription drug plan administered through CVS Caremark. Pharmacy drug claims are processed in accordance
with guidelines established for the Board of Regents’ Prescription Drug Benefit Program. Generally, claims are submitted
by participating pharmacies directly to CVS Caremark for verification, processing and payment. CVS Caremark
maintains an eligibility file based on information furnished by Blue Cross and Blue Shield of Georgia on behalf of the
various organizational units of the University System of Georgia. The self-insured dental plan is administered through
Delta Dental.
Retirees age 65 and older participate in a secondary healthcare coverage for Medicare-eligible retirees and dependents
provided through a retiree health care exchange option. The USG makes contributions to a health reimbursement
account, which can be used by the retiree to pay premiums and out-of-pocket healthcare-related expenses.
The Department of Administrative Services (DOAS) has the responsibility for the State of Georgia of making and
carrying out decisions that will minimize the adverse effects of accidental losses that involve State government assets.
The State believes it is more economical to manage its risks internally and set aside assets for claim settlement.
Accordingly, DOAS processes claims for risk of loss to which the State is exposed, including general liability, property
and casualty, workers' compensation, unemployment compensation, and law enforcement officers' indemnification.
Limited amounts of commercial insurance are purchased applicable to property, employee and automobile liability,
fidelity, and certain other risks.
58 Augusta University
The University is part of the State of Georgia reporting entity, and as such, is covered by the State of Georgia risk
management program administered by DOAS. Premiums for the risk management program are charged to the various
state organizations by DOAS to provide claims servicing and claims payment.
A self-insured program of professional liability for its employees was established by the Board of Regents of the
University System of Georgia under powers authorized by the O.C.G.A § 45-9-1.
The program insures the employees to the extent that they are not immune from liability against personal liability for
damages arising out of the performance of their duties or in any way connected therewith. The program is administered
by DOAS as a Self-Insurance Fund.
Note 16 Contingencies Amounts received or receivable from grantor agencies are subject to audit and adjustment by grantor agencies. This
could result in refunds to the grantor agency for any expenditure disallowed under grant terms. The amount of
expenditures which may be disallowed by the grantor cannot be determined at this time although the University expects
such amounts, if any, to be immaterial to its overall financial position.
Litigation, claims and assessments filed against the University, if any, are generally considered to be actions against
the State of Georgia. Accordingly, significant litigation, claims and assessments pending against the State of Georgia
are disclosed in the State of Georgia Comprehensive Annual Financial Report for the fiscal year ended June 30, 2018.
Note 17 Post-Employment Benefits Other Than Pension Benefits
Board of Regents Retiree Health Benefit Plan
Plan Description and Funding Policy
The Board of Regents Retiree Health Benefit Plan (Plan) is a single-employer, defined-benefit, healthcare plan
administered by the University System Office, an organizational unit of the USG. The Plan was authorized pursuant
to OCGA § 47-21-21 for the purpose of accumulating funds necessary to meet employer costs of retiree post-
employment health insurance benefits.
Pursuant to the general powers conferred by the OCGA § 20-3-31, the USG has established group health and life
insurance programs for regular employees of the USG. It is the policy of the USG to permit employees of the USG
eligible for retirement or who become permanently and totally disabled to continue as members of the group health
and life insurance programs. The USG offers its employees and retirees under the age of 65 access to three self-
insured healthcare plan options and one fully insured plan option. For the USG’s Plan Year 2018, the following self-
insured health care options were available: Blue Choice HMO plan, (Blue Cross and Blue Shield of Georgia) Consumer
Choice HSA plan, and the (Blue Cross and Blue Shield of Georgia) Comprehensive Care plan. The USG offers a self-
insured dental plan administered by Delta Dental.
Retirees age 65 and older participate in a secondary healthcare coverage for Medicare-eligible retirees and dependents
provided through a retiree health care exchange option. The USG makes contributions to the retirees’ health
reimbursement account, which can be used by the retiree to pay premiums and out-of-pocket healthcare related
expenses.
The University's membership in the Plan consisted of the following at June 30, 2018:
Active Employees 5,107
Retirees or Beneficiaries Receiving Benefits 2,133
Retirees Receiving Life Insurance Only 564
Total
7,804
The contribution requirements of plan members and the employer are established and may be amended by the Board.
The Plan is substantially funded on a “pay-as-you-go” basis; however, amounts above the pay-as-you-go basis may
be contributed annually, either by specific appropriation or by Board designation.

2018 Annual Financial Report 59
The University pays the employer portion for group insurance for eligible retirees. The employer portion of health
insurance for its eligible retirees is based on rates that are established annually by the Board for the upcoming plan
year. For the 2018 plan year, the employer rate was approximately 85% of the total health insurance cost for eligible
retirees and the retiree rate was approximately 15%. With regard to life insurance, the employer covers the total
premium cost for $25,000 of basic life insurance. If an individual elects to have supplemental, and/or, dependent life
insurance coverage, such costs are borne entirely by the retiree.
For fiscal year 2018, the University contributed $18,710,488 to the plan for current premiums or claims.
OPEB Liabilities, OPEB Expense, and Deferred Outflows of Resources and Deferred Inflows of Resources
Related to OPEB
At June 30, 2018, the University reported a liability for its proportionate share of the net OPEB liability. The net OPEB
liability was measured as of June 30, 2017. The total OPEB liability used to calculate the net OPEB liability was based
on an actuarial valuation as of June 30, 2016. An expected total OPEB liability as of June 30, 2017 was determined
using standard roll-forward techniques. The University’s proportion of the net OPEB liability was actuarially determined
based on employer contributions during the fiscal year ended June 30, 2017. At June 30, 2017, the University’s
proportion was 11.852125%, which was a decrease of (0.148052)% from its proportion measured as of June 30, 2016.
For the year ended June 30, 2018, the University recognized OPEB expense of $34,898,980. At June 30, 2018, the
University reported deferred outflows of resources and deferred inflows of resources related to OPEB from the following
sources:
Deferred
Outflows of Deferred Inflows of
Resources Resources
Differences between expected and actual experience $ 12,136,913 $ —
Changes of assumptions — 34,247,419
Net difference between projected and actual earnings on OPEB plan investments 15,758 —
Changes in proportion and differences between contributions and proportionate
The University's contributions subsequent to the measurement date of $18,710,488 are reported as deferred outflows
of resources and will be recognized as a reduction of the net OPEB liability in the year ended June 30, 2019. Other
amounts reported as deferred outflows of resources and deferred inflows of resources related to OPEB will be
recognized in OPEB expense as follows:
Year Ended June 30:
2019
$ (5,508,513)
2020 $ (5,508,513)
2021 $ (5,508,513)
2022 $ (5,508,513)
2023 $ (5,236,829)
share of contributions — 5,176,133
Contributions subsequent to the measurement date 18,710,488 —
Total
$ 30,863,159
$ 39,423,552
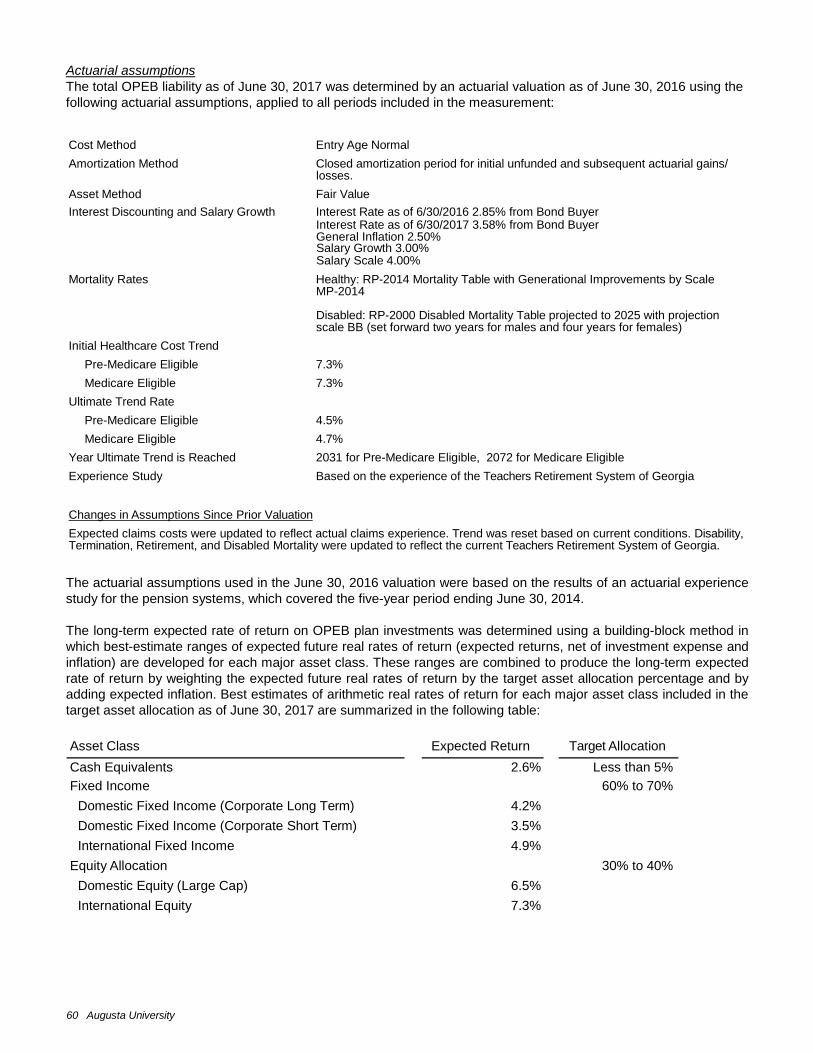
60 Augusta University
Actuarial assumptions
The total OPEB liability as of June 30, 2017 was determined by an actuarial valuation as of June 30, 2016 using the
following actuarial assumptions, applied to all periods included in the measurement:
Cost Method Entry Age Normal
Amortization Method Closed amortization period for initial unfunded and subsequent actuarial gains/ losses.
Asset Method Fair Value
Interest Discounting and Salary Growth Interest Rate as of 6/30/2016 2.85% from Bond Buyer Interest Rate as of 6/30/2017 3.58% from Bond Buyer General Inflation 2.50% Salary Growth 3.00% Salary Scale 4.00%
Mortality Rates Healthy: RP-2014 Mortality Table with Generational Improvements by Scale MP-2014
Disabled: RP-2000 Disabled Mortality Table projected to 2025 with projection scale BB (set forward two years for males and four years for females)
Initial Healthcare Cost Trend
Pre-Medicare Eligible 7.3%
Medicare Eligible 7.3%
Ultimate Trend Rate
Pre-Medicare Eligible 4.5%
Medicare Eligible 4.7%
Year Ultimate Trend is Reached 2031 for Pre-Medicare Eligible, 2072 for Medicare Eligible
Experience Study Based on the experience of the Teachers Retirement System of Georgia
Changes in Assumptions Since Prior Valuation
Expected claims costs were updated to reflect actual claims experience. Trend was reset based on current conditions. Disability, Termination, Retirement, and Disabled Mortality were updated to reflect the current Teachers Retirement System of Georgia.
The actuarial assumptions used in the June 30, 2016 valuation were based on the results of an actuarial experience
study for the pension systems, which covered the five-year period ending June 30, 2014.
The long-term expected rate of return on OPEB plan investments was determined using a building-block method in
which best-estimate ranges of expected future real rates of return (expected returns, net of investment expense and
inflation) are developed for each major asset class. These ranges are combined to produce the long-term expected
rate of return by weighting the expected future real rates of return by the target asset allocation percentage and by
adding expected inflation. Best estimates of arithmetic real rates of return for each major asset class included in the
target asset allocation as of June 30, 2017 are summarized in the following table:
Asset Class Expected Return Target Allocation
Cash Equivalents 2.6% Less than 5%
Fixed Income 60% to 70%
Domestic Fixed Income (Corporate Long Term) 4.2%
Domestic Fixed Income (Corporate Short Term) 3.5%
International Fixed Income 4.9%
Equity Allocation 30% to 40%
Domestic Equity (Large Cap) 6.5%
International Equity 7.3%
2018 Annual Financial Report 61
Discount rate
The Plan’s projected fiduciary net position at the end of 2018 is $0, based on the valuation completed for the fiscal
year ending June 30, 2017. As such, the Plan’s fiduciary net position was not projected to be available to make all
projected future benefit payments for current Plan members. The projected "depletion date" when projected benefits
are not covered by projected assets is 2018. Therefore, the long-term expected rate of return on Plan investments of
4.50% per annum was not applied to all periods of projected benefit payments to determine the total OPEB liability as
of June 30, 2017. Instead, a yield or index rate for a 20 year, tax-exempt general obligation municipal bond with an
average rating of AA or higher was used. This rate was determined to be 3.58% from the Bond Buyer.
Sensitivity of the net OPEB liability to changes in the discount rate
The following presents the the University’s proportionate share of the net OPEB liability, as well as what the University’s
proportionate share of the net OPEB liability would be if it were calculated using a discount rate that is 1% lower (2.58%)
or 1% higher (4.58%) than the current discount rate (3.58%):
1% Decrease Current Rate 1% Increase
2.58% 3.58% 4.58%
Proportionate Share of the Net OPEB Liability $ 597,458,315 $ 500,127,185 $ 424,250,913
Sensitivity of the net OPEB liability to changes in the healthcare cost trend rates
The following presents the University’s proportionate share of the net OPEB liability, as well as what the University’s
proportionate share of the net OPEB liability would be if it were calculated using healthcare cost trend rates that are
1% lower or 1% higher than the current healthcare cost trend rates:
Proportionate Share of the
1% Decrease Current Rate 1% Increase
Net OPEB Liability $ 421,877,008 $ 500,127,185 $ 603,509,857
Pre-Medicare Eligible 6.3% decreasing to 3.5% 7.3% decreasing to 4.5% 8.3% decreasing to 5.5%
Medicare Eligible 6.3% decreasing to 3.7% 7.3% decreasing to 4.7% 8.3% decreasing to 5.7%
OPEB plan fiduciary net position:
Detailed information about the Plan’s fiduciary net position is available in the USG Consolidated Annual Financial
Report which is publicly available at usg.edu/fiscal_affairs/financial_reporting/.
62 Augusta University
Note 18 Operating Expenses with Functional Classifications Business-type activity operating expenses by functional classification for fiscal 2018 are shown below:
Natural Classification
Functional Classification
Faculty Salaries
Staff Salaries Employee Benefits
Personal Services
Travel
Instruction $ 67,490,172 $ 30,159,871
$ 43,644,511 $ 71,930 $ 1,902,351
Research 9,759,046 12,724,944 5,814,647 693 514,941
Public Service 8,485,615 17,502,929 7,256,697 5,047 535,857
Academic Support 11,349,823 29,495,016 14,597,152 14,688 256,773
Student Services 305,661 3,565,272 1,294,071 47,082 124,471
Institutional Support 1,803,041 30,078,693 28,646,424 370,888 330,369
Plant Operations and Maintenance 270 12,048,207 4,822,775 — 45,656
Scholarships and Fellowships — 21,726 — — —
Auxiliary Enterprises 123,350 4,530,093 1,870,889 15,932 94,177
Patient Care 85,851,306 118,995,878 51,316,119 2,774 485,303
Total Operating Expenses $ 185,168,284 $ 259,122,629
$ 159,263,285 $ 529,034 $ 4,289,898
Natural Classification
Functional Classification Scholarships and
Fellowships
Utilities Supplies and
Other Services Depreciation/ Amortization
Total Operating Expenses
Instruction $ 722,218 $ 979,654
$ 20,031,814 $ 9,391,037 $ 174,393,558
Research 3,180 8,910 19,249,312 382,359 48,458,032
Public Service 32,200 154,032 9,814,587 190,495 43,977,459
Academic Support 300 123,886 4,832,173 1,722,893 62,392,704
Student Services 65,131 54,106 1,658,491 6,452 7,120,737
Institutional Support — 292,512 19,672,441 8,269,995 89,464,363
Plant Operations and Maintenance — 9,639,243 9,857,643 6,399,812 42,813,606
Scholarships and Fellowships 7,789,678 — — — 7,811,404
Auxiliary Enterprises 885,501 488,725 7,957,690 1,747,736 17,714,093
Patient Care — 257,964 134,762,383 — 391,671,727
Total Operating Expenses $ 9,498,208 $ 11,999,032
$ 227,836,534 $ 28,110,779 $ 885,817,683
Note 19 Subsequent Event Augusta University had no known subsequent events.
2018 Annual Financial Report 63
Note 20 Component Units Augusta University Foundation, Inc.
The Augusta University Foundation (AUF) is a private nonprofit organization that reports under FASB standards. As
such, certain revenue recognition criteria and presentation features are different from GASB revenue recognition criteria
and presentation features. The FASB reports were reclassified to the GASB presentation for external financial reporting
purposes in these financial statements.
The AUF acts primarily as a fund-raising organization to supplement the resources that are available to Augusta
University in support of its programs. During the year ended June 30, 2018, the AUF distributed approximately
$1,107,378 to Augusta University in support of capital outlay projects, scholarships, and other supporting activities.
Augusta University Research Institute, Inc.
Augusta University Research Institute (AURI) is a legally separate, tax-exempt component unit of the State of Georgia
reporting entity. The AURI serves to enhance the research mission of Augusta University by securing sponsored
research funding and by providing funding of special research initiatives. During the year ended June 30, 2018, the
AURI distributed approximately $60,279,814 to Augusta University in support of capital outlay projects, scholarships,
and other supporting activities.
AU Health System, Inc.
AU Health System, Inc. (the Health System), located in Augusta, Georgia, is a legally separate, tax-exempt organization,
which was established to promote the health science education missions and other tax-exempt functions and purposes
of the Augusta University (the University), AU Medical Associates (AUMA), and AU Medical Center, Inc. (AUMC), by
strategically coordinating operations of AUMA and AUMC. The Health System was incorporated under the laws of the
State of Georgia as a non-profit corporation on June 1, 2010. It began operations on June 1, 2010 as part of a Joint
Operating Agreement (the Agreement) with AUMA and AUMC. The Agreement was subsequently amended on June
26, 2014 to incorporate Roosevelt Warm Springs Rehabilitation & Specialty Hospitals, Inc. (RWSH) (a discretely
presented component unit) and on August 28, 2014 to incorporate AU Health Professions Associates, Inc. (Health
Professions Associates), Augusta University Nursing Associates, Inc. (Nursing Associates), and AU - Dental Associates
(Dental Associates).
During the year ended June 30, 2018, the Health System, AUMC, RWSH, and AUMA completed a series of corporate
and governance changes (the Reorganization) to better align the entities within the Health System and allow for efficient
and integrated funds flow and accounting. As a result of the Reorganization, AUMA became a blended component
unit of the Health System. Prior to the Reorganization, AUMA was a component unit of the University and AUMA's
financial position and operating results were not included in the Health System financial statements. In addition, as a
result of the Reorganization, AUMC and RWSH became blended component units of the Health System. Prior to the
Reorganization, AUMC and RWSH were discretely presented component units within the Health System's financial
statements. As part of the Reorganization, MCGH/PPG Reproductive Lab, LLC became a part of the integrated health
system. This was not included in the Health System statements in the prior year as it was a joint venture between
AUMC and AUMA and as such had a separate set of financial statements. The Health System has retrospectively
restated its financial statements for the change in reporting entity as if it had occurred as of the start of the year ended
June 30, 2017.
Georgia Health Sciences Foundation, Inc.
The Georgia Health Sciences Foundation (GHSF) is a private nonprofit organization that reports under FASB standards.
As such, certain revenue recognition criteria and presentation features are different from GASB revenue recognition
criteria and presentation features. The FASB reports were reclassified to the GASB presentation for external financial
reporting purposes in these financial statements.
The GHSF acts primarily as a fund-raising organization to supplement the resources that are available to Augusta
University in support of its programs. During the year ended June 30, 2018, the GHSF distributed approximately
$5,690,616 to Augusta University in support of capital outlay projects, scholarships, and other supporting activities.
Medical College of Georgia Foundation, Inc.
Medical College of Georgia Foundation, Inc. (the Foundation) is a nonprofit corporation incorporated under the laws
of the State of Georgia in 1954. The Foundation serves the needs and interests of the Medical College of Georgia,
the Augusta University Health Sciences campus, and the Augusta University Health System. The Foundation presents
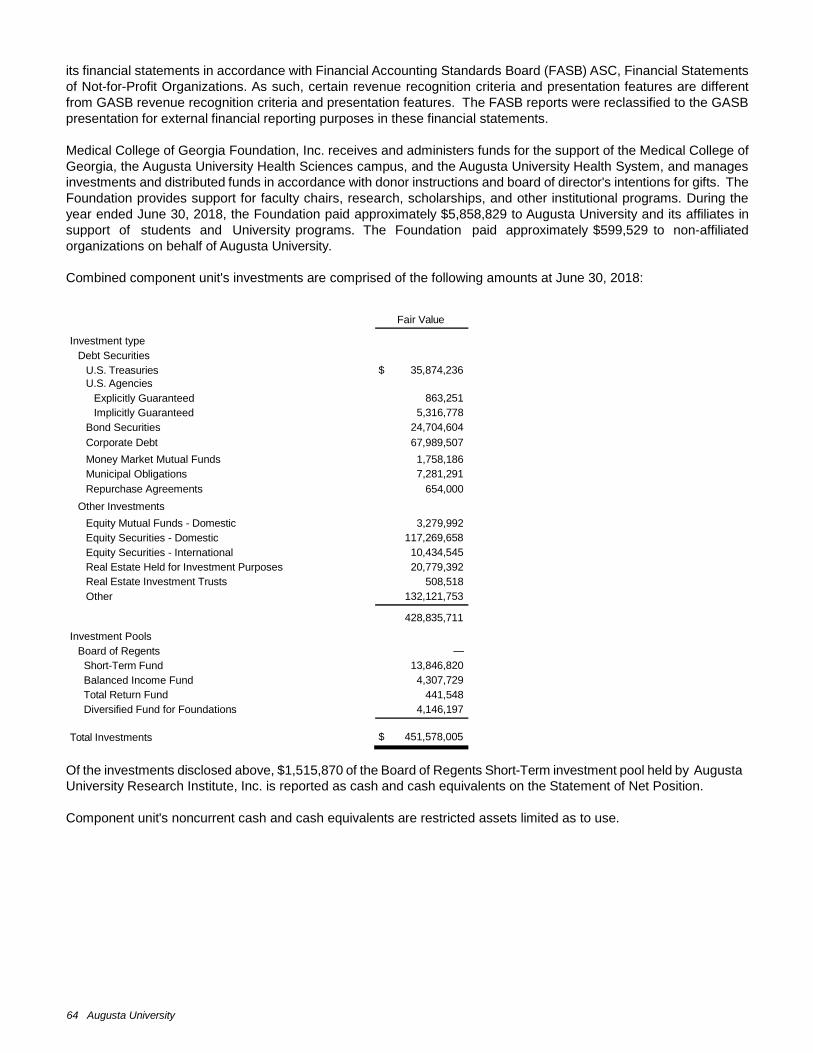
64 Augusta University
its financial statements in accordance with Financial Accounting Standards Board (FASB) ASC, Financial Statements
of Not-for-Profit Organizations. As such, certain revenue recognition criteria and presentation features are different
from GASB revenue recognition criteria and presentation features. The FASB reports were reclassified to the GASB
presentation for external financial reporting purposes in these financial statements.
Medical College of Georgia Foundation, Inc. receives and administers funds for the support of the Medical College of
Georgia, the Augusta University Health Sciences campus, and the Augusta University Health System, and manages
investments and distributed funds in accordance with donor instructions and board of director's intentions for gifts. The
Foundation provides support for faculty chairs, research, scholarships, and other institutional programs. During the
year ended June 30, 2018, the Foundation paid approximately $5,858,829 to Augusta University and its affiliates in
support of students and University programs. The Foundation paid approximately $599,529 to non-affiliated
organizations on behalf of Augusta University.
Combined component unit's investments are comprised of the following amounts at June 30, 2018:
Fair Value
Investment type
Debt Securities
U.S. Treasuries
$ 35,874,236
U.S. Agencies
Explicitly Guaranteed
863,251
Implicitly Guaranteed 5,316,778
Bond Securities 24,704,604
Corporate Debt 67,989,507
Money Market Mutual Funds 1,758,186
Municipal Obligations 7,281,291
Repurchase Agreements 654,000
Other Investments Equity Mutual Funds - Domestic 3,279,992
Equity Securities - Domestic 117,269,658
Equity Securities - International 10,434,545
Real Estate Held for Investment Purposes 20,779,392
Real Estate Investment Trusts 508,518
Other 132,121,753
428,835,711
Investment Pools
Board of Regents
—
Short-Term Fund 13,846,820
Balanced Income Fund 4,307,729
Total Return Fund 441,548
Diversified Fund for Foundations 4,146,197
Total Investments
$ 451,578,005
Of the investments disclosed above, $1,515,870 of the Board of Regents Short-Term investment pool held by Augusta
University Research Institute, Inc. is reported as cash and cash equivalents on the Statement of Net Position.
Component unit's noncurrent cash and cash equivalents are restricted assets limited as to use.
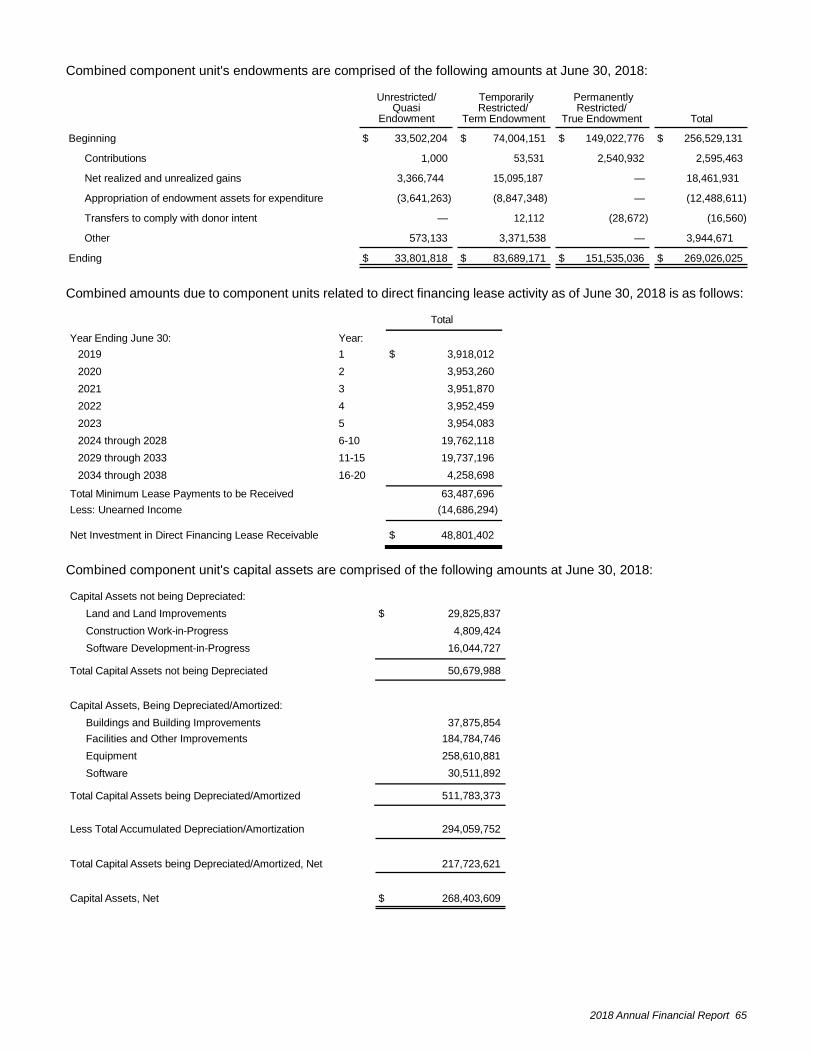
2018 Annual Financial Report 65
Combined component unit's endowments are comprised of the following amounts at June 30, 2018:
Unrestricted/ Quasi
Endowment
Temporarily Restricted/
Term Endowment
Permanently Restricted/
True Endowment Total
Beginning $ 33,502,204 $ 74,004,151 $ 149,022,776 $ 256,529,131
Contributions 1,000 53,531 2,540,932 2,595,463
Net realized and unrealized gains 3,366,744 15,095,187 — 18,461,931
Appropriation of endowment assets for expenditure (3,641,263) (8,847,348) — (12,488,611)
Transfers to comply with donor intent — 12,112 (28,672) (16,560)
Other 573,133 3,371,538 — 3,944,671
Ending $ 33,801,818 $ 83,689,171 $ 151,535,036 $ 269,026,025
Combined amounts due to component units related to direct financing lease activity as of June 30, 2018 is as follows:
Total
Year Ending June 30: Year: 2019 1 $ 3,918,012
2020 2 3,953,260
2021 3 3,951,870
2022 4 3,952,459
2023 5 3,954,083
2024 through 2028 6-10 19,762,118
2029 through 2033 11-15 19,737,196
2034 through 2038 16-20 4,258,698
Total Minimum Lease Payments to be Received 63,487,696
Less: Unearned Income (14,686,294)
Net Investment in Direct Financing Lease Receivable $ 48,801,402
Combined component unit's capital assets are comprised of the following amounts at June 30, 2018:
Capital Assets not being Depreciated:
Land and Land Improvements
$ 29,825,837
Construction Work-in-Progress 4,809,424
Software Development-in-Progress 16,044,727
Total Capital Assets not being Depreciated 50,679,988
Capital Assets, Being Depreciated/Amortized:
Buildings and Building Improvements
37,875,854
Facilities and Other Improvements 184,784,746
Equipment 258,610,881
Software 30,511,892
Total Capital Assets being Depreciated/Amortized 511,783,373
Less Total Accumulated Depreciation/Amortization 294,059,752
Total Capital Assets being Depreciated/Amortized, Net 217,723,621
Capital Assets, Net $ 268,403,609
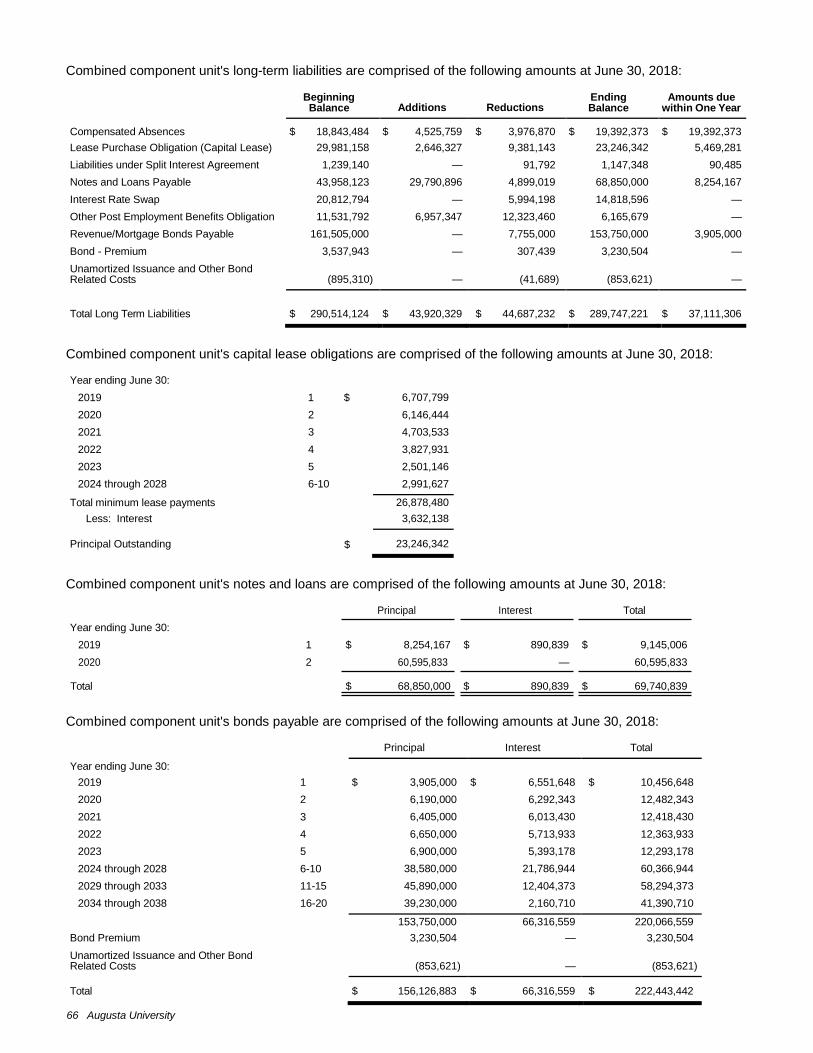
66 Augusta University
Combined component unit's long-term liabilities are comprised of the following amounts at June 30, 2018:
Beginning Balance
Additions
Reductions
Ending Balance
Amounts due within One Year
Compensated Absences $ 18,843,484 $ 4,525,759 $ 3,976,870 $ 19,392,373 $ 19,392,373
Lease Purchase Obligation (Capital Lease) 29,981,158 2,646,327 9,381,143 23,246,342 5,469,281
Liabilities under Split Interest Agreement 1,239,140 — 91,792 1,147,348 90,485
Notes and Loans Payable 43,958,123 29,790,896 4,899,019 68,850,000 8,254,167
Interest Rate Swap 20,812,794 — 5,994,198 14,818,596 —
Other Post Employment Benefits Obligation 11,531,792 6,957,347 12,323,460 6,165,679 —
Revenue/Mortgage Bonds Payable 161,505,000 — 7,755,000 153,750,000 3,905,000
Bond - Premium 3,537,943 — 307,439 3,230,504 —
Unamortized Issuance and Other Bond Related Costs
(895,310)
—
(41,689)
(853,621)
—
Total Long Term Liabilities
$ 290,514,124
$ 43,920,329
$ 44,687,232
$ 289,747,221
$ 37,111,306
Combined component unit's capital lease obligations are comprised of the following amounts at June 30, 2018:
Year ending June 30:
2019 1 $ 6,707,799
2020 2 6,146,444
2021 3 4,703,533
2022 4 3,827,931
2023 5 2,501,146
2024 through 2028 6-10 2,991,627
Total minimum lease payments 26,878,480
Less: Interest 3,632,138
Principal Outstanding $ 23,246,342
Combined component unit's notes and loans are comprised of the following amounts at June 30, 2018:
Year ending June 30:
Principal Interest Total
2019 1 $ 8,254,167 $ 890,839 $ 9,145,006
2020 2 60,595,833 — 60,595,833
Total $ 68,850,000 $ 890,839 $ 69,740,839
Combined component unit's bonds payable are comprised of the following amounts at June 30, 2018:
Principal Interest Total
Year ending June 30: 2019 1 $ 3,905,000 $ 6,551,648 $ 10,456,648
2020 2 6,190,000 6,292,343 12,482,343
2021 3 6,405,000 6,013,430 12,418,430
2022 4 6,650,000 5,713,933 12,363,933
2023 5 6,900,000 5,393,178 12,293,178
2024 through 2028 6-10 38,580,000 21,786,944 60,366,944
2029 through 2033 11-15 45,890,000 12,404,373 58,294,373
2034 through 2038 16-20 39,230,000 2,160,710 41,390,710
153,750,000 66,316,559 220,066,559
Bond Premium 3,230,504 — 3,230,504
Unamortized Issuance and Other Bond Related Costs
(853,621)
—
(853,621)
Total $ 156,126,883 $ 66,316,559 $ 222,443,442

2018 Annual Financial Report 67
Required
Supplementary
Information

68 Augusta University
AUGUSTA UNIVERSITY
REQUIRED SUPPLEMENTARY INFORMATION
SCHEDULE OF CONTRIBUTIONS
DEFINED BENEFIT PENSION PLANS
FOR THE LAST TEN YEARS
Year Ended
Actuarially Determined Contribution
(a)
Contributions in Relation to the
Actuarially Determined Contribution
(b)
Contribution Deficiency (Excess)
(a-b)
Covered Payroll
(c)
Contributions as a
Percentage of Covered Payroll (b/c)
Early Retirement Plan 6/30/2018 $ 11,767,714 $ 13,084,672 $ (1,316,958) N/A N/A
6/30/2017 $ 12,107,903 $ 13,084,672 $ (976,769) N/A N/A
6/30/2016 $ 12,760,669 $ 13,084,672 $ (324,003) N/A N/A
6/30/2015 $ 12,996,582 $ 13,084,672 $ (88,090) N/A N/A
6/30/2014 $ 13,045,051 $ 13,084,672 $ (39,621) N/A N/A
6/30/2013 $ 13,055,907 $ 13,225,850 $ (169,943) N/A N/A
6/30/2012 $ 12,861,601 $ 13,225,850 $ (364,249) N/A N/A
6/30/2011 $ 12,973,559 $ 13,225,850 $ (252,291) N/A N/A
6/30/2010 $ 13,050,409 $ 13,225,850 $ (175,441) N/A N/A
6/30/2009 $ 13,225,850 $ 13,225,850 $ — N/A N/A
Employees' Retirement System
6/30/2018
$ 816,038
$ 816,038
$ — $ 3,296,810
24.75%
6/30/2017 $ 457,473 $ 457,473 $ — $ 1,845,641 24.79%
6/30/2016 $ 178,786 $ 178,786 $ — $ 723,246 24.72%
6/30/2015 $ 143,532 $ 143,532 $ — $ 653,608 21.96%
6/30/2014 $ 104,806 $ 104,806 $ — $ 567,746 18.46%
6/30/2013 $ 89,395 $ 89,395 $ — $ 599,617 14.91%
6/30/2012 $ 65,638 $ 65,638 $ — $ 564,385 11.63%
6/30/2011 $ 87,040 $ 87,040 $ — $ 836,119 10.41%
6/30/2010 $ 94,168 $ 94,168 $ — $ 904,592 10.41%
6/30/2009 $ 89,258 $ 89,258 $ — $ 853,028 10.46%
Teachers Retirement System 6/30/2018 $ 34,287,410 $ 34,287,410 $ — $ 203,978,259 16.81%
6/30/2017 $ 27,473,760 $ 27,473,760 $ — $ 192,528,053 14.27%
6/30/2016 $ 26,234,649 $ 26,234,649 $ — $ 183,847,072 14.27%
6/30/2015 $ 23,837,005 $ 23,837,005 $ — $ 181,274,041 13.15%
6/30/2014 $ 21,780,531 $ 21,780,531 $ — $ 177,368,194 12.28%
6/30/2013 $ 19,623,178 $ 19,623,178 $ — $ 171,985,813 11.41%
6/30/2012 $ 18,166,483 $ 18,166,483 $ — $ 176,716,761 10.28%
6/30/2011 $ 17,965,990 $ 17,965,990 $ — $ 174,766,440 10.28%
6/30/2010 $ 17,059,127 $ 17,059,127 $ — $ 175,145,041 9.74%
6/30/2009 $ 16,179,733 $ 16,179,733 $ — $ 174,350,571 9.28%
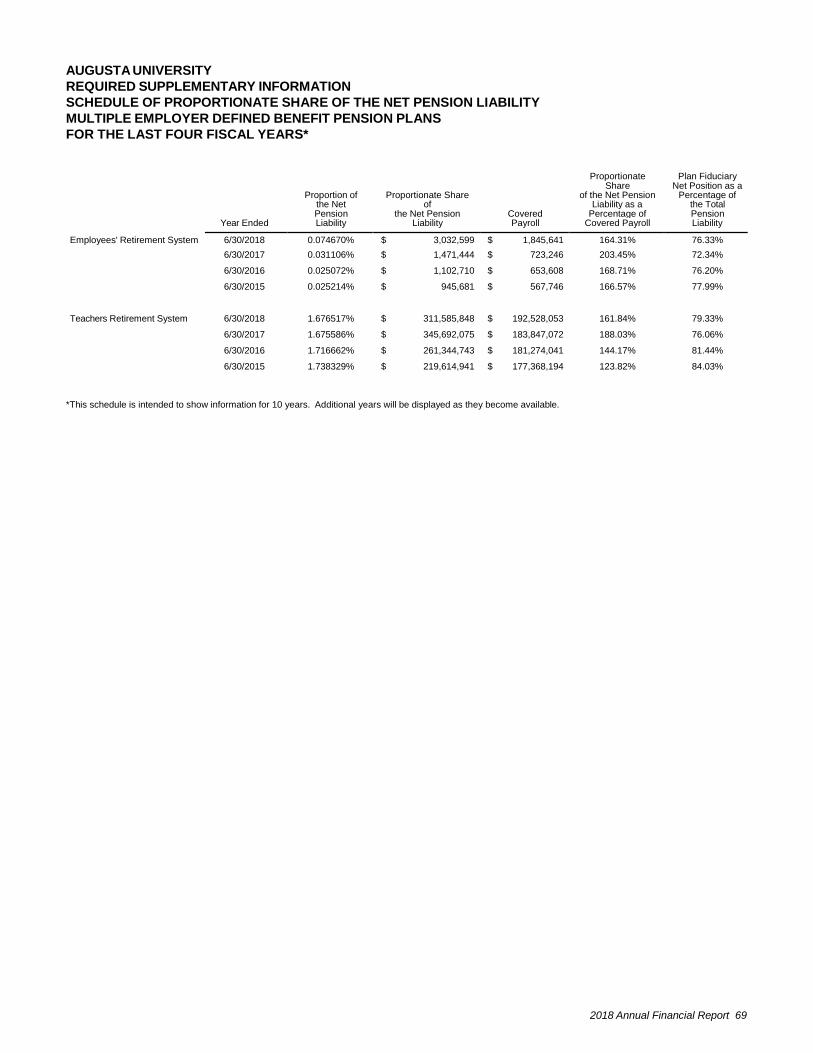
2018 Annual Financial Report 69
AUGUSTA UNIVERSITY
REQUIRED SUPPLEMENTARY INFORMATION
SCHEDULE OF PROPORTIONATE SHARE OF THE NET PENSION LIABILITY
MULTIPLE EMPLOYER DEFINED BENEFIT PENSION PLANS
FOR THE LAST FOUR FISCAL YEARS*
Proportionate Plan Fiduciary Share Net Position as a
Proportion of Proportionate Share of the Net Pension Percentage of
the Net of Liability as a the Total
Pension the Net Pension Covered Percentage of Pension
Year Ended Liability Liability Payroll Covered Payroll Liability
Employees' Retirement System 6/30/2018 0.074670% $ 3,032,599 $ 1,845,641 164.31% 76.33%
6/30/2017 0.031106% $ 1,471,444 $ 723,246 203.45% 72.34%
6/30/2016 0.025072% $ 1,102,710 $ 653,608 168.71% 76.20%
6/30/2015 0.025214% $ 945,681 $ 567,746 166.57% 77.99%
Teachers Retirement System 6/30/2018 1.676517% $ 311,585,848 $ 192,528,053 161.84% 79.33%
6/30/2017 1.675586% $ 345,692,075 $ 183,847,072 188.03% 76.06%
6/30/2016 1.716662% $ 261,344,743 $ 181,274,041 144.17% 81.44%
6/30/2015 1.738329% $ 219,614,941 $ 177,368,194 123.82% 84.03%
*This schedule is intended to show information for 10 years. Additional years will be displayed as they become available.

70 Augusta University
AUGUSTA UNIVERSITY
REQUIRED SUPPLEMENTARY INFORMATION
SCHEDULE OF EMPLOYERS' AND NONEMPLOYERS' NET PENSION LIABILITY
EARLY RETIREMENT PLAN - AUGUSTA UNIVERSITY
SINGLE EMPLOYER DEFINED BENEFIT PENSION PLAN
FOR THE LAST FIVE FISCAL YEARS*
(Dollar amounts in millions)
2018 2017 2016 2015 2014
Total Pension Liability
$ 148.9
$ 149.2
$ 151.8
$ 143.8
$ 145.4
Plan Fiduciary Net Position (99.0) (90.4) (80.3) (79.1) (76.2)
Net Pension Liability
$ 49.9
$ 58.8
$ 71.5
$ 64.7
$ 69.2
Plan Fiduciary Net Position as a Percentage of the Total Pension Liability
66.5%
60.6%
52.9%
55.0%
52.4%
Covered Payroll —% —% —% —% —%
Employers’ and Nonemployers’ Net Pension Liability as a Percentage of
Covered Payroll N/A N/A N/A N/A N/A
*This schedule is intended to show information for 10 years. Additional years will be displayed as they become available.
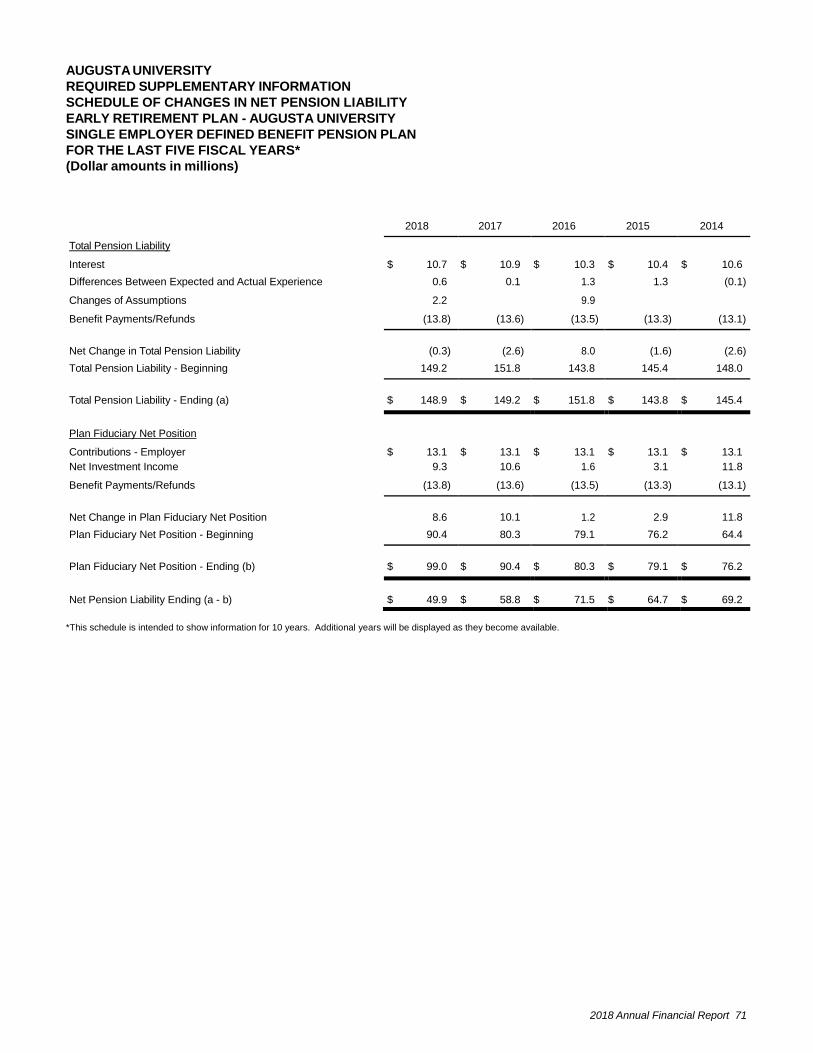
2018 Annual Financial Report 71
AUGUSTA UNIVERSITY
REQUIRED SUPPLEMENTARY INFORMATION
SCHEDULE OF CHANGES IN NET PENSION LIABILITY
EARLY RETIREMENT PLAN - AUGUSTA UNIVERSITY
SINGLE EMPLOYER DEFINED BENEFIT PENSION PLAN
FOR THE LAST FIVE FISCAL YEARS*
(Dollar amounts in millions)
2018 2017 2016 2015 2014
Total Pension Liability
Interest
$ 10.7
$ 10.9
$ 10.3
$ 10.4
$ 10.6
Differences Between Expected and Actual Experience 0.6 0.1 1.3 1.3 (0.1)
Changes of Assumptions 2.2 9.9 Benefit Payments/Refunds (13.8) (13.6) (13.5) (13.3) (13.1)
Net Change in Total Pension Liability
(0.3)
(2.6)
8.0
(1.6)
(2.6)
Total Pension Liability - Beginning 149.2 151.8 143.8 145.4 148.0
Total Pension Liability - Ending (a)
$ 148.9
$ 149.2
$ 151.8
$ 143.8
$ 145.4
Plan Fiduciary Net Position
Contributions - Employer
$ 13.1
$ 13.1
$ 13.1
$ 13.1
$ 13.1
Net Investment Income 9.3 10.6 1.6 3.1 11.8
Benefit Payments/Refunds (13.8) (13.6) (13.5) (13.3) (13.1)
Net Change in Plan Fiduciary Net Position
8.6
10.1
1.2
2.9
11.8
Plan Fiduciary Net Position - Beginning 90.4 80.3 79.1 76.2 64.4
Plan Fiduciary Net Position - Ending (b)
$ 99.0
$ 90.4
$ 80.3
$ 79.1
$ 76.2
Net Pension Liability Ending (a - b)
$ 49.9
$ 58.8
$ 71.5
$ 64.7
$ 69.2
*This schedule is intended to show information for 10 years. Additional years will be displayed as they become available.

72 Augusta University
AUGUSTA UNIVERSITY
REQUIRED SUPPLEMENTARY INFORMATION
SCHEDULE OF INVESTMENT RETURNS
EARLY RETIREMENT PLAN - AUGUSTA UNIVERSITY
SINGLE EMPLOYER DEFINED BENEFIT PENSION PLAN
FOR THE LAST FIVE FISCAL YEARS*
2018 2017 2016 2015 2014
Annual Money-Weighted Rate of Return, Net of Investment Expense
10.42%
13.39%
2.02%
4.13%
18.35%
*This schedule is intended to show information for 10 years. Additional years will be displayed as they become available.
2018 Annual Financial Report 73
AUGUSTA UNIVERSITY
REQUIRED SUPPLEMENTARY INFORMATION
NOTES TO THE REQUIRED SUPPLEMENTARY INFORMATION
DEFINED BENEFIT PENSION PLANS
METHODS AND ASSUMPTIONS
FOR FISCAL YEAR ENDED JUNE 30, 2018
Changes of assumptions
Early Retirement Plan: The expectation of retired life mortality was changed effective June 30, 2018 to the RP-2014 White Collar Mortality Table rather than the RP-2014 Mortality Table used previously. Mortality rates were adjusted to better recognize current and future mortality improvements.
Employees’ Retirement System: On December 17, 2015, the Board adopted recommended changes to the economic and demographic assumptions utilized by the System. Primary among the changes were the updates to rates of mortality, retirement, disability, withdrawal and salary increases.
Teachers Retirement System: In 2010 and later, the expectation of retired life mortality was changed to the RP 2000 Mortality Tables rather than the 1994 Group Annuity Mortality Table, which was used prior to 2010. In 2010, rates of withdrawal, retirement, disability and mortality were adjusted to more closely reflect actual experience. In 2010, assumed rates of salary increase were adjusted to more closely reflect actual and anticipated experience.
On November 18, 2015, the Board adopted recommended changes to the economic and demographic assumptions utilized by the System. Primary among the changes were the updates to rates of mortality, retirement, disability, withdrawal and salary increases. The expectation of retired life mortality was changed to RP 2000 White Collar Mortality Table with future mortality improvement projected to 2025 with the Society of Actuaries’ projection scale BB (set forward one year for males).
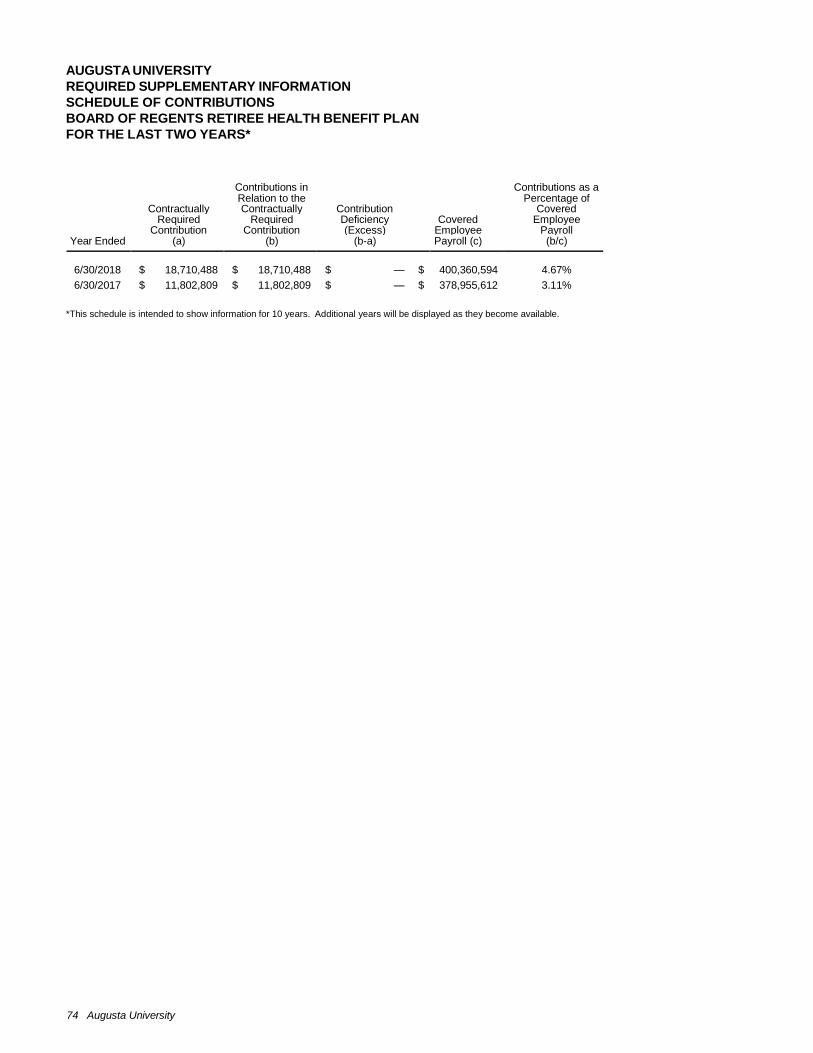
74 Augusta University
AUGUSTA UNIVERSITY
REQUIRED SUPPLEMENTARY INFORMATION
SCHEDULE OF CONTRIBUTIONS
BOARD OF REGENTS RETIREE HEALTH BENEFIT PLAN
FOR THE LAST TWO YEARS*
Contributions in Contributions as a
Relation to the Percentage of
Contractually Contractually Contribution Covered
Required Required Deficiency Covered Employee
Contribution Contribution (Excess) Employee Payroll Year Ended (a) (b) (b-a) Payroll (c) (b/c)
6/30/2018
$ 18,710,488
$ 18,710,488
$ — $
400,360,594
4.67%
6/30/2017 $ 11,802,809 $ 11,802,809 $ — $ 378,955,612 3.11%
*This schedule is intended to show information for 10 years. Additional years will be displayed as they become available.

2018 Annual Financial Report 75
AUGUSTA UNIVERSITY
REQUIRED SUPPLEMENTARY INFORMATION
SCHEDULE OF PROPORTIONATE SHARE OF THE NET OPEB LIABILITY
BOARD OF REGENTS RETIREE HEALTH BENEFIT PLAN
FOR THE FISCAL YEAR ENDED JUNE 30, 2018*
Proportionate Share Plan Fiduciary
Proportion of Proportionate Share of the Net OPEB Net Position as a
the Net of Covered Liability as a Percentage of
OPEB the Net OPEB Employee Percentage of the Total OPEB Year Ended Liability Liability Payroll Covered Payroll Liability
6/30/2018 11.85% $ 500,127,185 $ 378,955,612 131.98% 0.19%
*This schedule is intended to show information for 10 years. Additional years will be displayed as they become available.
76 Augusta University
AUGUSTA UNIVERSITY
REQUIRED SUPPLEMENTARY INFORMATION
NOTES TO THE REQUIRED SUPPLEMENTARY INFORMATION
BOARD OF REGENTS RETIREE HEALTH BENEFIT PLAN
METHODS AND ASSUMPTIONS
FOR FISCAL YEAR ENDED JUNE 30, 2018
Changes in Assumptions Since Prior Valuation
Expected claim costs were updated to reflect actual claims experience. Trend was reset based on current conditions. Disability, termination, retirement, and disabled mortality tables were updated to reflect the current Teachers Retirement System of Georgia methodology.
2018 Annual Financial Report 77
Supplementary
Information

78 Augusta University
AUGUSTA UNIVERSITY
BALANCE SHEET (NON-GAAP BASIS)
BUDGET FUNDS
JUNE 30, 2018
(UNAUDITED)
ASSETS
Cash and Cash Equivalents
$ 21,680,940.91
Investments
Accounts Receivable
Federal Financial Assistance
77,924,454.33
5,095,698.46
Other 57,916,179.73
Margin Allocation 6,638,215.00
Prepaid Expenditures 4,528,036.12
Inventories 97,562.65
Other Assets 11,000.00
Total Assets
$ 173,892,087.20
LIABILITIES AND FUND EQUITY
Liabilities
Accrued Payroll
$ 3,066,415.31
Encumbrance Payable 16,719,626.53
Accounts Payable 5,426,663.95
Unearned Revenue 43,571,278.00
Total Liabilities
68,783,983.79
Fund Balances
Reserved
Department Sales and Services
6,076,320.64
Indirect Cost Recoveries 39,651,877.61
Technology Fees 194,272.99
Restricted/Sponsored Funds 54,181,200.01
Uncollectible Accounts Receivable 441,079.05
Inventories 129,717.10
Tuition Carry - Forward 2,562,870.06
Carry-Over "Per Governor's Office of Planning and Budget"
Unreserved
Surplus
1,737,762.15
133,003.80
Total Fund Balances
105,108,103.41
Total Liabilities and Fund Balances
$ 173,892,087.20
Actual amounts were prepared on a prescribed basis of accounting that demonstrates compliance with budgetary statutes and regulations of the State of Georgia, which is a special purpose framework.

2018 Annual Financial Report 79
AUGUSTA UNIVERSITY
STATEMENT OF FUNDS AVAILABLE AND EXPENDITURES COMPARED TO BUDGET
BY PROGRAM AND FUNDING SOURCE
BUDGET FUND
FOR THE FISCAL YEAR ENDED JUNE 30, 2018
Funds Available Compared to Budget
Public Service / Special Funding Initiatives
State Appropriation
Original
Appropriation
Amended
Appropriation
Final
Budget
Current Year Revenues
Prior Year Reserve
Carry-Over
State General Funds $ 13,968,097.00 $ 13,968,097.00 $ 26,630,370.00 $ 26,630,370.00 $ —
State Funds - Prior Year Cary-Over
State General Funds - Prior Year — — 2,700,782.00 — 2,700,782.22
Total Public Service / Special Funding Initiatives 13,968,097.00 13,968,097.00 29,331,152.00 26,630,370.00 2,700,782.22
Teaching
State Appropriation
State General Funds 204,226,511.00 204,226,511.00 198,574,277.00 198,574,277.00 —
Other Funds 630,868,984.00 630,868,984.00 791,224,573.00 651,080,403.32 76,475,645.43
Total Teaching 835,095,495.00 835,095,495.00 989,798,850.00 849,654,680.32 76,475,645.43
Total Operating Activity $ 849,063,592.00 $ 849,063,592.00 $ 1,019,130,002.00 $ 876,285,050.32 $ 79,176,427.65
Actual amounts were prepared on a prescribed basis of accounting that demonstrates compliance with budgetary statutes and regulations of the State of Georgia, which is a special purpose
framework.
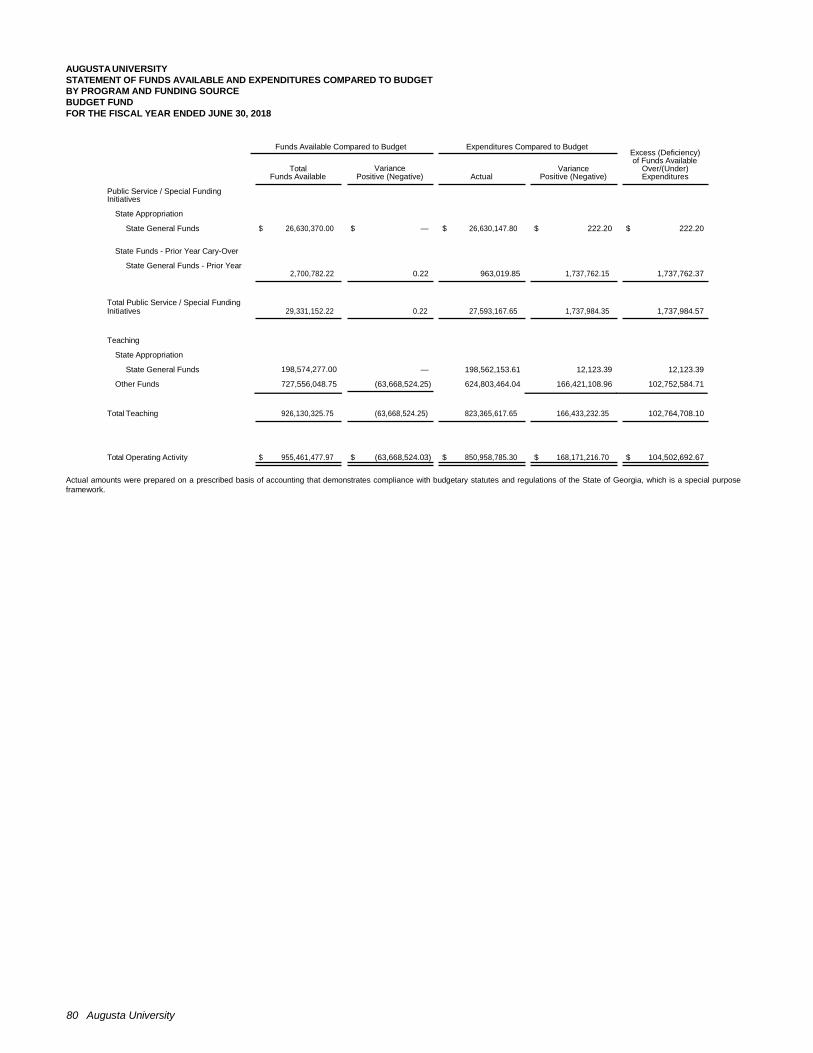
80 Augusta University
AUGUSTA UNIVERSITY
STATEMENT OF FUNDS AVAILABLE AND EXPENDITURES COMPARED TO BUDGET
BY PROGRAM AND FUNDING SOURCE
BUDGET FUND
FOR THE FISCAL YEAR ENDED JUNE 30, 2018
Funds Available Compared to Budget Expenditures Compared to Budget
Excess (Deficiency) of Funds Available
Public Service / Special Funding Initiatives
State Appropriation
Total Funds Available
Variance Positive (Negative) Actual
Variance Positive (Negative)
Over/(Under) Expenditures
State General Funds $ 26,630,370.00 $ — $ 26,630,147.80 $ 222.20 $ 222.20
State Funds - Prior Year Cary-Over
State General Funds - Prior Year 2,700,782.22 0.22 963,019.85 1,737,762.15 1,737,762.37
Total Public Service / Special Funding Initiatives 29,331,152.22 0.22 27,593,167.65 1,737,984.35 1,737,984.57
Teaching
State Appropriation
State General Funds 198,574,277.00 — 198,562,153.61 12,123.39 12,123.39
Other Funds 727,556,048.75 (63,668,524.25) 624,803,464.04 166,421,108.96 102,752,584.71
Total Teaching 926,130,325.75 (63,668,524.25) 823,365,617.65 166,433,232.35 102,764,708.10
Total Operating Activity $ 955,461,477.97 $ (63,668,524.03) $ 850,958,785.30 $ 168,171,216.70 $ 104,502,692.67
Actual amounts were prepared on a prescribed basis of accounting that demonstrates compliance with budgetary statutes and regulations of the State of Georgia, which is a special purpose
framework.
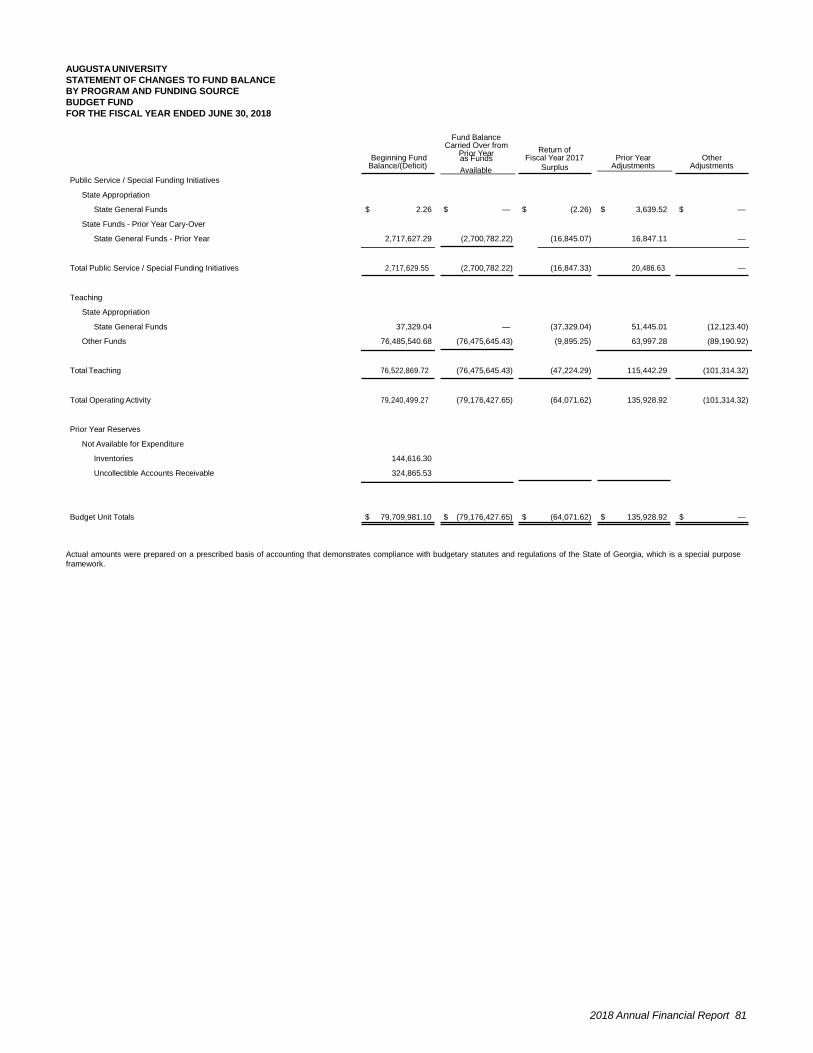
2018 Annual Financial Report 81
AUGUSTA UNIVERSITY
STATEMENT OF CHANGES TO FUND BALANCE
BY PROGRAM AND FUNDING SOURCE
BUDGET FUND
FOR THE FISCAL YEAR ENDED JUNE 30, 2018
Beginning Fund Balance/(Deficit)
Fund Balance Carried Over from
Prior Year as Funds
Return of
Fiscal Year 2017
Prior Year Adjustments
Other Adjustments
Public Service / Special Funding Initiatives
State Appropriation
Available Surplus
Total Public Service / Special Funding Initiatives 2,717,629.55 (2,700,782.22) (16,847.33) 20,486.63 —
Teaching
State Appropriation
State General Funds 37,329.04 — (37,329.04) 51,445.01 (12,123.40)
Other Funds 76,485,540.68 (76,475,645.43) (9,895.25) 63,997.28 (89,190.92)
Total Teaching 76,522,869.72 (76,475,645.43) (47,224.29) 115,442.29 (101,314.32)
Total Operating Activity 79,240,499.27 (79,176,427.65) (64,071.62) 135,928.92 (101,314.32)
Prior Year Reserves
Not Available for Expenditure
Inventories 144,616.30 (14,899.20)
Uncollectible Accounts Receivable 324,865.53 116,213.52
Budget Unit Totals $ 79,709,981.10 $ (79,176,427.65) $ (64,071.62) $ 135,928.92 $ —
Actual amounts were prepared on a prescribed basis of accounting that demonstrates compliance with budgetary statutes and regulations of the State of Georgia, which is a special purpose
framework.
State General Funds $ 2.26 $ — $ (2.26) $ 3,639.52 $ —
State Funds - Prior Year Cary-Over State General Funds - Prior Year 2,717,627.29 (2,700,782.22) (16,845.07) 16,847.11 —

82 Augusta University
AUGUSTA UNIVERSITY
STATEMENT OF CHANGES TO FUND BALANCE
BY PROGRAM AND FUNDING SOURCE
BUDGET FUND
FOR THE FISCAL YEAR ENDED JUNE 30, 2018
Excess
(Deficiency) of Funds Available
Over/Under)
Ending Fund Analysis of Ending Fund Balance
Balance/(Deficit)
Public Service / Special Funding Initiatives
State Appropriation
Expenditures June 30 Reserved Surplus/(Deficit) Total
Total Public Service / Special Funding Initiatives 1,737,984.57 1,758,471.20 1,737,762.15 20,709.05 1,758,471.20
Teaching
State Appropriation
State General Funds 12,123.39 51,445.00 — 51,445.00 51,445.00
Other Funds 102,752,584.71 102,727,391.07 102,666,541.31 60,849.75 102,727,391.06
Total Teaching 102,764,708.10 102,778,836.07 102,666,541.31 112,294.75 102,778,836.06
Total Operating Activity 104,502,692.67 104,537,307.27 104,404,303.46 133,003.80 104,537,307.26
Prior Year Reserves
Not Available for Expenditure
Inventories 129,717.10 129,717.10 129,717.10
Uncollectible Accounts Receivable 441,079.05 441,079.05 441,079.05
Early Retirement Program (Georgia Health Sciences University
—
—
—
Budget Unit Totals
$ 104,502,692.67 $ 105,108,103.42
$ 104,975,099.61
$ 133,003.80
$ 105,108,103.41
Departmental Sales and Services
$ 6,076,320.64
$ —
$ 6,076,320.64
Indirect Cost Recovery 39,651,877.61 — 39,651,877.61
Technology Fees 194,272.99 — 194,272.99
Restricted/Sponsored Funds 54,181,200.01 — 54,181,200.01
Carry-Over "Per Governor's Office of Planning and Budget"
1,737,762.15
—
1,737,762.15
Tuition Carry-Forward 2,562,870.06 — 2,562,870.06
Uncollectible Accounts Receivable 441,079.05 — 441,079.05
Inventories 129,717.10 — 129,717.10
Surplus — 133,003.80 133,003.80
$ 104,975,099.61
$ 133,003.80
$ 105,108,103.41
Actual amounts were prepared on a prescribed basis of accounting that demonstrates compliance with budgetary statutes and regulations of the State of Georgia, which is a special purpose
framework.
State General Funds $ 222.20 $ 3,861.72 $ — $ 3,861.72 $ 3,861.72
State Funds - Prior Year Cary-Over State General Funds - Prior Year 1,737,762.37 1,754,609.48 1,737,762.15 16,847.33 1,754,609.48

AUGUSTA UNIVERSITY
1120 15th Street
Augusta, Ga 30912
augusta.edu


![Audited Financial Results FY 2018-19 April 24, 2019 · Key Financial Highlights: FY 18-19 vs FY 17-18 as per Indian Accounting Standards [IndAS] Key Financial Highlights: Q4 FY 18-19](https://img.pdfslide.net/doc/110x75/5f1a178b938ef210d370e190/audited-financial-results-fy-2018-19-april-24-2019-key-financial-highlights-fy.jpg)