Embed Size (px)
Citation preview

Stock Code:2409The Annual Report posthttp://mops.twse.com.twhttp://AUO.com
AU OPTRONICS CORP.2019 ANNUAL REPORT
This is a translation of the 2019 annual report of AU Optronics Corp. The translation is for reference only. If there is any discrepancy between the English version and Chinese version, the Chinese version shall prevail.
-Notice to readers-
Printed on February 25, 2020.
AU Optronics Corporation
2019 Annual Report
AUO Spokesperson
Name: Benjamin Tseng
Title: Chief Financial Officer
AUO Deputy Spokesperson
Name: Jack Juang
Title:Director of Financial Planning Div.
TEL:03-500-8800
Email:[email protected]
Corporate Headquarters, Branches, and Fabs
Corporate Headquarter: No. 1, Li-Hsin Rd. 2, East Dist., Hsinchu Science Park, Hsinchu City
Taoyuan Branch: No. 1, Xinhe Road, Longtan Dist., Taoyuan City Address of Fabs:
Fab L3B: No. 1, Li-Hsin Rd. 2, East Dist., Hsinchu City
Fab 3C(L5): No. 23, Li-Hsin Rd., East Dist., Hsinchu City
Fab Longke: No.228, Longke St./No.288, Longyuan 1st Rd./ No.338, Longyuan 1st
Rd./ and No.388-1, Longyuan 1st Rd., Longtan Dist.,Taoyuan City
Fab Longtan: No. 1, Xinhe Road, Longtan Dist., Taoyuan City
Fab Huaya: No.189 Hwaya Rd. 2, Guishan Dist., Taoyuan City
Fab Taichung: No.1, JhongKe Rd./ No.2, Keya Rd./ and No.3, Keya Rd., Xitun Dist.,
Taichung City
Fab Houli: No.1, Machang Rd., Houli Dist., Taichung City
Fab Tainan: No.36, Keji 1st Rd., Annan Dist., Tainan City
Fab Kaohsiung: No.9, Luke 3rd Rd., Luzhu Dist., Kaohsiung City
TEL: 03-500-8800
Stock Transfer Agent Company: Stock-Affairs Agency Dept. of Taishin International Bank
Address: B1, No. 96, Sec. 1, Jianguo N. Rd, Zhongshan Dist., Taipei City
Website: www.taishinbank.com.tw
TEL: 02-2504-8125
Certified Public Accountant (CPA) and accounting firm for the financial statements of the most
recent year:
CPA: Hsin-Hai Wei & Chien-Hui Lu
Company: KPMG Certificated Public Accountants
Address: 68F, No.7, Sec.5, Xinyi Rd., Taipei (TAIPEI 101Tower)
Website: home.kpmg.com/tw
TEL: 02-8101-6666
Offshore secondary exchange and disclosure information available at:
Offshore secondary exchange: U.S. OTC market
Website: www.otcmarkets.com
Company code: AUOTY
Company website: www.auo.com

Contents
AU Optronics 2019 Annual Report
1
Contents
Chapter 1 Letter to Shareholders 2
Chapter 2 Company Profile 4
Chapter 3 Corporate Governance 5
Chapter 4 Capital Overview 52
Chapter 5 Operational Highlights 58
Chapter 6 Financial Information 73
Chapter 7 Review of Financial Conditions, Operating Result ,and Risk
Management 79
Chapter 8 Special Disclosure 87
Appendix 1 Consolidated Financial Statements and Independent Auditors'
Report for the most recent years 97
Appendix 2 Parent Company Only Financial Statements and Independent
Auditors' Report for the most recent years 194

AU Optronics 2019 Annual Report 2
Chapter 1 Letter to Shareholders
Dear Shareholders,
In 2019, the demand in the end-consumer market for panels was relatively weak as new capacity additions widened the
gap between market supply and demand, resulting in panel prices falling sharply. Despite best efforts by the
management team to optimize the product mix and control costs, the business performance did not meet
expectations. The consolidated revenue in 2019 was NT$268.79 billion, lower by 12.6% from 2018. The net operating
loss was NT$20.47 billion, and the net loss attributable to the parent company was NT$19.19 billion, representing a
basic loss of NT$2.0 per share. Despite challenges from supply-demand imbalance and the economic impact of
international trade conflict, AUO has been able to maintain a healthy financial position. In research and development
(R&D), the Company continued to develop value-added products to meet customers' needs.
In 2019, AUO's key product and technology developments were:
⚫ AUO launched 85- and 75-inch 8K bezel-less ALCD TV display panels, which offer excellent colors, contrast,
and high-resolution with advanced HDR technology. They offer perfect image quality, have stylish appearance,
and are the first choice of well-known TV brands worldwide.
⚫ AUO has established a complete product line in gaming display and has a leading role in the desktop and
notebook PC gaming display market. AUO has introduced a high-end 65-inch 4K large-sized gaming display with
mini LED backlight and a 17.3-inch 4K LTPS gaming notebook PC display, which is only 3.5 mm thick, making it
extremely effortless for gamers to carry it around.
⚫ AUO has developed a 1.2-inch AMOLED panel for personal wearable devices, with the world's slimmest case
border of less than 2 mm. It offers a central through-hole design to place authentic watch hands to meet
consumer market demand for fashionable design.
⚫ In automobile displays, AUO developed a 12.3-inch dual-cell curved display with pixel-by-pixel local dimming
and a 12.3-inch LTPS display showing images with real 3D depth for cluster display for vivid close-up view and
more intuitive driving experience. Freeform curved cluster and narrow border rear-view mirror displays were
also featured, making the in-vehicle design more stylish.
⚫ In advanced display technology, AUO has developed a 17.3-inch Ink Jet Printing OLED display, which offers high-
resolution image quality among same-size products. In addition, AUO has also developed the world's first (Note)
optical in-display fingerprint recognition technology, and the world's largest (Note) 12.1-inch TFT driven full-
color micro LED cluster display, leading the trend in next-generation display technologies with its innovative
capability.
Following are development trends in the display panel industry:
⚫ Although the panel makers in China have slowed down their expansion of late, the supply and demand situation
of the industry has worsened. Oversupply has become the norm. However, capacity is no longer the sole
competitive advantage in the TFT-LCD industry. In the future, the demand for displays will be diversified and will
increase for customized products. Thus, improved technologies, operational management, and deep customer
relationship are key to the competitiveness of panel makers.
⚫ The global technology industry in the 5G era is driven by developments in the Internet of Things (IoT), artificial
intelligence (AI), and crossover application products. Human-machine interface derived from numerous field
applications has also brought in new business opportunities for display panels.
In medium and long term, AUO will continue to enhance its core business value, and will create differentiated display
products, offering higher value for users from different application fields.
I. Enhance core business value: In display and energy business, AUO is committed to technology upgrades and
product differentiation to build its core competitive strength.
1. Display business:
⚫ Commodity products : AUO produces premium products for its customers and creates
differentiation with its technological capabilities, such as 8K TV panels, gaming display panels, and
products with mini LED backlights.
⚫ Non-commodity products:Displays for automobile, industrial PC, and wearable devices are highly
customized, featuring small quantity but greater variety. AUO’s advantage lies in its competitive
cost structure and its ability to manage with flexibility.
2. Energy business: From expertise developed in hardware products, AUO will provide solar-energy solutions,
including high-efficiency solar modules, comprehensive services for solar system projects, and highly
integrated energy management service platforms.
II. Field economy strategy:
AUO is deeply involved in the panel industry for long, and has diverse and leading design and production

Letter to Shareholders
AU Optronics 2019 Annual Report
3
technologies. It operates in a wide range of application markets and with customer groups around the world.
With these advantages, AUO commits to become an AIoT solution provider in the future with displays being
the core component, and strategize to form an ecosystem in each application field. In addition, it will engage in
value innovation and collaborate with its partners from various fields.
The developments in various fields are outlined here:
⚫ In recent years, AUO has started from display business, leveraging core technologies and capabilities built
up from past experience to create new business entities in the fields of smart retailing, health care, circular
economy, and smart industrial services. AUO hopes to involve directly and deeply in these fields, and make
good use of its existing core advantages and resources to create higher value.
⚫ To meet AUO’s existing customers' needs, and to provide more comprehensive software and hardware
integration solution services, AUO formed a System and Solution Business (SSB) team in 2019 to
collaborate with our customers to design and produce products for specific applications. In the future,
with help from the SSB team, AUO will identify potential customers and work toward expanding
integration and derive economic benefits.
⚫ To develop key human resources for its transformation goal, AUO will launch a 3A talent acquisition
program to attract talented people to work in AI, Advanced Technology, and Application Fields. With the
requisite organization and talent for market development and product marketing, the company could
develop an appropriate ecosystem for its management to create value.
⚫ Going forward, in response to trend of regionalization and localization in global economy, AUO will level
up its global business model by increasing its scale and resources and by providing local services and
localized solutions.
AUO's business philosophy is to develop as an excellent sustainable business house. In CSR (Corporate Sustainability
Responsibility), AUO has been included the Dow Jones Sustainability World Index for ten consecutive years, and has
been the only company from Taiwan to be included in the Bloomberg Gender-Equality Index for three consecutive years.
AUO is also among the top 5% in the Taiwan Stock Exchange’s Corporate Governance Evaluation. It has also excelled in
comprehensive CSR assessment, and has been honored with a number of awards, including the Corporate Social
Responsibility Award sponsored by the Commonwealth Magazine, the Corporate Social Responsibility & Social
Enterprise Awards sponsored by Global Views Magazine, as well as the Taiwan Corporate Sustainability Awards.
In the coming year, the panel industry will have to face challenges and uncertainties, including regional trade conflicts as
also overcome the challenges posed by the recent COVID-19 outbreak. By leveraging AUO’s robust R&D capability and
healthy financial position, AUO will continue to strive for value creation strategy, expanding the scope of businesses to
field economy. This strategy for transformation would gradually come to fruition in the future, which may enable AUO
to break away from the drastic business cycle of the panel industry, and to improve profitability as recognition of our
shareholders' unstinted support over the long term.
Shuang-Lang (Paul) Peng,
Chairman
Frank Ko,
President
Benjamin Tseng,
Chief Financial Officer and
Chief Accounting Officer
* Note: Refers to the market data collected by AUO as of Dec 31, 2019.

AU Optronics 2019 Annual Report 4
Chapter 2 Company Profile
(I) Date of Incorporation: August 12, 1996
(II) Company History: Aug 1996 Acer Display Technology (ADT) was established. The Company specialized in the development and manufacturing of key
components and systems of flat display panels.
Apr 1999 Taiwan's first G3.5 TFT-LCD production line was completed and made a successful pilot run.
Sep 2000 ADT began initial public offering (IPO) on the Taiwan Stock Exchange (TWSE).
Feb 2001 Taiwan's first G4 TFT-LCD fab began mass production.
May 2001 ADT announced the merger with Unipac Optoelectronics Corporation and was renamed AU Optronics Corporation (AUO)
Sep 2001 Merged with Unipac Optoelectronics Corporation.
May 2002 Listed on the New York Stock Exchange (NYSE) under the code AUO.
Jul 2002 AUO Suzhou module plant began mass production, leading the industry’s entry into the China market.
Dec 2002 Taiwan 1st G5 TFT-LCD production line pilot run.
Aug 2003 Debuted world's first 30”LCD TV panel, with specs surpassing all products of similar sizes.
Jan 2005 First 32” LCD TV panel produced at G6 fab successfully lit up.
Jul 2006 First 42” LCD TV panel produced at G7.5 fab successfully lit up.
Oct 2006 Merged with Quanta Display Inc. (QDI)
Jun 2007 Debuted the world's largest 65” TV panel.
Received the 2007 Asian Corporate Governance Award from Corporate Governance Asia.
Sep 2007 AUO Xiamen module plant began mass production.
Feb 2008 Unveiled the AUO Green Solutions.
Aug 2008 Received Taiwan's first independent verification GRI A+ for its 2007 CSR Report.
Dec 2008 First 46” LCD TV panel produced at G8.5 fab successfully lit up.
March 2009 AUO's G8.5 fab acknowledged as the world's first LEED Gold-certified TFT-LCD facility.
June 2009 Co-invested in module plant with Sichuan Changhong Electric Co., Ltd.
May 2010 Co-invested in solar cell plant with US-based SunPower Technology.
July 2010 Acquired 100% ownership of AFPD Pte., Ltd., subsidiary of Toshiba Mobile Display in Singapore.
Dec 2010 Subsidiary Darwin Precisions Corporation was authorized for IPO on the Taiwan Stock Exchange.
April 2011 Ranked among top five enterprises in number of patents granted in China.
May 2011 G8.5 fab in Houli garnered the world's first LEED Platinum certification.
Jun 2011 Obtained the world's first ISO 50001 Certification for manufacturing facilities.
AUO Slovakia module plant began mass production.
Sept 2011 Subsidiary Darwin Precisions Corporation was merged with subsidiary Briview Corporation. Darwin Precisions Corporation,
the remaining Company after the merger, was renamed Briview.
Jul 2012 Obtained the world's first ISO 14045 Eco-efficiency Assessment of Product Systems Verification.
Mar 2013 Presented Taiwan's first zero liquid discharge solution.
Jun 2013 G8.5 fab in Houli received Taiwan's first Diamond Certification for Green Factory Building.
Sep 2013 AUO Headquarters received the certification of Carbon Neutral Building from the Environmental Protection Agency
Apr 2014 Founded Star River Energy Corporation to create an investment platform for solar power plants.
May 2014 AUO's CSR report was the first in Taiwan to be honored with GRI G4 certification throughout manufacturing industries.
Oct 2014 Subsidiary Briview was merged with Forhouse Corp. Briview, the remaining Company after the merger, was renamed Darwin
Precisions Corporation.
Nov 2014 Obtained Taiwan's first certification in environmental education site throughout manufacturing industries.
Oct 2015 Donated DADA's Magic Land to National Museum of Natural Science to promote optronics and science education.
Jun 2015 Sungen Solar Power Plant project received 2015 Top Solar System Award.
Oct 2015 Donated over NT$100 million in Honesty-Intelligence Scholarship over the past 10 years, benefiting over 30,000 students.
Dec 2015 Merged with subsidiary Taiwan CFI Co., Ltd. AUO Kaohsiung Fab and AUO Tainan Fab were set up at the buildings and fabs of
Taiwan CFI Co., Ltd.
AUO's Lungtan Fab completed Taiwan's first locally designed and integrated process water full-recycling system.
Nov 2016 AUO Kunshan G6 LTPS LCD fab announced its grand opening with successful mass production.
Aug 2017 Established Global Research Center (GRC).
Mar 2018 Acquired 100% ownership of ComQi, a content management service company.
May 2018 Honored with 2018 SID (Display Week 2018) Best-in-Show Award.
Aug 2018 Received four awards from the 2018 Gold Panel Awards; Chairman Paul SL Peng also honored with Exceptional Contribution
Award.
Oct 2018 Participated in 2018 Taichung World Flora Exposition and the AUO Micro Gallery was opened.
Nov 2018 Received ten awards from Taiwan Corporate Sustainability Awards, organized by Taiwan Institute for Sustainable Energy (TAISE);
Chairman Paul SL Peng was honored with the Outstanding Corporate Sustainability Professionals Award.
Dec 2018 Subsidiary AUO Crystal Corp. entered into share conversion with subsidiary Sanda Materials Corporation; 100% of Sanda
Materials' shares have been acquired by AUO Crystal Corp.
Feb 2019 Entered into share conversion with subsidiary AUO Crystal Corp.; 100% of AUO Crystal's shares have been acquired by AU
Optronics.
Mar 2019 Awarded the first Taiwan Circular Economy Award from Chung-Hua Institution for Economic Research.
Jun 2019 Obtained the first certification of International Performance Management & Verification Protocol (IPMVP) in Taiwan.
Jul 2019 Awarded the 2019 Excellent and Innovative Product Award from Central Taiwan Science Park.
Aug 2019 Obtained four awards from the "2019 Display Gold Panel Awards"
Sept 2019 Selected as a constituent of the Dow Jones Sustainability World Index (DJSI World) for ten consecutive years.
Oct 2019 The Company's U.S. depositary receipts were delisted from the New York Stock Exchange and transferred to the U.S. OTC
market under the code of AUOTY.
Nov 2019 High-efficiency solar modules were honored with the Gold Panel Awards Award by the Ministry of Economic Affairs.
Jan 2020 Included in the Bloomberg Gender Equality Index for three consecutive years.

AU Optronics 2019 Annual Report
5
Corporate Governance
Chapter 3 Corporate Governance
I. Organization
(I) Organizational Structure
2020 年 2 月 25 日
(II) Responsibilities and functions of major departments
Department Business
CSR Committee Enhance the management effectiveness of corporate social responsibility (CSR) and meet expectations
from stakeholders for corporate governance, environmental protection and social welfare through
comprehensively promoting projects, integrating horizontal resources and actively staying connected to
international trends, thus helping the Company operations to work toward sustainable development.
Chief of Antitrust
Compliance
To ensure compliance with domestic and international antitrust laws by the Company; assess, mitigate
and provide strategic advices on a variety of antitrust related risks; establish a robust and sustainable
Antitrust Compliance System to enhance antitrust compliance and further the Company’s sustainable
business development at the same time.
Technology
Group
The R&D of advanced display technologies, design, and development of new products.
Business Group The provision of a full range of display product planning, sales, marketing and customer service for TV, IT,
mobile device, automotive, general, PID/retail and new display applications, in addition to all-round smart
solutions for transportation, medical, industrial and commercial purposes.
Manufacturing
Group
The planning and management of display manufacturing process, raw materials and finished products.
System &
Solution Business
The provision of a full range of smart systems, integrated solutions and marketing services for retail,
transportation, industrial and commercial spaces.
Energy Business The provision of high-efficiency solar modules, all-round solar power plant service, and highly integrated
service platform concerning energy management & service.
Supply Chain
Management
The management of procurement, export and import affairs.
Operational
Support Units
Finance, Legal, Sustainability Development, Human Resource, Information Technology, Corporate
Strategic Planning ,etc.
Auditing The management of internal audit and operating procedures.
Shareholders
Board of Directors Chairman and CEO
Remuneration Committee
Corp. Governance Committee
Chief of Antitrust
Compliance
Auditing
CSR Committee Committee
President and COO
Business Group Manufacturing
Group System and
Solutions Business
Headquarters Energy Business
Headquarters
Operational
Support Units
Audit Committee
Supply Chain
Management
Technology Group

AU
Optro
nics
2019 A
nnual R
epo
rt
6
II. Documents of directors, president, vice presidents, associate vice presidents, and managers of each departments and divisions
(I) Director Information
January 31, 2020; Unit of shares: 1,000 shares
Position and Name Gender
Nationality
or Place of
Registration
Date Elected
(Appointed)
Term
of
Service
Date First
Elected
Shares held when
elected
Current Number of
Shares Held
Shares Held By
Spouse and Minor
Children Primary work or academic
experiences
Position concurrently held
in the Company and other
companies Number
of
Shares
Shareholding
percentage
(%)
Number
of Shares
Shareholding
percentage
(%)
Number
of
shares
Shareholding
percentage
(%)
Chairman and CEO
Shuang-Lang (Paul)
Peng
Male Republic of
China 2019.06.14 3 years 2010.06.18 5,631 0.06 5,631 0.06 1,212 0.01
- M.B.A., Heriot-Watt University,
U.K.
- President, AU Optronics Corp.
- CEO, AU Optronics Corp.
- Director, Qisda Corp.
- Director, Darwin Precisions Corp
Director
Kuen-Yao (K.Y.) Lee Male
Republic of
China 2019.06.14 3 years 2004.04.30 10,512 0.11 10,512 0.11 1,215 0.01
- M.B.A, International Institute for
Management Development,
Switzerland
- Chairman, Qisda Corp.
- Chairman, AU Optronics Corp.
- Director, Qisda Corp.
- Director, Darfon Electronics
Corp.
- Director, BenQ Materials Corp.
Director
AUO Foundation
(Note 1)
Representative: Frank
Ko
-
Republic of
China 2019.06.14 3 years 2019.06.14 312 0.00 312 0.00 - - - -
Male Republic of
China 2019.09.10 - - - - 0 0 0 0
- PhD in Optoelectronics
(Science), National Chiao Tung
University -Chairman and CEO,
E Ink Holdings Inc.
- Vice President, Strategic
Development Office, AU
Optronics Corp.
- Vice President, TV Display
Business Group, AU Optronics
Corp.
- President and Chief Operating
Officer, AU Optronics Corp.
Director
BenQ Foundation
(Note 1)
Representative: Peter
Chen
- Republic of
China 2019.06.14 3 years 2010.06.18 100 0.00 100 0.00 - - - -
Male Republic of
China 2019.06.14 - - - - 0 0 99 0.00
- Technology Management
Program, National Chengchi
University
- EMBA, Thunderbird, American
Graduate School, U.S.A.
- B.S., Electrical Engineering,
National Cheng Kung University
- Executive Vice President,
Technology Product Center,
BenQ Corp.
- Chairman and President, Qisda
Corp.
- Chairman, DFI Inc.
- Chairman, BenQ Medical
Technology Corporation.
- Chairman, Partner Tech Corp.
- Vice Chairman, Alpha Networks
Inc.
- Director, Darfon Electronics
Corp.
- Director, BenQ Materials Corp.

Corp
orate
Gove
rnan
ce
AU
Optro
nics
2019 A
nnual R
epo
rt
7
Position and Name Gender
Nationality
or Place of
Registration
Date Elected
(Appointed)
Term
of
Service
Date First
Elected
Shares held when
elected
Current Number of
Shares Held
Shares Held By
Spouse and Minor
Children Primary work or academic
experiences
Position concurrently held
in the Company and other
companies Number
of
Shares
Shareholding
percentage
(%)
Number
of Shares
Shareholding
percentage
(%)
Number
of
shares
Shareholding
percentage
(%)
Independent Director
Chin-Bing (Philip) Peng Male
Republic of
China 2019.06.14 3 years 2013.06.19 97 0.00 97 0.00 0 0
- M.B.A, National Chengchi
University.
- Senior Vice President and CFO,
ACER Incorporated.
- Director and President, iD
SoftCapital
- Director, ACER Incorporated
- Director, AOPEN Inc
- Director, Wistron NeWeb
Corporation.
- Director, Wistron Information
Technology & Services
Corporation
- Director, Wistron Corporation
- Independent Director and
Member of Audit Committee and
Remuneration Committee,Apacer
Technology Inc.
Independent Director
Mei-Yueh Ho Female
Republic of
China 2019.06.14 3 years 2010.06.18 0 0 0 0 0 0
- B.S., Agricultural Chemistry,
National Taiwan University
- Minister, Ministry of Economic
Affairs, R.O.C.
- Council Minister, Council for
Economic Planning and
Development, R.O.C.
- Independent Director and
Member of Audit Committee and
Remuneration Committee, Bank
of Kaohsiung, Ltd.
- Independent Director and
Member of Audit Committee and
Remuneration Committee, Kinpo
Electronics, Inc.
- Independent Director and
Member of Audit Committee, ASE
Technology Holding Co., Ltd.
Independent Director
Yen-Shiang Shih Male
Republic of
China 2019.06.14 3 years 2016.06.16 0 0 0 0 0 0
- Ph.D., Chemistry, Massachusetts
Institute of Technology, USA
- Chief of Chemical Engineering,
National Taiwan University of
Science and Technology
- Professor of Chemical
Engineering, National Taiwan
University of Science and
Technology
- Director General, Small and
Medium Enterprise
Administration, Ministry of
Economic Affairs, R.O.C.
- Director General, Taiwan
Tobacco & Wine Bureau
- Independent Director, Member of
Audit Committee, Nomination
Committee and Remuneration
Committee, CTCI Corporation
- Independent Director, Member of
Audit Committee and
Remuneration Committee,
Formosa Plastics Corporation
- Director, Taiwan Research
Institute
- Director, Taiwan Institute of
Economic Research
- Policy Advisor, Taiwan Electrical
and Electronic Manufacturers'
Association
AU
Optro
nics
2019 A
nnual R
epo
rt
8
Position and Name Gender
Nationality
or Place of
Registration
Date Elected
(Appointed)
Term
of
Service
Date First
Elected
Shares held when
elected
Current Number of
Shares Held
Shares Held By
Spouse and Minor
Children Primary work or academic
experiences
Position concurrently held
in the Company and other
companies Number
of
Shares
Shareholding
percentage
(%)
Number
of Shares
Shareholding
percentage
(%)
Number
of
shares
Shareholding
percentage
(%)
- Director General, Industrial
Development Bureau, Ministry of
Economic Affairs, R.O.C.
- Vice Minister, Ministry of
Economic Affairs, R.O.C.
- Deputy Minister, Ministry of
Economic Affairs, R.O.C.
- Chairman, CPC
Corporation,Taiwan
- Minister, Ministry of Economic
Affairs, R.O.C.
- National Policy Advisor, Office of
the President, R.O.C.
- Chairman, Sinotech Engineering
Consultants, Inc.
- Supreme Advisor, Commerce
Development Research Institute
- Chairman, Sustainable & Circular
Economy Development
Association
- Chair Professor, Chung Yuan
Christian University
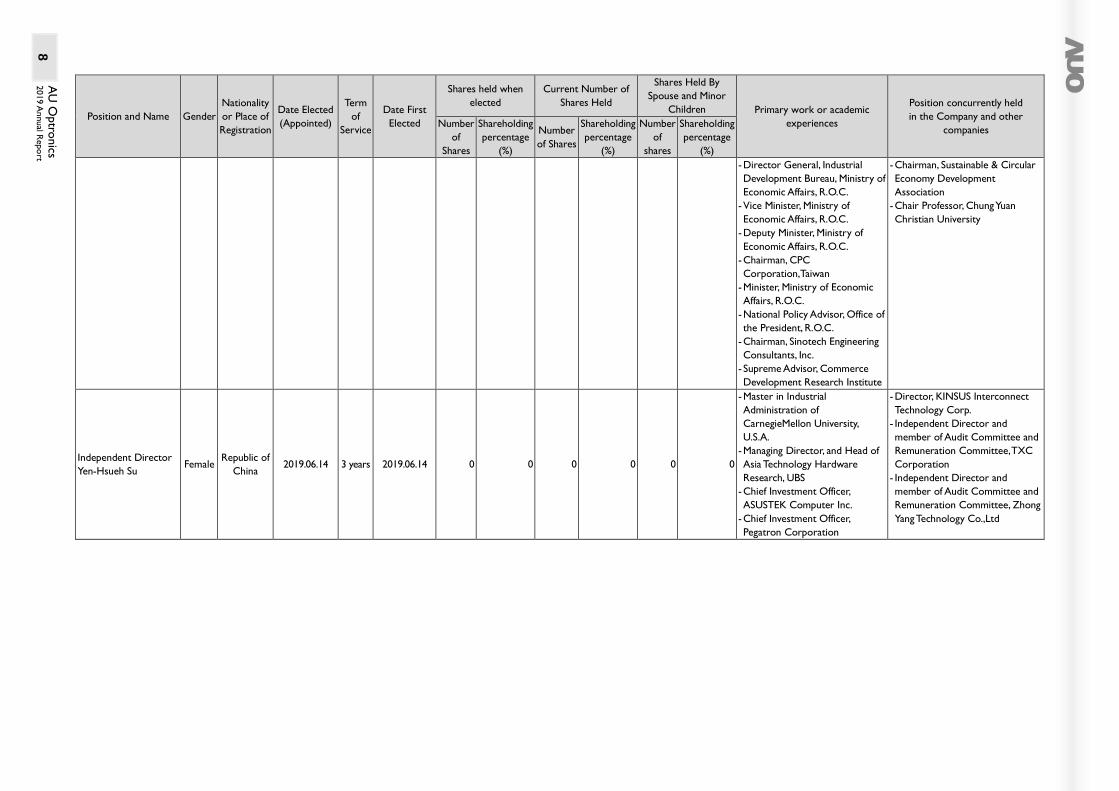
Independent Director
Yen-Hsueh Su Female
Republic of
China 2019.06.14 3 years 2019.06.14 0 0 0 0 0 0
- Master in Industrial
Administration of
CarnegieMellon University,
U.S.A.
- Managing Director, and Head of
Asia Technology Hardware
Research, UBS
- Chief Investment Officer,
ASUSTEK Computer Inc.
- Chief Investment Officer,
Pegatron Corporation
- Director, KINSUS Interconnect
Technology Corp.
- Independent Director and
member of Audit Committee and
Remuneration Committee, TXC
Corporation
- Independent Director and
member of Audit Committee and
Remuneration Committee, Zhong
Yang Technology Co.,Ltd

Corp
orate
Gove
rnan
ce
AU
Optro
nics
2019 A
nnual R
epo
rt
9
Position and Name Gender
Nationality
or Place of
Registration
Date Elected
(Appointed)
Term
of
Service
Date First
Elected
Shares held when
elected
Current Number of
Shares Held
Shares Held By
Spouse and Minor
Children Primary work or academic
experiences
Position concurrently held
in the Company and other
companies Number
of
Shares
Shareholding
percentage
(%)
Number
of Shares
Shareholding
percentage
(%)
Number
of
shares
Shareholding
percentage
(%)
Independent Director
Jang-Lin (John) Chen Male
Republic of
China 2019.06.14 3 years 2019.06.14 0 0 0 0 0 0
- Stanford Executive Program,
Stanford University, Graduate
School of Business
- Ph.D. in Polymer Material,
NYU/Polytechnic University,
U.S.A
- Master in Chemistry, National
Taiwan University
- B.S., Chemistry, National Tsing
Hua University
- ITRI Fellow, Electronics &
Optoelectronics System
Research Lab
- VP and DTC General Director,
Display Technology Center, ITRI
- Adjunct Professor, Department
of Photonics, National Chiao-
Tung University
- CTO, Kodak LCD Polarizer Films
Business
- Research Fellow, Eastman Kodak
Company
- ITRI Research Fellow, Electronics
& Optoelectronics System
Research Lab and Industry,
Science and Technology
International Strategy Center
- Executive Supervisor SID Taipei
Chapter
- Director, Taiwan Display Material
& Devices Association
- Vice Chairman of Board, Taiwan
Display Union Association
- Director, Taiwan TFT LCD
Association
- Chair Professor, National Chiao
Tung University
Company shares held by directors in the name of other persons: Director Chin-Bing (Philip) Peng held the Company’s shares in the name of other persons in the number of 150 thousand shares, constituting 0.00 % of
shareholding.
Any Executive, Director, or supervisor who is a spouse or relative within the second degree of kinship: None.
If the chairman, president or personnel with equivalent position (chief manager) are the same person, spouses or relatives within one degree of kinship, the reasons, reasonability, necessity and measures to be taken
accordingly shall be addressed:
The position of the chief executive officer of the Company is responsible for the planning and execution of the Company's sustainable operation and long-term development strategy, coordinating the management team and
reporting to the Board of Directors; the president and chief operating officer is responsible for the planning and management of the Company's daily operations. The reason why the chairman also serves as the chief
executive officer is to carry out the plan for sustainable management and strategic development of the enterprise, to lead the management team, and to report to the Board of Directors. In doing so, the powers and duties
are clearly divided between the chairman and chief executive officer, and the president and chief operating officer. Meanwhile, the independence of the Board of Directors is assured in that independent directors consitute half
of the Board, and that more than half of the directors are not an employee or a manager of the Company.
AU Optronics 2019 Annual Report 10
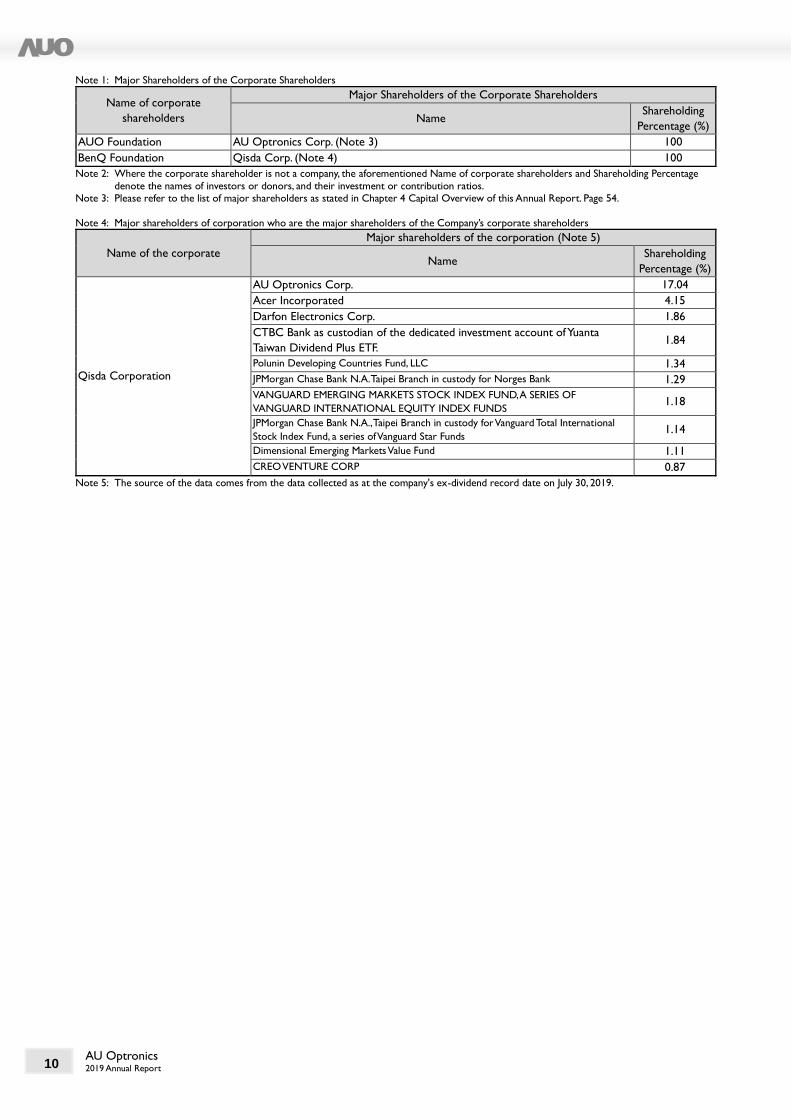
Note 1: Major Shareholders of the Corporate Shareholders
Name of corporate
shareholders
Major Shareholders of the Corporate Shareholders
Name Shareholding
Percentage (%)
AUO Foundation AU Optronics Corp. (Note 3) 100
BenQ Foundation Qisda Corp. (Note 4) 100
Note 2: Where the corporate shareholder is not a company, the aforementioned Name of corporate shareholders and Shareholding Percentage
denote the names of investors or donors, and their investment or contribution ratios. Note 3: Please refer to the list of major shareholders as stated in Chapter 4 Capital Overview of this Annual Report. Page 54.
Note 4: Major shareholders of corporation who are the major shareholders of the Company’s corporate shareholders
Name of the corporate
Major shareholders of the corporation (Note 5)
Name Shareholding
Percentage (%)
Qisda Corporation
AU Optronics Corp. 17.04
Acer Incorporated 4.15
Darfon Electronics Corp. 1.86
CTBC Bank as custodian of the dedicated investment account of Yuanta
Taiwan Dividend Plus ETF. 1.84
Polunin Developing Countries Fund, LLC 1.34
JPMorgan Chase Bank N.A. Taipei Branch in custody for Norges Bank 1.29
VANGUARD EMERGING MARKETS STOCK INDEX FUND, A SERIES OF
VANGUARD INTERNATIONAL EQUITY INDEX FUNDS 1.18
JPMorgan Chase Bank N.A., Taipei Branch in custody for Vanguard Total International
Stock Index Fund, a series of Vanguard Star Funds 1.14
Dimensional Emerging Markets Value Fund 1.11
CREO VENTURE CORP 0.87
Note 5: The source of the data comes from the data collected as at the company's ex-dividend record date on July 30, 2019.
Corporate Governance
11 AU Optronics 2019 Annual Report
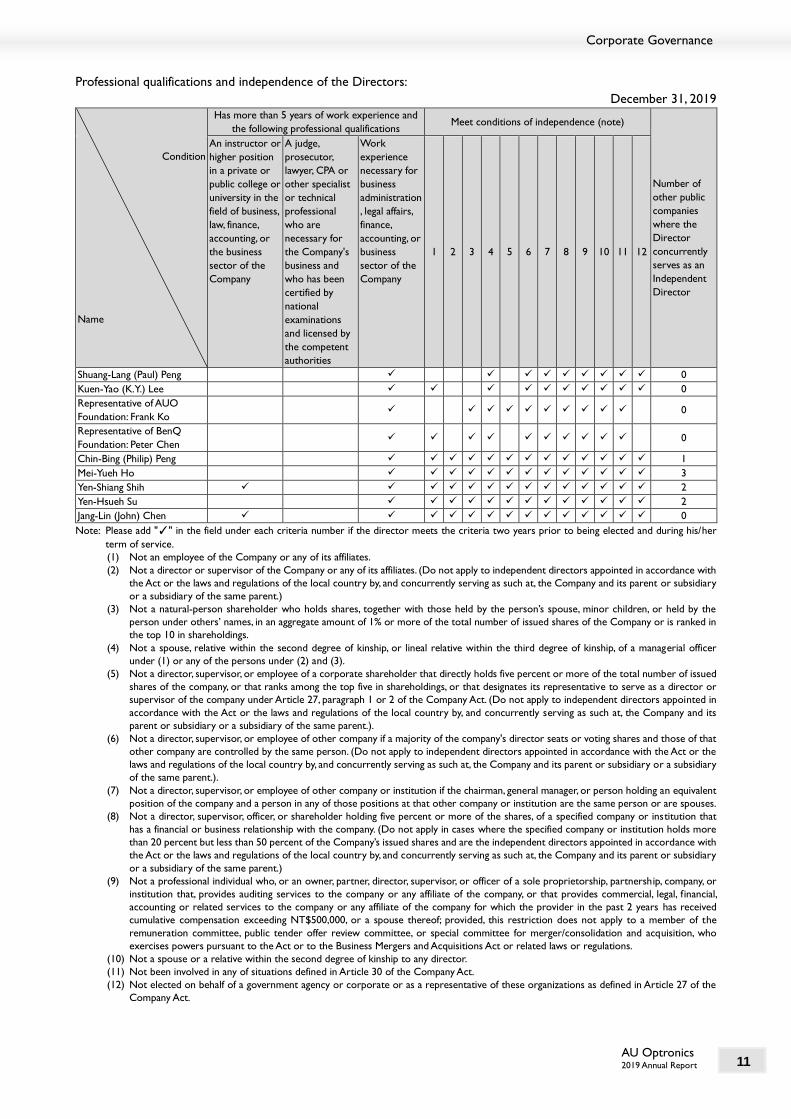
Professional qualifications and independence of the Directors:
December 31, 2019
Condition
Name
Has more than 5 years of work experience and
the following professional qualifications Meet conditions of independence (note)
Number of
other public
companies
where the
Director
concurrently
serves as an
Independent
Director
An instructor or
higher position
in a private or
public college or
university in the
field of business,
law, finance,
accounting, or
the business
sector of the
Company
A judge,
prosecutor,
lawyer, CPA or
other specialist
or technical
professional
who are
necessary for
the Company's
business and
who has been
certified by
national
examinations
and licensed by
the competent
authorities
Work
experience
necessary for
business
administration
, legal affairs,
finance,
accounting, or
business
sector of the
Company
1 2 3 4 5 6 7 8 9 10 11 12
Shuang-Lang (Paul) Peng ✓ ✓ ✓ ✓ ✓ ✓ ✓ ✓ ✓ 0
Kuen-Yao (K.Y.) Lee ✓ ✓ ✓ ✓ ✓ ✓ ✓ ✓ ✓ ✓ 0
Representative of AUO
Foundation: Frank Ko ✓ ✓ ✓ ✓ ✓ ✓ ✓ ✓ ✓ ✓ 0
Representative of BenQ
Foundation: Peter Chen ✓ ✓ ✓ ✓ ✓ ✓ ✓ ✓ ✓ ✓ 0
Chin-Bing (Philip) Peng ✓ ✓ ✓ ✓ ✓ ✓ ✓ ✓ ✓ ✓ ✓ ✓ ✓ 1
Mei-Yueh Ho ✓ ✓ ✓ ✓ ✓ ✓ ✓ ✓ ✓ ✓ ✓ ✓ ✓ 3
Yen-Shiang Shih ✓ ✓ ✓ ✓ ✓ ✓ ✓ ✓ ✓ ✓ ✓ ✓ ✓ ✓ 2
Yen-Hsueh Su ✓ ✓ ✓ ✓ ✓ ✓ ✓ ✓ ✓ ✓ ✓ ✓ ✓ 2
Jang-Lin (John) Chen ✓ ✓ ✓ ✓ ✓ ✓ ✓ ✓ ✓ ✓ ✓ ✓ ✓ ✓ 0
Note: Please add "✓" in the field under each criteria number if the director meets the criteria two years prior to being elected and during his/her
term of service.
(1) Not an employee of the Company or any of its affiliates.
(2) Not a director or supervisor of the Company or any of its affiliates. (Do not apply to independent directors appointed in accordance with
the Act or the laws and regulations of the local country by, and concurrently serving as such at, the Company and its parent or subsidiary
or a subsidiary of the same parent.)
(3) Not a natural-person shareholder who holds shares, together with those held by the person’s spouse, minor children, or held by the
person under others’ names, in an aggregate amount of 1% or more of the total number of issued shares of the Company or is ranked in
the top 10 in shareholdings.
(4) Not a spouse, relative within the second degree of kinship, or lineal relative within the third degree of kinship, of a managerial officer
under (1) or any of the persons under (2) and (3).
(5) Not a director, supervisor, or employee of a corporate shareholder that directly holds five percent or more of the total number of issued
shares of the company, or that ranks among the top five in shareholdings, or that designates its representative to serve as a director or
supervisor of the company under Article 27, paragraph 1 or 2 of the Company Act. (Do not apply to independent directors appointed in
accordance with the Act or the laws and regulations of the local country by, and concurrently serving as such at, the Company and its
parent or subsidiary or a subsidiary of the same parent.).
(6) Not a director, supervisor, or employee of other company if a majority of the company's director seats or voting shares and those of that
other company are controlled by the same person. (Do not apply to independent directors appointed in accordance with the Act or the
laws and regulations of the local country by, and concurrently serving as such at, the Company and its parent or subsidiary or a subsidiary
of the same parent.).
(7) Not a director, supervisor, or employee of other company or institution if the chairman, general manager, or person holding an equivalent
position of the company and a person in any of those positions at that other company or institution are the same person or are spouses.
(8) Not a director, supervisor, officer, or shareholder holding five percent or more of the shares, of a specified company or institution that
has a financial or business relationship with the company. (Do not apply in cases where the specified company or institution holds more
than 20 percent but less than 50 percent of the Company’s issued shares and are the independent directors appointed in accordance with
the Act or the laws and regulations of the local country by, and concurrently serving as such at, the Company and its parent or subsidiary
or a subsidiary of the same parent.)
(9) Not a professional individual who, or an owner, partner, director, supervisor, or officer of a sole proprietorship, partnership, company, or
institution that, provides auditing services to the company or any affiliate of the company, or that provides commercial, legal, financial,
accounting or related services to the company or any affiliate of the company for which the provider in the past 2 years has received
cumulative compensation exceeding NT$500,000, or a spouse thereof; provided, this restriction does not apply to a member of the
remuneration committee, public tender offer review committee, or special committee for merger/consolidation and acquisition, who
exercises powers pursuant to the Act or to the Business Mergers and Acquisitions Act or related laws or regulations.
(10) Not a spouse or a relative within the second degree of kinship to any director.
(11) Not been involved in any of situations defined in Article 30 of the Company Act.
(12) Not elected on behalf of a government agency or corporate or as a representative of these organizations as defined in Article 27 of the
Company Act.
AU
Optro
nics
2019 A
nnual R
epo
rt
12
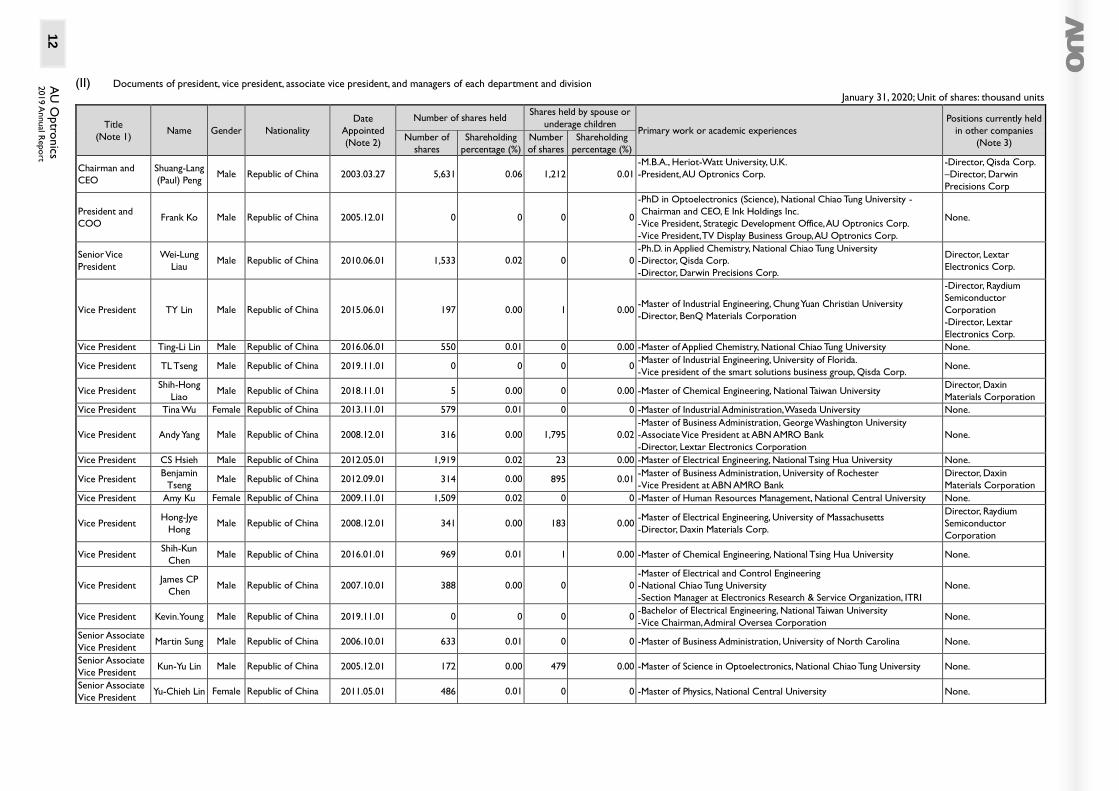
(II) Documents of president, vice president, associate vice president, and managers of each department and division
January 31, 2020; Unit of shares: thousand units
Title
(Note 1) Name Gender Nationality
Date
Appointed
(Note 2)
Number of shares held Shares held by spouse or
underage children Primary work or academic experiences
Positions currently held
in other companies
(Note 3) Number of
shares
Shareholding
percentage (%)
Number
of shares
Shareholding
percentage (%)
Chairman and
CEO
Shuang-Lang
(Paul) Peng Male Republic of China 2003.03.27 5,631 0.06 1,212 0.01
- M.B.A., Heriot-Watt University, U.K.
- President, AU Optronics Corp.
-Director, Qisda Corp.
–Director, Darwin
Precisions Corp
President and
COO Frank Ko Male Republic of China 2005.12.01 0 0 0 0
- PhD in Optoelectronics (Science), National Chiao Tung University -
Chairman and CEO, E Ink Holdings Inc.
- Vice President, Strategic Development Office, AU Optronics Corp.
- Vice President, TV Display Business Group, AU Optronics Corp.
None.
Senior Vice
President
Wei-Lung
Liau Male Republic of China 2010.06.01 1,533 0.02 0 0
- Ph.D. in Applied Chemistry, National Chiao Tung University
- Director, Qisda Corp.
- Director, Darwin Precisions Corp.
Director, Lextar
Electronics Corp.
Vice President TY Lin Male Republic of China 2015.06.01 197 0.00 1 0.00 - Master of Industrial Engineering, Chung Yuan Christian University
- Director, BenQ Materials Corporation
-Director, Raydium
Semiconductor
Corporation
-Director, Lextar
Electronics Corp.
Vice President Ting-Li Lin Male Republic of China 2016.06.01 550 0.01 0 0.00 - Master of Applied Chemistry, National Chiao Tung University None.
Vice President TL Tseng Male Republic of China 2019.11.01 0 0 0 0 - Master of Industrial Engineering, University of Florida.
- Vice president of the smart solutions business group, Qisda Corp. None.
Vice President Shih-Hong
Liao Male Republic of China 2018.11.01 5 0.00 0 0.00 - Master of Chemical Engineering, National Taiwan University
Director, Daxin
Materials Corporation
Vice President Tina Wu Female Republic of China 2013.11.01 579 0.01 0 0 - Master of Industrial Administration, Waseda University None.
Vice President Andy Yang Male Republic of China 2008.12.01 316 0.00 1,795 0.02
- Master of Business Administration, George Washington University
- Associate Vice President at ABN AMRO Bank
- Director, Lextar Electronics Corporation
None.
Vice President CS Hsieh Male Republic of China 2012.05.01 1,919 0.02 23 0.00 - Master of Electrical Engineering, National Tsing Hua University None.
Vice President Benjamin
Tseng Male Republic of China 2012.09.01 314 0.00 895 0.01
- Master of Business Administration, University of Rochester
- Vice President at ABN AMRO Bank
Director, Daxin
Materials Corporation
Vice President Amy Ku Female Republic of China 2009.11.01 1,509 0.02 0 0 - Master of Human Resources Management, National Central University None.
Vice President Hong-Jye
Hong Male Republic of China 2008.12.01 341 0.00 183 0.00
- Master of Electrical Engineering, University of Massachusetts
- Director, Daxin Materials Corp.
Director, Raydium
Semiconductor
Corporation
Vice President Shih-Kun
Chen Male Republic of China 2016.01.01 969 0.01 1 0.00 - Master of Chemical Engineering, National Tsing Hua University None.
Vice President James CP
Chen Male Republic of China 2007.10.01 388 0.00 0 0
- Master of Electrical and Control Engineering
- National Chiao Tung University
- Section Manager at Electronics Research & Service Organization, ITRI
None.
Vice President Kevin.Young Male Republic of China 2019.11.01 0 0 0 0 - Bachelor of Electrical Engineering, National Taiwan University
- Vice Chairman, Admiral Oversea Corporation None.
Senior Associate
Vice President Martin Sung Male Republic of China 2006.10.01 633 0.01 0 0 - Master of Business Administration, University of North Carolina None.
Senior Associate
Vice President Kun-Yu Lin Male Republic of China 2005.12.01 172 0.00 479 0.00 - Master of Science in Optoelectronics, National Chiao Tung University None.
Senior Associate
Vice President Yu-Chieh Lin Female Republic of China 2011.05.01 486 0.01 0 0 - Master of Physics, National Central University None.
AU
Optro
nics
2019 A
nnual R
epo
rt
Corp
orate
Gove
rnan
ce
13
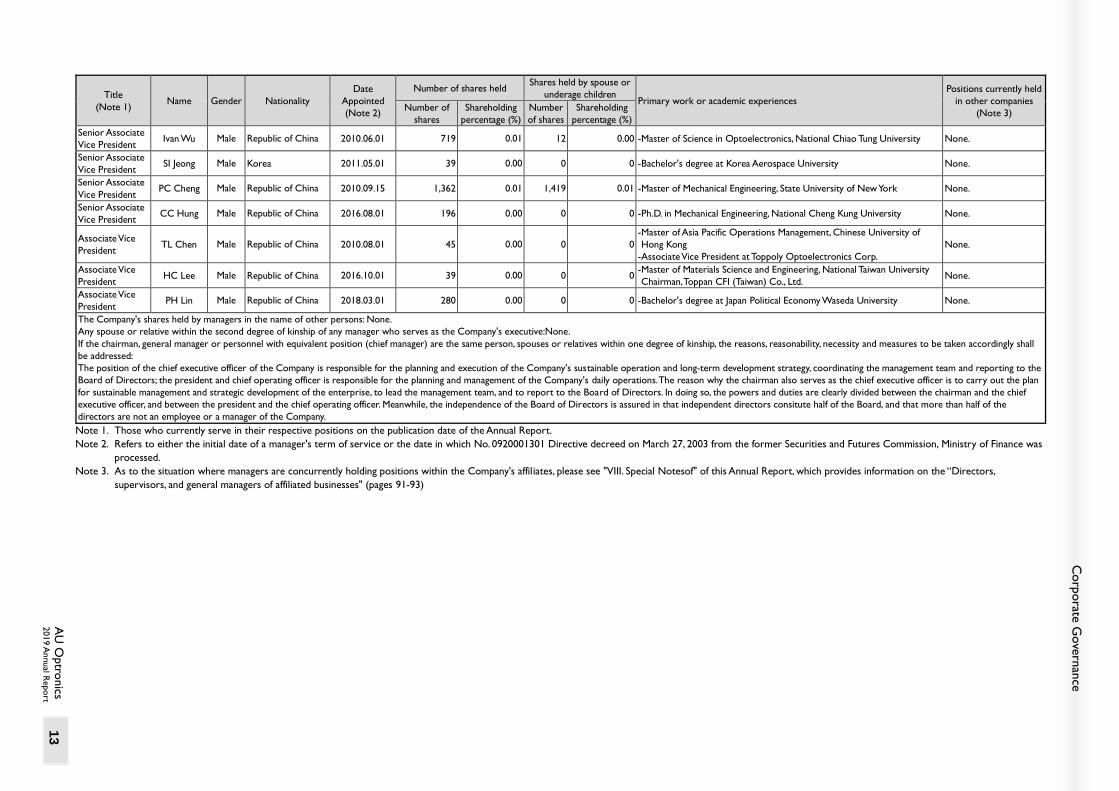
Title
(Note 1) Name Gender Nationality
Date
Appointed
(Note 2)
Number of shares held Shares held by spouse or
underage children Primary work or academic experiences
Positions currently held
in other companies
(Note 3) Number of
shares
Shareholding
percentage (%)
Number
of shares
Shareholding
percentage (%)
Senior Associate
Vice President Ivan Wu Male Republic of China 2010.06.01 719 0.01 12 0.00 - Master of Science in Optoelectronics, National Chiao Tung University None.
Senior Associate
Vice President SI Jeong Male Korea 2011.05.01 39 0.00 0 0 - Bachelor's degree at Korea Aerospace University None.
Senior Associate
Vice President PC Cheng Male Republic of China 2010.09.15 1,362 0.01 1,419 0.01 - Master of Mechanical Engineering, State University of New York None.
Senior Associate
Vice President CC Hung Male Republic of China 2016.08.01 196 0.00 0 0 - Ph.D. in Mechanical Engineering, National Cheng Kung University None.
Associate Vice
President TL Chen Male Republic of China 2010.08.01 45 0.00 0 0
- Master of Asia Pacific Operations Management, Chinese University of
Hong Kong
- Associate Vice President at Toppoly Optoelectronics Corp.
None.
Associate Vice
President HC Lee Male Republic of China 2016.10.01 39 0.00 0 0
- Master of Materials Science and Engineering, National Taiwan University
Chairman, Toppan CFI (Taiwan) Co., Ltd. None.
Associate Vice
President PH Lin Male Republic of China 2018.03.01 280 0.00 0 0 - Bachelor's degree at Japan Political Economy Waseda University None.
The Company's shares held by managers in the name of other persons: None.
Any spouse or relative within the second degree of kinship of any manager who serves as the Company's executive:None.
If the chairman, general manager or personnel with equivalent position (chief manager) are the same person, spouses or relatives within one degree of kinship, the reasons, reasonability, necessity and measures to be taken accordingly shall
be addressed:
The position of the chief executive officer of the Company is responsible for the planning and execution of the Company's sustainable operation and long-term development strategy, coordinating the management team and reporting to the
Board of Directors; the president and chief operating officer is responsible for the planning and management of the Company's daily operations. The reason why the chairman also serves as the chief executive officer is to carry out the plan
for sustainable management and strategic development of the enterprise, to lead the management team, and to report to the Board of Directors. In doing so, the powers and duties are clearly divided between the chairman and the chief
executive officer, and between the president and the chief operating officer. Meanwhile, the independence of the Board of Directors is assured in that independent directors consitute half of the Board, and that more than half of the
directors are not an employee or a manager of the Company.
Note 1. Those who currently serve in their respective positions on the publication date of the Annual Report.
Note 2. Refers to either the initial date of a manager's term of service or the date in which No. 0920001301 Directive decreed on March 27, 2003 from the former Securities and Futures Commission, Ministry of Finance was
processed.
Note 3. As to the situation where managers are concurrently holding positions within the Company's affiliates, please see "VIII. Special Notesof" of this Annual Report, which provides information on the “Directors,
supervisors, and general managers of affiliated businesses" (pages 91-93)

AU
Optro
nics
2019 A
nnual R
epo
rt
14
III. Compensation to Directors, Supervisors, President and Vice Presidents in the latest year
(I) Compensation to Directors Unit: NT$1,000; 1,000 shares
Title Name
(Note 1)
Director’s compensation Ratio of sum of items A, B, C and D to profit (loss)
(%) (Note 10)
Compensation earned by a Director who is an employee of the Company Ratio of sum of items A,
B, C, D, E, F and G to profit (loss) (%)
(Note 10)
Compensation
from investees
other than AU
Optronics
Corp.’s
subsidiaries or
Parent Company
(Note 11)
Compensation (A)
(Note 3)
Pension upon retirement(B)
(Note 4)
Director's remuneration (C)
(Note 5)
Business execution
Expenses (D) (Note 6)
Salaries, bonuses and special expenses (E)
(Note 7)
Pension upon retirement (F)
(Note 4)
Employee’s remuneration (G) (Note 8)
AU
O
ptr
onic
s C
orp
.
AU
O
ptr
onic
s C
orp
. and its
su
bsi
dia
ries
(N
ote
9)
AU
O
ptr
onic
s C
orp
.
AU
O
ptr
onic
s C
orp
. and its
su
bsi
dia
ries
(Note
9)
AU
O
ptr
onic
s C
orp
.
AU
O
ptr
onic
s C
orp
. and its
su
bsi
dia
ries
(N
ote
9)
AU
O
ptr
onic
s C
orp
.
AU
O
ptr
onic
s C
orp
. and its
su
bsi
dia
ries
(N
ote
9)
AU
O
ptr
onic
s C
orp
.
AU
O
ptr
onic
s C
orp
. and its
su
bsi
dia
ries
(N
ote
9)
AU
O
ptr
onic
s C
orp
.
AU
O
ptr
onic
s C
orp
. and its
su
bsi
dia
ries
(N
ote
9)
AU
O
ptr
onic
s C
orp
.
AU
O
ptr
onic
s C
orp
. and its
su
bsi
dia
ries
(N
ote
9)
AU Optronics
Corp.
AU
Optronics
Corp. and its
subsidiaries
(Note 9)
AU
Optr
onic
s
Corp
.
AU
Optr
onic
s
Corp
. and its
subsi
d iar
ies
(N
ote
9)
Cash Stock Cash Stock
Chairman and CEO
Shuang-Lang (Paul) Peng
6,000 6,000 - - - - 2,070 2,120 (0.04) (0.04) 42,737 42,737 - - - - - - (0.26) (0.27) 60
Director Kuen-Yao (K.Y.) Lee
2,000 2,000 - - - - 70 70 (0.01) (0.01) - - - - - - - - (0.01) (0.01) 14,859
Corporate Director
BenQ Foundation 2,000 2,000 - - - - - - (0.01) (0.01) - - - - - - - - (0.01) (0.01) 4,933
Corporate Director Representative
Peter Chen - - - - - - 70 70 (0.00) (0.00) - - - - - - - - (0.00) (0.00) 27,071
Corporate Director
AUO Foundation 1,101 1,101 - - - - - - (0.01) (0.01) - - - - - - - - (0.01) (0.01) -
Corporate Director Representative
Frank Ko(Note 2)
- - - - - - 10 10 (0.00) (0.00) 19,856 19,856 33 33 - - - - (0.10) (0.10) -
Corporate Director Representative
Kuo-Hsin (Michael) Tsai(Note 2)
- - - - - - 750 1,443 (0.00) (0.01) 20,564 20,564 157 157 - - - - (0.11) (0.12) 90
Corporate Director
Qisda Corporation
899 899 - - - - - - (0.00) (0.00) - - - - - - - - (0.00) (0.00) -
Independent Director
Chin-Bing (Philip) Peng
2,820 2,820 - - - - 160 160 (0.02) (0.02) - - - - - - - - (0.02) (0.02) -
Independent Director
Mei-Yueh Ho 2,400 2,400 - - - - 140 140 (0.01) (0.01) - - - - - - - - (0.01) (0.01) -
Independent Director
Yen-Shiang Shih 2,510 2,510 - - - - 150 150 (0.01) (0.01) - - - - - - - - (0.01) (0.01) -
Independent Director
Yen-Hsueh Su 1,432 1,432 - - - - 90 90 (0.01) (0.01) - - - - - - - - (0.01) (0.01) -
Independent Director
Jang-Lin (John) Chen
1,322 1,322 - - - - 80 80 (0.01) (0.01) - - - - - - - - (0.01) (0.01) -
Independent Director
Vivien Huey-Juan Hsieh
1,438 2,088 - - - - 80 100 (0.01) (0.01) - - - - - - - - (0.01) (0.01) -
Independent Director
Ding-Yuan Yang 1,278 1,278 - - - - 90 90 (0.01) (0.01) - - - - - - - - (0.01) (0.01) -
1. Please describe the policy, system, standards and structure of independent directors' remuneration, as well as the connection between the amount of remuneration paid and director’s responsibilities, risks, time investment and other factors: the
remuneration of the directors of the Company is determined by the board of directors in accordance with the Articles of Incorporation, issued based on the director's participation in the Company's operations and contribution, with reference to both
domestic and foreign market standards. If the Company has a profit, the board of directors will determine the amount of directors' remuneration in accordance with the Company's Articles of Incorporation. Independent directors are ex-officio
members of the audit committee. In addition to the general remuneration paid to directors, the Company takes into account of each director’s individual responsibilities, risks and investment time, and also determines different reasonable remunerations.
2. In addition to the information disclosed in the table above, has any Director provided services to AU Optronics Corp. and its subsidiaries and received compensation for such services (e.g. serving as a consultant that is not an employee): None.

Corp
orate
Gove
rnan
ce
AU
Optro
nics
2019 A
nnual R
epo
rt 15
Table of compensation ranges
Compensation range for each Director in AU
Optronics Corp.
Name of Director
Sum of the first 4 items (A+B+C+D) Sum of the first 7 items (A+B+C+D+E+F+G)
AU Optronics Corp. AU Optronics Corp. and its subsidiaries
(Note 9) AU Optronics Corp.
Parent Company, AU Optronics Corp. and its
subsidiaries and investees (Note 12)
Less than NT$ 1,000,000 Peter Chen, Frank Ko, Kuo-Hsin (Michael) Tsai,
Qisda Corporation
Peter Chen, Frank Ko, Qisda Corporation Peter Chen, Qisda Corporation Qisda Corporation
NT$ 1,000,000 (inclusive) ~NT$ 2,000,000 AUO Foundation, Yen-Hsueh Su, Jang-Lin (John)
Chen, Vivien Huey-Juan Hsieh, Ding-Yuan Yang
AUO Foundation, Kuo-Hsin (Michael) Tsai , Yen-
Hsueh Su, Jang-Lin (John) Chen, Ding-Yuan Yang
AUO Foundation, Yen-Hsueh Su, Jang-Lin (John)
Chen, Vivien Huey-Juan Hsieh, Ding-Yuan Yang
AUO Foundation, Yen-Hsueh Su, Jang-Lin (John)
Chen, Vivien Huey-Juan Hsieh, Ding-Yuan Yang
NT$ 2,000,000 (inclusive) ~NT$ 3,500,000
Kuen-Yao (K.Y.) Lee, BenQ Foundation, Chin-
Bing (Philip) Peng, Mei-Yueh Ho, Yen-Shiang Shih
Kuen-Yao (K.Y.) Lee, BenQ Foundation, Chin-
Bing (Philip) Peng, Mei-Yueh Ho, Yen-Shiang Shih,
Vivien Huey-Juan Hsieh
Kuen-Yao (K.Y.) Lee, BenQ Foundation, Chin-
Bing (Philip) Peng, Mei-Yueh Ho, Yen-Shiang Shih
Chin-Bing (Philip) Peng, Mei-Yueh Ho, Yen-Shiang
Shih
NT$ 3,500,000 (inclusive) ~NT$ 5,000,000
NT$ 5,000,000 (inclusive) ~NT$ 10,000,000 Shuang-Lang (Paul) Peng Shuang-Lang (Paul) Peng BenQ Foundation
NT$ 10,000,000 (inclusive) ~NT$ 15,000,000
NT$ 15,000,000 (inclusive) ~NT$ 30,000,000 Frank Ko, Kuo-Hsin (Michael) Tsai Kuen-Yao (K.Y.) Lee, Peter Chen, Frank Ko, Kuo-
Hsin (Michael) Tsai
NT$ 30,000,000 (inclusive) ~NT$ 50,000,000
NT$ 50,000,000 (inclusive) ~NT$ 100,000,000 Shuang-Lang (Paul) Peng Shuang-Lang (Paul) Peng
More than NT$ 100,000,000
Total 15 Persons (including 3 Corporate Directors) 15 Persons (including 3 Corporate Directors) 15 Persons (including 3 Corporate Directors) 15 Persons (including 3 Corporate Directors)
Note 1. On June 14, 2019, the shareholders' general committee was re-elected. Peter Chen and Kuo-Hsin (Michael) Tsai were elected as the Corporate Director Representative of the BenQ Foundation and AUO Foundation; Yen-Hsueh Su and Janglin (John)
Chen were elected as Independent Directors; Corporate Director Qisda Corporation and Independent Directors Vivien Huey-Juan Hsieh and Ding-Yuan Yang stepped down.
Note 2. On September 10, 2019, the Corporate Director Representative of the AUO Foundation was reassigned from Kuo-Hsin (Michael) Tsai to Frank Ko.
Note 3. Refers to compensation for Directors in 2019 (including salaries, job allowance, severance pay, bonuses, and performance fees).
Note 4. Refers to pension either allocated or paid out per legal requirements in 2019.
Note 5. Refers to Directors' remunerations in 2019.
Note 6. Refers to Directors' business execution expenses in 2019 (including provisions of compensation, transport fees, special expenses, various subsidies, accommodations, or company vehicles and other physical items for those serving as representatives
of Corporate Directors or supervisors designated by AU Optronics Corp. and its subsidiaries).
Note 7. Refers to compensation for Directors who also served as President, Vice President, other managers or employees in 2019 including salaries, job remuneration, severance pay, bonuses, performance fees, transport fees, special expenses, various
subsidies, accommodation, company vehicles, and other physical items, etc. Any salary expenses recognized under IFRS 2 Share-Based Payment, including employee stock option plan, employee restricted stock and cash capital increase by stock
subscription shall also be included in compensation.
Note 8. Refers to employee’s remuneration (including stock and cash) paid to Directors who also served as President, Vice President, other managers, or employees in 2019.
Note 9. Total compensation in various items paid out to AU Optronics Corp.’s Directors.
Note 10. Profit refers to the profit (loss) for the year in the 2019 parent company only financial statements of AU Optronics Corp. under Taiwan IFRS.
Note 11. Refers to compensation, remunerations (including remunerations for employees, Directors, and supervisors), business execution expenses, and other related payments received by Directors who served as Director, supervisor, or manager in
investees other than AU Optronics Corp.’s subsidiaries or Parent Company in 2019.
Note 12. Total compensation paid to AU Optronics Corp.’s Directors.
AU
Optro
nics
2019 A
nnual R
epo
rt
16
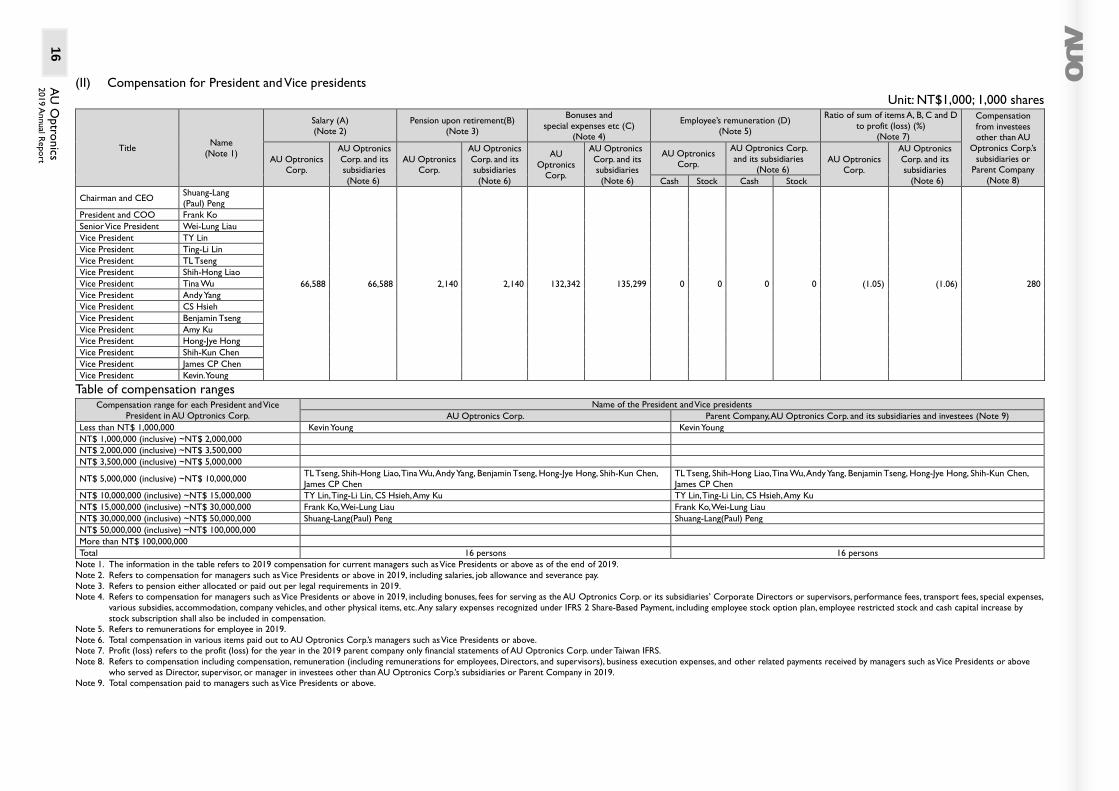
(II) Compensation for President and Vice presidents
Unit: NT$1,000; 1,000 shares
Title Name
(Note 1)
Salary (A)
(Note 2)
Pension upon retirement(B)
(Note 3)
Bonuses and
special expenses etc (C)
(Note 4)
Employee’s remuneration (D)
(Note 5)
Ratio of sum of items A, B, C and D
to profit (loss) (%)
(Note 7)
Compensation
from investees
other than AU
Optronics Corp.’s
subsidiaries or
Parent Company
(Note 8)
AU Optronics
Corp.
AU Optronics
Corp. and its
subsidiaries
(Note 6)
AU Optronics
Corp.
AU Optronics
Corp. and its
subsidiaries
(Note 6)
AU
Optronics
Corp.
AU Optronics
Corp. and its
subsidiaries
(Note 6)
AU Optronics
Corp.
AU Optronics Corp.
and its subsidiaries
(Note 6) AU Optronics
Corp.
AU Optronics
Corp. and its
subsidiaries
(Note 6) Cash Stock Cash Stock
Chairman and CEO Shuang-Lang
(Paul) Peng
66,588 66,588 2,140 2,140 132,342 135,299 0 0 0 0 (1.05) (1.06) 280
President and COO Frank Ko
Senior Vice President Wei-Lung Liau
Vice President TY Lin
Vice President Ting-Li Lin
Vice President TL Tseng
Vice President Shih-Hong Liao
Vice President Tina Wu
Vice President Andy Yang
Vice President CS Hsieh
Vice President Benjamin Tseng
Vice President Amy Ku
Vice President Hong-Jye Hong
Vice President Shih-Kun Chen
Vice President James CP Chen
Vice President Kevin.Young
Table of compensation ranges Compensation range for each President and Vice
President in AU Optronics Corp.
Name of the President and Vice presidents
AU Optronics Corp. Parent Company, AU Optronics Corp. and its subsidiaries and investees (Note 9)
Less than NT$ 1,000,000 Kevin Young Kevin Young
NT$ 1,000,000 (inclusive) ~NT$ 2,000,000
NT$ 2,000,000 (inclusive) ~NT$ 3,500,000
NT$ 3,500,000 (inclusive) ~NT$ 5,000,000
NT$ 5,000,000 (inclusive) ~NT$ 10,000,000 TL Tseng, Shih-Hong Liao, Tina Wu, Andy Yang, Benjamin Tseng, Hong-Jye Hong, Shih-Kun Chen,
James CP Chen
TL Tseng, Shih-Hong Liao, Tina Wu, Andy Yang, Benjamin Tseng, Hong-Jye Hong, Shih-Kun Chen,
James CP Chen
NT$ 10,000,000 (inclusive) ~NT$ 15,000,000 TY Lin, Ting-Li Lin, CS Hsieh, Amy Ku TY Lin, Ting-Li Lin, CS Hsieh, Amy Ku
NT$ 15,000,000 (inclusive) ~NT$ 30,000,000 Frank Ko, Wei-Lung Liau Frank Ko, Wei-Lung Liau
NT$ 30,000,000 (inclusive) ~NT$ 50,000,000 Shuang-Lang(Paul) Peng Shuang-Lang(Paul) Peng
NT$ 50,000,000 (inclusive) ~NT$ 100,000,000
More than NT$ 100,000,000
Total 16 persons 16 persons
Note 1. The information in the table refers to 2019 compensation for current managers such as Vice Presidents or above as of the end of 2019.
Note 2. Refers to compensation for managers such as Vice Presidents or above in 2019, including salaries, job allowance and severance pay.
Note 3. Refers to pension either allocated or paid out per legal requirements in 2019.
Note 4. Refers to compensation for managers such as Vice Presidents or above in 2019, including bonuses, fees for serving as the AU Optronics Corp. or its subsidiaries’ Corporate Directors or supervisors, performance fees, transport fees, special expenses,
various subsidies, accommodation, company vehicles, and other physical items, etc. Any salary expenses recognized under IFRS 2 Share-Based Payment, including employee stock option plan, employee restricted stock and cash capital increase by
stock subscription shall also be included in compensation.
Note 5. Refers to remunerations for employee in 2019.
Note 6. Total compensation in various items paid out to AU Optronics Corp.’s managers such as Vice Presidents or above.
Note 7. Profit (loss) refers to the profit (loss) for the year in the 2019 parent company only financial statements of AU Optronics Corp. under Taiwan IFRS.
Note 8. Refers to compensation including compensation, remuneration (including remunerations for employees, Directors, and supervisors), business execution expenses, and other related payments received by managers such as Vice Presidents or above
who served as Director, supervisor, or manager in investees other than AU Optronics Corp.’s subsidiaries or Parent Company in 2019.
Note 9. Total compensation paid to managers such as Vice Presidents or above.

Corp
orate
Gove
rnan
ce
AU
Optro
nics
2019 A
nnual R
epo
rt 17
(III) The top five executives with the highest remuneration
Unit: NT$1,000; 1,000 shares
Title Name
(Note 1)
Salary (A)
(Note 3)
Pension upon retirement(B)
(Note 4)
Bonuses and
special expenses etc (C)
(Note 5)
Employee’s remuneration (D)
(Note 6)
Ratio of sum of items A, B, C and D
to profit (loss) (%)
(Note 8)
Compensation from
investees other than
AU Optronics Corp.’s
subsidiaries or Parent
Company
(Note 9)
AU Optronics
Corp.
AU Optronics
Corp. and its
subsidiaries
(Note 7)
AU Optronics
Corp.
AU Optronics
Corp. and its
subsidiaries
(Note 7)
AU Optronics
Corp.
AU Optronics
Corp. and its
subsidiaries
(Note 7)
AU Optronics Corp.
AU Optronics Corp.
and its subsidiaries
(Note 7) AU Optronics
Corp.
AU Optronics
Corp. and its
subsidiaries
(Note 7) Cash Stock Cash Stock
Chairman and CEO Shuang-Lang
(Paul) Peng 10,012 10,012 - - 34,725 34,775 - - - - (0.23) (0.23) 60
President and COO Frank Ko
(Note 2) 1,850 1,850 33 33 18,006 18,006 - - - - (0.10) (0.10) -
Senior Vice President Wei-Lung Liau 5,265 5,265 203 203 11,290 11,290 - - - - (0.09) (0.09) 60
Vice President TY Lin 4,384 4,384 108 108 8,902 9,702 - - - - (0.07) (0.07) 50
Vice President Ting-Li Lin 4,526 4,526 194 194 7,950 7,950 - - - - (0.07) (0.07) -
Note 1. The information in the table refers to 2019 compensation for current managers such as Vice Presidents or above as of the end of 2019.
Note 2. Appointed on September 10, 2019.
Note 3. Refers to compensation for managers such as Vice Presidents or above in 2019, including salaries, job allowance and severance pay.
Note 4. Refers to pension either allocated or paid out per legal requirements in 2019.
Note 5. Refers to compensation for managers such as Vice Presidents or above in 2019, including bonuses, fees for serving as the AU Optronics Corp. or its subsidiaries’ Corporate Directors or supervisors, performance fees, transport fees, special
expenses, various subsidies, accommodation, company vehicles, and other physical items, etc. Any salary expenses recognized under IFRS 2 Share-Based Payment, including employee stock option plan, employee restricted stock and cash capital
increase by stock subscription shall also be included in compensation.
Note 6. Refers to remunerations for employee in 2019.
Note 7. Total compensation in various items paid out to AU Optronics Corp.’s managers such as Vice Presidents or above.
Note 8. Profit (loss) refers to the profit (loss) for the year in the 2019 parent company only financial statements of AU Optronics Corp. under Taiwan IFRS.
Note 9. Refers to compensation including compensation, remuneration (including remunerations for employees, Directors, and supervisors), business execution expenses, and other related payments received by managers such as Vice Presidents or above
who served as Director, supervisor, or manager in investees other than AU Optronics Corp.’s subsidiaries in 2019.
(IV) Name of the managers provided with employee’s remunerations and state of payments: Not applicable
(V) Compare and analyze the total compensation as a percentage of net income after taxes stated in the parent company only or individual financial statements, paid by the
Company and by all companies listed in the consolidated financial statement in the most recent two years to the Company's Directors, supervisors, President and Vice
President. Describe the policies, standards, and packages for payment of compensation, the procedures for determining compensation, and its linkage to business performance
and future risk exposure.
1. The total compensation as a percentage of net income after taxes stated in the parent company only financial statement, paid by the Company and by all companies listed
in the consolidated financial statement in the most recent two years to the Company's Directors, supervisors, President and Vice President are as the following: Unit: NT$ 1,000
Year Item
2019 2018
Net income (loss) after taxes on the Company's Parent Company Only
Financial Statements (19,185,258) 10,160,598
Ratio of compensation paid to Directors by the Company (%) (0.15) 0.56
Ratio of compensation for Directors paid by all companies listed in the Consolidated Financial Statements (%)
(0.16) 0.59
Ratio of compensation for Managers such as Vice President or above paid by
the Company (%) (1.05) 2.79
Ratio of compensation for Managers such as Vice President or above paid by all companies listed in the Consolidated Financial Statements (%)
(1.06) 2.87
AU
Optro
nics
2019 A
nnual R
epo
rt
18
2. Policies, standards, and packages for payment of compensation, as well as the procedures followed for determining the compensation, and their linkages to business
performance and future risk exposure.
(1) Compensation for Company Directors have been authorized for distribution by the Board of Directors pursuant to the Company's Articles of Association, based on
individual Director's level of participation and contributions to Company operations, and have been paid pursuant to the Compensation Policy to the Directors and
Functional Committee Members which is in reference to domestic and overseas industry standards. When earnings are present, the Board of Directors will resolve
on the amount of Directors’ remunerations based on the Company's Articles of Association.
(2) Appointment, termination, and compensation for the Company's President and Vice presidents are handled in accordance with Company policies. Compensation is
paid according to the “Principle of Compensation Paid to Managers” as stipulated by the Company’s Remuneration Committee and the Board of Directors. The
compensation paid to directors and managers of the Company, after being approved by the Remuneration Committee, is submitted to the Board of Directors for
further approval.
(3) The principle for distribution of remuneration of the Company's managers is linked to their job duties and performance thereof; that is, the remuneration is positioned
within a certain interval of the industry remuneration comparison table, which rewards higher remuneration when high performance is achieved; in addition, the
company has a incentive program for managers, which is carried out by the Remuneration Committe who will determine the targets for rewards (such as market
share, revenue, etc.) according to the Company's strategic development, and who will regulary review the overall operating status of the Company and the achievement
of said targets, and give rewards accordingly. Moreover, according to the Company's Articles of Association, if the Company makes a profit in the year, it should allocate
no less than 5% for employee compensation. In light of the above-mentioned remuneration policy, the Company provides a competitive remuneration in the market
and attracts, retains and cultivates talent in the long run. Doing so loyally reflects the Company's operating risks and corporate governance structure, and avoids using
short-term profit as the sole indicator for remuneration and performance evaluation, thereby establishing a link to shareholder’s long-term value.

AU Optronics 2019 Annual Report
19
Corporate Governance
IV. Implementation of Corporate Governance
(I) Operations of the Board of Directors
The Company had convened seven Board of Directors meetings in 2019 with the following attendance:
Title Name Number of
actual
attendance
Number of proxy
attendance
Actual attendance rate (%)
Remarks (Note 1)
Chairman Shuang-Lang (Paul) Peng 7 0 100 Re-election
Director Kuen-Yao (K.Y.) Lee 7 0 100 Re-election
Director BenQ Foundation
Representative: Kuo-Hsin (Michael) Tsai
3 0 100 Re-election, assigning a
new representative Representative: Peter Chen
4 0 100
Director AUO Foundation
Representative: Kuo-Hsin (Michael) Tsai
3 0 100 Newly elected, reassigning
a representative on September 10, 2019 Representative: Frank Ko 1 0 100
Independent Director Mei-Yueh Ho 7 0 100 Re-election
Independent Director Chin-Bing (Philip) Peng 7 0 100 Re-election
Independent Director Yen-Shiang Shih 7 0 100 Re-election
Independent Director Yen-Hsueh Su 4 0 100 Newly elected
Independent Director Jang-Lin (John) Chen 4 0 100 Newly elected
Director Qisda Corporation
Representative: Peter Chen 3 0 100 Former
Independent Director Vivien Huey-Juan Hsieh 3 0 100 Former
Independent Director Ding-Yuan Yang 3 0 100 Former
Other items that shall be disclosed: I. When one of the following situations occurred to the operations of the Board, state the date and term of the Board meeting, content of
proposals, opinions of all Independent Directors and the Company's actions in response to the opinions of the Independent Directors: (I) Matters included in Article 14-3 of the Securities and Exchange Act: regulations from Article 14-3 are not applicable since the
Company has already established an Audit Committee. For explanations on matters stipulated in Article 14-5 of the Securities and
Exchange Act, please see Operations of the Audit Committee (Page 21). (II) In addition to the aforementioned matters, any other resolutions from the Board of Directors where an Independent Director
expressed a dissenting or qualified opinion that has been recorded or stated in writing: None.
II. When Directors abstain themselves for being a stakeholder in certain proposals, the name of the Directors, the content of the proposal, reasons for abstentions and the participation in voting should be stated.
Date of Board
Meeting
Name of Director Resolutions Reason for Recusal Participation in Voting
March 22, 2019 All directors present Approved the 2018
compensation to
directors and senior
managerial officers
Since the resolution is for
the compensation to
directors and senior
managerial officers,
directors all abstained
themselves from the
meeting when it came to
their remuneration in order
to avoid conflict of interests.
Did not participate in
discussion or voting
Chairman Shuang-Lang (Paul) Peng
Director Kuen-Yao (K.Y.) Lee
Peter Chen, Representative of Qisda Corp.
Kuo-Hsin (Michael) Tsai, Representative of
BenQ Foundation
Approved the
donations
Concurrently the director
and the representative of a
corporate shareholder of
BenQ Foundation
Did not participate in
discussion or voting
April 24, 2019 Chairman Shuang-Lang (Paul) Peng Approved the
Company and the
subsidiaries to lend
capital to AU
Optronics (Kunshan)
Co., Ltd.
Concurrently serve as a
director of AU Optronics
(Kunshan) Co., Ltd.
Did not participate in
discussion or voting
Chairman Shuang-Lang (Paul) Peng Approved the
Company to conduct
derivative transaction
on behalf of AU
Optronics (Kunshan)
Co., Ltd. on its
exposure in US
dollars
Concurrently serve as a
director of AU Optronics
(Kunshan) Co., Ltd.
Did not participate in
discussion or voting
Chairman Shuang-Lang (Paul) Peng
Director Kuen-Yao (K.Y.) Lee
Director Kuo-Hsin (Michael) Tsai
Director Peter Chen
Director BenQ Foundation
Independent Director Chin-Bing (Philip) Peng
Independent Director Mei-Yueh Ho
Independent Director Yen-Shiang Shih
Approved to lift non-
competition
restrictions on board
members
Directors who are the
board candidates seperately
recused themselves from
the meeting when it came
to lifting their non-
competition restrictions.
Did not participate in
discussion or voting

AU Optronics 2019 Annual Report
20
April 24, 2019 Chairman Shuang-Lang (Paul) Peng
Director Kuo-Hsin (Michael) Tsai
Independent Director Yen-Shiang Shih
Approved the
donations to AUO
Foundation
Concurrently serve as a
director of AUO
Foundation
Did not participate in
discussion or voting
June 14, 2019 Independent Director Yen-Shiang Shih
Independent Director Yen-Hsueh Su
Appointed the
members of the
Company’s fourth-
term Remuneration
Committee
Serve as a member of the
Remuneration Committe as
delegated by the Board of
Directors
Did not participate in
discussion or voting
July 24, 2019 Chairman Shuang-Lang (Paul) Peng
Kuo-Hsin (Michael) Tsai, Director and
Representative of AUO Foundation
Approved the
distribution of 2018
employees’
remuneration for
senior managerial
officers
Concurrently serve as a
manager of the Company
Did not participate in
discussion or voting
February 5, 2020 All directors present Approved the 2019
compensation to
directors and senior
managerial officers
Since the resolution is for
the compensation to
directors and senior
managerial officers,
directors all abstained
themselves from the
meeting when it came to
their remuneration in order
to avoid conflict of interests
Did not participate in
discussion or voting
Chairman Shuang-Lang (Paul) Peng
Frank Ko, Representative of AUO Foundation
Approved the 2020
Senior Officer
Compensation Policy
Concurrently serve as a
manager of the Company
Did not participate in
discussion or voting
Chairman Shuang-Lang (Paul) Peng
Director Kuen-Yao (K.Y.) Lee
Peter Chen, Representative BenQ Foundation
Frank Ko, Representative of AUO Foundation
Approved the
donations
Concurrently serve as a
director or representative
of a corporate shareholders
for BenQ Foundation and
AUO Foundation
Did not participate in
discussion or voting
III. The interval and period of self-assessment (or peer assessment) made by the Board of Directors of the Company, the assessment
scope, method, and content, and the implementation:
Assessment
Interval
Assessment period Scope Assessment
Method
Assessment Content
Annually October 2018 to
October 2019
Board of
Directors,
Functional
Committees
(including Audit
Committee and
Remuneration
Committee) and
their individual
members
Internal self-
assessment made
by the Board of
Directors,
Functional
Committees
(including Audit
Committee and
Remuneration
Committee) and
their individual
members
The performance assessment of the Board of Directors and its
individual members includes five major aspects: the degree of
participation in the Company's operations, the decision-making
quality of the Board of Directors, the composition and structure of
the Board of Directors, selection and appointment of directors and
continuous education and internal control.
The performance assessment of the Functional Committees and its
individual members includes five major aspects: the degree of
participation in the Company's operations, the awareness of duties
of theFunctional Committees, the decision-making quality of the
Functional Committees, the composition and election of the
Functional Committees, and internal control.
IV. Targets for strengthening the functions of the Board of Directors in the current and the most recent year (e.g., setting up an Audit
Committee and enhancing information transparency) and evaluation of target implementation:
1. The Company's Board of Directors' duties include supervising the Company's strategy, monitoring the management and the
operation and arrangement of corporate governance systems. It is also responsible for the Company and the Shareholders’ Meeting, and shall exercise its powers in accordance with the law, regulations, Articles of Incorporation or the resolutions of the
Shareholders' Meetings. 2. The Company has established the Audit Committee on June 13, 2007 to carry out duties concerning the Securities and Exchange
Act, Company Act, and other legal regulations. Please see Page 21 of the Annual Report for operations of the Audit Committee. 3. The Company has established a Remuneration Committee on August 30, 2011 to regularly evaluate and establish the salaries and
compensation for Directors and managers, as well as to regularly review the performance of Directors and managers as well as the policies, systems, standards, and structures of their salaries and compensation. Please see Page 31 of the Annual Report for operations of the Remuneration Committee.
4. The Company set up a Corporate Governance Committee on October 29, 2019, of which the powers and duties include, establish independent standards required by members of the board of directors, and to seek, review and nominate director candidates with diverse backgrounds such as professional knowledge, technology, experience and gender; construct and develop
the organizational structure of the board of directors and committees, to evaluate the performance of the board of directors, committees and directors, and to evaluate the independence of independent directors; develop and regularly review directors' training programs and succession plans; and establish the Company's corporate governance principles.
5. The Company held re-elections of its Directors at the Annual General Meeting on June 14, 2019. Nine seats of Directors were elected, including five seats of Independent Directors. To strengthen the functionality of the Board and corporate governance, the seats of Independent Directors account for majority of all Directors.
6. Please see Page 32 of the Annual Report for the goals and implementations of the Company's Sustainability Committee.
Note 1: The Company re-elected the directors at the Annual General Meeting on June 14, 2019.

AU Optronics 2019 Annual Report
21
Corporate Governance
(II) Operations of the Audit Committee
The Company had convened seven Audit Committee meetings in 2019 with the following attendance:
Title Name Number of actual
attendance
Number of proxy
attendance
Actual attendance rate
(%)
Remarks (Note)
Independent Director Chin-Bing (Philip) Peng 7 0 100 Re-election
Independent Director Mei-Yueh Ho 7 0 100 Re-election
Independent Director Yen-Shiang Shih 7 0 100 Re-election
Independent Director Yen-Hsueh Su 4 0 100 Newly elected
Independent Director Jang-Lin (John) Chen 4 0 100 Newly elected
Independent Director Vivien Huey-Juan Hsieh 3 0 100 Former
Independent Director Ding-Yuan Yang 3 0 100 Former
Other items that shall be disclosed:
I. When one of the following situations has occurred to the operations of the Audit Committee, state the date, term and content of proposals of
the Board meeting, result of resolutions of the Audit Committee and the Company's actions in response to the resolutions:
(I) Matters included in Article 14-5 of the Securities and Exchange Act: (Please see III. Corporate Governance Report - Material Resolutions
from the Shareholders' Meeting and the Board of Directors on Page 46-48 of the Annual Report):
All resolutions have been approved with the consent of one-half or more of all Audit Committee members before a resolution has been
reached at the Board meeting. There were no other resolutions which had not been approved with the concurrence of one-half or more of
all Audit Committee members but were undertaken upon the consent of two-thirds or more of all directors.
(II) Except the items in the preceding issues, other resolutions which had not been approved with the concurrence of one-half or more of all
Audit Committee members but were undertaken upon the consent of two-thirds or more of all directors: None.
II. In regards to the recusal of independent directors from voting due to conflict of interests, the name of the independent directors, the resolutions,
reasons for recusal due to conflict of interests and voting outcomes should be stated:
Meeting Date Name of
Members
Resolutions Reason for Recusal Participation in Voting
April 24, 2019 Yen-Shiang Shih To approve the donation to
AUO Foundation
Concurrently serve as a director of
AUO Foundation
Did not participate in discussion or
voting
III. Communication between the Independent Directors, the head of internal audit and CPAs (shall include material matters, methods and results of
communication on the finances and state of business of the Company):
1. The Company regularly convenes Audit Committee meetings. Where necessary, CPAs, the head of internal audit and relevant executives are
also invited to the meeting.
2. The head of Internal audit is required to submit audit reports to the Audit Committee based on annual audit plan on a regular basis, whereas
the Audit Committee also conducts regular evaluation on the Company's internal control system, internal auditors and their audit results.
3. The Audit Committee regularly communicates with the Company's CPAs for review or audit results of the quarterly financial statements and
other communication matters required by law. The Audit Committee also undertakes independence reviews on the selection of CPA and the
CPA's audit and non-audit services.
IV. Annual key functions and operations:
(I) Annual key functions
1. Communicate results of audit report with the head of internal audit regularly according to the annual audit plan.
2. Communicate with CPA regularly over financial statement review or audit results in each quarter.
3. Review financial reports.
4. Assessment of the effectiveness of internal control system.
5. Review the hiring, dismissal, compensation and service matters concerning CPAs in advance.
6. Evaluate the independence of the CPA who provide audit and non-audit services.
7. Review the Company's operational procedures and material transactions of assets, derivatives, capital lending and endorsement/guarantees.
8. Legal compliance.
9. Handle any grievances/reporting incidents submitted to the Audit Committee Mailbox.
(II) 2019 operations: Proposals of the Audit Committee meetings have all been reviewed or approved by members of the Audit Committee with
no dissent from any of the Independent Directors.
Note: The Company re-elected the directors at the Annual General Meeting on June 14, 2019.
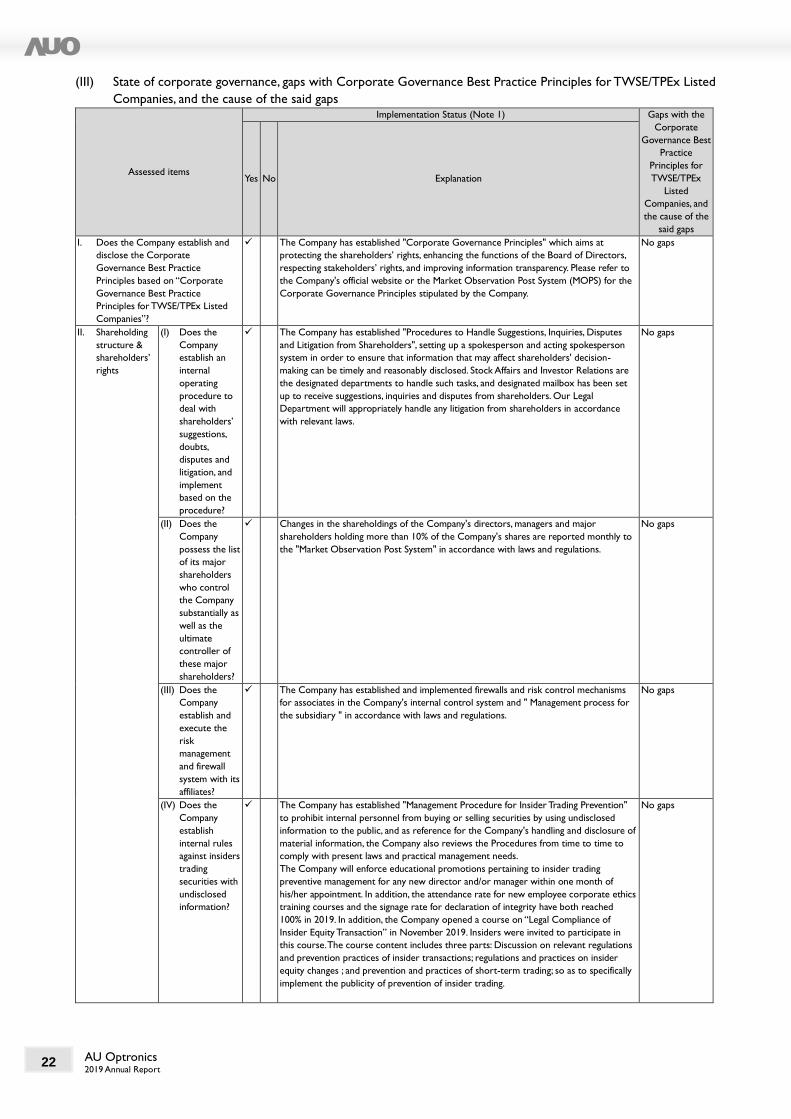
AU Optronics 2019 Annual Report
22
(III) State of corporate governance, gaps with Corporate Governance Best Practice Principles for TWSE/TPEx Listed
Companies, and the cause of the said gaps
Assessed items
Implementation Status (Note 1) Gaps with the
Corporate
Governance Best
Practice
Principles for
TWSE/TPEx
Listed
Companies, and
the cause of the
said gaps
Yes No Explanation
I. Does the Company establish and
disclose the Corporate
Governance Best Practice
Principles based on “Corporate
Governance Best Practice
Principles for TWSE/TPEx Listed
Companies”?
✓ The Company has established "Corporate Governance Principles" which aims at
protecting the shareholders’ rights, enhancing the functions of the Board of Directors,
respecting stakeholders’ rights, and improving information transparency. Please refer to
the Company's official website or the Market Observation Post System (MOPS) for the
Corporate Governance Principles stipulated by the Company.
No gaps
II. Shareholding
structure &
shareholders’
rights
(I) Does the
Company
establish an
internal
operating
procedure to
deal with
shareholders’
suggestions,
doubts,
disputes and
litigation, and
implement
based on the
procedure?
✓ The Company has established "Procedures to Handle Suggestions, Inquiries, Disputes
and Litigation from Shareholders", setting up a spokesperson and acting spokesperson
system in order to ensure that information that may affect shareholders' decision-
making can be timely and reasonably disclosed. Stock Affairs and Investor Relations are
the designated departments to handle such tasks, and designated mailbox has been set
up to receive suggestions, inquiries and disputes from shareholders. Our Legal
Department will appropriately handle any litigation from shareholders in accordance
with relevant laws.
No gaps
(II) Does the
Company
possess the list
of its major
shareholders
who control
the Company
substantially as
well as the
ultimate
controller of
these major
shareholders?
✓ Changes in the shareholdings of the Company's directors, managers and major
shareholders holding more than 10% of the Company's shares are reported monthly to
the "Market Observation Post System" in accordance with laws and regulations.
No gaps
(III) Does the
Company
establish and
execute the
risk
management
and firewall
system with its
affiliates?
✓ The Company has established and implemented firewalls and risk control mechanisms
for associates in the Company's internal control system and " Management process for
the subsidiary " in accordance with laws and regulations.
No gaps
(IV) Does the
Company
establish
internal rules
against insiders
trading
securities with
undisclosed
information?
✓ The Company has established "Management Procedure for Insider Trading Prevention"
to prohibit internal personnel from buying or selling securities by using undisclosed
information to the public, and as reference for the Company's handling and disclosure of
material information, the Company also reviews the Procedures from time to time to
comply with present laws and practical management needs.
The Company will enforce educational promotions pertaining to insider trading
preventive management for any new director and/or manager within one month of
his/her appointment. In addition, the attendance rate for new employee corporate ethics
training courses and the signage rate for declaration of integrity have both reached
100% in 2019. In addition, the Company opened a course on “Legal Compliance of
Insider Equity Transaction” in November 2019. Insiders were invited to participate in
this course. The course content includes three parts: Discussion on relevant regulations
and prevention practices of insider transactions; regulations and practices on insider
equity changes ; and prevention and practices of short-term trading; so as to specifically
implement the publicity of prevention of insider trading.
No gaps

AU Optronics 2019 Annual Report
23
Corporate Governance
Assessed items
Implementation Status (Note 1) Gaps with the
Corporate
Governance Best
Practice
Principles for
TWSE/TPEx
Listed
Companies, and
the cause of the
said gaps
Yes No Explanation
III. Composition
and
responsibilities
of the Board
of Directors
(I) Does the
Board develop
and implement
a diversified
policy for the
composition of
its members?
✓ The composition of the Board of Directors shall be determined by taking diversity into
consideration. It is advisable that directors concurrently serving as the Company's
managers not exceed one-third of the total number of the Board members, and that an
appropriate policy on diversity based on the Company's business operations, operating
dynamics, and development needs be formulated and include, without being limited to,
the following two general standards:
1. General conditions and values: Gender and age.
2. Professional knowledge and skills: Professional background, professional skills and
industrial experience.
The specific management objectives and achievement of the Company's diversity policy
are as follows:
Management objectives: Progress
Independent Directors form the majority of all directors. Achieved
Number of Directors who concurrently serve as Company
managers do not exceed one-third of all Directors.
Achieved
At least two seats of Directors are females. Achieved
The Company's fulfillment of diversification of members of the Board of Directors in
2019 is as follows:
Name Title
Seniority of
Independent Director
Gender
Professional knowledge and skills
Major Experiences
Age
Employees
Identification Less than
3 years
3-9 years
More than
9 years
Industry or
technology
Legal, finance or accounting
Technology industry
Financial investment
Technical research
Below 55 yrs
old
56-65 yrs old
66-75 yrs old
Shuang-Lang
(Paul) Peng
Chairman
Male V V V V
Kuen-
Yao (K.Y.) Lee
Director
Male V V V
Frank Ko
Director Male V V V V
Peter Chen
Director Male V V V
Chin-
Bing (Philip) Peng
Independent
Director V Male V V V V
Mei-Yueh
Ho
Independent Director V Female V V V V
Yen-Shiang
Shih
Independent Director V Male V V V
Yen-Hsueh
Su
Independent Director V Female V V V V V
Jang-Lin
(John) Chen
Independent
Director V Male V V V V
Note: Information as of December 31, 2019.
No gaps
(II) In addition to
remuneration
committee and
audit
committee
established
according to
law, has the
Company
voluntarily
established
other
functional
committees?
✓ In addition to the Audit Committee and the Remuneration Committe, the Company
also established a Corporate Governance Committee in October 2019 to strengthen
corporate governance and enhance the effectiveness of the Board. The convener of the
Corporate Governance Committee is the chairman of the Company and its members
are all independent directors. Its powers and duties include, establish independent
standards required by members of the board of directors, and to seek, review and
nominate director candidates with diverse backgrounds such as professional knowledge,
technology, experience and gender; construct and develop the organizational structure
of the board of directors and committees, to evaluate the performance of the board of
directors, committees and directors, and to evaluate the independence of independent
directors; develop and regularly review directors' training programs and succession
plans; and establish the Company's corporate governance principles.
The Company has also set up a CSR Committee. For organization and operations of
the CSR Committee, please see Chapter 7. Capital Overview, in which financial
performance is reviewed and analyzed and risks satated, and Chapter 3. Corporate
Governance - fulfillment of corporate social responsibility (Page 81 and Page 32) of this
Annual Report.
No gaps
(III) Does the
company
formulate the
performance
evaluation
methods for
✓ The Company's Board of Directors has approved the "Methods to Evaluate
Performance of the Board of Directors" on January 25, 2017, which has clearly
established that the Board of Directors shall undertake internal performance evaluation
at least once each year, and evaluation from external independent entities or external
experts and scholars shall be undertaken at least once every three years.
1. Internal performance evaluation:
No gaps

AU Optronics 2019 Annual Report
24
Assessed items
Implementation Status (Note 1) Gaps with the
Corporate
Governance Best
Practice
Principles for
TWSE/TPEx
Listed
Companies, and
the cause of the
said gaps
Yes No Explanation
the Board of
Directors,
conduct
performance
evaluations
annually and
regularly, and
report the
results of the
performance
evaluations to
the Board of
Directors, and
use them as a
reference for
individual
directors'
remuneration
and
nomination
and renewal?
The Company conducts internal performance evaluations on the “Board of
Directors”, “Audit Committee” and “Remuneration Committe” every year,
performed by members of the Board of Directors, members of functional
committees, and the Board’s meeting units.
The performance evaluation of the Board of Directorsincludes five major aspects: the
degree of participation in the Company's operations, the decision-making quality of
the Board of Directors, the composition and structure of the Board of Directors,
selection and appointment of directors, continuous education and internal control,
which are composed of 45 evaluation indicators; the performance evaluation of the
functional committees also includes five major aspects: the degree of participation in
the Company's operations, the awareness of duties of the functional committees, the
decision-making quality of the functional committees, the composition and election of
the functional committees, and internal control; there are 23 evaluation indicators for
the Audit Committee and 19 for the Remuneration Committe. The "Board of
Directors", "Audit Committee" and "Remuneration Committe" are evaluated on their
performance, and the evaluation results are divided into three levels: Exceeding
Expectations, Meets Expectations, and Room for Improvement.
The self-evaluation results of the Board of Directors, the Audit Committee and the
Remuneration Committee of the Company in 2019 were all “Exceeding
Expectations”, without any major improvement items. The evaluation results are
expected to report to the directors for the first board meeting in 2020, which will
serve as a reference for members of the Board of Directors and functional
committees on their performance, remuneration, nomination and renewal.
Meanwhile, as recommended by the directors, the Company also set up a Corporate
Governance Committee at the end of 2019, approved by the directors, so as to
establish appropriate and adequate functional committee.
2. External performance evaluation:
The Taiwan Corporate Governance Association (TCGA) was asked to undertake an
external effectiveness evaluation of the Company's Board of Directors in 2018.
Evaluation was conducted through online self-assessment questionnaires and on-site
inspection for 8 aspects including formation of the Board members, coaching,
delegation of authority, supervision, communications, internal control and risk
management, self-discipline, and supporting systems.
The performance evaluation report on the Board of Directors issued by the TCGA
suggested that the Board of Directors has three characteristics: active
implementation of sustainable governance, in-depth participation in business
management, and a high degree of self-discipline; the Company reported the
evaluation results to the Board of Directors, and the Board took TCGA’s
recommendation to be a reference for continuous improvement of the functions, and
made a decision to implement the performance evaluation of the functional
committees from 2019.
3. Pursuant to Article 15 of the Articles of Incorporation, directors’ remunerations of
the Company shall not exceed 1% of the Company's remaining profit for the year.
Remuneration Committee and the Board of Directors will establish compensations
for Directors based on the Company's management results and compensation policy
to the directors and functional committee members and in reference to the
Directors' performance evaluation results.
Directors' performance evaluation in 2018 indicated “Exceeding Expectations”. Upon
resolution from the Remuneration Committee and the Board of Directors in 2018,
directors' remuneration in 2018 had been fully distributed in accordance with "
Compensation policy to the directors and functional committee members."
(IV) Does the
Company
regularly
implement
assessments
on the
independence
of CPA?
✓ The Company's Audit Committee regularly evaluates the independence of CPAs every
year, and submits the evaluation results to the Board of Directors.
Below is a summary of the evaluation mechanism:
1. CPA of the Company is not a related party with either the Company or its
Directors.
2. The Company abides by the Corporate Governance Principles and undertakes
rotation of CPA.
3. Pursuant to the Sarbanes-Oxley Act, the accounting firm of the CPA needs to obtain
approval from the Audit Committee before undertaking annual audit and non-audit
services.
4. Pursuant to the Sarbanes-Oxley Act, the CPA reports to the Audit Committee
quarterly for the review/audit results and the compliance of independence.
5. Regularly obtain the Declaration of Independence from CPA.
No gaps

AU Optronics 2019 Annual Report
25
Corporate Governance
Assessed items
Implementation Status (Note 1) Gaps with the
Corporate
Governance Best
Practice
Principles for
TWSE/TPEx
Listed
Companies, and
the cause of the
said gaps
Yes No Explanation
Set forth below is the evaluation result:
1. Independence between the CPA and the Company complies with the Certified
Public Accountant Act of the Republic of China, Code of Professional Ethics for
Certified Public Accountant, and the regulations of SEC and PCAOB of the United
States.
The Company has not commissioned the same CPA for five consecutive years.
IV. Has the Company appointed
competent and appropriate number
of personnel responsible for
corporate governance matters, and
delegated the company’s corporate
governance supervisors to be in
charge of such matters (including but
not limited to providing information
for directors and supervisors to
perform their functions, assisting
directors and supervisors in
complying with laws and regulations,
handling matters related to Board
meetings and shareholders' meetings
according to the law, and
producing minutes of the Board
meetings and shareholders’
meetings)?
✓ The Board of Directors has appointed Mr. Benjamin Tseng, the vice president, as the
head of corporate governance, who is responsible for the supervision and planning of
corporate governance. His qualifications meet the requirements set forth in Article 3-
1-1 of the Corporate Governance Best Practice Principles for TWSE/TPEx Listed
Companies. The head of corporate governance’s duties include: provide directors and
Audit Committee with the information required for the implementation and the latest
regulations pertaining to the Company's operations, assist directors and Audit
Committee in complying with laws and regulations, report regularly to the Corporate
Governance Committee and the Board of Directors on corporate governance
operations, handle affairs relating to the board and shareholder meetings in accordance
with the law, produce the minutes of the Board of Directors and shareholders'
meetings, assist directors and members of Audit Committee in their appointments
and continuing education, etc., all are performed by the Board’s secretary unit.
Key corporate governance implementations include the following:
1. In 2019, seven Boards meetings and seven Audit Committee meetings were held.
2. One Annual General Meeting was held in 2019.
3. All members of the Board have completed at least six credits of continuing
education.
4. The Company has filed for liability insurance for its Directors and important
employees, and reports to the Board of Directors after the insurance has been
renewed.
5. The Compnay has conducted performance evaluation on the Board of Directors
and the functional committees. The evaluation results of the Board of Directors,
Audit Committee, and the Remuneration Committee are all Exceeding
Expectations.
6. The Company's results in the 5th Corporate Governance Evaluation had ranked
among Top 5%.
7. In 2019, the training hours for the head of corporate governance totaled 21 hours,
and the information has been disclosed on the Market Observation Post System.
For the complete course information, please refer to page 44 of the annual report.
No gaps
V. Has the Company set up channels of
communication for stakeholders
(including but not limited to
shareholders, employees, customers
and suppliers), dedicated a section of
the company's website for
stakeholder affairs and adequately
responded to stakeholders' inquiries
on significant corporate social
responsibility issues?
✓ The Company has a spokesperson system. At the same time, the Company's website
uses a variety of methods and channels to provide the Company's latest information
and important results of corporate social responsibility issues, which methods and
channels include stakeholder zone on the website, seminars, investor conference call,
industry-government-academia consultation meetings, customer satisfaction surveys,
mails, and corporate social responsibility reports.
No gaps
VI. Has the Company commissioned a
professional stock affair agency to
manage shareholders' meetings
relevant affairs?
✓ The Company has appointed Stock-Affairs Agency Department of Taishin International
Bank as its agency to carry out tasks relevant to Shareholders' Meetings.
No gaps
VII. Information
Disclosure
(I) Does the
Company
establish a
website to
disclose
information on
financial
operations and
corporate
governance?
✓ 1. Financial information disclosure:
The Company's Chinese and English websites have investor zones, which regularly
update financial information and investor conference call materials for investors'
reference.
2. Disclosure of business information:
Product Introduction and Technical R&D sections have been set up on the
Company's website, providing product and business information on a timely basis,
and the Company also uploads the latest business activities for the public at all
times.
3. Disclosure of corporate governance information:
The Company has a corporate governance area, which includes: Information about
the Board of Directors and functional committees, performance evaluation of the
Board of Directors and corporate governance related information; in addition, the
Company's policies and regulations and important documents are placed on the
website.
No gaps
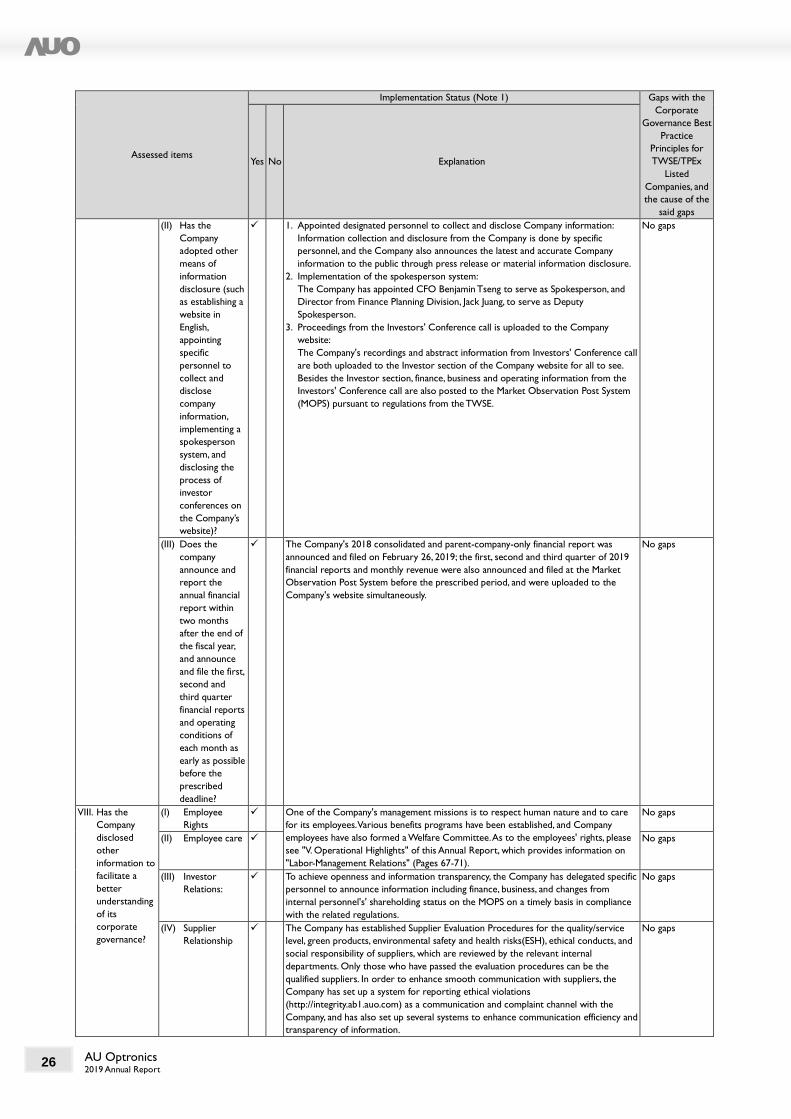
AU Optronics 2019 Annual Report
26
Assessed items
Implementation Status (Note 1) Gaps with the
Corporate
Governance Best
Practice
Principles for
TWSE/TPEx
Listed
Companies, and
the cause of the
said gaps
Yes No Explanation
(II) Has the
Company
adopted other
means of
information
disclosure (such
as establishing a
website in
English,
appointing
specific
personnel to
collect and
disclose
company
information,
implementing a
spokesperson
system, and
disclosing the
process of
investor
conferences on
the Company’s
website)?
✓ 1. Appointed designated personnel to collect and disclose Company information:
Information collection and disclosure from the Company is done by specific
personnel, and the Company also announces the latest and accurate Company
information to the public through press release or material information disclosure.
2. Implementation of the spokesperson system:
The Company has appointed CFO Benjamin Tseng to serve as Spokesperson, and
Director from Finance Planning Division, Jack Juang, to serve as Deputy
Spokesperson.
3. Proceedings from the Investors' Conference call is uploaded to the Company
website:
The Company's recordings and abstract information from Investors' Conference call
are both uploaded to the Investor section of the Company website for all to see.
Besides the Investor section, finance, business and operating information from the
Investors' Conference call are also posted to the Market Observation Post System
(MOPS) pursuant to regulations from the TWSE.
No gaps
(III) Does the
company
announce and
report the
annual financial
report within
two months
after the end of
the fiscal year,
and announce
and file the first,
second and
third quarter
financial reports
and operating
conditions of
each month as
early as possible
before the
prescribed
deadline?
✓ The Company's 2018 consolidated and parent-company-only financial report was
announced and filed on February 26, 2019; the first, second and third quarter of 2019
financial reports and monthly revenue were also announced and filed at the Market
Observation Post System before the prescribed period, and were uploaded to the
Company's website simultaneously.
No gaps
VIII. Has the
Company
disclosed
other
information to
facilitate a
better
understanding
of its
corporate
governance?
(I) Employee
Rights
✓ One of the Company's management missions is to respect human nature and to care
for its employees. Various benefits programs have been established, and Company
employees have also formed a Welfare Committee. As to the employees' rights, please
see "V. Operational Highlights" of this Annual Report, which provides information on
"Labor-Management Relations" (Pages 67-71).
No gaps
(II) Employee care ✓ No gaps
(III) Investor
Relations:
✓ To achieve openness and information transparency, the Company has delegated specific
personnel to announce information including finance, business, and changes from
internal personnel's' shareholding status on the MOPS on a timely basis in compliance
with the related regulations.
No gaps
(IV) Supplier
Relationship
✓ The Company has established Supplier Evaluation Procedures for the quality/service
level, green products, environmental safety and health risks(ESH), ethical conducts, and
social responsibility of suppliers, which are reviewed by the relevant internal
departments. Only those who have passed the evaluation procedures can be the
qualified suppliers. In order to enhance smooth communication with suppliers, the
Company has set up a system for reporting ethical violations
(http://integrity.ab1.auo.com) as a communication and complaint channel with the
Company, and has also set up several systems to enhance communication efficiency and
transparency of information.
No gaps

AU Optronics 2019 Annual Report
27
Corporate Governance
(V) Rights of
Stakeholders
✓ The Company has set up different and diversified interaction methods for different
stakeholders, and disclosed them in the corporate social responsibility report every
year. At the beginning of each year, the Company reports to the Board of Directors on
the communication with various stakeholders so that they can hear the voices of the
stakeholders.
No gaps
(VI) Directors’
continuing
education
✓ 1. The Company has undertaken the following training pursuant to the "Directions for
the Implementation of Continuing Education for Directors and Supervisors of
TWSE Listed and TPEx Listed Companies" from TWSE. Please see the following
table "Continuing Education and Training for the Company Directors in 2019" for
details.
2. The Company's managers may hold concurrent positions as Directors or
supervisors of the Company's Subsidiaries. As to continuing education for the
managers, please see "III. Other Material Information" of this Annual Report, which
provides information on "Other important information to achieve better
understanding on the state of corporate governance activities"(Page 44)
No gaps
(VII) The
implementation
of risk-
management
policies and
risk evaluation
standard
✓ Please see "Chapter 7. for Review, Analysis, Risk Factors of Financial Position and
Performance" for details (Pages 79-86.)
No gaps
(VIII) The
implementation
of customer
relations
policies
✓ The Company normally maintains close contact with its customers, and constantly
informs clients of products that satisfy the clients' interest. The Company also ensures
that its products can achieve the expected reliability and quality. Moreover, the
Company also actively participates in the clients' CSR promotional plans to blend new
perspectives and methods into the Company's management system in practice.
No gaps
(IX) Status of
purchasing
liability
insurance for
Company
Directors
✓ The Company has filed for liability insurance for its Directors and managers. The
Company regularly evaluates the insurance limit on an annual basis, and reports the
renewal of liability insurance to the Board of Directors.
No gaps
IX. Succession Plan and Operations of
Members of the Board of Directors
and Key Managerial Officers
✓ The Company has a diversity policy on the composition of members of the Board of
Directors. Under the structure of the Board of Directors with more than half of the
independent directors, the Company's Corporate Governance Committee formulates
independent standards required by members of the board of directors, and to seek,
review and nominate director candidates with diverse backgrounds such as
professional knowledge, technology, experience and gender. At the same time, the
Corporate Governance Committee will also consider the professional knowledge,
technology and experience required by the directors of the Company based on the
Company's size, business nature, future strategic development and transformation
planning, and regularly review the number of directors and the criteria that should be
met, so as to plan for succession of directors.
The Company has set up a Talent Development Committee, which regularly meets to
discuss and inspect the transitional planning and talent cultivation for important
managerial roles within the Company. The committee has also set up an Individual
Development Program (IDP) for important managerial roles based on their individual
competencies and functional needs. To foster the managerial competency, leadership,
and operational skills of important managerial roles, the IPD includes training courses,
interdisciplinary learning, job rotation, and a mentorship system based on the needs of
the organization and individuals. In particular, the training courses are planned by the
Company's training system. In addition to internal training courses, renowned external
institutions are also introduced to facilitate the management team in expanding its
external perspectives. To foster multi-dimensional strategic views at the management
level, the Talent Development Committee will establish management level rotations
based on the organization's needs. A mentorship system is also established to facilitate
new managers. In addition to organizing and incubating a well-rounded management
reserve to assume subsequent leadership through cross-disciplinary methods, the
mentorship system also allows managers to learn up close the strategic views required
for corporate management.
The Company will also arrange important management to serve as members of the
Board of Directors of the Company or investment enterprise, familiarize them with
the operation of the Board of Directors, and have them participated in the planning of
the Company's or investment enterprise's long-term strategic direction and vision.
No gaps
X. Please provide information on the status of improvement regarding the results of corporate governance evaluation published by the TWSE Corporate
Governance Center in the most recent year. For improvements not yet implemented, state the areas and policies the Company has set as priority for
improvement:
The Company is named among the top 5% in the 5th Corporate Governance Evaluation from the TWSE in 2018. At the same time, the Company referred to
the corporate governance evaluation indicators and took the recommendations of the Board of Directors in their performance evaluation results to set up a
Corporate Governance Committee at the end of 2019 in order to establish appropriate and sufficient functional committees and strengthen corporate
governance and enhance the effectiveness of the Board of Directors. The Company continuously demonstrates its sustainable strength in all aspects of
economy, environment and society, and will continue to uphold the core values of the Company , namely integrity, and undertake the long-term sustainable
responsibility for all stakeholders and the society.
To realize our mission of "becoming a leading green project enterprise around the world," the Company has invested toward new business areas in solar

AU Optronics 2019 Annual Report
28
Note 1: Operations are based on the Company's practices, and either Yes or No will be ticked. Please see the content of the abstract for
explanations.
energy, developed eco-friendly products, and is committed to in-depth environmental issues in the manufacturing industry.
Energy management: The Company is the first manufacturing company in the world to introduce the ISO 50001 energy management system. Each year, there
are hundreds of energy-saving management improvement programs, with investment of several hundred million NTD. In addition, in order to strengthen
energy performance management, the Company is ahead of the industry to introduce internationally recognized measurements, namely International
Performance Management & Verification Protocol (IPMVP), so as to make the data quality more reliable. In addition, in order to respond to the trend of
intelligent management of big data, the Company trains intelligent professionals through professional training and cultivation, so that all aspects of the
Company's operations can employ intelligent management and see the improvement of energy efficiency; on large and high-energy-consumption systems,
such as water cooled chiller unit and the air compressor system, we have achieved considerable energy saving performance through intelligent management.
Taking 2019 as an example, the overall power saving performance is estimated to be about 100 million kWh.
Environmental management:
The Company has introduced the ISO 14001 environmental management system for a long time. Through continuous improvement of the recycling
mechanism, it ensures the sustainability of the environment and meets the needs of stakeholders. Practices of such includes the implementation of water-
saving technologies in the production process, the promotion of sludge reduction projects, the improvement of material recycling, support for the
government policies, promotion of the use of recycled water, and cooperation with suppliers to implement the Company's 2025 CSR goal of [sustainable
environment, inclusive growth, and flexible innovation].
Green energy: As of December 31, 2019, the Company has indirectly established and implemented a 114MWp solar power system through Star River Energy
Corp. and Star Shining Energy Corp.
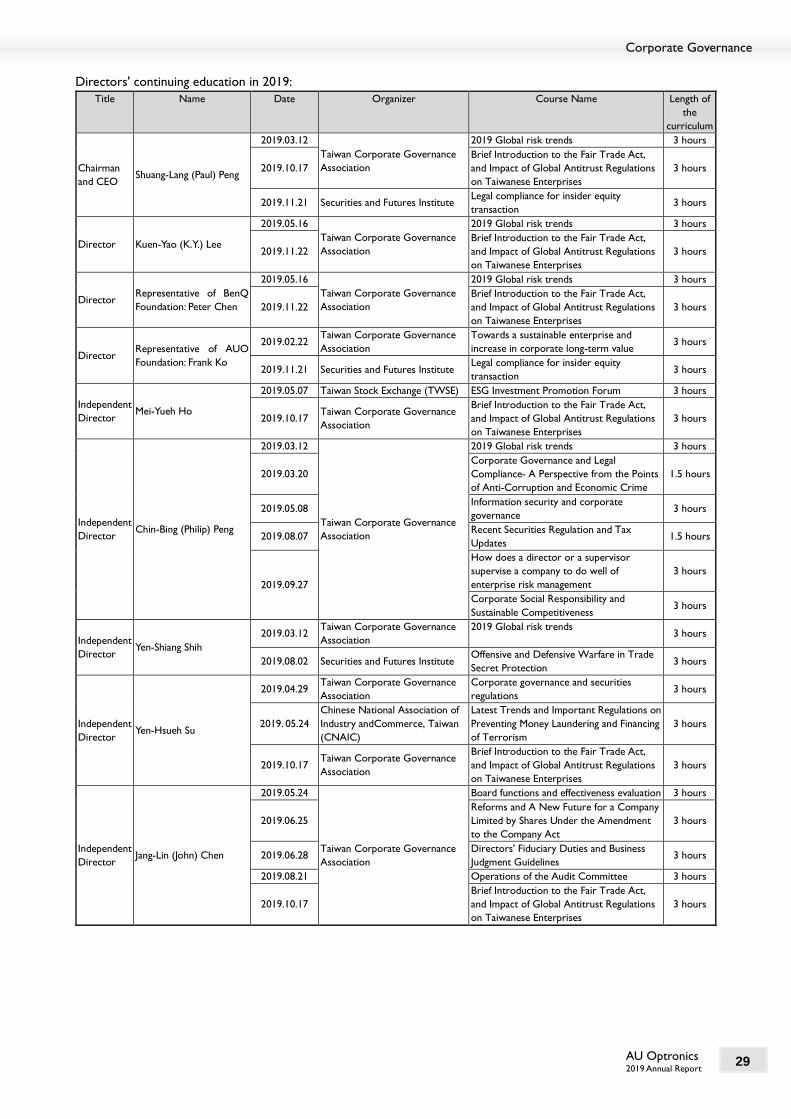
AU Optronics 2019 Annual Report
29
Corporate Governance
Directors' continuing education in 2019:
Title Name Date Organizer Course Name Length of
the
curriculum
Chairman
and CEO Shuang-Lang (Paul) Peng
2019.03.12
Taiwan Corporate Governance
Association
2019 Global risk trends 3 hours
2019.10.17
Brief Introduction to the Fair Trade Act,
and Impact of Global Antitrust Regulations
on Taiwanese Enterprises
3 hours
2019.11.21 Securities and Futures Institute Legal compliance for insider equity
transaction 3 hours
Director Kuen-Yao (K.Y.) Lee
2019.05.16
Taiwan Corporate Governance
Association
2019 Global risk trends 3 hours
2019.11.22
Brief Introduction to the Fair Trade Act,
and Impact of Global Antitrust Regulations
on Taiwanese Enterprises
3 hours
Director Representative of BenQ
Foundation: Peter Chen
2019.05.16
Taiwan Corporate Governance
Association
2019 Global risk trends 3 hours
2019.11.22
Brief Introduction to the Fair Trade Act,
and Impact of Global Antitrust Regulations
on Taiwanese Enterprises
3 hours
Director Representative of AUO
Foundation: Frank Ko
2019.02.22 Taiwan Corporate Governance
Association
Towards a sustainable enterprise and
increase in corporate long-term value 3 hours
2019.11.21 Securities and Futures Institute Legal compliance for insider equity
transaction 3 hours
Independent
Director Mei-Yueh Ho
2019.05.07 Taiwan Stock Exchange (TWSE) ESG Investment Promotion Forum 3 hours
2019.10.17 Taiwan Corporate Governance
Association
Brief Introduction to the Fair Trade Act,
and Impact of Global Antitrust Regulations
on Taiwanese Enterprises
3 hours
Independent
Director Chin-Bing (Philip) Peng
2019.03.12
Taiwan Corporate Governance
Association
2019 Global risk trends 3 hours
2019.03.20
Corporate Governance and Legal
Compliance- A Perspective from the Points
of Anti-Corruption and Economic Crime
1.5 hours
2019.05.08 Information security and corporate
governance 3 hours
2019.08.07 Recent Securities Regulation and Tax
Updates 1.5 hours
2019.09.27
How does a director or a supervisor
supervise a company to do well of
enterprise risk management
3 hours
Corporate Social Responsibility and
Sustainable Competitiveness 3 hours
Independent
Director Yen-Shiang Shih
2019.03.12 Taiwan Corporate Governance
Association
2019 Global risk trends 3 hours
2019.08.02 Securities and Futures Institute Offensive and Defensive Warfare in Trade
Secret Protection 3 hours
Independent
Director Yen-Hsueh Su
2019.04.29 Taiwan Corporate Governance
Association
Corporate governance and securities
regulations 3 hours
2019. 05.24
Chinese National Association of
Industry andCommerce, Taiwan
(CNAIC)
Latest Trends and Important Regulations on
Preventing Money Laundering and Financing
of Terrorism
3 hours
2019.10.17 Taiwan Corporate Governance
Association
Brief Introduction to the Fair Trade Act,
and Impact of Global Antitrust Regulations
on Taiwanese Enterprises
3 hours
Independent
Director Jang-Lin (John) Chen
2019.05.24
Taiwan Corporate Governance
Association
Board functions and effectiveness evaluation 3 hours
2019.06.25
Reforms and A New Future for a Company
Limited by Shares Under the Amendment
to the Company Act
3 hours
2019.06.28 Directors' Fiduciary Duties and Business
Judgment Guidelines 3 hours
2019.08.21 Operations of the Audit Committee 3 hours
2019.10.17
Brief Introduction to the Fair Trade Act,
and Impact of Global Antitrust Regulations
on Taiwanese Enterprises
3 hours

AU Optronics 2019 Annual Report
30
(IV) Composition, duties, and operations of the Company's Remuneration Committee:
1. Information on the members of the Remuneration Committee
December 31, 2019
Status
Qualifications
Name
Has more than 5 years of work experience
and the following professional qualifications Meet conditions of independence (Note 1)
Number of
other public
companies
where the
member
concurrently
serves as
member in
Remuneration
Committee
Note
An instructor
or higher
position in a
private or
public college
or university
in the field of
business, law,
finance,
accounting, or
the business
sector of the
Company
A judge,
prosecutor,
lawyer, CPA or
other specialist or
technical
professional who
are necessary for
the Company's
business and who
has been certified
by national
examinations and
licensed by the
competent
authorities
Work
experience
necessary for
business
administration,
legal affairs,
finance,
accounting, or
business
sector of the
Company
1 2 3 4 5 6 7 8 9 10
Independent
Director
Yen-Shiang
Shih ✓
✓ ✓ ✓ ✓ ✓ ✓ ✓ ✓ ✓ ✓ ✓ 2
Independent
Director
Yen-Hsueh
Su
✓ ✓ ✓ ✓ ✓ ✓ ✓ ✓ ✓ ✓ ✓ 2
Member Ding-Yuan
Yang
✓ ✓ ✓ ✓ ✓ ✓ ✓ ✓ ✓ ✓ ✓ 0
Note 1: Please add "✓" in the field under each criteria number if the member meets the criteria two years prior to being elected and during his/her
term of service.
(1) Not an employee of the Company or any of its affiliates.
(2) Not a director or supervisor of the Company or any of its affiliates. (Do not apply to independent directors appointed in
accordance with the Act or the laws and regulations of the local country by, and concurrently serving as such at, the Company and
its parent or subsidiary or a subsidiary of the same parent.)
(3) Not a natural-person shareholder who holds shares, together with those held by the person’s spouse, minor children, or held by
the person under others’ names, in an aggregate amount of 1% or more of the total number of issued shares of the Company or
is ranked in the top 10 in shareholdings.
(4) Not a spouse, relative within the second degree of kinship, or lineal relative within the third degree of kinship, of a managerial
officer under (1) or any of the persons under (2) and (3).
(5) Not a director, supervisor, or employee of a corporate shareholder that directly holds five percent or more of the total number
of issued shares of the company, or that ranks among the top five in shareholdings, or that designates its representative to serve
as a director or supervisor of the company under Article 27, paragraph 1 or 2 of the Company Act. (Do not apply to independent
directors appointed in accordance with the Act or the laws and regulations of the local country by, and concurrently serving as
such at, the Company and its parent or subsidiary or a subsidiary of the same parent.)
(6) Not a director, supervisor, or employee of other company if a majority of the company's director seats or voting shares and those
of that other company are controlled by the same person. (Do not apply to independent directors appointed in accordance with
the Act or the laws and regulations of the local country by, and concurrently serving as such at, the Company and its parent or
subsidiary or a subsidiary of the same parent.)
(7) Not a director, supervisor, or employee of other company or institution if the chairman, general manager, or person holding an
equivalent position of the company and a person in any of those positions at that other company or institution are the same
person or are spouses.
(8) Not a director, supervisor, officer, or shareholder holding five percent or more of the shares, of a specified company or institution
that has a financial or business relationship with the company. (Do not apply in cases where the specified company or institution
holds more than 20 percent but less than 50 percent of the Company’s issued shares and are the independent directors appointed
in accordance with the Act or the laws and regulations of the local country by, and concurrently serving as such at, the Company
and its parent or subsidiary or a subsidiary of the same parent.)
(9) Not a professional individual who, or an owner, partner, director, supervisor, or officer of a sole proprietorship, partnership, company,
or institution that, provides auditing services to the company or any affiliate of the company, or that provides commercial, legal,
financial, accounting or related services to the company or any affiliate of the company for which the provider in the past 2 years
has received cumulative compensation exceeding NT$500,000, or a spouse thereof; provided, this restriction does not apply to a
member of the remuneration committee, public tender offer review committee, or special committee for merger/consolidation
and acquisition, who exercises powers pursuant to the Act or to the Business Mergers and Acquisitions Act or related laws or
regulations.
(10) Not been involved in any of situations defined in Article 30 of the Company Act.

AU Optronics 2019 Annual Report
31
Corporate Governance
2. Responsibilities of the Remuneration Committee:
Establish a performance-based compensation system for the Company through an independent
standpoint, fulfill functional authority given by the Board of Directors, and regularly submit proposals or
recommendations on the compensation system to be discussed at Board meetings.
3. Operation of Remuneration Committee:
(1) The Company has a Remuneration Committee composed of three members.
(2) Term of service: June 14, 2019 to June 13, 2022.
The Company had convened three Remuneration Committee meetings in 2019 with the following
attendance:
Title Name Number of actual
attendance
Number of proxy
attendance
Actual attendance
rate (%)
Remarks (Note)
Convener Yen-Shiang Shih 1 0 100 Newly elected
Member Yen-Hsueh Su 1 0 100 Newly elected
Member Ding-Yuan Yang 3 0 100 Re-election
Convener Chin-Bing (Philip) Peng 2 0 100 Former
Member Vivien Huey-Juan Hsieh 2 0 100 Former
Other items that shall be disclosed:
1. If the Board of Directors chooses not to adopt or revise recommendations proposed by the Remuneration Committee, the date
of the Directors’ Meeting, session, contents of proposals, results of meeting resolutions, and the Company’s disposition of opinions
provided by the Remuneration Committee shall be described in detail (also, where the salary and compensation approved by the
Directors’ Meeting is better than that recommended by the Remuneration Committee, the differences and the reason for the
approval shall be described in detail): None.
2. For the decisions made by the Remuneration Committee, if there are members who hold objection or reservation to a resolution
and such objection or reservation is on record or raised through a written statement, the date, session, contents of proposals, all
members’ opinions, and ways in handling these opinions should be elaborated: None.
3. Discussion from the Remuneration Committee, resolutions, and ways the Company handled opinions from committee members:
Date of Meeting Agenda Resolutions and opinions of all members
January 28, 2019 Approved to amend the proportion to the appropriation of
employees’ and directors’ remuneration of 2018
Approved the proportion to the appropriation of employees’
and directors' remuneration of 2019
Approved the 2019 Manager Remuneration Policy
Approved as proposed and reported to
the Board of Directors for resolution.
March 22, 2019 Approved the proportion to the appropriation of employees’
and directors' remuneration of 2019
Approved the 2018 distributions to directors and senior
managerial officers.
July 24, 2019 Approved the distribution of 2018 remeneration for senior
managerial officers
February 5, 2020 Approved the 2019 compensation distributions to directors
and senior managerial officers.
Approved the 2020 Manager Renuneration Policy
Approved the proportion to the appropriation of employees’
and directors' remuneration
Approved the amendments to “compensation policy to the
directors and functional committee members”
4. Scope of responsibilities of the Remuneration Committee:
The Remuneration Committee shall exercise the care of a good administrator, faithfully fulfill the following function and power
and submit recommendations to the Board of Directors for discussion:
1. Stipulate and regularly review the policies, systems, standards, and structure of performance assessment, salaries, and
remunerations of directors and managerial officers.
2. Regularly review and stipulate the salaries and remunerations of directors and managerial officers.
Note: On June 14, 2019, the Board of Directors of the Company appointed Yen-Shiang Shih, Yen-Hsueh Su, and Ding-Yuan Yang
members of the fourth Remuneration Committe, with Yen-Shiang Shih as the convener.
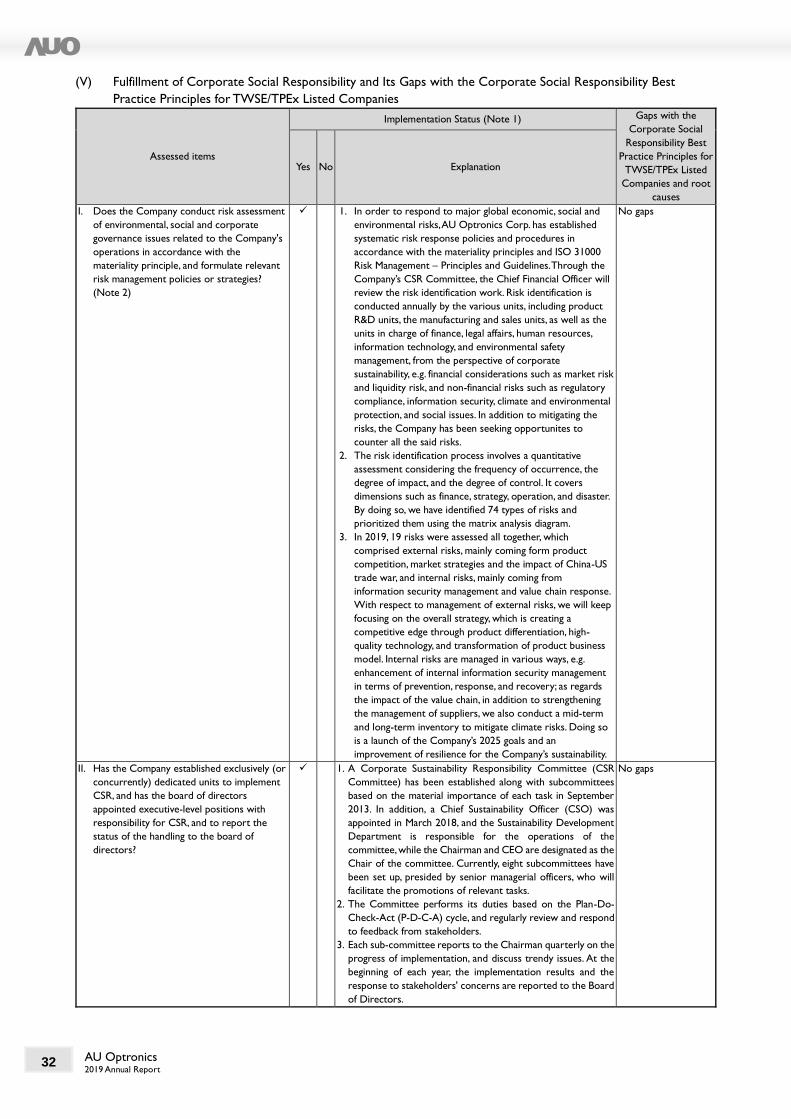
AU Optronics 2019 Annual Report
32
(V) Fulfillment of Corporate Social Responsibility and Its Gaps with the Corporate Social Responsibility Best
Practice Principles for TWSE/TPEx Listed Companies
Assessed items
Implementation Status (Note 1) Gaps with the
Corporate Social
Responsibility Best
Practice Principles for
TWSE/TPEx Listed
Companies and root
causes
Yes No Explanation
I. Does the Company conduct risk assessment
of environmental, social and corporate
governance issues related to the Company's
operations in accordance with the
materiality principle, and formulate relevant
risk management policies or strategies?
(Note 2)
✓ 1. In order to respond to major global economic, social and
environmental risks, AU Optronics Corp. has established
systematic risk response policies and procedures in
accordance with the materiality principles and ISO 31000
Risk Management – Principles and Guidelines. Through the
Company’s CSR Committee, the Chief Financial Officer will
review the risk identification work. Risk identification is
conducted annually by the various units, including product
R&D units, the manufacturing and sales units, as well as the
units in charge of finance, legal affairs, human resources,
information technology, and environmental safety
management, from the perspective of corporate
sustainability, e.g. financial considerations such as market risk
and liquidity risk, and non-financial risks such as regulatory
compliance, information security, climate and environmental
protection, and social issues. In addition to mitigating the
risks, the Company has been seeking opportunites to
counter all the said risks.
2. The risk identification process involves a quantitative
assessment considering the frequency of occurrence, the
degree of impact, and the degree of control. It covers
dimensions such as finance, strategy, operation, and disaster.
By doing so, we have identified 74 types of risks and
prioritized them using the matrix analysis diagram.
3. In 2019, 19 risks were assessed all together, which
comprised external risks, mainly coming form product
competition, market strategies and the impact of China-US
trade war, and internal risks, mainly coming from
information security management and value chain response.
With respect to management of external risks, we will keep
focusing on the overall strategy, which is creating a
competitive edge through product differentiation, high-
quality technology, and transformation of product business
model. Internal risks are managed in various ways, e.g.
enhancement of internal information security management
in terms of prevention, response, and recovery; as regards
the impact of the value chain, in addition to strengthening
the management of suppliers, we also conduct a mid-term
and long-term inventory to mitigate climate risks. Doing so
is a launch of the Company’s 2025 goals and an
improvement of resilience for the Company’s sustainability.
No gaps
II. Has the Company established exclusively (or
concurrently) dedicated units to implement
CSR, and has the board of directors
appointed executive-level positions with
responsibility for CSR, and to report the
status of the handling to the board of
directors?
✓ 1. A Corporate Sustainability Responsibility Committee (CSR
Committee) has been established along with subcommittees
based on the material importance of each task in September
2013. In addition, a Chief Sustainability Officer (CSO) was
appointed in March 2018, and the Sustainability Development
Department is responsible for the operations of the
committee, while the Chairman and CEO are designated as the
Chair of the committee. Currently, eight subcommittees have
been set up, presided by senior managerial officers, who will
facilitate the promotions of relevant tasks.
2. The Committee performs its duties based on the Plan-Do-
Check-Act (P-D-C-A) cycle, and regularly review and respond
to feedback from stakeholders.
3. Each sub-committee reports to the Chairman quarterly on the
progress of implementation, and discuss trendy issues. At the
beginning of each year, the implementation results and the
response to stakeholders' concerns are reported to the Board
of Directors.
No gaps

AU Optronics 2019 Annual Report
33
Corporate Governance
Assessed items
Implementation Status (Note 1) Gaps with the
Corporate Social
Responsibility Best
Practice Principles for
TWSE/TPEx Listed
Companies and root
causes
Yes No Explanation
III. Environmental
Issues
(I) Has the Company
referred to the nature of
its industry to establish a
suitable environmental
management system
(EMS)?
✓ 1. By proceeding the product carbon footprint inventory, the
Company calculates the greenhouse gas emissions during
each stage of a product's life cycle, which includes raw
materials, production, transportation, sales, usage, disposal,
and to recycling. The Company has also developed an online
carbon footprint management system, which is conducive to
innovative design of reducing materials used and its carbon
footprint.
2. The Company has established Environmental Safety, Health
and Energy Policies, which encompass six aspects:
commitment to legal compliance, reducing environmental
burden, promoting safety and health, strengthening
communications mechanism, fostering the culture of
sustainability, and enhancing management performance.
3. ISO 14001 Environmental Management System has been
implemented at all production facilities of the Company.
No gaps
(II) Is the Company
committed to improving
usage efficiency of
various resources and
utilizing renewable
resources with reduced
environmental impact?
✓ 1. The Company strives to design sustainable packaging that is
easy to access, light, eco-friendly, easy to recycle, and high
impact resistance by using recycled materials. Doing so
reduces resources used for packaging and decreases
greenhouse gas emissions. Moreover, we also undertake
supplier-packaging recycling plan. The Company has already
won numerous awards from both Taiwan and overseas
institutions because of the design concept, which blends
innovation with environmental friendliness.
2. ISO 50001 Energy Management System has been fully
implemented at all production facilities of the Company.
No gaps
(III) Does the Company
assess the potential risks
and opportunities
brought by climate
changes on the
Company, both for the
time being and for the
future, and take
measures to respond to
climate issues?
✓ 1. The Company has set its goals for 2025 pertaining to the
Sustainable Development Goals (SDGs). Among them, for
SDG13 Climate Action, we have proposed the goal of “To
Improve Our Resilience to Climate Changes, and to
Relentlessly Mitigate Financial Impacts Brought By Climate
Changes”. Accordingly, we have established management
procedures for continuous improvement, which are regularly
reported to the CSR Committee.
2. The CSR Committee also established a Carbon-Energy
Working Group (WG), which includes a Risk Adaptation
Team. Based on the framework of Task Force on Climate-
related Financial Disclosures (TCFD), we have taken stock of
risks and opportunities derived from climate changes,
including management of a broken supply chain due to
physical risks, risks of market strategies arising from
transformation, and mastery of regulatory trends. Through
the identification work done by each responsible unit, we are
able to foresee potential losses, and thus give response
accordingly.
3. The Company holds a TCFD Conference annually, during
which we review the previous year's climate events and the
effectiveness of our countermeasures, re-examine the climate
scenario, and re-assess the financial impacts, so as to actively
face the constantly changing risks.
No gaps

AU Optronics 2019 Annual Report
34
Assessed items
Implementation Status (Note 1) Gaps with the
Corporate Social
Responsibility Best
Practice Principles for
TWSE/TPEx Listed
Companies and root
causes
Yes No Explanation
(IV) Does the Company
count the amount of
greenhouse gas
emissions, water
consumption and total
weight of waste for the
past two years? Are any
policies pertaining to
energy conservation,
carbon reduction,
greenhouse gas
reduction, reduction of
water consumption, or
other waste
management policies
formulated accordingly?
✓ 1. Each year, the Company discloses its annual achievement
regarding greenhouse gas (GHG) emissions due to climate
change, water resource management and waste reduction, as
well as the implementation status of environmental goals, and
related data in its CSR Report, of which the Chapter 4
“Environment Sustainability” can be referred to for further
information.
2. In order to implement relevant sustainability actions, a CSR
Committee was set up in 2013. In addition, we have also
formulated our Corporate Social Responsibility Best Practice
Principles, as well as other sustainability policies (available for
download on the official website), including policies to mitigate
climate change, reduce environmental load, and improve the
efficiency of energy and resource use.
3. In order to integrate internationally, in 2018, the Company
focused on 9 trendy SDGs and set our CSR goals for 2025,
including: three pillars, namely EPS (Environment, People &
Society), and ten major goals, e.g. environmental sustainability,
inclusive growth and flexibility and innovation; among them, in
the environmental sustainability part, we will continue to work
towards the mid-term goal of [ Have the value chain jointly
cope with the water crisis and conserve use of tap water;
Reduce carbon emissions at each stage of the product life cycle;
And lead the development of a circular value chain to expand
economic benefits].
No gaps
IV. Society (I) Has the Company set up
management policy and
procedures according to
related laws and
regulations and the
International Bill of
Human Rights?
✓ To ensure that employee rights are protected and to fulfill social
responsibility, the Company has drawn up management systems
in 2006 in reference to international standards such as the
International Labor Organization (ILO), the Global Sullivan
Principles, the UN Guiding Principles on Business and Human
Rights, and Code of Conduct of the Responsible Business
Alliance.
In 2019, the Company conducted inventory on human rights
risks of stakeholders, listed vulnerable groups and issues, and
established mitigation measures and supervision mechanisms.
Mitigations:
The Company strives to protect employees' human rights in the
following manner: legal compliance, freedom of employment,
humane treatment, anti-prejudice and anti-sexual harassment,
protection of employees' rights to express their opinions,
establishing diversified and effective communication mechanisms,
having a sound compensation and benefits system, and training
for development opportunities and course options. We also
fulfill human rights protection through the following means:
⚫ The Company evaluates risks of human rights, policy, and
impacts in accordance with the Company's human rights risk
evaluation form, and undertake actions for necessary
improvements accordingly.
⚫ Advocate for anti-violence measures at the workplace,
reinforce the awareness of human rights and ensure that
employees fully understand the human rights policy.
⚫ Provide and maintain fluent grievance channels, undertake
timely investigations into human rights reporting incidents
and actively adopt improvement actions.
⚫ Supervise global business partners to collectively protect
human rights through a supplier audit.
⚫ For new employees, we provide courses of corporate social
responsibility, as well as publicity of human rights policy, so
that colleagues understand their rights, and the Company’s
policies and practices of corporate social responsibility. A
total of 424 people completed training in 2019, with a signing
rate of 100%
No gaps

AU Optronics 2019 Annual Report
35
Corporate Governance
Assessed items
Implementation Status (Note 1) Gaps with the
Corporate Social
Responsibility Best
Practice Principles for
TWSE/TPEx Listed
Companies and root
causes
Yes No Explanation
Supervision:
The Company conducts annual internal audits of all fabs each
year. 11 times of audit were conducted in 2019, the content of
which includes labor, health and safety, ethics norms, and
management systems, etc., so as to ensure that all employees
fully understand the importance of human rights and that the
Company's operations comply with local laws and regulations, as
well as international standards.
(II) Does the Company
formulate and
implement reasonable
employee benefits
measures (including
compensation, days-off,
and other benefits, etc.),
and appropriately link
the operating
performance or results
to employee
compensation?
✓ 1. Article 15 of the Company's Articles of Association has
stipulated that employee compensations shall be no less than
5% of the year's profit.
2. Based on the Company's Procedures for Distributing
Bonuses, and in reference to performance from each business
department and individual performance, reasonable
compensation will be given to employees upon approval from
their respective executives.
3. The Company regularly participates in international market
salary and compensation surveys, adjusting compensation
ranges in order to provide competitive compensation. In
addition, compensation adjustments were undertaken in 2019
in consideration of the Company’s performance, the
consumer price index (CPI), the economic growth rate, and
individual performance, among other factors, and the average
adjustment rate ranged at 1%-3%.
4. For the Company's employee benefits measures and
implementation status, please refer to the “Labor Relations”
in Chapter 5 “Operational Highlights” of this Annual Report.
(pages 67-70)
No gaps
(III) Has the Company
provided employees with
a safe and healthy work
environment as well as
conducted regular
classes on health and
safety?
✓ 1. Besides abiding by relevant legal regulations in Taiwan, to
provide a safe work environment for employees, all
production facilities of the Company have passed the
internationally-accredited OHSAS 18001 Occupational
Health and Safety Management System certification.
2. The Company has stipulated Chemical Substance
Management Principles and continues to update its content
based on domestic and overseas legal regulations,
environmental assessments, and customer requests, as well as
notify suppliers to comply with relevant regulations to ensure
that chemicals provided by suppliers do not contain
prohibited substances.
3. The Company has undertaken labor work environment
inspection and health checkup pursuant to legal regulations
and has improved the work environment based on results of
inspection, provided necessary protection, and adjusted the
work environment accordingly.
4. In order to effectively raise the awareness of all employees
about the environment, safety and health, the Company
regularly organizes education and trainings in this respect.
No gaps
(IV) Has the Company
established effective
career and competence
development and
training plans?
✓ The Company has established AUO College based on each
training group to foster the career planning of employees.
Training programs have been established (e.g., R&D functions fall
under the College of Engineering, manufacturing functions fall
under the College of Engineering, and management functions fall
under the College of Management and more) to systematically
and gradually help employees develop their career paths.
In addition, the Company has also set up Training Executive
Committee to foster the professional skills of employees.
Internal lecturers will hold classes to effectively pass on their
professional knowledge and skill-sets.
No gaps

AU Optronics 2019 Annual Report
36
Assessed items
Implementation Status (Note 1) Gaps with the
Corporate Social
Responsibility Best
Practice Principles for
TWSE/TPEx Listed
Companies and root
causes
Yes No Explanation
(V) Has the Company
complied with relevant
laws and regulations and
international standards
for its products and
services respecting
customer health and
safety, customer privacy,
marketing and labeling,
and formulated relevant
consumer protection
policies and grievance
procedures?
✓ 1. The Company had established an inter-departmental Green
Product Team to make necessary responses since the EU had
announced the Restriction of the use of Hazardous Substance
(RoHS) in 2005. In addition, to respond to the European
Union's Registration, Evaluation, and Authorization of
Chemical (REACH) regulation, the Company maintains the
status of products that contain Substances of Very High
Concern (SVHCs) to ensure compliance with REACH. We
also regularly collect information on major environmental
laws around the world to stay on top of the latest
international regulatory trends.
2. The Company's solar products have received International
Electrotechnical Commission (IEC) and Electrical Testing
Laboratories (ETL) Listed certification, which are indicated
on the transportation labels. Since monitor/display products
are not terminal products, if product carbon footprint labels
are requested by AUO's clients, the Company will provide
relevant data per clients’ requests.
3. The Company pays attention to customers' service
satisfaction and its corporate image, brand value, and
recognition for service quality. Therefore, the Company
strives to provide comprehensive product solutions and a
wide range of innovative products. To achieve the most
efficient services, designated departments will be in charge
during each phase of the product, from product development,
design, production, transportation, to maintenance.
4. The Company regularly meets and communicates with
customers. A customer satisfaction survey is also undertaken
on an annual basis to identify the six major aspects that will
come into contact with the customers. Designated
departments have been assigned to each aspect to establish
indicators for satisfaction and objectives to supervise
customer satisfaction. If satisfaction data analysis shows that
objective has not been met, the designated department will
be responsible for carrying out improvement measures, and
review will be undertaken by senior executives during
management review meetings.
5. The Company has also set up an online service platform to
provide product warranty services directly for our
customers. Customers can apply for service on the platform
based on the warranty agreement.
No gaps

AU Optronics 2019 Annual Report
37
Corporate Governance
Assessed items
Implementation Status (Note 1) Gaps with the
Corporate Social
Responsibility Best
Practice Principles for
TWSE/TPEx Listed
Companies and root
causes
Yes No Explanation
(VI) Does the Company
formulate a supplier
management policy that
requires suppliers to
follow relevant
regulations on
environmental
protection, occupational
safety and health, or
labor rights, and how
well are those policies
implemented?
✓ 1. The Company has an "AUO Supplier/Subcontractor Code of
Conduct" and requires all suppliers and subcontractors to
sign the "Statement of Compliance with AUO Supplier/
Subcontractor Code of Conduct", which covers occupational
safety, industrial hygiene,, environmental protection, and labor
rights, so as to ensure that suppliers and subcontractors
comply with the Responsible Business Alliance(RBA) Code of
Conduct or local laws.
2. The RBA Audit Team consists of the procurement, quality
assurance, environmental safety and human resources
management. Audit methods include on-site audits, document
reviews, and employee interviews. Due to the large number
and variety of the Company's subcontractors and raw
material suppliers, the RBA's annual audit mainly focuses on
the three categories: the top 70% manufacturers of the
Company's procurement, the high CSR risk rating in the
supply chain, and the key consulting suppliers.
3. The Company conducts social and environmental
responsibility audits for all first-tier suppliers and
subcontractors to ensure that they comply with relevant
local laws and regulations. The Company also arranges for
suppliers to participate in a series of social, environmental,
and energy saving courses. Once a supplier or a
subcontractor violates Corporate Social Responsibility policy,
it would negatively impact the Company's business
relationship with AUO.
No gaps
V. Does the Company refer to the guidelines
for the preparation of internationally
accepted reports in preparing its corporate
social responsibility reports and other
reports that disclose the Company's non-
financial information? Did the aforesaid
report obtain the assurance or accreditation
of an impartial third party?
✓ 1. The Company's first CSR Report was published in 2006.
Since 2007, the Company has compiled the CSR Report in
compliance with GRI-G4. The reports have been verified by
independent third-party institutions. Besides following the
existing standards, we have also autonomously adopted the
accounting system ISAE 3000 for assurance for our 2016
CSR Report and the reports thereafter, which not only
strengthens the transparency of reports but also enhances
the precision of our internal work.
2. Since the Company officially responded to the Dow Jones
Sustainability Index (DJSI) questionnaire in 2009, it has been
included in the DJSI World for 10 consecutive years.
No gaps
VI. Where the Company has stipulated its own Best Practices on CSR according to the Corporate Social Responsibility Best Practice Principles for
TWSE/TPEx Listed Companies, please describe any gaps between the prescribed best practices and actual activities taken by the Company:
The Company has established a set of "Corporate Social Responsibility Best Practice Principles," which includes regulations on environmental
protection, community participation, social contribution, community service, social welfare, customer's rights, human rights, safety and health,
and these Principles can be downloaded from the Company website: (https://www.auo.com/zh-TW/Policy_and_Documents/index). As for the
Company's CSR strategies and status of implementation, please see "Chapter 3 Corporate Governance" of this Annual Report, which provides
information on "Fulfillment of Social Responsibility" (Pages 32-39).
VII. Other important information for better understanding of corporate social responsibilities (such as the Company's systems and measures and
the implementation of environmental protection, community engagement, social contribution, social service, social charity, customer interest,
human rights, safety and health, and other CSR activities):
Adhering to the spirit that corporate sustainability needs to take into account economic, environmental and social aspects, the Company has
established the AUO Foundation to promote various sustainable actions such as environmental protection and social participation. AUO
Foundation has three business pillars, namely "Popular Science Education on Environmental Protection, Green Sustainability Life, Care for
Nature and Culture”, and four volunteer systems respecting Love, Green, Education, and Culture, so as to maintain the natural ecology, improve
the quality of living environment, promote environmental education, and care for public welfare. Doing so also encourages employees to
volunteer, and realize themselves, while working for a better society for Taiwan. Below is a summary of the major contents of each theme:
[Popular Science Education on Environmental Protection]
Environmental Education in Taichung
Taichung fab has been promoting environmental education for the fifth year. This year, the fab secured an extension of the certification of an
environmental education facility granted by the Environmental Protection Administration. The fab developed two sets of courses, namely "Energy"
and "Culture", based on the characteristics of the field. The courses are open to elementary school groups if appointment is made in advance. The
fab also subsidized rural schools to come to experience the courses. This year's Energy course introduces VR so that students can better
understand the energy-saving facilities of green plants. In addition, in order to expand its influence, the fab actively cooperates with relevant units
AU Optronics 2019 Annual Report
38
Assessed items
Implementation Status (Note 1) Gaps with the
Corporate Social
Responsibility Best
Practice Principles for
TWSE/TPEx Listed
Companies and root
causes
Yes No Explanation
such as the Environmental Training Institute of the Environmental Protection Administration, Environmental Protection Bureau of Taichung City
Government, and other environmental education facilities to share AU Optronics Corp.’s environmental education courses and concepts, either in
the form of activity experience, professional visits, and paper contribution in a seminar; internally, through large-scale company events (such as
Green Party and Family Day), the environmental literacy of employees and their dependents is enhanced in an easy-to-understand manner for
them to put into action. Since 2015, we have jointly organized summer camps with Taichung Metropolitan Park each year, in which the fab staff
guide students to understand the water use of Datu Mountain, and lead them deep into the community to visit the mysterious ancient well. In
addition to the theme of "Water Resources", in 2019, the fab for the first time cooperated with the FORMOSAN ASSOCIATION FOR G.M.T.
CULTURE to hold summer camps, with the theme of "culture", in which the fab guided students to understand the development history of Datu
Mountain dating back to ancient times. Students were led to Xi Dadun Kiln and Gomach to understand the history and culture, as well as the
relationship between human life and environmental changes. The fab has held 4 events on the two themes, participated by 97 people and 16
volunteers.
Environmental Education in Longtan
GreenArk, the first LCD panel water resource park throughout Taiwan was built to convey the skills and knowledge of AUO's innovative water-
recycling engineering technology. The Company has started course strcuturing since 2016. Experts and scholars were invited to undertake on-site
effectiveness review and coaching, on top of inviting schools in nearby communities to host trial courses. We have received the certification for a
water resource teaching venue in July 2018, making us the 12th environmental educational facility in Taoyuan City. GreenArk at Longtan Fab has
designed environmental educational courses that are easy to understand for 5th and 6th graders. The purpose of this is to instill the awareness for
the importance of sustainable water resources in younger students. 42 environmental courses have been held since 2019, including 18 outdoor
courses (including 2 courses in remote school) and 22 courses for adults, two summer camps, and one environmental protection promotion
course, with a total of 919 participants and 92 volunteers. So far, participants have reached a total of 1,174 people.
To reinforce teaching experience and to advocate the concept of sustainable consumption of water to our employees, summer camp activities
have been held each summer starting from 2017, and students from local elementary schools were invited to take part. For three consecutive
years, we have co-organized summer camps with the Chungli Laojie River Education Center and the Shihmen Reservoir Education Center. So far,
six summer camps have been held, participated by employees and their dependents and local elementary schools, totaling 131 participants.
DADA's Magic Science Camp
To broaden the strength of optronics and popular science education, by drawing upon our competitive edge in our core business and collaborating
with the National Museum of Natural Science and Yuan T. Lee Foundation Science Education for All, we have organized " DADA's Magic Science
Camp," an exciting one-day camp for recipients of the Honest-Intelligent Scholarship in junior high schools since 2016. The purpose of the camp is
to help high-performing yet impoverished students to attain access to diversified education opportunities and inspire them to optronics and
popular science education. 10 camps were held in 2019, providing free participation for 649 winners of junior high school students. Courses
covered popular science topics including optics, electricity and solar power.
Dada's Magic Land
AUO has been committed to the promotion of popular science education for a long time. Since 2009, it has cooperated with the National
Museum of Natural Science to develop “Dada’s Magic Land”, a learning base for photoelectric principles, in which Interactive explanation of optical
principles, combined with living examples, are provided to let visitors and students understand the application of photoelectricity. In 2019, a total
of 1,005 people participated in the guided tour, and 233,095 people visited the museum. In addition to the normal guided tour, AUO also instills
popular science education in every participant at the Company’s large-scale events, such as AUO Green Party, 2019 Family Day, among others.
Volunteer services of guided tours in 2019 were given by 182 people, with accumulated service hours reaching 1,513 hours.
[Green Sustainability Life]
Green Party
In response to Arbor Day, AUO has been organizing the Green Party Festival for ten consecutive years. To date, over 1 million trees have been
planted. In 2019, we have for the first time invited local suppliers in Taichung to participate in this event. Over 1,500 AUO employees and their
family members joined us in this year's Arbor Day event, planting about 5,000 seedlings around AUO Houli Fab in cold rainy dawn. Through this
concrete action, they have demonstrated their determination to build a sustainable planet. In the event, entertaining activities held at each booth
for parents and their children have deepened the philosophy of environmental education, thereby fulfilling our philosophy and commitment to
environmental protection.
Energy Saving and Plastic Reduction
In order to convey the concept of environmental sustainability of AUO, on April 22nd, the Earth Day, we have launched a non-plastic operation in
all fabs. In addition to sharing environmental protection ideas online and participating in the 21 Days to a Green Life, there are were concrete
actions of reduction of plastic for dining use. Environmental protection-promoting manufacturers were invited to set up booths in the fab area to
publicize the awareness of environmental protection for colleagues. This event has been participated by 2,979 people. In addition, from June to
September, AUO has held summer energy-saving activities. In addition to temperature control in various fabs, and “cool biz”, a clothing promotion
for summer days, we have awoken colleagues 'energy-saving awareness through various soft activities. In addition to designing games to establish
colleagues' energy-saving knowledge, we also held a power-saving contest in each fab, publicizing residential power-saving activities and inviting
colleagues to save power with their families. This year, nearly 1,200 people responded, saving 33,000 Kwh of electricity.
Farmland Adoption Program Fundraiser
In response to BenQ Foundation's "Farmland Adoption Program Fundraiser" project, we have encouraged AUO employees to adopt
environmentally-friendly paddy fields throughout Taiwan since 2008. As of 2019, over 10 hectares of farm have been adopted at Nanpu in
Hsinchu, and Xizhou in Changhua. In 2019, a total of 602 colleagues were called to participate, and donated more than NT$ 670,000.
Supporting Taiwanese Local Produce
Taiwan's agricultural products have always been on the AUO agenda. Starting from 2008, more than 20 agricultural products were directly
purchased in an attempt to help farmers. In 2019, we were the first in Taiwan to cooperate with Buy Nearby, a social enterprise. Through social
enterprises, we have cultivated local small farmers and helped farmers in remote areas and tribes, thereby bringing good quality agricultural

AU Optronics 2019 Annual Report
39
Corporate Governance
Assessed items
Implementation Status (Note 1) Gaps with the
Corporate Social
Responsibility Best
Practice Principles for
TWSE/TPEx Listed
Companies and root
causes
Yes No Explanation
products directly to the market. In 2019, Taiwan Uno Fresh picked local seasonal produce including Xinxing pears from Houli, Taichung,pomelos
from Douliu, Yunlin, Ruixue pears from Houli, Taichung, and wax apples from Pingtung, so that the farming philosophies from small farms could be
seen. The produce was welcomed by AUO employees, and more than NT$1.3 million worth of produce was sold.
[Care for Nature and Culture]
Christmas Wish Program
The Christmas Wish Program campaign at AUO has been an ongoing effort since 2002. For the past 18 years, AUO has helped over 102,000
disadvantaged students from remote regions and charity organizations to raise Christmas presents and scholarships. Approximately NT$11.6
million in scholarship funds have been raised. The dream project in 2019 is titled "Children's Wishing Stars, Liting the Dreams and Hearts”.
Colleagues recommend those who need help around them, including 16 recipients, namely Yude Children's Home, Holy Family for Special
Education, Baby Development Center, Jinshan Elementary School, Hsin Kwang Elementary School, Hao-Shen Children’s Home, Good Shepherd
Social Welfare Foundation (Dexin / Lamb's Home), Atayal Garden, Mountain Climbing Service Club of National Chiao Tung University, Nantou
Tonglin Elementary School, Nantou Guangxing Elementary School, Seed Family and Kid's Book House in Taitung. For the first time, we have
cooperated with "Teach For Taiwan (TFT)", a plan to cultivate long-term front-line teachers to teach in remote areas, so that we could bring
stable and high-quality education to the rural schools, and help children regain the joy of learning. In order to make the recipient children feel the
enthusiasm of AUO, on the eve of Christmas, more than ten senior executives and more than 110 employees and their family members were
invited to work as volunteers, and sent gifts to social welfare institutions and local schools in person to convey love and care. The mileage
accumulated over the 18 years is a whopping 7,000 kilometers, delivering love across thousands of miles to realize children's Christmas dream.
Honest-Intelligent Scholarship
To implement our vision of giving back to society in practice, the Honest-Intelligence Scholarship was established by AUO in 2006. Over the past
14 years, over NT$129 million in scholarships have been provided, assisting more than 32,500 impoverished students, or students with tragic
losses, to continue their education. This is a donation project where AUO employees voluntarily contributed one to several days' worth of their
salaries. Since the target of the donation was very clear, the proceeding was handled with transparency with a very convenient application
procedure. It had achieved widespread popularity and positive recognition among AUO staff, providing students with much-needed assistance.
Approximately 2,000 kindhearted employees had participated in the Honest-Integrity Scholarship fundraiser in 2019, raising nearly NT$8.35 million
of scholarship funds. Besides sponsoring 2,035 elementary and junior high school students from disadvantaged families, 649 junior high school
students were also invited to participate in the DADA Science Camp, helping them to set solid foundations for their future scientific learning and
knowledge.
Social Welfare Clubs and Volunteering Activities
Seven social welfare clubs have been gradually established at AUO's Taiwan facilities since 2013, in which AUO employees regularly undertake
community service at nearby welfare institutions. The subjects of these efforts have included children being sheltered by the Department of Social
Welfare, physically and mentally challenged children and children who have dropped out of school. AUO employees have assisted in providing
companionship, cleaning their environment, and/or course counseling. In addition, the annual Christmas Wish Program and scholarship fundraisers
have also helped disadvantaged children placed in social institutions to continue their schooling. In 2019, more than 7,600 employees volunteered,
rendering services for more than 22,000 hours.
Cultural achievements of Sidadun Kiln
Since 2010, the AUO Taichung fab and the Focus Junior High School have jointly planned the "Fuke Walk-through" event, inviting fresh junior high
school students to learn about the environment, culture and industry of their hometown by walking through. The event has been held for ten
years, with a total of 5,937 fresh junior high school students participating. The content of the event is based on the theme of "cultural
preservation, renewable energy and green plants". Through AUO's professional guided tours and interactive quizzes, students will be guided to
understand the local environment and culture. Doing so also communicates the Company's philosophy and care for environmental education. It is
expected that in 2020, the Sidadun Kiln Cultural Museum will be rebuilt by employing the 3R environment-friendly construction method employed
by AUO Micro Gallery, so as to pass on local cultures.
Note 1. If “Yes” is checked in the operating status column, please explain the important policies, strategies, measures and implementation
situations; if “No” is checked in the operating status column, please explain the reasons, as well as give relevant policies, strategies and
measures to counter the situation.
Note 2. The materiality principle refers to those environmental, social and corporate governance issues that have significant influence on the
Company's investors and other interested parties.

AU Optronics 2019 Annual Report
40
(VI) Implementation of Ethical Corporate Management and the Gaps With the Ethical Corporate Management Best
Practice Principles for TWSE/TPEx Listed Companies, and the Causes Thereof
Assessed items
Implementation Status (Note 1) Gaps with the
Ethical Corporate
Management Best
Practice Principles
for TWSE/TPEx
Listed Companies,
and the cause of
the said gaps
Yes No Explanation
I. Formulating
policies and plans
for ethical
corporate
management
(I) Does the Company formulate
its ethical corporate
management policies that have
been approved by the Board
of Directors? Has the
Company declared its ethical
corporate management
policies and procedures in its
guidelines and external
documents, and does the
Board of Directors and
management work proactively
to implement their
commitment to those
management policies?
✓ The "Code of Ethical Management" disclosed on the
Company's website is approved by the Board of Directors.
In addition, the Company has also formulated a manual
regarding ethical corporate management. Moreover, Board
members and all employees must sign the "Ethic
Declaration." In addition, every year, the effectiveness and
outcomes of the Code of Ethical Management are
reported regularly to the Board of Directors, and publicly
disclosed in the annual report and CSR report.
No gaps
(II) Does the Company establish
an assessment mechanism for
unethical risks, according to
which it analyzes and assesses
operating activities with high
potential unethical risks? Does
the mechanism include any
precautionary measures
against all the conducts as
stated in Article 7, Paragraph 2
of the Ethical Corporate
Management Best Practice
Principles for TWSE/TPEx
Listed Companies?
✓ The Company has developed an assessment mechanism
for unethical risks, and set out the following precautionary
measures for the following unethical conducts in the
corporate ethic manual:
⚫ Bribing or receiving bribes, and taking or receiving
inappropriate benefits.
⚫ Providing illegal political contributions
⚫ Improper charitable donation or sponsorship
⚫ Unreasonable Presents, Hospitality or Other Improper
Benefits
⚫ Violation against Anti-trust Law
⚫ Infringement on Intellectual Property
Moreover, preventative measures for infringement on
trade secrets have also been proposed in the Management
Principles for Information Security.
The Company regularly analyzes and evaluates business
activities with a high unethical risk. We also conduct job
inventory and arranges mandatory training courses for
executives who are defined as having an honest duty, so
that they comply with regulations when conducting their
businesses.
For those who breach the Corporate Ethical Policy, the
following punitive actions will be taken based on the
severity of the breach, including oral or written
reprimands and warnings, salary deduction or cancellation
of bonuses or even termination of employment. In case of
unlawful activity, legal actions will also be taken. In addition
to the above-mentioned actions, if the breach of the
Corporate Ethical Policy is done to obtain inappropriate
benefits for the perpetrator, the benefits obtained shall be
returned to the victim or the Company.
No gaps
(III) Has the Company established
policies to prevent unethical
conduct, with clear statements
regarding relevant procedures,
conduct guidelines,
punishments for violation, and
rules for appeal, and does the
Company implement them
accordingly, and regularly
review and correct such
measures?
✓ No gaps
II. Implementing
ethical operation
(I) Does the Company evaluate
business partners’ ethical
records and include ethics-
related clauses in the business
contracts signed with the
counterparties?
✓ Only after requiring all contracted vendors to sign code of
ethical conduct can the Company file the information of
any trading counterparty or vendor and transaction be
undertaken.
No gaps

AU Optronics 2019 Annual Report
41
Corporate Governance
Assessed items
Implementation Status (Note 1) Gaps with the
Ethical Corporate
Management Best
Practice Principles
for TWSE/TPEx
Listed Companies,
and the cause of
the said gaps
Yes No Explanation
(II) Has the Company established
an exclusively (or
concurrently) dedicated unit
under the Board to implement
ethical corporate management,
and report to the Board on a
regular basis (at least annually)
about the ethical corporate
management policies,
precautionary measures
against unethical conducts, as
well as the implementation and
supervision thereof?
✓ In order to improve ethical corporate management, the
Sustainability Development Head Office is responsible for
the formulation and supervision of the implementation of
the ethical corporate management plan, for reporting the
implementation status thereof to the Board of Directors
at least once a year, and for conducting inventory of
honest job positions in order to provide trainings and
declare conflict of interests.
At the annual supplier conference, the Company
announces commitments to ethical transactions. In
addition, to confirm that key suppliers meet the
regulations, we have employed the external audit system
of the Responsible Business Alliance (RBA).
In 2019, we communicated the ethical transaction
commitment to suppliers, had 421 suppliers sign the Code
of Conduct, and audited the implementation of ethical
corporate management of 39 suppliers.
The signing rate of new employees for ethics training
courses, as well as Declaration of Ethics, is 100%.
No gaps
(III) Has the Company established
policies preventing conflict of
interest, provided proper
channels of appeal, and
enforced these policies and
opened channels accordingly?
✓ To implement the regulations on conflict of interest in the
Corporate Ethics Handbook and to prevent Company
losses from conflict of interest from its employees, "AUO
Reporting Procedures for Conflict of Interest" had been
established, allowing employees to report through the
system. Alternatively, employees in specific roles (that
require honesty) are required to file their status on the
reporting system on an annual basis.
No gaps
(IV) Has the Company established
effective systems for both
accounting and internal
control to implement ethical
corporate management? Has
the internal auditors
formulated related plans and
checked the compliance of
anti-unethical conduct based
on the unethical risks
assessed? Or does the
Company commission a CPA
for the audit task?
✓ "Internal control system" has been established at AUO, in
which internal audit personnel will regularly evaluate risks
and propose audit plans and undertake audits accordingly.
Special project-based audits will also be undertaken when
necessary. Results of such audits are regularly reported to
the Audit Committee and the Board of Directors,
facilitating the management level to understand the
operations of the Company's internal control to achieve
management purposes.
No gaps
(V) Does the Company regularly
hold internal and external
training related to ethical
corporate management?
✓ Besides the integrity promotion courses for the new
recruits, the Company has also launched 'Legal
Compliance Course' since 2015, in which indirect
employees are required to undertake legal compliance
online courses and sit through quizzes every two years, as
well as signing a declaration for legal compliance upon
completion of the course.
No gaps
III. Operation of
whistle-blowing
mechanisms in
the Company
(I) Has the Company established
concrete whistle-blowing and
rewarding systems and
accessible whistle-blowing
channels? Does the Company
assign a suitable and dedicated
individual for the case being
exposed by the whistle-
blower?
✓ Reporting can be made through any of the following
channels when a breach of ethical or integral conduct is
found during any of the Company's business activities:
⚫ Internal: Direct executives, President Mailbox, Audit
Committee Mailbox
⚫ External: Reporting System on Breach of Code of
Ethical Conduct (http://integrity.ab1.auo.com)
After an accusation case has been filed, investigation will
ensue by the Audit Department or a special committee
formed based on the Management Methods of Material
Disciplinary Investigation Committee.
No gaps

AU Optronics 2019 Annual Report
42
Assessed items
Implementation Status (Note 1) Gaps with the
Ethical Corporate
Management Best
Practice Principles
for TWSE/TPEx
Listed Companies,
and the cause of
the said gaps
Yes No Explanation
(II) Has the Company established
standard operating procedures
for the reported matters, the
measures to be taken after
investigation is completed, and
the relevant confidential
mechanism?
✓ The Company's Procedures for Accounting, Internal
Control and Audit Related Grievance and the Grievance
Reporting Method have clearly stipulated standard
operating procedures, responsible departments for
receiving such reports, and procedures to handle these
reports. The Company also maintains confidentiality of
personal information and strictly prohibits its employees
from taking retaliatory actions.
No gaps
(III) Has the Company adopted
protection against
inappropriate disciplinary
action for the whistle-blower?
✓ No gaps
IV. Enhanced information disclosure
Does the company disclose its ethical corporate
management policies and the results of its
implementation on the company’s website and MOPS?
✓ The Company has clearly stated the content and
effectiveness of the Ethical Corporate Management Best
Practice Principles in the Company's CSR Report, which
can be found on the Company website. The Ethical
Corporate Management Best Practice Principles are also
disclosed on the Company website, and relevant
performance is regularly disclosed and updated each year.
No gaps
V. If the Company has established its own ethical corporate management principles based on the Ethical Corporate Management Best Practice
Principles for TWSE/TPEx Listed Companies, please describe the implementation and any deviations from the Principles:
In 2014, the Company formulated the “Code of Ethical Management” in accordance with the “Ethical Corporate Management Best Practice
Principles for TWSE/TPEx Listed Companies”. There is no significant difference between the Company ’s ethical corporate management and
the said laws.
VI. Other important information that facilitates the understanding of the implementation of ethical corporate management (such as review and
amendment of the Company's Ethical Corporate Management Best Practice Principles):
Since the Company has begun advocating for the "Honest AUO" activities in 2012, a series of activities ranging from signing a Declaration of Ethics,
online ethics testing, read-aloud of the Corporate Ethics Handbook and anti-trust course, have helped to cultivate a mindset for 'honesty' in each
and every one of AUO's employees, forming the most basic corporate culture of AUO.
Ethics Promotions Week is planned every year, in which employees can become more familiar with the Company's internal ethics culture through
broadcast and e-bulletin. Moreover, the Corporate Integrity Handbook is announced to be the Code of Conduct for all AUO employees. To ensure
that all employees can implement integrity in their work, the Code offers a guide to behavioral conduct, case studies, and examples for the
Company's Corporate Integrity Policy, standards on working with business partners, standards on working with government agencies, Intellectual
Property rights, conflict of interest, information system security, insider trading, and anti-trust.
Concurrently, to abide by the local laws and regulations in which the Company operates in and to undertake business activities with the highest
level of moral standards and to help employees gain accurate legal knowledge, AUO requires indirect employees to undertake online legal
compliance courses and subjects them to relevant quizzes, as well as signing a declaration for legal compliance after the completion of the course.
Furthermore, to facilitate all employees to understand the meaning of the Antitrust Law, besides having established an Antitrust Law section on the
internal website, a mobile APP has also been established so that employees can inquire for relevant information on a timely basis.
In addition, the Company deems unit managers who handle supplier matters and have close relationships with manufacturers as having an honest
job position. Considering that supervisory positions require high ethical standards in conducting business so as to protect the Company and
individual employees, we have made the “AUO Declaration of Conflict of Interests”, according to which colleagues having an honest job position
must make a declaration each year. A total of 770 people declared in 2019, with completion rate being 100%. Every two years, a compulsory
compliance training course is arranged for the managers holding honest positions, which courses cover practical case sharing and regulations that
must be followed when handling relevant business at work.
The operating status column is based on the Company's practices, and either Yes or No will be ticked. Please see the
content of the abstract for explanations.
(VII) If the Company has stipulated best practices for corporate governance and other relevant bylaws, the means to
search for these bylaws shall be disclosed.
The Company has established "Corporate Governance Principles" which aims at protecting the shareholders’
rights, enhancing the functions of the Board of Directors, respecting stakeholders’ rights, and improving
information transparency. Please see either the MOPS or the Company website for the Company's Corporate
Governance Principles.
(VIII) Other important information that can promote understanding of the company’s corporate governance operations:
1. In order to strengthen corporate governance and enhance the effectiveness of the Board of Directors, the
Board of Directors established a Corporate Governance Committee and formulated the " Organizational
Charter for Corporation Governance Committee " in October 2019. For related content, please visit either
the MOPS or the Company website.
2. The Board of Directors has appointed Mr. Benjamin Tseng, the vice president, as the head of corporate

AU Optronics 2019 Annual Report
43
Corporate Governance
governance, who is responsible for the supervision and planning of corporate governance. Such an
appointment is to protect shareholders' rights and enhance the competence of the Board of Directors. His
qualifications meet the requirements set forth in Article 3-1-1 of the Corporate Governance Best Practice
Principles for TWSE/TPEx Listed Companies. The head of corporate governance has the power to: provide
Directors and Audit Committee with the information required for the implementation and the latest
regulations pertaining to the Company's operations, assist Directors and Audit Committee in complying
with laws and regulations, report regularly to the Corporate Governance Committee and the Board of
Directors on corporate governance operations, handle affairs relating to the board and shareholder
meetings in accordance with the law, produce the minutes of the Board of Directors and shareholders'
meetings, assist Directors and members of Audit Committee in their appointments and continuing
education, etc., all are performed by the Board’s secretary unit.
3. The Company has established " Management Procedure for Insider Trading Prevention " to serve as a
reference for the Company's handling and disclosure of material information, the Company also reviews
the Procedures from time to time to comply with present laws and practical management needs. The
Procedures are also announced on AUO's internal Document Management System and the Company
website for all managers and employees around the world to review. The Company also alerts insider of
the Company the material information and notifications as needed.
AU Optronics 2019 Annual Report
44
4. The Company regularly arranges for senior executives to attend corporate governance courses. Please
see the following table for corporate governance training undertaken by senior executives in 2019:
Title Name Date of continuing
education Organizer Course title
Length of the
curriculum
Chairman
and CEO
Shuang-Lang (Paul)
Peng
2019.03.12
Taiwan Corporate
Governance Association
2019 Global risk trends 3 hours
2019.10.17
Brief Introduction to the Fair Trade Act, and
Impact of Global Antitrust Regulations on
Taiwanese Enterprises
3 hours
2019.11.21 Securities and Futures
Institute Legal compliance for insider equity transaction 3 hours
President
and COO Frank Ko
2019.02.22 Taiwan Corporate
Governance Association
Towards a sustainable enterprise and increase
in corporate long-term value
3 hours
2019.11.21 Securities and Futures
Institute
Legal compliance for insider equity transaction 3 hours
Senior Vice
President Wei-Lung Liau
2019.03.12
Taiwan Corporate
Governance Association
2019 Global risk trends 3 hours
2019.10.17
Brief Introduction to the Fair Trade Act, and
Impact of Global Antitrust Regulations on
Taiwanese Enterprises
3 hours
2019.11.21 Securities and Futures
Institute Legal compliance for insider equity transaction 3 hours
Vice
President
Hong-Jye Hong,
Amy Ku 2019.03.12
Taiwan Corporate
Governance Association 2019 Global risk trends 3 hours
Vice
President Shih-Hong Liao 2019.06.13
Accounting Research and
Development Foundation
Corporate Governance Practices: An Analysis
of the Trends and Cases of "Comprehensive
Enterprise Value Management"
3 hours
Vice
President
Ting-Li Lin, Hong-
Jye Hong, James CP
Chen, CS Hsieh
2019.10.17 Taiwan Corporate
Governance Association
Brief Introduction to the Fair Trade Act, and
Impact of Global Antitrust Regulations on
Taiwanese Enterprises
3 hours
TY Lin 2019.11.22
Vice
President
Wei-Lung Liau, TY
Lin, Ting-Li Lin, hih-
Hong Liao, CS Hsieh
2019.11.21 Securities and Futures
Institute Legal compliance for insider equity transaction 3 hours
Financial
Manager
Accounting
Manager
Cooperate
Governance
Manager
Benjamin Tseng
2019.02.27 Accounting Research and
Development Foundation
The Key Role of "Breaking News" in Economic
Crimes: Legal Liability and Case Study 3 hours
2019.03.12 Taiwan Corporate
Governance Association 2019 Global risk trends 3 hours
2019.03.15
Accounting Research and
Development Foundation
Analysis of amendments to IFRS financial
reporting standards and analysis of common
deficiencies
3 hours
2019.05.23
Corporate governance practices: an analysis of
the trends and cases of "Comprehensive
Enterprise Value Management"
3 hours
2019.10.15 Analysis of IFRS 16 "Leases" 3 hours
2019.10.04 Taiwan Stock Exchange
(TWSE) ESG Investment Forum 2 hours
2019.10.17 Taiwan Corporate
Governance Association
Brief Introduction to the Fair Trade Act, and
Impact of Global Antitrust Regulations on
Taiwanese Enterprises
3 hours
2019.11.21 Securities and Futures
Institute Legal compliance for insider equity transaction 3 hours
Audit
Manager Maggie Chen
2019.03.12 Taiwan Corporate
Governance Association
2019 global risk trends 3 hours
2019.09.10 The Institute of Internal
Auditors-Chinese Taiwan
How internal auditors interpret business
performance and risks from IFRS financial
statements
6 hours
2019.10.04 Accounting Research and
Development Foundation
Analysis of Cases of "Audit Transformation"
and "Data Analysis" Brought by Emerging
Technology
6 hours
2019.10.17 Taiwan Corporate
Governance Association
Brief Introduction to the Fair Trade Act, and
Impact of Global Antitrust Regulations on
Taiwanese Enterprises
3 hours
2019.11.21 Securities and Futures
Institute Legal compliance for insider equity transaction 3 hours

AU Optronics 2019 Annual Report
45
Corporate Governance
(IX) Implementation of Internal Control System
1. Statement of Internal Control System
AU Optronics Corporation
Statement of Internal Control System
Date: February 5, 2020
Based on the findings of a self-assessment, AU Optronics Corporation (hereinafter “the Company”) states the
following pertaining to its internal control system during year 2019:
I. The Company is fully aware that establishing, operating and maintaining an internal control system are the
responsibilities of its Board of Directors and managers. The Company has established such a system with an aim
to providing reasonable assurance for the achievement of the following objectives: The effectiveness and
efficiency of business operation (including profitability, performance, and safe-guarding of company assets; The
reliability, timeliness, transparency, and regulatory compliance of financial reporting and other related reports;
and The compliance with applicable laws, regulations and rulings.
II. An internal control system has inherent limitations. No matter how perfectly it is designed, an effective internal
control system can provide only reasonable assurance of achieving the three above-mentioned objectives.
Moreover, the effectiveness of the internal control system may be subject to changes of environment or
circumstances. Nonetheless, the Company's internal control system comprises of self-monitoring mechanisms,
and the Company immediately undertakes corrective measures once a deficiency is identified.
III. The Company assesses the design and operating effectiveness of its internal control system in accordance with
the criteria stated in the “Regulations Governing Establishment of Internal Control Systems by Public
Companies” (hereinafter referred to as “the Regulations”). The criteria stipulated in the Regulations identify five
essential elements of an internal control system based on managerial control process, including 1). Control
environment, 2). Risk assessment 3). Control activities, 4). Information and communication, and 5). Monitoring
activities. Each essential element further contains several items. Please see the Regulations for the
aforementioned items.
IV. The Company has evaluated the design and operating effectiveness of its internal control system according to
the aforesaid criteria.
V. Based on the results of the abovementioned assessment, the Company believes that, as of December 31, 2019,
its internal control system, including its supervision and management of subsidiaries, was effective in design and
operation and provided reasonable assurance of achievement of operational effectiveness and efficiency,
reliability, timeliness, transparency of reporting, and compliance with applicable laws, regulations and rulings.
VI. This Statement constitutes an integral part of the Annual Report for the year 2019 and the Prospectus of the
Company and will be made public. Any falsehood, concealment, or other illegality in the content made public will
entail legal liability under Articles 20, 32, 171, and 174 in the Securities and Exchange Act.
VII. This Statement has been approved by the Board of Directors in their meeting held on February 5, 2020, with
none of the nine attending directors expressing dissenting opinions, and the remainder all affirming the contents
of this Statement.
AU Optronics Corporation
Chairman ,Shuang-Lang (Paul):
President ,Frank Ko:
2. Companies that CPAs to professionally review the internal control system shall disclose the review
report provided by the accountants: None.

AU Optronics 2019 Annual Report
46
(X) The Company and its personnel have been punished by law, the Company has undertaken disincentive measures
for its personnel for breaching the internal control system, and any material deficiencies and revisions in the most
recent year up to the publication date of the Annual Report:
1. As to penalties on environmental pollution, please see "V. Operational Highlights" (Page 67) of this Annual
Report, which provides information on "Environmental Protection Expenditures".
2. As to penalties on labor conflicts, please see "V. Operational Highlights" of this Annual Report, which
provides information on "Labor-Management Relation"(Pages 70-71).
(XI) Material resolutions made in the Shareholders' Meeting and the Board of Directors in the most recent year and
up to the publication date of this Annual Report
1. Material resolutions from the 2019 Shareholders' Meeting and Implementation Status
⚫ Elected nine directors (including five independent directors) being the ninth-term directors
Implementation status: Directors elected comprise Shuang-Lang (Paul) Peng, Kuen-Yao (K.Y.) Lee, Kuo-
Hsin (Michael) Tsai, the Representative of AUO Foundation, Peter Chen, the representative of BenQ
Foundation, Mei-Yueh Ho (independent director), Chin-Bing (Philip) Peng (independent director),
Yen-Shiang Shih (independent director), Yen-Hsueh Su (independent director), Jang-Lin (John) Chen
(independent director). The term of office is from June 14, 2019 to June 13, 2022.
⚫ Accepted 2018 Business Report and Financial Statements
Implementation status: Resolution was passed
⚫ Accepted the proposal for the distribution of 2018 earnings
Implementation status: resolution passed; the ex-dividend record date was set on July 19, 2019, and
earnings have been distributed on August 16, 2019 based on the resolution from the Shareholders'
Meeting. Amount of cash dividend distributed was NT$0.5 per share; hence, NT$500 would be
distributed for each 1,000 shares. Total cash dividend distributed was NT$4,812,122,558.
⚫ Approved issuance of new common shares for cash to sponsor issuance of the overseas depositary
shares and/or issuance of new common shares for cash in public offering and/or issuance of new
common shares for cash in private placement and/or issuance of overseas or domestic convertible
bonds in private placement
Implementation status: resolution was passed; the Board of Directors is authorized to proceed with
funding. However, no actual action toward this means has been taken yet as of the publication date of
the Annual Report.
⚫ Approved the amendment to the Articles of Incorporation
Implementation status: resolution was passed, and the amended Articles of Incorporation became
effective on June 14, 2019.
⚫ Approved the amendments to Handling Procedures for Acquisition or Disposal of Assets, Handling
Procedures for Conducting Derivative Transactions, Handling Procedures for Capital Lending, Handling
Procedures for Providing Endorsements and Guarantees for Third Parties.
Implementation status: resolution was passed, and the amended procedures became effective on June
14, 2019.
⚫ Approved to lift non-competition restrictions on board members
Implementation status: resolution was passed, and the non-competition restrictions were lifted on the
director candidates, namely Shuang-Lang (Paul) Peng, Kuen-Yao (K.Y.) Lee, Kuo-Hsin (Michael) Tsai,
BenQ Foundation, Peter Chen, Mei-Yueh Ho, Chin-Bing (Philip) Peng, Yen-Shiang Shih, Yen-Hsueh Su,
and Jang-Lin (John) Chen

AU Optronics 2019 Annual Report
47
Corporate Governance
2. Material Resolutions from the Board of Directors
8th Term
18th Meeting
2019.01.28
Approved the Internal Control Declaration for 2018 (note)
Approved the amendment of proportion to the appropriation of employees’ remuneration and directors’
remuneration in 2018
Approved the proportion to the appropriation of employees’ remuneration and directors’ remuneration in 2019
Approved the 2018 Parent Company Only and Consolidated Financial Statements (note)
Approved the 2019 services and fees of the Certified Public Accountant (note)
Approved Subsidiary, AU Optronics Manufacturing (Shanghai) Corp., to lend capital to Subsidiaries, U-Fresh
Technology (Suzhou) Co., Ltd. and AUO Care Management (Suzhou) Co., Ltd. (note)
Approved the amendments to the Authorization Matrix(note)
Approved the 2019 Senior Officer Compensation Policy
Approved the addition and renewal of banking facilities
8th Term
19th Meeting
2019.3.22
Approved the 2018 Business Report and the 2019 Business Plan (note)
Approved the distribution of 2018 earnings (note)
Approved the distributions of 2018 employees’ and directors’ remuneration
Approved the issuance of new common shares for cash to sponsor issuance of the overseas depositary shares and/or
issuance of new common shares for cash in public offering and/or issuance of new common shares for cash in private
placement and/or issuance of overseas or domestic convertible bonds in private placement (note)
Approved the amendment to Articles of Incorporation
Approved the amendment to Handling Procedures for Acquisition or Disposal of Assets, Handling Procedures for
Conducting Derivative Transactions, Handling Procedures for Capital Lending, Handling Procedures for Providing
Endorsements and Guarantees for Third Parties(note)
Approved the directors’ election and the list of the nominated candidates of the directors (including independent
directors)
Approved the date of convening the 2019 Annual General Shareholders’ Meeting, meeting agenda and submission
period of shareholder proposals and directors
Approved to cancel the issuance of securities in private placement resolved in the 2018 Annual General
Shareholders’ Meeting (note)
Approved the increase/reduction of capital expenditure budget
Approved the proportion to the appropriation of employees’ remuneration and directors’ remuneration in 2019
Approved the 2018 compensation to directors and senior managerial officers
Approved the donations(note)
Approved to conduct Sustainability-Linked Loan
8th Term
20th Meeting
2019.4.24
Approved the Consolidated Financial Statements for the period ended March 31, 2019 (note)
Approved the Company and the subsidiaries to lend capital to AU Optronics (Kunshan) Co., Ltd. (note)
Approved the Company to conduct derivative transaction on behalf of AU Optronics (Kunshan) Co., Ltd. on its
exposure in US dollars(note)
Approved the capital injection from the Company to the subsidiary, ComQi Ltd. (note)
Approved to lift non-competition restrictions on board members
Approved the amendment to Articles of Incorporation Examined shareholders’ proposals for 2019 Annual General
Shareholders’ Meeting
Approved the SOP of processing the requirements from the directors
Approved the donations to AUO Foundation(note)
Approved the addition and renewal of banking facilities
9th Term
1st Meeting
2019.6.14
Elected of the Chairman
Appointed the members of the Company’s fourth-term Remuneration Committee
9th Term
2nd Meeting
2019.7.24
Approved the Consolidated Financial Statements for the period ended June 30, 2019 (note)
Approved to invest the common shares of Star Shining Energy Corporation(note)
Approved the distribution of 2018 employees’ remuneration for senior managerial officers
Approved the addition and renewal of banking facilities
9th Term
3rd Meeting
2019.9.9
Intention to delist the Company’s ADSs from the NYSE (note)
Approved the Company to repurchase its outstanding common shares
Approved the changes of senior officers
9th Term
4th Meeting
2019.10.29
Approved 2020 annual audit plan (note)
Approved the amendments to Internal Control Systems(note)
Approved the Consolidated Financial Statements for the period ended September 30, 2019 (note)
Approved the subsidiaries to lend capital to AU Optronics (Kunshan) Co., Ltd. (note)
Approved to lend capital to the subsidiary, AUO Crystal Corporation(note)
Approved to cancel the endorsements and guarantees of the subsidiaries (note)
Approved the amendments to Corporate Governance Principles, Corporate Social Responsibility Principles, Ethical
Corporate Management Principles and Performance Evaluation Principles of Board of Directors
Approved the set-up of the Corporate Governance Committee and to stipulate the Corporate Governance
Committee Charter
Approved the changes of senior officers
Approved the addition and renewal of banking facilities
9th Term
5th Meeting
2020.2.5
Approved the Internal Control Declaration for 2019 (note)
Approved the amendments to Internal Control Systems(note)
Approved the 2019 Parent Company Only and Consolidated Financial Statements (note)
Approved the proportion to the appropriation of employees’ remuneration and directors’ remuneration

AU Optronics 2019 Annual Report
48
Note: Matters included in Article 14-5 of the Securities and Exchange Act.
(XII) Major contents of any dissenting opinions on record or stated in a written statement made by Directors or
supervisors regarding material resolutions passed by the Board of Directors’ Meeting in the most recent year
up to the publication date of this report: None.
(XIII) In the most recent year up to the publication date of the Annual Report, a summary of the resignation and
dismissal of Chairman, President, Accounting Manager, financial Manager, internal audit manager , Head of
Corporate Governance and R&D:
Title Name Date of appointment Date of Discharge Cause
President and COO Kuo-Hsin (Michael) Tsai November 01, 2015 September 09, 2019 Position adjustment
(XIV) Certification obtained by the Company and its personnel related to financial information transparency from
competent authorities:
December 31, 2019
Title of Licence Number of persons
Financial Accounting Audits
R.O.C. CPA 3 1
US CPA 1 -
Chartered Financial Analyst (CFA) 1 -
Financial Risk Manager (FRM) 1 -
Certified Internal Auditor (CIA) 2 1
Certified Information Systems Auditor (CISA) - 2
Senior Securities Processing Personnel 7 1
Certified Securities Investment Analyst (CSIA) - 1
Intermediate Intangible Asset Appraiser - 1
Stock Affairs Personnel 1 1
Basic Ability Test for Corporate Internal Control organized by the Securities and Futures Institute 1 6
The Fundamentals of Corporate Governance Test held by the Securities and Futures Institute 3 -
Approved to lend capital to the subsidiary, SPACE MONEY INC. (note)
Approved the subsidiary, AU Optronics Manufacturing (Shanghai) Corp., to lend capital (note)
Approved the Company to cancel the bank guarantee against the bank loan to AU Optronics (Kunshan) Co., Ltd.
(note)
Approved the amendments to “compensation policy to the directors and functional committee members”
Approved the 2019 compensation to directors and senior managerial officers
Approved the 2020 Senior Officer Compensation Policy
Approved the reduction of capital expenditure budget
Approved the donations(note)
Approved to conduct Syndication loan
Approved the addition and renewal of banking facilities
9th Term
6th Meeting
2020.2.5
The Company intends to publicly acquire the common shares of ADLINK Technology Inc. (note)

AU Optronics 2019 Annual Report
49
Corporate Governance
V. Information on CPA fees
(I) Information on CPA fees
Unit: NT$ thousands
Name of the
Accounting Firm
Name of
CPA
Audit
Fees
Non-accounting fee
CPA's Audit Period Note System
Design
Corporate
Registration
Human
Resources
Others
(Note) Subtotal
KPMG
Certificated
Public
Accountants
Wei Hsin-
Hai
Lu Chien-
Hui
35,610 - - - 936 936 2019.1.1~2019.12.31
Note: The service fees
included the fee for CSR
assurance and consulting
service and so on.
1. Non-audit fees paid to the CPA, accounting firm of CPA and its affiliates were more than 25% of the audit
fees: Not applicable.
2. Replacement of accounting firm and the audit fees in the replacing years is less than that in the previous
year: Not applicable.
3. Audit fees were reduced by over 10% compared with the previous year: Not applicable.
(II) The audit fees mentioned above are the fees paid to the CPA regarding the services of audit and review on
financial report, and tax compliance.
VI. Information on change of accountants in the past two years: None.
VII. Has any of the Company’s Chairman, President, or managers responsible for finance or accounting duties served
in the Company’s CPA firm or its affiliated Company within the most recent year: None.
VIII. The Situation of equity transfer or changes to equity pledge of Directors, managers or shareholders holding
more than 10% of Company shares in the most recent year (or initial date of a manager's term of service) up to
the publication date of this report:
(I) Changes in shares held by Directors, managers, and shareholders holding 10% or more of shares: Unit: 1,000 shares
Title (Note) Name
2019 As of January 31, 2020
Increase
(decrease) of
shares held
Increase
(decrease) of
shares pledged
Increase
(decrease) of
shares held
Increase (decrease)
of shares pledged
Chairman and CEO Shuang-Lang (Paul) Peng 1,212 0 0 0
Director Kuen-Yao (K.Y.) Lee 0 0 0 0
Corporate Director AUO Foundation 0 0 0 0
Representative of
Corporate Director
President and COO
Frank Ko 0 0 0 0
Corporate Director BenQ Foundation 0 0 0 0
Representative of
Corporate Director Peter Chen 0 0 0 0
Independent Director Chin-Bing (Philip) Peng 0 0 0 0
Independent Director Mei-Yueh Ho 0 0 0 0
Independent Director Yen-Shiang Shih 0 0 0 0
Independent Director Yen-Hsueh Su 0 0 0 0
Independent Director Jang-Lin (John) Chen 0 0 0 0
Senior Vice President Wei-Lung Liau 537 0 0 0
Vice President TY Lin 129 0 0 0
Vice President Ting-Li Lin (62) 0 (12) 0
Vice President TL Tseng 0 0 0 0
Vice President Shih-Hong Liao 0 0 0 0
Vice President Tina Wu 177 0 (50) 0
Vice President Andy Yang 314 0 0 0
Vice President CS Hsieh 386 0 0 0
Vice President Benjamin Tseng 314 0 0 0
Vice President Amy Ku (30) 0 0 0
Vice President Hong-Jye Hong 107 0 0 0
Vice President Shih-Kun Chen 218 0 (51) 0
Vice President James CP Chen 388 0 0 0
Vice President Kevin.Young 0 0 0 0
Senior Associate Vice
President Martin Sung 133 0 (60) 0
Senior Associate Vice
President Kun-Yu Lin 142 0 (9) 0
Senior Associate Vice
President Yu-Chieh Lin 355 0 0 0
AU Optronics 2019 Annual Report
50
Note: Those who still serve in their respective positions when the Annual Report is published.
(II) Counterparty of equity pledge is a related party:
Name (Note)
Reason for
equity
transfer
Transaction
date
Transaction
counterparty
Relationship between Counterpart and the
Company and Its Directors, Supervisors and
Shareholders with Shareholding Ratio of 10%
or More
Number of shares
(thousand shares)
Transaction
price
Shuang-Lang
(Paul) Peng Gift 2019.03.13
AUO
Foundation
Chairman of the transaction counterparty 101 -
CS Hsieh Gift 2019.03.15
Director of the transaction counterparty
30 -
Benjamin
Tseng Gift 2019.03.19 30 -
Amy Ku Gift 2019.03.20 30 -
Note: Those who still serve in their respective positions when the Annual Report is published.
(III) Counterparty of equity pledge is a related party: None.
IX. Information of relationships between TOP 10 shareholders are related parties
Unit: 1,000 shares
Name (Note)
Shares held Shares held by spouse
or underage children
Total shares held in the
name of other persons
Familial relationships
between top 10
shareholders who are
either related parties,
spouses, or relatives
within the second degree
of kinship, his/her/its title
(or name) and
relationships
Note
Number
of shares
Shareholding
percentage
(%)
Number
of shares
Shareholding
percentage
(%)
Number
of shares
Shareholding
percentage
(%)
Title (or
name) Relationships
Qisda Corporation 663,599 6.90 - - - - - -
Qisda Corporation
Representative: Peter Chen - - 99 0.00 - - - -
ADR of AU Optronics Corp. 522,594 5.43 - - - - - -
Quanta Computer Inc. 443,930 4.61 - - - - - -
Quanta Computer Inc.
Representative: Barry Lam - - - - - - - -
Fubon Life Insurance Co., Ltd. 367,500 3.82 - - - - - -
Fubon Life Insurance Co., Ltd.
Representative: Richard M. Tsai - - - - - - - -
Trust Holding for Employees for AU Optronics
Corp. 353,829 3.68 - - - - - -
Tong Hwei Enterprise Co., Ltd. 150,000 1.56 - - - - - -
Tong Hwei Enterprise Co., Ltd.
Representative: Tsung-Hsiang Tsai - - - - - - - -
JPMorgan Chase Bank N.A., Taipei Branch in
custody for Vanguard Total International Stock
Index Fund, a series of Vanguard Star Funds
110,309 1.15 - - - - - -
Cathay Life Insurance Co., Ltd. 103,400 1.07 - - - - - -
Cathay Life Insurance Co., Ltd.
Representative: Tiao-Kuei Huang - - - - - - - -
VANGUARD EMERGING MARKETS STOCK
INDEX FUND, A SERIES OF
VANGUARD INTERNATIONAL EQUITY
INDEX FUNDS
92,925 0.97 - - - - - -
CTBC bank, Yuanta Taiwan 50 Securities Funds 71,075 0.74 - - - - - -
Note: Information recorded on the shareholder roster as of the latest book closure date (July 19, 2019) of the Company.
Senior Associate Vice
President Ivan Wu 263 0 0 0
Senior Associate Vice
President SI Jeong 39 0 0 0
Senior Associate Vice
President PC Cheng 0 0 0 0
Senior Associate Vice
President CC Hung 83 0 0 0
Associate Vice President TL Chen 27 0 0 0
Associate Vice President HC Lee 39 0 0 0
Associate Vice President PH Lin 225 0 0 0

AU Optronics 2019 Annual Report
51
Corporate Governance
X. Number of shares held and combined shareholdings percentage in the same investment business by the
Company, the Company's Directors, Managers, and companies directly or indirectly controlled by the Company:
Unit: 1,000 shares
Investment business (Note 1)
Investment by the Company
(Note 2)
Investment by Directors,
Supervisors, Managers and
directly or indirectly controlled
businesses (Note 2)
Comprehensive investment
(Note 3)
Number of
shares
Shareholding
Percentage (%)
Number of
shares
Shareholding
Percentage (%)
Number of
shares
Shareholding
Percentage (%)
Lextar Electronics Corp. 78,418 15.10 61,845 11.91 140,263 27.01
Raydium Semiconductor Corp. - - 11,759 18.09 11,759 18.09
Daxin Materials Corp. - - 25,748 25.07 25,748 25.07
Star River Energy Corp. 37,904 32.01 1,776 1.50 39,680 33.51
Star Shining Energy Corp. 93,000 31.00 6,000 2.00 99,000 33.00
Ubitech Corp. - - 357 26.31 357 26.31
WishMobile, Inc. - - 2,500 12.50 2,500 12.50
SkyREC Ltd. - - 188 16.12 188 16.12
Note 1. Invested by the Consolidated Company using the equity method Note 2. Information recorded on the shareholder roster as of the latest book closure date of each company.

AU Optronics 2019 Annual Report
52
Chapter 4 Capital Overview I. Capital and shares (I) Source of Share Capital
Unit: NT$; Shares
Year and
month
Issued price (par
value per
share)
Authorized capital Paid-in capital Note
Number of shares
Amount Number of
shares Amount Source of capital
Capital increase by assets other
than cash
Others
1996.08 10 200,000,000 2,000,000,000 50,000,000 500,000,000 Establishment - Note 1
1997.06 10 200,000,000 2,000,000,000 200,000,000 2,000,000,000 Capital Increase by Cash - Note 2
1998.07 10 800,000,000 8,000,000,000 500,000,000 5,000,000,000 Capital Increase by Cash - Note 3
1998.12 10 800,000,000 8,000,000,000 800,000,000 8,000,000,000 Capital Increase by Cash - Note 4
1999.12 10 1,400,000,000 14,000,000,000 1,100,000,000 11,000,000,000 Capital Increase by Cash - Note 5
2001.03 10 1,400,000,000 14,000,000,000 1,250,000,000 12,500,000,000 Capital Increase by Cash - Note 6
2001.09 10 5,000,000,000 50,000,000,000 2,970,581,607 29,705,816,070 Capital Increase by retained earnings, capital
surplus and acquisition - Note 7
2002.06 10 5,000,000,000 50,000,000,000 3,470,581,607 34,705,816,070
Capital increase by cash to participate in
the issuance of overseas depository receipt
- Note 8
2002.08 10 5,000,000,000 50,000,000,000 3,976,397,079 39,763,970,790 Domestic corporate bond conversion - Note 9
2002.11 10 5,000,000,000 50,000,000,000 4,003,048,921 40,030,489,210 Domestic corporate bond conversion - Note 10
2003.01 10 5,000,000,000 50,000,000,000 4,024,194,453 40,241,944,530 Domestic corporate bond conversion - Note 11
2003.02 10 5,000,000,000 50,000,000,000 4,025,833,686 40,258,336,860 Domestic corporate bond conversion - Note 12
2003.08 10 5,800,000,000 58,000,000,000 4,270,445,386 42,704,453,860 Domestic corporate bond conversion
- Note 13 Capital increase by retained earnings
2003.11 10 5,800,000,000 58,000,000,000 4,352,237,241 43,522,372,410 Domestic corporate bond conversion - Note 14
2004.06 10 5,800,000,000 58,000,000,000 4,658,040,897 46,580,408,970 Capital increase by retained earnings - Note 15
2004.07 10 5,800,000,000 58,000,000,000 4,958,040,897 49,580,408,970
Capital increase by cash to participate in
the issuance of overseas depository receipt
- Note 16
2005.08 10 7,000,000,000 70,000,000,000 5,830,547,132 58,305,471,320
Capital increase by retained earnings
- Note 17 Capital increase by cash to participate in
the issuance of overseas depository receipt
2006.08 10 7,000,000,000 70,000,000,000 6,094,068,587 60,940,685,870 Capital increase by retained earnings - Note 18
2006.11 10 9,000,000,000 90,000,000,000 7,573,178,616 75,731,786,160 Capital increase by acquisition - Note 19
2007.02 10 9,000,000,000 90,000,000,000 7,573,402,805 75,734,028,050 Employee stock options - Note 20
2007.06 10 9,000,000,000 90,000,000,000 7,573,782,895 75,737,828,950 Employee stock options - Note 21
2007.08 10 9,000,000,000 90,000,000,000 7,596,895,987 75,968,959,870 Corporate bond conversion
- Note 22 Employee stock options
2007.09 10 9,000,000,000 90,000,000,000 7,805,727,146 78,057,271,460 Capital increase by retained earnings - Note 23
2007.11 10 9,000,000,000 90,000,000,000 7,817,705,505 78,177,055,050 Corporate bond conversion
- Note 24 Employee stock options
2008.05 10 9,000,000,000 90,000,000,000 7,865,200,583 78,652,005,830 Corporate bond conversion
- Note 25 Employee stock options
2008.05 10 9,000,000,000 90,000,000,000 7,868,206,737 78,682,067,370 Corporate bond conversion
- Note 26 Employee stock options
2008.08 10 9,000,000,000 90,000,000,000 8,505,525,398 85,055,253,980
Capital increase by retained earnings
- Note 27 Corporate bond conversion
Employee stock options
2008.11 10 9,000,000,000 90,000,000,000 8,505,719,634 85,057,196,340 Employee stock options - Note 28
2009.09 10 10,000,000,000 100,000,000,000 8,827,045,535 88,270,455,350 Capital increase by retained earnings - Note 29
2013.05 10 10,000,000,000 100,000,000,000 9,624,245,115 96,242,451,150 Capital increase by cash to participate in the issuance of overseas depository receipt
- Note 30
Note 1. Hsinchu Science Park Bureau 08.12.1996(85) Certificate No. 13629.
Note 2. Hsinchu Science Park Bureau 06.05.1997(86) Certificate No. 10528.
Note 3. Hsinchu Science Park Bureau 07.06.1998(87) Certificate No. 016400.
Note 4. Hsinchu Science Park Bureau 12.23.1998(87) Certificate No. 030560.
Note 5. Hsinchu Science Park Bureau 12.10.1999 Certificate No. 0880026812.
Note 6. Hsinchu Science Park Bureau 03.23.2001 Certificate No. 0900006660.
Note 7. Hsinchu Science Park Bureau 09.14.2001 Certificate No. 0910023096.
Note 8. Hsinchu Science Park Bureau 06.20.2002 Certificate No. 0910014056.
Note 9. Hsinchu Science Park Bureau 08.02.2002 Certificate No. 0910017441.
Note 10. Hsinchu Science Park Bureau 11.29.2002 Certificate No. 0910029009.
Note 11. Hsinchu Science Park Bureau 01.22.2003 Certificate No. 0920001485.
Note 12. Hsinchu Science Park Bureau 02.26.2003 Certificate No. 0920004126.
Note 13. Hsinchu Science Park Bureau 08.11.2003 Certificate No. 0920019428.
Note 14. Hsinchu Science Park Bureau 11.20.2003 Certificate No. 0920031977

AU Optronics 2019 Annual Report
53
Capital Overview
Note 15. Hsinchu Science Park Bureau 06.23.2004 Certificate No. 0930016501.
Note 16. Hsinchu Science Park Bureau 07.16.2004 Certificate No. 0930018382.
Note 17. Hsinchu Science Park Bureau 08.25.2005 Certificate No. 0940023097.
Note 18. Hsinchu Science Park Bureau 08.23.2006 Certificate No. 0950021964.
Note 19. Hsinchu Science Park Bureau 11.29.2006 Certificate No. 0950031936.
Note 20. Hsinchu Science Park Bureau 02.08.2007 Certificate No. 0950003634.
Note 21. Hsinchu Science Park Bureau 06.29.2007 Certificate No. 0960017409.
Note 22. Hsinchu Science Park Bureau 08.21.2007 Certificate No. 0960021864.
Note 23. Hsinchu Science Park Bureau 09.11.2007 Certificate No. 0960023922.
Note 24. Hsinchu Science Park Bureau 11.21.2007 Certificate No. 0960030854.
Note 25. Hsinchu Science Park Bureau 05.19.2008 Certificate No. 0970012663.
Note 26. Hsinchu Science Park Bureau 05.27.2008 Certificate No. 0970013216.
Note 27. Hsinchu Science Park Bureau 08.28.2008 Certificate No. 0970023767.
Note 28. Hsinchu Science Park Bureau 11.20.2008 Certificate No. 0970032275.
Note 29. Hsinchu Science Park Bureau 09.15.2009 Certificate No. 0980025465.
Note 30. Hsinchu Science Park Bureau 05.24.2013 Certificate No. 1020015421.
As of February 25, 2020; Unit: Shares
Shares
Category
Authorized capital Amount of corporate bonds that can be converted
Shares outstanding Unissued shares SubTotal
Registered common shares 9,624,245,115 375,754,885 10,000,000,000 725,000,000
Note: The said outstanding shares include 125,000 thousand treasury shares held by the Company.
Shelf registration: Not applicable
(II) Shareholder structure Shareholding base date: July 19, 2019; Unit: Shares
Shareholder structure
Quantity Government
institutions
Financial
institutions
Other
corporations Individual
Foreign
institutions and
foreigners
SubTotal
Number of persons 10 150 488 385,477 1,231 387,356
Number of shares held 65,542,148 1,036,429,869 1,469,894,698 4,001,520,578 3,050,857,822 9,624,245,115
Shareholding Percentage (%) 0.68 10.77 15.27 41.58 31.70 100.00
(III) Distribution of Equity Ownership Type: Common shares Shareholding Base Date: July 19, 2019; Unit: Shares
Class of shareholding Number of shareholders Number of shares held Shareholding percentage (%)
1 to 999 98,826 20,260,479 0.21
1,000 to 5,000 168,550 407,492,742 4.23
5,001 to 10,000 52,505 418,156,795 4.34
10,001 to 15,000 18,596 233,434,216 2.43
15,001 to 20,000 13,883 259,132,328 2.69
20,001 to 30,000 12,175 312,087,997 3.24
30,001 to 40,000 5,985 214,454,047 2.23
40,001 to 50,000 4,157 194,830,947 2.02
50,001 to 100,000 7,142 522,099,929 5.42
100,001 to 200,000 3,029 431,069,701 4.48
200,001 to 400,000 1,281 361,173,378 3.75
400,001 to 600,000 377 186,159,313 1.93
600,001 to 800,000 183 127,406,303 1.32
800,001 to 1,000,000 122 111,077,831 1.15
1,000,001 or more 545 5,825,409,109 60.53
Total 387,356 9,624,245,115 100.00
Note: The Company does not issue preferred shares.

AU Optronics 2019 Annual Report
54
(IV) List of Major Shareholders (Top 10 shareholders who own the most shares) Shareholding base date: July 19, 2019
Shares
Names of major shareholders
Number of shares held
(thousand shares)
Shareholding
Percentage (%)
Qisda Corporation 663,599 6.90
ADR of AU Optronics Corp. 522,594 5.43
Quanta Computer Inc. 443,930 4.61
Fubon Life Insurance Co., Ltd. 367,500 3.82
Trust Holding for Employees for AU Optronics Corp. 353,829 3.68
Tong Hwei Enterprise Co., Ltd. 150,000 1.56
JPMorgan Chase Bank N.A., Taipei Branch in custody for Vanguard Total International Stock
Index Fund, a series of Vanguard Star Funds 110,309 1.15
Cathay Life Insurance Co., Ltd. 103,400 1.07
VANGUARD EMERGING MARKETS STOCK INDEX FUND, A SERIES OF
VANGUARD INTERNATIONAL EQUITY INDEX FUNDS 92,925 0.97
CTBC bank, Yuanta Taiwan 50 Securities Funds 71,075 0.74
(V) Market Price, Net Worth, Earnings, and Dividends in the Past Two Years Unit: NT$
Year
Item As of February 25, 2020 2019 2018
Market Price per Share
Highest 11.65 12.75 14.30
Lowest 9.51 6.92 11.30
Average (Note 1) 10.67 9.37 13.03
Net Value per Share Before distribution (Note 6) 18.36 21.08
After distribution - (Note 2) 20.58
Earnings per Share (EPS) Weighted Average of Share Number (thousand shares) 9,499,245 9,597,268 9,624,245
Earnings per Share (EPS) (Note 6) (2.00) 1.06
Dividend per Share
Cash dividend - (Note 2) 0.5
Stock Dividends Dividend from retained earnings (Shares) - (Note 2) -
Dividend from capital reserve - (Note 2) -
Cumulative unpaid dividends - (Note 2) -
Return on investment
(ROI) Analysis
Price-to-Earning Ratio (Note 3) (Note 6) - 12.08
Price-Dividend ratio (Note 4) - (Note 2) 25.62
Cash dividend yield (Note 5) - (Note 2) 3.90%
Note 1. Average market price calculated based on transaction amount and transaction volume.
Note 2. Pending resolution at the 2020 Annual Shareholders' Meeting.
Note 3. Price/earnings ratio = Average closing price for each share for the year/Earnings per share (before retrospective).
Note 4. Price/dividend ratio = Average closing price for each share for the year/Cash dividend per share.
Note 5. Cash dividend yield = Cash dividend per share / Average closing price per share for the year.
Note 6. Up to the publication date of this annual report, no information has been attested or approved by an independent auditor.
(VI) Dividend Policy and Implementation:
1. The dividend policy set forth in Article 15-1 of the Articles of Incorporation
Where the Company has a profit at the end of each fiscal year, the Company shall first allocate the profit to pay taxes
and cover accumulated losses, and then 10% of the remaining net earnings shall be allocated as the Company's legal
reserve unless and until the accumulated legal reserve reaches the paid in capital. Certain amount shall be further
allocated as special reserve or the special reserve shall be reversed in accordance with applicable laws and regulations
or as requested by the competent authority. The balance (if any) together with accumulated unappropriated retained
earnings can be distributed after the distribution plan proposed and approved. Dividend distribution in the form of
shares (in whole or in part) shall be approved by the shareholders’ meeting. Dividend distribution in the form of cash
shall be approved by the Board and a report of such distribution shall be submitted to the shareholders’ meeting.
The Company's dividend policy is to pay dividends from surplus considering factors such as the Company's current and
future investment environment, cash requirements, domestic and overseas competitive conditions and capital budget
requirements, and taking into account the shareholders' interest, maintenance of a balanced dividend and the Company's
long term financial plan. If the retained earnings available for distribution of the current year reaches 2% of the paid in
capital of the Company, no less than 20% of the retained earnings available for distribution of the current year shall be
distributed as dividend. If the retained earnings available for distribution of the current year does not reach 2% of the
paid in capital of the Company, the Company may distribute no dividend. The cash portion of the dividend shall not be
less than 10% of the total dividend in the form of cash and stock.
The dividend distribution ratio in the preceding paragraph could be adjusted taking into consideration finance, business
and operations, etc.

AU Optronics 2019 Annual Report
55
Capital Overview
2. Dividend payout plans proposed during the most recent shareholders' meeting
As of the publication date of the annual report, the Board of Directors of the Company has not resolved the 2019
earnings distribution proposal. The Board of Directors meeting will be held no later than 40 days before the annual
general meeting to make a resolution. The relevant information will be announced on the Company's website and
Market Observation Post System (Mops) at that time.
3. Major changes expected in the dividend policy: None
(VII) The impact of stock dividend distribution proposed by this shareholders' meeting on the Company’s operating
performance and earnings per share: The Company did not disclose the 2020 financial forecast information and
thus does not apply.
(VIII) Compensation for employees and Directors
1. The percentage or range of compensations for employees and Directors based on Article 15 and Article 15-3 of the
Articles of Incorporation:
Where the Company has a profit before tax for each fiscal year, the Company shall first reserve certain amount of the
profit to recover losses for preceding years, and then set aside no less than 5% of the remaining profit for distribution
to employees as remuneration and no more than 1% of the remaining profit for distribution to directors as
remuneration.
The employees who are entitled to employees remunerations in the form of shares or cash, employee stock option,
restricted employee stock, the bought back shares to be transferred by the Company and the new shares reserved for
employees subscription in the Company’s share offering include employees of subsidiaries of the Company meeting
certain specific qualifications and the Board or the person duly designated by the Board is authorized to decide such
qualifications and allocation.
2. The accounting procedure used to handle differences between estimated column of employee dividend and forecast
basis of director’s compensation, basis for calculating shares for the purpose of paying out share dividends and actual
payout figure for this period:
The Company accrued remuneration to employees based on the profit before income tax excluding the remuneration
to employees and Directors for each period, multiplied by the percentage resolved by the Board of Directors.
Remuneration to directors was estimated based on the amount expected to pay and recognized together with the
remuneration to employees as operating costs or operating expenses. If remuneration to employees is resolved to be
distributed in stock, the number of shares is determined by dividing the amount of remuneration by the closing price
of the shares (ignoring ex-dividend effect) on the day preceding the Board of Directors’ meeting. If there is a change in
the proposed amounts after the annual financial statements are authorized for issue, the differences are accounted for
as a change in accounting estimate and adjusted prospectively to next year’s profit or loss.
3. Compensation based on the resolution of the Board of Directors:
(1) Amount of compensation for employees and Directors: None.
(2) Sum of employees' compensation in stock and its proportion of the net income after tax (NIAT) provided in the
Individual Financial Statement and the total sum of employees' compensation: Not applicable.
4. Actual distribution of employees and Directors' compensation in the previous year, and the difference, reasons, and
processing situation for the employees and Directors' compensation that were recognized:
Unit: NT$
Item Amount
Employee's compensation in cash 1,215,696,307
Director's compensation 27,779,785
There was no difference between the actual distribution amount and the recognized amount in 2019.
(IX) The situation of the Company's repurchase of its own shares in the most recent year and up to the publication
date of this Annual Report:
February 25, 2020
Batch Order of Repurchase The Third Time (batch)
Purpose of Repurchase Shares Transferred to Employees
Repurchase for Period Sep. 17, 2019 - Nov. 4, 2019
Repurchase price range (NT $) 5.71~11.84
Shares types and quantities of Repurchased(shares) 125,000,000 common shares
Amount of the Share Repurchased (NTD) 1,013,422,848
Ratio of bought-back quantity to planned Repurchased quantity (%) 100
Number of cancelled and transferred shares 0
Accumulated quantity of the Company’s shares held (Shares) 125,000,000
Percentage of total company shares held (%) 1.30

AU Optronics 2019 Annual Report
56
II. Corporate bond processing (including outstanding and corporate bonds in progress) (I) Information regarding Ordinary Corporate Bonds: None.
(II) Information regarding the Conversion Bonds: None
(III) Information regarding the Exchangeable Bonds: None.
(IV) Information regarding Shelf Registration for Corporate Bonds: None.
(V) Information regarding Corporate Bonds with Attached Warrant: None.
III. Handling of preferred shares (including preferred shares outstanding and in process) (I) Handling of preferred shares: None
(II) Information regarding preferred shares with attached warrant: None.
IV. Handling of overseas depositary receipts (including overseas deposit receipts that have
participated in the issuance and have not been fully redeemed and overseas depositary
receipts that have still been processed)
Date of issuance (placement) 05.29.2002/ 07.31.2003/ 06.23.2004/ 07.12.2004/ 07.22.2005/ 08.26.2005/ 08.30.2006/
10.01.2006/ 09.06.2007/ 08.22.2008/ 09.09.2009/ 05.07.2013 (Note 1)
Issuance and trading place U.S. OTC market (Note 2)
Total Issued Amount (US$) 1,996,807,815
Unit Issue Price (US$) 11.57; 16.00; 15.35; 4.4
Total number of issued units (units)
as of February 15, 2020 51,036,874 (Note 3)
The source of securities represented Common shares of the Company
The amount of securities represented (shares) as
of February 15, 2020 510,368,769 (Note 3)
The rights and obligations of holders of depositary
receipts Rights and obligations are the same as common shares
Trustee N/A
Depository institutions Citibank, N.A.
Custodian Citibank Taiwan Ltd.
Outstanding amount (US$)
as of February 15, 2020 44,073,132
The allocation methods on the relevant costs
incurred as a result of the issuance and during the
effective period.
The issue-related expenses were proportionally allocated by the Company and the
selling shareholder according to the actual number of shares sold. After the issuance,
except where otherwise agreed by the Company and the Depositary, the costs of all
overseas depositary receipts shall be borne by the Company.
Important Agreements for Depository and
Custody Contracts Details such as depository and custody contracts
Market Price
Per unit (US$) 2019
Highest 4.23
Lowest 2.16
Average 3.09
As of February 25,
2020
Highest 3.76
Lowest 3.13
Average 3.42
Note 1. 07.31.2003, 07.12.2004, 08.26.2005, 08.30.2006, 09.06.2007, 08.22.2008, and 09.09.2009 : The issuance of new shares through
capital increase by retained earnings. 10.01.2016: The new issuance resulted from merging with Quanta Display Inc.
Note 2. From October 1, 2019, the Company's ADSs have been delisting from the New York Stock Exchange to the U.S. over-the-counter
market for trading.
Note 3. Per FSC's directive, with respect to the Company’s ADSs, no additional re-issuance after redemption of the Company’s ADSs will
be permitted beginning from New York time December 3, 2019, and the permitted number of the Company’s outstanding ADSs
in the U.S. over-the-counter market is capped at the total number of ADSs issued by the Company on New York time December
2, 2019.

AU Optronics 2019 Annual Report
57
Capital Overview
V. Employee stock option handling status: (I) As of the publication date of the Annual Report, the processing situation and impact on shareholders' right
from employee stock option that have not matured yet: None.
(II) Names, acquisition, and subscription of managers who have obtained employee stock option as well as
employees who rank among the top 10 in terms of the number of shares obtained via employee stock
option, cumulative as of the date of publication of the Annual Report:
1. The Company has not issued employee stock options.
2. However, the Company was merged with Quanta Display Inc. on October 1, 2006, and the employee
stock options that were issued separately on August 8, 2002 and December 31, 2003 were assumed
by the Company. As to the aforesaid employee stock option, its outstanding units on the combined
base date and its subscribable shares were 1,861 thousand shares and 5,631 thousand shares
respectively, which have separately reached expiration on August 7, 2008 and December 30, 2009.
The aforementioned employee stock option holders had exercised their rights and obtained 1,679
thousand and 1,962 thousand shares from the date of merger until expiry dates. The subscription
amount were NT$63,866 thousand and NT$98,155 thousand, respectively.
VI. Operations of new restricted employee shares (I) As of the date of publication of the Annual Report, new restricted employee shares that have not fully met
the conditions and the impact on shareholders' right: This is not applicable as the Company has not issued
new restricted employee shares.
(II) Names of managers and top 10 employees holding new restricted employee shares as of the publication
date of the Annual Report and the conditions of receiving such shares: Not applicable.
VII. Issuance of new shares in connection with the merger or acquisition of other corporations (I) In the most recent year as of the publication date of the Annual Report, the Company has completed
merger or acquisition of other corporations to issue new shares: None.
(II) In the most recent year as of the publication date of the Annual Report, the Board of Directors of the
Company has approved merger or acquisition of other corporations to issue new shares: None.
VIII. Implementation status of fund application (I) As of one quarter before the publication date of this Annual Report, plan for previous issuance or private
placement of securities that have not been completed, or that have been completed but no benefits
achieved within the past three years: None.
(II) As of one quarter before the publication date of this Annual Report, processing condition for previous
issuance or private placement of securities that have not been completed, or that have been completed
but no benefits achieved within the past three years: Not applicable."

AU Optronics 2019 Annual Report
58
Chapter 5 Operational Highlights
I. Business Activities (I) Business scope:
As a global leader in optoelectronic solutions, AU Optronics leverages its solid foundation of R&D and
manufacturing of displays, providing display products coved all kinds of applications and smart integrating
software and hardware. At the same time, it extends its core expertise to enter new business areas, such
as solar, smart retailing, general health, circular economy, and smart industrial services. The turnover of
display products in 2019 accounted for approximately 95.5% of the consolidated turnover.
Concerning the main business scope of the Company's subsidiaries, please refer to the basic information
of the affiliated companies in Chapter 8 Special Disclosure (Pages 88-90) of this Annual Report.
(II) Industry Overview
1. Current status and development of the industry:
The mainstream in the current flat display industry is still TFT-LCD. With the technological advantages, wide
application range, and economies of scale, TFT-LCD caters to the need of the digital era for comprehensive
information products and consumer electronic applications.
Tracing back the history of TFT-LCD industry development, one can notice its industrial cycle and its capital-
and technology-intensive characteristics. At present, the world's major TFT-LCD producers include Taiwan,
South Korea, Japan, and mainland China. According to a survey conducted by Witsview, a market survey agency,
Taiwan and mainland China are the world's top two TFT-LCD manufacturers in 2019 in that the two’s market
share of large size (Note) panel shipments is approximately 33.4% and 42.1%, respectively.
With the popularization of comprehensive digital information-based and consumer electronics-based products,
TFT-LCD stands as a crucial component and has taken a strategic position in the flat panel display supply chain.
It has led the industry in terms of upstream material components and their corresponding technological
advances. Furthermore, it has lent support to the information electronics industry around the world to expand
its downstream application market. Since TFT-LCD businesses started mass production in Taiwan, the synergistic
effect of the industry has prompted robust development in local industries in related upstream materials and
component businesses.
2. Relations among upstream, midstream and downstream industries
Upstream industry Glass substrates, color filters, polarizers, driver ICs, printed circuit boards, backlight
modules, liquid crystals, and so on
Midstream industry Liquid crystal display panels, liquid crystal display modules, etc.
Downstream industry LCD TVs, tablets, notebooks, desktop monitors, mobile phones, commercial displays,
and other electronic products
3. Various trends of products:
TFT-LCD production technology is now widely adopted in a variety of flat panel displays, including LCD TVs,
desktop monitors, notebooks, tablets, mobile phones, and displays for commercial use and other applications.
Moreover, as the trend for service convergence continues to cultivate the integration of related products,
demand also continues to grow for novel features of mobile device panels such as wider viewing angles, higher
resolution, lightweight and energy-saving features, and touch controls. Meanwhile, in response to the popularity
of networking and smart features, multimedia entertainments are moving toward large-size, high-definition
panels with ultra-narrow bezels, which enable devices to transmit data without distortion in a smart streaming
environment. The development of various major applications is as below:
- LCD TVs and others
After the year 2000, LCD TVs have gradually become the mainstream in TV display technology. Their
strengths include thinner bezels and lightweight features, energy savings, and relative ease in coming in larger
sizes. After the next-generation TFT-LCD capacity gradually became available, large-size TVs have entered
mass production and prices have also become more affordable. By 2019, the average size of LCD TVs around
the world has exceeded 46 inches, and the mainstream TV size has gradually changed from 32 inches to 40
inches and then to 50 inches. This trend of increasing TV sizes is expected to continue in the future. As LED
(light-emitting diode) technology has matured, LED backlights have now completely replaced traditional
CCFL (cold cathode fluorescent lamp) TV backlights since they conserve more energy and are making TVs'
wight even lighter and bezels even thinner. Regarding the development of television software, the
introduction of smart TV with network features and embedded in value-added services platforms allowed
televisions not only to play TV shows but also to offer diverse functions for audio-visual interactive
entertainment. Under the canopy of the IoT, smart TV has now become one of the key focuses
of a digital home.
Demand for high-definition panels has been driven by the pursuit of a real-scene visual experience and better
visual quality on larger TV screens. This in turn has further stimulated the development of UHD 4K panel
Note: According to the definition of the Witsview report, “large size” denotes products such as tablets and notebook screens,
desktop displays, LCD TV screens and displays for public use.
AU Optronics 2019 Annual Report
59
Operational Highlights
technology (with a resolution 3840×2160) and a TV content ecosystem comprising shooting equipment,
image compression technology, and storage and transmission technologies. Since 2014, content providers
such as online streaming and satellite TV operators have begun to introduce UHD 4K digital content. Other
emerging LCD TV technologies including wide color gamut technology that increases color saturation,
curved designs that enhance an immersive experience, local dimming backlit modules that improve the
contrast ratio via local light modulation, HDR (high dynamic range) technology that makes dark details
clearer, and bezel-less technology that expands the visual range have been launched. When combined with
UHD 4K, these technologies can provide consumers with new experiences and interactions in games, movies,
sports, and other software applications, continuously driving LCD TV market growth momentum. The 2020
Tokyo Olympics plans to broadcast the events by employing 8K4K (resolution 7680x4320) technology. As
such, more 8K4K products will be launched in 2020, offering the ultimate visual experience for consumers.
Driven on one side by industrial and commercial video walls commonly used for transportation, surveillance,
and audio/ video control, and on the other side by the popularity of interactive multimedia machines and
advertising, large-size display demand is increasing. Comprehensive digitization of commodity advertisements,
catering, drive-thru, and various outdoor/ semi-outdoor signages are expected to come next. Such expansive
applications of public information displays, along with the IoT and cloud computing will open the door for
smart applications to step into people's daily lives. Given that people can now incessantly access public
information any time, this will further push demand for public information displays.
- Desktop monitors
The growing popularity of mobile communication development and mobile computing products has slowed
the market’s appetite for desktop monitors in recent years. In this way, product differentiation is the only
way going forward for desktop displays. That is to embark on the trend of integration of information products
and consumer electronics applications and develop high-resolution and high-definition desktop monitors
that can be used for work, entertainment and watching TV. On the other hand, applications that targeted
professional market segments, such as gaming products, high-definition display, and high refresh rate features
become important. On top of this, curve-contoured and bezel-less or 21:9 ultra-wide screens, whose designs
are based on ergonomics, are all for a better user experience.
- Notebooks and Tablets
Notebook products have continuously improved toward high performance and lightweight. Brands launched
ultra-thin notebooks aimed to break from previous designs, with novel features such as fast response time,
longer battery life, and lightweight. Touch-embedded notebooks with a stylus, or 2-in-1 notebooks that have
the features of a tablet, also penetrated into the high-end or commercial market. Premium notebooks, and
the gaming notebooks with a high-resolution display, large size and high refresh rate mentioned earlier, will
be the main growth segments of notebook product.
Tablets have changed the user's interface experience due to numerous embedded applications and a well-
developed ecosystem to support mobile entertainment and fast Internet access. In addition, their lightweight,
energy-saving, and high mobility features also played a role in driving up a high demand within just a few years.
However, the tablet market has significantly declined in recent years due to the increasing popularity of
larger-screen mobile phones, low-priced notebooks, and 2-in-1 notebooks.
- Mobile phones and related products
Mobile communication technology has been evolving. High-speed, high-definition video/audio services that
were initially provided in 2009 have now attracted investment from a wide base of global telecom operators.
In addition, the popularity of mobile network allows mobile application panel shipments to keep the leading
position among small-medium size panel applications To satisfy consumers' increasing need for mobile
telecommunications, Internet, and entertainment, specifications of cell phones have developed from
hardware allocations with simple functions, to today's smartphones with enriched hardware and software
with complete ecosystems. The average size of screens has grown from 1 to 2 inches to today's mainstream
6 inches or above. After 2017, manufacturers have also been pursuing higher screen-to-body ratios, moving
from the original 16:9 to 18:9, or 19.5:9. In addition, nearly full-screen phones are also being achieved through
notch and drilling techniques. With the emergence of visual needs for instant high-quality videos, cell phone
vendors have also launched phones with UHD 4K high definition after 2015, so that consumers can view 4K
media content directly from their smartphone screens.4G5G
Smartphones have now become a necessity for consumers. According to the market survey agency, the
annual growth rate of mobile phone shipments in major markets, such as North America, Western Europe,
and Mainland China has dropped to a single digit or even a negative number. Despite that, the markets are
moving towards a high-end direction. As such, the replacement of the vast existing smartphones will be the
spotlight for the markets. In terms of emerging markets, the penetration rate of smartphones is still low.
Consumers in certain countries still mostly prefer feature phones; therefore, the transition from feature
phones to smartphones will be the main growth driver for emerging markets.
- Commercial displays and others
Commercial displays cover a wide range of applications, including automotive dashboards, industrial
computers, medical equipment, ATMs, point-of-sale systems, and arcade games. With the rise of cloud
computing, the market size of commercial displays keeps growing.

AU Optronics 2019 Annual Report
60
In the past, interior dashboards in vehicles were designed with buttons and knobs and shown by pointers.
However, the demand for TFT-LCD panels has increased with the digitization of the interior information
system. Multiple display panels thus will be adopted for every car. For example, a touch-embedded panel can
be introduced in the center console to play audio-visual programs and control air-conditioner and seats, and
other related functions. Large-size and high-resolution panels that integrate navigation, speedometer, and
engine-related information can also be applied in the dashboard.
In the past, wearable products tended to focus their own application on health and personal life management.
Now they are refined by prestigious electronics manufactures, who have launched watches and wristbands,
among other products, that can go with APPs to be used for online payment and identity confirmation, and
by prestigious fashion designers and traditional watchmakers, who have provided more fashionable and
exquisite exterior designs; the trend goes on to include interactive audio system, which facilitates the
convenience and diversification of product application. Separately, virtual reality products have gradually
boomed owing to more and more applications in games, shopping, and media entertainment. A head-
mounted display could introduce users to a reality-like experience. Associated business opportunities are
waiting for another surge when wireless transmissions and IoT become more mature.
Other applications include industrial computers, programmable logic controllers (PLC), medical equipment,
automated teller machines, point-of-sale systems, and arcade games, which gradually substitute TFT-LCD
panels for the old, monotonous and inconvenient method of using signals, negative film, paper, and physical
institutions to indicate a large amount of information. As cloud computing and IoT technologies are reaching
maturity, more and more applications and devices have begun to stream and share information with each
other. To allow people to access information any time in their daily lives, displays will be used in more facilities
everywhere.5G
4. Competitive situation
TFT-LCD is one flat panel technology and is the mainstream technology in the current market. At present, the
global TFT-LCD manufacturers are mainly China’s BOE, CSOT, Tianma, and other panel factories, South Korea’s
SDC and LGD, Taiwan’s AU Optronics Corp, Innolux, HannStar and Japan’s SHARP and JDI.
Those manufacturers in recent years had different focus when it came to the large-size panel market. Korean
manufacturers turned their focus to AMOLED panel technology development and production and shut down
several old TFT-LCD production lines. Japanese manufacturers invested in small-medium size panels instead.
Manufacturers in China continued to set up high-generation TFT-LCD production lines, but their major sales
were still large-scale commodity panels, and the range of their size being rather restricted due to the relatively
concentrated fab generation lines; nonetheless, they had actively set up AMOLED panel fabs. Meanwhile, given
limited growth of production capacity, Taiwanese manufacturers have continued to launch panels of
differentiated sizes and technology-intensive products.
As for the small-and-medium-sized product market, seeing that smartphones have evolved toward high screen-
to-body ratio, larger size, higher resolution, Notch design, lightweight, and low power consumption features,
various panel makers have allocated production capacities on low-temperature polycrystalline silicon (LTPS)
and AMOLED. While Korean manufacturers have focused on setting up AMOLED production lines, Japanese
and Taiwanese manufacturers have increased more production capacity in LTPS. Separately, manufacturers in
China have increased capacities for both.
Currently, competition in the panel industry has shifted from capacity expansion to new technologies and high
value-added products such as UHD 4K/ 8K 4K resolution, curved desktop displays, or bezel-less TV panels.
These production technologies require a longer learning curve but can satisfy the diverse needs of consumers
and potentially create higher value.
(III) Technology and R&D overview
AUO has continued to push our innovative R&D capacity. In 2019, we demonstrated our latest innovations in major
exhibitions and were recognized with many awards. Our major products and technologies are stated as follows:
⚫ 8K HDR TV panels
In order to grab the business opportunities of broadcasting the 2020 Tokyo Olympics and to embark on the
global sales trend of large-size TVs, brands having adopted AUO 8K panels in their products have gone on the
market beforehand. However, AUO is the first in the industry with the ability to mass produce ultra-large 8K4K
TV displays. AUO’s 85-inch 8K bezel-less ALCD TV display possesses advanced HDR technology which increases
dimming zones up to 1,024 zones and offers peak brightness up to 2,000 nits with strengthened local dimming
effect. Equipped with ultra-high-density LED backlight modules, this advanced display presents the most optimized
colors, contrast, and details in every scene. With the highly-detailed image quality of over 33 million pixels, viewers
feel as if the objects on-screen are real in this immersive sensory experience. Through its ultra-high resolution
and highly-detailed image quality, the 8K HDR TV display demonstrates AUO’s solid technology leading position
in the industry.
⚫ Comprehensive high-end Mini LED displays
AUO also unveiled a series of displays with Mini LED backlight technology. The applications include various sized
gaming devices, from large-sized monitors and desktop monitors to laptops, and even high-end applications such
as VR headsets and smart vehicles.
We have launched a 17.3-inch 4K LTPS gaming laptop panel with a maximum brightness of more than 1,000 nits,

AU Optronics 2019 Annual Report
61
Operational Highlights
which qualifies for the highest level of VESA Display HDR1000. The module thickness is only 3.5 mm, which is
portable and conducive to players' enjoyment of the game.
For VR headset applications, AUO’s 2.9-inch LTPS display with active-matrix Mini LED backlight module design
presents 2,304 dimming zones and an ultra-high pixel density of 1,688 PPI, offering exceptionally realistic VR
experiences with high dynamic images. AUO’s Mini LED backlight technology also extends to vehicle applications.
The 12.3-inch LTPS curved cluster panel has a high resolution and smooth 750R curved design and offers
excellent local dimming capabilities with 1,000 nits ultra brightness to display sharp and detailed images.
⚫ Vehicle display panels
As smart vehicles and autonomous car technologies continue to evolve, HMI systems for vehicles are becoming
smarter and more personalized. Vehicle interiors are also turning away from traditional mechanical designs and
showing more flexibility. Larger display screens allow the driver to access all vehicle functions on one screen, and
AUO has developed high-performance automotive displays with multiple panel laminations, such as the joint
12.3-inch CID and 20.3-inch passenger display panel which provides high brightness and high-resolution images
and a streamlined 1,200R curvature design. AUO’s 13.3-inch CID panel features an in-cell touch solution
integrated with TDDI IC, resulting in a thinner display and a tightly-joined interior arrangement. The display area
has three holes for buttons or knobs, offering more design possibilities for a more intuitive and convenient driving
experience.
AUO has expanded its IoV system integration capabilities from vehicle display modules to system integration
services. AUO provides comprehensive vehicle display solutions that integrate dashboard systems, display
interfaces, and back-end code design. AUO’s 7-inch smart dashboard integrates a high-resolution full-color display
and automotive-grade SOCs into a system-level product, that has been successfully implemented by AUO with
a European premium motorcycle brand. Another smart dashboard system featuring a multi-color LED digital
display with advanced MCUs has also been adopted by an international electric scooter brand. By offering a one-
stop shop for software and hardware integration and development services, AUO continues to create additional
value for IoV systems and provides users a safe and smart riding experience.
⚫ Smartphone displays
To provide the best mobile user experience possible, AUO is dedicated to enhancing both the performance and
appearance of smartphone displays. AUO has launched a 6-inch full-screen in-display LTPS fingerprint scanning
panel, which is the world's first (Note) to build the optical sensor in the LCD panel for scanning fingerprints and
equipped with AHVA technology, full HD+ (1080 x 2160) resolution, and 403 PPI pixel density. Also, the full-
screen scanning area has 403 PPI pixels and 30 ms swift sensor response time, exhibiting the smoothest and
most accurate sensing performance possible on a smartphone.
The 6.2-inch in-cell touch LTPS LCD sports the world’s smallest (Note) through-hole design. At merely 4.2 mm,
the tiny drill hole is barely noticeable on a 21:9 full HD+ (1080 x 2520) screen, whose cinemascope aspect ratio
combining AHVA technology is a perfect choice for film enthusiasts to entertain themselves on the move.
Also applying the AHVA technology, the 6.3-inch in-cell touch LTPS LCD has full HD+ (1080 x 2304) resolution
and possesses the world’s narrowest (Note) 1.0 mm bottom border, which is around 40% narrower than that of
its counterpart in the market, making it a true work of art to marvel at with equally narrow border on all four
sides of the display.
⚫ Medical display panels
As the world’s population continues to increase and age, the demand for medical display equipment in various
areas is expanding rapidly. AUO’s comprehensive portfolio of medical displays supports a multitude of
professional medical devices in many areas, including ultrasound, imaging modality, endoscopic and surgeries. For
instance, AUO has showcased medical display panels of 23-inch, 27-inch, and 32-inch.
AUO’s 23-inch ultrasound display offers an exceptionally high contrast ratio of 2,200:1 and a wide viewing angle
with ultra-low color washout in a dark room to reveal extremely delicate grayscale shadings even in rapidly
dynamic scans, that are crucial to assist doctors in conducting precise diagnoses. Also, AUO’s bezel-less 27-inch
medical panel equipped with blue light filter properties incorporates QHD resolution and AHVA (Advanced
Hyper-Viewing Angle) technology to present high-quality professional medical images. Furthermore, AUO’s 32-
inch 4K high resolution surgical display supports 100% Adobe wide color gamut technologies, which provide
meticulous presentations of different layers and shades of the color red, which is crucial for surgeries. The realistic
colors and details on the monitors are a great help for surgeons who need to make timely and accurate medical
diagnosis.
⚫ Advanced reflectionless technology
For art galleries and professional showcasing scenarios, AUO specifically designed a series of advanced
reflectionless technology (A.R.T.) displays that can reduce light reflection and glare from ambient lighting and
present excellent image quality under complex illumination conditions. The complete lineup of 75-inch 8K, 32-
inch 4K, and 17-inch square 2K displays, incorporated with high resolution, high contrast, and color performance,
delivers the most authentic and exquisite image details and will be nicely implemented at art galleries and other
artwork showcasing venues.
⚫ Ink Jet Printing OLED display technology
OLED display has the advantages of high resolution, wide viewing angle, high contrast, and fast response time
Note: This is the market information available for the Company as of December 31, 2019.

AU Optronics 2019 Annual Report
62
that can create outstanding image quality. Overcoming material and equipment limitations, AUO takes the lead
in the industry to launch a 17.3-inch UHD 4K Ink Jet Printing (IJP) OLED display with high pixel density of 255
PPI which can offer excellent image quality and dynamic motion pictures; it also integrates high brightness, 120
Hz high refresh rate, and wide color gamut to deliver rich depth, bright color, as well as sharp and smooth details.
With a more cost-competitive manufacturing process, AUO pioneers the IJP OLED display technology
development, setting a milestone and securing its leading position in the display industry.
⚫ Foldable AMOLED touch display technology
AUO has long invested in flexible AMOLED display technology and accumulated many proprietary manufacturing
processes, materials, and panel design know-how. AUO will showcase its 5.6-inch foldable AMOLED touch panel
that can be folded inwards or outwards for a customized design according to client requirements. Using a plastic
substrate and integrated with AUO’s proprietary flexible touch panel, the foldable AMOLED technology can still
present outstanding image quality even at 4mm folding radius and can be continuously folded over 200,000 times,
creating infinite possibilities for mobile devices.
Solar power technology R&D
AUO is committed to providing solar module products of high-efficiency, high-quality, and high-reliability, as well as total solutions for
solar power stations. In 2019, we have continued to enhance the power of monocrystalline silicon modules. We have also enhanced
power plant monitoring and maintenance information systems to realize the Company's commitment to green energy through
differentiated product design and comprehensive value-added services.
⚫ High-performance solar module technology
AUO is the first in Taiwan to mass-produce multi-busbar module products. We further utilize the high-efficiency half-cut cell
module technology to increase the module's photovoltaic power output. A 60-cell module can produce power up to 350 watts.
At the same time, the circuit layout of the half-cut cell module can effectively reduce the hot spot temperature of the module and
improve the power performance when the module is partially shaded by such as fallen leaves in the environment.
⚫ Comprehensive solar power plant services
AUO has abundant experience in power plant planning and construction and provides a full range of power plant construction
services. We combine high-efficiency modules and our diversified capabilities and resources to provide services such as power
plant development, EPC engineering solutions, and maintenance services as per clients’ needs. AUO’s comprehensive solar power
plant solution can meet the different needs of rooftop, ground-mounted, and floating power plants. Aside from creating excellent
energy efficiency for customers, the innovative plant platform establishes a compound application, which merges solar farm with
traditional agricultural, fish-farming, and livestock-farming fields, and the concept of a green plant. By doing so, AUO innovates a
new model of power plant operation and builds up a customized power plant, so as to create a win-win situation for sustainability
and the environment.
AUO uses IoT technology to integrate power plant data. With the introduction of artificial intelligence, we provide a
comprehensive and cross-platform solution for monitoring and intelligent maintenance. In addition, we collect field data before
and after the power plant is built for system diagnosis, planning, analysis, and long-term maintenance, so as to optimize the cost
and efficiency of power generation.
⚫ Energy generation and storageintegrated technology platform
In response to the developing trends in green energy, AUO plans to engage in the application of energy storage systems and
develop a platform that kneads power generation technology with energy storage technology. In the future, we will provide
integration and development of customized energy storage system as per the needs of each project.
AUO's consolidated R&D expenditure in 2019 was NT$9.8 billion. By the end of January 2020, the R&D expenditure was NT$800 million. As always,
AUO continues to invest in advanced technologies and utilize them to improve its existing production capacity to strengthen AUO's competitiveness
in high-end and new applications market. As of December 31, 2019, AUO has filed for applications of 26,400 patents and has cumulatively obtained
19,400 patents worldwide. In terms of R&D patents, 97% of our patents are invention patents. The Intellectual Property Bureau of the Ministry of
Economic Affairs announced the ranking of patent applications and certification in 2019. Among the application of all three kinds of patents, namely
invention patents, utility model patents, and design patents, the Company ranked first in patent certification and third in patent applications among
domestic corporates. AUO's great efforts in proprietary technology and strategic deployment in patents have once again solidified our leadership
position in flat panel displays.
In 2020, the Company expects to invest about NT $ 10 billion in research and development, subject to timely adjustments based on global market
conditions and the Company's actual operating situation. AUO's major future R&D projects are summarized as below:
Project Title Descriptions Current
status
Expected mass
production time
(Note)
Success factors
High-End TV Panel
Display
For characteristics of the high-end 8K displays,
namely large-size, ultra-narrow bezels, high
brightness, low reflectivity, and high contrast, we
have steadily improved them to satisfy the high
resolution demand in both bright and dark viewing
environments. In addition, with minimal and
differentiated appearance, we have also developed
corresponding technologies.
Under
development
2020 1. AUO independently develops new
product architectures and new
manufacturing process
technologies and works with key
material suppliers to develop key
materials.
2. Complete technical planning and
patent certification, achieving

AU Optronics 2019 Annual Report
63
Operational Highlights
Project Title Descriptions Current
status
Expected mass
production time
(Note)
Success factors
technological and product
differentiation, thereby improving
the added-value of products.
Public Information
Display Technology
Continue to develop application display technology
with high reliability, high brightness, and special
shapes to satisfy the different application
environments for both indoors and outdoors.
Under
development
2020 Developing proprietary new pixel
designs by collaborating with suppliers
to improve material properties and
through internal processing
optimization.
Mobile Device Display
Technology
Continue to develop high-resolution, ultra-light,
ultra-thin, and ultra-narrow bezel LTPS panels that
include properties such as high
Under
development
2020 The 6th-generation LTPS fabs continue
to optimize the process, coupled with
product innovation design, and
cooperation with suppliers to develop
new Mini LED products for high-end
product models.
AMOLED Technology Inkjet and flexible AMOLED technologies have
been continuously developed to increase cost
competitiveness and meet different usage
scenarios.
Under
development
2021 By integrating key equipment and
cooperating with material suppliers,
AUO verifies the feasibility of
optimized mass production with
proprietary technology.
Bifacial-type PV
Module
Developing bifacial-type high-power PV module
products.
Under
development
2021 1. Package design and reliability of
bifacial-type modules.
2. Simulating the power generation
gain and integration optimization of
the bifacial-type module in the
system.
Construction of a pilot
site of integrating
energy generation and
storage.
Build an integrated energy generation and storage
software platform on a pilot site where solar
power and energy storage systems are connected.
Under
development
2021 1. Independent R&D capabilities in
energy management.
2. Proficiency in product development
of energy storage systems.
Note: It refers to the expected mass production time. The actual production time is subject to the needs of the market and of customers.
(IV) Short/ long-term business development plans
As a leading TFT-LCD manufacturer in Taiwan, AUO is dedicated to applications such as LCD TVs, desktop
monitors, notebooks, tablets, mobile phones, commercial displays, and other small-and-medium-sized
displays.
In terms of AUO's short-term business development plan and capacity expansion, AUO will invest in
increasing quality production capacity. Such capacity enhancement plans include the new 6th Gen LTPS fab
in Kunshan, China, which can provide the capacity of 25,000 base panels starting from 2017. Moreover, the
new 8.5-Gen fab in Houli, Taichung has reached the maximum production capacity of 27,000 base panels
in 2018. We hope to further improve our profitability by increasing the capacity of advanced quality
production. In terms of products, AUO will combine a-Si TFT and LTPS TFT with innovative technology
and product design, to produce competitive value-added products. Applications to large-sized products
include high resolution, curved products, wide color gamut, high dynamic range, and bezel-less design.
Among the small-and-medium-sized products are high-end mobile phone panels with FHD, WQHD
(resolution 1440x2560), UHD 4K and multiple screen-to-body ratios, high-resolution automotive
dashboard panels, notebook panels, as well as solutions for low reflectivity and on-cell touch panel, and so
on. Besides, AUO also has completed generation production lines that provide clients with diverse
products of various sizes. AUO is determined to satisfy clients' requests for instant supply. It will keep
strengthening strategic alliances with clients, creating a win-win situation. In this way, AUO continues to
lead in a pivotal position in the panel supply chain.
As for long-term business development plans, apart from developing process capabilities and advanced
display technologies such as AMOLED, Mini LED, and Micro LED, AUO will continue putting resources into
R&D to foster its ability for technology innovation, with a view to leading the position in cutting-edge
technology. Furthermore, AUO has a comprehensive plan of leveraging patents as a technical barrier against
competition, as well as a solid support to branded customers for business expansion across the world. In
terms of products, AUO will emphasize more on value chain integration and value-added product
improvement, in order to provide customers with more value-added solutions and services with its
product development ability in a flexible way. Product differentiation, quality enhancement, and value-added
features will continue to play a role in AUO's long-term competitiveness. For long-term business
development plans in response to each product development trend, please refer to the section of Various
AU Optronics 2019 Annual Report
64
Trends of the Products Development in Chapter 5 Operational Highlights in this Annual Report. (pages
60-63)
II. Markets and Overview of Production and Sales (I) Market analysis
1. Regions of major sales:
The clients of AUO comprise global IT, consumer electronics, and industrial electronics manufacturers, among
which are internationally renowned brands and system integrators or system vendors. Therefore, the TFT-LCD
products are well sought-after in a wide range of markets, from Asia, the United States, and Europe, to emerging
markets.
2. Market share
According to the Witsview survey, the top five global TFT-LCD large-sized panel shipment manufacturers in
2019 are BOE, Innolux, LG Display, AU Optronics, and Samsung Display, accounting for approximately 28.5 %,
17.2%, 15.3%, 13.6%, 5.7%. of global market shares.
The panel display industry has turned from scale competition to value competition, and AUO has been deeply
engaged in high-value-added products. According to Witsview, a market research agency, the top three
manufacturers of notebook computer panels in the world in 2019 are BOE (29.5%) and AUO (23.3%) and
Innolux (20.9%); in terms of large-size 8K TV panel shipments, the top two manufacturers are Samsung Display
and AUO; in terms of desktop display panel shipments, the top four are BOE (24.5%), LG Display (22.1%), AUO
(17.8%) and Innolux (16.4%). According to the OMDIA, the top three of automotive panels in the world in 2019
were Japan Display Inc. (15.8%), Tianma (14.4%), AUO (14.0%)
3. Future market supply/ demand and growth
According to the market survey agency, Witsview, the overall demand for TFT-LCD panel area grew by 3.3% in
2019. Boosted by the recent increase in the average size of application panels, the market demand for large-
sized panels has continued to soar. The demanded panel area is estimated to grow by 3.9% in 2020. The TFT-
LCD industry performance is closely tied to the end market of electronic products such as TVs, desktop
monitors, notebooks and tablets, mobile phones and commercial displays, and so on.
The overall output volume in 2019 was approximately 227 million panels, and the volume is expected to have
a mild increase in 2020. As LCD TVs are becoming increasingly affordable, consumers are more willing to
purchase TVs with larger sizes and higher resolution. As for the mature PC market, a prolonged replacement
cycle has hindered consumer demand. However, operating systems upgrades have started to provide incentives
for enterprises to replace machines. Such commercial demand is expected to carry on in 2020. Among them,
the total output delivery volume of desktop displays in 2019 was approximately 140 million units, and is
expected to remain constant, or have a mild decrease, in 2020. Nevertheless, the ratio of desktop panel displays
has shown a steady increase. For notebooks, the total shipment volume in 2019 was approximately 161 million
units and is expected to increase to 162 million units in 2020, thanks to the replacement of machines due to
operating system upgrades. The demand especially among high-end notebooks, which are ultra-light, of ultra-
low power consumption, continues to grow. In addition, 2-in-1 products that function both as tablets and
notebooks are also continuing to grow year over year. As for mobile phones, smartphones are advancing toward
larger size, higher resolution, and higher screen-to-body ratio. The total shipment in 2019 was approximately
1.36 billion units and is expected to return to positive growth in 2020.
From the perspective of the panel supply side, according to data from Witsview, a market survey agency, display
high generation lines were continuing to be launched in 2019, resulting in that the annual growth rate of the
TFT-LCD industry's production capacity area is still greater than the annual growth rate of product demand
area. Despite the industry ’s increasing capacity of the high generation line, some generation lines were shut
down, and thus It is expected that the growth rate of capacity area in 2020 will be lower than in 2019. In addition,
various applications are developing toward higher-value products, including higher resolution, lighter weight
design, on-cell touch panels, and software/hardware integration systems. Judging from the market supply and
demand, the success in industrial competition no longer depends on expanding production capacity but requires
combining technology and the ability to integrate product values.
4. Positive/ negative factors of competitive niches and long-term development, and the countermeasures thereof
1) Competitive niches
⚫ Technology and product strength: In the face of the increasing complexity in industrial competition,
AUO will continue to focus on improving the existing technologies and innovating new ones. Other
focuses include product quality upgrades and new product development, such as on-cell touch panels,
high-resolution panels, curved displays, and commercial displays. By providing differentiated products
of higher added-value, AUO aims to strategically raise the bar for the competition.
⚫ Talent, R&D capability and patent quality: AUO continues to pour R&D resources into cultivating
technical talent. Its long-term accumulated R&D and manufacturing experience helps to effectively
mitigate the learning curve for new products. Moreover, AUO's long-term strategic layout in patent
quantity and quality also creates a sufficient reserve of technology capability to support the
superiority of its products.
⚫ Highly flexible management and production capacity: AUO is above the other competitors in terms

AU Optronics 2019 Annual Report
65
Operational Highlights
of cutting-edge technologies. It has complete generation lines at its back and is capable of
reconfiguring them to a maximal advantage in response to all kinds of products. In order to provide
cost-competitive products, AUO relies on a solid mass production experience along with complete
upstream-to-downstream industrial supply chain management to establish a comprehensive
integrated platform that covers marketing, product management, customer service, manufacturing
efficiency, yield quality, and material logistics management. This in turn creates higher customer value.
⚫ Full customer strategy: AUO is a professional panel manufacturer specializing in panel R&D and
production. Having no brands of its own, it strategically avoids direct competition with its customers.
Furthermore, AUO's ever-advancing technology appeals to first-line clients worldwide. At the
present stage, our customer base covers China, Japan, Korea brands, including system integrators
and clients from Europe, America, and emerging markets. In addition to completing our global
customer layout, we also achieved a balanced customer portfolio.
2) Favorable factors of development prospects:
⚫ High-resolution ecosystem: Consumers are requesting better viewing quality, an immersive
experience, and product design for large-sized display products. As the UHD 4K ecosystem around
the world is increasingly mature and in line with the development of 8K4K ALCD, AUO has launched
various UHD 4K/8K4K TV products with ultra high resolution, flexible screens, wide color gamut,
total flatscreens, and bezel-less features, providing a visual experience of virtually being inside the
screen and offering perfect images for consumers. This is helping AUO maintain our leading position
in the high-end product market. Demand for products such as desktop displays, notebook computers,
and smartphones is also emerging.
⚫ High-growth market: Some TFT-LCD related products still promise a high growth rate, such as
commercial displays, public information displays, and wearable devices. Small-volume but diverse
demands as well as high entry barriers characterize commercial displays. AUO has been cultivating
the commercial market for a long time, as we clearly understand that customers value reliability and
long-term supply capability. This was the reason why AUO has been the first in a number of non-
consumer electronic fields, such as industrial computers, automated teller machines, point-of-sale
information systems, and arcade games. On the other hand, AUO has enjoyed a leading market share
in the steadily growing automotive market in recent years. In the meantime, we have also aggressively
expanded into the market of high-end, high-entry-barrier automotive panel products. AUO's
advanced integrated automotive touch panels combining full lamination have successfully broken into
the supply chain of major car manufacturers in Japan, Europe, the United States, South Korea, and
China. As for wearable devices that require thin, lightweight, and power-saving displays, AUO's
AMOLED, conventional TFT-LCD and transflective TFT-LCD technologies are all ready for mass
production. In particular, the AMOLED smart watch panel adopts the circular panel technology to
make the panel more circular in shape, allowing the watch brands more flexibility in design to satisfy
various customized demands.
⚫ Business opportunities of IoT: As business services are gradually launched, ultra-high reliability and
low latency communications are enabled through even more extensive network coverage and
support for even more effective data transmission. This in turn will help to expand and cater to
service application needs requiring both speed and stability. With IoT's trend, various connected
devices are rapidly increasing. Moreover, new business models and applications will possibly
accelerate development and bring about a more diverse and extensive application of displays. In
addition, various applications are demanding large sizes, which in turn will prompt the panel demand
area. AUO targeted smart manufacturing, smart home, smart retail, smart handheld and wear devices,
car, and medical care applications, by launching products with ultra-high resolution, curved surface,
wide color gamut, high dynamic range, on-cell touch, and other value-added applications. We greeted
the business opportunities of the IoT era by utilizing our integral strengths to enhance the value-
added and create high-valued differentiated products with technological diversity.5G
3) Unfavorable factors and countermeasures
⚫ Mainland China progressively expanding plants: In recent years, competitors in China have focused
on high generation production lines and have steadily expanded production capacities. This has
affected supply/demand conditions of the panel industry. It should be noted, however, that in the TFT-
LCD industry, production capacity is no longer the only competitive factor; equally important aspects
of business deployment include technology, management, operations, and clientele. To stand against
the challenge of capacity expansion, AUO will continue to leverage its technology and product
strengths, combined with technology, flexibility, patent quality, and a complete layout of clientele. Its
advanced technologies and differentiated products shall create greater value.
⚫ Consumer behavior is affected by the global economy: uncertain economic factors including trade
wars, the end of the quantitative easing policy, and the outbreak of COVID-19 in recent years have
affected overall consumer behavior. However, the progressively improving technologies, which have
produced more affordable products with high-resolution, high-definition images, may stimulate
another surge of product replacement in mature markets. By way of product diversification and

AU Optronics 2019 Annual Report
66
market decentralization, AUO will minimize the impact of economic fluctuations.
⚫ Numerous consumer product markets are reaching saturation: The demand for LCD TVs, tablets,
and smartphones has gradually saturated in developed markets. The overall shipment and growth
strength of panels have gradually slowed down as well. Yet, emerging areas including cloud
communication, big data and the IoT are soaring and promise business opportunities for new display
applications. In the future, demand for varied and customized displays will increase. AUO will
continue to upgrade our technology, striving to lead the position in image quality, design
differentiation and solutions. We will meet the technical requirements for new product trends with
our solid technical competencies.
(II) Important applications and production processes of the major products.
1. Important applications
TFT-LCD products are digital display devices used to transmit information. Their application is broad, and
includes commercial and industrial information displays, computers, telecommunication-related products, and
consumer electronic displays. With the market integration driven by the digital age, current major products of
TFT-LCD applications include LCD TVs, desktop LCD monitors, tablets, notebooks, mobile phones, car displays,
wearable devices. In general industrial and commercial areas, TFT-LCD related products include automatic teller
machines, vending machines, public information displays, other touch screen products, and portable electronic
devices.3C
2. Production process
TFT-LCD production process consists of three phases:
(1) Front-end array or TFT process: The process is similar to the semiconductor process, except that the
thin film transistor is fabricated on glass instead of a silicon wafer.
(2) Middle-end cell or LCD process: The previous array glass is used as a substrate to unite the color filter
glass substrate. The space between the two substrates is filled with liquid crystal.
(3) Back-end module assembly or LCM Process: This process consists of assembling the post-cell-process
glass with a variety of components such as backlights, circuits, and frames.
(III) Supply of primary raw materials
The TFT-LCD production process is relatively complicated and additionally requires numerous raw
materials and components. The primary raw materials and key components include glass substrates, driver
ICs, polarizers, backlit modules, liquid crystals, printed circuit boards, color filters and flexible printed
circuits, and so on. AUO has always maintained a good working relationship with domestic and overseas
raw material suppliers. For key materials and components, it retains more than two suppliers to remain
flexible with procurement and disperse the risk of excessive purchase concentration.
(IV) A list of any suppliers and clients accounting for 10% or more of the Company's total procurement (sales)
amount in either of the two most recent fiscal years; the amounts bought from (sold to) each; the
percentage of total procurement (sales) accounted for by each; and an explanation of the reason for
increases or decreases in the above figures.
1. Major Customer for the past two years
Unit: NT$100 million
Year
Item
2019 2018
Customer Amount
Ratio to
annual net
revenue (%)
Relationship
with AUO Customer Amount
Ratio to
annual net
revenue (%)
Relationship
with AUO
1 Samsung 331 12.3 - Samsung 354 11.5 -
2 Others 2,357 87.7 Others 2,722 88.5
Net revenue 2,688 100.0 Net revenue 3,076 100.0
Reasons for change: Mainly due to the product assortment.
2. Major purchasers for the past two years
No purchases from any single vendor in 2018 and 2019 accounted for 10% or more of net purchases;
hence this is not applicable.
(V) Production value and volumn for the past two years
Unit: NT $ 100 million; 1,000 pieces
Year
Main
products
2019 2018
Production
Capacity (Note)
Production
Quantity
Production
Value
Production
Capacity (Note)
Production
Quantity
Production
value
TFT-LCD 13,085 238,455 2,260 12,907 288,702 2,365
Others - - 85 - - 136
Total 13,085 238,455 2,345 12,907 288,702 2,501
Note: Calculated by Glass substrate (mother glass).

AU Optronics 2019 Annual Report
67
Operational Highlights
(VI) Sales volume and value for the past two years
Unit: NT $ 100 million; 1,000 pieces
Year
Main
products
2019 2018
Domestic sales Export sales Domestic sales Export sales
Volume Value Volume Value Volume Value Volume Value
TFT-LCD 70,084 743 169,174 1,717 95,889 892 185,498 1,911
Others - 73 - 155 - 113 - 160
Total 70,084 816 169,174 1,872 95,889 1,005 185,498 2,071
III. Employee Information Fiscal Year As of January 31, 2020 2019 2018
Total number of
employees (persons)
Production 33,134 32,809 38,688
Technical 8,070 8,074 8,930
Sales and marketing 1,134 1,133 1,013
Management and
administrative 3,434 3,446 3,610
Total 45,772 45,462 52,241
Average age (years) 32.8 32.9 32.1
Average duration of service (years) 6.5 6.5 5.6
Educational distribution
ratio (%)
Director of
Philosophy 0.4 0.4 0.4
Master's Degree 13.1 13.2 12.3
Bachelor's Degree 36.8 37.1 36.8
Senior high school 32.3 33.7 31.7
Senior high school or
below 17.4 15.6 18.8
IV. Environmental Protection Expenditures Any losses suffered by the company in the most recent fiscal year and up to the annual report publication date
due to environmental pollution incidents (including any compensation paid and any violations of environmental
protection laws or regulations found in environmental inspection, specifying the disposition dates, disposition
reference numbers, the articles of law violated, and the content of the dispositions), and disclosing an estimate of
possible expenses that could be incurred currently and in the future and measures being or to be taken. If a
reasonable estimate cannot be made, an explanation of the facts of why it cannot be made shall be provided.
(I) Loss due to environmental pollution: None.
(II) Future countermeasures thereof and possible expenditures: AUO and subsidiaries have always put
emphasis on environmental protection work. Apart from internal pollution prevention and controls, all
types of business waste are to be re-used or processed by qualified manufacturers according to the law. In
the future, AUO will continue to reinforce educational training on the relevant laws/regulations and
declaration procedures.
V. Labor Relations (I) List of employee benefits, in-service training, internal training, retirement system, and implementation status,
as well as employer-employee agreements, and protection measures for employee entitlements:
1. Employee welfare measures
(1) Employees are entitled to labor insurance, National Health Insurance, and group insurance on the first
day of work.
(2) The Company has set up a benefits trust fund program, which inspires employees through linking long-
term benefit plans with the Company's operating performance.
(3) Apart from monthly salaries, annual bonuses such as those for the Mid-Autumn Festival, Dragon Boat
Festival and Lunar new year are also available. Motivation bonuses, performance bonuses, and employee
compensations are given in due course based on the Company's profitability.
(4) Staff restaurants are available at each fab site, providing breakfast, lunch, dinner, and late-night meals. Meals
are subsidized.
(5) Life plaza that comprises convenience stores, coffee shops, bakeries, fruit bars, and laundry shops is set
up within each fab. In addition, special sales events are also launched from time to time to provide
affordable daily consumption for our colleagues.
(6) The Company has set up a Wellness Center at each fab. A medical team of professional doctors and
nurses are in charge of the employees' well-being. Various health promotion activities are held to provide

AU Optronics 2019 Annual Report
68
comprehensive body, mind, and spiritual health care.
(7) Fitness center managed by a professional health management team is built at each fab. Apart from
permanent stadiums, fitness equipment, and sports classrooms, irregular courses are given at the request
of colleagues.
(8) AUO's Employee Welfare Committee is organized to take care of employees' lives, promote their
wellness, and maintain a harmonious labor-management relationship. The committee is responsible for
the planning and organizing of staff benefits and various activities such as sports seasons, celebration of
festival, club activities, and employee outings. Other benefits and subsidies include those connected to
emergency assistance, in-hospitalization, weddings, funerals and other events.
2. Employee training
Starting from the first day of work, new employees are given training programs. Through the Win Camp, they
are introduced to AUO's corporate guiding principles including the corporate social responsibility and related
policies.s. AUO University plays a central role in employee learning. Through the AUO Learning System (ALS),
every employee can participate in the various training courses and programs provided. AUO University plans
for training needed by each professional discipline to create a comprehensive talent development program.
AUO's employee training programs are as below:
(1) New recruit training: This training covers two stages. The first stage includes the official
environmental safety/health course, the corporate development direction,
management guidelines, and related policies. Also included are cultural
courses run by Win Camp to help newcomers quickly become familiar with
their colleagues and with the organizational culture and guidelines. The
second stage focuses on professional skills and knowledge corresponding to
individual job positions.
(2) Personal competency
development:
Classroom courses, which are based on the staff's common competency and
assisted through online learning, provide job-relevant management
knowledge and skills (e.g., cross-departmental communication, project
management, usiness-related skills, and legal knowledge). Selective advanced
courses are also given based on the employees' seniority.
(3) Professional knowledge
improvement:
In coordination with the Company's strategy, colleagues are sent to
participate in domestic/international industrial and management-related
seminars and forums. Training provided by the consultant companies and
manufacturers also help the Company promote technology, develop new
products, introduce innovative ideas, and improve management skills.
(4) External training program: In response to the needs of skills necessary in positions or the development
of professional ability from the staff, AUO provides the information on
external training programs to help improve the staff's working or
professional skills, thus boosting the organizational competitiveness.
(5) Management training: For employees at the management level, AUO conducts a series of
management training courses to improve the management of the Company.
The average educational training hours received each year by the new
managers and new assistant managers are about 29 and 40 hours,
respectively. The general education courses received by assistant managers
take up 6.4 hours on average.
2019 Global ALS curriculum and execution process are as follows:
Category College Sessions Total number
of persons
Total number of
training hours
Total expense
(NT$1000)
AUO University course
internal training
College of the Future 16 1,430 461
50,151
College of Science 19 3,329 57
College of Engineering 356 9,474 17,562
College of Liberal Arts 29 2,358 223
College of Leadership 27 1,397 628
AUO University course
external training External training -- 796
--
Learning development system maintenance and project implementation expense

AU Optronics 2019 Annual Report
69
Operational Highlights
3. Retirement Policy and execution:
(1) The Company has provided Retirement Policy.
(2) Supervisory Committee of Workers’ Pension Preparation Fund was established in August 1997 and began
to allocate pension in May 1998. The Allocation is based on 2% to 15% of the monthly salary.
(3) Starting from July 2005, the 2nd-tier new labor pension plan was implemented in accordance with the
law.
(4) According to the provisions of International Accounting Standard No.19, the actuary is required to
conduct evaluation on the pension reserve fund, and submit an actuarial assessment report.
4. Labor-management agreement and implementation:
AUO has always valued the labor relation. Apart from complying with the Labor Standards Law and related
regulations, AUO went further to offer more benefits and measures, the reason for our harmonious labor
relation. On the other hand, AUO regularly holds quarterly/ monthly meetings, labor-management meeting
business briefings, and other two-way meetings to deliver important notices and policies. Other means of
communication included 24-7 platforms, such as "Audit Committee Box," "General Manager's Mailbox,"
“Grievance Mailbox for Sexual Harassment,” and “Internal Communication Box,” for the Company to collect,
understand, and resolve employees' needs. Doing so has established a sound environment for mutual
participation and full communication between employees and the management team.
5. Workplace, and protective measures for employee's personal safety
AUO has been dedicated to environmental protection, energy saving, and employee care for a long time. It
endeavors to fulfill its social responsibilities and create a sustainable business. In addition to relevant domestic
laws and regulations, all sites of AUO have thoroughly passed the internationally recognized OHSAS 18001
Occupational Health and Safety Management System Certification. The specific measures are as follows:
(1) Highlight the source management
The Company’s fabs were designed in accordance with the plant construction risk management
specifications. Solutions to prevent all possible hazards were incorporated into fab construction. All on-
site operations and possible damages/risks incurred were identified and evaluated, and the most feasible
methods and techniques for hazard prevention and risk control were adopted accordingly, with a
particular emphasis on source management. As an instance, the AUO equipment safety standards were
based not only on the process characteristics, but also on the safety standards adopted domestically and
in Europe and America. As early as the phase of equipment design, a thorough discussion with the supplier
was conducted, and clearance control was applied to the purchase. To ensure employee safety during
operations, new equipment loaded in a plant site has to abide by the equipment installation safety
inspection specifications before operations can begin. For chemicals, AUO Chemical Filter has been
established to screen for high-risk substances, in line with the international trend for chemical
management. Clearance control is also applied to the chemical sources, to protect employees' health and
avoid environmental impact.
(2) Promoting a culture of safety
The Company has been promoting a culture of safety since 2012. Safety improvement was also included
in the five major missions of the annual B2B (Back to Basics) initiative. Signing ceremonies for safety
commitments and a safety forum were held at each fab, through which each employee was expected to
play a safety role in his or her own position, so as to blend safety awareness into work and life and achieve
the vision of zero incidents.
(3) Strengthen communication and training for hazard prevention
In order to effectively enhance the staff's safety and hygiene awareness, AUO planned seven thematic
courses for general employees, professionals, and supervisors. These courses cover a series of topics
including environmental protection, safety and hygiene, emergency response, management systems, risk
management, social responsibility, and green products. This plan’s purpose is to allow staff to recognize
hazards and then follow the corresponding safety standard procedures to protect themselves. On top of
training, a departmental safety officer was appointed to regularly collect employees' safety and hygiene
needs for work, and to transmit safety management measures and notices for healthy two-way
communication.
(4) Promoting employees' health
AUO has arranged for professional nursing staff to plan an all-inclusive health program. In addition to
health checks, medical consultations and various health promotion activities were held regularly. An e-
health management platform has also been built, allowing employees to access relevant and personal
health information at all times. In addition, services of psychological and legal consultations with
professionals were provided to employees in need. To counter any impacts on the Company and
employees from infectious diseases in recent years, besides keeping track of relevant information, AUO
has also established a complete emergency procedure and a team to conduct epidemic prevention and
disaster reduction, protecting employees' health and minimizing the impact on the Company.

AU Optronics 2019 Annual Report
70
(5) Establish an emergency response framework
Besides regular emergency groupings and drills, AUO has established a 24-hour emergency response
center equipped with full monitoring facilities to keep abreast of the situation in every factory corner, in
order to avoid possible material impact on the business operations. A complete emergency response
plan was also made to respond to fires, chemical spills, earthquakes, floods, and so on. Moreover, to
minimize the impact on personnel and property, drills are also performed to familiarize personnel with
the various procedures in case of emergency.
(6) Continuous monitoring and auditing
To ensure the safety of sites, various environmental tests and personnel working environment
measurements were performed in accordance with the law. A complete audit procedure was also
established that includes routine inspections, high-risk operation inspections, supervisor inspections, and
cross-plant audits performed by safety experts from each fab site. Domestic and overseas third-party
verification units and customers also carry out audits at our sites from time to time. Moreover,
management review committees at the corporate and plant levels are formed and relevant meetings are
held by the senior manager and the site chief, respectively. These committees are responsible for the
regular review of environmental safety matters and operations, and for setting up goals and directions
for better safety performance.
(II) Any losses suffered by the company in the most recent fiscal year and up to the annual report publication
date due to labor-management disputes (including any violations of Labor Standards Act indicated in the
labor inspection, specifying the disposition dates, disposition reference numbers, the articles of laws
violated, and the content of the dispositions), and disclosing an estimate of possible expenses that could
be incurred currently and in the future and measures being or to be taken. If a reasonable estimate cannot
be made, an explanation of the facts of why it cannot be made shall be provided.
1. Loss due to labor-management disputes:
Company
name Incident
Penalty/indemnity
amount
(NT$1,000)
Countermeasures and
improvements
AU
Optronics
Corporation
1. Disposition date: April 16, 2019
2. Disposition reference number: Environmental Protection
Section of Hsinchu Science Park No. 1080010900
3. Violated clauses: Article 38, Paragraph 2 of the Labor Standards
Act
4. Content of violated clauses: Annual paid leaves from the
preceding paragraph are to be arranged by workers. The
employer, however, in the light of the urgent needs of the
business operation or employees' personal factors, may consult
and make adjustments with workers.
5. Content of disposition: The labor inspection conducted by the
Science Park spotted that annual paid leaves were not arranged
by labors.
20 1. From 2020 onwards, the
Company will conduct an
intention survey prior to a
bridge holiday. Labors may,
based on their
arrangement of work and
holiday, work on the
questionnaire system and
make a reply as to
whether they will attend
that day, or whether they
will have the Company fill
out a leave request on
their behalf.
2. For the work time
management of employees,
the Company has
voluntarily provided
working hour reports to
the management level for
personnel care and work
allocations.
3. Access control systems
are implemented, to
record who has
consecutively worked for
seven days, and the
employee will not be able
to enter the working
grounds.
4. The Company will
regularly promote legal
compliance tasks to the
management level regular
meetings.
1. Disposition date: April 18, 2019
2. Disposition reference number: Environmental Protection
Section of Central Science Park No.1080008208
3. Violated clauses: Article 32, Paragraph 2 of the Labor Standards
Act
4. Content of violated clauses: The extension of working hours
referred to in the preceding paragraph, combined with the
regular working hours shall not exceed twelve hours a day; the
total number of overtime shall not exceed forty-six hours a
month;
5. Content of disposition: Labor inspection conducted by Central
Science Park spotted that labors had worked overtime.
70
1. Disposition date: February 17, 2020
2. Disposition reference number: Environmental Protection Section
of Central Science Park No.1090003562
3. Violated clauses: Article 32, Paragraph 2 of the Labor Standards
Act
4. Content of violated clauses: The extension of working hours
referred to in the preceding paragraph, combined with the
regular working hours shall not exceed twelve hours a day; the
total number of overtime shall not exceed forty-six hours a
month;
5. Content of disposition: Labor inspection conducted by Central
Science Park spotted that labors had worked overtime.
50
1. Disposition date: June 13, 2019 90 Strengthen supervisors'
awareness of legal

AU Optronics 2019 Annual Report
71
Operational Highlights
Company
name Incident
Penalty/indemnity
amount
(NT$1,000)
Countermeasures and
improvements
Darwin
Precisions
Corporation
2. Disposition reference number: Labor Affairs Bureau of Taichung
City Government No. 1080135486
3. Violated clauses: Article 32, Paragraph 2 of the Labor Standards
Act
4. Content of violated clauses: Extending labor’s working hours by
a number exceeding the legal threshold.
5. Content of disposition: Labor Affairs Bureau of Taichung City
Government inspect the Daya Fab and spotted that it had
extended labors working hours by a number exceeding the legal
threshold.
compliance and put
employees' overtime hours
under control.
1. Disposition date: October 18, 2019
2. Disposition reference number: Labor Affairs Bureau of Taichung
City Government No. 1080248742
3. Violated clauses: Article 22, Paragraph 2 of the Labor Standards
Act
4. Content of violated clauses: Wages were not paid in full directly
to employees.
5. Contents of disposition: The labor inspection Conducted by the
Labor Affairs Bureau of Taichung City Government found that
employees of Fab Daya had taken their leaves in advance due to
the company's adjustment of their attendance days. The said
leaves taken in advance had not been made up when employees
left their jobs, resulting in the company’s deduction of their
wages.
20 Implementation and
compliance with relevant
laws and regulations.
1. Disposition date: January 14, 2020
2. Disposition reference number: Labor Affairs Bureau of Taichung
City Government No. 1080267718
3. Violated clauses: Articles 42 and Article 57, Paragraph 9 of the
Employment Services Act
4. Content of violated clauses: No employment of foreign worker
may jeopardize nationals’ opportunity in employment.
5. Content of disposition: In that the Company refused to accept
dismissed employees who wished to do the jobs performed by
foreigners, Taichung City Government deemed it a violation
against the Employment Service Act.
60 Implementation and
compliance with relevant
laws and regulations.
2. In the most recent year and up to the date of publication of this Annual Report, the Company and
its subsidiaries were not, except for above-mentioned matters, fined for violation of other relevant
regulations.

AU Optronics 2019 Annual Report
72
VI. Material Contracts (I) As of the date of publication of this Report, the material long-term loan agreements and technical
cooperation agreements that are still ongoing or are about to expire in the most recent year, are as follows:
Long-term loan contracts
Type Party Term Main content Restrictive clauses
Financing Bank of Taiwan and
other syndicated banks 2018.06~2024.02
Repaying existing debts Secured by the building,
equipment and machinery
Financing Bank of Taiwan and
other syndicated banks 2017.07~2023.04
Purchase of machinery and
equipment
Secured by the equipment and
machinery
Financing Bank of Taiwan and
other syndicated banks 2016.11~2022.05
Purchase of machinery and
equipment
Secured by the equipment and
machinery
Technical Collaboration Agreement
Type Party Term Main content Restrictive
clauses
Patent license Fujitsu Limited (former FDTC) Subject to the
agreement Specific TFT-LCD patent license
Subject to the
agreement
Patent/technology
licensing Toppan Printing Co., Ltd.
Subject to the
agreement
Specific color filter
patent/technology license
Subject to the
agreement
Patent license Semiconductor Energy Laboratory Co.,
Ltd.
Subject to the
agreement
Specific LCD and OLED product
patent license
Subject to the
agreement
Patent cross-license
Japan Display Inc. (former Japan Display
East Inc., Hitachi Displays, Ltd.), Panasonic
Liquid Crystal Display, Co., Ltd. (former
IPS Alpha Technology, Ltd.)
Subject to the
agreement
Patent cross-license for specific
TFT-LCD and OLED products
Subject to the
agreement
Patent cross-license Sharp Corporation Subject to the
agreement
Patent cross- license for specific
TFT-LCD products
Subject to the
agreement
Patent cross-license LG Display Co., Ltd. Subject to the
agreement
Patent cross- license for specific
TFT-LCD products
Subject to the
agreement
Patent cross-license Samsung Electronics Co., Ltd. Subject to the
agreement
Patent cross- license for specific
TFT-LCD products
Subject to the
agreement
Patent cross-license Hydis Technologies Co., Ltd. Subject to the
agreement
Patent cross- license for specific
LCD products
Subject to the
agreement
Patent cross-license Seiko Epson Corporation Subject to the
agreement
Patent cross- license for specific
LCD and OLED products
Subject to the
agreement
In addition to the aforesaid agreements, during the course of operation AUO has also signed license or cross-license
agreements with other third parties for patents they owned or controlled.
(II) For other material contracts of the Company and subsidiaries, please refer to Appendix I to this Annual
Report, titled Consolidated Financial Statements and Independent Auditor’s Report (pages 97-193).

AU Optronics 2019 Annual Report
73
Financial Highlights
Chapter 6 Financial Highlights I. Condensed Balance Sheet and Statement of Comprehensive Income for the Most Recent Five
Years
(I) International Financial Reporting Standards - Consolidated Financial Statements
Condensed Consolidated Balance Sheet Unit: NT$ thousands
Year
Item
Financial data for the most recent five years (Note 1)
2019.12.31 2018.12.31 2017.12.31 2016.12.31 2015.12.31
Current assets 143,200,211 149,067,627 180,175,541 163,346,242 161,992,140
Property, plant and equipment 206,734,543 221,586,475 224,933,089 222,741,832 208,785,609
Intangible assets 12,808,326 13,377,263 13,170,892 13,602,834 14,575,279
Other assets (Note 2) 34,894,511 25,800,410 23,171,762 30,078,343 40,201,217
Total assets 397,637,591 409,831,775 441,451,284 429,769,251 425,554,245
Current
liabilities
Before distribution 90,528,089 128,937,971 107,236,609 117,266,175 141,349,389
After distribution (Note 3) 133,750,093 121,672,977 122,655,752 144,717,875
Non-current liabilities 119,132,753 63,615,116 108,969,560 112,867,894 79,568,451
Total liabilities Before distribution 209,660,842 192,553,087 216,206,169 230,134,069 220,917,840
After distribution (Note 3) 197,365,209 230,642,537 235,523,646 224,286,326
Equity attributable to shareholders of
AU Optronics Corp. 176,671,840 202,862,715 208,154,368 181,244,699 181,985,222
Common stock 96,242,451 96,242,451 96,242,451 96,242,451 96,242,451
Capital surplus Before distribution 60,544,474 60,622,043 60,540,326 59,979,723 60,249,983
After distribution (Note 3) 60,622,043 60,540,326 59,979,723 60,249,983
Retained
earnings
Before distribution 22,903,722 46,845,991 51,115,529 24,243,153 20,407,277
After distribution (Note 3) 42,033,869 36,679,161 18,853,576 17,038,791
Other components of equity (2,005,384) (847,770) 256,062 779,372 5,085,511
Treasury stock (1,013,423) - - - -
Non-controlling interests 11,304,909 14,415,973 17,090,747 18,390,483 22,651,183
Total equity Before distribution 187,976,749 217,278,688 225,245,115 199,635,182 204,636,405
After distribution (Note 3) 212,466,566 210,808,747 194,245,605 201,267,919
Note 1: The financial data for the most recent five years has been audited by CPAs. As of the date of this Annual Report, the 2020 financial
data has not been audited or reviewed by CPAs.
Note 2: Other assets are non-current assets excluding property, plant and equipment, and intangible assets.
Note 3: Pending resolution in 2020 Annual Shareholders’ Meeting.

AU Optronics 2019 Annual Report
74
Condensed Consolidated Statement of Comprehensive Income Unit: NT$ thousands (except for earnings per share: NT$)
Year
Item
Financial data for the past five years (Note)
2019 2018 2017 2016 2015
Net revenue 268,791,694 307,634,389 341,028,267 329,089,036 360,346,494
Gross profit 455,943 28,139,504 61,041,745 34,491,019 39,837,055
Profit (loss) from operations (20,467,948) 6,667,865 39,139,124 12,338,456 17,521,148
Non-operating income and expenses 623,194 4,548,286 224,482 (1,152,554) (9,922,298)
Profit (loss) before income tax (19,844,754) 11,216,151 39,363,606 11,185,902 7,598,850
Profit (loss) from continuing operations
for the year (21,599,416) 7,959,895 30,258,488 6,606,711 4,842,882
Loss from discontinued operations - - - - -
Profit (loss) for the year (21,599,416) 7,959,895 30,258,488 6,606,711 4,842,882
Other comprehensive income (loss), net
of taxes (1,411,771) (1,383,775) (960,183) (6,359,644) (768,225)
Total comprehensive income (loss) for
the year (23,011,187) 6,576,120 29,298,305 247,067 4,074,657
Profit (loss) attributable to shareholders
of AU Optronics Corp. (19,185,258) 10,160,598 32,359,417 7,818,938 4,931,960
Profit (loss) attributable to non-
controlling interests (2,414,158) (2,200,703) (2,100,929) (1,212,227) (89,078)
Total comprehensive income (loss)
attributable to shareholders of AU
Optronics Corp.
(20,192,454) 9,085,260 31,754,733 3,326,560 4,838,950
Total comprehensive income (loss)
attributable to non-controlling interests (2,818,733) (2,509,140) (2,456,428) (3,079,493) (764,293)
Earnings (loss) per share (EPS) (2.00) 1.06 3.36 0.81 0.51
Note: The financial data for the most recent five years has been audited by CPAs. As of the date of this Annual Report, the 2020 financial
data has not been audited or reviewed by CPAs.

AU Optronics 2019 Annual Report
75
Financial Highlights
(II) International Financial Reporting Standards –Parent Company Only Financial Statement
Condensed Balance Sheet Unit: NT$ thousands
Year
Item
Financial data for the most recent five years (Note 1)
2019.12.31 2018.12.31 2017.12.31 2016.12.31 2015.12.31
Current assets 96,317,458 98,928,620 133,588,893 107,580,230 99,459,796
Property, plant and equipment 144,142,738 148,448,632 141,796,990 135,433,979 143,897,638
Intangible assets 12,051,761 12,476,746 12,983,137 13,602,834 14,575,279
Other assets (Note 2) 93,152,910 87,550,523 85,732,867 101,218,733 115,740,782
Total assets 345,664,867 347,404,521 374,101,887 357,835,776 373,673,495
Current
liabilities
Before distribution 73,270,709 110,042,400 91,044,482 94,944,624 124,563,162
After distribution (Note 3) 114,854,522 105,480,850 100,334,201 127,931,648
Non-current liabilities 95,722,318 34,499,406 74,903,037 81,646,453 67,125,111
Total liabilities Before distribution 168,993,027 144,541,806 165,947,519 176,591,077 191,688,273
After distribution (Note 3) 149,353,928 180,383,887 181,980,654 195,056,759
Equity attributable to shareholders of
AU Optronics Corp. 176,671,840 202,862,715 208,154,368 181,244,699 181,985,222
Common stock 96,242,451 96,242,451 96,242,451 96,242,451 96,242,451
Capital surplus Before distribution 60,544,474 60,622,043 60,540,326 59,979,723 60,249,983
After distribution (Note 3) 60,622,043 60,540,326 59,979,723 60,249,983
Retained
earnings
Before distribution 22,903,722 46,845,991 51,115,529 24,243,153 20,407,277
After distribution (Note 3) 42,033,869 36,679,161 18,853,576 17,038,791
Other components of equity (2,005,384) (847,770) 256,062 779,372 5,085,511
Treasury stock (1,013,423) - - - -
Non-controlling interests - - - - -
Total equity Before distribution 176,671,840 202,862,715 208,154,368 181,244,699 181,985,222
After distribution (Note 3) 198,050,593 193,718,000 175,855,122 178,616,736
Note 1: The financial data for the most recent five years has been audited and attested by CPAs. As of the date of printing of the Annual
Report, the 2020 financial data has not been attested or reviewed by CPAs.
Note 2: Other assets are non-current assets excluding property, plant and equipment, and intangible assets.
Note 3: Pending resoluting in 2020 Annual Shareholders’ Meeting.
Condensed Statement of Comprehensive Income Unit: NT$ thousands (except for earnings per share: NT$)
Year
Item
Financial data for the most recent five years (Note)
2019 2018 2017 2016 2015
Net revenue 255,167,176 293,060,339 319,839,895 300,728,680 333,879,825
Gross profit (2,618,924) 26,377,798 59,586,501 28,070,086 33,705,034
Profit (loss) from operations (17,726,245) 11,033,564 43,313,271 12,538,693 17,631,265
Non-operating income and expenses (620,419) 951,429 (3,306,536) (2,134,096) (10,564,577)
Profit (loss) before income tax (18,346,664) 11,984,993 40,006,735 10,404,597 7,066,688
Profit (loss) from continuing operations
for the year (19,185,258) 10,160,598 32,359,417 7,818,938 4,931,960
Loss from discontinued operations - - - - -
Profit (loss) for the year (19,185,258) 10,160,598 32,359,417 7,818,938 4,931,960
Other comprehensive income (loss), net
of taxes (1,007,196) (1,075,338) (604,684) (4,492,378) (93,010)
Total comprehensive income (loss) for
the year (20,192,454) 9,085,260 31,754,733 3,326,560 4,838,950
Profit (loss) attributable to shareholders
of AU Optronics Corp. (19,185,258) 10,160,598 32,359,417 7,818,938 4,931,960
Profit (loss) attributable to non-
controlling interests - - - - -
Total comprehensive income (loss)
attributable to shareholders of AU
Optronics Corp.
(20,192,454) 9,085,260 31,754,733 3,326,560 4,838,950
Total comprehensive income (loss)
attributable to non-controlling interests - - - - -
Earnings (loss) per share (EPS) (2.00) 1.06 3.36 0.81 0.51
Note: The financial data for the most recent five years has been audited and attested by CPAs. As of the date of printing of the Annual Report,
the 2020 financial data has not attested or reviewed by CPAs
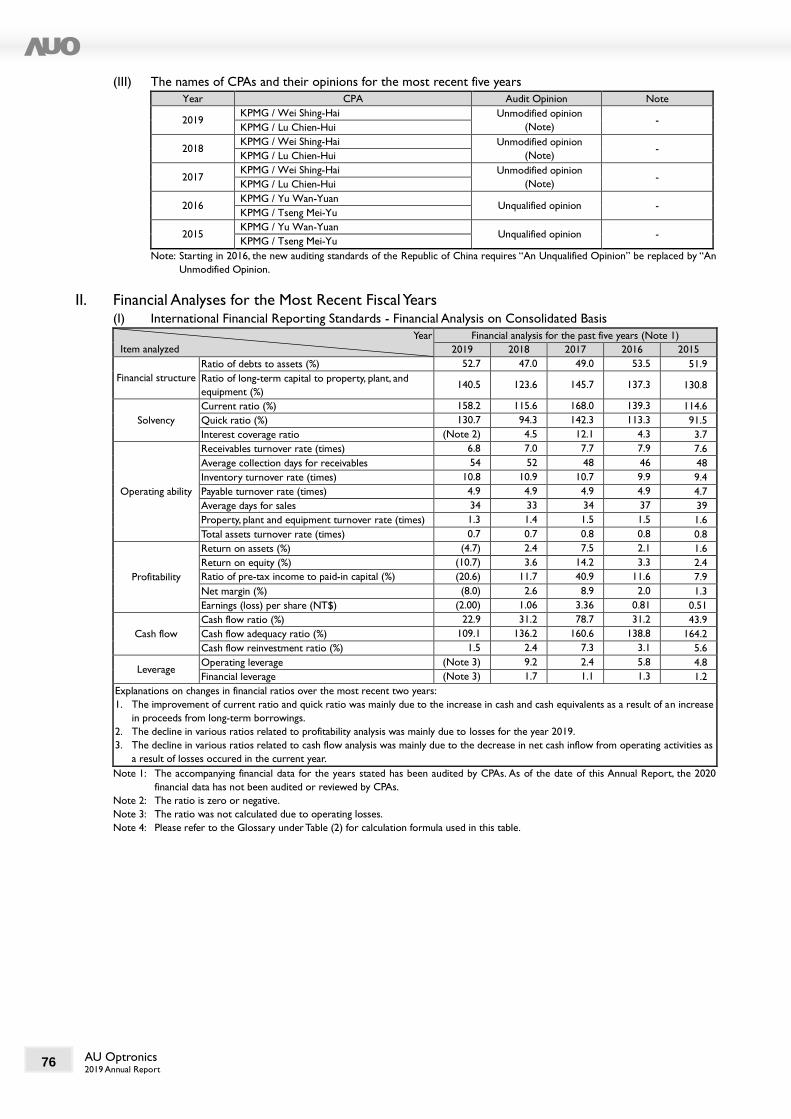
AU Optronics 2019 Annual Report
76
(III) The names of CPAs and their opinions for the most recent five years
Year CPA Audit Opinion Note
2019 KPMG / Wei Shing-Hai Unmodified opinion
(Note) -
KPMG / Lu Chien-Hui
2018 KPMG / Wei Shing-Hai Unmodified opinion
(Note) -
KPMG / Lu Chien-Hui
2017 KPMG / Wei Shing-Hai Unmodified opinion
(Note) -
KPMG / Lu Chien-Hui
2016 KPMG / Yu Wan-Yuan
Unqualified opinion - KPMG / Tseng Mei-Yu
2015 KPMG / Yu Wan-Yuan
Unqualified opinion - KPMG / Tseng Mei-Yu
Note: Starting in 2016, the new auditing standards of the Republic of China requires “An Unqualified Opinion” be replaced by “An
Unmodified Opinion.
II. Financial Analyses for the Most Recent Fiscal Years (I) International Financial Reporting Standards - Financial Analysis on Consolidated Basis
Year
Item analyzed
Financial analysis for the past five years (Note 1)
2019 2018 2017 2016 2015
Financial structure
Ratio of debts to assets (%) 52.7 47.0 49.0 53.5 51.9
Ratio of long-term capital to property, plant, and
equipment (%) 140.5 123.6 145.7 137.3 130.8
Solvency
Current ratio (%) 158.2 115.6 168.0 139.3 114.6
Quick ratio (%) 130.7 94.3 142.3 113.3 91.5
Interest coverage ratio (Note 2) 4.5 12.1 4.3 3.7
Operating ability
Receivables turnover rate (times) 6.8 7.0 7.7 7.9 7.6
Average collection days for receivables 54 52 48 46 48
Inventory turnover rate (times) 10.8 10.9 10.7 9.9 9.4
Payable turnover rate (times) 4.9 4.9 4.9 4.9 4.7
Average days for sales 34 33 34 37 39
Property, plant and equipment turnover rate (times) 1.3 1.4 1.5 1.5 1.6
Total assets turnover rate (times) 0.7 0.7 0.8 0.8 0.8
Profitability
Return on assets (%) (4.7) 2.4 7.5 2.1 1.6
Return on equity (%) (10.7) 3.6 14.2 3.3 2.4
Ratio of pre-tax income to paid-in capital (%) (20.6) 11.7 40.9 11.6 7.9
Net margin (%) (8.0) 2.6 8.9 2.0 1.3
Earnings (loss) per share (NT$) (2.00) 1.06 3.36 0.81 0.51
Cash flow
Cash flow ratio (%) 22.9 31.2 78.7 31.2 43.9
Cash flow adequacy ratio (%) 109.1 136.2 160.6 138.8 164.2
Cash flow reinvestment ratio (%) 1.5 2.4 7.3 3.1 5.6
Leverage Operating leverage (Note 3) 9.2 2.4 5.8 4.8
Financial leverage (Note 3) 1.7 1.1 1.3 1.2
Explanations on changes in financial ratios over the most recent two years:
1. The improvement of current ratio and quick ratio was mainly due to the increase in cash and cash equivalents as a result of an increase
in proceeds from long-term borrowings.
2. The decline in various ratios related to profitability analysis was mainly due to losses for the year 2019.
3. The decline in various ratios related to cash flow analysis was mainly due to the decrease in net cash inflow from operating activities as
a result of losses occured in the current year.
Note 1: The accompanying financial data for the years stated has been audited by CPAs. As of the date of this Annual Report, the 2020
financial data has not been audited or reviewed by CPAs.
Note 2: The ratio is zero or negative.
Note 3: The ratio was not calculated due to operating losses.
Note 4: Please refer to the Glossary under Table (2) for calculation formula used in this table.
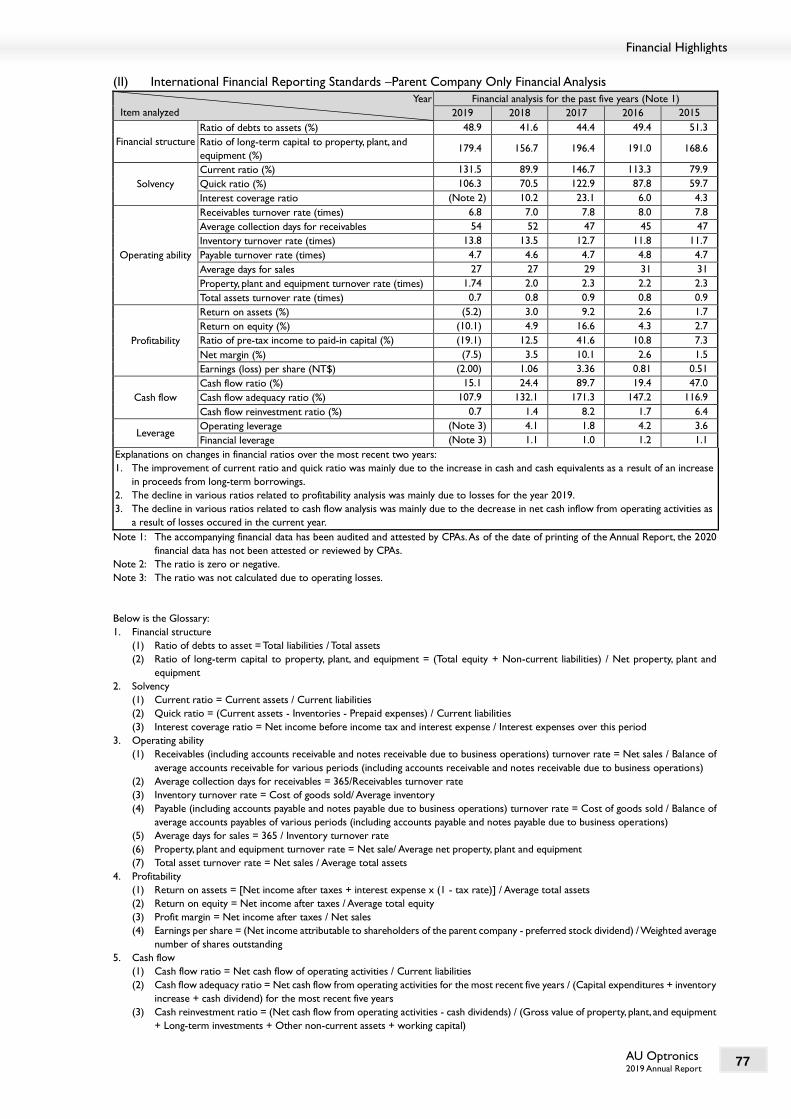
AU Optronics 2019 Annual Report
77
Financial Highlights
(II) International Financial Reporting Standards –Parent Company Only Financial Analysis
Year
Item analyzed
Financial analysis for the past five years (Note 1)
2019 2018 2017 2016 2015
Financial structure
Ratio of debts to assets (%) 48.9 41.6 44.4 49.4 51.3
Ratio of long-term capital to property, plant, and
equipment (%) 179.4 156.7 196.4 191.0 168.6
Solvency
Current ratio (%) 131.5 89.9 146.7 113.3 79.9
Quick ratio (%) 106.3 70.5 122.9 87.8 59.7
Interest coverage ratio (Note 2) 10.2 23.1 6.0 4.3
Operating ability
Receivables turnover rate (times) 6.8 7.0 7.8 8.0 7.8
Average collection days for receivables 54 52 47 45 47
Inventory turnover rate (times) 13.8 13.5 12.7 11.8 11.7
Payable turnover rate (times) 4.7 4.6 4.7 4.8 4.7
Average days for sales 27 27 29 31 31
Property, plant and equipment turnover rate (times) 1.74 2.0 2.3 2.2 2.3
Total assets turnover rate (times) 0.7 0.8 0.9 0.8 0.9
Profitability
Return on assets (%) (5.2) 3.0 9.2 2.6 1.7
Return on equity (%) (10.1) 4.9 16.6 4.3 2.7
Ratio of pre-tax income to paid-in capital (%) (19.1) 12.5 41.6 10.8 7.3
Net margin (%) (7.5) 3.5 10.1 2.6 1.5
Earnings (loss) per share (NT$) (2.00) 1.06 3.36 0.81 0.51
Cash flow
Cash flow ratio (%) 15.1 24.4 89.7 19.4 47.0
Cash flow adequacy ratio (%) 107.9 132.1 171.3 147.2 116.9
Cash flow reinvestment ratio (%) 0.7 1.4 8.2 1.7 6.4
Leverage Operating leverage (Note 3) 4.1 1.8 4.2 3.6
Financial leverage (Note 3) 1.1 1.0 1.2 1.1
Explanations on changes in financial ratios over the most recent two years:
1. The improvement of current ratio and quick ratio was mainly due to the increase in cash and cash equivalents as a result of an increase
in proceeds from long-term borrowings.
2. The decline in various ratios related to profitability analysis was mainly due to losses for the year 2019.
3. The decline in various ratios related to cash flow analysis was mainly due to the decrease in net cash inflow from operating activities as
a result of losses occured in the current year.
Note 1: The accompanying financial data has been audited and attested by CPAs. As of the date of printing of the Annual Report, the 2020
financial data has not been attested or reviewed by CPAs.
Note 2: The ratio is zero or negative.
Note 3: The ratio was not calculated due to operating losses.
Below is the Glossary:
1. Financial structure
(1) Ratio of debts to asset = Total liabilities / Total assets
(2) Ratio of long-term capital to property, plant, and equipment = (Total equity + Non-current liabilities) / Net property, plant and
equipment
2. Solvency
(1) Current ratio = Current assets / Current liabilities
(2) Quick ratio = (Current assets - Inventories - Prepaid expenses) / Current liabilities
(3) Interest coverage ratio = Net income before income tax and interest expense / Interest expenses over this period
3. Operating ability
(1) Receivables (including accounts receivable and notes receivable due to business operations) turnover rate = Net sales / Balance of
average accounts receivable for various periods (including accounts receivable and notes receivable due to business operations)
(2) Average collection days for receivables = 365/Receivables turnover rate
(3) Inventory turnover rate = Cost of goods sold/ Average inventory
(4) Payable (including accounts payable and notes payable due to business operations) turnover rate = Cost of goods sold / Balance of
average accounts payables of various periods (including accounts payable and notes payable due to business operations)
(5) Average days for sales = 365 / Inventory turnover rate
(6) Property, plant and equipment turnover rate = Net sale/ Average net property, plant and equipment
(7) Total asset turnover rate = Net sales / Average total assets
4. Profitability
(1) Return on assets = [Net income after taxes + interest expense x (1 - tax rate)] / Average total assets
(2) Return on equity = Net income after taxes / Average total equity
(3) Profit margin = Net income after taxes / Net sales
(4) Earnings per share = (Net income attributable to shareholders of the parent company - preferred stock dividend) / Weighted average
number of shares outstanding
5. Cash flow
(1) Cash flow ratio = Net cash flow of operating activities / Current liabilities
(2) Cash flow adequacy ratio = Net cash flow from operating activities for the most recent five years / (Capital expenditures + inventory
increase + cash dividend) for the most recent five years
(3) Cash reinvestment ratio = (Net cash flow from operating activities - cash dividends) / (Gross value of property, plant, and equipment
+ Long-term investments + Other non-current assets + working capital)

AU Optronics 2019 Annual Report
78
6. Leveraging
(1) Operating leverage = (Net operating revenue - variable operating costs and expenses) / Operating profit
(2) Financial leverage = Operating profit / (Operating profit - interest expenses)
III. The Audit Committee's Review Report As of the date of this Annual Report, the Company's Audit Committee has not presented their Review Report.
Relevant information will be published in the 2020 Annual General Meeting's handbook, and the handbook will
be uploaded to the Market Observation Post System (MOPS) 30 days prior to the 2020 Annual General Meeting.
IV. Consolidated Financial Statement and Independent Auditors' Report for the most recent year:
please refer to Appendix 1 (Pages 97-193).
V. Parent-company-only Financial Statement and Independent Auditors' Report for the most
recent year: please refer to Appendix 2 (Pages 194-290).
VI. Any financial difficulties experienced by the Company and its affiliate businesses during the
most recent year up to the date of this Annual Report need to be stated as well as the impact
on the Company's financial position need to be outlined: None.

AU Optronics 2019 Annual Report
79
Review and Analysis of Financial Position and Financial Performance, and Risk Management
Chapter 7 Review and Analysis of Financial Position and Financial
Performance, and Risk Management
I. Financial position analysis Unit: NT$ thousands
Year
Item 2019.12.31 2018.12.31
Difference
Increase (decrease)
amount %
Current assets 143,200,211 149,067,627 (5,867,416) (3.9)
Long-term investment 13,544,650 13,265,790 278,860 2.1
Property, plant and equipment 206,734,543 221,586,475 (14,851,932) (6.7)
Right-of-use assets 12,207,768 - 12,207,768 -
Investment property 1,555,130 730,306 824,824 112.9
Intangible assets 12,808,326 13,377,263 (568,937) (4.3)
Deferred tax assets 5,181,617 6,632,668 (1,451,051) (21.9)
Other assets 2,405,346 5,171,646 (2,766,300) (53.5)
Total assets 397,637,591 409,831,775 (12,194,184) (3.0)
Current liabilities 90,528,089 128,937,971 (38,409,882) (29.8)
Non-current liabilities 119,132,753 63,615,116 55,517,637 87.3
Total liabilities 209,660,842 192,553,087 17,107,755 8.9
Common stock 96,242,451 96,242,451 - -
Capital surplus 60,544,474 60,622,043 (77,569) (0.1)
Retained earnings 22,903,722 46,845,991 (23,942,269) (51.1)
Other components of equity (2,005,384) (847,770) (1,157,614) 136.5
Treasury stock (1,013,423) - (1,013,423) -
Equity attributable to shareholders of AU
Optronics Corp. 176,671,840 202,862,715 (26,190,875) (12.9)
Non-controlling interests 11,304,909 14,415,973 (3,111,064) (21.6)
Total equity 187,976,749 217,278,688 (29,301,939) (13.5)
Analysis of items that have major changes:
1. The increase in investment property was mainly due to the transfer of leased-out plants and right-of-use assets to investment property in
2019.
2. The decrease in deferred tax assets was mainly due to the decrease in tax losses carryforwards.
3. The decrease in other assets was mainly due to the reclassification of long-term prepaid rents to right-of-use assets upon the application
of IFRS16 and the reclassification of long-term receivables due within one year to current assets.
4. The decrease in current liabilities was mainly due to the decrease in long-term loans due within one year.
5. The increase in non-current liabilities was mainly due to the increase in proceeds from long-term loans.
6. The decrease in other components of equity was mainly due to currency exchange losses incurred in the translation of foreign operations
due to exchange rate fluctuations in 2019.

AU Optronics 2019 Annual Report
80
II. Financial performance (I) Financial performance analysis
Unit: NT$ thousands
Year
Item 2019 2018
Change in proportion
Increase (decrease)
amount
%
Revenue 270,794,105 309,798,066 (39,003,961) (12.6)
Less: sales return and discount 2,002,411 2,163,677 (161,266) (7.5)
Net revenue 268,791,694 307,634,389 (38,842,695) (12.6)
Cost of sales 268,335,751 279,494,885 (11,159,134) (4.0)
Gross profit (loss) 455,943 28,139,504 (27,683,561) (98.4)
Operating expenses 20,923,891 21,471,639 (547,748) (2.6)
Profit (loss) from operations (20,467,948) 6,667,865 (27,135,813) (407.0)
Non-operating income and expenses 623,194 4,548,286 (3,925,092) (86.3)
Profit (loss) before income tax for the year (19,844,754) 11,216,151 (31,060,905) (276.9)
Less: income tax expense 1,754,662 3,256,256 (1,501,594) (46.1)
Profit (loss) for the year (21,599,416) 7,959,895 (29,559,311) (371.4)
Analysis of items that have major changes:
1. Profit from operations decreased in 2019 mainly due to a decline in the average selling price of TFT-LCD panels owing to an oversupply
market condition.
2. Decrease in non-operating income and expenses was mainly due to a disposal gain on property, plant and equipment from our subsidiaries
in 2018, and an asset impairment recognized associated with our energy business in 2019.
(II) The special key performance indicators (KPI) of the panel industry
Year
Item
2019
First
Quarter
Second
Quarter
Third
Quarter
Fourth
Quarter Full year
Large-sized panels shipments (million units) (Note1) 25.9 27.2 28.7 26.4 108.2
Small-medium-sized panels shipments (million units) 25.0 33.0 35.6 37.4 131.0
Consolidated shipments (million units) 50.9 60.2 64.3 63.8 239.2
Operating margin (%) (7.6) (4.9) (7.8) (10.5) (7.6)
EBITDA (Note 2) margin (%) 6.1 8.1 5.0 4.2 5.9
Inventory turnover (days) 37 36 34 35 34
Net debt to equity (%) 12.6 13.6 18.4 17.7 17.7
Note 1: Large-size refers to panels that are 10 inches and above.
Note 2: EBITDA =Operating profit + D&A.
(III) Estimated sales volume and supporting info
AUO is a leading global manufacturer of optoelectronic solutions. Its main product lines cover TFT-LCD panels in
large, medium and small sizes. The current panel sizes in production range from 1.2 inches to 85 inches. The application
range and dimensions are very comprehensive. The Company's panel shipments fluctuate considerably when the
product mix changes. Therefore, it is not appropriate to only use sales as the basis for measurement. However, the
Company continues to focus on product value enhancement and product mix optimization. Meanwhile, the Company
also focuses on strengthening its leading edge in product technology and increasing the shipment of integrated and
high value-added products to maintain its product competitiveness in response to the future development direction
of panels toward high-end technologies under the rapidly changing industry environment.
III. Cash flow Changes in consolidated cash flows in 2019:
Unit: NT$ thousands
Cash balance
12/31/2018
Net cash flow from
operating activities
Net cash flow from
investing activities
Net cash flow from
financing activities
Cash balance 12/31/2019
(including effect of exchange rate)
69,163,296 20,730,639 (28,112,356) 20,742,067 80,449,772
(I) Analysis of changes in consolidated cash flows in 2019
Operating activities:Mainly include net loss, along with depreciation and amortization expenses.
Investing activities: Mainly used in capital expenditures.
Financing activities: Mainly include proceeds from long-term borrowings.
(II) Liquidity improvement plan: The Company showed no signs of liquidity deficit.
(III) Analysis of cash liquidity in the coming year: The Company, on the premise of maintaining stable cash
liquidity, will carefully plan and manage cash expenditures related to investments and operations while
taking, cash balances on accounts, cash flows from operating activities and investing activities and the status
of financial markets into consideration.

AU Optronics 2019 Annual Report
81
Review and Analysis of Financial Position and Financial Performance, and Risk Management
IV. Material Expenditures of the Most Recent Year and Impact on the Company's Finances and
Operations The Company's material capital expenditure in 2019 mainly comprised final payment for Gen 8.5 production line
expansion equipment in Taichung, Houli, and activation and upgrade of equipment assets to respond to customers’
demanded quantity and optimize the Company's product portfolio and technical specifications. Based on the
consolidated financial statements, the amount paid for the acquisition of fixed assets in 2019 was NT$ 29.5 billion,
accounting for approximately 11% of the net sales, and thus had no significant impact on the Company's finances
and operations.
V. Investment policy for the most recent fiscal year, the main reasons for the profits/losses
generated thereby, the improvement plan, and investment plans for the coming year The Company's reinvestment policy is in line with the Company's business development strategy and operational
needs. The Company seeks appropriate long-term strategic partnerships, and the major scope of reinvestments
include related key components, upstream and downstream companies, comprehensive solutions for panel display
applications, and solar power plants. The Company's net income from equity investments under the equity method
that were recognized in 2019 Consolidated Financial Statements were NT$ 149,907 thousand, with a decrease
from the previous year, which was attributable to the decline in profits or asset impairment of invested companies
as a result of fierce industrial competition.The Company will continue to focus on related strategic investment in
the industry, as well as increase investment in the field of the downstream application. The Company will take
appropriate measures to dispose the investment positions in addition to continuing to evaluate the investment
plan carefully.
VI. Analyze and assess the following risks in the most recent year up to the publication date of
the Annual Report (I) The organizational structure of risk management
AUO’s CSR Committee is chaired by the Chairman and CEO, and the Risk Management Subcommittee under the CSR
Committee is chaired by the Chief Financial Officer. The Risk Management Subcommittee manages and executes the
Company's annual risk identification from the perspective of business sustainability with a conduct process of
identification, analysis, evaluation of risks. The annual risk identification also takes into account the frequency of
occurrence, the level of impact and the level of control to carry out a quantitative evaluation, covering strategic,
operational, financial, and disaster aspects and formulates risk mitigation strategies accordingly to reduce, transfer, and
avoid risks; and, set up the Business Continuity Plan.
The identified risk issues are discussed in the Corporate Management Meeting (CMM) each year, so that the
management team can focus on the overall strategy, draw up the Risk Control Plan, and strengthen and complete the
vulnerability of our internal system, thereby improving the Company's resilience of sustainable operation. The Risk
Control Plan is supervised and implemented by the Risk Management Subcommittee, of which the Chairman reports
the progress of the implementation to the CSR Committee every quarter.
Structure of the Company's CSR Committee is as follows:
ESH Information
Security
Compliance CMM Corporate
Governance
CSO
Technology Sustainability
Supply Chain Sustainability
Business Risk Management
(CFO)
Business Sustainability
Energy Sustainability
Manufacturing Sustainability
Stakeholders Engagement
CSR Committee
(Chairman & CEO)
Corporate Citizenship

AU Optronics 2019 Annual Report
82
(II) The impacts of interest rates, foreign exchange rates fluctuation and inflation situation on the Company’s
profit and loss, and the future countermeasures:
Interest rate fluctuation
The exposure to changes in interest rate of the Company and its subsidiaries is mainly from floating-rate long-
term debt obligations from operating and investment activities. Any change in interest rates will cause the cash
flows of interest expense paid in the future to fluctuate over time. The consolidated interest expense for 2019
was NT$3,251,370 thousand, which was calculated based on the long-term borrowing of the Company and its
subsidiaries with floating interest rates for 2019. If the market interest rate increases by 0.25% in the future, the
net profit before tax will be reduced by approximately NT$280,558 thousand.
In terms of assets, the capital allocation of the Company and its subsidiaries base on the principle of prudence and
stability. It mainly allocates in bank deposits and high liquidity short-term government bonds with reverse
repurchase agreements to preserve principal and maintain liquidity.
Foreign exchange rate fluctuation
The exposure to foreign currency risk of the Company and its subsidiaries arises from cash and cash equivalents,
accounts receivables, borrowings and accounts payables that are denominated in foreign currency. Therefore,
fluctuations in foreign currency may affect operating income, operating costs and even profit performance
denominated in foreign currencies. In order to avoid adverse effects of changes in foreign currency on the
operating results of the Company and its subsidiaries, the Company and its subsidiaries use forward contracts as
hedging instruments to minimize the impact of foreign currency risk on the profit and loss of the Company and
its subsidiaries. Based on the Consolidated Financial Statements, gains and losses on valuation of forward contract
derivatives and foreign exchanges gains and losses measured at fair value in 2019 of that period as a net gain of
NT$148,053 thousand. In the future, these hedges will continue to reduce foreign currency risks. Calculated based
on the cost structure of the Company and its subsidiaries in 2019, if NT$ appreciates by 1% relative to the US
dollar, the consolidated gross margin will decline by about 0.5%
Inflation or deflation
According to the estimates of the Directorate-General of Budget, Accounting and Statistics, Executive Yuan, R.O.C.
(Taiwan) in 2019, the domestic economic growth rate was 2.71%, and the average annual growth rate of the
consumer price index (CPI) was 0.56%. As such, such a mild price increase should not have a material impact on
the Company’s consolidated operating resultsin 2019. Based on the combined amount of raw material purchased
in NTD by the Company and its subsidiariesin 2019, if the inflation rate increases by 1% (i.e. the consumer price
index increases by 1%), the Company’s combined purchase amount will increase by approximately NT$200 million.
(III) The policies to engage in high-risk, high-leverage investments, capital lending, endorsements and guarantees,
and the derivative transactions, the main reasons for profits and losses, and the future countermeasures:
The Company and its subsidiaries did not engage in high-risk, high-leverage investments, and acted with the principle of
prudence and stability to carry out funds allocation and hedging activities.
When the Company and its subsidiaries are engaged in capital lending, endorsements and guarantees, and derivative
transactions, the Company will, in addition to complying with the relevant handling procedures, and to making a public
announcement and filing the necessary reports in accordance with the regulations of the competent authorities:
1. Capital lending to Others: As of the publication date of the Annual Report, the Company and its subsidiaries are
limited to lending funds to the Company and its subsidiaries.
2. Endorsements and Guarantees: As of the publication date of the Annual Report, the Company and its subsidiaries
are limited to providing endorsements and guarantees for the Company and subsidiaries in which the Company
holds more than 50% of ownership of such subsidiaries’ total shares.
3. Derivative transactions: The Company and its subsidiaries conduct derivative transactions based on the positions
arising from the Company’s business exposed to foreign currency risk. The purpose is to avoid market risks and
reduce the Company’s business operating risks. Based on the consolidated financial statements, gains and losses
on valuation of forward contract derivatives and foreign exchanges gains and losses measured at fair value in 2019
of that period as a net gain of NT$148,053 thousand, indicating that the hedging performance is adequate. The
Company and its subsidiaries will continue to conduct hedging under the principle of avoiding risks arising from
the fluctuation of foreign currency and interest rates. The Company and its subsidiaries will also take business
conditions and market trends into consideration to periodically evaluate positions exposed to interest rate and
foreign currency risks and adjust the relevant hedging strategies. In addition, the Company's subsidiary has
structured time deposits, and gains and losses of the derivative from structured time deposits measured at fair
value for the year in 2019 was a net gain of NT$65,068 thousand.
(IV) Future research and development (R&D) plans and the R&D expenses expected to be invested:
Please see "Chapter 5 Operational Highlights" of this Annual Report which provides information on the "Technology
and R&D Overview" (Pages 60-63)
(V) The impacts of changes on important domestic and foreign policies and laws on the Company’s finance and
business, and the countermeasures:
The Company has always paid close attention to policies and laws that may affect the Company’s operations, and
cooperate with the Company’s related internal policies. The changes in law in 2019 has no significant impact on the
Company after evaluation.
AU Optronics 2019 Annual Report
83
Review and Analysis of Financial Position and Financial Performance, and Risk Management
(VI) The impacts of technology changes on the Company’s finance and business, and the countermeasures:
Market applications of flat panel displays are increasingly diversified, ranging from consumer products such as TVs,
desktop monitors, and notebooks, tablets, mobile phones, and smart watches to non-consumer products including
automotive, medical, digital signage, and various commercial panel displays. Flat panel displays are ever-present in daily
lives, and the TFT-LCD remains the most mature and most competitive technology. AUO has devoted substantial R&D
efforts to developing advanced display technologies for years, and accumulated a wealth of patents and manufacturing
experience.
Display market demand is currently trending toward features including larger size, ultra high resolution, wide color
gamut, high contrast, wide viewing angle, fast response time, narrow bezel, thin and lightweight, stylish appearance, and
low power consumption. Based on existing TFT-LCD competencies, AUO has developed related processes and product
technologies such as GOA (Gate on Array), COA (Color Filter on Array), AHVA (Advanced Hyper-Viewing Angle), and
High Refresh Rate, HDR (High Dynamic Range), curved, free-form cutting, on-cell/in-cell touch, etc., to meet the needs
of market. At the same time, AUO continues to develop new technologies such as AMOLED, Mini LED, Micro LED and
other related technologies to accelerate technology adoption and the development of the entire value chain, delivering
the best image performance possible for viewers worldwide.
(VII) The impacts of change of corporate image on the enterprise crisis management and the countermeasures:
The Company will initiate its crisis management mechanism immediately if there are any concerns that will adversely
impact AUO's operations and corporate reputation in the event of crisis and potential external risks. The emergency
response team will quickly investigate the incident for risk assessment and take necessary actions. This emergency
response team is composed of a cross-section high-level executives from business groups, supply chain management,
environment & safety, human resources, information technology and marketing departments. They will review the
Company's crisis management principles to protect the safety of employees and the environment while ensuring the
efficiency of its manufacturing operations. The Company's crisis communication plan also upholds open communication
principles to ensure that employees, customers, authorities, investors media and related stakeholders have immediate
access to the latest status.
The Company continues to demonstrate potential for sustainable development in the economic, environmental, and
social sectors. The Company shall also maintain its core business values for honesty and integrity and shoulder long-
term responsibilities for sustainable development for the benefit of the stakeholders and society.
(VIII) The expected benefits and possible risks to engage in mergers and acquisitions (M&A) and the
countermeasures:
The Company’s Board of Directors resolved to tender offer the common stock of ADLINK Technology Co., Ltd. at a
consideration of NT $ 57 per share in cash on February 5, 2020. The tender offer period was from February 7, 2020 to
March 12, 2020 and the expected volume of the securities to be acquired was 65,249,177 shares. To enhance the
competitiveness, the Company plans to cooperate with ADLINK to establish a strategic partnership for the Industrial
and Commercial AIoT Ecosystem through the ADLINK tender offer.
(IX) The expected benefits and possible risks to expand the fabs and the countermeasures:
AUO is committed to providing customers with an innovative and high value-added product portfolio. AUO has the
flexibility to adjust and develop various application products with the competitive advantages of the complete
generations of production lines. Small-and-medium-sized TFT-LCD panels will move toward higher specifications such
as ultra-high resolution and low-power mobile phone panels, wearable products, VR/ AR displays, and notebook
computer panel products in the next few years. Based on past LTPS experiences, AUO has invested and constructed
the Gen 6 LTPS fab at Kunshan, China, and the fab has begun mass production in 2017. In addition, to respond to the
market demand of increasing TV sizes over the years, phase 1 and phase 2 of production capacity enhancement in Gen
8.5 fab in Taiwan have also been accomplished in 2016 and 2018 respectively. AUO will also carefully increase production
capacity in the future in line with the complete product lines, and create market differentiation in response to market
changes in supply and demand.
(X) Risk of procurement and sales concentration, and countermeasures:
1. Risks from sales concentration and response measures:
(1) The Company’s major customers accounted for a significant proportion of the Company’s revenue, and the
list of major customers has experienced some changes in response to changes in product mix. The Company's
revenues and profitability will be affected in case orders from major customers have decreased, are delayed,
or canceled, or should major customers be faced with financial difficulties. Therefore, the Company is
committed to maintaining a close relationship with our customers and will continue to provide services that
satisfy their needs. The Company will also strictly monitor the changes in customers' credit status and is
committed to the development of potential customers in order to reduce the risk of concentrated sales.
(2) For customers who accounted for more than 10% of the net sales in the last two years, please refer to
Chapter 5 Operational Highlights of this Annual Report, which provides information on Markets and
Overview of Production and Sales (Pages 67).
AU Optronics 2019 Annual Report
84
2. Risks from purchase concentration and response measures:
(1) Raw material
The Company needs to adequately procure raw materials needed for production purposes. Some of the
purchased raw materials are supplied by a single manufacturer. Therefore, if there is a shortage of raw materials
from the suppliers' end or its upstream manufacturers, and the Company fails to find alternative materials in
time, the risk of not being able to meet the needs of customers in a timely manner may arise. As a result, the
Company's revenue and profit may decline. The Company continues to bring in local suppliers to reduce the
proportion of imported raw materials. In addition to effectively reducing supply chain costs, it also reduces
supply chain risks. In addition, for raw materials that come from a single supplier, the Company distributes its
raw material purchases from upstream in addition to the Company's cooperation with existing suppliers to
bring in more than one production plant. The Company is also committed to bring in new suppliers and
expects to minimize the risks involved.
(2) Equipment
The market for equipment is often supplied from a limited number of suppliers. Machine purchases may take
up to 6 to 12 months or longer in the display panel industry. Therefore, the Company will consider the needs
for operational growth and capacity expansion, and actively seek for equipment and services that can meet
production requirements. In addition, the Company will also discuss various business models with suppliers
to shorten the pre-procurement period of the machines so that the suppliers can pre-arrange the production
plans of the machines. Thus, the suppliers can be expected to provide production equipment and related
services on time to reduce the risks arising from limited or concentrated suppliers and supply.
(3) The Company does not have any suppliers that account for more than 10% of net purchases in the last two
years.
(XI) The impacts and risks arising from major transfer or exchange of shares by directors or shareholders with
over 10 percent of shares in the Company and the countermeasures:
In the most recent year up to the publication date of this Annual Report, the Company is not aware of any risk of
substantial transfer or replacement of shares of directors or large shareholders holding more than 10% of shares, except
those who have already declared according to law.
(XII) Impact, risk, and response measures related to any change in the administrative authority towards the
Company's operations:
In the most recent year up to the publication date of this Annual Report, the Company has not had any operating rights
changes.
(XIII) If there are any litigation, non-litigation or administrative proceedings that has received final judgment or is
still ongoing in which the Company, any of its director, supervisor, general manager, substantial representative,
major shareholder (having holding of more than 10%) or subsidiary is a party and has a material impact on
the shareholders’ interests or stock price, the Company shall disclose the facts in dispute, amount in dispute,
filing date, parties, and status as of the printing of the Report:
1. Final judgments or pending litigation, non-litigation or administrative proceedings in most recent year and as of the
date of printing of this Report which may have a material impact on shareholders’ interests or stock price:
Antitrust Civil Actions Lawsuits
A lawsuit was filed by certain consumers in Israel against certain LCD manufacturers, including us, in the District
Court of the Central District in Israel (“Israeli Court”). The defendants contested various issues, including whether
the lawsuit was properly served. In March 2016, the Israeli Court issued an order stating that the case may proceed
in Israel. We and other defendants appealed the Israeli Court’s decision. The Israeli Court ordered that, except for
the appellate proceedings, all the other court proceedings be stayed. The first-level appellate court heard the appeal
in December 2016. In December 2016, the Israeli Court overturned the original decision and revoked the
permission for this case to be served outside of Israeli jurisdiction. The plaintiffs lodged an appeal to the Israeli
Supreme Court, but the Israeli Supreme Court overruled the appeal in August 2017. In January 2018, the parties
reached a settlement agreement and agreed to commence the required proceedings for withdrawing the lawsuit.
In April 2019, the Central District Court of Israel in Lod approved the settlement. AUO has complied with all the
court ordered directives to finalize the settlement, so the settlement is now completed.
In May 2014, LG Electronics Nanjing Display Co., Ltd. and seven of its affiliates filed a lawsuit in Seoul Central District
Court against certain LCD manufacturers including AUO, alleging overcharge and claiming damages. We do not
believe this lawsuit has merit and have retained counsel to handle this matter. At this stage, the results of this matter
remain uncertain, and we continue to review the merits of this lawsuit on an on-going basis.
A lawsuit was filed in June 2018 by the Government of Puerto Rico and on behalf of all consumers and relevant
government agencies of Puerto Rico against certain LCD manufacturers. The named defendants for this lawsuit
included AUO and AUUS. The lawsuit was filed in the Superior Court of San Juan, Court of First Instance and alleges
unjust enrichment and claiming unspecified monetary damages. We have retained counsel to handle this matter. At
this stage, the outcome of this matter remains uncertain. We are reviewing the merits of this lawsuit on an ongoing
basis, but we are unable to predict the actions of the Government of Puerto Rico or the actions that competent
regulatory agencies may take in connection with this proceeding.

AU Optronics 2019 Annual Report
85
Review and Analysis of Financial Position and Financial Performance, and Risk Management
We will make certain provisions with respect to some, but not all, civil lawsuits as the management deems
appropriate. See Note 45 of our consolidated financial statements for further details. The provisions may ultimately
be proven to be under- or over-estimated. We will reassess the adequacy and reasonableness of the said provisions
and make adjustments as we deem necessary. Any penalties, fines, damages or settlements made in connection with
these legal proceedings and/or lawsuits may have a material adverse effect on our business, results of operations
and future prospects.
Other Litigation
In July 2018, Vista Peak Ventures, LLC (“VPV”) filed three lawsuits in the United States District Court for the Eastern
District of Texas against the Company, claiming infringement of certain of VPV’s patents in the United States relating
to the manufacturing of TFT-LCD panels. In the complaints, VPV seeks, among other items, unspecified monetary
damages for past damages and an injunction against future infringement. On September 27, 2019, the relevant parties
reached a settlement agreement, and all pending lawsuits that have been filed by VPV against AUO were dismissed
on October 10, 2019.
In addition to the matters described above, we and/or our subsidiaries are also a party to other litigations or
proceedings that arise during our or their ordinary course of business. Except as mentioned above, we and/or our
subsidiaries are not involved in any material litigation or proceeding which could be expected to have a material
adverse effect on our business or results of operations.
Environmental Proceedings
There have been environmental proceedings relating to the development project of the Central Taiwan Science
Park in Houli, Taichung, where our second 8.5-generation fab is located and which has been established since 2010.
The proceedings were initiated by six residents in Houli District, Taichung City (the “Plaintiffs”) to object to the
administrative dispositions of the environmental assessment and development approval issued in 2010 by the
Environmental Protection Administration (“EPA”) of the Executive Yuan of Taiwan to the third-phase development
area in the Central Taiwan Science Park (the “Project”). On August 8, 2014, the Plaintiffs reached a settlement with
the defendants (i.e., the governmental authorities, including the EPA of the Executive Yuan of Taiwan, the Ministry of
Science and Technology (former National Science Council of the ROC Executive Yuan) and the Central Taiwan
Science Park Development Office) in the Taipei High Administrative Court). The second-phase environmental
impact assessment for the Project continues to proceed. On December 14, 2017, the EPA of the Executive Yuan of
Taiwan held the third review meeting of the investigation group. The review meeting reached the conclusion of
suggesting approval for the Project. On November 6, 2018, the EPA approved the Project, but on December 6, 2018,
five residents in Houli District, Taichung City filed an administrative appeal to the Appeals Review Committee of
the Executive Yuan requesting a withdrawal of the approval. The administrative appeal was rejected by the Appeal
Review Committee on October 24, 2019 and the residents have proceeded to file an administrative action for
invalidating the environmental assessment again, this time against the EPA. We will continue to monitor if there will
be any material adverse effect on our operations as the event develops.
2. Final judgment, ongoing major litigation, non-litigation or administrative proceedings involving Company directors,
supervisors, General Manager, substantial representative, and shareholders that hold more than 10% of this
Company's stock up to the publication date of this Annual Report that can have a material impact on shareholders'
interest or stock price: none.
3. For the Company’s subsidiary litigations details, please refer to Appendix 1: Consolidated Financial Statement and
Independent Auditors' Report of the most recent year (Pages 97-193).
(XIV) Risk of information security
1. Information Security Committee:
The Company has set up an Information Security Committee to initiate and promote the management of
information security. The committee is headed by the Company Chairman, and meetings are convened by the
President. Senior managers from each department serve as committee members, and meetings are organized
regularly to establish and review the goals and policy of information security management. In addition, to fulfill
information security management in practice, several information security implementation teams have been set up
under the Information Security Committee, including the Technology Control Team, Educational Training Team,
Audit and Investigation Team, Risk Management Team, and Document Control Team. Senior managers from relevant
departments serve as heads of these teams and carry out the information security tasks approved by the
Information Security Committee.
2. Information security policy:
The Company's information security policy is to protect the Company's intellectual property, comprehensively
enhance the awareness for information security, and to collectively create profitable business opportunities. In
addition to improving various internal information security management mechanisms, regular information security
publicity, employee information security education and training over the years, we introduced ISO27001 Information
Security Management System in order to better meet international information security management trends and
respond to customer information security requirements. By regular verification conducted by ISO 27001
Information Safety Management System, we have implemented our information security policy and protected
customer data and the Company's intellectual property. We have also strengthened our crisis management ability
regarding information security incidents and achieved our information security policy KPI.

AU Optronics 2019 Annual Report
86
3. Information security and cyber risk control:
Cyber attacks are ever evolving and changing, and information systems cannot completely prevent any third-party
denial-of-service attacks. Cyber attacks may introduce malware to the Company's internal network for intentional
damage or information theft via emails, phishing, or brute-force attacks. Brute-force attacks may force the
Company's production and operations to stop, while information theft attacks may lead to leaks of material
operating information, or personal information from employees or customers. The Company adopts active
information security strengthening procedures. Besides introducing next-generation firewalls, intrusion prevention
system, malicious email filtering, employee Internet access protection, operating system updates, installing anti-virus
software, and 24/7 information security surveillance service, the Company also evaluates risks related to information
security quarterly through the internal risk management system and reports status of risk control and improvement
plans to the Risk Management Committee to control and mitigate relevant cyber risks.
The Company arranged an information security insurance policy in 2019 to respond to insurance claims that may
incur related expenses (such as restoration and identification) when a major information security incident occurs.
Doing so not only transfers risks but also obtains assistance and resources from external security experts, so as to
continuously review and improve related security operations.
4. Information security training for employees:
The Company regularly organizes email social engineering drills and educates employees on related information
security knowledge such as email sending and receiving to reduce the risk of accidental clicks on malicious emails.
In addition, in view of the frequent occurrence of commercial email scams in recent years, the Company trains
personnel involved in handling cash flows, e.g. colleagues in business, finance, and procurement units, in order to
prevent commercial email scams, and optimizes internal processes to ensure the security of receipts and payments.
Considering the importance of business secret protection, 9,663 employees were offered online training courses
and exams on business secret protection in this respect in 2019. The Company looks to increase the employees'
information security awareness through various information security training sessions, to ensure the knowledge of
information security will be integrated into employees' day-to-day operations.
5. In the most recent year and up to the date of publication of this Annual Report, the Company has not experienced
any major cyber attack incidents that have impacted the Company's operations.
(XV) Other material risks: None.
VII. Other material matters: None.

AU Optronics 2019 Annual Report
87
Special Disclosure
Chapter 8 Special Disclosure I. Information about affiliates
(I) Organization chart of affiliates
December 31, 2019
Note 1: AUCZ is in the process of liquidation.
Note 2: The Company and its subsidiaries obtained more than half of the directors of Star River Energy Corp. However, it has been assessed that
there was evidence of lack of relationships of control and affiliation.
Konly Venture: 100%
Ronly Venture: 100%
AULB: 100%
M. Setek: 99.99%
ACMK: 100%
FFMI: 100%
FHWJ: 100%
AUKR: 100%
AUUS: 100%
AUSJ: 100%
AUVI: 100%
AUKS: 51%
AUSK: 100%
AUJP: 100%
AUSZ: 100%
AUSG: 100%
AENL: 100%
AEUS: 100%
AEDE (Note 1): 100%
BVLB
AULB: 70.29%
Darwin Precision: 29.71%
BVHF: 100%
BVKS (Note 4): 100%
BVXM: 100%
BVHF: 100%
AUST: 100%
AU Optronics Corporation
Corporation Corporation
Space Money: 100%
FHVI: 100%
PMSA: 100%
FWSA: 100%
FTMI: 100%
FTKS: 100%
FPWJ
FWSA: 65.52%
FTMI: 34.48%
FTWJ: 100%
U-Fresh: 100%
A-Care: 100%
BVHF: 100%
AUSH: 100%
EDT: 100%
MIS: 100%
UFSZ: 100%
Sanda Materials: 100%
CQHLD: 100%
CQUK: 100%
CQCA: 100%
DPHK: 100%
DPXM: 100%
DPSZ: 100%
DPLB: 100%
DPSK: 100%
CQUS: 100%
AUNL: 100%
Darwin Precisions
AUO: 28.56%
Konly Venture: 6.40%
Ronly Venture: 6.09%
AUCZ: 100% (Note 1)
AUXM: 100%
AUO Crystal: 100%
JRUS: 100%
JRUK: 100%
UFSD: 100%
BVKS (Note 4): 100%
CQIL: 100%

AU Optronics 2019 Annual Report
88
(II) Basic information of affiliates December 31, 2019; Unit: NT$1,000
Name of business Date of
incorporation Address Paid-in Capital Main Activities
a.u. Vista Inc.
(AUVI) 2014.12.18
8915 Research Drive, Suite 100, Irvine, CA
92618, USA USD 5,000
Research and development
and IP-related business
AFPD Pte., Ltd.
(AUST) 2001.03.14
10 Tampines Industrial Avenue 3 Singapore
528798 SGD 677,065
Manufacturing TFT-LCD
panels based on low
temperature polysilicon
technology
AU Optronics (Czech) s.r.o.
(AUCZ)(Note 1) 2008.01.17
Turanka 859/98d, Slatina, 627 00 Brno, Czech
Republic CZK 365,000 Assembly of solar modules
AU Optronics (L) Corp.
(AULB) 2000.09.07
Level 15B, Main Office Tower, Financial Park
Labuan, Jalan Merdeka, 87000 Labuan F.T.,
Malaysia
USD 1,882,189 Holding and trading company
AU Optronics (Slovakia) s.r.o.
(AUSK) 2009.01.24 Bratislavská 517, 911 05 Trenčín, Slovak Republic EUR 1,000
Repairing of TFT-LCD
modules
AU Optronics Corporation America
(AUUS) 2000.09.11
37085 Grand River Avenue, #340, Farmington, MI
48335, USA USD 1,000
Sales and sales support of
TFT-LCD panels
AU Optronics Corporation Japan
(AUJP) 2001.09.11
3-24-21 Sanwa Bld. 5F, Shiba, Minato-Ku, Tokyo
105-0014, Japan JPY 40,000
Sales support of TFT-LCD
panels
AU Optronics Europe B.V.
(AUNL) 2004.05.24
Zekeringstraat 39, 1014BV Amsterdam,
Netherlands EUR 50
Sales and sales support of
TFT-LCD panels
AU Optronics Korea Ltd.
(AUKR) 2004.07.01
No.906, 9F, Gwanggyo Business Center, 156,
Gwanggyo-ro, Yeongtong-gu, Suwon-si,
Gyeonggi-do, 16506, Korea
KRW 173,075 Sales support of TFT-LCD
panels
AU Optronics Singapore Pte. Ltd.
(AUSG) 2006.09.20
10 Tampines Industrial Avenue 3 Singapore
528798 SGD 60,577
Holding company and sales
support of TFT-LCD panels
AUO Crystal (Malaysia) Sdn. Bhd.
(ACMK) 2010.10.08
Melaka World Solar Valley, 78000 Alor Gajah,
Melaka, Malaysia MYR 46,196
Manufacturing and sales of
solar wafers
AUO Green Energy America Corp.
(AEUS) 2010.09.30
1525 McCarthy Blvd. Suite 218 Milpitas, CA
95035 USA USD 3,510
Sales support of solar-related
products
AUO Green Energy Europe B.V.
(AENL) 2010.09.29
Zekeringstraat 39, 1014BV Amsterdam,
Netherlands EUR 43
Sales support of solar-related
products
BriView (L) Corp.
(BVLB) 2009.07.02
Level 15B, Main Office Tower, Financial Park
Labuan, Jalan Merdeka, 87000 Labuan F.T.,
Malaysia
USD 121,171 Holding company
ComQi Canada Inc.
(CQCA) 2007.03.06
199 Bay Street Suite 4000 Toronto ON M5L
1A9, Canada USD 1,016
Research and development of
content management system
ComQi Holding Ltd.
(CQHLD) 2007.02.27
Bentinck House, 3-8 Bolsover Street, London,
England W1W 6AB USD 27,819 Holding company
ComQi Inc.
(CQUS) 2007.03.05
1209 Orange Street, Corporation Trust Center,
Wilmington, County of New Castle, Delaware
19801
USD 14,120 Sales of content management
system and hardware
ComQi Ltd.
(CQIL) 2010.02.15 14 Yad Harutzim St. Tel Aviv, Israel 67778 USD 34,659 Holding company
ComQi UK Ltd.
(CQUK) 2007.01.23
Bentinck House, 3-8 Bolsover Street, London,
England W1W 6AB USD 2,781
Sales support of content
management system
Darwin Precisions (Hong Kong)
Limited
(DPHK)
2007.11.21 Room 706, Haleson Building, 1 Jubilee Street,
Central, Hong Kong USD 58,786 Holding company
Darwin Precisions (L) Corp.
(DPLB) 2005.11.18
Level 15B, Main Office Tower, Financial Park
Labuan, Jalan Merdeka, 87000 Labuan F.T.,
Malaysia
USD 92,267 Holding company
Darwin Precisions (Slovakia) s.r.o.
(DPSK) 2016.05.07 Bratislavská 517, 911 05 Trenčín, Slovak Republic EUR 4,000
Manufacturing and sales of
automotive parts
Forefront Corporation
(FFMI) 2001.06.20
Level 3, Alexander House, 35 Cybercity, Ebene,
Mauritius USD 6,526 Holding company
Forhouse International Holding Ltd.
(FHVI) 1999.09.17
Portcullis Chambers, 4th Floor, Ellen Skelton
Building, 3076 Sir Francis Drake Highway, Road
Town, Tortola, VG1110, Virgin Islands, British
USD 22,006 Holding company
Fortech International Corp.
(FTMI) 2002.07.26
Level 3, Alexander House, 35 Cybercity, Ebene,
Mauritius USD 6,503 Holding company
Forward Optronics International
Corp.
(FWSA)
2004.12.13 Vistra Corporate Services Centre, Ground Floor
NPF Building, Beach Road, Apia, Samoa USD 19,000 Holding company
JohnRyan Limited
(JRUK)
2019.10.11 Suite 305, Stanmore Bic Howard Road, Stanmore,
UK, HA7 1BT GBP 0
Development and sales of
content management system
and sales of the related
hardware
JohnRyan Inc.
(JRUS) 2019.10.07
1209 Orange Street, Corporation Trust Center,
Wilmington, County of New Castle, Delaware
19801
USD 0
Development and sales of
content management system
and sales of the related
hardware

AU Optronics 2019 Annual Report
89
Special Disclosure
Name of business Date of
incorporation Address Paid-in Capital Main Activities
M.Setek Co., Ltd.
(M.Setek) 1978.02.03
Sanwa Build 5F, 3-24-21 Shiba, Minato-ku Tokyo
105-0014, Japan JPY 18,000
Manufacturing and sales of
ingots
Prime Forward International Ltd.
(PMSA) 2002.01.25
Vistra Corporate Services Centre, Ground Floor
NPF Building, Beach Road, Apia, Samoa USD 31,993 Holding company
AU Optronics (Suzhou) Corp., Ltd
(AUSZ) 2001.06.19
No.398, Suhongzhong Road. Suzhou Industrial
Park USD 278,000
Manufacturing, assembly, and
sales of TFT-LCD modules
AUO Care Management (Suzhou)
Co., Ltd.
(A-Care)
2017.09.22 No.398, Suhongzhong Road. Suzhou Industrial
Park CNY 10,000
Design, development and
sales of software and
hardware for health care
industry
U-Fresh Technology (Suzhou) Co.,
Ltd.
(UFSZ)
2018.02.24 No.398, Suhongzhong Road. Suzhou Industrial
Park CNY 6,000
Planning, design and
development of construction
for environmental
protectionand and related
project management
Edgetech Data Technologies (Suzhou)
Corp., Ltd.
(EDT)
2018.08.28 No.398, Suhongzhong Road. Suzhou Industrial
Park CNY 5,000
Design and sales of software
and hardware system and
equipment relating to
intelligent manufacturing
Mega Insight Smart Manufacturing
(Suzhou) Corp., Ltd.
(MIS)
2018.08.28 No.398, Suhongzhong Road. Suzhou Industrial
Park CNY 5,000
Development and licensing of
software relating to intelligent
manufacturing, and related
consulting services
Darwin Precisions (Suzhou) Corp.
(DPSZ) 2005.12.08
No. 11, Tingxin Street, Suhongzhong Road.
Suzhou Industrial Park USD 25,000
Manufacturing and sales of
backlight modules related
parts
AU Optronics Manufacturing
(Shanghai) Corp.
(AUSJ)
2001.12.20 No.3, Lane 58, Sanzhuang road, songjiang export
processing zone, Shanghai USD 108,000
Manufacturing and assembly
of TFT-LCD modules; leasing
AU Optronics (Shanghai) Co., Ltd.
(AUSH) 2005.09.22
Floor 5, building B, No.33 guangshun road,
Shanghai USD 3,000
Sales support of TFT-LCD
panels
AU Optronics (Kunshan) Co., Ltd.
(AUKS) 2009.08.21
No.6 LongTeng Rd. Kunshan Economic&Technical
Development Zone,Kunshan ,Jiangsu USD 961,000
Manufacturing and sales of
TFT-LCD panels
Fortech Electronics (Kunshan) Co., Ltd.
(FTKS)
2004.01.02 No.6 LongTeng Rd. Kunshan Economic&Technical
Development Zone,Kunshan ,Jiangsu USD 36,000
Manufacturing and sales of
backlight modules and related
parts
BriView (Hefei) Co., Ltd.
(BVHF) 2010.04.09
No. 176, Yuner Rd., Economic and Technology
Development Dist., Hefei City, Anhui Province USD 73,450
Manufacturing and sales of
liquid crystal products and
related parts
Fortech Electronics (Suzhou) Co., Ltd.
(FTWJ) 2002.08.30
No.399, Jin Hu Rd., Wujiang Economic and
Technology Development Dist., Suzhou City, Jiang
Su Province
USD 35,000
Manufacturing and sales of
backlight modules and related
parts
Forhouse Electronics (Suzhou) Co.,
Ltd. (FHWJ)
2001.10.09
No.399, Jin Hu Rd., Wujiang Economic and
Technology Development Dist., Suzhou City, Jiang
Su Province
USD 6,500 Manufacturing of motorized
treadmills
Suzhou Forplax Optronics Co., Ltd.
(FPWJ) 2005.02.28
No.399, Jin Hu Rd., Wujiang Economic and
Technology Development Dist., Suzhou City, Jiang
Su Province
USD 29,000 Manufacturing and sales of
precision plastic parts
U-Fresh Environmental Technology
(Shandong) Co., Ltd.
(UFSD)
2019.05.27
South area, Floor 2, building 7, No.299, zidong
avenue, new material industrial park, tianqiao
district, jinan city
CNY 2,000
Planning, design and
development of construction
for environmental
protectionand and related
project management
AU Optronics (Xiamen) Corp.
(AUXM) 2005.12.13
No.1689, Xiang’An North Road, Xiang’An
Branch,Torch Hi-tech Industrial Development
Zone Xiamen
USD 250,000
Manufacturing , assembly and
sales assembly of TFT-LCD
modules
BriView (Xiamen) Corp.
(BVXM) 2008.12.02
No.1998 Fangshan West
Road,(Xiang’An)Industrial Area,Xiamen Torch Hi-
tech Zone
CNY 600,000
Manufacturing and sales of
liquid crystal products and
related parts
Darwin Precisions (Xiamen)
Corporation
(DPXM)
2006.03.31 No. 3089 Xiang'an North Rd., Xiang'an District,
Xiamen City, 361102, Fujian Province USD 70,000
Manufacturing and sales of
backlight modules and related
parts
Konly Venture Corp.
(Konly Venture) 2002.07.29
9F., No. 198, Jingmao 2nd Rd., Nangang Dist.,
Taipei City 115 NTD 2,843,018 Venture capital investment
Ronly Venture Corp.
(Ronly Venture) 2005.01.11
9F., No. 198, Jingmao 2nd Rd., Nangang Dist.,
Taipei City 115 NTD 1,547,568 Venture capital investment
Space Money Inc.
(Space Money) 2015.10.05
9F., No. 198, Jingmao 2nd Rd., Nangang Dist.,
Taipei City 115 NTD 30,000
Sales and leasing of content
management system and
hardware
AU Optronics 2019 Annual Report
90
Note 1: AUCZ is in the process of liquidation.
(III) Shareholders of the companies presumed to have a relationship of control and affiliation: None.
(IV) Industries covered by all affiliates:
The businesses that all affiliates of AUO are engaged in include manufacturing, assembly, sales and sales support of
LCD, LCD modules, back-lighting modules and color filter; development of solar business related products and solar
power plant. Some of the related enterprises have been set up for investment purpose of relevant technologies to the
aforementioned products and their upstream and downstream Industries. In general, the main purpose is to vertically
integrate the upstream and downstream industry chains so that all affiliates can achieve the maximum synergy through
the integration of their value chains, thereby stabilizing the Company's competitive advantage in the industry.
Name of business Date of
incorporation Address Paid-in Capital Main Activities
U-Fresh Technology Inc.
(U-Fresh) 2017.01.23
9F., No. 198, Jingmao 2nd Rd., Nangang Dist.,
Taipei City 115 NTD 100,000
Planning, design and
development of construction
for environmental
protectionand and related
project management
Sanda Materials Corporation
(Sanda Materials) 2014.04.23
1F., No.20-1, Guangfu N. Rd., Hukou Township,
Hsinchu County, Taiwan NTD 1,168,361 Holding company
Darwin Precisions Corporation
(Darwin Precisions) 1989.10.13
No. 20-1, Guangfu N. Rd., Hukou Township,
Hsinchu County 303 NTD 6,655,551
Manufacturing, design and
sales of TFT-LCD modules,
TV set, backlight modules and
related parts
AUO Crystal Corporation
(AUO Crystal) 2009.05.22
No. 335, Sec. 2, Houke Road, Central Taiwan
Science Park, Houli District, Taichung City,
Taiwan
NTD 4,186,206 Manufacturing and sales of
ingots and solar wafers

AU Optronics 2019 Annual Report
91
Special Disclosure
(V) Directors, supervisors, and presidents of affiliates
December 31, 2019; Unit: in thousand shares; NT$1,000;%
Name of
business Title Name
Shareholding
Shares (Investment Amount) %
AUVI Director TK Wu, Wei-Lung Liau, Hong-Jye Hong
-
AULB holds 5,000 shares
-
100.00
AUST Director Ting-Li Lin, Yi-Cheng Chen
-
AULB holds 907,114 shares
-
100.00
AUCZ
(Note 1)
Director Shih-Hong Liao -
AULB’s investment CZK 365,000
-
100.00
AULB Director Shuang-Lang (Paul) Peng -
The Company holds 1,882,189 shares
-
100.00
AUSK Director Kuo-Hsin (Michael) Tsai -
AULB’s investment EUR 1,000
-
100.00
AUUS Director James CP Chen, John Choe, Linh Ha -
AULB holds 1,000 shares
-
100.00
AUJP Director
James CP Chen, Seki Shih -
AULB holds 1 shares
-
100.00
AUNL Director James CP Chen
-
The Company holds 50 shares
-
100.00
AUKR Director James CP Chen -
AULB’s investment KRW 173,075
-
100.00
AUSG Director Shuang-Lang (Paul) Peng, Yi-Cheng Chen -
AULB holds 266,268 shares
-
100.00
ACMK Director Shih-Hong Liao, Frank CC Cheng, Cheng-Lung Chan -
AUO Crystal holds 46,196 shares
-
100.00
AEUS Director Shih-Hong Liao -
AUSG holds 9,510 shares
-
100.00
AENL Director Shih-Hong Liao -
AUSG holdings -
-
100.00
BVLB Director FC Hsiang, Kuo-Hsin (Michael) Tsai -
AULB holds 85,171 shares
Darwin Precisions holds 36,000 shares
-
70.29
29.71
CQCA Director Hank M. Liu, TY Lin, Iftah Ifhar, Gregory Galvin
-
CQHLD holdings-
-
100.00
CQHLD Director Hank M. Liu, Andy Yang, Iftah Ifhar -
CQIL holds 635,709 shares
-
100.00
CQUS Director Hank M. Liu, Andy Yang, TY Lin, Iftah Ifhar, Stuart
Armstrong
-
CQHLD holds 11 shares
-
100.00
CQIL Director Hank M. Liu, Andy Yang, Iftah Ifhar -
The Company holds 39,974 shares
-
100.00
CQUK Director Hank M. Liu, Andy Yang, Iftah Ifhar -
CQHOLD holdings-
-
100.00
DPHK Director DarwinPrecisions (L) Corp.
FC Hsiang
DPLB holds 10 shares
-
100.00
-
DPLB Director FC Hsiang , Kuo-Hsin (Michael) Tsai -
Darwin Precisions holds 92,267 shares
-
100.00
DPSK Director FC Hsiang -
DPLB’s investment EUR 4,000
-
100.00
FFMI Director FC Hsiang, Kuo-Hsin (Michael) Tsai -
Darwin Precisions’ investment USD 6,526
-
100.00
FHVI Director FC Hsiang, Kuo-Hsin (Michael) Tsai -
Darwin Precisions’ investment USD
22,006
-
100.00
FTMI Director FC Hsiang, Kuo-Hsin (Michael) Tsai -
FHVI’s investment USD 6,503
-
100.00
FWSA Director FC Hsiang, Kuo-Hsin (Michael) Tsai -
FHVI’s investment USD 19,000
-
100.00
JRUK Director Hank M. Liu, Andy Yang, Iftah Ifhar -
CQUS holds-
-
100.00
JRUS Director Hank M. Liu, Andy Yang, Iftah Ifhar -
CQUS holds 10 shares
-
100.00
M.Setek Director
Supervisor
Sheaffer Lee, Jim Lee, Saito Hiroyuki
Betty Chen
-
-
Sanda Materials holds 11,404,184 shares
-
-
99.99
PMSA Director FC Hsiang, Kuo-Hsin (Michael) Tsai -
FHVI’s investment USD 31,993
-
100.00
AU Optronics 2019 Annual Report
92
Name of
business Title Name
Shareholding
Shares (Investment Amount) %
AUSZ Director
Supervisor
President
Shuang-Lang (Paul) Peng, Wei-Lung Liau, Ting-Li Lin
Jack Juang
Robert Kuo
-
-
-
AULB’s investment USD 278,000
-
-
-
100.00
A-Care Director
Supervisor
President
Andy Yang
Jack Juang
Alex JJ Yeh
-
-
-
AUSH’s investment CNY 10,000
-
-
-
100.00
UFSZ Director
Supervisor
President
SK Huang
Jack Juang
Matt Chien
-
-
-
AUSH’s investment CNY 6,000
-
-
-
100.00
EDT Director
Supervisor
President
Andy Yang
Jack Juang
Linda Zhao
-
-
-
AUSH’s investment CNY 5,000
-
-
-
100.00
MIS Director
Supervisor
President
Andy Yang
Jack Juang
Linda Zhao
-
-
-
AUSH’s investment CNY 5,000
-
-
-
100.00
DPSZ Director
Supervisor
President
Chung-Yen Chuang, Chun-Kun Fu, HT Lai
Cathay Ching
HT Lai
-
-
-
DPHK’s investment USD 25,000
-
-
-
100.00
AUSJ Director
Supervisor
President
Shuang-Lang (Paul) Peng, Wei-Lung Liau, Ting-Li Lin
Jack Juang
Robert Kuo
-
-
-
AULB’s investment USD 108,000
-
-
-
100.00
AUSH Director
Supervisor
President
Shuang-Lang (Paul) Peng
Jack Juang
Robert Kuo
-
-
-
AULB’s investment USD 3,000
-
-
-
100.00
AUKS Director
Supervisor
President
Shuang-Lang (Paul) Peng, TY Lin, York-Son Chu, Bo Song,
Wei-Gang Miao
Jack Juang
York-Son Chu
-
-
-
AULB’s investment USD 490,110
Jiangsu Kunshan Development Zone
Construction Group's investment USD
470,890
-
-
-
-
51.00
49.00
FTKS Director
Supervisor
President
Chung-Yen Chuang, Chun-Kun Fu, HT Lai
Cathay Ching
HT Lai
-
-
-
PMSA’s investment USD 36,000
-
-
-
100.00
BVHF Director
Supervisor
President
Chung-Yen Chuang, Chun-Kun Fu, HT Lai
Cathay Ching
HT Lai
-
-
-
BVLB’s investment USD 73,450
-
-
-
100.00
FTWJ Director
Supervisor
President
Chung-Yen Chuang, Chun-Kun Fu, HT Lai
Cathay Ching
HT Lai
-
-
-
FTMI’s investment USD 35,000
-
-
-
100.00
FHWJ Director
Supervisor
President
Chung-Yen Chuang, Chun-Kun Fu, HT Lai
Cathay Ching
HT Lai
-
-
-
FFMI’s investment USD 6,500
-
-
-
100.00
FPWJ Director
Supervisor
President
Chung-Yen Chuang, Chun-Kun Fu, HT Lai
Cathay Ching
HT Lai
-
-
-
FTMI’s investment USD 10,000
FWSA’s investment USD 19,000
-
-
-
34.48
65.52
UFSD Director
Supervisor
President
SK Huang
Jack Juang
Joe Chou
-
-
-
UFSZ’s investment CNY2,000
-
-
-
100.00
AUXM Director
Supervisor
President
Shuang-Lang (Paul) Peng, Wei-Lung Liau, Ting-Li Lin
Jack Juang
David Lee
-
-
-
AULB’s investment USD 250,000
-
-
-
100.00

AU Optronics 2019 Annual Report
93
Special Disclosure
Note 1: AUCZ is in the process of liquidation.
Name of
business Title Name
Shareholding
Shares (Investment Amount) %
BVXM Director
Supervisor
President
Ting-Li Lin, Wei-Lung Liau, David Lee
Jack Juang
David Lee
-
-
-
AUXM’s investment CNY 600,000
-
-
-
100.00
DPXM Director
Supervisor
President
Chung-Yen Chuang, Chun-Kun Fu, Limbo FJ
Cathay Ching
Limbo FJ
-
-
-
DPHK’s investment USD 70,000
-
-
-
100.00
Konly
Venture
Director Representative of AU Optronics Corp.: Shuang-Lang
(Paul) Peng
-
The Company holds 284,302 shares
-
100.00
Ronly
Venture
Director Representative of AU Optronics Corp.: Shuang-Lang
(Paul) Peng
-
The Company holds 154,757 shares
-
100.00
Space
Money
Director Representative of AU Optronics Corp.: Andy Yang -
The Company holds 3,000 shares
-
100.00
U-Fresh
Director
Representative of AU Optronics Corp.: HC Lee
-
The Company holds 10,000 shares
-
100.00
Sanda
Materials
Director
Representative of AUO Crystal: Frank CC Cheng -
AUO Crystal holds 116,836 shares
-
100.00
Darwin
Precisions
Director Representatives of AU Optronics Corp.: FC Hsiang,
Shuang-Lang (Paul) Peng, Kuo-Hsin (Michael) Tsai
HB Chen
Independent Directors: Austin Chen, YP Chung, Vivien
Huey-Juan Hsieh
-
-
Holding 563 shares
-
-
The Company holds 190,108 shares
-
-
0.08
-
-
28.56
AUO Crystal Director Representative of AU Optronics Corp.: Shih-Hong Liao - -
The Company holds 418,583 shares 100.00

AU Optronics 2019 Annual Report
94
(VI) Overview of affiliates’ operations:
December 31, 2019; Unit: other than earnings per share, the rest is in NT$1,000
Name of
business Currency Capital Total assets
Total
liabilities Net assets Revenue
Profit from
operations
Profit or loss
for the year
(After income
tax)
Earnings per
share (Note 1)
(dollar; after
income tax)
AUVI USD 5,000 5,937 62 5,875 2,203 266 255 0.05
AUST USD 433,867 205,036 65,730 139,306 184,271 5,819 2,120 0.00
AUCZ
(Note 1) CZK 365,000 242,234 3,347 238,886 99,079 (15,836) (82,692) -
AULB USD 1,882,189 1,807,283 41,177 1,766,106 108,218 13 44,203 0.02
AUSK EUR 1,000 28,002 7,569 20,433 5,112 558 220 -
AUUS USD 1,000 4,526 2,463 2,063 9,969 281 161 0.16
AUJP JPY 40,000 232,950 40,749 192,202 269,164 10,313 125 156.25
AUNL EUR 50 6,130 5,011 1,119 22,850 441 396 7.92
AUKR KRW 173,075 2,071,690 896,034 1,175,656 1,883,314 72,017 97,367 -
AUSG USD 37,787 34,573 125 34,448 956 39 903 0.00
ACMK USD 15,000 28,193 10,360 17,833 47,599 1,322 1,368 0.03
AEUS USD 3,510 815 1 814 - (12) (1) 0.00
AENL EUR 43 201 47 155 515 20 (11) (25.58)
BVLB USD 121,171 27,134 - 27,134 - (3) (4,313) (0.04)
CQCA USD 1,016 758 208 550 2,283 108 88 797.96
CQHLD USD 27,189 18,491 - 18,491 5,503 4,816 4,811 0.01
CQUS USD 14,120 6,895 3,032 3,863 7,689 (1,790) (1,873) (165.85)
CQIL USD 34,659 16,402 (4) 16,406 - (22) (1,778) (0.04)
CQUK USD 2,781 605 95 510 643 126 123 61,474.99
DPHK USD 58,786 205,804 - 205,804 - - (248) (24.80)
DPLB USD 92,267 208,351 - 208,351 - - (903) (0.01)
DPSK EUR 4,000 4,937 2,663 2,274 5,843 (698) (586) -
FFMI USD 6,526 1,437 - 1,437 - - 200 0.31
FHVI USD 22,006 134,946 - 134,946 - - 3,105 0.14
FTMI USD 6,503 75,756 - 75,756 - - (2,786) (0.43)
FWSA USD 19,000 14,364 - 14,364 - - 146 0.01
JRUK GBP - - - - - - - -
JRUS USD - - - - - - - -
M.Setek JPY 18,000 8,608,315 1,576,836 7,031,479 10,447,680 316,980 665,134 0.06
PMSA USD 31,993 44,825 - 44,825 - - 1,832 0.06
AUSZ CNY 2,208,359 6,093,157 2,683,069 3,410,088 8,276,555 462,000 497,364 -
A-Care CNY 10,000 6,197 2,032 4,165 4,187 (4,254) (4,197) -
UFSZ CNY 6,000 6,672 2,383 4,288 7,512 (1,172) (1,778) -
EDT CNY 5,000 5,131 1,224 3,907 1,999 (1,157) (1,092) -
MIS CNY 5,000 6,272 4,265 2,006 5,325 (3,042) (2,912) -
DPSZ CNY 184,322 473,323 61,006 412,316 177,075 (10,820) 330 -
AUSJ CNY 866,978 881,819 5,043 876,777 9 (16,526) 18,122 -
AUSH CNY 21,787 103,856 7,219 96,637 32,876 1,657 (8,369) -
AUKS CNY 5,948,236 11,558,212 9,292,798 2,265,414 2,771,208 (1,033,607) (1,036,234) -
FTKS CNY 281,567 312,882 (130) 313,012 - 1,596 12,666 -
BVHF CNY 472,327 292,590 103,555 189,035 381,235 (29,847) (29,804) -
FTWJ CNY 279,158 1,041,297 561,372 479,926 853,255 (19,427) (19,795) -
FHWJ CNY 53,779 25,382 15,346 10,035 - (4,047) 1,386 -
FPWJ CNY 223,933 149,537 166 149,371 - (7,904) 1,538 -
UFSD CNY 2,000 1,449 104 1,344 - (658) (656) -
AUXM CNY 1,804,476 5,303,762 2,198,959 3,104,803 6,494,665 163,804 174,624 -
BVXM CNY 600,000 484,611 189,630 294,981 787,073 (1,861) 8,191 -
DPXM CNY 505,962 1,348,601 323,792 1,024,809 1,202,761 (20,347) (2,045) -
Konly
Venture TWD 2,843,018 5,209,097 160 5,208,937 - (4,220) 171,825 0.60
Ronly
Venture TWD 1,547,568 2,049,980 120 2,049,860 - (153) 9,126 0.06
Space Money TWD 30,000 31,671 13,425 18,247 18,197 (11,097) (11,025) (3.68)
U-Fresh TWD 100,000 174,669 85,763 88,906 219,386 (11,111) (11,183) (1.12)
Sanda
Materials TWD 1,168,361 1,983,132 811 1,982,321 - (893) 171,314 1.47
Darwin
Precisions TWD 6,655,551 21,551,256 10,500,304 11,050,952 15,372,936 (204,196) (190,141) (0.29)
AUO Crystal TWD 4,186,206 6,462,954 3,657,513 2,805,441 4,804,614 (632,386) (2,648,071) (6.33)
Note 1: AUCZ is in the process of liquidation.
Note 2: Calculated based on the number of shares outstanding for each company on December 31, 2019.

AU Optronics 2019 Annual Report
95
Special Disclosure
II. Consolidated Financial Statements of Affiliates:
Letter of Statement
The entities that are required to be included in the combined financial statements of AU
Optronics Corp. as of and for the year ended December 31, 2019 under the Criteria Governing
Preparation of Affiliation Reports, Consolidated Business Reports, and Consolidated Financial
Statements of Affiliated Enterprises are the same as those included in the consolidated financial
statements prepared in conformity with the International Financial Reporting Standard No. 10,
“Consolidated Financial Statements” endorsed by the Financial Supervisory Commission of
the Republic of China. In addition, the information required to be disclosed in the combined
financial statements is included in the consolidated financial statements. Consequently, AU
Optronics Corp. and its subsidiaries do not prepare a separate set of combined financial
statements.
Hereby declared
AU Optronics Corporation
Chairman: Shuang-Lang (Paul) Peng
February 5, 2020
III. Affiliation Reports: Not applicable.

AU Optronics 2019 Annual Report
96
IV. Privately placed securities handling status in the most recent year up to the publication date
of this Annual Report shall disclose the date and amount passed by the Shareholders'
Meeting/Board of Directors, price setting basis and reasonableness, selection method for
specific people, necessary reason for organizing private placement, and the completion of fund
application plan after monies and proceeds are fully collected. Fund application status in
privately placed securities and plan implementation progress: Item 2019 Private Placement (Note)
The type of securities Private Placement Common shares and/or overseas or domestic convertible bonds
The date and amount of the Shareholders' Meeting resolution
Approved by the Shareholders' Meeting on June 14, 2019. Amount: It has been approved by the Annual Shareholders’ Meeting held on June 14, 2019, to
authorize the Board of Directors depending on the principles approved by Annual
General Shareholders’ Meeting, within the limit of 950,000,000 common shares, to choose one or more fundraising instruments to issue new common shares for cash to sponsor issuance of the overseas depository shares and/or new common shares for cash in public offering and/or new common shares for cash in private placement and/or
overseas or domestic convertible bonds in private placement in accordance with the applicable laws and regulations.
Basis and reasonableness for
determination of the subscription price
1. The higher of (x) the simple average closing price of the Company’s common shares for 1, 3 or 5 trading days prior to the pricing date, and (y) the simple average closing price of the Company’s common shares for 30 trading days prior to the pricing date, after adjustment for shares issued as stock dividends, shares cancelled in connection with capital reduction and the
cash dividends, as the reference subscription price of the Private Placement Shares. 2. The issue price of the Private Placement Shares shall be no less than 80% of the reference
price. It is proposed to authorize the Board to decide the actual issue price within the range
approved by the shareholders meeting, depending on the status of finding specific investor(s) and market conditions. The issue price of the Private Placement CB shall be no less than 80% of the theoretical price.
3. As aforementioned, subscription price of the Private Placement Shares and issue price of Private Placement CB will be determined with reference to the price of the Company’s common shares and the theoretical price in accordance with the Regulations Governing Public
Companies Issuing Securities in Private Placement, thus, the price should be reasonable.
The method to determine specific
investor(s)
The investors to subscribe to the Private Placement Shares and/or Private Placement CB must meet the qualifications listed in Article 43-6 of the Securities and Exchange Act and are limited to
strategic investor(s). Priority will be given to the investor(s) who could benefit the Company's long
term development, competitiveness, and existing shareholders' rights. The Board is fully authorized to determine the specific investor(s). The purpose, necessity and projected benefits for choosing
strategic investor(s) are to accommodate the Company’s operation and development needs to have the strategic investor(s) to assist the Company, directly or indirectly, in its finance, business, manufacturing, technology, procurement, management, and strategy development, etc. so to
strengthen the Company’s competitiveness and enhance its operational efficiency and long term development.
The necessary of issuance for private placement
Considering the effectiveness and convenience for issuance of the Private Placement Shares/Private
Placement CB and accommodating the Company’s development planning, including inviting the strategic investor(s), it would be necessary to issue the Private Placement Shares and/or Private Placement CB.
Payment completion date
Not applicable (Note)
The place information
Actual subscription (or conversion) price
Actual subscription (or conversion) price and reference price difference
Impact on shareholders' equity for
conducting private placement
The use of funds acquired from private placement and the implementation
progress of the plan
Benefits of private placement
Note: The Annual Shareholders’ Meeting approved to authorize the Board of Directors to handle the fund raising on June 14, 2019, but the
private placement has not been issued as of the publication date of the Annual Report.
V. Holding or disposition of the Company shares by subsidiaries in the most recent year up to
the publication date of this Annual Report: None.
VI. Other items that must be included: None.
VII. Any event that results in substantial impact on the shareholders’ equity or prices of the
Company’s securities as prescribed by Subparagraph 2, Paragraph 3, Article 36 of the Securities
and Exchange Act that have occurred in the most recent year up to the publication date of this
Annual Report: None.

Appendix 1
AU Optronics 2019 Annual Report
97
Appendix 1
Stock Code:2409
AU OPTRONICS CORP.
AND SUBSIDIARIES
Consolidated Financial Statements and
Independent Auditors’ Report
For the Years Ended
December 31, 2019 and 2018
The independent auditors’ report and the accompanying consolidated financial statements are the English translation of the Chinese
version prepared and used in the Republic of China. If there is any conflict between, or any difference in the interpretation of the
English version and Chinese version, the Chinese-language independent auditors’ report and consolidated financial statements shall
prevail.

AU Optronics 2019 Annual Report
98
Representation Letter
The entities that are required to be included in the combined financial statements of AU Optronics Corp. as of
and for the year ended December 31, 2019 under the Criteria Governing Preparation of Affiliation Reports,
Consolidated Business Reports, and Consolidated Financial Statements of Affiliated Enterprises are the same
as those included in the consolidated financial statements prepared in conformity with the International
Financial Reporting Standard No. 10, “Consolidated Financial Statements” endorsed by the Financial
Supervisory Commission of the Republic of China. In addition, the information required to be disclosed in the
combined financial statements is included in the consolidated financial statements. Consequently, AU
Optronics Corp. and its subsidiaries do not prepare a separate set of combined financial statements.
Hereby declare
Company Name: AU Optronics Corp.
Chairman: Shuang-Lang (Paul) Peng
Date: February 5, 2020

Appendix 1
AU Optronics 2019 Annual Report
99
Independent Auditors’ Report
To the Board of Directors of AU Optronics Corp.:
Opinion
We have audited the consolidated financial statements of AU Optronics Corp. and its subsidiaries (“the
Company”), which comprise the consolidated balance sheets as of December 31, 2019 and 2018, the
consolidated statements of comprehensive income, consolidated statements of changes in equity, and
consolidated statements of cash flows for the years ended December 31, 2019 and 2018, and notes to the
consolidated financial statements including a summary of significant accounting policies.
In our opinion, the accompanying consolidated financial statements present fairly, in all material respects, the
consolidated financial position of the Company as of December 31, 2019 and 2018, and its consolidated
financial performance and its consolidated cash flows for each of the years then ended, in accordance with
the Regulations Governing the Preparation of Financial Reports by Securities Issuers and with the
International Financial Reporting Standards (“IFRS”), International Accounting Standards (“IAS”),
Interpretations developed by the International Financial Reporting Interpretations Committee (“IFRIC”) or
the former Standing Interpretations Committee (“SIC”) endorsed and issued into effect by the Financial
Supervisory Commission of the Republic of China.
Basis for Opinion
We conducted our audit in accordance with the Regulations Governing Auditing and Certification of
Financial Statements by Certified Public Accountants and the auditing standards generally accepted in the
Republic of China. Our responsibilities under those standards are further described in the Auditor’s
Responsibilities for the Audit of the Consolidated Financial Statements section of our report. We are
independent of the Company in accordance with the Certified Public Accountants Code of Professional
Ethics in Republic of China (“the Code”), and we have fulfilled our other ethical responsibilities in
accordance with the Code. We believe that the audit evidence we have obtained is sufficient and appropriate
to provide a basis for our opinion.
Emphasis of Matter
As stated in Note 3(1) to the consolidated financial statements, the Company has initially adopted the IFRS
16, “Leases” from January 1, 2019 and applied the modified retrospective approach with no restatement of
comparative period amounts. Our conclusion is not modified in respect of this matter.
Key Audit Matters
Key audit matters are those matters that, in our professional judgment, were of most significance in our audit
of the consolidated financial statements of the current period. These matters were addressed in the context of
our audit of the consolidated financial statements as a whole, and in forming our opinion thereon, and we do
not provide a separate opinion on these matters. We have determined the matters described below to be the
key audit matters to be communicated in our report.
Impairment of long-term non-financial assets (including goodwill)
Refer to Note 4(16) “Impairment – non-financial assets”, Note 5(2) and Note 5(3) “Critical accounting
judgments and key sources of estimation and assumption uncertainty”, Note 6(9) “Property, plant and
equipment”, Note 6(10) “Lease arrangements”, and Note 6(12) “Intangible assets” to the consolidated
financial statements.
AU Optronics 2019 Annual Report
100
Description of key audit matter:
The Company operates in an industry with high investment costs, has goodwill through the acquisition of
subsidiaries, and may experience volatility in response to changes in the external market; hence, it is
important to assess the impairment of its long-term non-financial assets (including goodwill). The
impairment assessment includes identifying cash-generating units, determining a valuation model,
determining significant assumptions, and computing recoverable amounts. With the complexity of the
impairment assessment process and the involvement of significant management judgment regarding
assumptions used, this is one of the key areas our audit focused on.
How the matter was addressed in our audit:
In relation to the key audit matter above, our principal audit procedures included understanding and testing
the Company’s controls surrounding the impairment assessment and testing process; assessing whether there
are impairment indications for the identified cash-generating units of the Company and its related assets;
understanding and assessing the appropriateness of the valuation model used by the management in the
impairment assessment and the significant assumptions used to determine related assets’ future cash flows
projection, useful lives, and weighted-average cost of capital; retrospectively reviewing the accuracy of
assumptions used in prior-period estimates and performing a sensitivity analysis of key assumptions and
results; in addition to the above audit procedures, appointing specialists to evaluate the appropriateness of the
weighted-average cost of capital used and related assumptions; performing an inquiry of the management
and identifying any event after the balance sheet date if able to affect the results of the impairment
assessment; and assessing the adequacy of the Company’s disclosures of its policy on impairment of
noncurrent non-financial assets and other related disclosures.
Revenue recognition
Refer to Note 4(19) “Revenue from contracts with customers” and Note 6(21) “Revenue from contracts with
customers” to the consolidated financial statements.
Description of key audit matter:
Revenue is recognized when the control over a product has been transferred to the customer as specified in
each individual contract with customers. The Company recognizes revenue depending on the various sales
terms in each individual contract with customers to ensure the performance obligation has been satisfied by
transferring control over a product to a customer. In addition, the Company operates in an industry in which
sales revenue is easily influenced by various external factors such as supply and demand of the market, and
this may impact the recognition of revenue. Consequently, this is one of the key areas our audit focused on.
How the matter was addressed in our audit:
In relation to the key audit matter above, our principal audit procedures included understanding and testing
the Company’s controls surrounding revenue recognition; assessing whether appropriate revenue recognition
policies are applied through comparison with accounting standards and understanding the Company’s main
revenue types, its related sales agreements, and sales terms; on a sample basis, inspecting contracts with
customers or customers’ orders and assessing whether the accounting treatment of the related contracts
(including sales terms) is applied appropriately; performing a test of details of sales revenue and
understanding the rationale for any identified significant sales fluctuations and any significant reversals of
revenue through sales discounts and sales returns which incurred within a certain period before or after the
balance sheet date; and assessing the adequacy of the Company’s disclosures of its revenue recognition
policy and other related disclosures.

Appendix 1
AU Optronics 2019 Annual Report
101
Other Matters
AU Optronics Corp. has additionally prepared its parent-company-only financial statements as of and for the
years ended December 31, 2019 and 2018, on which we have issued an unmodified audit opinion with the
paragraph on emphasis of matter and unmodified audit opinion, respectively.
Responsibilities of Management and Those Charged with Governance for the Consolidated Financial
Statements
Management is responsible for the preparation and fair presentation of the consolidated financial statements
in accordance with Regulations Governing the Preparation of Financial Reports by Securities Issuers and
with the IFRS, IAS, IFRIC, SIC endorsed and issued into effect by the Financial Supervisory Commission of
the Republic of China, and for such internal control as management determines is necessary to enable the
preparation of consolidated financial statements that are free from material misstatement, whether due to
fraud or error.
In preparing the consolidated financial statements, management is responsible for assessing the Company’s
ability to continue as a going concern, disclosing, as applicable, matters related to going concern and using
the going concern basis of accounting unless management either intends to liquidate the Company or to
cease operations, or has no realistic alternative but to do so.
Those charged with governance (inclusive of the Audit Committee) are responsible for overseeing the
Company’s financial reporting process.
Auditor’s Responsibilities for the Audit of the Consolidated Financial Statements
Our objectives are to obtain reasonable assurance about whether the consolidated financial statements as a
whole are free from material misstatement, whether due to fraud or error, and to issue an auditors’ report that
includes our opinion. Reasonable assurance is a high level of assurance, but is not a guarantee that an audit
conducted in accordance with the auditing standards generally accepted in the Republic of China will always
detect a material misstatement when it exists. Misstatements can arise from fraud or error and are considered
material if, individually or in the aggregate, they could reasonably be expected to influence the economic
decisions of users taken on the basis of these consolidated financial statements.
As part of an audit in accordance with auditing standards generally accepted in the Republic of China, we
exercised professional judgment and maintained professional skepticism throughout the audit. We also:
1. Identified and assessed the risks of material misstatement of the consolidated financial statements,
whether due to fraud or error, design and perform audit procedures responsive to those risks, and obtain
audit evidence that is sufficient and appropriate to provide a basis for our opinion. The risk of not
detecting a material misstatement resulting from fraud is higher than for one resulting from error, as
fraud may involve collusion, forgery, intentional omissions, misrepresentations, or the override of
internal control.
2. Obtained an understanding of internal control relevant to the audit in order to design audit procedures
that are appropriate in the circumstances, but not for the purpose of expressing an opinion on the
effectiveness of the Company’s internal control.
3. Evaluated the appropriateness of accounting policies used and the reasonableness of accounting
estimates and related disclosures made by management.
4. Concluded on the appropriateness of management’s use of the going concern basis of accounting and,
based on the audit evidence obtained, whether a material uncertainty exists related to events or
conditions that may cast significant doubt on the Company’s ability to continue as a going concern. If
we conclude that a material uncertainty exists, we are required to draw attention in our auditors’ report to
the related disclosures in the consolidated financial statements or, if such disclosures are inadequate, to
modify our opinion. Our conclusions are based on the audit evidence obtained up to

AU Optronics 2019 Annual Report
102
the date of our auditors’ report. However, future events or conditions may cause the Company to cease to
continue as a going concern.
5. Evaluated the overall presentation, structure and content of the consolidated financial statements,
including the disclosures, and whether the consolidated financial statements represent the underlying
transactions and events in a manner that achieves fair presentation.
6. Obtained sufficient and appropriate audit evidence regarding the financial information of the entities or
business activities within the Company to express an opinion on the consolidated financial statements.
We are responsible for the direction, supervision and performance of the group audit. We remain solely
responsible for our audit opinion.
We communicated with those charged with governance regarding, among other matters, the planned scope
and timing of the audit and significant audit findings, including any significant deficiencies in internal
control that we identified during our audit.
We also provided those charged with governance with a statement that we have complied with relevant
ethical requirements regarding independence, and communicated with them all relationships and other
matters that may reasonably be thought to bear on our independence, and where applicable, related
safeguards.
From the matters communicated with those charged with governance, we determined those matters that were
of most significance in the audit of the consolidated financial statements of the current period and are
therefore the key audit matters. We describe these matters in our auditors’ report unless law or regulation
precludes public disclosure about the matter or when, in extremely rare circumstances, we determine that a
matter should not be communicated in our report because the adverse consequences of doing so would
reasonably be expected to outweigh the public interest benefits of such communication.
The engagement partners on the audit resulting in this independent auditors’ report are Wei, Shing-Hai and
Lu, Chien-Hui.
KPMG
Hsinchu, Taiwan (Republic of China)
February 25, 2020
Notice to Readers
The accompanying consolidated financial statements are intended only to present the consolidated financial position, financial
performance, and cash flows in accordance with the Regulations Governing the Preparation of Financial Reports by Securities
Issuers and with the IFRS, IAS, IFRIC, SIC endorsed and issued into effect by the Financial Supervisory Commission of the Republic
of China. The standards, procedures and practices to audit such consolidated financial statements are those generally accepted and
applied in the Republic of China.
The independent auditors’ report and the accompanying consolidated financial statements are the English translation of the Chinese
version prepared and used in the Republic of China. If there is any conflict between, or any difference in the interpretation of the
English version and Chinese version, the Chinese-language independent auditors’ report and consolidated financial statements shall
prevail.

Appendix
1
AU
Optro
nics
2019 A
nnual R
epo
rt 103
AU OPTRONICS CORP. AND SUBSIDIARIES
Consolidated Balance Sheets
December 31, 2019 and 2018 (Expressed in thousands of New Taiwan dollars)
December 31,
2019 2018
Assets Amount % Amount %
Current assets:
1100 Cash and cash equivalents (Note 6(1)) $ 80,449,772 20 69,163,296 17
1110 Financial assets at fair value through profit or loss-current (Note 6(2)) 1,521,406 - 1,709,531 -
1170 Notes and accounts receivable, net (Note 6(4)) 30,308,675 8 44,647,981 11
1180 Accounts receivable from related parties, net (Notes 6(4)&7) 1,778,499 - 2,754,253 1
1210 Other receivables from related parties (Note 7) 3,956 - 12,945 -
1220 Current tax assets 79,886 - 69,156 -
130X Inventories (Note 6(5)) 23,460,072 6 26,309,104 6
1476 Other current financial assets (Notes 6(4)&8) 2,302,383 1 1,459,763 -
1479 Other current assets (Note 6(13)) 3,295,562 1 2,941,598 1
143,200,211 36 149,067,627 36
Noncurrent assets:
1517 Financial assets at fair value through other comprehensive income-
noncurrent (Note 6(3)) 7,545,171 2 6,979,925 2
1550 Investments in equity-accounted investees (Note 6(6)) 5,999,479 2 6,285,865 2
1600 Property, plant and equipment (Notes 6(9),7&8) 206,734,543 52 221,586,475 54
1755 Right-of-use assets (Note 6(10)) 12,207,768 3 - -
1760 Investment property (Note 6(11)) 1,555,130 - 730,306 -
1780 Intangible assets (Notes 6(7)&(12)) 12,808,326 3 13,377,263 3
1840 Deferred tax assets (Note 6(27)) 5,181,617 1 6,632,668 2
1900 Other noncurrent assets (Notes 6(13)&8) 2,405,346 1 5,171,646 1
254,437,380 64 260,764,148 64
Total Assets $ 397,637,591 100 409,831,775 100
December 31,
2019 2018
Liabilities and Equity Amount % Amount %
Current liabilities:
2100 Short-term borrowings (Note 6(14)) $ 1,725,602 - 546,472 -
2120 Financial liabilities at fair value through profit or loss-current (Note 6(2)) 18,859 - 22,115 -
2170 Accounts payable 44,307,437 11 50,459,587 12
2180 Accounts payable to related parties (Note 7) 6,950,828 2 8,161,186 2
2213 Equipment and construction payable (Note 7) 6,316,902 2 11,231,333 3
2220 Other payables to related parties (Note 7) 40,584 - 27,998 -
2230 Current tax liabilities 1,523,879 - 3,094,253 1
2250 Provisions-current (Note 6(16)) 708,268 - 1,507,564 -
2280 Lease liabilities-current (Note 6(10)) 682,367 - - -
2399 Other current liabilities 18,718,165 5 24,291,532 6
2322 Current installments of long-term borrowings (Notes 6(15)&8) 9,535,198 3 29,595,931 7
90,528,089 23 128,937,971 31
Noncurrent liabilities:
2540 Long-term borrowings, excluding current installments (Notes 6(15)&8) 102,433,194 26 56,709,387 14
2550 Provisions-noncurrent (Note 6(16)) 1,053,290 - 1,030,485 -
2570 Deferred tax liabilities (Note 6(27)) 3,264,100 1 3,845,593 1
2580 Lease liabilities-noncurrent (Note 6(10)) 10,408,710 3 - -
2600 Other noncurrent liabilities (Note 6(18)) 1,973,459 - 2,029,651 1
119,132,753 30 63,615,116 16
Total liabilities 209,660,842 53 192,553,087 47
Equity: (Note 6(19))
Equity attributable to shareholders of AU Optronics Corp.:
3100 Common stock 96,242,451 24 96,242,451 23
3200 Capital surplus 60,544,474 15 60,622,043 15
3300 Retained earnings 22,903,722 6 46,845,991 11
3400 Other components of equity (2,005,384) (1) (847,770) -
3500 Treasury stock (1,013,423) - - -
176,671,840 44 202,862,715 49
Non-controlling interests:
36XX Non-controlling interests 11,304,909 3 14,415,973 4
Total equity 187,976,749 47 217,278,688 53
Total Liabilities and Equity $ 397,637,591 100 409,831,775 100
See accompanying notes to the consolidated financial statements
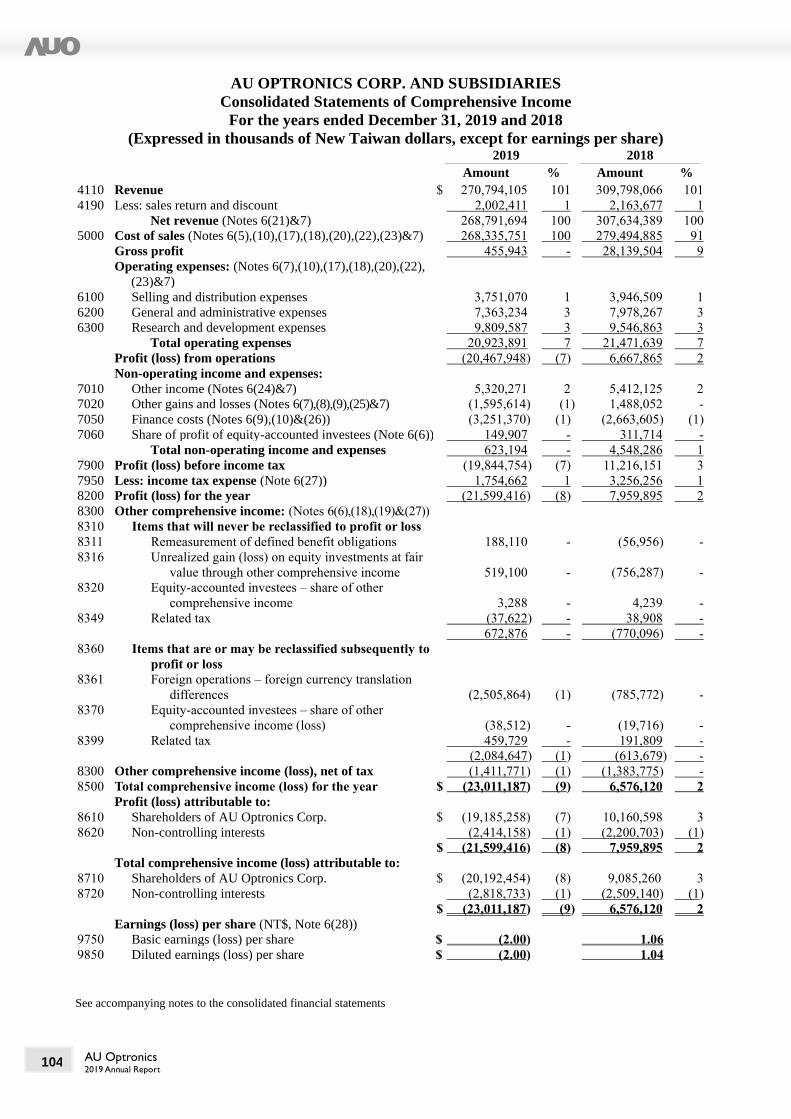
AU Optronics 2019 Annual Report
104
AU OPTRONICS CORP. AND SUBSIDIARIES
Consolidated Statements of Comprehensive Income
For the years ended December 31, 2019 and 2018
(Expressed in thousands of New Taiwan dollars, except for earnings per share) 2019 2018
Amount % Amount %
4110 Revenue $ 270,794,105 101 309,798,066 101
4190 Less: sales return and discount 2,002,411 1 2,163,677 1
Net revenue (Notes 6(21)&7) 268,791,694 100 307,634,389 100
5000 Cost of sales (Notes 6(5),(10),(17),(18),(20),(22),(23)&7) 268,335,751 100 279,494,885 91
Gross profit 455,943 - 28,139,504 9
Operating expenses: (Notes 6(7),(10),(17),(18),(20),(22),
(23)&7)
6100 Selling and distribution expenses 3,751,070 1 3,946,509 1
6200 General and administrative expenses 7,363,234 3 7,978,267 3
6300 Research and development expenses 9,809,587 3 9,546,863 3
Total operating expenses 20,923,891 7 21,471,639 7
Profit (loss) from operations (20,467,948) (7) 6,667,865 2
Non-operating income and expenses:
7010 Other income (Notes 6(24)&7) 5,320,271 2 5,412,125 2
7020 Other gains and losses (Notes 6(7),(8),(9),(25)&7) (1,595,614) (1) 1,488,052 -
7050 Finance costs (Notes 6(9),(10)&(26)) (3,251,370) (1) (2,663,605) (1)
7060 Share of profit of equity-accounted investees (Note 6(6)) 149,907 - 311,714 -
Total non-operating income and expenses 623,194 - 4,548,286 1
7900 Profit (loss) before income tax (19,844,754) (7) 11,216,151 3
7950 Less: income tax expense (Note 6(27)) 1,754,662 1 3,256,256 1
8200 Profit (loss) for the year (21,599,416) (8) 7,959,895 2
8300 Other comprehensive income: (Notes 6(6),(18),(19)&(27))
8310 Items that will never be reclassified to profit or loss
8311 Remeasurement of defined benefit obligations 188,110 - (56,956) -
8316 Unrealized gain (loss) on equity investments at fair
value through other comprehensive income 519,100 - (756,287) -
8320 Equity-accounted investees – share of other
comprehensive income 3,288 - 4,239 -
8349 Related tax (37,622) - 38,908 -
672,876 - (770,096) -
8360 Items that are or may be reclassified subsequently to
profit or loss
8361 Foreign operations – foreign currency translation
differences (2,505,864) (1) (785,772) -
8370 Equity-accounted investees – share of other
comprehensive income (loss) (38,512) - (19,716) -
8399 Related tax 459,729 - 191,809 -
(2,084,647) (1) (613,679) -
8300 Other comprehensive income (loss), net of tax (1,411,771) (1) (1,383,775) -
8500 Total comprehensive income (loss) for the year $ (23,011,187) (9) 6,576,120 2
Profit (loss) attributable to:
8610 Shareholders of AU Optronics Corp. $ (19,185,258) (7) 10,160,598 3
8620 Non-controlling interests (2,414,158) (1) (2,200,703) (1)
$ (21,599,416) (8) 7,959,895 2
Total comprehensive income (loss) attributable to:
8710 Shareholders of AU Optronics Corp. $ (20,192,454) (8) 9,085,260 3
8720 Non-controlling interests (2,818,733) (1) (2,509,140) (1)
$ (23,011,187) (9) 6,576,120 2
Earnings (loss) per share (NT$, Note 6(28))
9750 Basic earnings (loss) per share $ (2.00) 1.06
9850 Diluted earnings (loss) per share $ (2.00) 1.04
See accompanying notes to the consolidated financial statements
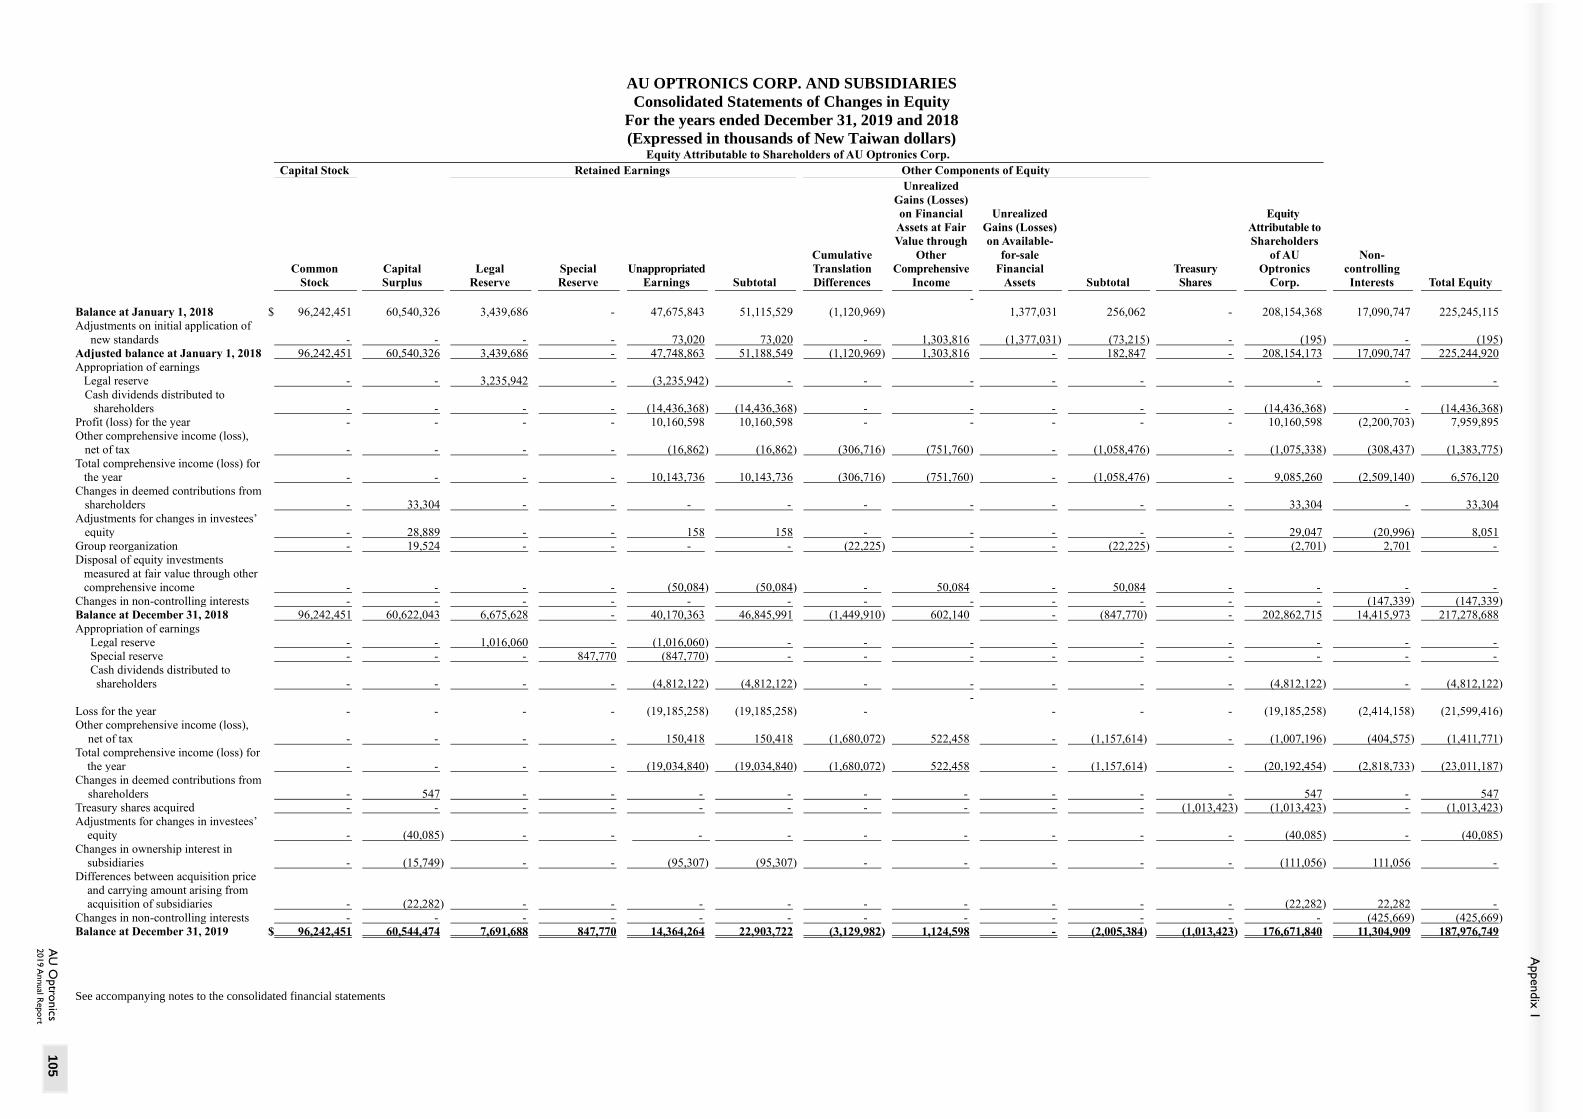
AU
Optro
nics
2019 A
nnual R
epo
rt
Appendix
1
105
AU OPTRONICS CORP. AND SUBSIDIARIES
Consolidated Statements of Changes in Equity
For the years ended December 31, 2019 and 2018
(Expressed in thousands of New Taiwan dollars)
See accompanying notes to the consolidated financial statements
Equity Attributable to Shareholders of AU Optronics Corp.
Non-
controlling
Interests Total Equity
Capital Stock Retained Earnings Other Components of Equity
Common
Stock
Capital
Surplus
Legal
Reserve
Special
Reserve
Unappropriated
Earnings Subtotal
Cumulative
Translation
Differences
Unrealized
Gains (Losses)
on Financial
Assets at Fair
Value through
Other
Comprehensive
Income
Unrealized
Gains (Losses)
on Available-
for-sale
Financial
Assets Subtotal
Treasury
Shares
Equity
Attributable to
Shareholders
of AU
Optronics
Corp.
Balance at January 1, 2018 $ 96,242,451 60,540,326 3,439,686 - 47,675,843 51,115,529 (1,120,969)
-
1,377,031 256,062 - 208,154,368 17,090,747 225,245,115
Adjustments on initial application of
new standards - - - - 73,020 73,020 - 1,303,816 (1,377,031) (73,215) - (195) - (195)
Adjusted balance at January 1, 2018 96,242,451 60,540,326 3,439,686 - 47,748,863 51,188,549 (1,120,969) 1,303,816 - 182,847 - 208,154,173 17,090,747 225,244,920
Appropriation of earnings
Legal reserve - - 3,235,942 - (3,235,942) - - - - - - - - -
Cash dividends distributed to
shareholders - - - - (14,436,368) (14,436,368) - - - - - (14,436,368) - (14,436,368)
Profit (loss) for the year - - - - 10,160,598 10,160,598 - - - - - 10,160,598 (2,200,703) 7,959,895
Other comprehensive income (loss),
net of tax - - - - (16,862) (16,862) (306,716) (751,760) - (1,058,476) - (1,075,338) (308,437) (1,383,775)
Total comprehensive income (loss) for
the year - - - - 10,143,736 10,143,736 (306,716) (751,760) - (1,058,476) - 9,085,260 (2,509,140) 6,576,120
Changes in deemed contributions from
shareholders - 33,304 - - - - - - - - - 33,304 - 33,304
Adjustments for changes in investees’
equity - 28,889 - - 158 158 - - - - - 29,047 (20,996) 8,051
Group reorganization - 19,524 - - - - (22,225) - - (22,225) - (2,701) 2,701 -
Disposal of equity investments
measured at fair value through other
comprehensive income - - - - (50,084) (50,084) - 50,084 - 50,084 - - - -
Changes in non-controlling interests - - - - - - - - - - - - (147,339) (147,339)
Balance at December 31, 2018 96,242,451 60,622,043 6,675,628 - 40,170,363 46,845,991 (1,449,910) 602,140 - (847,770) - 202,862,715 14,415,973 217,278,688
Appropriation of earnings
Legal reserve - - 1,016,060 - (1,016,060) - - - - - - - - -
Special reserve - - - 847,770 (847,770) - - - - - - - - -
Cash dividends distributed to
shareholders - - - - (4,812,122) (4,812,122) - - - - - (4,812,122) - (4,812,122)
Loss for the year - - - - (19,185,258) (19,185,258) -
-
- - - (19,185,258) (2,414,158) (21,599,416)
Other comprehensive income (loss),
net of tax - - - - 150,418 150,418 (1,680,072) 522,458 - (1,157,614) - (1,007,196) (404,575) (1,411,771)
Total comprehensive income (loss) for
the year - - - - (19,034,840) (19,034,840) (1,680,072) 522,458 - (1,157,614) - (20,192,454) (2,818,733) (23,011,187)
Changes in deemed contributions from
shareholders - 547 - - - - - - - - - 547 - 547
Treasury shares acquired - - - - - - - - - - (1,013,423) (1,013,423) - (1,013,423)
Adjustments for changes in investees’
equity - (40,085) - - - - - - - - - (40,085) - (40,085)
Changes in ownership interest in
subsidiaries - (15,749) - - (95,307) (95,307) - - - - - (111,056) 111,056 -
Differences between acquisition price
and carrying amount arising from
acquisition of subsidiaries - (22,282) - - - - - - - - - (22,282) 22,282 -
Changes in non-controlling interests - - - - - - - - - - - - (425,669) (425,669)
Balance at December 31, 2019 $ 96,242,451 60,544,474 7,691,688 847,770 14,364,264 22,903,722 (3,129,982) 1,124,598 - (2,005,384) (1,013,423) 176,671,840 11,304,909 187,976,749

AU Optronics 2019 Annual Report
106
AU OPTRONICS CORP. AND SUBSIDIARIES
Consolidated Statements of Cash Flows
For the years ended December 31, 2019 and 2018
(Expressed in thousands of New Taiwan dollars)
2019 2018
Cash flows from operating activities:
Profit (loss) before income tax $ (19,844,754) 11,216,151
Adjustments for:
- depreciation 35,693,033 33,686,561
- amortization 564,686 540,969
- gains on financial instruments at fair value through profit or loss (41,065) (406,507)
- interest expense 3,251,370 2,663,605
- interest income (885,520) (841,615)
- dividend income (295,575) (468,263)
- share of profit of equity-accounted investees (149,907) (311,714)
- gains on disposals of property, plant and equipment, net (106,546) (1,923,044)
- losses on disposals of investments and financial assets, net 13,154 -
- impairment losses on assets 2,298,646 399,363
- unrealized foreign currency exchange losses (gains) (430,183) 545,856
- others 26,468 (132,537)
Changes in operating assets and liabilities:
- notes and accounts receivable 13,685,703 (3,702,504)
- receivables from related parties 984,744 (826,893)
- inventories 2,794,115 (1,654,060)
- other current assets (926,326) 3,260,786
- accounts payable (5,014,990) 2,776,504
- payables to related parties (1,197,773) 503,293
- net defined benefit liability (89,422) (82,176)
- provisions (759,948) 636,100
- other current liabilities (4,906,788) (3,679,040)
Cash generated from operations 24,663,122 42,200,835
Cash received from interest income 919,840 815,890
Cash received from dividends 568,871 670,234
Cash paid for interest (3,417,833) (2,481,821)
Cash paid for income taxes (2,003,361) (1,004,444)
Net cash provided by operating activities 20,730,639 40,200,694
See accompanying notes to the consolidated financial statements

AU Optronics 2019 Annual Report
107
Appendix 1
AU OPTRONICS CORP. AND SUBSIDIARIES
Consolidated Statements of Cash Flows (Continued)
For the years ended December 31, 2019 and 2018
(Expressed in thousands of New Taiwan dollars)
2019 2018
Cash flows from investing activities:
Acquisitions of financial assets at fair value through profit or loss (3,668,175) (2,509,528)
Disposals of financial assets at fair value through profit or loss 3,970,809 924,567
Acquisitions of financial assets at fair value through other
comprehensive income (47,182) (3,452,722)
Disposals of financial assets at fair value through other comprehensive
income - 59,021
Acquisitions of equity-accounted investees - (684,756)
Proceeds from disposals of equity-accounted investees 904,050 -
Proceeds from return of capital by equity-accounted investees - 99,200
Net cash outflow arising from acquisition of subsidiaries - (448,488)
Net cash inflows resulting from disposals of subsidiaries - 51,387
Acquisitions of property, plant and equipment (29,546,642) (34,770,263)
Proceeds from disposals of property, plant and equipment 170,880 6,408,057
Decrease (increase) in refundable deposits 49,670 (169,666)
Increase in intangible assets (1,711) -
Decrease (increase) in other financial assets 55,945 (4,635)
Net cash used in investing activities (28,112,356) (34,497,826)
Cash flows from financing activities:
Proceeds from short-term borrowings 2,576,584 2,526,082
Repayments of short-term borrowings (1,388,334) (5,343,976)
Proceeds from long-term borrowings 79,880,000 4,271,566
Repayments of long-term borrowings (53,378,766) (28,736,527)
Payment of lease liabilities (694,922) -
Guarantee deposits refunded (1,828) (13,402)
Cash dividends (4,812,122) (14,436,368)
Repurchase of treasury shares (1,013,423) -
Net change of non-controlling interests and others (425,122) (114,035)
Net cash provided by (used in) financing activities 20,742,067 (41,846,660)
Effect of exchange rate change on cash and cash equivalents (2,073,874) 286,472
Net increase (decrease) in cash and cash equivalents 11,286,476 (35,857,320)
Cash and cash equivalents at January 1 69,163,296 105,020,616
Cash and cash equivalents at December 31 $ 80,449,772 69,163,296
See accompanying notes to the consolidated financial statements

AU Optronics 2019 Annual Report
108
(Continued)
AU OPTRONICS CORP. AND SUBSIDIARIES
Notes to Consolidated Financial Statements
For the years ended December 31, 2019 and 2018
(Expressed in thousands of New Taiwan dollars, unless otherwise indicated)
1. Organization
AU Optronics Corp. (“AUO”) was founded on August 12, 1996 and is located in Hsinchu Science Park,
the Republic of China (“ROC”). AUO’s main activities are the research, development, production and
sale of thin film transistor liquid crystal displays (“TFT-LCDs”) and other flat panel displays used in a
wide variety of applications. AUO also engages in the production and sale of solar modules and systems.
AUO’s common shares have been publicly listed on the Taiwan Stock Exchange since September 2000,
and its American Depositary Shares (“ADSs”) have been listed on the New York Stock Exchange
(“NYSE”) since May 2002. On and from October 1, 2019, AUO’s ADSs has delisted from the NYSE and
begun trading on the over-the-counter (“OTC”) market.
On September 1, 2001, October 1, 2006 and October 1, 2016, Unipac Optoelectronics Corp. (“Unipac”),
Quanta Display Inc. (“QDI”) and Taiwan CFI Co., Ltd. (“CFI”) were merged with and into AUO,
respectively. AUO is the surviving Company, whereas Unipac, QDI and CFI were dissolved.
The consolidated financial statements comprise AUO and its subsidiaries (collectively as “the Company”).
2. The Authorization of Financial Statements
These consolidated financial statements were approved and authorized for issue by the Board of Directors
of AUO on February 5, 2020.
3. Application of New and Revised Standards, Amendments and Interpretations
(1) Impact of adoption of new, revised or amended standards and interpretations endorsed by the
Financial Supervisory Commission, ROC (“FSC”)
In preparing the accompanying consolidated financial statements, the Company has adopted the
following International Financial Reporting Standards (“IFRS”), International Accounting Standards
(“IAS”), Interpretations developed by the International Financial Reporting Interpretations
Committee (“IFRIC”) or the former Standing Interpretations Committee (“SIC”) issued by the
International Accounting Standards Board (“IASB”) (collectively, “IFRSs”) and endorsed by the
FSC with effective date from January 1, 2019.
New, Revised or Amended Standards and Interpretations Effective Date
Issued by IASB Amendments to IFRS 9, Prepayment Features with Negative
Compensation
January 1, 2019
IFRS 16, Leases January 1, 2019
Amendments to IAS 19, Plan Amendment, Curtailment or Settlement January 1, 2019
Amendments to IAS 28, Long-term Interests in Associates and Joint
Ventures
January 1, 2019
IFRIC 23, Uncertainty over Income Tax Treatments January 1, 2019
Annual Improvements to IFRSs 2015 – 2017 Cycle January 1, 2019
AU Optronics 2019 Annual Report
Appendix 1
(Continued)
AU OPTRONICS CORP. AND SUBSIDIARIES
Notes to Consolidated Financial Statements
109
Except for the item discussed below, the adoption of abovementioned standards and interpretations
has not had a material impact on the Company’s accounting policies.
IFRS 16, Leases
IFRS 16 sets out the accounting standards for leases, which replaces IAS 17, Leases and the related
interpretations.
Upon the initial application of IFRS 16, if the Company is a lessee, it is required to recognize a right-
of-use asset and a lease liability on the balance sheet for all leases with exception for leases of low-
value assets and short-term leases which the Company may elect to apply the accounting method
similar to the accounting for operating lease under IAS 17. Additionally, a depreciation expense
charged on the right-of-use asset and an interest expense accrued on the lease liability, for which
interest is computed by using effective interest method, are recognized separately on the statement
of comprehensive income. On the statement of cash flows, cash payments for the principal amount
of the lease liability is classified within financing activities; cash payments for interest portion is
classified within operating activities. See Note 4(14) for an explanation of the Company’s accounting
policies on leases.
When IFRS 16 became effective, as a lessee, the Company applied this Standard using the modified
retrospective approach with the cumulative effect of the initial application of this Standard
recognized at the date of initial application. Comparative financial information, therefore, has not
been restated. The Company is not required to make any adjustments on transition to IFRS 16 for
leases in which it acts as a lessor, except for a sublease. The Company has accounted for those leases
in accordance with IFRS 16 starting from the date of initial application. On January 1, 2019, based
on the assessment of the remaining contractual terms and conditions agreed in head leases and
subleases, all of the Company’s subleases were classified as operating leases.
As at January 1, 2019, lease liabilities recognized for leases previously classified as an operating
lease under IAS 17, except for leases of low-value asset and short-term leases, were measured at the
present value of the remaining lease payments, discounted using the lessee’s incremental borrowing
rate at the date of initial application. Right-of-use assets were measured at an amount equal to the
lease liabilities, adjusted by the amount of any prepaid or accrued lease payments relating to that
lease. The Company also tested right-of-use assets for impairment applying IAS 36.
In addition, the Company used the following practical expedients when applying IFRS 16 to leases.
a. Applied a single discount rate to a portfolio of leases with reasonably similar characteristics.
b. Applied the exemption not to recognize right-of-use assets and lease liabilities to leases for which
the lease term ends within 12 months of the date of initial application.
c. Excluded initial direct costs from the measurement of the right-of-use assets at the date of initial
application.
d. Used hindsight when determining the lease term if the contract contains options to extend or
terminate the lease.
For leases that were classified as finance leases under IAS 17, the carrying amount of the right-of-
use asset and the lease liability at the date of initial application were determined at the carrying
amount of the lease asset and lease payable under IAS 17 as at December 31, 2018.

(Continued)
AU OPTRONICS CORP. AND SUBSIDIARIES
Notes to Consolidated Financial Statements
AU Optronics 2019 Annual Report
110
The weighted average lessee’s incremental borrowing rate applied to lease liabilities recognized by
the Company at January 1, 2019 is 1.87%. The reconciliation between the lease liabilities recognized
and the future minimum lease payments of non-cancellable operating leases on December 31, 2018
is presented as follows:
Amounts
(in thousands)
The future minimum lease payments of non-cancellable operating
leases on December 31, 2018
$
5,942,211
Recognition exemption for short-term leases (43,032)
Other leases in scope of IFRS 16 125,328
Undiscounted amount on January 1, 2019 $ 6,024,507
Discounted amount using the incremental borrowing rate on January 1,
2019
$
5,445,818
Finance lease liabilities recognized on December 31, 2018 2,496
Extension of lease that reasonably certain to be exercised 7,241,212
Lease liabilities recognized on January 1, 2019 $ 12,689,526
The following table summarized the impacts of initially applying IFRS 16 on the Company’s assets,
liabilities and equity as at January 1, 2019.
January 1, 2019
Carrying
amount under
IAS 17 and
related
standards and
interpretations
Adjustments
from changes
in accounting
policies
Carrying
amount under
IFRS 16
(in thousands)
Other current assets $ 2,941,598 (6,638) 2,934,960
Property, plant and equipment 221,586,475 (1,765) 221,584,710
Right-of-use assets - 14,059,544 14,059,544
Other noncurrent assets 5,171,646 (1,364,111) 3,807,535
Impacts to total assets $ 12,687,030
Lease liabilities–current $ - 708,167 708,167
Other current liabilities 24,291,532 (931) 24,290,601
Lease liabilities–noncurrent - 11,981,359 11,981,359
Other noncurrent liabilities 2,029,651 (1,565) 2,028,086
Impacts to total liabilities $ 12,687,030
Impacts to total equity $ -

AU Optronics 2019 Annual Report
Appendix 1
(Continued)
AU OPTRONICS CORP. AND SUBSIDIARIES
Notes to Consolidated Financial Statements
111
(2) Impact of the IFRSs that have been endorsed by the FSC but not yet in effect
According to Ruling No. 1080323028 issued by the FSC on July 29, 2019, commencing from 2020,
the Company is required to adopt the IFRSs that have been endorsed by the FSC with effective date
from 2020. The related new, revised or amended standards and interpretations are set out below:
New, Revised or Amended Standards and Interpretations Effective Date
Issued by IASB Amendments to IFRS 3, Definition of a Business January 1, 2020
Amendments to IFRS 9, IAS 39 and IFRS 7, Interest Rate Benchmark
Reform
January 1, 2020
Amendments to IAS 1 and IAS 8, Definition of Material January 1, 2020
The Company assesses that the initial adoption of the abovementioned standards would not have any
material impact on its accounting policies.
(3) The IFRSs issued by the IASB but not yet endorsed by the FSC
A summary of the new or/and amended IFRSs issued by the IASB but not yet endorsed by the FSC
is set out below.
New, Revised or Amended Standards and Interpretations Effective Date
Issued by IASB Amendments to IFRS 10 and IAS 28, Sale or Contribution of Assets
between an Investor and its Associate or Joint Venture
Subject to IASB’s
announcement
IFRS 17, Insurance Contracts January 1, 2021
Amendments to IAS 1,Classification of Liabilities as Current or Non-
Current
January 1, 2022
Note: The aforementioned new, revised and amended standards and interpretations are effective for
annual periods beginning on or after the respective effective dates.
As of the date that the accompanying consolidated financial statements were issued, the Company
continues in assessing the impact on its financial position and results of operations as a result of the
application of abovementioned standards and interpretations. The related impact will be disclosed
when the assessment is complete.
4. Summary of Significant Accounting Policies
The significant accounting policies applied in the preparation of these consolidated financial statements
are set out as below. The significant accounting policies have been applied consistently to all periods
presented in these consolidated financial statements.
(1) Statement of compliance
The consolidated financial statements have been prepared in accordance with the Regulations
Governing the Preparation of Financial Reports by Securities Issuers (hereinafter referred to as “the
Regulations”) and the IFRSs endorsed by the FSC with effective dates (hereinafter referred to as
“TIFRSs”).

(Continued)
AU OPTRONICS CORP. AND SUBSIDIARIES
Notes to Consolidated Financial Statements
AU Optronics 2019 Annual Report
112
(2) Basis of preparation
a. Basis of measurement
The consolidated financial statements have been prepared on the historical cost basis except
for the following material items in the consolidated balance sheets:
(i) Financial instruments at fair value through profit or loss (including derivative financial
instruments) (Note 6(2));
(ii) Financial assets at fair value through other comprehensive income (Note 6(3));
(iii) Defined benefit asset (liability) is recognized as the fair value of the plan assets less the
present value of the defined benefit obligation (Note 6(18)).
b. Functional and presentation currency
The functional currency of each individual consolidated entity is determined based on the
primary economic environment in which the entity operates. The Company’s consolidated
financial statements are presented in New Taiwan Dollar (“NTD”), which is also AUO’s
functional currency. All financial information presented in NTD has been rounded to the
nearest thousand, unless otherwise noted.
(3) Basis of consolidation
a. Principle of preparation of the consolidated financial statements
The Company includes in its consolidated financial statements the results of operations of all
controlled entities in which the Company is exposed to, or has rights to, variable returns from
its involvement with the entity and has the ability to affect those returns through its power over
the entity. All significant inter-company transactions, income and expenses are eliminated in
the consolidated financial statements.
The financial statements of subsidiaries are included in the consolidated financial statements
from the date that control commences until the date that control ceases. Total comprehensive
income (loss) in a subsidiary is allocated to the shareholders of AUO and the non-controlling
interests even if this results in the non-controlling interests having a deficit balance.
Subsidiaries’ financial statements are adjusted to align the accounting policies with those of
the Company.
Changes in the Company’s ownership interests in a subsidiary that do not result in a loss of
control are accounted for as equity transactions. The carrying amounts of the Company’s
investment and non-controlling interests are adjusted to reflect the changes in their relative
interests in the subsidiary. Any difference between such adjustment and the fair value of the
consideration paid or received is recognized directly in equity and attributed to shareholders of
AUO.
Upon the loss of control, the Company derecognizes the carrying amounts of the assets and
liabilities of the subsidiary and non-controlling interests. Any interest retained in the former
subsidiary is remeasured at fair value when control is lost. The gain or loss is measured as the
difference between: (i) the aggregate of the fair value of the consideration received and the
fair value of any retained investment in the former subsidiary at the date when the Company
loses control; and (ii) the aggregate of the carrying amount of the former subsidiary’s assets
(including goodwill), liabilities and non-controlling interests at the date when the Company
loses control. The Company accounts for all amounts previously recognized in other
comprehensive income in relation to that subsidiary on the same basis as would be required if
the Company had directly disposed of the related assets or liabilities.

AU Optronics 2019 Annual Report
Appendix 1
(Continued)
AU OPTRONICS CORP. AND SUBSIDIARIES
Notes to Consolidated Financial Statements
113
b. List of subsidiaries in the consolidated financial statements were as follows:
Percentage of
Ownership (%)
Name of Investor Name of Subsidiary Main Activities and Location
December 31,
2019
December 31,
2018
AUO AU Optronics (L) Corp. (AULB) Holding and trading company (Malaysia) 100.00 100.00
AUO Konly Venture Corp. (Konly) Venture capital investment (Taiwan ROC) 100.00 100.00
AUO Ronly Venture Corp. (Ronly) Venture capital investment (Taiwan ROC) 100.00 100.00 AUO Space Money Inc. (SMI) Sales and leasing of content management system
and hardware (Taiwan ROC)
100.00 100.00
AUO U-Fresh Technology Inc. (UTI) Planning, design and development of construction for environmental protection and related project
management (Taiwan ROC)
100.00 100.00
AUO ComQi Ltd. (CQIL) Holding company (Israel) 100.00 100.00(1) AUO AU Optronics Europe B.V. (AUNL) Sales and sales support of TFT-LCD panels
(Netherlands)
100.00 100.00(2)
AUO, Konly and Ronly
Darwin Precisions Corporation (DPTW)
Manufacturing, design and sales of TFT-LCD modules, TV set, backlight modules and related
parts (Taiwan ROC)
41.05(3) 41.05(3)
AUO and Konly AUO Crystal Corp. (ACTW) Manufacturing and sales of ingots and solar wafers (Taiwan ROC)
100.00(4) 96.02(4)
ACTW Sanda Materials Corporation
(SDMC)
Holding company (Taiwan ROC) 100.00 100.00(5)
ACTW AUO Crystal (Malaysia) Sdn. Bhd.
(ACMK)
Manufacturing and sales of solar wafers (Malaysia) 100.00 100.00
SDMC M.Setek Co., Ltd. (M.Setek) Manufacturing and sales of ingots (Japan) 99.9991 99.9991 AULB AU Optronics Corporation America
(AUUS)
Sales and sales support of TFT-LCD panels (United
States)
100.00 100.00
AULB AU Optronics Corporation Japan (AUJP)
Sales support of TFT-LCD panels (Japan) 100.00 100.00
AULB AU Optronics Korea Ltd. (AUKR) Sales support of TFT-LCD panels (South Korea) 100.00 100.00
AULB AU Optronics Singapore Pte. Ltd. (AUSG)
Holding company and sales support of TFT-LCD panels (Singapore)
100.00 100.00
AULB AU Optronics (Czech) s.r.o.
(AUCZ)(6)
Assembly of solar modules (Czech Republic) 100.00 100.00
AULB AU Optronics (Shanghai) Co., Ltd.
(AUSH)
Sales support of TFT-LCD panels (PRC) 100.00 100.00
AULB AU Optronics (Xiamen) Corp. (AUXM)
Manufacturing, assembly and sales of TFT-LCD modules (PRC)
100.00 100.00
AULB AU Optronics (Suzhou) Corp., Ltd.
(AUSZ)
Manufacturing, assembly and sales of TFT-LCD
modules (PRC)
100.00 100.00
AULB AU Optronics Manufacturing
(Shanghai) Corp. (AUSJ)
Manufacturing and assembly of TFT-LCD modules;
leasing (PRC)
100.00 100.00
AULB AU Optronics (Slovakia) s.r.o. (AUSK)
Repairing of TFT-LCD modules (Slovakia Republic)
100.00 100.00
AULB AFPD Pte., Ltd. (AUST) Manufacturing TFT-LCD panels based on low
temperature polysilicon technology (Singapore)
100.00 100.00
AULB AU Optronics (Kunshan) Co., Ltd.
(AUKS)
Manufacturing and sales of TFT-LCD panels (PRC) 51.00 51.00
AULB a.u. Vista Inc. (AUVI) Research and development and IP related business (United States)
100.00 100.00
AULB and DPTW BriView (L) Corp. (BVLB) Holding company (Malaysia) 100.00 100.00
AUSG AUO Energy (Tianjin) Corp. (AETJ)(6)
Manufacturing and sales of solar modules (PRC) - 100.00
AUSG AUO Green Energy America Corp. (AEUS)
Sales support of solar-related products (United States)
100.00 100.00
AUSG AUO Green Energy Europe B.V.
(AENL)
Sales support of solar-related products
(Netherlands)
100.00 100.00
AUXM BriView (Xiamen) Corp. (BVXM) Manufacturing and sales of liquid crystal products
and related parts (PRC)
100.00 100.00
AUSH AUO Care Information Tech. (Suzhou) Co., Ltd. (A-Care)
Design, development and sales of software and hardware for health care industry (PRC)
100.00 100.00
AUSH U-Fresh Technology (Suzhou) Co.,
Ltd. (UFSZ)
Planning, design and development of construction
project for environmental protection and related project management (PRC)
100.00 100.00(7)
AUSH Edgetech Data Technologies
(Suzhou) Corp., Ltd. (EDT)
Design and sales of software and hardware
integration system and equipment relating to intelligent manufacturing (PRC)
100.00 100.00(7)
AUSH Mega Insight Smart Manufacturing
(Suzhou) Corp., Ltd. (MIS)
Development and licensing of software relating to
intelligent manufacturing, and related consulting services (PRC)
100.00 100.00(7)

(Continued)
AU OPTRONICS CORP. AND SUBSIDIARIES
Notes to Consolidated Financial Statements
AU Optronics 2019 Annual Report
114
Percentage of
Ownership (%)
Name of Investor Name of Subsidiary Main Activities and Location
December 31,
2019
December 31,
2018
UFSZ U-Fresh Environmental Technology (Shandong) Co., Ltd. (UFSD)
Planning, design and development of construction project for environmental protection
and related project management (PRC)
100.00(7) -
CQIL ComQi Holdings Ltd. (CQHLD) Holding company (United Kingdom) 100.00 100.00(1) CQHLD ComQi UK Ltd. (CQUK) Sales support of content management system
(United Kingdom)
100.00 100.00(1)
CQHLD ComQi Inc. (CQUS) Sales of content management system and hardware (United States)
100.00 100.00(1)
CQHLD ComQi Canada Inc. (CQCA) Research and development of content management
system (Canada)
100.00 100.00(1)
CQUS
JohnRyan Limited (JRUK)
Development and sales of content management
system and sales of related hardware (United
Kingdom)
100.00(7) -
CQUS JohnRyan Inc. (JRUS) Development and sales of content management
system and sales of related hardware (United States)
100.00(7) -
DPTW Darwin Precisions (L) Corp. (DPLB) Holding company (Malaysia) 100.00 100.00
DPTW Forhouse International Holding Ltd.
(FHVI)
Holding company (BVI) 100.00 100.00
DPTW Force International Holding Ltd.
(FRVI)(6)
Holding company (BVI) - 100.00
DPTW and FRVI Forefront Corporation (FFMI) Holding company (Mauritius) 100.00(6) 100.00 FHVI Fortech International Corp. (FTMI) Holding company (Mauritius) 100.00 100.00
FHVI Forward Optronics International
Corp. (FWSA)
Holding company (Samoa) 100.00 100.00
FHVI Prime Forward International Ltd.
(PMSA)
Holding company (Samoa) 100.00 100.00
FFMI Forhouse Electronics (Suzhou) Co., Ltd. (FHWJ)
Manufacturing of motorized treadmills (PRC) 100.00 100.00
FTMI Fortech Electronics (Suzhou) Co.,
Ltd. (FTWJ)
Manufacturing and sales of backlight modules and
related parts (PRC)
100.00 100.00
FWSA and FTMI Suzhou Forplax Optronics Co., Ltd.
(FPWJ)
Manufacturing and sales of precision plastic parts
(PRC)
100.00 100.00
PMSA Fortech Electronics (Kunshan) Co., Ltd. (FTKS)
Manufacturing and sales of backlight modules and related parts (PRC)
100.00 100.00
DPLB Darwin Precisions (Hong Kong)
Limited (DPHK)
Holding company (Hong Kong) 100.00 100.00
DPLB Darwin Precisions (Slovakia) s.r.o.
(DPSK)
Manufacturing and sales of automotive parts
(Slovakia Republic)
100.00 100.00
DPHK Darwin Precisions (Suzhou) Corp. (DPSZ)
Manufacturing and sales of backlight modules and related parts (PRC)
100.00 100.00
DPHK Darwin Precisions (Xiamen) Corp.
(DPXM)
Manufacturing and sales of backlight modules and
related parts (PRC)
100.00 100.00
BVLB
BriView (Hefei) Co., Ltd. (BVHF) Manufacturing and sales of liquid crystal products
and related parts (PRC)
100.00 100.00
Note 1: In March 2018, the Company acquired 100% of the shareholdings of CQIL and its subsidiaries (hereinafter referred to
as “ComQi”) and therefore, obtained control over ComQi. Refer to Note 6(7) for further details.
Note 2: As part of a business restructuring, AULB disposed all of its shareholdings in AUNL to AUO in December 2018. This
was treated as an equity transaction as there was no change in control of AUNL by the Company.
Note 3: Although the Company did not own more than 50% of the DPTW’s ownership interests, it was considered to have de
facto control over the main operating policies of DPTW. As a result, DPTW was accounted for as a subsidiary of the
Company.
Note 4: As part of a business restructuring, Konly and Ronly successively disposed its shareholdings in ACTW to AUO in
December 2018 and February 2019. This was treated as an equity transaction as there was no change in control of ACTW
by the Company.
Note 5: As part of a business restructuring, AUO, Konly and Ronly disposed all of their shareholdings in SDMC to ACTW
during the second quarter of 2018. This was treated as an equity transaction as there was no change in control of SDMC
by the Company.
Note 6: As of December 31, 2019, AETJ and FRVI were liquidated and AUCZ is still in the process of liquidation. After the
liquidation of FRVI, its ownership in FFMI was transferred to DPTW.
Note 7: UFSZ was incorporated in February 2018. EDT and MIS were incorporated in August 2018. UFSD was incorporated in
May 2019. JRUK and JRUS were incorporated in October 2019.

AU Optronics 2019 Annual Report
Appendix 1
(Continued)
AU OPTRONICS CORP. AND SUBSIDIARIES
Notes to Consolidated Financial Statements
115
(4) Foreign currency transactions and operations
a. Transactions in foreign currencies are translated to the respective functional currencies of the
individual entities of the Company at exchange rates at the dates of the transactions. Monetary
assets and liabilities denominated in foreign currencies at the reporting date are retranslated to
the functional currency at the exchange rate at that date and the resulting exchange differences
are included in profit or loss for the year. Non-monetary assets and liabilities denominated in
foreign currencies that are measured at fair value are retranslated to the functional currency at
the exchange rate at the date when the fair value was determined. The resulting exchange
differences are included in profit or loss for the year except for those arising from the
retranslation of non-monetary items in respect of which gains and losses are recognized directly
in other comprehensive income, in which case, the exchange differences are also recognized
directly in other comprehensive income. Non-monetary items in foreign currencies that are
measured at historical cost are translated using the exchange rate at the date of the transaction.
Exchange differences arising from the effective portion of changes in the fair value of
derivatives that are designated and qualified as cash flow hedges are recognized in other
comprehensive income.
b. For the purpose of presenting consolidated financial statements, the assets and liabilities of the
Company’s foreign operations are translated into NTD using the exchange rates at each
reporting date. Income and expenses of foreign operations are translated at the average exchange
rates for the period unless the exchange rates fluctuate significantly during the period; in that
case, the exchange rates at the dates of the transactions are used. Foreign currency differences
are recognized in other comprehensive income and accumulated in equity (attributed to
shareholders of AUO and non-controlling interests as appropriate).
(5) Classification of current and non-current assets and liabilities
An asset is classified as current when:
a. The asset expected to realize, or intends to sell or consume, in its normal operating cycle;
b. The asset primarily held for the purpose of trading;
c. The asset expected to realize within twelve months after the reporting date; or
d. Cash and cash equivalent excluding the asset restricted to be exchanged or used to settle a
liability for at least twelve months after the reporting date.
All other assets are classified as non-current.
A liability is classified as current when:
a. The liability expected to settle in its normal operating cycle;
b. The liability primarily held for the purpose of trading;
c. The liability is due to be settled within twelve months after the reporting date; or
d. The Company does not have an unconditional right to defer settlement of the liability for at
least twelve months after the reporting date. Terms of a liability that could, at the option of the
counterparty, result in its settlement by the issue of equity instruments, do not affect its
classification.
All other liabilities are classified as non-current.

(Continued)
AU OPTRONICS CORP. AND SUBSIDIARIES
Notes to Consolidated Financial Statements
AU Optronics 2019 Annual Report
116
(6) Cash and cash equivalents
Cash comprises cash balances and demand deposits. Cash equivalents comprise short-term highly
liquid investments that are readily convertible into known amount of cash and are subject to an
insignificant risk of changes in their fair value. Time deposits with short-term maturity but not for
investments and other purposes and are qualified with the aforementioned criteria are classified as
cash equivalent.
(7) Financial instruments
a. Financial assets
(i) Classification of financial assets
The Company classifies financial assets into the following categories: financial assets at
amortized cost, financial assets at fair value through other comprehensive income and
financial assets at fair value through profit or loss. When, and only when, the Company
changes its business model for managing financial assets it shall reclassify all affected
financial assets.
(a) Financial assets at amortized cost
A financial asset is measured at amortized cost if it meets both of the following
conditions and is not designated as measured at fair value through profit or loss:
i. it is held within a business model whose objective is to hold financial assets to
collect contractual cash flows; and
ii. its contractual terms give rise on specified dates to cash flows that are solely
payments of principal and interest on the principal amount outstanding.
Such financial assets are initially recognized at fair value, plus any directly attributable
transaction costs. Subsequently, these assets are measured at amortized cost using the
effective interest method, less any impairment losses. Interest income, foreign
exchange gains and losses, and recognition (reversal) of impairment losses, are
recognized in profit or loss.
(b) Financial assets at fair value through other comprehensive income
On initial recognition, the Company is able to make an irrevocable election to present
subsequent changes in the fair value of investments in equity instruments that is not
held for trading in other comprehensive income. This election is made on an
instrument-by-instrument basis.
Such financial assets are initially recognized at fair value, plus any directly attributable
transaction costs. Subsequent to initial recognition, they are measured at fair value and
changes therein are recognized in other comprehensive income and accumulated in
equity-unrealized gains (losses) on financial assets at fair value through other
comprehensive income, except for dividends deriving from equity investments which
are recognized in profit or loss unless the dividend clearly represents a recovery of
part of the cost of the investment. When an investment is derecognized, the cumulative
gain or loss in equity will not be reclassified to profit or loss, instead, is reclassified to
retained earnings.
Dividends on investments in equity instruments are recognized on the date that the
Company’s right to receive the dividends is established.
(c) Financial assets at fair value through profit or loss
All financial assets not classified as at amortized cost or at fair value through other
comprehensive income as described above are measured at fair value through profit
or loss. This includes all derivative financial assets.
AU Optronics 2019 Annual Report
Appendix 1
(Continued)
AU OPTRONICS CORP. AND SUBSIDIARIES
Notes to Consolidated Financial Statements
117
Such financial assets are initially recognized at fair value, and attributable transaction
costs are recognized in profit or loss as incurred. Subsequent to initial recognition,
they are measured at fair value and changes therein are recognized in profit or loss.
(ii) Impairment of financial assets
The Company recognizes loss allowances for expected credit losses on financial assets at
amortized cost, including cash and cash equivalents, receivables, refundable deposits and
other financial assets, etc., and contract assets. Loss allowances for financial assets are
deducted from the gross carrying amount of the assets. The recognition or reversal of the
loss allowance is recognized in profit or loss.
The expected credit loss is the weighted average of credit losses with the respective risks
of a default occurring on the financial instrument as the weights.
The Company measures the loss allowance for a financial instrument at an amount equal
to lifetime expected credit losses, except for the financial instrument that is determined to
have low credit risk at the reporting date and the credit risk thereof has not increased
significantly since initial recognition, which is measured at an amount equal to the 12-
month expected credit losses. For trade receivables and contract assets, the Company
measures their loss allowances at an amount equal to lifetime expected credit losses.
When determining whether the credit risk of a financial asset has increased significantly
since initial recognition, the Company considers reasonable and supportable information
that is relevant. This includes both qualitative and quantitative information and analysis,
based on the Company’s historical experience and credit assessment as well as forward-
looking information.
In the circumstance that a financial asset is past due or the borrower is unlikely to pay its
credit obligations to the Company in full, the Company considers the credit risk on that
financial asset has significantly increased, or further, to be in default.
At each reporting date, the Company assesses whether financial assets at amortized cost
are credit-impaired. A financial asset is “credit-impaired” when one or more events that
have a detrimental impact on the estimated future cash flows of the financial asset have
occurred.
(iii) De-recognition of financial assets
The Company derecognizes financial assets when the contractual rights to the cash flows
from the asset expire, or when the Company transfers substantially all the risks and rewards
of ownership of the financial assets to another entity.
b. Financial liabilities
(i) Classification of financial liabilities
The Company classifies financial liabilities into the following categories: financial
liabilities at fair value through profit or loss and other financial liabilities.
(a) Financial liabilities at fair value through profit or loss
The Company designates financial liabilities as held for trading for the purpose of
hedging exposure to foreign exchange risk arising from operating and financing
activities. When a financial liability is not effective as a hedge the Company accounts
for it as a financial liability at fair value through profit or loss.
The Company designates financial liabilities, other than the one mentioned above, as
at fair value through profit or loss at initial recognition. Attributable transaction costs
are recognized in profit or loss as incurred. Financial liabilities in this category are
subsequently measured at fair value and changes therein, which takes into account any
interest expense, are recognized in profit or loss.

(Continued)
AU OPTRONICS CORP. AND SUBSIDIARIES
Notes to Consolidated Financial Statements
AU Optronics 2019 Annual Report
118
(b) Other financial liabilities
Financial liabilities not classified as held for trading, or not designated as at fair value
through profit or loss (including loans and borrowings, trade and other payables), are
measured at fair value, plus any directly attributable transaction cost at the time of
initial recognition. Subsequent to initial recognition, they are measured at amortized
cost calculated using the effective interest method, except for insignificant recognition
of interest expense from short-term borrowings and payables. Interest expense not
capitalized as an asset cost is recognized in profit or loss.
(ii) De-recognition of financial liabilities
The Company derecognizes financial liabilities when the contractual obligation has been
discharged, cancelled or expired. The difference between the carrying amount and the
consideration paid or payable, including any non-cash assets transferred or liabilities
assumed is recognized in profit or loss.
c. Offsetting of financial assets and liabilities
The Company presents financial assets and liabilities on a net basis in the consolidated balance
sheet when the Company has the legally enforceable rights to offset, and intends to settle such
financial assets and liabilities on a net basis or to realize the assets and settle the liabilities
simultaneously.
(8) Inventories
The cost of inventories includes all necessary expenditures and charges for bringing the inventory
to a stable, useable and marketable condition and location. The production overhead is allocated to
finished goods and work in progress based on the normal capacity of the production facilities.
Subsequently, inventories are measured at the lower of cost and net realizable value. Cost is
determined using the weighted-average method. Net realizable value is calculated based on the
estimated selling price less all estimated costs of completion and the estimated costs necessary to
make the sale.
(9) Noncurrent assets held for sale
Noncurrent assets are classified as held for sale when their carrying amounts are expected to be
recovered primarily through sale rather than through continuing use. Such noncurrent assets must
be available for immediate sale in their present condition and the sale is highly probable within one
year. When classified as held for sale, the assets are measured at the lower of their carrying amount
and fair value less costs to sell. Impairment losses on initial classification as held for sale and
subsequent gains or losses on re-measurement are recognized in profit or loss. However, subsequent
gains are not recognized in excess of the cumulative impairment loss that has been recognized.
When intangible assets and property, plant and equipment are classified as held for sale, they are no
longer amortized or depreciated. In addition, once an equity-accounted investee is classified as held
for sale, it is no longer equity accounted.
(10) Investments in associates and joint ventures
Associates are those entities in which the Company has the power to exercise significant influence,
but not control or joint control, over their financial and operating policies.
Joint venture is a joint arrangement whereby the Company and other parties agreed to share the
control of the arrangement, and have rights to the net assets of the arrangement. Unanimous consent
from the parties sharing control is required when making decisions for the relevant activities of the
arrangement.
Investments in associates or joint ventures are accounted for using the equity method and are
recognized initially at cost. The cost of the investment includes transaction costs. The consolidated
AU Optronics 2019 Annual Report
Appendix 1
(Continued)
AU OPTRONICS CORP. AND SUBSIDIARIES
Notes to Consolidated Financial Statements
119
financial statements include the Company’s share of the profit or loss and other comprehensive
income of associates or joint ventures, after adjustments are made to align their accounting policies
with those of the Company. When an associate or a joint venture incurs changes in its equity not
derived from profit or loss and other comprehensive income, the Company recognizes all the equity
changes in proportion to its ownership interest in the associate or joint venture as capital surplus
provided that the ownership interest in the associate or joint venture remains unchanged.
The difference between acquisition cost and fair value of associates’ or joint ventures’ identifiable
assets and liabilities as of the acquisition date is accounted for as goodwill. Goodwill is included in
the original investment cost of acquired associates or joint ventures and is not amortized. If the fair
value of identified assets and liabilities is in excess of acquisition cost, the remaining excess over
acquisition cost is recognized as a gain in profit or loss.
The Company discontinues the use of the equity method from the date when its investment ceases
to be an associate or a joint venture, and then measures the retained interests at fair value at that date.
The difference between the carrying amount of the investment at the date the equity method was
discontinued and the fair value of the retained interests along with any proceeds from disposing of
a part interest in the associate or joint venture is recognized in profit or loss. Moreover, the Company
accounts for all amounts previously recognized in other comprehensive income in relation to that
investment on the same basis as would be required if the investee had directly disposed of the related
assets or liabilities.
When the Company subscribes for additional shares in an associate or a joint venture at a percentage
different from its existing ownership percentage, the resulting carrying amount of the investment
differs from the amount of the Company’s proportionate interest in the net assets of the associate or
joint venture. The Company records such a difference as an adjustment to investments with the
corresponding amount charged or credited to capital surplus. If the capital surplus arising from
investment accounted for under the equity method in associates or joint ventures is insufficient to
offset with the said corresponding amount, the differences will be charged or credited to retained
earnings.
If the Company’s ownership interest in an associate or a joint venture is reduced due to disposal of
or disproportionate subscription to the shares, but the Company continues to apply the equity method,
the Company shall reclassify to profit or loss the proportion of the gain or loss that had previously
been recognized in other comprehensive income relating to that reduction in ownership interest on
the same basis as would be required if the investee had directly disposed of the related assets or
liabilities.
At the end of each reporting period, if there is any indication of impairment, the entire carrying
amount of the investment including goodwill is tested for impairment as a single asset, by comparing
its recoverable amount with its carrying amount. An impairment loss recognized forms part of the
carrying amount of the investment in associates or joint ventures. Accordingly, any reversal of that
impairment loss is recognized to the extent that the recoverable amount of the investment
subsequently increases.
Profits and losses resulting from the transactions between the Company and associates or joint
ventures are recognized in the Company’s consolidated financial statements only to the extent of
interests in the associate or joint venture that are not related to the Company.
When the Company’s share of losses exceeds its interest in an associate or a joint venture, the
carrying amount of that interest, including any long-term investments that form part thereof, is
reduced to zero, and the recognition of further losses is discontinued except to the extent that the
Company has a legal or constructive obligation, or has made payments on behalf of the investee.
(11) Investment property
(Continued)
AU OPTRONICS CORP. AND SUBSIDIARIES
Notes to Consolidated Financial Statements
AU Optronics 2019 Annual Report
120
Investment property is the property held either to earn rental income or for capital appreciation or
for both, but not for sale in the ordinary course of business, use in the production or supply of goods
or services or for administrative purposes. Investment property is measured at cost on initial
recognition. Subsequent to initial recognition, investment properties are measured using the cost
model. Depreciation is charged and recognized in non-operating income and expenses based on the
depreciable amount. Depreciation methods, useful lives and residual values are in accordance with
the policy of property, plant and equipment. Cost includes expenditure that is directly attributable
to the acquisition of the investment property.
An investment property is reclassified to property, plant and equipment at its carrying amount when
the use of the investment property changes.
(12) Property, plant and equipment
a. Recognition and measurement
Items of property, plant and equipment are measured at cost less accumulated depreciation and
accumulated impairment losses. Cost includes expenditure that is directly attributed to the
acquisition of the asset, any cost directly attributable to bringing the asset to the location and
condition necessary for it to be capable of operating in the manner intended by management,
the initial estimate of the costs of dismantling and removing the item and restoring the site on
which it is located, and any borrowing cost that is eligible for capitalization. The cost of the
software is capitalized as part of the equipment if the purchase of the software is necessary for
the equipment to be capable of operating.
When part of an item of property, plant and equipment with a cost that is significant in relation
to the total cost of the item and the useful life or the depreciation method of the significant part
is different from another significant part of that same item, it is accounted for as a separate
item (significant component) of property, plant and equipment.
The gain or loss arising from the derecognition of an item of property, plant and equipment is
determined as the difference between the net disposal proceeds, if any, and the carrying amount
of the item, and is recognized in profit or loss.
b. Subsequent costs
Subsequent expenditure is capitalized only when it is probable that the future economic
benefits associated with the expenditure will flow to the Company and the cost of the item can
be measured reliably. Ongoing repairs and maintenance expenses are recognized in profit or
loss as incurred.
c. Depreciation
Depreciation is determined by depreciable amount allocated over the estimated useful lives of
the respective assets, considering significant components of an individual asset on a straight-
line basis. If a component has a useful life that is different from the remainder of that asset,
that component is depreciated separately. Depreciation is recognized in profit or loss.
Leased assets are depreciated over their useful lives if it is reasonably certain that the Company
will obtain ownership by the end of the lease term. Otherwise, leased assets are depreciated
over the shorter of the lease term and their useful lives.
Except for land, which is not depreciated, the estimated useful lives of the assets are as follows:
(i) Buildings: 20~50 years
(ii) Machinery and equipment: 3~10 years
(iii) Other equipment: 3~6 years

AU Optronics 2019 Annual Report
Appendix 1
(Continued)
AU OPTRONICS CORP. AND SUBSIDIARIES
Notes to Consolidated Financial Statements
121
Depreciation methods, useful lives, and residual values are reviewed at each annual reporting
date and, if necessary, adjusted as appropriate. Any changes therein are accounted for as
changes in accounting estimates.
d. Reclassification to investment property
A property is reclassified to investment property at its carrying amount when the use of the
property changes from owner-occupied to investment purpose.
(13) Long-term prepaid rent (policy applicable before January 1, 2019)
Long-term prepaid rent is for the right to use of land (classified as other noncurrent assets), which
is amortized over the shorter of economic useful life or the covenant period on a straight-line basis.
(14) Leases
Leases (policy applicable from January 1, 2019)
a. Identifying a lease
A contract is, or contains, a lease when all the following conditions are satisfied:
(i) the contract involves the use of an identified asset, and the supplier does not have a
substantive right to substitute the asset; and
(ii) the Company has the right to obtain substantially all of the economic benefits from use
of the identified asset throughout the period of use; and
(iii) the Company has the right to direct the use of the identified asset throughout the period
of use.
b. As a lessee
Payments for leases of low-value assets and short-term leases are recognized as expenses on a
straight-line basis during the lease term for which the recognition exemption is applied. Except
for leases described above, a right-of-use asset and a lease liability shall be recognized for all
other leases at the lease commencement date.
The Company recognizes a right-of-use asset and a lease liability at the lease commencement
date. The lease liability is initially measured at the present value of the lease payments
(including fixed payments and variable lease payments that depend on an index or a rate),
discounted using the lessee’s incremental borrowing rate. The right-of-use asset is initially
measured at cost, which comprises the initial amount of the lease liability, adjusted for any
lease payments made at or before the commencement date, less any lease incentives received,
plus any initial direct costs incurred and an estimate of costs to be incurred in restoring the
underlying asset.
The right-of-use asset is subsequently depreciated using the straight-line method over the
shorter of the useful life of the right-of-use asset or the lease term. The lease liability is
subsequently measured at amortized cost using the effective interest method. It is remeasured
(i) if there is a change in the lease term; (ii) if there is a change in future lease payments arising
from a change in an index or a rate; (iii) if there is a change in the amounts expected to be
payable under a residual value guarantee; or (iv) if the Company changes its assessment of
whether it will exercise a purchase, extension or termination option. When the lease liability is
remeasured in the circumstances aforementioned, a corresponding adjustment is made to the
carrying amount of the right-of-use asset. However, if the carrying amount of the right-of-use
asset is reduced to zero, any remaining amount of the remeasurement is recognized in profit or
loss.
Moreover, the lease liability is remeasured when lease modifications occur that decrease the
scope of the lease. The Company accounts for the remeasurement of the lease liability by
decreasing the carrying amount of the right-of-use asset to reflect the partial or full termination
of the lease, and recognizes in profit or loss any gain or loss relating to the partial or full
termination of the lease.

(Continued)
AU OPTRONICS CORP. AND SUBSIDIARIES
Notes to Consolidated Financial Statements
AU Optronics 2019 Annual Report
122
c. As a lessor
Lease income from an operating lease is recognized in profit or loss on a straight-line basis
over the lease term. Initial direct costs incurred in negotiating and arranging an operating lease
are added to the carrying amount of the asset leased to others and recognized as an expense on
a straight-line basis over the lease term.
Leases (policy applicable before January 1, 2019)
a. Lessor
Lease income from an operating lease is recognized in profit or loss on a straight-line basis over
the lease term. Initial direct costs incurred in negotiating and arranging an operating lease are
added to the carrying amount of the leased asset, and recognized as an expense on a straight-
line basis over the lease term.
b. Lessee
Payments made under operating lease (excluding insurance and maintenance expenses) are
recognized in profit or loss on a straight-line basis over the term of the lease.
(15) Intangible assets
a. Goodwill
Goodwill is recognized when the purchase price exceeds the fair value of identifiable net assets
acquired in a business combination. Goodwill is measured at cost less accumulated impairment
losses.
Equity-method goodwill is included in the carrying amounts of the equity investments. The
impairment losses for the goodwill within the equity-accounted investees are accounted for as
deductions of carrying amounts of investments in equity-accounted investees.
b. Research and development
During the research phase, activities are carried out to obtain and understand new scientific or
technical knowledge. Expenditures during this phase are recognized in profit or loss as incurred.
Expenditure arising from development is capitalized as an intangible asset when the Company
demonstrates all of the following:
(i) the technical feasibility of completing the intangible asset so that it will be available for
use or sale;
(ii) its intention to complete the intangible asset and use or sell it;
(iii) its ability to use or sell the intangible asset;
(iv) the probability that the intangible asset will generate probable future economic benefits;
(v) the availability of adequate technical, financial and other resources to complete the
development and to use or sell the intangible asset; and
(vi) its ability to measure reliably the expenditure attributable to the intangible asset during
its development.
Development expenditure which fails to meet the criteria for recognition as an intangible asset
is reflected in profit or loss when incurred. Capitalized development expenditure is measured
at cost less accumulated amortization and any accumulated impairment losses.
c. Other intangible assets
Other intangible assets acquired are measured at cost less accumulated amortization and any
accumulated impairment losses.
d. Subsequent expenditure

AU Optronics 2019 Annual Report
Appendix 1
(Continued)
AU OPTRONICS CORP. AND SUBSIDIARIES
Notes to Consolidated Financial Statements
123
Subsequent expenditure is capitalized only when it increases the future economic benefits
embodied in the specific asset to which it relates. All other expenditure, including expenditure
on internally generated goodwill and brands, is recognized in profit or loss as incurred.
e. Amortization
The depreciable amount of an intangible asset is the cost less its residual value. Other than
goodwill and intangible assets with indefinite useful life, an intangible asset with a finite useful
life is amortized over 3 to 20 years using the straight-line method from the date that the asset
is made available for use. The amortization charge is recognized in profit or loss.
The residual value, amortization period, and amortization method are reviewed at least
annually at each annual reporting date, and any changes therein are accounted for as changes
in accounting estimates.
(16) Impairment – non-financial assets
Other than inventories, deferred tax assets and noncurrent assets held for sale, the carrying amounts
of the Company’s investment property measured at cost and other long-term non-financial assets
(property, plant and equipment, right-of-use assets and other intangible assets with finite useful
lives), are reviewed at the reporting date to determine whether there is any indication of impairment.
When there is an indication of impairment exists for the aforementioned assets, the recoverable
amount of the asset is estimated. If it is not possible to estimate the recoverable amount of an
individual asset, the Company estimates the recoverable amount of the cash-generating unit (“CGU”)
to which the asset has been allocated to.
In performing an impairment test for other long-term non-financial assets, the estimated recoverable
amount is evaluated in terms of an asset or a CGU. Any excess of the carrying amount of the asset
or its related CGU over its recoverable amount is recognized as an impairment loss. The recoverable
amount of an asset or a CGU is the higher of its fair value less costs of disposal and its value in use.
If there is evidence that the accumulated impairment loss of an asset other than goodwill and
intangible assets with indefinite useful lives in prior years no longer exists or has decreased, the
amount previously recognized as an impairment loss is reversed, and the carrying amount of the
asset or CGU is increased to the revised estimate of its recoverable amount. The increased carrying
amount shall not exceed the carrying amount that would have been determined (net of depreciation
or amortization) had no impairment loss been recognized for the asset in prior years.
For goodwill and intangible assets with indefinite useful lives or that are not yet available for use,
are required to be tested for impairment at least annually. Any excess of the carrying amount of the
asset over its recoverable amount is recognized as an impairment loss.
For the purpose of impairment test, goodwill acquired in a business combination is allocated to
CGUs that are expected to benefit from the synergies of the combination. If the recoverable amount
of a CGU is less than its carrying amount, the difference is allocated first to reduce the carrying
amount of any goodwill allocated to the unit, then the carrying amounts of the other assets in the
unit on a pro rata basis. The impairment loss recognized on goodwill is not reversed in a subsequent
period.
(17) Provisions
A provision is recognized when the Company has a present obligation arising from a past event, it
is probable that the Company will be required to make an outflow of resources embodying economic
benefits to settle the obligation, and the amount of the obligation can be estimated reliably.
Provisions are determined by discounting the expected future cash flows at a pre-tax rate that reflects
the current market assessments of the time value of money and the risks specific to the liability. The
unwinding of the discount is recognized as interest expense.
(Continued)
AU OPTRONICS CORP. AND SUBSIDIARIES
Notes to Consolidated Financial Statements
AU Optronics 2019 Annual Report
124
a. Warranties
A provision for warranties is recognized when the underlying products or services are sold.
The provision is weighting factors based on historical experience of warranty claims rate and
other possible outcomes against their associated probabilities.
b. Decommissioning obligation
The Company is subject to decommissioning obligations related to certain items of property,
plant and equipment. Such decommissioning obligations are primarily attributable to clean-up
costs, including deconstruction, transportation, and recover costs. The unwinding of the
discount based on original discount rate is recognized in profit or loss as interest expense over
the periods with corresponding increase in the carrying amounts of the accrued
decommissioning costs. The carrying amount of the accruals at the end of the assets’ useful
lives is the same as the estimated decommissioning costs.
c. Onerous contracts
A provision for onerous contracts is recognized when the expected benefits to be derived by
the Company from a contract are lower than the unavoidable cost of meeting its obligations
under the contract. The provision is measured at the present value of the lower of the expected
cost of terminating the contract and the expected net cost of continuing with the contract.
Before a provision is established, the Company recognizes any impairment loss on the assets
associated with that contract.
d. Loss contingencies
Management periodically assesses the obligation of all litigation and claims and relative legal
costs. Provision for loss contingencies arising from claims, assessments, litigation, fines, and
penalties and other sources are recognized when it is probable the present obligation as a result
of a past event will result in an outflow of resources and the amount can be reasonably
estimated.
Provisions recognized are the best estimates of the expenditure for settling the present
obligation at each reporting date.
(18) Treasury shares
Where the Company repurchases its common stock that has been issued, the consideration paid,
including all directly attributable costs is recorded as treasury share and deducted from equity. When
treasury share is reissued, the excess of sales proceeds over cost is accounted for as capital surplus
– treasury shares. If the sales proceeds are less than cost, the deficiency is accounted for as a
reduction of capital surplus arising from similar types of treasury shares. If such capital surplus is
insufficient to cover the deficiency, the remainder is recorded as a reduction of retained earnings.
The carrying amount of treasury share is calculated using the weighted-average cost of different
types of repurchase.
If treasury share is retired, the weighted-average cost of the retired treasury share is written off
against the par value and the capital surplus premium, if any, of the stock retired on a pro rata basis.
If the weighted-average cost written off exceeds the sum of the par value and the capital surplus
premium, the difference is accounted for as a reduction of capital surplus – treasury shares, or a
reduction of retained earnings for any deficiency where capital surplus – treasury shares is
insufficient to cover the difference. If the weighted-average cost written off is less than the sum of
the par value and the capital surplus premium, if any, of the stock retired, the difference is accounted
for as an increase in capital surplus – treasury shares.
(19) Revenue from contracts with customers
Revenue is measured based on the consideration that the Company expects to be entitled in the
transfer of goods or services to a customer. The Company recognizes revenue when it satisfies a
AU Optronics 2019 Annual Report
Appendix 1
(Continued)
AU OPTRONICS CORP. AND SUBSIDIARIES
Notes to Consolidated Financial Statements
125
performance obligation by transferring control over a product or service to a customer. The
following is a description of the Company’s major revenues:
a. Sales of goods
Revenue is recognized when the control over a product has been transferred to the customer.
The transfer of control refers to the product has been delivered to and accepted by the customer
without remaining performance obligations from the Company. Delivery occurs when the
product has been shipped to the specified location and the risk of loss over the product has been
transferred to the customer, as well as when the product has been accepted by the customer
according to the terms of sales contract, or when the Company has objective evidence that all
criteria for acceptance have been satisfied.
For certain contracts with volume discounts offer to customers, revenue is recognized on a net
basis of contract price less estimated volume discounts, and only to the extent that it is highly
probable that a significant reversal will not occur. The amount of volume discounts is estimated
based on the expected value with reference to the historical experience, and is recorded as refund
liability (presented under other current liabilities).
Trade receivable is recognized when the Company is entitled for unconditional right to receive
payment upon delivery of goods to customers. The consideration received in advance from the
customer according to the sales contract but without delivery of goods is recognized as a contract
liability, for which revenue is recognized when the control over the goods is transferred to the
customer.
The Company provides standard warranties for goods sold and has obligation to refund
payments for defective goods, in which the Company has recognized provisions for warranties
to fulfill the obligation. Refer to Note 4(17) for further details.
b. Construction contracts
For construction contracts, revenue is recognized progressively based on the progress towards
complete satisfaction of contract activities, and only to the extent that it is highly probable that
a significant reversal in the amount of cumulative revenue recognized will not occur.
If the Company cannot reasonably measure its progress towards complete satisfaction of
performance obligations in accordance with the construction contracts, revenue is recognized
only to the extent of contract costs incurred that it is expected to be recoverable.
The consideration is paid by the customer according to the agreed payment terms. The excess
of the amount that has been recognized as revenue over the amount that the Company has issued
a bill is recognized as a contract asset. When the entitlement to the payment becomes
unconditional, the contract asset is transferred to receivables.
A contract liability is recognized for an advance consideration that the Company has billed to
customers arising from construction contracts. When the construction is completed and accepted
by the customers, the contract liability is transferred to revenue.
If there are changes in circumstances, the estimates of revenue, cost and the progress towards
complete satisfaction of contract will be amended. Any changes therein are recognized in profit
or loss during the period in which the changes and amendments are made.
The Company provides standard warranties for construction contracts and has recognized
provisions for warranties to fulfill the obligation. Refer to Note 4(17) for further details.
(Continued)
AU OPTRONICS CORP. AND SUBSIDIARIES
Notes to Consolidated Financial Statements
AU Optronics 2019 Annual Report
126
c. Financing components
The Company expects that the length of time when the Company transfers the goods or services
to the customer and when the customer pays for those goods or services will be less than one
year. Therefore, the amount of consideration is not adjusted for the time value of money.
(20) Government grants
a. Grants for compensating the research and development expenditures
Grants that compensate the Company for research and development expenditures are recognized
in profit or loss on a systematic basis in the periods in which the expenses are recognized.
b. Grants related to the purchase of assets
Grants related to the purchase of assets are set up as deferred income and are recognized in profit
or loss on a systematic basis over the useful life of the assets.
c. Other grants
Other grants from government that becomes receivable as compensation for expenses or losses
already incurred or for the purpose of giving immediate financial support to the Company with
no future related costs are recognized in profit or loss of the period in which it becomes
receivable.
(21) Employee benefits
a. Defined contribution plans
Obligations for contributions to defined contribution pension plans are recognized as an
employee benefit expense in profit or loss in the periods during which services are rendered by
employees.
b. Defined benefit plans
The Company’s net obligation in respect of defined benefit pension plans is calculated
separately for each benefit plan by estimating the amount of future benefit that employees have
earned in the current and prior periods, discounting that amount and deducting the fair value of
any plan assets. Discount rate is determined by reference to the yield rate of Taiwan government
bonds at the reporting date. The calculation of defined benefit obligations is performed annually
by a qualified actuary using the Projected Unit Credit Cost Method.
Remeasurements of the net defined benefit liability (asset) which comprise actuarial gains and
losses, the return on plan assets (excluding interest) and the effect of the asset ceiling (if any,
excluding interest), are recognized in other comprehensive income in the period in which they
occur, and which then are reflected in retained earnings and will not be reclassified to profit or
loss.
c. Short-term employee benefits
Short-term employee benefit obligations, which are due to be settled within twelve months are
measured on an undiscounted basis and are expensed as the related service is provided.
The expected cost of cash bonus or profit-sharing plans, which is anticipated to be paid within
one year, are recognized as a liability when the Company has a present legal or constructive
obligation to pay this amount as a result of past service provided by the employee, and the
obligation can be estimated reliably.
(22) Share-based payment arrangements
The compensation cost of employee share-based payment arrangements is measured based on the
fair value at the date on which they are granted. The compensation cost is recognized, together with
a corresponding increase in equity, over the periods in which the employees become unconditionally
entitled to the awards. The amount recognized as an expense is adjusted to reflect the number of
awards whose related service and non-market performance conditions are expected to be met, such
AU Optronics 2019 Annual Report
Appendix 1
(Continued)
AU OPTRONICS CORP. AND SUBSIDIARIES
Notes to Consolidated Financial Statements
127
that the amount ultimately recognized as an expense is based on the number of awards that meet the
related service and non-market performance conditions at the vesting date.
For share-based payment awards with non-vesting conditions, the grant-date fair value of the
share-based payment is measured to reflect such conditions, and there is no true-up for differences
between expected and actual outcomes.
(23) Income taxes
Income tax expense comprises current and deferred taxes.
a. Current taxes
Current taxes comprise the expected tax payable or receivable on the taxable income or losses
for the year and any adjustments to tax payable or receivable in respect of previous years. It is
measured using the statutory tax rate or the actual legislative tax rate at the reporting date.
In accordance with the ROC Income Tax Act, undistributed earnings from the companies
located in the Republic of China, if any, is subject to an additional surtax. The surtax on
unappropriated earnings is expensed in the year the shareholders approved the distributions
which is the year subsequent to the year the earnings arise.
b. Deferred taxes
Deferred taxes are recognized in respect of temporary differences between the carrying
amounts of assets and liabilities for financial reporting purposes and the amounts used for
income tax purposes. Deferred tax liabilities are recognized for temporary difference of future
taxable income. Deferred tax assets are recognized for unused tax losses, unused tax credits
and deductible temporary differences to the extent that it is probable that future taxable profits
will be available against which they can be utilized.
Deferred tax assets are reviewed at annual reporting date, by considering global economic
environment, industry environment, statutory tax deduction years and projected future taxable
income, and reduced to the extent that it is no longer probable that future taxable profits will
be available to allow all or part of the deferred tax asset to be recovered. Deferred tax assets
which originally not recognized is also reviewed at annual reporting date and recognized to the
extent that it is probable that future taxable profits will be available to allow all or part of the
deferred tax asset to be recovered.
Deferred taxes liabilities for taxable temporary differences related to investments in
subsidiaries, associates and joint arrangements are recognized, unless the Company is able to
control the timing of the reversal of the taxable temporary differences and it is probable that
they will not reverse in the foreseeable future.
Deferred tax is measured at the tax rates that are expected to be applied to temporary
differences when the reverse, using the statutory tax rate or the actual legislative tax rate on
the reporting date. Deferred tax assets and liabilities are offset only if certain criteria are met.
Current taxes and deferred taxes are recognized in profit or loss except to the extent that it
relates to items recognized directly in equity or other comprehensive income.
(24) Business combinations
The consideration transferred in the acquisition is measured at fair value, as are identifiable net
assets acquired. Goodwill is measured as the excess of the aggregate of the fair value of
consideration transferred and the amount of any non-controlling interests in the acquiree over the
net identifiable assets acquired and liabilities assumed. If the fair value of the net assets acquired is
in excess of the aggregate consideration transferred and the amount of any non-controlling interests
in the acquiree, after reassessing all of the assets acquired and all of the liabilities assumed being
properly identified, the difference is recognized in profit or loss as a gain on bargain purchase.

(Continued)
AU OPTRONICS CORP. AND SUBSIDIARIES
Notes to Consolidated Financial Statements
AU Optronics 2019 Annual Report
128
Acquisition-related costs are expensed as incurred, except that the costs are related to the issue of
debt or equity instruments.
Non-controlling interests in an acquiree that are present ownership interests and entitle their holders
to a proportionate share of the entity’s net assets in the event of liquidation are measured, on a case-
by-case basis, at either fair value or the present ownership instruments’ proportionate share in the
recognized amounts of the acquiree’s net identifiable assets. All other components of non-
controlling interests shall be measured at their acquisition-date fair values, unless another
measurement basis is required by TIFRSs.
Any contingent consideration included in the consideration transferred is recognized at fair value at
the date of acquisition. Subsequent changes to the fair value of the contingent consideration during
the measurement period shall adjust to the cost of the acquisition and the resulting goodwill
retrospectively. An adjustment made during the measurement period is to reflect additional
information obtained by the Company about facts and circumstances that existed as of the
acquisition date. The measurement period shall not exceed one year from the acquisition date. The
accounting treatment for those changes to the fair value of the contingent consideration that are not
measurement period adjustments is depending on the classification of the contingent consideration.
If the contingent consideration is classified as equity, it is not remeasured and the subsequent
settlement is accounted for within equity. Otherwise, other contingent consideration is remeasured
at fair value at each reporting date and subsequent changes in the fair value are recognized in profit
or loss.
(25) Earnings (loss) per share
Basic earnings (loss) per share is computed by dividing profit or loss attributable to the shareholders
of AUO by the weighted-average number of common shares outstanding during the period. In
computing diluted earnings per share, profit or loss attributable to the shareholders of AUO and the
weighted-average number of common shares outstanding during the period are adjusted for the
effects of dilutive potential common stock, assuming dilutive share equivalents had been issued.
The weighted-average outstanding shares are retroactively adjusted for the effects of stock dividends
transferred from retained earnings or capital surplus to common stock.
(26) Operating segments
An operating segment is a component of an entity that engages in business activities from which it
may earn revenue and incur expenses (including revenues and expenses relating to transactions with
other components of the same entity). Operating results of the operating segments are reviewed
regularly by the Company’s chief operating decision maker (“CODM”) to make decisions pertaining
to the allocation of resources to the segment and to assess its performance. Meanwhile, discrete
financial information for operating results is available. 5. Critical Accounting Judgments and Key Sources of Estimations and Assumptions Uncertainty
The preparation of the consolidated financial statements in conformity with the Regulations and TIFRSs
requires management to make judgments, estimates and assumptions that affect the application of the
accounting policies and the reported amount of assets, liabilities, income and expenses. Actual results
may differ from these estimates.
Estimates and underlying assumptions are reviewed by management on an ongoing basis. Revisions to
accounting estimates are recognized in the period in which the estimates are revised and in any future
periods affected.
Information about critical judgments, estimates and assumptions in applying accounting policies that have
the significant effect on the amounts recognized in the consolidated financial statements is included in the
following notes:

AU Optronics 2019 Annual Report
Appendix 1
(Continued)
AU OPTRONICS CORP. AND SUBSIDIARIES
Notes to Consolidated Financial Statements
129
(1) Estimate of provisions
Provision for warranty is estimated when product revenue is recognized. The estimate has been
made based on the quantities within the warranty period, the historical and anticipated warranty
claims rate associated with similar products and services, and the projected unit cost of
maintenance. The Company regularly reviews the basis of the estimate and if necessary, amends it
as appropriate. There could be a significant impact on provision for warranty for any changes of the
basis of the estimate.
Provision for unsettled litigation and claims is recognized when it is probable that it will result in
an outflow of the Company’s resources and the amount can be reasonably estimated. While the
ultimate resolution of litigation and claims cannot be predicted with certainty, the final outcome or
the actual cash outflow may be materially different from the estimated liability.
(2) Impairment of long-term non-financial assets, other than goodwill
In the process of evaluating the potential impairment of tangible and intangible assets other than
goodwill, the Company is required to make subjective judgments in determining the independent
cash flows, useful lives, expected future income and expenses related to the specific asset groups
with the consideration of the usage mode of asset and the nature of industry. Any changes in these
estimates based on changed economic conditions or business strategies could result in significant
impairment charges or reversal in future years.
(3) Impairment of goodwill
The assessment of impairment of goodwill requires the Company to make subjective judgment to
determine the identified CGUs, allocate the goodwill to relevant CGUs and estimate the
recoverable amount of relevant CGUs.
(4) Measurement of defined benefit obligations
Accrued pension liabilities and the resulting pension expenses under defined benefit pension plans
are calculated using the Projected Unit Credit Cost Method. Actuarial assumptions comprise the
discount rate, rate of employee turnover, long-term average future salary increase, etc. Changes in
economic circumstances and market conditions will affect these assumptions and may have a
material impact on the amount of the expense and the liability.
(5) Recognition of deferred tax assets
Deferred tax assets are recognized to the extent that it is probable that future taxable profits will be
available against which those deferred tax assets can be utilized. Assessment of the realization of
the deferred tax assets requires management’s subjective judgment and estimate, including the
future revenue growth and profitability, the sources of taxable income, the amount of tax credits
can be utilized and feasible tax planning strategies. Changes in the global economic environment,
the industry trends and relevant laws and regulations may result in adjustments to the deferred tax
assets.
(6) Estimate of variable consideration of revenue
The Company estimates the amount of variable consideration by using methods either the expected
value or the most likely amount based on historical experience, market and economic situation and
any known factors that would significantly affect the estimates. The amount of variable
consideration is recognized as a reduction of revenue in the same period the related revenue is
recognized. The Company periodically reviews the reasonableness of the estimated variable
consideration. However, the adequacy of estimations may be affected by factors such as market
price competition and the evolution of product technology, which could result in significant
adjustments to the variable consideration.
(Continued)
AU OPTRONICS CORP. AND SUBSIDIARIES
Notes to Consolidated Financial Statements
AU Optronics 2019 Annual Report
130
(7) Valuation of inventories
As inventories are stated at the lower of cost or net realizable value, the Company estimates the net
realizable value of inventories for obsolescence and unmarketable items at the end of reporting
period and then writes down the cost of inventories to net realizable value. The net realizable value
of the inventory is mainly determined based on assumptions of future demand within a specific
time horizon. Due to the rapid industrial transformation, there may be significant changes in the net
realizable value of inventories. 6. Description of Significant Accounts
(1) Cash and Cash Equivalents
December 31,
2019 2018
(in thousands)
Cash on hand, demand deposits and checking accounts $ 46,290,722 30,134,051
Time deposits 34,124,011 38,939,198
Government bonds with reverse repurchase agreements 35,039 90,047
$ 80,449,772 69,163,296
Refer to Note 6(31) for the disclosure of credit risk, currency risk and sensitivity analysis
of the financial instruments of the Company.
As at December 31, 2019 and 2018, no cash and cash equivalents were pledged with banks
as collaterals.
(2) Financial Assets and Liabilities at Fair Value through Profit or Loss (“FVTPL”)
December 31,
2019 2018
(in thousands)
Financial assets mandatorily measured at FVTPL:
Foreign currency forward contracts $ 42,815 70,074
Structured deposits 1,478,591 1,639,457
$ 1,521,406 1,709,531
Financial liabilities held for trading:
Foreign currency forward contracts $ 18,859 22,115
The Company entered into derivative contracts to manage the exposure to currency risk arising
from operating activities. Refer to Note 6(31) for the disclosure of the Company’s credit and
currency risks related to financial instruments. As of December 31, 2019 and 2018, the Company’s
outstanding foreign currency forward contracts were as follows:
December 31, 2019
Contract item Maturity date Contract amount
(in thousands)
Sell USD / Buy NTD Jan. 2020 USD176,600 / NTD5,319,611
Sell USD / Buy JPY Jan. 2020 – Apr. 2020 USD47,292 / JPY5,150,510
Sell USD / Buy CNY Jan. 2020 – Jun. 2020 USD61,500 / CNY432,823
Sell USD / Buy SGD Jan. 2020 – Feb. 2020 USD39,276 / SGD53,372
Sell USD / Buy MYR Jan. 2020 – Mar. 2020 USD703 / MYR2,905
Sell CNY / Buy USD Feb. 2020 – Mar. 2020 CNY1,935,305 / USD276,672
Sell EUR / Buy JPY Jan. 2020 – Feb. 2020 EUR23,000 / JPY2,788,285
Sell HKD / Buy USD Jan. 2020 HKD60,177 / USD7,721
AU Optronics 2019 Annual Report
Appendix 1
(Continued)
AU OPTRONICS CORP. AND SUBSIDIARIES
Notes to Consolidated Financial Statements
131
December 31, 2018
Contract item Maturity date Contract amount
(in thousands)
Sell USD / Buy NTD Jan. 2019 USD223,000 / NTD6,858,785
Sell USD / Buy JPY Jan. 2019 – Apr. 2019 USD147,470 / JPY16,493,633
Sell NTD / Buy JPY Jan. 2019 – Mar. 2019 NTD2,054,260 / JPY7,400,000
Sell USD / Buy CNY Jan. 2019 – Jun. 2019 USD87,000 / CNY597,420
Sell EUR / Buy JPY Jan. 2019 EUR12,000 / JPY1,536,180
Sell EUR / Buy USD Jan. 2019 EUR28,500 / USD32,441
Sell EUR / Buy CZK Jan. 2019 – Mar. 2019 EUR3,240 / CZK84,081
Sell USD / Buy MYR Jan. 2019 – Mar. 2019 USD879 / MYR3,670
Sell CNY / Buy JPY Jan. 2019 – Feb. 2019 CNY60,800 / JPY981,383
Sell USD / Buy SGD Jan. 2019 USD5,793 / SGD7,940
Sell CNY / Buy USD Jan. 2019 – Feb. 2019 CNY853,328 / USD124,000
(3) Financial Assets at Fair Value through Other Comprehensive Income (“FVTOCI”)
December 31,
2019 2018
(in thousands)
Investments in equity instruments at FVTOCI:
Equity securities – listed stocks $ 7,356,501 6,803,900
Equity securities – non-listed stocks 188,670 176,025
$ 7,545,171 6,979,925
The purpose that the Company invests in the abovementioned equity securities is for long-
term strategies, but rather for trading purpose. Therefore, those equity securities are
designated as financial assets at FVTOCI.
If the value of these equity securities appreciates or depreciates by 10% at the reporting
date, other comprehensive income would increase or decrease by $754,517 thousand and
$697,993 thousand for the years ended December 31, 2019 and 2018, respectively.
(4) Notes and Accounts Receivable, net (Including Related and Unrelated Parties)
December 31,
2019 2018
(in thousands)
Notes and accounts receivable $ 32,104,912 47,453,087
Less: loss allowance (17,738) (50,853)
$ 32,087,174 47,402,234
Notes and accounts receivable, net $ 30,308,675 44,647,981
Accounts receivable from related parties, net $ 1,778,499 2,754,253

(Continued)
AU OPTRONICS CORP. AND SUBSIDIARIES
Notes to Consolidated Financial Statements
AU Optronics 2019 Annual Report
132
The Company measures loss allowance for notes and accounts receivable using the
simplified approach under IFRS 9 with the lifetime expected credit losses. Analysis of
expected credit losses which was measured based on the aforementioned method, was as
follows:
December 31, 2019
Carrying
amount of
notes and
accounts
receivable
Weighted-
average loss
rate
Loss
allowance for
lifetime
expected
credit losses
(in thousands) (in thousands)
Not past due $ 31,061,173 0.00% 1
Past due less than 60 days 1,010,918 0.00% 4
Past due 61~180 days 15,233 0.95% 145
$ 32,087,324 150
December 31, 2018
Carrying
amount of
notes and
accounts
receivable
Weighted-
average loss
rate
Loss
allowance for
lifetime
expected
credit losses
(in thousands) (in thousands)
Not past due $ 46,529,408 0.00% 89
Past due less than 60 days 862,373 0.05% 439
Past due 61~180 days 11,090 0.98% 109
Past due over 180 days 475 100% 475
$ 47,403,346 1,112
In addition, there was objective evidence indicating that, under reasonable expectation,
some of the notes and accounts receivable would not be recovered in total; therefore, the
Company recognized a loss allowance of $17,588 thousand and $49,741 thousand as of
December 31, 2019 and 2018, respectively.
The movement of the loss allowance for notes and accounts receivable was as follows:
For the years ended
December 31,
2019 2018
(in thousands)
Balance at beginning of the year $ 50,853 93,053 Provisions (reversals) charged to (against) expense (14,543) (24,302)
Write-offs (18,404) (17,985)
Effect of changes in foreign currency exchange rates (168) 87
Balance at end of the year $ 17,738 50,853
The payment terms granted to customers are generally 25 to 60 days from the end of the
month during which the invoice is issued. This term is consistent with practices in our
industry, and thus, no financing components involved.
Information about the Company’s exposure to credit risk is included in Note 6(31).

AU Optronics 2019 Annual Report
Appendix 1
(Continued)
AU OPTRONICS CORP. AND SUBSIDIARIES
Notes to Consolidated Financial Statements
133
As at December 31, 2018, the Company did not sell its accounts receivables to banks. As at
December 31, 2019, the Company’s accounts receivables sold and derecognized were as
follows: December 31, 2019
Underwriting bank
Factoring
limit
Amount
sold and
derecognized
Amount
advanced
Principal
terms
(in thousands) (in thousands) (in thousands)
CTBC bank USD 152,000 USD 18,526 NTD 500,000 See Notes(a)~(d)
Taipei Fubon Bank USD 120,000 USD 56,020 NTD 1,500,000 See Notes(a)~(d)
DBS Bank USD 154,000 USD 56,730 NTD 1,520,000 See Notes(a)~(d)
Bank of Taiwan USD 250,000 USD 15,718 USD 14,000 See Notes(a)~(d)
Note (a): Under these facilities, the Company transferred accounts receivable to the respective underwriting
banks, which are without recourse subject to the underwriting consents.
Note (b): The Company informed its customers pursuant to the respective facilities to make payment directly
to the respective underwriting banks.
Note (c): As of December 31, 2019, total outstanding receivables after the above transactions, net of fees
charged by underwriting banks, of $487,754 thousand was recognized under other current financial
assets. In addition, interest rate for the balance of advanced amount as of December 31, 2019 was
ranging from 1.07% to 2.44%.
Note (d): To the extent of the amount transferred to the underwriting banks, risks of non-collection or potential
payment default by customers in the event of insolvency are borne by respective banks. The
Company is not responsible for the collection of receivables subject to these facilities, or for any
legal proceedings and costs thereof in collecting these receivables. In case any commercial dispute
between the Company and customers or other reasons results in the Company’s failure to perform
the obligation under these facilities, the banks have requested the Company to issue promissory
notes in the amounts equal to 10 percent of respective facilities or to transfer receivables in the
amounts equal to 10 percent of respective facilities. Other than such arrangements, no collaterals
were provided by the Company.
(5) Inventories
December 31,
2019 2018
(in thousands)
Finished goods $ 9,005,001 9,406,248
Work-in-progress 9,537,700 11,133,846
Raw materials 4,917,371 5,769,010
$ 23,460,072 26,309,104
For the years ended December 31, 2019 and 2018, the amounts recognized as cost of sales
in relation to inventories were $268,335,751 thousand and $279,494,885 thousand,
respectively. The net of provisions for inventories written down to net realizable value,
which were also included in cost of sales, amounted to $33,451 thousand and $1,402,367
thousand for the years ended December 31, 2019 and 2018, respectively.
As at December 31, 2019 and 2018, none of the Company’s inventories was pledged as
collateral.

(Continued)
AU OPTRONICS CORP. AND SUBSIDIARIES
Notes to Consolidated Financial Statements
AU Optronics 2019 Annual Report
134
(6) Investments in Equity-accounted Investees
December 31,
2019 2018
(in thousands)
Associates $ 5,820,759 5,973,127
Joint ventures 178,720 312,738
$ 5,999,479 6,285,865
a. Associates
December 31, 2019 December 31, 2018
Name of
associate
Principal
activities
Principal
place of
business Amount
Ownership
interest Amount
Ownership
interest
(in thousands) % (in thousands) %
Lextar Electronics
Corp. (“Lextar”)
Manufacturing and
sales of Light
Emitting Diode
Taiwan
ROC $ 2,909,521
27 $ 3,082,178 27
Star Shining Energy
Corporation
(“SSEC”)
Investment Taiwan
ROC 1,015,512
33 1,002,874 33
Raydium
Semiconductor
Corporation
(“Raydium”)
IC design Taiwan
ROC 740,504
17 716,381 18
Daxin Materials Corp.
(“Daxin”)
Research,
manufacturing, and
sales of display
related chemicals
Taiwan
ROC 688,813
25 654,940 25
Star River Energy
Corp.
(“SREC”)
Investment Taiwan
ROC 444,550
34 434,421 34
Others 21,859 82,333
$ 5,820,759 $ 5,973,127
None of the above associates is considered individually material to the Company. The
following table summarized the amount recognized by the Company at its share of
those associates.
For the years ended
December 31,
2019 2018
(in thousands)
The Company’s share of associates’:
Profit $ 195,865 307,992
Other comprehensive loss (35,224) (15,477)
Total comprehensive income $ 160,641 292,515

AU Optronics 2019 Annual Report
Appendix 1
(Continued)
AU OPTRONICS CORP. AND SUBSIDIARIES
Notes to Consolidated Financial Statements
135
b. Joint ventures
None of the joint ventures is considered individually material to the Company. The following
table summarized the amount recognized by the Company at its share of those joint ventures.
For the years ended
December 31,
2019 2018
The Company’s share of joint ventures’: (in thousands)
Profit (loss) $ (45,958) 3,722
Other comprehensive income - -
Total comprehensive income (loss) $ (45,958) 3,722
As at December 31, 2019 and 2018, none of the Company’s investments in equity-accounted
investees was pledged as collateral.
(7) Acquisition of Subsidiaries
In March 2018, the Company obtained control over ComQi by acquiring 100% of shareholdings of
ComQi. ComQi is engaged in integration service of content management system and hardware.
Through the acquisition of ComQi, the Company expects to be able to provide a total solution for
the upstream and downstream of public information displays.
If the acquisition had taken place on January 1, 2018, management estimated that the Company’s
consolidated revenue and net profit for the year ended December 31, 2018 would have been
$307,673,560 thousand and $7,956,563 thousand, respectively. In determining these amounts,
management had assumed that the fair value adjustments that arose on the acquisition date would
have been the same if the acquisition had taken place on January 1, 2018. The aforementioned pro-
forma information is presented for illustrative purposes only and is not necessarily an indication of
revenue and results of operations of the Company that would have been achieved had the acquisition
been completed on January 1, 2018, nor is it intended to be a projection of future results.
Acquisition-related costs of $12,191 thousand on legal fees and due diligence fees were expensed
and recognized in operating expenses in the consolidated statement of comprehensive income for the
year ended December 31, 2018.
The following table summarized each major class of consideration transferred, the assets acquired
and liabilities assumed at the acquisition date and the amount of goodwill recognized.

(Continued)
AU OPTRONICS CORP. AND SUBSIDIARIES
Notes to Consolidated Financial Statements
AU Optronics 2019 Annual Report
136
a. Consideration transferred
Amounts
(in thousands)
Cash $ 467,920
Contingent consideration 283,354
$ 751,274
In accordance with the terms of the contingent consideration, in the event that ComQi’s annual
net revenue and annual recurring revenue for the year ended December 31, 2018 are greater than
the agreed revenue targets in the agreement, the Company should pay additional consideration
of USD4,000 thousand and USD7,000 thousand, respectively, to the original shareholders of
ComQi. Under the arrangement of the contingent consideration, the potential undiscounted
amount of the contingent payment that the Company might have to pay was between USD0 and
USD11,000 thousand.
The fair value of the contingent consideration estimated using Monte Carlo simulation amounted
to $283,354 thousand. The fair value measurement was based on the significant unobservable
inputs in the market and categorised as a Level 3 fair value under IFRS 13. The significant inputs
in the valuation technique used are discount rate of 8.5%, revenue volatility rate of 30.8% and
AUO’s credit spread of 0.88%.
As ComQi’s annual net revenue and annual recurring revenue for the year ended December 31,
2018 were not greater than the agreed revenue targets in the agreement, the Company remeasured
the fair value of the contingent consideration and determined the value was zero. The change in
the fair value of the contingent consideration of $283,354 thousand was not a measurement
period adjustment, and therefore, was recognized under other gains and losses in the consolidated
statement of comprehensive income for the year ended December 31, 2018.
b. Identifiable assets acquired and liabilities assumed
The following table summarized the fair value of identifiable assets acquired and liabilities
assumed recognized at the acquisition date:
Fair value
(in thousands)
Cash $ 19,432
Accounts receivable and other current assets 36,851
Property, plant and equipment 3,712
Intangible assets 150,436
Accounts payable and other current liabilities (57,361)
Other liabilities (2,120)
$ 150,950
c. Goodwill arising from the acquisition for which is attributable mainly to the synergies expected
to be achieved from integrating ComQi into the Company’s existing business has been
recognized as follows:
Amounts
(in thousands)
Consideration transferred $ 751,274
Less: Fair value of identifiable net assets (150,950)
$ 600,324
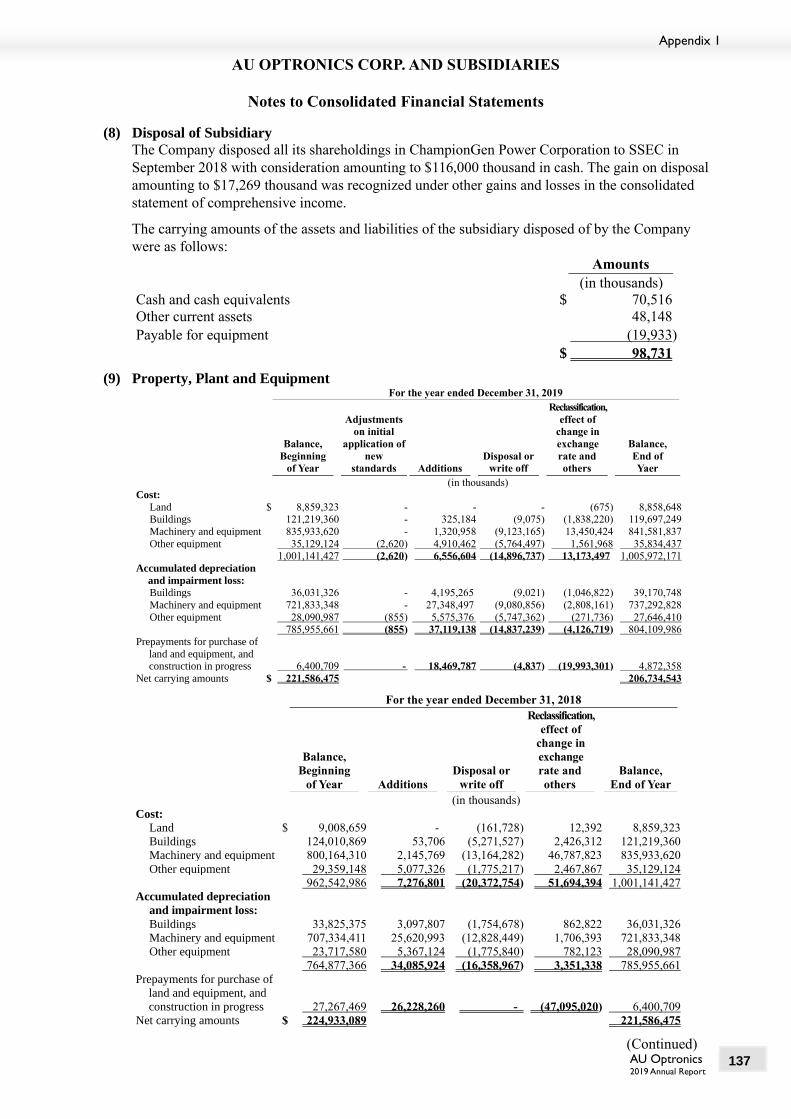
AU Optronics 2019 Annual Report
Appendix 1
(Continued)
AU OPTRONICS CORP. AND SUBSIDIARIES
Notes to Consolidated Financial Statements
137
(8) Disposal of Subsidiary
The Company disposed all its shareholdings in ChampionGen Power Corporation to SSEC in
September 2018 with consideration amounting to $116,000 thousand in cash. The gain on disposal
amounting to $17,269 thousand was recognized under other gains and losses in the consolidated
statement of comprehensive income.
The carrying amounts of the assets and liabilities of the subsidiary disposed of by the Company
were as follows:
Amounts
(in thousands)
Cash and cash equivalents $ 70,516
Other current assets 48,148
Payable for equipment (19,933)
$ 98,731
(9) Property, Plant and Equipment For the year ended December 31, 2019
Balance,
Beginning
of Year
Adjustments
on initial
application of
new
standards Additions
Disposal or
write off
Reclassification,
effect of
change in
exchange
rate and
others
Balance,
End of
Yaer
(in thousands)
Cost:
Land $ 8,859,323 - - - (675) 8,858,648 Buildings 121,219,360 - 325,184 (9,075) (1,838,220) 119,697,249
Machinery and equipment 835,933,620 - 1,320,958 (9,123,165) 13,450,424 841,581,837
Other equipment 35,129,124 (2,620) 4,910,462 (5,764,497) 1,561,968 35,834,437 1,001,141,427 (2,620) 6,556,604 (14,896,737) 13,173,497 1,005,972,171
Accumulated depreciation
and impairment loss: Buildings 36,031,326 - 4,195,265 (9,021) (1,046,822) 39,170,748
Machinery and equipment 721,833,348 - 27,348,497 (9,080,856) (2,808,161) 737,292,828
Other equipment 28,090,987 (855) 5,575,376 (5,747,362) (271,736) 27,646,410 785,955,661 (855) 37,119,138 (14,837,239) (4,126,719) 804,109,986
Prepayments for purchase of
land and equipment, and construction in progress 6,400,709 - 18,469,787 (4,837) (19,993,301) 4,872,358
Net carrying amounts $ 221,586,475 206,734,543
For the year ended December 31, 2018
Balance,
Beginning
of Year Additions
Disposal or
write off
Reclassification,
effect of
change in
exchange
rate and
others
Balance,
End of Year
(in thousands)
Cost:
Land $ 9,008,659 - (161,728) 12,392 8,859,323
Buildings 124,010,869 53,706 (5,271,527) 2,426,312 121,219,360
Machinery and equipment 800,164,310 2,145,769 (13,164,282) 46,787,823 835,933,620
Other equipment 29,359,148 5,077,326 (1,775,217) 2,467,867 35,129,124
962,542,986 7,276,801 (20,372,754) 51,694,394 1,001,141,427
Accumulated depreciation
and impairment loss:
Buildings 33,825,375 3,097,807 (1,754,678) 862,822 36,031,326
Machinery and equipment 707,334,411 25,620,993 (12,828,449) 1,706,393 721,833,348
Other equipment 23,717,580 5,367,124 (1,775,840) 782,123 28,090,987
764,877,366 34,085,924 (16,358,967) 3,351,338 785,955,661
Prepayments for purchase of
land and equipment, and
construction in progress
27,267,469
26,228,260
-
(47,095,020)
6,400,709
Net carrying amounts $ 224,933,089 221,586,475
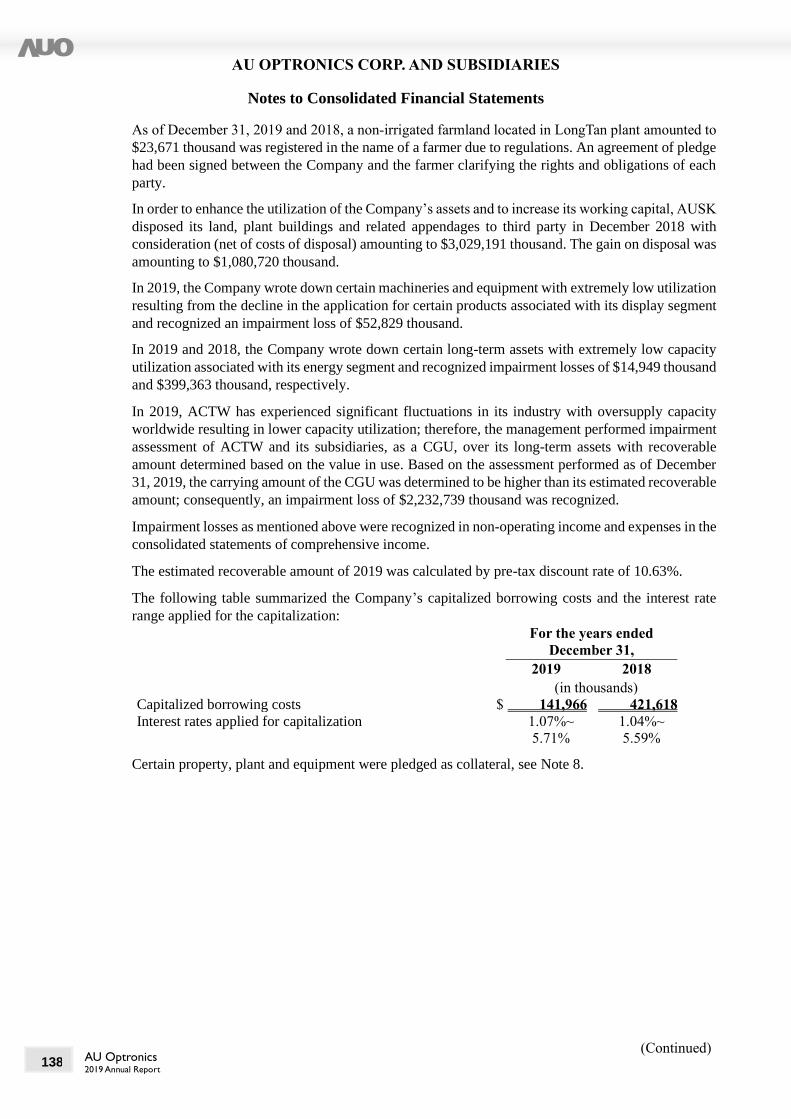
(Continued)
AU OPTRONICS CORP. AND SUBSIDIARIES
Notes to Consolidated Financial Statements
AU Optronics 2019 Annual Report
138
As of December 31, 2019 and 2018, a non-irrigated farmland located in LongTan plant amounted to
$23,671 thousand was registered in the name of a farmer due to regulations. An agreement of pledge
had been signed between the Company and the farmer clarifying the rights and obligations of each
party.
In order to enhance the utilization of the Company’s assets and to increase its working capital, AUSK
disposed its land, plant buildings and related appendages to third party in December 2018 with
consideration (net of costs of disposal) amounting to $3,029,191 thousand. The gain on disposal was
amounting to $1,080,720 thousand.
In 2019, the Company wrote down certain machineries and equipment with extremely low utilization
resulting from the decline in the application for certain products associated with its display segment
and recognized an impairment loss of $52,829 thousand.
In 2019 and 2018, the Company wrote down certain long-term assets with extremely low capacity
utilization associated with its energy segment and recognized impairment losses of $14,949 thousand
and $399,363 thousand, respectively.
In 2019, ACTW has experienced significant fluctuations in its industry with oversupply capacity
worldwide resulting in lower capacity utilization; therefore, the management performed impairment
assessment of ACTW and its subsidiaries, as a CGU, over its long-term assets with recoverable
amount determined based on the value in use. Based on the assessment performed as of December
31, 2019, the carrying amount of the CGU was determined to be higher than its estimated recoverable
amount; consequently, an impairment loss of $2,232,739 thousand was recognized.
Impairment losses as mentioned above were recognized in non-operating income and expenses in the
consolidated statements of comprehensive income.
The estimated recoverable amount of 2019 was calculated by pre-tax discount rate of 10.63%.
The following table summarized the Company’s capitalized borrowing costs and the interest rate
range applied for the capitalization:
For the years ended
December 31,
2019 2018
(in thousands)
Capitalized borrowing costs $ 141,966 421,618
Interest rates applied for capitalization 1.07%~
5.71%
1.04%~
5.59%
Certain property, plant and equipment were pledged as collateral, see Note 8.

AU Optronics 2019 Annual Report
Appendix 1
(Continued)
AU OPTRONICS CORP. AND SUBSIDIARIES
Notes to Consolidated Financial Statements
139
(10) Lease Arrangements
a. Lessees
(i) Right-of-use assets
December 31, 2019
(in thousands)
Carrying amount of right-of-use assets
Land $ 11,595,815
Buildings 575,724
Other equipment 36,229
$ 12,207,768
For the year ended
December 31, 2019
(in thousands)
Additions to right-of-use assets $ 192,655
Depreciation charge for right-of-use assets
Land $ 566,982
Buildings 238,969
Other equipment 66,590
$ 872,541
(ii) Lease liabilities
December 31, 2019
Future
minimum
lease
payments Interests
Present
value of
minimum
lease
payments
(in thousands)
Less than one year $ 879,518 197,151 682,367
Between one and five years 2,874,682 678,576 2,196,106
More than five years 9,588,087 1,375,483 8,212,604
$ 13,342,287 2,251,210 11,091,077
Lease liabilities-current $ 682,367
Lease liabilities-noncurrent $ 10,408,710
(iii) Significant lease agreements
AUO has entered into various land lease agreements with Hsinchu Science Park Bureau,
Central Science Park Administration Bureau and Southern Taiwan Science Park Bureau,
respectively, for the construction of plant for operations. All lease amounts are adjusted in
accordance with the land value announced by the government from time to time. In 2019,
AUO modified one of its lease contracts due to the decrease of the scope of the lease, and
therefore, the carrying amount of the right-of-use asset was reduced by $1,064,094
thousand. The difference between the remeasurement of the lease liability and the reduction
of the right-of-use asset was recognized in profit or loss.
(iv) Sublease of right-of-use assets
The Company subleased part of its right-of-use assets under operating leases. In 2019, the
income from sublease was $8,199 thousand. Right-of-use assets that meet the definition of
investment properties are reclassified to investment properties. Refer to Note 6(11) for
further information on investment properties.

(Continued)
AU OPTRONICS CORP. AND SUBSIDIARIES
Notes to Consolidated Financial Statements
AU Optronics 2019 Annual Report
140
(v) Additional lease information
The Company applies the recognition exemption to account for short-term leases and leases
of low-value assets, primarily for some leases of office buildings and other sporadic leasing.
The amounts recognized in profit or loss during the lease term were as follows:
For the year ended
December 31, 2019
(in thousands)
Expenses relating to short-term leases $ 15,832
Expenses relating to leases of low-value assets, excluding
short-term leases of low-value assets $ 315
Total cash outflow for the Company’s leases in which it acts as a lessee for the year ended
December 31, 2019 was $920,666 thousand.
b. Lessor
The Company leased out its investment properties and part of its land, buildings and equipment
and did not transfer substantially all the risks and rewards incidental to their ownership to the
lessees, therefore, those leases were recognized as operating leases. Refer to Note 6(24) for the
information of rental income from operating leases. In addition, the direct costs relating to the
aforementioned operating leases amounted to $3,007 thousand for the year ended December 31,
2019.
The maturity analysis of undiscounted operating lease receivable for the abovementioned assets
are as follows:
December 31,
2019
(in thousands)
Year 1 $ 110,905
Year 2 110,316
Year 3 110,025
Year 4 106,272
Year 5 105,721
Year 6 onwards 2,079,849
Total undiscounted operating lease receivable $ 2,623,088
Refer to Note 6(17) for the Company’s respective information as lessor and lessee as of
December 31, 2018.

AU Optronics 2019 Annual Report
Appendix 1
(Continued)
AU OPTRONICS CORP. AND SUBSIDIARIES
Notes to Consolidated Financial Statements
141
(11) Investment Property For the year ended December 31, 2019
Balance,
Beginning
of Year Additions
Reclassification
and effect of
change in
exchange rate
Balance,
End of
Year
(in thousands)
Cost:
Land $ 730,306 - (667) 729,639
Buildings - - 1,418,652 1,418,652
Right-of-use assets - - 28,570 28,570
730,306 - 1,446,555 2,176,861
Accumulated depreciation:
Buildings - 7,363 612,618 619,981
Right-of-use assets - 302 1,448 1,750
- 7,665 614,066 621,731
Net carrying amounts $ 730,306 1,555,130
Fair Value $ 2,252,170 4,057,848
For the year ended December 31, 2018
Balance,
Beginning
of Year Additions
Reclassification
and effect of
change in
exchange rate
Balance,
End of
Year
(in thousands)
Land $ 717,823 - 12,483 730,306
Fair Value $ 2,213,184 2,252,170
In order to enhance the utilization of the Company’s assets and to increase its working capital, AUSJ
leased its buildings and right-of-use assets to third party in 2019, and has reclassified the
aforementioned assets totaling $832,886 thousand from property, plant and equipment and right-of-
use assets to investment property.
The fair value of investment property is based on a valuation performed by a qualified independent
appraiser who holds a recognized and relevant professional qualification and has recent valuation
experience in the location and category of the investment property being valued. The valuation is
performed using income approach, sales comparison approach and land development analysis
approach with reference to available market information.
The fair value measurement was categorized as a level 3 fair value based on the inputs in the valuation
techniques used. Income approach determines the fair value of the investment property based on the
projected cash flows from the Company’s estimated future rentals collected and discounted using the
capitalization rate of the property. Sales comparison approach is through comparison, analysis,
adjustment and other means of value for comparable properties to estimate the value of the
investment property. Land development analysis approach determine the fair value of investment
property based on the value prior to development or construction, after deducting the direct cost,
indirect cost, capital interest and profit during the development period, and also consider total sales
price of properties after completion of development or construction. It also incorporates the
possibility of changes in utility of land through development or improvement in accordance with
legal use and density of the land.

(Continued)
AU OPTRONICS CORP. AND SUBSIDIARIES
Notes to Consolidated Financial Statements
AU Optronics 2019 Annual Report
142
The significant inputs used in the fair value measurement were as follows:
December 31,
2019 2018
Overall capital interest rate 2.53% 1.86%
Rate of return 15.00% 10.00%
Capitalization rate 8.00%~12.00% 12.00%
As at December 31, 2019 and 2018, there was no investment property that was pledged as collateral.
(12) Intangible Assets
For the year ended December 31, 2019
Balance,
Beginning
of Year Additions
Effect of
change in
exchange rate
Balance,
End of Year
(in thousands)
Cost:
Goodwill $ 12,056,500 - - 12,056,500
Patent and technology fee 12,271,742 1,711 (7,140) 12,266,313
Others 150,436 - - 150,436
24,478,678 1,711 (7,140) 24,473,249
Accumulated amortization and
impairment loss:
Goodwill 175,581 - - 175,581
Patent and technology fee 10,903,269 436,815 (1,178) 11,338,906
Others 22,565 127,871 - 150,436
11,101,415 564,686 (1,178) 11,664,923
Net carrying amounts $ 13,377,263 12,808,326
For the year ended December 31, 2018
Balance,
Beginning
of Year Additions
Effect of
change in
consolidated
entities
Effect of
change in
exchange
rate
Balance,
End of Year
(in thousands)
Cost:
Goodwill $ 11,456,176 - 600,324 - 12,056,500
Patent and technology fee 12,275,548 - - (3,806) 12,271,742
Others - - 150,436 - 150,436
23,731,724 - 750,760 (3,806) 24,478,678 Accumulated amortization and
impairment loss:
Goodwill 175,581 - - - 175,581
Patent and technology fee 10,385,251 518,404 - (386) 10,903,269
Others - 22,565 - - 22,565
10,560,832 540,969 - (386) 11,101,415
Net carrying amounts $ 13,170,892 13,377,263
The Company acquired goodwill and other intangible assets arising from the business combination
in March 2018. Please refer to Note 6(7) for the relevant information.
For the purpose of impairment test, the following table shows the information of the operating
business that the Company’s goodwill allocating to.

AU Optronics 2019 Annual Report
Appendix 1
(Continued)
AU OPTRONICS CORP. AND SUBSIDIARIES
Notes to Consolidated Financial Statements
143
December 31,
2019 2018
(in thousands)
Display business $ 11,880,919 11,880,919
The Company’s goodwill has been tested for impairment at least once at the end of the annual
reporting period. The recoverable amount was determined based on value in use of the operating
business.
The key assumptions used in the estimation of the recoverable amount included discount rate and
terminal growth rate. The annual discount rates for the years ended December 31, 2019 and 2018
were 12.25% and 11.57%, respectively, based on industry weighted average cost of capital. The cash
flow projections were determined based on the financial budgets approved by management covering
the future five-year period and extrapolated with a steady annual terminal growth rate for subsequent
years, which were negative 0.5% and negative 1% for the years ended December 31, 2019 and 2018,
respectively. The key assumptions abovementioned represents the management’s forecast of the
future for the related industry by considering the history information from internal and external
sources.
Based on the impairment assessment for the years ended December 31, 2019 and 2018, no
impairment losses were recognized as the recoverable amount of the CGU was higher than its
carrying value.
(13) Other Current Assets and Other Noncurrent Assets
December 31,
2019 2018
(in thousands)
Refundable and overpaid tax $ 1,458,170 1,351,646
Refundable deposits 663,911 716,097
Prepayment for equipment 453,300 650,727
Prepayments for purchases 158,521 230,793
Long-term receivables 5,812 930,001
Long-term prepaid rents - 1,364,111
Others 2,961,194 2,869,869
5,700,908 8,113,244
Less: current (3,295,562) (2,941,598)
Noncurrent $ 2,405,346 5,171,646
The long-term prepaid rents were reclassified to right-of-use assets on January 1, 2019 upon the
initial adoption of IFRS 16. See Note 3(1).
(14) Short-term Borrowings
December 31,
2019 2018
(in thousands)
Unsecured borrowings $ 1,725,602 546,472
Unused credit facilities $ 37,982,721 43,533,037
Interest rate range
1.20%~
4.35%
2.54%~
4.35%
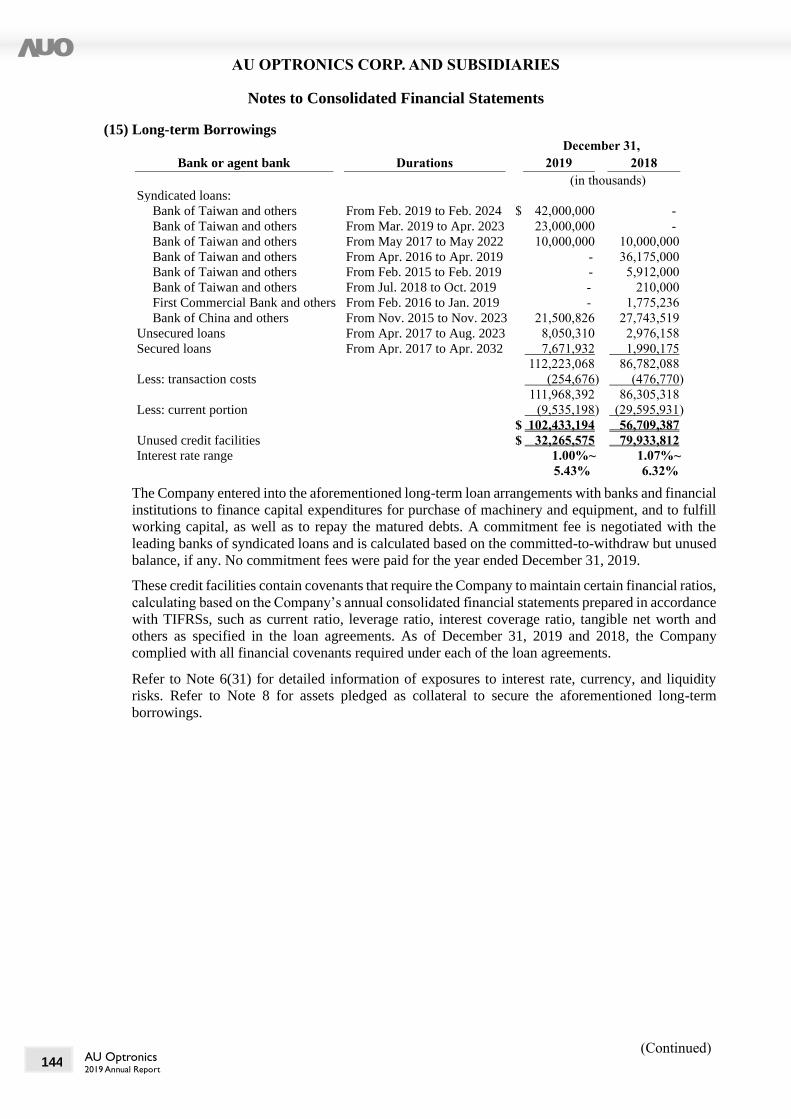
(Continued)
AU OPTRONICS CORP. AND SUBSIDIARIES
Notes to Consolidated Financial Statements
AU Optronics 2019 Annual Report
144
(15) Long-term Borrowings
December 31,
Bank or agent bank Durations 2019 2018
(in thousands)
Syndicated loans:
Bank of Taiwan and others From Feb. 2019 to Feb. 2024 $ 42,000,000 -
Bank of Taiwan and others From Mar. 2019 to Apr. 2023 23,000,000 -
Bank of Taiwan and others From May 2017 to May 2022 10,000,000 10,000,000
Bank of Taiwan and others From Apr. 2016 to Apr. 2019 - 36,175,000
Bank of Taiwan and others From Feb. 2015 to Feb. 2019 - 5,912,000
Bank of Taiwan and others From Jul. 2018 to Oct. 2019 - 210,000
First Commercial Bank and others From Feb. 2016 to Jan. 2019 - 1,775,236
Bank of China and others From Nov. 2015 to Nov. 2023 21,500,826 27,743,519
Unsecured loans From Apr. 2017 to Aug. 2023 8,050,310 2,976,158
Secured loans From Apr. 2017 to Apr. 2032 7,671,932 1,990,175
112,223,068 86,782,088
Less: transaction costs (254,676) (476,770)
111,968,392 86,305,318
Less: current portion (9,535,198) (29,595,931)
$ 102,433,194 56,709,387
Unused credit facilities $ 32,265,575 79,933,812
Interest rate range
1.00%~
5.43%
1.07%~
6.32%
The Company entered into the aforementioned long-term loan arrangements with banks and financial
institutions to finance capital expenditures for purchase of machinery and equipment, and to fulfill
working capital, as well as to repay the matured debts. A commitment fee is negotiated with the
leading banks of syndicated loans and is calculated based on the committed-to-withdraw but unused
balance, if any. No commitment fees were paid for the year ended December 31, 2019.
These credit facilities contain covenants that require the Company to maintain certain financial ratios,
calculating based on the Company’s annual consolidated financial statements prepared in accordance
with TIFRSs, such as current ratio, leverage ratio, interest coverage ratio, tangible net worth and
others as specified in the loan agreements. As of December 31, 2019 and 2018, the Company
complied with all financial covenants required under each of the loan agreements.
Refer to Note 6(31) for detailed information of exposures to interest rate, currency, and liquidity
risks. Refer to Note 8 for assets pledged as collateral to secure the aforementioned long-term
borrowings.

AU Optronics 2019 Annual Report
Appendix 1
(Continued)
AU OPTRONICS CORP. AND SUBSIDIARIES
Notes to Consolidated Financial Statements
145
(16) Provisions
Warranties(i)
Litigation
and claims Others Total
(in thousands)
Balance at January 1, 2019 $ 1,463,869 431,228 642,952 2,538,049
Additions (Reversals) 251,512 (116,094) (252,208) (116,790)
Usage (422,976) (156,521) (63,661) (643,158)
Effect of change in
exchange rate (159) (6,312) (10,072) (16,543)
Balance at December 31,
2019 1,292,246 152,301 317,011 1,761,558
Less: current (486,517) (152,301) (69,450) (708,268)
Noncurrent $ 805,729 - 247,561 1,053,290
Balance at January 1, 2018 $ 1,546,960 89,520 249,483 1,885,963
Additions (Reversals) 176,092 336,061 570,898 1,083,051
Usage (259,109) - (187,842) (446,951)
Effect of change in
exchange rate
(74) 5,647 10,413 15,986
Balance at December 31,
2018
1,463,869 431,228 642,952 2,538,049
Less: current (686,424) (431,228) (389,912) (1,507,564)
Noncurrent $ 777,445 - 253,040 1,030,485
(i) The provisions for warranties for the years ended December 31, 2019 and 2018 were estimated based on
historical experience of warranty claims rate associated with similar products and services. The Company
expects most warranty claims will be made within two years from the date of the sale of the product.
(17) Operating Leases
a. Lessees
Future minimum lease payments under non-cancellable operating leases as of December 31,
2018 were as follows:
December 31,
2018
(in thousands)
Less than one year $ 927,351
Between one and five years 2,928,983
More than five years 2,085,877
$ 5,942,211
AUO entered into various operating lease agreements for land with Hsinchu Science Park
Bureau beginning from March 1, 1994 for a period of 20 years, with renewal option upon
expiration. AUO had on July 2003 and November 2006, entered into various operating lease for
land with Central Science Park Administration Bureau for period from July 28, 2003 till
December 31, 2023 and November 9, 2006 till December 31, 2025. All lease amounts are
adjusted in accordance with the land value announced by the government from time to time.
AUO had also on February 2008 and October 2018, respectively, renewed its lease agreements
with Hsinchu Science Park Bureau and Southern Taiwan Science Park Bureau, respectively, for
the lands in Longtan Science Park and Kaohsiung Science Park. The period covers from
February 9, 2008 till December 31, 2027 and October 23, 2018 till October 22, 2038,
respectively. All lease amounts are adjusted in accordance with the land value announced by the
government from time to time.

(Continued)
AU OPTRONICS CORP. AND SUBSIDIARIES
Notes to Consolidated Financial Statements
AU Optronics 2019 Annual Report
146
Rental expense for operating leases amounted to $1,064,263 thousand for the year ended
December 31, 2018.
b. Lessor
The Company leased its investment properties to third parties under operating lease. Refer to
Note 6(11) for further information on investment properties.
Future minimum lease receivables under non-cancellable operating leases as of December 31,
2018 were as follows:
December 31,
2018
(in thousands)
Less than one year $ 105,788
Between one and five years 423,150
More than five years 2,188,728
$ 2,717,666
In addition to the above-mentioned, the Company also leased partial offices to others. See Note
6(24) for rental income. Repair and maintenance expenses incurred from aforementioned
operating leases for the year ended December 31, 2018 amounted to $1,723 thousand.
(18) Employee Benefits
a. Defined benefit plans
Pursuant to the ROC Labor Standards Act, AUO has established a defined benefit pension plan
covering their full-time employees in the ROC. This plan provides for retirement benefits to
retiring employees based on years of service and the average salaries and wages for the six-
month period before the employee’s retirement. The funding of this retirement plan by AUO is
contributed monthly based on a certain percentage of employees’ total salaries and wages. The
fund is deposited with Bank of Taiwan.
M.Setek has established defined benefit pension plans providing for retirement benefits to
retiring employees based on years of service, position, and certain other factors in accordance
with the regulations of its country of establishment.
(i) Reconciliation for AUO’s and M.Setek’s present value of defined benefit obligation and
the fair value of plan assets
December 31,
2019 2018
(in thousands)
Present value of defined benefit obligation $ (3,155,988) (3,257,962)
Fair value of plan assets 2,542,831 2,367,273
Net defined benefit liability $ (613,157) (890,689)

AU Optronics 2019 Annual Report
Appendix 1
(Continued)
AU OPTRONICS CORP. AND SUBSIDIARIES
Notes to Consolidated Financial Statements
147
(ii) Movement in net defined benefit asset (liability)
Defined benefit
obligation
Fair value of plan
assets
Net defined benefit
asset (liability)
2019 2018 2019 2018 2019 2018
(in thousands)
Balance at January 1, $ (3,257,962) (3,128,927) 2,367,273 2,213,018 (890,689) (915,909)
Included in profit or loss
Service cost (4,104) (5,289) - - (4,104) (5,289)
Interest cost (39,337) (49,598) - - (39,337) (49,598)
Expected return on plan
assets - - 28,880 35,408 28,880 35,408
(43,441) (54,887) 28,880 35,408 (14,561) (19,479)
Included in other
comprehensive income
Remeasurements (loss)
gain:
Actuarial (loss) gain
arising from:
- demographic
assumptions 89,851 (15,795) - - 89,851 (15,795)
- financial assumptions (206,995) (178,212) - - (206,995) (178,212)
- experience adjustment 228,466 84,437 - - 228,466 84,437
Return on plan assets
excluding interest
income - - 76,788 52,614 76,788 52,614
111,322 (109,570) 76,788 52,614 188,110 (56,956)
Other
Contributions paid by the
employer - - 101,019 102,831 101,019 102,831
Benefits paid 33,936 36,915 (31,129) (36,598) 2,807 317
Effect of changes in
exchange rates and
others 157 (1,493) - - 157 (1,493)
34,093 35,422 69,890 66,233 103,983 101,655
Balance at December 31, $ (3,155,988) (3,257,962) 2,542,831 2,367,273 (613,157) (890,689)
(iii) Plan assets
Pursuant to the ROC Labor Standards Act, AUO contributes an amount based on a certain
percentage of employees’ total salaries and wages paid every month to its pension fund
(the “Fund”), which is administered by the Bureau of Labor Fund, Ministry of Labor and
supervised by the employees’ pension plan committee (the “Committee”) and deposited in
the Committee’s name with Bank of Taiwan. Under the ROC Regulations for Revenues,
Expenditures, Safeguard and Utilization of the Labor Retirement Fund, the minimum
return on the plan assets should not be lower than the average interest rate on two-year time
deposits published by the local banks. The government is not only responsible for the
determination of the investment strategies and policies, but also for any shortfall in the
event that the rate of return is less than the required rate of return.
As of December 31, 2019, the Fund deposited in the Committee’s name in the Bank of
Taiwan amounted to $2,542,854 thousand. Information on utilization of labor pension
funds, including the yield rate of funds and the component of plan assets are available at
the Bureau of Labor Funds, Ministry of Labor website.
Under the defined benefit plans in Japan, M.Setek is responsible to pay to employees when
they are retired.

(Continued)
AU OPTRONICS CORP. AND SUBSIDIARIES
Notes to Consolidated Financial Statements
AU Optronics 2019 Annual Report
148
(iv) Defined benefit obligation
(a) Principal actuarial assumptions
December 31,
2019 2018
Discount rate 0.18%~0.88% 0.21%~1.22%
Rate of increase in future salary 0.77%~4.49% 0.77%~4.49%
The Company anticipates contributing $100,799 thousand to the defined benefit plans
in the next year starting from January 1, 2020.
As at December 31, 2019, the weighted-average duration of the defined benefit
obligation was between 5 years to 20 years.
(b) Sensitivity analysis
Reasonably possible changes at December 31, 2019 and 2018 to one of the relevant
actuarial assumptions, holding other assumptions constant, would have affected the
defined benefit obligation by the amounts shown below.
December 31, 2019 December 31, 2018
Changes in assumptions Changes in assumptions
+ 0.25% - 0.25% + 0.25% - 0.25%
(in thousands) (in thousands)
Discount rate $ (150,970) 159,425 (160,307) 169,544
Rate of increase in
future salary
$ 156,774 (148,385) 166,250 (158,100)
In practical, the relevant actuarial assumptions are correlated to each other. The
approach to develop the sensitivity analysis as above is the same approach to recognize
the net defined benefit liability in the balance sheet.
The approach to develop the sensitivity analysis and its relevant actuarial assumptions
are the same as those in previous year.
b. Defined contribution plans
Commencing July 1, 2005, pursuant to the ROC Labor Pension Act (the “Act”), employees who
elected to participate in the Act or joined the Company after July 1, 2005, are subject to a defined
contribution plan under the Act. Under the defined contribution plan, AUO and its subsidiaries
located in the ROC contribute monthly at a rate of no less than six percent of the employees’
monthly salaries and wages to the employee’s individual pension fund account at the ROC
Bureau of Labor Insurance. The Company’s foreign subsidiaries have set up their retirement
plans, if necessary, based on their respective local government regulations.
AUO and its subsidiaries in the ROC have set up defined contribution plans in accordance with
the Act. For the years ended December 31, 2019 and 2018, these companies set aside, $977,908
thousand and $1,024,700 thousand, respectively, of the pension costs under the pension plan to
the ROC Bureau of the Labor Insurance. Except for the aforementioned companies, other
foreign subsidiaries recognized pension expenses of $784,169 thousand and $923,378 thousand
for the years ended December 31, 2019 and 2018, respectively, for the defined contribution
plans based on their respective local government regulations.
(19) Capital and Other Components of Equity
a. Common stock
AUO’s authorized common stock, with par value of $10 per share, both amounted to
$100,000,000 thousand as at December 31, 2019 and 2018.
AUO’s issued common stock, with par value of $10 per share, both amounted to $96,242,451
thousand as at December 31, 2019 and 2018.

AU Optronics 2019 Annual Report
Appendix 1
(Continued)
AU OPTRONICS CORP. AND SUBSIDIARIES
Notes to Consolidated Financial Statements
149
On September 9, 2019, AUO’s Board of Directors approved the delisting of ADSs from the
NYSE and trading on the OTC market. On and from October 1, 2019, AUO’s ADSs has begun
trading on the OTC market. As of December 31, 2019, AUO has issued 50,123 thousand ADSs,
which represented 501,229 thousand shares of its common stock.
b. Capital surplus
The components of capital surplus were as follows:
December 31,
2019 2018
(in thousands)
From common stock $ 52,756,091 52,756,091
From convertible bonds 6,049,862 6,049,862
From others 1,738,521 1,816,090
$ 60,544,474 60,622,043
According to the ROC Company Act, capital surplus, including premium from stock issuing
and donations received, shall be applied to offset accumulated deficits before it can be
distributed by issuing common stock as stock dividends or by cash according to the proportion
of shareholdings. Pursuant to the ROC Regulations Governing the Offering and Issuance of
Securities by Securities Issuers, the total sum of capital surplus capitalized per annum shall not
exceed 10 percent of the paid-in capital.
c. Legal reserve
According to the ROC Company Act, 10 percent of the net profit shall be allocated as legal
reserve until the accumulated legal reserve equals the paid-in capital. When a company incurs
no loss, it may, pursuant to a resolution to be adopted by a shareholders’ meeting, distribute its
legal reserve by issuing new shares or by cash, only the portion of legal reserve which exceeds
25 percent of the paid-in capital may be distributed.
d. Distribution of earnings
In accordance with AUO’s Articles of Incorporation, after payment of income taxes and
offsetting accumulated deficits, the legal reserve shall be set aside until the accumulated legal
reserve equals AUO’s paid-in capital. In addition, a special reserve in accordance with
applicable laws and regulations shall also be set aside or reversed. The remaining current-year
earnings together with accumulated undistributed earnings from preceding years can be
distributed according to relevant laws and AUO’s Articles of Incorporation.
AUO’s dividend policy is to pay dividends from surplus considering factors such as AUO’s
current and future investment environment, cash requirements, domestic and overseas
competitive conditions and capital budget requirements, while taking into account shareholders’
interest, maintenance of balanced dividend and AUO’s long-term financial plan. If the current-
year retained earnings available for distribution reach 2% of the paid-in capital of AUO,
dividend to be distributed shall be no less than 20% of the current-year retained earnings
available for distribution. If the current-year retained earnings available for distribution do not
reach 2% of the paid-in capital of AUO, AUO may decide not to distribute dividend. The cash
portion of the dividend, which may be in the form of cash and stock, shall not be less than 10%
of the total dividend distributed during the year. The dividend distribution ratio aforementioned
could be adjusted after taking into consideration factors such as finance, business and operations,
etc.
Pursuant to relevant laws or regulations or as requested by the local authority, total net debit
balance of the other components of equity shall be set aside from current earnings as special
reserve, and not for distribution. Subsequent decrease pertaining to items that are accounted for

(Continued)
AU OPTRONICS CORP. AND SUBSIDIARIES
Notes to Consolidated Financial Statements
AU Optronics 2019 Annual Report
150
as a reduction to the other components of equity shall be reclassified from special reserve to
undistributed earnings.
AUO’s appropriations of earnings for 2017 had been approved in the shareholders’ meeting held
on June 15, 2018. The appropriations and dividends per share were as follows:
For fiscal year 2017
Appropriation
of earnings
Dividends per
share
(in thousands, except for per share data)
Legal reserve $ 3,235,942
Cash dividends to shareholders 14,436,368 $1.50
$ 17,672,310
The aforementioned appropriation of earnings for 2017 was consistent with the resolutions of
the board of directors’ meeting held on March 23, 2018.
AUO’s appropriations of earnings for 2018 had been approved in the shareholders’ meeting held
on June 14, 2019. The appropriations and dividends per share were as follows:
For fiscal year 2018
Appropriation
of earnings
Dividends per
share
(in thousands, except for per share data)
Legal reserve $ 1,016,060
Special reserve 847,770
Cash dividends to shareholders 4,812,122 $0.50
$ 6,675,952
The aforementioned appropriation of earnings for 2018 was consistent with the resolutions of
the board of directors’ meeting held on March 22, 2019.
Information on the approval of board of directors and shareholders for AUO’s appropriations of
earnings are available at the Market Observation Post System website.
e. Treasury shares
According to the resolution approved by the board of directors’ meeting held on September 9,
2019, AUO expects to repurchase 125,000 thousand shares as treasury shares transferred to
employees in accordance with Securities and Exchange Act requirements. The related
information on treasury share transactions was as follows: For the year ended December 31, 2019
Reason for reacquisition
Number of
shares,
Beginning of
Year Additions Reductions
Number of
shares, End of Year
(in thousands of shares)
Transferring to employees - 125,000 - 125,000
Pursuant to the Securities and Exchange Act, the number of shares repurchased shall not exceed
10 percent of the number of the company’s issued and outstanding shares, and the total amount
repurchased shall not exceed the sum of the company’s retained earnings, share premium, and
realized capital surplus. Also, the shares repurchased for transferring to employees shall be
transferred within five years from the date of reacquisition and those shares not transferred
within the five-year period are to be retired.
In accordance with the Securities and Exchange Act, treasury shares held by AUO shall not be
pledged, and do not hold any shareholder rights before their transfer.

AU Optronics 2019 Annual Report
Appendix 1
(Continued)
AU OPTRONICS CORP. AND SUBSIDIARIES
Notes to Consolidated Financial Statements
151
f. Other components of equity
Cumulative
translation
differences
Unrealized
gains (losses)
on financial
assets at
FVTOCI Total
(in thousands)
Balance at January 1, 2019 $ (1,449,910) 602,140 (847,770)
Foreign operations – foreign currency
translation differences (2,043,931) - (2,043,931)
Net change in fair value of financial assets
at FVTOCI - 519,100 519,100
Equity-accounted investees – share of other
comprehensive income (38,512) 3,358 (35,154)
Realized gain on sales of securities reclassified
to profit or loss (9,098) - (9,098)
Related tax 411,469 - 411,469
Balance at December 31, 2019 $ (3,129,982) 1,124,598 (2,005,384)
Cumulative
translation
differences
Unrealized
gains (losses)on
financial assets
at FVTOCI
Unrealized gains
(losses) on
available-for-sale
financial assets Total
(in thousands)
Balance at January 1, 2018 $ (1,120,969) - 1,377,031 256,062
Adjustments on initial application
of new standards - 1,303,816 (1,377,031) (73,215)
Foreign operations – foreign
currency translation differences (336,902) - - (336,902)
Net change in fair value of financial
assets at FVTOCI - (754,813) - (754,813)
Equity-accounted investees – share
of other comprehensive income (19,716) 3,053 - (16,663)
Realized gain on sales of securities
reclassified to profit or loss (107,457) - - (107,457)
Cumulative unrealized loss of
equity instruments transferred to
retained earnings due to disposal - 50,084 - 50,084
Group reorganization (22,225) - - (22,225)
Related tax 157,359 - - 157,359
Balance at December 31, 2018 $ (1,449,910) 602,140 - (847,770)
g. Non-controlling interests, net of tax
For the years ended
December 31,
2019 2018
(in thousands)
Balance at the beginning of the year $ 14,415,973 17,090,747
Equity attributable to non-controlling interests:
Loss for the year (2,414,158) (2,200,703)
Adjustment of changes in ownership of investees 111,056 (20,996)
Foreign currency translation differences (404,575) (306,963)
Unrealized losses on financial assets at FVTOCI - (1,474)
Effect of acquisition of non-controlling interests (389,430) -
Proceeds from subsidiaries capital increase and
others
(13,957) (144,638)
Balance at the end of the year $ 11,304,909 14,415,973

(Continued)
AU OPTRONICS CORP. AND SUBSIDIARIES
Notes to Consolidated Financial Statements
AU Optronics 2019 Annual Report
152
(20) Share-based Payments
The Company’s employee stock option plans were as follows:
ACTW Option Plan
a. The key terms and conditions related to the grants under ACTW’s outstanding employee stock
option plan were disclosed as follows:
Grant
date
Total number of
options issued
(units in
thousands)
Contractual
life of options
Exercisable
period
Exercise
price
(per share)
2014 Employee stock
option plan
Sep. 1,
2014
20 Sep.1, 2014 –
Aug. 31, 2019
After Aug. 31,
2016
$10
b. The related employee benefit expenses and capital surplus recognized on ACTW’s employee
stock options were nil and $167 thousand for the years ended December 31, 2019 and 2018,
respectively.
c. The fair value of the employee stock options granted by ACTW was measured at the dates of
grant using the Binomial option pricing model. The valuation information was as follows:
2014 Employee Stock
Option Plan
Expected volatility 38.88%
Risk-free interest rate 1.1648%
Expected duration 5 years
Fair value at the grant date NT$0.20/per share
d. Information about ACTW’s outstanding stock options is as follows: For the years ended December 31,
2019 2018
Weighted-
average
exercise
price
(per share)
Number of
options
(shares)
Weighted-
average
exercise
price
(per share)
Number of
options
(shares)
Outstanding at January 1 $ 10 13,291,000 $ 10 16,601,000
Options exercised 10 (11,995,000) 10 (2,260,000)
Options expired - (1,296,000) - (1,050,000)
Outstanding at December 31 - - 10 13,291,000
Exercisable at December 31 - 13,291,000

AU Optronics 2019 Annual Report
Appendix 1
(Continued)
AU OPTRONICS CORP. AND SUBSIDIARIES
Notes to Consolidated Financial Statements
153
(21) Revenue from Contracts with Customers
For the year ended December 31, 2019
Display
segment
Energy
segment
Total
segments
(in thousands)
Primary geographical markets:
PRC (including Hong Kong) $ 97,084,436 1,277,799 98,362,235
Taiwan 78,394,325 4,835,269 83,229,594
Singapore 38,526,625 7,666 38,534,291
Japan 19,877,671 1,046,332 20,924,003
Others 22,784,165 4,957,406 27,741,571
$ 256,667,222 12,124,472 268,791,694
For the year ended December 31, 2019
Display
segment
Energy
segment
Total
segments
(in thousands)
Major products:
Products for Televisions $ 87,269,763 - 87,269,763
Products for Mobile PCs and Devices 69,305,510 - 69,305,510
Products for Monitors 39,522,268 - 39,522,268
Products for Commercial and Others(i) 60,569,681 - 60,569,681
Solar Products - 12,124,472 12,124,472
$ 256,667,222 12,124,472 268,791,694
Major customers:
Customer A $ 33,142,985 - 33,142,985
Others (individually not greater than 10%) 223,524,237 12,124,472 235,648,709
$ 256,667,222 12,124,472 268,791,694
For the year ended December 31, 2018
Display
segment
Energy
segment
Total
segments
(in thousands)
Primary geographical markets:
PRC (including Hong Kong) $ 112,542,529 1,089,508 113,632,037
Taiwan 93,126,115 6,231,767 99,357,882
Singapore 39,363,415 7,515 39,370,930
Japan 19,748,373 1,418,491 21,166,864
Others 26,004,322 8,102,354 34,106,676
$ 290,784,754 16,849,635 307,634,389
Major products:
Products for Televisions $ 113,194,567 - 113,194,567
Products for Mobile PCs and Devices 74,375,305 - 74,375,305
Products for Monitors 47,024,353 - 47,024,353
Products for Commercial and Others(i) 56,190,529 - 56,190,529
Solar Products - 16,849,635 16,849,635
$ 290,784,754 16,849,635 307,634,389
Major customers:
Customer A $ 35,358,013 - 35,358,013
Others (individually not greater than 10%) 255,426,741 16,849,635 272,276,376
$ 290,784,754 16,849,635 307,634,389

(Continued)
AU OPTRONICS CORP. AND SUBSIDIARIES
Notes to Consolidated Financial Statements
AU Optronics 2019 Annual Report
154
(i) Others include sales from products for other applications and sales of raw materials, components and
from service charges.
(22) Remuneration to Employees and Directors
According to AUO’s Articles of Incorporation, AUO should distribute remuneration to employees
and directors no less than 5% and no more than 1% of annual profits before income tax, respectively,
after offsetting accumulated deficits, if any. Only employees, including employees of affiliate
companies that meet certain conditions are entitled to the abovementioned remuneration which to be
distributed in stock or cash. The said conditions and distribution method are decided by board of
directors or the personnel authorized by board of directors.
AUO did not accrue remuneration to employees and directors due to the loss making position for the
year ended December 31, 2019.
AUO accrued remuneration to employees based on the profit before income tax excluding the
remuneration to employees and directors for the period, multiplied by the percentage resolved by
board of directors. For the year ended December 31, 2018, AUO estimated the remuneration to
employees amounting to $1,215,696 thousand. Remuneration to directors was estimated based on
the amount expected to pay and recognized together with the remuneration to employees as cost of
sales or operating expenses. If remuneration to employees is resolved to be distributed in stock, the
number of shares is determined by dividing the amount of remuneration by the closing price of the
shares (ignoring ex-dividend effect) on the day preceding the board of directors’ meeting. If there is
a change in the proposed amounts after the annual consolidated financial statements are authorized
for issue, the differences are accounted for as a change in accounting estimate and adjusted
prospectively to next year’s profit or loss.
Remuneration to employees and directors for 2018 in the amounts of $1,215,696 thousand and
$27,780 thousand, respectively, in cash for payment had been approved in the meeting of board of
directors held on March 22, 2019. The aforementioned approved amounts are the same as the
amounts charged against earnings of 2018.
Remuneration to employees and directors for 2017 in the amounts of $4,062,114 thousand and
$132,604 thousand, respectively, in cash for payment had been approved in the meeting of board of
directors held on March 23, 2018. The aforementioned approved amounts are the same as the
amounts charged against earnings of 2017.
The information about AUO’s remuneration to employees and directors is available at the Market
Observation Post System website.
(23) The Nature of Expenses For the years ended December 31,
2019 2018
Recognized
in cost of
sales
Recognized
in
operating
expenses Total
Recognized
in cost of
sales
Recognized
in
operating
expenses Total
(in thousands)
Employee benefits expenses:
Salaries and wages $23,538,794 7,286,093 30,824,887 27,135,370 7,798,555 34,933,925
Labor and health insurances 1,439,339 477,905 1,917,244 1,511,793 497,859 2,009,652
Retirement benefits 1,399,297 377,341 1,776,638 1,585,950 381,607 1,967,557
Other employee benefits 3,075,827 559,544 3,635,371 3,222,160 617,828 3,839,988
Depreciation 31,599,910 4,093,123 35,693,033 29,980,415 3,706,146 33,686,561
Amortization 436,815 127,871 564,686 518,403 22,566 540,969

AU Optronics 2019 Annual Report
Appendix 1
(Continued)
AU OPTRONICS CORP. AND SUBSIDIARIES
Notes to Consolidated Financial Statements
155
(24) Other Income
For the years ended
December 31,
2019 2018
(in thousands)
Interest income on bank deposits $ 879,053 832,621
Interest income on government bonds with reverse
repurchase agreements and others 6,467 8,994
Rental income, net 488,811 628,401
Dividend income 295,575 468,263
Grants 2,734,987 2,716,197
Others 915,378 757,649
$ 5,320,271 5,412,125
(25) Other Gains and Losses
For the years ended
December 31,
2019 2018
(in thousands)
Foreign exchange gains (losses), net $ (168,499) (41,391)
Gains on valuation of financial instruments at FVTPL, net 381,620 507,532
Gains (losses) on disposals of investments and financial
assets, net (13,154) -
Gains on disposals of property, plant and equipment, net 106,546 1,923,044
Impairment losses on assets (2,298,646) (399,363)
Gains (losses) from litigation and others 396,519 (501,770)
$ (1,595,614) 1,488,052
(26) Finance Costs
For the years ended
December 31,
2019 2018
(in thousands)
Interest expense on bank borrowings $ 2,714,080 2,442,872
Interest expense on lease liabilities 209,607 -
Interest expense on others 327,683 220,733
$ 3,251,370 2,663,605

(Continued)
AU OPTRONICS CORP. AND SUBSIDIARIES
Notes to Consolidated Financial Statements
AU Optronics 2019 Annual Report
156
(27) Income Taxes
The Company cannot file a consolidated tax return under local regulations. Therefore, AUO and its
subsidiaries calculate their income taxes liabilities individually on a stand-alone basis using the
enacted tax rates in their respective tax jurisdictions.
a. Income tax expenses
The components of income tax expense for the years ended December 31, 2019 and 2018 were
as follows:
For the years ended
December 31,
2019 2018
(in thousands)
Current income tax expense:
Current year $ 745,844 2,400,949
Adjustment to prior years and others (258,671) (127,281)
487,173 2,273,668
Deferred tax expense (benefit):
Temporary differences 584,559 (632,785)
Investment tax credit and tax losses carryforwards 682,930 1,998,662
Effect of changes in statutory income tax rate - (383,289)
1,267,489 982,588
Total income tax expense $ 1,754,662 3,256,256
Income taxes expense (benefit) recognized directly in other comprehensive income for the years
ended December 31, 2019 and 2018 were as follows:
For the years ended
December 31,
2019 2018
(in thousands)
Items that will never be reclassified to profit or loss:
Remeasurement of defined benefit obligations $ 37,622 (38,908)
Items that are or may be reclassified subsequently to
profit or loss:
Foreign operations – foreign currency translation
differences $ (459,729) (191,809)

AU Optronics 2019 Annual Report
Appendix 1
(Continued)
AU OPTRONICS CORP. AND SUBSIDIARIES
Notes to Consolidated Financial Statements
157
Reconciliation of the expected income tax expense (benefit) calculated based on the ROC
statutory income tax rate compared with the actual income tax expense as reported in the
consolidated statements of comprehensive income for the years ended December 31, 2019 and
2018, was as follows:
For the years ended
December 31,
2019 2018
(in thousands)
Income tax expense at AUO’s statutory tax rate $ (3,968,951) 2,243,230
Tax on undistributed earnings, net 690 1,279,810
Effect of different subsidiaries income tax rate 38,756 (484,055)
Effect of changes in statutory income tax rate - (383,289)
Share of profit (loss) of equity-accounted subsidiaries (75,209) 774,165
Net of non-taxable income and non-deductible expense 43,202 (165,663)
Effect of change of unrecognized deductible temporary
differences, tax losses carryforwards, and investment
tax credits 5,947,778 138,969
Adjustments to prior year (258,672) (127,281)
Others 27,068 (19,630)
Income tax expense $ 1,754,662 3,256,256
Effective tax rate (8.84)% 29.03%
The above reconciliation is prepared based on each individual entity of the Company and
presented on an aggregate basis.
b. Deferred tax assets and liabilities
Deferred tax assets have not been recognized in respect of the following items.
December 31,
2019 2018
(in thousands)
Deductible temporary differences $ 3,620,044 2,638,778
Unused investment tax credits 981,360 853,837
Unused tax losses carryforwards 32,445,130 28,697,671
$ 37,046,534 32,190,286
As of December 31, 2019, the unused investment tax credits include $974,909 thousand and
$6,297 thousand from AUST and ACMK, respectively, with no expiration and $154 thousand
from a domestic subsidiary, UTI.
Tax loss carryforwards is utilized in accordance with the relevant jurisdictional tax laws and
regulations. Net losses from foreign subsidiaries are approved by tax authorities in respective
jurisdiction to offset future taxable profits. Under the ROC tax laws, approved tax losses of
AUO and its domestic subsidiaries can be carried forward for 10 years to offset future taxable
profits.

(Continued)
AU OPTRONICS CORP. AND SUBSIDIARIES
Notes to Consolidated Financial Statements
AU Optronics 2019 Annual Report
158
As of December 31, 2019, the expiration period for abovementioned unrecognized deferred tax
assets of unused tax losses carryforwards were as follows:
Year of assessment
Unrecognized
deferred tax assets
Expiration in year
(in thousands)
2011 $ 2,904,785 2020 ~ 2021
2012 11,042,933 2021 ~ 2022
2013 1,747,050 2022 ~ 2023
2014 2,347,376 2023 ~ 2024
2015 2,159,621 2020 ~ 2025
2016 4,259,267 2020 ~ 2026
2017 2,314,089 2021 ~ 2026
2018 1,279,958 2023 ~ 2028
2019 (estimated) 4,390,051 2023 ~ 2029
$ 32,445,130
As of December 31, 2019, the aggregate taxable temporary differences associated with
investments in subsidiaries not recognized as deferred tax liabilities amounted to $277,670
thousand.
The components of and changes in deferred tax assets and liabilities were as follows: Deferred tax assets Deferred tax liabilities Total
December 31,
2019
December 31,
2018
December 31,
2019
December 31,
2018
December 31,
2019
December 31,
2018
(in thousands)
Investment tax credits $ 385,728 542,115 - - 385,728 542,115
Tax losses carryforwards 2,223,440 2,760,163 - - 2,223,440 2,760,163
Unrealized loss and expenses 166,393 310,192 (5,321) (5,556) 161,072 304,636
Inventories write-down 879,267 1,027,680 - - 879,267 1,027,680
Foreign investment gains under the
equity method - - (1,043,486) (1,049,091) (1,043,486) (1,049,091)
Accumulated amortization of goodwill
in accordance with local tax laws - - (2,213,429) (2,213,429) (2,213,429) (2,213,429)
Remeasurement of defined benefit plans 157,216 194,838 - - 157,216 194,838
Foreign operations – foreign currency
translation differences 886,062 426,333 - - 886,062 426,333
Others 483,511 1,371,347 (1,864) (577,517) 481,647 793,830
$ 5,181,617 6,632,668 (3,264,100) (3,845,593) 1,917,517 2,787,075

AU Optronics 2019 Annual Report
Appendix 1
(Continued)
AU OPTRONICS CORP. AND SUBSIDIARIES
Notes to Consolidated Financial Statements
159
January 1,
2018
Recognized
in profit or
loss
Recognized
in other
comprehensive
income
Effect of
change in
consolidated
entities,
exchange rate
and others
December
31, 2018
Recognized
in profit or
loss
Recognized
in other
comprehensive
income
Effect of
change in
consolidated
entities,
exchange rate
and others
December
31, 2019
(in thousands)
Deferred tax assets
(liabilities):
Investment tax credits $ 656,480 (132,840) - 18,475 542,115 (148,453) - (7,934) 385,728
Tax losses carryforwards 3,942,012 (1,181,429) - (420) 2,760,163 (534,477) - (2,246) 2,223,440
Unrealized loss and
expenses 222,739 81,893 - 4 304,636 (143,534) - (30) 161,072
Inventories write-down 644,887 386,558 - (3,765) 1,027,680 (148,035) - (378) 879,267
Foreign investment losses
(gains) under the
equity method (890,153) (158,938) - - (1,049,091) 5,605 - - (1,043,486)
Accumulated
amortization of
goodwill in accordance
with local tax laws (1,881,415) (332,014) - - (2,213,429) - - - (2,213,429)
Remeasurement of
defined benefit plans 155,930 - 38,908 - 194,838 - (37,622) - 157,216
Foreign operations –
foreign currency
translation differences 234,524 - 191,809 - 426,333 - 459,729 - 886,062
Others 464,368 354,182 - (24,720) 793,830 (298,595) - (13,588) 481,647
$ 3,549,372 (982,588) 230,717 (10,426) 2,787,075 (1,267,489) 422,107 (24,176) 1,917,517
c. Assessments by the tax authorities
As of December 31, 2019, the tax authorities have completed the examination of income tax
returns of AUO through 2017.
(28) Earnings (Loss) per Share
For the years ended
December 31,
2019 2018
(in thousands, except for per
share data)
Basic earnings (loss) per share
Profit (loss) attributable to AUO’s shareholders $ (19,185,258) 10,160,598
Weighted-average number of common shares
outstanding during the year
9,597,268 9,624,245
Basic earnings (loss) per share (NT$) $ (2.00) 1.06
Diluted earnings (loss) per share
Profit (loss) attributable to AUO’s shareholders $ (19,185,258) 10,160,598
Weighted-average number of common shares
outstanding during the year
9,597,268 9,624,245
Effect of employee remuneration in stock - 164,609
9,597,268 9,788,854
Diluted earnings (loss) per share (NT$) $ (2.00) 1.04
Since AUO incurred net loss for the year ended December 31, 2019, there were no potential ordinary
shares with dilutive effect for the year.

(Continued)
AU OPTRONICS CORP. AND SUBSIDIARIES
Notes to Consolidated Financial Statements
AU Optronics 2019 Annual Report
160
(29) Cash Flow Information
The reconciliation of liabilities to cash flows arising from financing activities was as follows:
Long-term
borrowings
(including
current
installments)
Short-term
borrowings
Guarantee
deposits
Lease
liabilities
Total
liabilities
from
financing
activities
(in thousands)
Balance at January 1, 2019 $ 86,305,318 546,472 816,512 12,689,526 100,357,828
Cash flows 26,501,234 1,188,250 (1,828) (694,922) 26,992,734
Non-cash changes:
Increase (decrease) in lease
liabilities - - - (872,224) (872,224)
Changes in exchange rate (1,059,445) (9,120) (29,228) (31,303) (1,129,096)
Amortization on transaction
costs 221,285 - - - 221,285
Balance at December 31, 2019 $ 111,968,392 1,725,602 785,456 11,091,077 125,570,527
Long-term
borrowings
(including
current
installments)
Short-term
borrowings
Guarantee
deposits
Total
liabilities from
financing
activities
(in thousands)
Balance at January 1, 2018 $ 110,608,010 3,424,376 838,482 114,870,868
Cash flows (24,464,961) (2,817,894) (13,402) (27,296,257)
Non-cash changes:
Changes in exchange rate 27,663 (60,010) (8,568) (40,915)
Amortization on transaction costs 134,606 - - 134,606
Balance at December 31, 2018 $ 86,305,318 546,472 816,512 87,668,302
(30) Financial Instruments
a. Fair value and carrying amount
The carrying amounts of the Company’s current non-derivative financial instruments, including
financial assets at amortized cost and financial liabilities at amortized cost, were considered to
approximate their fair value due to their short-term nature. This methodology applies to cash
and cash equivalents, receivables or payables (including related parties), other current financial
assets, and short-term borrowings.
Disclosures of fair value are not required for the financial instruments abovementioned and lease
liabilities. Other than those, the carrying amount and fair value of other financial instruments of
the Company as of December 31, 2019 and 2018 were as follows:
December 31, 2019 December 31, 2018
Carrying
Amount Fair Value
Carrying
Amount Fair Value
(in thousands)
Financial assets:
Financial assets at FVTPL:
Financial assets mandatorily
measured at FVTPL $ 1,521,406 1,521,406 1,709,531 1,709,531
Financial assets at FVTOCI 7,545,171 7,545,171 6,979,925 6,979,925
Financial assets at amortized cost:
Long-term receivables 5,812 5,812 930,001 930,001
Refundable deposits 663,911 663,911 716,097 716,097
Financial liabilities:
Financial liabilities at FVTPL:
Financial liabilities held for trading 18,859 18,859 22,115 22,115
Financial liabilities at amortized cost:
Long-term borrowings (including
current installments) 111,968,392 111,968,392 86,305,318 86,305,318

AU Optronics 2019 Annual Report
Appendix 1
(Continued)
AU OPTRONICS CORP. AND SUBSIDIARIES
Notes to Consolidated Financial Statements
161
December 31, 2019 December 31, 2018
Carrying
Amount Fair Value
Carrying
Amount Fair Value
(in thousands)
Guarantee deposits 785,456 785,456 816,512 816,512
b. Valuation techniques and assumptions applied in fair value measurement
The fair values of financial assets and financial liabilities with standard terms and conditions
and traded in active markets are determined with reference to quoted market prices. The fair
values of other financial assets and financial liabilities without quoted market prices are
estimated using valuation approach. The estimates and assumptions used are the same as those
used by market participants in the pricing of financial instruments.
Fair value of foreign currency forward contract is measured based on the maturity date of each
contract with quoted spot rate and quoted swap points from Reuters quote system.
Fair value of structured investment product is measured based on the discounted future cash
flows arising from principal consideration and probable gains estimate to be received.
Fair value of long-term receivables is determined by discounting the expected cash flows at a
market interest rate.
The refundable deposits and guarantee deposits are based on carrying amount as there is no
fixed maturity.
The fair value of floating-rate long-term borrowings approximates to their carrying value.
c. Fair value measurements recognized in the consolidated balance sheets
The Company determines fair value based on assumptions that market participants would use
in pricing an asset or a liability in the principal market. When considering market participant
assumptions in fair value measurements, the following fair value hierarchy distinguishes
between observable and unobservable inputs, which are categorized in one of the following
levels:
(i) Level 1 inputs: Unadjusted quoted prices for identical assets or liabilities in active markets.
(ii) Level 2 inputs: Other than quoted prices included within Level 1, inputs are observable for
the asset or liability, either directly (i.e. as prices) or indirectly (i.e. derived from prices).
(iii) Level 3 inputs: Derived from valuation techniques that include inputs for the asset or
liability that are not based on observable market data (unobservable inputs).

(Continued)
AU OPTRONICS CORP. AND SUBSIDIARIES
Notes to Consolidated Financial Statements
AU Optronics 2019 Annual Report
162
The fair value measurement level of an asset or a liability within their fair value hierarchy is
based on the lowest level of any input that is significant to the fair value measurement. The
Company uses valuation techniques that maximize the use of observable inputs and minimize
the use of unobservable inputs.
Level 1 Level 2 Level 3 Total
(in thousands)
December 31, 2019
Financial assets at FVTPL:
Financial assets mandatorily measured at
FVTPL
$ - 1,521,406 - 1,521,406
Financial assets at FVTOCI 7,356,501 - 188,670 7,545,171
Financial assets at amortized cost:
Long-term receivables - 5,812 - 5,812
Financial liabilities at FVTPL:
Financial liabilities held for trading - 18,859 - 18,859
December 31, 2018
Financial assets at FVTPL:
Financial assets mandatorily measured at
FVTPL
$ - 1,709,531 - 1,709,531
Financial assets at FVTOCI 6,803,900 - 176,025 6,979,925
Financial assets at amortized cost:
Long-term receivables - 930,001 - 930,001
Financial liabilities at FVTPL:
Financial liabilities held for trading - 22,115 - 22,115
There were no transfers between Level 1 and 2 for the years ended December 31, 2019 and 2018.
d. Reconciliation for fair value measurements categorized within Level 3
For the years ended
December 31,
2019 2018
(in thousands)
Financial assets at FVTOCI - equity instruments
without active market
Balance at beginning of the year $ 176,025 -
Adjustments on initial application of IFRS 9 - 177,815
Net gains (losses) included in other
comprehensive income
(33,501) 9,990
Purchases 47,182 34,157
Disposals - (45,937)
Effect of exchange rate change (1,036) -
Balance at end of the year $ 188,670 176,025

AU Optronics 2019 Annual Report
Appendix 1
(Continued)
AU OPTRONICS CORP. AND SUBSIDIARIES
Notes to Consolidated Financial Statements
163
e. Description of valuation processes and quantitative disclosures for fair value measurements
categorized within Level 3
The Company’s management reviews the policy and procedures of fair value measurements at
least once at the end of the annual reporting period, or more frequently as deemed necessary.
When a fair value measurement involves one or more significant inputs that are unobservable,
the Company monitors the valuation process discreetly and examines whether the inputs are
used the most relevant market data available.
Item
Valuation
technique
Significant
unobservable inputs
Inter-relationship
between significant
unobservable inputs and
fair value measurement
Financial assets at
FVTOCI–equity
instruments without
active market
Market approach Price-Book ratio
(0.7~2.95 at Dec. 31,
2019 and 0.99~5.2 at
Dec. 31, 2018)
Price-Earnings ratio
(7.85~31.28 at Dec.
31, 2019 and
14.69~112.13 at
Dec. 31, 2018)
Discount for lack of
marketability
(20%~28% at Dec.
31, 2019 and 20% at
Dec. 31, 2018)
The higher the price-
book ratio is, the
higher the fair value is.
The higher the price-
earnings ratio is, the
higher the fair value is.
The greater degree of
lack of marketability
is, the lower the fair
value is.
(31) Financial Risk Management
a. Risk management framework
The managerial officers of related divisions are appointed to review, control, trace and monitor
the strategic risks, financial risks and operational risks faced by the Company. The managerial
officers report to executive officers the progress of risk controls from time to time and, if
necessary, report to the board of directors, depending on the extent of impact of risks.
b. Financial risk information
Hereinafter discloses information about the Company’s exposure to variable risks, and the goals,
policies and procedures of the Company’s risk measurement and risk management.
The Company is exposed to the following risks due to usage of financial instruments:
(i) Credit risk
Credit risk is the risk of financial loss to the Company if a customer or counterparty to a
financial instrument fails to meet its contractual obligations. The Company’s exposures to
credit risk are mainly from:
(a) The carrying amount of financial assets recognized in the consolidated balance sheets.
(b) The amount of contingent liabilities as a result from the Company providing financial
guarantee to its customers.
The Company’s potential credit risk is derived primarily from cash in bank, cash
equivalents and trade receivables. The Company deposits its cash and cash equivalent
investments with various reputable financial institutions of high credit quality. The
Company also entered into reverse repurchase agreements with securities firms or banks in
Taiwan covering government bonds that classified as cash equivalents. There should be no
major concerns for the performance capability of trading counterparts. Management
performs periodic evaluations of the relative credit standing of these financial institutions
and limits the amount of credit exposure with any one institution. Management believes
that there is a limited concentration of credit risk in cash and cash equivalent investments.

(Continued)
AU OPTRONICS CORP. AND SUBSIDIARIES
Notes to Consolidated Financial Statements
AU Optronics 2019 Annual Report
164
The majority of the Company’s customers are in high technology industries.
Management continuously evaluates and controls the credit quality, credit limit and
financial strength of its customers to ensure any overdue receivables are taken necessary
procedures. The Company also flexibly makes use of prepayments, accounts receivable
factoring and credit insurance as credit enhancement instruments. If necessary, the
Company will request collaterals or assurance from its customers in order to reduce the
credit risk from particular customers.
Additionally, on the reporting date, the Company reviews the recoverability of its
receivables to provide appropriate valuation allowances. Consequently, management
believes there is a limited concentration of its credit risk.
For the years ended December 31, 2019 and 2018, the Company’s five largest customers
accounted for 38.7% and 36.6%, respectively, of the Company’s consolidated net revenue.
There is no other significant concentration of credit risk.
Refer to Note 6(4) for expected credit loss analysis of accounts receivable and the
movement in the loss allowance of accounts receivable.
For credit of guarantee, the Company’s policy is to provide financial guarantees only to
subsidiaries. Refer to Note 13(1)b. for information about endorsements or guarantees
provided by the Company to its subsidiaries as of December 31, 2019.
(ii) Liquidity risk
Liquidity risk is the risk that the Company has no sufficient working capital and unused
credit facilities to meet its obligations associated with matured financial liabilities, that may
resulting from an economic downturn or uneven demand and supply in the market and
cause a significant decrease in product selling prices and market demands.
Liquidity risk of the Company is monitored through its corporate treasury department
which tracks the development of the actual cash flow position for the Company and uses
input from a number of sources in order to forecast the overall liquidity position both on a
short and long term basis. Corporate treasury invests surplus cash in money market deposits
with appropriate maturities to ensure sufficient liquidity is available to meet liabilities when
due, without incurring unacceptable losses or risking damage to the Company’s reputation.
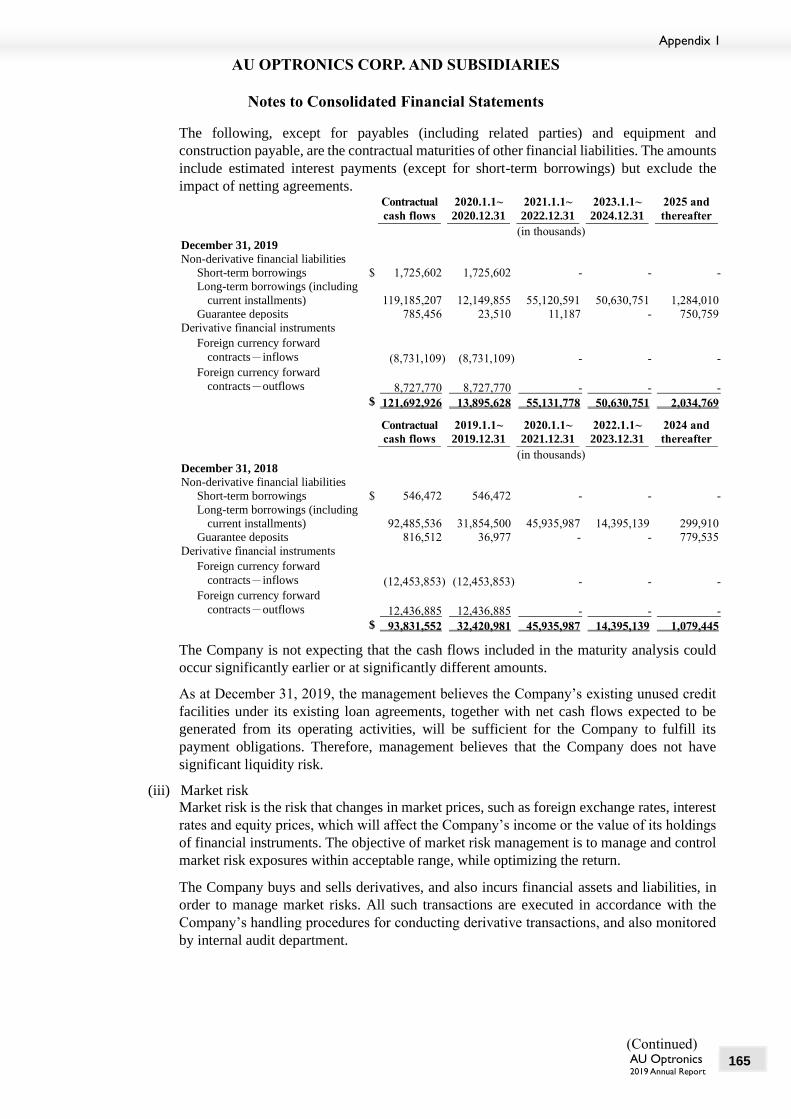
AU Optronics 2019 Annual Report
Appendix 1
(Continued)
AU OPTRONICS CORP. AND SUBSIDIARIES
Notes to Consolidated Financial Statements
165
The following, except for payables (including related parties) and equipment and
construction payable, are the contractual maturities of other financial liabilities. The amounts
include estimated interest payments (except for short-term borrowings) but exclude the
impact of netting agreements.
Contractual
cash flows
2020.1.1~
2020.12.31
2021.1.1~
2022.12.31
2023.1.1~
2024.12.31
2025 and
thereafter
(in thousands)
December 31, 2019
Non-derivative financial liabilities
Short-term borrowings $ 1,725,602 1,725,602 - - -
Long-term borrowings (including
current installments)
119,185,207 12,149,855 55,120,591 50,630,751 1,284,010
Guarantee deposits 785,456 23,510 11,187 - 750,759
Derivative financial instruments
Foreign currency forward
contracts-inflows
(8,731,109) (8,731,109) - - -
Foreign currency forward
contracts-outflows
8,727,770 8,727,770 - - -
$ 121,692,926 13,895,628 55,131,778 50,630,751 2,034,769
Contractual
cash flows
2019.1.1~
2019.12.31
2020.1.1~
2021.12.31
2022.1.1~
2023.12.31
2024 and
thereafter
(in thousands)
December 31, 2018
Non-derivative financial liabilities
Short-term borrowings $ 546,472 546,472 - - -
Long-term borrowings (including
current installments)
92,485,536 31,854,500 45,935,987 14,395,139 299,910
Guarantee deposits 816,512 36,977 - - 779,535
Derivative financial instruments
Foreign currency forward
contracts-inflows
(12,453,853) (12,453,853) - - -
Foreign currency forward
contracts-outflows
12,436,885 12,436,885 - - -
$ 93,831,552 32,420,981 45,935,987 14,395,139 1,079,445
The Company is not expecting that the cash flows included in the maturity analysis could
occur significantly earlier or at significantly different amounts.
As at December 31, 2019, the management believes the Company’s existing unused credit
facilities under its existing loan agreements, together with net cash flows expected to be
generated from its operating activities, will be sufficient for the Company to fulfill its
payment obligations. Therefore, management believes that the Company does not have
significant liquidity risk.
(iii) Market risk
Market risk is the risk that changes in market prices, such as foreign exchange rates, interest
rates and equity prices, which will affect the Company’s income or the value of its holdings
of financial instruments. The objective of market risk management is to manage and control
market risk exposures within acceptable range, while optimizing the return.
The Company buys and sells derivatives, and also incurs financial assets and liabilities, in
order to manage market risks. All such transactions are executed in accordance with the
Company’s handling procedures for conducting derivative transactions, and also monitored
by internal audit department.

(Continued)
AU OPTRONICS CORP. AND SUBSIDIARIES
Notes to Consolidated Financial Statements
AU Optronics 2019 Annual Report
166
(a) Currency risk
The Company is exposed to currency risk on foreign currency denominated financial
assets and liabilities arising from operating, financing and investing activities such
that the Company uses forward exchange contracts to hedge its currency risk. Gains
and losses derived from the foreign currency fluctuations on underlying assets and
liabilities are likely to offset. However, transactions of derivative financial instruments
help minimize the impact of foreign currency fluctuations, but the risk cannot be fully
eliminated.
The Company periodically examines portions exposed to currency risks for individual
asset and liability denominated in foreign currency and uses forward contracts as
hedging instruments to hedge positions exposed to risks. The contracts have maturity
dates that do not exceed one year, and do not meet the criteria for hedge accounting.
I. Exposure of currency risk
The Company’s significant exposure to foreign currency risk was as follows:
December 31, 2019 December 31, 2018
Foreign
currency
amounts
Exchange
rate NTD
Foreign
currency
amounts
Exchange
rate NTD
(in thousands) (in thousands) (in thousands) (in thousands)
Financial assets
Monetary items
USD $ 1,499,405 30.1350 45,184,570 2,092,501 30.8020 64,453,216
JPY 22,122,120 0.2768 6,123,403 11,872,572 0.2775 3,294,639
EUR 46,595 33.7422 1,572,218 29,681 35.2036 1,044,878
Non-monetary items
USD 1,726 30.1350 52,013 2,799 30.8020 86,215
RMB - 4.3155 - 20,258 4.4813 90,782
Financial liabilities
Monetary items
USD 1,515,582 30.1350 45,672,064 1,188,175 30.8020 36,598,166
JPY 22,187,729 0.2768 6,141,563 25,296,499 0.2775 7,019,778
EUR 239 33.7422 8,064 209 35.2036 7,358
II. Sensitivity analysis
The Company’s exposure to foreign currency risk arises mainly from the
translation of the foreign currency exchange gains and losses on cash and cash
equivalents, trade receivables, loans and borrowings and trade payables that are
denominated in foreign currency. Depreciation or appreciation of the NTD by 1%
against the USD, EUR and JPY at December 31, 2019 and 2018, while all other
variables were remained constant, would have increased or decreased the net profit
before tax for the years ended December 31, 2019 and 2018 as follows:
For the years ended
December 31,
2019 2018
(in thousands)
1% of depreciation $ 10,585 251,674
1% of appreciation (10,585) (251,674)

AU Optronics 2019 Annual Report
Appendix 1
(Continued)
AU OPTRONICS CORP. AND SUBSIDIARIES
Notes to Consolidated Financial Statements
167
III. Foreign exchange gain (loss) on monetary items
With varieties of functional currencies within the consolidated entities of the
Company, the Company disclosed foreign exchange gain (loss) on monetary items
in aggregate. The aggregate of realized and unrealized foreign exchange losses for
the years ended December 31, 2019 and 2018 were $168,499 thousand and $41,391
thousand, respectively.
(b) Interest rate risk
The Company’s exposure to changes in interest rates is mainly from floating-rate long-
term debt obligations. Any change in interest rates will cause the effective interest
rates of long-term borrowings to change and thus cause the future cash flows to
fluctuate over time. The Company will, depending on the market condition, enter
into and designate interest rate swaps as hedges of the variability in cash flows
attributable to interest rate risk.
Assuming the amount of floating-rate debts at the end of the reporting period had been
outstanding for the entire year and all other variables were remained constant, an
increase or a decrease in the interest rate by 0.25% would have resulted in a decrease
or an increase in the net profit before tax for the years ended December 31, 2019 and
2018 by $280,558 thousand and $216,955 thousand, respectively.
(c) Equity price risk
See Note 6(3) for disclosure of equity price risk analysis.
(32) Capital Management
Through clear understanding and managing of significant changes in external environment, related
industry characteristics, and corporate growth plan, the Company manages its capital structure to
ensure it has sufficient financial resources to sustain proper liquidity, to invest in capital expenditures
and research and development expenses, to repay debts and to distribute dividends in accordance to
its plan. The management pursues the most suitable capital structure by monitoring and maintaining
proper financial ratios as below. The Company aims to enhance the returns of its shareholders through
achieving an optimized debt-to-equity ratio from time to time.
December 31,
2019 2018
(in thousands)
Short-term borrowings $ 1,725,602 546,472
Long-term borrowings (including current installments) 111,968,392 86,305,318
Total liabilities 209,660,842 192,553,087
Total equity 187,976,749 217,278,688
Debt-to-equity ratio 112% 89%
Net debt-to-equity ratio(i) 18% 8%
(i) Net debt-to-equity ratio is defined as short-term borrowings plus long-term borrowings less cash and cash
equivalents and divided by total equity.

(Continued)
AU OPTRONICS CORP. AND SUBSIDIARIES
Notes to Consolidated Financial Statements
AU Optronics 2019 Annual Report
168
7. Related-party Transactions
All inter-company transactions and balances between AUO and its subsidiaries are eliminated in the
consolidated financial statements and are not disclosed in this note. The transactions between the
Company and other related parties are set out as follows:
(1) Name and relationship of related parties
The following is a summary of related parties that have had transactions with the Company during
the periods presented in the consolidated financial statements. Name of related party Relationship with the Company
Lextar Electronics Corporation (“Lextar”) Associate
Lextar Electronics (Suzhou) Co., Ltd. (“LESZ”) Subsidiary of Lextar
Lextar Electronics (Xiamen) Co., Ltd. (“LEXM”) Subsidiary of Lextar
Lextar Electronics (Chuzhou) Corp. (“LEXCZ”) Subsidiary of Lextar
Wellybond Corporation (“WBC”) Subsidiary of Lextar
TRENDYLITE CORPORATION (“TRENDYLITE”) Subsidiary of Lextar
Raydium Semiconductor Corporation (“Raydium”) Associate
Raydium Semiconductor (Kunshan) Co., Ltd. (“RKS”) Subsidiary of Raydium
Dazzo Technology Corporation (“Dazzo”) Subsidiary of Raydium(i)
Star River Energy Corp. (“SREC”) Associate
Sungen Power Corporation (“SGPC”) Subsidiary of SREC
Evergen Power Corporation (“EGPC”) Subsidiary of SREC
Star Shining Energy Corporation (“SSEC”) Associate
Fargen Power Corporation (“FGPC”) Subsidiary of SSEC
Sheng Li Energy Corporation (“SLEC”) Subsidiary of SSEC
ChampionGen Power Corporation (“CGPC”) Subsidiary of SSEC(ii)
TronGen Power Corporation (“TGPC”) Subsidiary of SSEC
Ri Ji Power Corporation (“RJPC”) Subsidiary of SSEC
Ri Jing Power Corporation (“RGPC”) Subsidiary of SSEC
Mao Zheng Energy Corporation (“MZEC”) Subsidiary of SSEC
Mao Xin Energy Corporation (”MXEC”) Subsidiary of SSEC
Sheng Feng Power Corporation (”SFPC) Subsidiary of SSEC
WishMobile, Inc. (“WMI”) Associate
Daxin Materials Corp. (“Daxin”) Associate
Darwin Summit Co., Ltd. (“DSC”) Associate
Ubitech Inc. (“Ubitech”) Associate
BVCH Optronics (Sichuan) Corp. (“BVCH”) Joint venture(iii)
Evonik Forhouse Optical Polymers Corp. (“EFOP”) Joint venture
Wibase Industrial Solutions Inc. (“WIS”) DPTW represented as a director of WIS
Qisda Corporation (“Qisda”) Corporate shareholder of AUO of which
accounts for AUO using the equity method
Qisda Vietnam Co., Ltd. (“QVH”) Subsidiary of Qisda
BenQ Corporation (“BenQ”) Subsidiary of Qisda
BenQ Materials Corp. (“BMC”) Subsidiary of Qisda
Qisda (Suzhou) Co., Ltd. (“QCSZ”) Subsidiary of Qisda
Qisda Electronics (Suzhou) Co., Ltd. (“QCES”) Subsidiary of Qisda
Qisda Optronics (Suzhou) Co., Ltd. (“QCOS”) Subsidiary of Qisda
Qisda Japan Co., Ltd. (“QJTO”) Subsidiary of Qisda
BenQ Europe B.V. (“BQE”) Subsidiary of Qisda
BenQ Asia Pacific Corp. (“BQP”) Subsidiary of Qisda
BenQ America Corporation (“BQA”) Subsidiary of Qisda
Mainteq Europe B.V. (“MQE”) Subsidiary of Qisda
BenQ Co., Ltd. (“BQC”) Subsidiary of Qisda
BenQ Technology (Shanghai) Co., Ltd. (“BQls”) Subsidiary of Qisda
Guru Systems (Suzhou) Co., Ltd. (“GSS”) Subsidiary of Qisda
BenQ GURU Corp. (“GST”) Subsidiary of Qisda

AU Optronics 2019 Annual Report
Appendix 1
(Continued)
AU OPTRONICS CORP. AND SUBSIDIARIES
Notes to Consolidated Financial Statements
169
Name of related party Relationship with the Company
BenQ Material (Suzhou) Co., Ltd. (“BMS”) Subsidiary of Qisda
Suzhou BenQ Hospital Co., Ltd. (“QCHS”) Subsidiary of Qisda
DFI Inc. (“DFI”) Subsidiary of Qisda
Data Image Corporation (“DIC”) Subsidiary of Qisda
Data Image (Suzhou) Corporation (“DICSZ”) Subsidiary of Qisda
Sysage Technology Co., Ltd. (“Sysage”) Subsidiary of Qisda
BenQ Foundation Substantive related party
AUO Foundation Substantive related party
(i) Dazzo was merged with and into Raydium, an associate of the Company, on April 1, 2019
(ii) The Company disposed all its shareholdings in CGPC to SSEC, an associate of the Company, in
September 2018. Refer to Note 6(8) for the relevant disclosures.
(iii) BVCH had been liquidated in December 2019.
(2) Compensation to key management personnel
Key management personnel’s compensation comprised:
For the years ended
December 31,
2019 2018
(in thousands)
Short-term employee benefits $ 243,203 345,019
Post-employment benefits 2,633 2,547
$ 245,836 347,566
(3) Except for otherwise disclosed in other notes to the consolidated financial statements, the Company’s
significant related party transactions and balances were as follows:
a. Sales
Sales
Accounts receivable
from related parties
For the years ended
December 31, December 31,
2019 2018 2019 2018
(in thousands)
Associates $ 1,227,987 1,898,336 280,009 696,423
Others 10,347,963 12,050,450 1,498,490 2,057,830
$ 11,575,950 13,948,786 1,778,499 2,754,253
The collection terms for sales to related parties were 25 to 55 days from the end of the month
during which the invoice is issued. The pricing for sales to related parties were not materially
different from those with third parties.

(Continued)
AU OPTRONICS CORP. AND SUBSIDIARIES
Notes to Consolidated Financial Statements
AU Optronics 2019 Annual Report
170
b. Purchases
Purchases
Accounts payable to related
parties
For the years ended
December 31, December 31,
2019 2018 2019 2018
(in thousands)
Associates $ 8,664,439 9,185,563 2,825,292 3,664,742
Joint ventures 1,027,147 1,449,636 72,942 -
Others 17,077,497 18,589,791 4,052,594 4,496,444
$ 26,769,083 29,224,990 6,950,828 8,161,186
The payment terms for purchases from related parties were 30 to 120 days. The pricing and
payment terms with related parties were not materially different from those with third parties.
c. Acquisition of property, plant and equipment
Acquisition prices
For the years ended
December 31,
2019 2018
(in thousands)
Associates $ 6,555 6,527
Others 17,436 4,449
$ 23,991 10,976
d. Disposal of property, plant and equipment
Proceeds from disposal Gain on disposal
For the years ended
December 31,
For the years ended
December 31,
2019 2018 2019 2018
(in thousands) (in thousands)
Others $ 835 - 72 -

AU Optronics 2019 Annual Report
Appendix 1
(Continued)
AU OPTRONICS CORP. AND SUBSIDIARIES
Notes to Consolidated Financial Statements
171
e. Other related party transactions
Transaction type
Type of related party
December 31,
2019 2018
(in thousands)
Other receivables due
from related parties
Associates $ 2,727 8,161
Others 1,229 4,784
$ 3,956 12,945
Other payables due to
related parties
(including payables
for equipment)
Associates $ 13,980 18,148
Others 35,991 10,027
$ 49,971 28,175
Transaction type
Type of related party
For the years ended
December 31,
2019 2018
(in thousands)
Rental income Associates $ 52,227 55,044
Joint ventures 6,611 6,611
Others:
BMC 83,477 66,748
Others 24,110 24,474
$ 166,425 152,877
Administration and Associates $ 17,980 18,580
other income Joint ventures 223 1,060
Others 7,996 8,789
$ 26,199 28,429
Other expenses Associates $ 20,157 37,155
Joint ventures 36 567
Others 59,287 29,336
$ 79,480 67,058
The Company leased portion of its facilities to related parties. The collection term was 15 days
from quarter-end, and the pricing was not materially different from that with third parties.
For the years ended December 31, 2019 and 2018, the Company had received cash dividends
from related parties of $566,865 thousand and $668,228 thousand, respectively.

(Continued)
AU OPTRONICS CORP. AND SUBSIDIARIES
Notes to Consolidated Financial Statements
AU Optronics 2019 Annual Report
172
8. Pledged Assets
The carrying amounts of the assets which the Company pledged as collateral were as follows:
December 31,
Pledged assets Pledged to secure 2019 2018
(in thousands)
Restricted cash in banks(i) Customs duties and guarantee
for warranties
$ 35,809 91,753
Land and building Long-term borrowings 28,423,642 27,696,480
Machinery and equipment Long-term borrowings 42,968,184 37,317,602
$ 71,427,635 65,105,835
(i) Classified as other current financial assets and other noncurrent assets by its liquidity. 9. Significant Contingent Liabilities and Unrecognized Commitments
The significant commitments and contingencies of the Company as of December 31, 2019, in addition to
those disclosed in other notes to the consolidated financial statements, were as follows:
(1) Outstanding letters of credit
As at December 31, 2019, the Company had the following outstanding letters of credit for the
purpose of purchasing machinery and equipment and materials:
Currency
December 31,
2019
(in thousands)
USD 5,768
JPY 1,951,409
(2) Technology licensing agreements
Starting in 1998, AUO has entered into technical collaboration, patent licensing, and/or patent cross
licensing agreements with Fujitsu Display Technologies Corp. (subsequently assumed by Fujitsu
Limited), Toppan Printing Co., Ltd. (“Toppan Printing”), Semiconductor Energy Laboratory Co.,
Ltd., Japan Display Inc. (formerly Japan Display East Inc./Hitachi Displays, Ltd.), Panasonic Liquid
Crystal Display Co., Ltd. (formerly IPS Alpha Technology, Ltd.), LG Display Co., Ltd., Sharp
Corporation, Samsung Electronics Co., Ltd., Hydis Technologies Co., Ltd., Seiko Epson
Corporation and others. AUO believes that it is in compliance with the terms and conditions of the
aforementioned agreements.
(3) Purchase commitments
Starting from 2006, DPTW has entered into a long-term materials supply agreement with Evonik
Forhouse Optical Polymers Corp. (“EFOP”), a joint venture of the Company. Under the agreement,
DPTW and EFOP agreed on the supply of certain optical-grade molding compounds at agreed prices
and quantities.
As at December 31, 2019, significant outstanding purchase commitments for construction in
progress, property, plant and equipment totaled $7,639,758 thousand.
(4) Litigation
a. Antitrust civil actions lawsuits in the United States and other jurisdictions
A lawsuit was filed by certain consumers in Israel against certain LCD manufacturers including
AUO in the District Court of the Central District in Israel (“Israeli Court”). The defendants
contested various issues including whether the lawsuit was properly served. In December 2016,
the Israeli Court overturned the original decision and revoked the permission for this case to
serve out of Israeli jurisdiction. The plaintiffs lodged an appeal to the Israeli Supreme Court but
the Israeli Supreme Court overruled the appeal in August 2017. In January

AU Optronics 2019 Annual Report
Appendix 1
(Continued)
AU OPTRONICS CORP. AND SUBSIDIARIES
Notes to Consolidated Financial Statements
173
2018, the parties reached a settlement agreement and agreed to commence the required
proceedings for withdrawing the lawsuit. In April 2019, the Central District Court of Israel in
Lod approved the settlement. In May 2014, LG Electronics Nanjing Display Co., Ltd. and seven
of its affiliates filed a lawsuit in Seoul Central District Court against certain LCD manufacturers
including AUO, alleging overcharge and claiming damages. AUO does not believe service has
been properly made, but in order to protect its rights, AUO has retained counsel to handle the
related matter, and at this stage, the final outcome of these matters is uncertain. AUO has been
reviewing the merits of this lawsuit on an on-going basis.
In September 2018, AUUS received a complaint filed by the Government of Puerto Rico on its
own behalf and on behalf of all consumers and governmental agencies of Puerto Rico against
certain LCD manufacturers including AUO and AUUS in the Superior Court of San Juan, Court
of First Instance alleging unjust enrichment and claiming unspecified monetary damages. AUO
has retained counsel to handle the related matter and intends to defend this lawsuit vigorously,
and at this stage, the final outcome of these matters is uncertain. AUO is reviewing the merits
of this lawsuit on an on-going basis.
b. Alleged patent infringements
In July 2018, Vista Peak Ventures, LLC (“VPV”) filed three lawsuits in the United States District
Court for the Eastern District of Texas against AUO, claiming infringement of certain of VPV’s
patents in the United States relating to the manufacturing of TFT-LCD panels. In the complaints,
VPV seeks, among other things, unspecified monetary damages for past damages and an
injunction against future infringement. On September 27, 2019, the relevant parties reached a
settlement agreement, and all pending lawsuits that have been filed by VPV against AUO were
dismissed on October 10, 2019.
As of February 5, 2020, the Company has made certain provisions with respect to certain of the
above lawsuits as the management deems appropriate, considering factors such as the nature of
the litigation or claims, the materiality of the amount of possible loss, the progress of the cases
and the opinions or views of legal counsel and other advisors. Management will reassess all
litigation and claims at each reporting date based on the facts and circumstances that exist at
that time, and will make additional provisions or adjustments to previous provisions. The
ultimate amount cannot be ascertained until the relevant cases are closed. The ultimate
resolution of the legal proceedings and/or lawsuits cannot be predicted with certainty. While
management intends to defend certain of the lawsuits described above vigorously, there is a
possibility that one or more legal proceedings or lawsuits may result in an unfavorable outcome
to the Company. In addition to the matters described above, the Company is also a party to other
litigations or proceedings that arise during the ordinary course of business. Except as mentioned
above, the Company, to its knowledge, is not involved as a defendant in any material litigation
or proceeding which could be expected to have a material adverse effect on the Company’s
business or results of operations.
10. Significant Disaster Losses: None.
11. Subsequent Event:
On February 5, 2020, AUO’s Board of Directors resolved to acquire common shares of ADLINK
Technology Inc. through tender offer. The tender offer consideration for each common share is NT$57 in
cash. The planned acquisition amount is 65,249 thousand shares of ADLINK. The tender offer period will
run from February 7, 2020 to March 12, 2020.

(Continued)
AU OPTRONICS CORP. AND SUBSIDIARIES
Notes to Consolidated Financial Statements
AU Optronics 2019 Annual Report
174
12. Others
Since 2010, there have been environmental proceedings relating to the development project of the Central
Taiwan Science Park in Houli, Taichung, which AUO’s second 8.5-generation fab is located at. The
proceedings were initiated by six residents in Houli District, Taichung City (the “Plaintiffs”) to object the
administrative dispositions of the environmental assessment and development approval issued in 2010 by
the Environmental Protection Administration (“EPA”) of the Executive Yuan of Taiwan to the third
phrase development area in the Central Taiwan Science Park (the “Project”). On August 8, 2014, the
Plaintiffs reached a settlement with the defendants (i.e. the governmental authorities, including the EPA
of the Executive Yuan of Taiwan, the Ministry of Science and Technology (former National Science
Council of the ROC Executive Yuan) and the Central Taiwan Science Park Development Office) in the
Taipei High Administrative Court. The second phase environmental impact assessment for the Project
continues to proceed. On December 14, 2017, the EPA of the Executive Yuan of Taiwan held the third
review meeting of the investigation group. The review meeting reached the conclusion of suggesting
approval for the Project. On November 6, 2018, the EPA approved the Project, but on December 6, 2018,
five residents in Houli District, Taichung City filed administrative appeal to the Appeals Review
Committee of the Executive Yuan requesting a withdrawal of the approval. Currently management does
not believe that this event will have a material adverse effect on the Company’s operation and will
continue to monitor the development of this event. 13. Additional Disclosures
(1) Information on significant transactions:
Following are the additional disclosures required by the Regulations for the Company for the year
ended December 31, 2019.
a. Financings provided: Please see Table 1 attached.
b. Endorsements/guarantees provided: Please see Table 2 attached.
c. Marketable securities held (excluding investment in subsidiaries, associates and joint ventures):
Please see Table 3 attached.
d. Individual marketable securities acquired or disposed of with costs or prices exceeding NT$300
million or 20% of the paid-in capital: Please see Table 4 attached.
e. Acquisition of individual real estate with costs exceeding NT$300 million or 20% of the paid-in
capital: None.
f. Disposal of individual real estate with prices exceeding NT$300 million or 20% of the paid-in
capital: None.
g. Purchases from or sales to related parties with amounts exceeding NT$100 million or 20% of the
paid-in capital: Please see Table 5 attached.
h. Receivables from related parties with amounts exceeding NT$100 million or 20% of the paid-in
capital: Please see Table 6 attached.
i. Information about trading in derivative instruments: Please see Note 6(2).
j. Business relationship between the parent and the subsidiaries and significant intercompany
transactions: Please see Table 7 attached.
(2) Information on investees (excluding information on investment in Mainland China): Please see Table
8 attached.
(3) Information on investment in Mainland China:
a. The related information on investment in Mainland China: Please see Table 9.1 and 9.2 attached.
b. Upper limit on investment in Mainland China: Please see Table 9.1 and 9.2 attached.
c. Significant transactions:
Significant direct or indirect transactions with the investees in Mainland China for the year ended
December 31, 2019, for which intercompany transactions were eliminated upon consolidation,
are disclosed in “Information on significant transactions”.

AU Optronics 2019 Annual Report
Appendix 1
(Continued)
AU OPTRONICS CORP. AND SUBSIDIARIES
Notes to Consolidated Financial Statements
175
14. Segment Information
(1) Operating segment information
The Company has two operating segments: display and energy. The display segment generally is
engaged in the research, development, design, manufacturing and sale of flat panel displays and most
of our products are TFT-LCD panels. The energy segment primarily is engaged in the design,
manufacturing and sale of ingots, solar wafers and solar modules, as well as providing technical
engineering services and maintenance services for solar system projects.
Segment results are excluding non-operating income and expenses and income tax expense (benefit).
There are no differences between the consolidated financial statements for the years ended December
31, 2019 and 2018 with the financial results received by the Company’s chief operating decision
maker. The accounting policies for the operating segments are the same as those used in preparation
of the consolidated financial statements of the Company. The Company uses the net revenue, profit
(loss) from operations and segment profit (loss) excluding depreciation and amortization as the basis
of segment performance assessment. For the year ended December 31, 2019
Display
segment
Energy
segment
Total
segments
(in thousands)
Net revenue from external customers $ 256,667,222 12,124,472 268,791,694
Segment profit (loss) $ (19,484,401) (983,547) (20,467,948)
Net non-operating income and expenses 623,194
Consolidated profit (loss) before income tax $ (19,844,754)
Segment profit (loss) excluding depreciation and
amortization $ 15,753,181 36,590 15,789,771
Segment assets $ 397,637,591
For the year ended December 31, 2018
Display
segment
Energy
segment
Total
segments
(in thousands)
Net revenue from external customers $ 290,784,754 16,849,635 307,634,389
Segment profit (loss) $ 7,792,505 (1,124,640) 6,667,865
Net non-operating income and expenses 4,548,286
Consolidated profit (loss) before income tax $ 11,216,151
Segment profit (loss) excluding depreciation and
amortization $ 40,773,745 121,650 40,895,395
Segment assets $ 409,831,775
(2) Geographic information
a. Net revenue from external customers: See Note 6(21).
b. Consolidated noncurrent assets(i)
December 31,
2019 2018
(in thousands)
Region
Taiwan $ 174,518,271 172,639,349
PRC (including Hong Kong) 54,890,846 61,284,667
Others 6,301,996 6,941,674
$ 235,711,113 240,865,690
(i) Noncurrent assets are not inclusive of financial instruments, deferred tax assets and prepaid pension.
(3) Major customer and product information: See Note 6(21).

AU
Optro
nics
2019 A
nnual R
epo
rt
(Continued)
17
6
AU OPTRONICS CORP. AND SUBSIDIARIES
Financings Provided
For the year ended December 31, 2019
(Amount in thousands of New Taiwan Dollars)
Table 1
No. Financing
Company
Borrowing
Company
Financial
Statement
Account
Related
Party
Maximum
Balance for
the Period
(Note 3)
Ending Balance
(Notes 1 and 2)
Amount
Actually
Drawn Down
(Notes 1 and 4)
Interest Rate Nature of
Financing
Transaction
Amounts
Reason for
Financing
Allowance
for Bad
Debt
Collateral Financing
Limits for Each
Borrowing
Company
(Notes 1 and 5)
Limits on
Financing
Company’s Total
Financing
Amount
(Notes 1 and 5)
Item Value
0 AUO ACTW Other
receivables from related
parties
Yes 3,500,000 1,725,000 1,200,000 Markup rate on
short-term financing cost
Needs for
short-term financing
- Operating
capital
- - - 17,667,184 70,668,736
0 AUO AUKS Other receivables
from related
parties
Yes 1,524,810 1,294,650 - Markup rate on short-term
financing cost
Needs for short-term
financing
- Operating capital
- - - 17,667,184 70,668,736
1 AULB AUSK Other
receivables
from related parties
Yes - - - Markup rate on
short-term
financing cost
Needs for
short-term
financing
- Operating
capital
- - - 53,221,601 53,221,601
1 AULB AUKS Other
receivables from related
parties
Yes 10,633,245 10,572,975 2,805,075 Markup rate on
short-term financing cost
Needs for
short-term financing
- Operating
capital
- - - 21,288,641 21,288,641
2 AUXM BVHF Other receivables
from related
parties
Yes - - - Markup rate on short-term
financing cost
Needs for short-term
financing
- Operating capital
- - - 5,359,511 5,359,511
2 AUXM AUKS Other
receivables
from related parties
Yes 5,272,980 4,962,825 3,452,400 Markup rate on
short-term
financing cost
Needs for
short-term
financing
- Operating
capital
- - - 5,359,511 5,359,511
3 BVXM AUKS Other receivables
from related
parties
Yes 434,010 431,550 - Markup rate on short-term
financing cost
Needs for short-term
financing
- Operating capital
- - - 509,196 509,196
4 AUSJ UFSZ Other
receivables
from related parties
Yes 92,090 86,310 - Markup rate on
short-term
financing cost
Needs for
short-term
financing
- Operating
capital
- - - 3,783,730 3,783,730

AU
Optro
nics
2019 A
nnual R
epo
rt 177
(Continued)
Appendix
1
No. Financing
Company
Borrowing
Company
Financial
Statement
Account
Related
Party
Maximum
Balance for
the Period
(Note 3)
Ending Balance
(Notes 1 and 2)
Amount
Actually
Drawn Down
(Notes 1 and 4)
Interest Rate Nature of
Financing
Transaction
Amounts
Reason for
Financing
Allowance
for Bad
Debt
Collateral Financing
Limits for Each
Borrowing
Company
(Notes 1 and 5)
Limits on
Financing
Company’s Total
Financing
Amount
(Notes 1 and 5)
Item Value
4 AUSJ AUKS Other
receivables
from related parties
Yes 1,467,264 1,380,960 949,410 Markup rate on
short-term
financing cost
Needs for
short-term
financing
- Operating
capital
- - - 1,513,492 1,513,492
4 AUSJ A-Care Other
receivables from related
parties
Yes 46,045 43,155 - Markup rate on
short-term financing cost
Needs for
short-term financing
- Operating
capital
- - - 3,783,730 3,783,730
5 AUSZ AUKS Other receivables
from related
parties
Yes 5,272,980 4,962,825 4,099,725 Markup rate on short-term
financing cost
Needs for short-term
financing
- Operating capital
- - - 5,886,493 5,886,493
6 DPSZ AUKS Other
receivables
from related parties
Yes 460,450 431,550 - Adjusted by
base lending
rate of People’s Bank of China
Needs for
short-term
financing
- Operating
capital
- - - 711,740 711,740
7 FTKS AUKS Other
receivables from related
parties
Yes 450,170 431,550 431,550 Adjusted by
base lending rate of People’s
Bank of China
Needs for
short-term financing
- Operating
capital
- - - 540,321 540,321
8 FTWJ FHWJ Other receivables
from related
parties
Yes 92,090 64,733 64,733 Adjusted by base lending
rate of People’s
Bank of China
Needs for short-term
financing
- Operating capital
- - - 2,071,120 2,071,120
Note 1: Amounts denominated in foreign currencies are translated into New Taiwan Dollars using the exchange rates at the reporting date.
Note 2: The ending balance represents the amounts approved by the Board of Directors.
Note 3: The maximum balance for the period represents the highest amount in New Taiwan Dollar announced or occurred during the period.
Note 4: All inter-company transactions among AUO and its subsidiaries have been eliminated in the consolidated financial statements.
Note 5: The policy for the limit on total financing amount and the financing limit for any individual entity are prescribed as follows:
a. AUO: The total amount available for lending purposes shall not exceed 40% of AUO’s net worth as stated in its latest audited financial statement. The total amount for
lending to a company shall not exceed 10% of AUO’s net worth as stated in its latest audited financial statement.
b. AULB, AUSZ, AUXM, AUSJ and BVXM: The total amount available for lending purposes shall not exceed 40% of the net worth of the lending company as stated in its
latest audited financial statement. The total amount for lending to a company shall not exceed 40% of the net worth of the lending company as stated in its latest audited
financial statement.
c. In the event that the financing is between foreign subsidiaries whose voting shares are 100% owned, directly or indirectly, by AUO, the aggregate amount available for
lending to such borrowers and total amount lendable to a company shall not exceed the net worth of the lending company as stated in its latest audited financial statement.
d. DPSZ, FTWJ and FTKS: The total amount available for lending purposes shall not exceed 40% of the net worth of the lending company. The total amount for lending to
a company shall not exceed 40% of the net worth of the lending company.
e. In the event that the financing is between foreign subsidiaries whose voting shares are 100% owned, directly and indirectly, by DPTW, the aggregate amount available for
lending to such borrowers and the total amount lendable to each of such borrowers shall not exceed the net worth of the lending company.

AU
Optro
nics
2019 A
nnual R
epo
rt
(Continued)
17
8
AU OPTRONICS CORP. AND SUBSIDIARIES
Endorsements/Guarantees Provided
For the year ended December 31, 2019 (Amount in thousands of New Taiwan Dollars)
Table 2
No. Endorser/
Guarantor
Guaranteed Party
Limits on
Endorsement/
Guarantee Amount
Provided for Each
Party (Notes 4 and 5)
Maximum
Endorsement/
Guarantee
Balance for the
Period (Note 2)
Ending Balance
(Notes 3 and 4)
Amount
Actually
Drawn Down
(Note 4)
Amount of
Endorsement/
Guarantee
Collateralized
by Properties
Ratio of
Accumulated
Endorsement/
Guarantee to Net
Worth per Latest
Financial
Statements
Maximum
Endorsement/
Guarantee
Amount
Allowable
(Notes 4 and 5)
Endorsement/
Guarantee
Provided by
Parent
Company to
Subsidiary
Endorsement/
Guarantee
Provided by
Subsidiary to
Parent
Company
Endorsement/
Guarantee
Provided to
Subsidiaries
in Mainland
China
Name
Nature of
Relationship
(Note 1)
0 AUO AUKS 2 88,335,920 16,140,185 15,317,737 11,507,216 - 8.67% 176,671,840 Yes No Yes
1 AUXM AUO
&AUST
3,4 13,398,777 2,302,250 - - - - 13,398,777 No Yes No
1 AUXM AUO 3 13,398,777 9,577,360 6,257,475 - - 46.70% 13,398,777 No Yes No
2 AUSJ AUO 3 3,783,730 1,473,440 - - - - 3,783,730 No Yes No
3 AUSZ AUO 3 14,716,233 7,275,110 4,401,810 - - 29.91% 14,716,233 No Yes No 3 AUSZ AUO
&AUSK
3,4 14,716,233 1,519,485 - - - - 14,716,233 No Yes No
Note 1: The relationship between the endorser/guarantor and the guaranteed party:
1. A company with which it does business.
2. A company in which the Company directly and indirectly holds more than 50% of the voting shares.
3. A company that directly and indirectly holds more than 50% of the voting shares in the Company.
4. Companies in which the Company holds, directly or indirectly, 90% or more of the voting shares.
5. A company that fulfills its contractual obligations by providing mutual endorsements/guarantees for another company in the same industry or for joint builders for
purposes of undertaking a construction project.
6. A company that all capital contributing shareholders make endorsements/guarantees for their jointly invested company in proportion to their shareholding percentages.
7. Companies in the same industry provide among themselves joint and several security for a performance guarantee of a sales contract for pre-construction homes
pursuant to the Consumer Protection Act for each other.
Note 2: The maximum endorsement/guarantee balance for the period represents the highest amount in New Taiwan Dollar announced or occurred during the period.
Note 3: The ending balance represents the amounts approved by the Board of Directors.
Note 4: Amounts denominated in foreign currencies are translated into New Taiwan Dollars using the exchange rates at the reporting date.
Note 5: The policy for the limit of total endorsement/guarantee amount and the limit on endorsement/guarantee amount provided to each party are prescribed as follows:
a. AUO: The total endorsement/guarantee amount provided shall not exceed the net worth of AUO as stated in its latest audited financial statement. The aggregate
amount of endorsement/guarantee provided to each guaranteed party shall not exceed 50% of AUO’s net worth as stated in its latest audited financial statement.
b. AUSZ, AUXM and AUSJ: The total endorsement/guarantee amount provided and the aggregate amount of endorsement/guarantee provided to each guaranteed party
both shall not exceed the net worth of the endorser/guarantor as stated in its latest audited financial statement.

AU
Optro
nics
2019 A
nnual R
epo
rt 179
(Continued)
Appendix
1
AU OPTRONICS CORP. AND SUBSIDIARIES
Marketable Securities Held (Excluding Investment in Subsidiaries, Associates and Joint Ventures)
December 31, 2019 (Amount in thousands of New Taiwan Dollars and foreign currencies indicated, and shares in thousands)
Table 3
Name of
Holder
Type and Name
of Marketable
Securities
Relationship
with the
Securities Issuer
Financial Statement Account
December 31, 2019 Maximum
Shareholding
in the Interim
Note Shares
Carrying
Amount
Percentage of
Ownership Fair Value
AUO Stock
BenQ ESCO Corp.
Related party Financial assets at FVTPL— noncurrent 1,700 - 17.00% - 17.00%
AUO Stock
Qisda
Related party Financial assets at FVTOCI— noncurrent 335,231 7,140,410 17.04% 7,140,410 17.04%
AULB Stock
Abakus Solar AG
- Financial assets at FVTPL— noncurrent 3 - 2.22% - 2.22%
AUSH Stock
T-powertek
Optronics Co.,
Ltd.
- Financial assets at FVTOCI— noncurrent 352 CNY 6,250 2.16% CNY 6,250 2.16%
DPSZ Structured deposit - Financial assets at FVTPL-current - CNY 70,488 - CNY 70,488 -
FPWJ Structured deposit - Financial assets at FVTPL-current - CNY 100,642 - CNY 100,642 -
FTKS Structured deposit - Financial assets at FVTPL-current - CNY 171,493 - CNY 171,493 -
Konly Stock
PlayNitride Inc.
- Financial assets at FVTOCI— noncurrent 609 42,123 1.80% 42,123 2.80%
Konly Stock
SnapBizz
CloudTech Pte.
Ltd.
- Financial assets at FVTOCI— noncurrent 13 - 5.33% - 6.13%
Konly Stock
a2peak power Co.,
Ltd.
- Financial assets at FVTPL-noncurrent 4,000 - 10.87% - 10.87%
Konly Stock
ChenFeng
Optronics
Corporation
- Financial assets at FVTPL-noncurrent 1,500 - 2.63% - 3.26%
Konly Stock
UniBright
Chemical Co., Ltd.
- Financial assets at FVTPL-noncurrent 4,200 - 8.52% - 8.52%

AU
Optro
nics
2019 A
nnual R
epo
rt
(Continued)
18
0
Name of
Holder
Type and Name
of Marketable
Securities
Relationship
with the
Securities Issuer
Financial Statement Account
December 31, 2019 Maximum
Shareholding
in the Interim
Note Shares
Carrying
Amount
Percentage of
Ownership Fair Value
Konly Stock
Azotek Co., Ltd.
- Financial assets at FVTOCI— noncurrent 2,407 7,345 4.01% 7,345 4.01%
Konly Stock
Qisda
Related party Financial assets at FVTOCI— noncurrent 10,145 216,091 0.52% 216,091 0.52%
Konly Stock
ATS International
Inc.
- Financial assets at FVTOCI— noncurrent 1,667 - 5.15% - 5.15%
DPTW Stock
Wibase Industrial
Solutions Inc.
Related party Financial assets at FVTOCI— noncurrent 4,700 56,400 12.11% 56,400 12.11%
DPTW Stock
Evertrust
Technology Ltd.
- Financial assets at FVTOCI— noncurrent 150 1,500 16.13% 1,500 16.13%
DPTW Stock
D8AI Holdings
Corporation
- Financial assets at FVTOCI— noncurrent 7,000 8,649 4.59% 8,649 4.59%
DPTW Stock
HUAI I Precision
Technology Co.,
Ltd.
- Financial assets at FVTOCI— noncurrent 2,914 34,968 10.00% 34,968 10.00%
DPTW Stock
Disign
Incorporated
- Financial assets at FVTOCI— noncurrent 2 10,714 19.89% 10,714 19.89%
Ronly Stock
UniBright
Chemical Co., Ltd.
- Financial assets at FVTPL-noncurrent 600 - 1.22% - 1.22%
Ronly Stock
Exploit
Technology Co.,
Ltd.
- Financial assets at FVTPL-noncurrent 41 - 0.49% - 0.49%

AU
Optro
nics
2019 A
nnual R
epo
rt 181
(Continued)
Appendix
1
AU OPTRONICS CORP. AND SUBSIDIARIES
Individual Marketable Securities Acquired or Disposed of with Costs or Prices Exceeding
NT$300 Million or 20% of the Paid-in Capital
For the year ended December 31, 2019 (Amount in thousands of New Taiwan Dollars and foreign currencies indicated, and shares in thousands)
Table 4
Company
Name
Type and
Name of
Marketable
Securities
Financial
Statement
Account
Counterparty Relationship
Beginning Balance Acquisition Disposal Ending Balance
Shares Amount Shares Amount Shares Amount Carrying
Amount
Gain/Loss
on Disposal Shares Amount
Note
AUO Stock
ACTW Investments in equity-
accounted investees
- - 378,193 5,005,774 40,390 549,393 - - - - 418,583 2,805,441 1
DPSZ Structured deposit
Financial assets at
FVTPL-
current
- - - - - CNY 140,000 - CNY 71,331 CNY 71,331 - - CNY 70,488 2
FPWJ Structured
deposit
Financial
assets at
FVTPL-
current
- - - CNY 91,753 - CNY 200,000 - CNY 194,885 CNY 194,885 - - CNY 100,642 2
FTKS Structured deposit
Financial
assets at
FVTPL-
current
- - - CNY 274,091 - CNY 510,000 - CNY 621,552 CNY 621,552 - - CNY 171,493 2
Note 1: a. As part of a business restructuring, AUO acquired all shares of ACTW from Konly and other shareholders.
b. The ending balance includes the recognition of investment gain (loss), foreign currency translation differences and capital surplus, etc. under the equity method.
Note 2: The ending balance includes the gain/loss on valuation of the financial asset.

AU
Optro
nics
2019 A
nnual R
epo
rt
(Continued)
18
2
AU OPTRONICS CORP. AND SUBSIDIARIES
Purchases from or Sales to Related Parties with Amounts Exceeding NT$100 Million or 20% of the Paid-in Capital
For the year ended December 31, 2019 (Amount in thousands of New Taiwan Dollars and foreign currencies indicated)
Table 5
Company
Name Counterparty Relationship
Transaction Details
Transactions with
Terms Different
from Others Notes/Accounts Receivable (Payable)
Note
Purchases
/Sales Amount
(Note 2)
Percentage of
Total Purchases
/Sales
Credit Terms
Unit
Price
(Note 1)
Credit
Terms
(Note 1)
Ending Balance
(Note 2)
Percentage of Total
Notes /Accounts
Receivable
(Payable)
AUO BMC Subsidiary of Qisda Purchases 4,049,902 2% EOM 90 days - (988,782) (2)%
AUO Raydium Associate Purchases 980,406 1% EOM 120 days - (238,957) -
AUO Qisda Corporate shareholder of AUO
of which accounts for AUO using the equity method
Purchases 8,306,875 4% EOM 45 days - (1,437,067) (3)%
AUO Daxin Associate Purchases 2,665,305 1% EOM 120 days - (831,009) (2)%
AUO DPTW Subsidiary of AUO Purchases 6,101,237 3% EOM 60 days - (887,617) (2)%
AUO AUCZ Subsidiary of AUO Purchases 129,946 - EOM 45 days - - -
AUO AUSZ Subsidiary of AUO Purchases 35,474,816 18% EOM 45 days - (9,447,956) (19)%
AUO AUST Subsidiary of AUO Purchases 5,692,940 3% EOM 45 days - (873,769) (2)%
AUO AUSK Subsidiary of AUO Purchases 134,558 - EOM 45 days - (19,847) -
AUO AULB Subsidiary of AUO Purchases 956,615 - EOM 45 days - (381,063) (1)%
AUO AUKS Subsidiary of AUO Purchases 12,385,120 6% EOM 30 days - (2,151,131) (4)%
AUO AUXM Subsidiary of AUO Purchases 25,695,562 13% EOM 45 days - (8,029,959) (16)%
AUO TGPC Subsidiary of SSEC Sales (161,763) - EOM 25 days - 109,566 -
AUO QCSZ Subsidiary of Qisda Sales (7,126,336) (3)% EOM 55 days - 930,165 3%
AUO QCOS Subsidiary of Qisda Sales (244,442) - EOM 55 days - 27,621 -
AUO FGPC Subsidiary of SSEC Sales (663,428) - EOM 25 days - 76,082 -
AUO DPXM Subsidiary of AUO Sales (130,396) - EOM 45 days - 7,822 -
AUO DPTW Subsidiary of AUO Sales (413,290) - EOM 45 days - 43,577 -
AUO BenQ Subsidiary of Qisda Sales (2,571,371) (1)% EOM 55 days - 399,935 1%
AUO AUXM Subsidiary of AUO Sales (989,043) - EOM 45 days - - -
AUO AUUS Subsidiary of AUO Sales (131,140) - EOM 75 days - 36,724 -
AUO AUSZ Subsidiary of AUO Sales (1,036,086) - EOM 45 days - - -
AUO AUNL Subsidiary of AUO Sales (696,101) - EOM 45 days - 136,045 -
AUO RGPC Subsidiary of SSEC Sales (109,168) - EOM 25 days - - -
AUO ACTW Subsidiary of AUO Sales (581,352) - EOM 45 days - 82,862 -
ACMK ACTW Subsidiary of AUO Purchases USD 36,650 93% OA 60 days - USD (5,971) (92)%
AUCZ AUO Ultimate parent company Sales CZK (99,079) (100)% EOM 45 days - - -
AUKS AUSZ Subsidiary of AUO Purchases CNY 130,338 8% EOM 60 days - CNY (42,137) (6)%
AUKS Qisda Corporate shareholder of AUO of which accounts for AUO
using the equity method
Purchases CNY 23,017 1% EOM 120 days - CNY (10,475) (2)%
AUKS AUO Ultimate parent company Sales CNY (2,770,165) (100)% EOM 30 days - CNY 500,963 100%
AULB AUO Ultimate parent company Sales USD (30,931) (72)% EOM 45 days - USD 8,711 100%
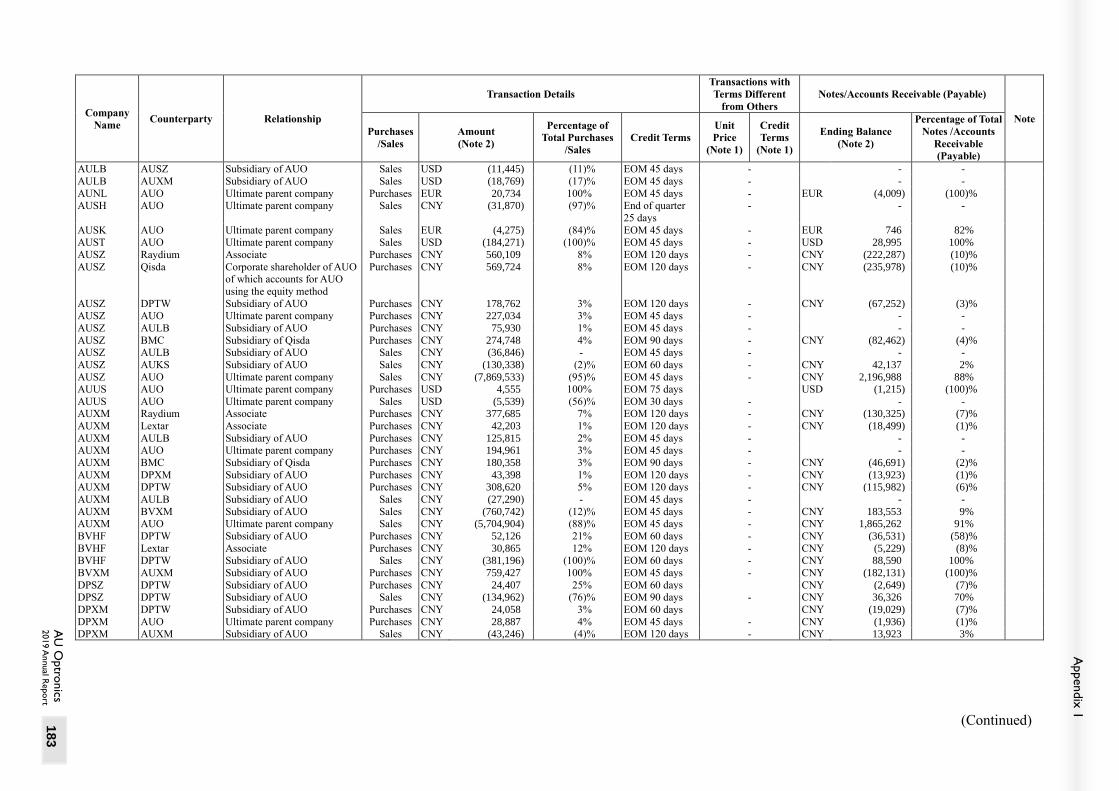
AU
Optro
nics
2019 A
nnual R
epo
rt 183
(Continued)
Appendix
1
Company
Name Counterparty Relationship
Transaction Details
Transactions with
Terms Different
from Others
Notes/Accounts Receivable (Payable)
Note
Purchases
/Sales
Amount
(Note 2)
Percentage of
Total Purchases
/Sales
Credit Terms Unit
Price
(Note 1)
Credit
Terms
(Note 1)
Ending Balance
(Note 2)
Percentage of Total
Notes /Accounts
Receivable
(Payable)
AULB AUSZ Subsidiary of AUO Sales USD (11,445) (11)% EOM 45 days - - -
AULB AUXM Subsidiary of AUO Sales USD (18,769) (17)% EOM 45 days - - -
AUNL AUO Ultimate parent company Purchases EUR 20,734 100% EOM 45 days - EUR (4,009) (100)%
AUSH AUO Ultimate parent company Sales CNY (31,870) (97)% End of quarter
25 days
- - -
AUSK AUO Ultimate parent company Sales EUR (4,275) (84)% EOM 45 days - EUR 746 82%
AUST AUO Ultimate parent company Sales USD (184,271) (100)% EOM 45 days - USD 28,995 100%
AUSZ Raydium Associate Purchases CNY 560,109 8% EOM 120 days - CNY (222,287) (10)%
AUSZ Qisda Corporate shareholder of AUO of which accounts for AUO
using the equity method
Purchases CNY 569,724 8% EOM 120 days - CNY (235,978) (10)%
AUSZ DPTW Subsidiary of AUO Purchases CNY 178,762 3% EOM 120 days - CNY (67,252) (3)%
AUSZ AUO Ultimate parent company Purchases CNY 227,034 3% EOM 45 days - - -
AUSZ AULB Subsidiary of AUO Purchases CNY 75,930 1% EOM 45 days - - -
AUSZ BMC Subsidiary of Qisda Purchases CNY 274,748 4% EOM 90 days - CNY (82,462) (4)%
AUSZ AULB Subsidiary of AUO Sales CNY (36,846) - EOM 45 days - - -
AUSZ AUKS Subsidiary of AUO Sales CNY (130,338) (2)% EOM 60 days - CNY 42,137 2%
AUSZ AUO Ultimate parent company Sales CNY (7,869,533) (95)% EOM 45 days - CNY 2,196,988 88%
AUUS AUO Ultimate parent company Purchases USD 4,555 100% EOM 75 days USD (1,215) (100)%
AUUS AUO Ultimate parent company Sales USD (5,539) (56)% EOM 30 days - - -
AUXM Raydium Associate Purchases CNY 377,685 7% EOM 120 days - CNY (130,325) (7)%
AUXM Lextar Associate Purchases CNY 42,203 1% EOM 120 days - CNY (18,499) (1)%
AUXM AULB Subsidiary of AUO Purchases CNY 125,815 2% EOM 45 days - - -
AUXM AUO Ultimate parent company Purchases CNY 194,961 3% EOM 45 days - - -
AUXM BMC Subsidiary of Qisda Purchases CNY 180,358 3% EOM 90 days - CNY (46,691) (2)%
AUXM DPXM Subsidiary of AUO Purchases CNY 43,398 1% EOM 120 days - CNY (13,923) (1)%
AUXM DPTW Subsidiary of AUO Purchases CNY 308,620 5% EOM 120 days - CNY (115,982) (6)%
AUXM AULB Subsidiary of AUO Sales CNY (27,290) - EOM 45 days - - -
AUXM BVXM Subsidiary of AUO Sales CNY (760,742) (12)% EOM 45 days - CNY 183,553 9%
AUXM AUO Ultimate parent company Sales CNY (5,704,904) (88)% EOM 45 days - CNY 1,865,262 91%
BVHF DPTW Subsidiary of AUO Purchases CNY 52,126 21% EOM 60 days - CNY (36,531) (58)%
BVHF Lextar Associate Purchases CNY 30,865 12% EOM 120 days - CNY (5,229) (8)%
BVHF DPTW Subsidiary of AUO Sales CNY (381,196) (100)% EOM 60 days - CNY 88,590 100%
BVXM AUXM Subsidiary of AUO Purchases CNY 759,427 100% EOM 45 days - CNY (182,131) (100)%
DPSZ DPTW Subsidiary of AUO Purchases CNY 24,407 25% EOM 60 days CNY (2,649) (7)%
DPSZ DPTW Subsidiary of AUO Sales CNY (134,962) (76)% EOM 90 days - CNY 36,326 70%
DPXM DPTW Subsidiary of AUO Purchases CNY 24,058 3% EOM 60 days CNY (19,029) (7)%
DPXM AUO Ultimate parent company Purchases CNY 28,887 4% EOM 45 days - CNY (1,936) (1)%
DPXM AUXM Subsidiary of AUO Sales CNY (43,246) (4)% EOM 120 days - CNY 13,923 3%

AU
Optro
nics
2019 A
nnual R
epo
rt
(Continued)
18
4
Company
Name Counterparty Relationship
Transaction Details
Transactions with
Terms Different
from Others
Notes/Accounts Receivable (Payable)
Note
Purchases
/Sales
Amount
(Note 2)
Percentage of
Total Purchases
/Sales
Credit Terms
Unit
Price
(Note 1)
Credit
Terms
(Note 1)
Ending Balance
(Note 2)
Percentage of
Total Notes
/Accounts
Receivable
(Payable)
DPXM DPTW Subsidiary of AUO Sales CNY (1,074,429) (89)% EOM 90 days - CNY 384,021 83%
FTWJ DPTW Subsidiary of AUO Purchases CNY 116,790 21% EOM 60 days - CNY (283,725) (57)%
FTWJ Lextar Associate Purchases CNY 57,349 10% EOM 120 days - CNY (22,443) (5)%
FTWJ DPTW Subsidiary of AUO Sales CNY (765,048) (90)% EOM 90 days - CNY 552,530 91%
M.Setek ACTW Subsidiary of AUO Sales JPY (5,215,104) (99)% EOM 45 days - JPY 1,643,976 100%
ACTW AUO Ultimate parent company Purchases 581,454 17% EOM 45 days - (82,862) (11)%
ACTW M.Setek Subsidiary of AUO Purchases 1,480,568 43% EOM 45 days - (455,053) (62)%
ACTW ACMK Subsidiary of AUO Sales (1,079,766) (22)% OA 60 days - 179,946 22%
UTI AUO Ultimate parent company Sales (150,409) (69)% EOM 60 days - 15,093 89%
DPTW BVHF Subsidiary of AUO Purchases 1,726,072 13% EOM 60 days - (143,375) (5)%
DPTW AUO Ultimate parent company Purchases 410,921 3% EOM 45 days - (43,343) (1)%
DPTW EFOP Joint Venture Purchases 1,027,147 7% EOM 45 days - (72,942) (2)%
DPTW FTWJ Subsidiary of AUO Purchases 3,428,533 25% EOM 90 days - (998,087) (32)%
DPTW DPXM Subsidiary of AUO Purchases 4,819,703 35% EOM 90 days - (1,390,592) (45)%
DPTW DPSZ Subsidiary of AUO Purchases 606,434 4% EOM 90 days - (156,919) (5)%
DPTW DPXM Subsidiary of AUO Sales (107,170) (1)% EOM 60 days - 36,730 1%
DPTW FTWJ Subsidiary of AUO Sales (521,864) (3)% EOM 60 days - 196,827 7%
DPTW DPSZ Subsidiary of AUO Sales (110,489) (1)% EOM 60 days - 11,445 -
DPTW BVHF Subsidiary of AUO Sales (236,590) (2)% EOM 60 days - 9,589 -
DPTW AUXM Subsidiary of AUO Sales (1,379,316) (9)% EOM 120 days - 501,004 18%
DPTW AUO Ultimate parent company Sales (6,456,889) (42)% EOM 60 days - 845,012 31%
DPTW QCES Subsidiary of Qisda Sales (208,913) (1)% EOM 120 days - 80,000 3%
DPTW Darwin Summit
Corporation,
Ltd.
Associate Sales (100,201) (1)% EOM 90 days - 42,033 2%
DPTW AUSZ Subsidiary of AUO Sales (797,366) (5)% EOM 120 days - 290,507 11%
Note 1: Transaction terms with related parties were similar to those with third parties, except for particular transactions with no similar transactions to compare with. For those
transactions, transaction terms were determined in accordance with mutual agreements.
Note 2: All inter-company transactions among AUO and its subsidiaries have been eliminated in the consolidated financial statements.

AU
Optro
nics
2019 A
nnual R
epo
rt 185
(Continued)
Appendix
1
AU OPTRONICS CORP. AND SUBSIDIARIES
Receivables from Related Parties with Amounts Exceeding NT$100 Million or 20% of the Paid-in Capital
December 31, 2019
(Amount in thousands of New Taiwan Dollars and foreign currencies indicated)
Table 6
Company
Name Counterparty Relationship
Ending Balance of
Receivables
(Note 3)
Turnover Rate
Overdue Receivables Amounts Received in
Subsequent Period
(Note 1)
Allowance
for Bad
Debts Amount Action Taken
AUO TGPC Subsidiary of SSEC 109,566 2.93 - - - -
AUO ACTW Subsidiary of AUO 1,284,439 (Note 2) - - - -
AUO BenQ Subsidiary of Qisda 399,935 5.52 114 Will be collected in next period - -
AUO AUNL Subsidiary of AUO 136,045 10.23 16 Collected in subsequent period 70,516 -
AUO QCSZ Subsidiary of Qisda 930,165 6.26 935 Will be collected in next period - -
AUKS AUO Ultimate parent company CNY 500,963 5.83 CNY 28,896 Collected in subsequent period CNY 240,556 -
AULB AUO Ultimate parent company USD 9,189 (Note 2) USD 8,711 Will be collected in next period - -
AULB AUKS Subsidiary of AUO USD 95,056 (Note 2) - - - -
AUSJ AUKS Subsidiary of AUO CNY 224,528 (Note 2) - - - -
AUST AUO Ultimate parent company USD 28,995 5.92 - - - -
AUSZ AUKS Subsidiary of AUO CNY 1,016,582 (Note 2) CNY 14,634 Collected in subsequent period CNY 16,118 -
AUSZ AUO Ultimate parent company CNY 2,196,989 (Note 2) CNY 27,024 Collected in subsequent period CNY 1,511,352 -
AUXM BVXM Subsidiary of AUO CNY 183,895 (Note 2) CNY 1,421 Collected in subsequent period CNY 106,300 -
AUXM AUKS Subsidiary of AUO CNY 818,914 (Note 2) CNY 137 Collected in subsequent period CNY 250 -
AUXM AUO Ultimate parent company CNY 1,865,262 6.10 CNY 93,824 Collected in subsequent period CNY 1,082,848 -
BVHF DPTW Subsidiary of AUO CNY 88,996 (Note 2) CNY 49,549 Will be collected in next period - -
DPSZ DPTW Subsidiary of AUO CNY 36,326 2.55 - - - -
DPXM DPTW Subsidiary of AUO CNY 384,031 (Note 2) - - CNY 24,417 -
FTKS AUKS Subsidiary of AUO CNY 101,547 (Note 2) - - - -
FTWJ DPTW Subsidiary of AUO CNY 552,530 1.39 - - CNY 97,667 -
M.Setek ACTW Subsidiary of AUO JPY 1,643,976 5.75 JPY 418,115 Will be collected in next period - -
ACTW M.Setek Subsidiary of AUO 220,875 - - - - -
ACTW ACMK Subsidiary of AUO 188,510 (Note 2) - - - -
DPTW AUSZ Subsidiary of AUO 290,507 5.49 - - - -
DPTW FTWJ Subsidiary of AUO 1,230,770 (Note 2) 29,182 Collected in subsequent period 414,948 -
DPTW AUXM Subsidiary of AUO 501,004 5.36 - - - -
DPTW AUO Ultimate parent company 845,532 (Note 2) 71,466 Will be collected in next period - -
DPTW BVHF Subsidiary of AUO 157,802 (Note 2) - - - -
Note 1: Until the end of January 2020.
Note 2: The ending balance includes other receivables from transactions not related to ordinary sales.
Note 3: All inter-company transactions among AUO and its subsidiaries have been eliminated in the consolidated financial statements.

AU
Optro
nics
2019 A
nnual R
epo
rt
(Continued)
18
6
AU OPTRONICS CORP. AND SUBSIDIARIES
Business Relationship and Significant Intercompany Transactions
For the year ended December 31, 2019
(Amount in thousands of New Taiwan Dollars and foreign currencies indicated)
Table 7
No. Company
Name Counterparty Nature of Relationship
Inter-company Transactions
Financial
Statement
Account
Amount Trading Terms
Percentage of
Consolidated
Net Revenue or
Total Assets
0 AUKS AUO Subsidiary to parent Net revenue CNY 2,770,165 The prices of inter-company sales are not comparable with
those of third parties. The credit term is EOM 30 days.
5%
0 AUKS AUO Subsidiary to parent Receivables from
related parties
CNY 500,963 - 1%
1 AULB AUKS Subsidiary to subsidiary Receivables from
related parties
USD 95,056 - 1%
2 AUST AUO Subsidiary to parent Net revenue USD 184,271 The prices of inter-company sales are not comparable with
those of third parties. The credit term is EOM 45 days.
2%
3 AUSZ AUO Subsidiary to parent Net revenue CNY 7,869,533 The prices of inter-company sales are not comparable with
those of third parties. The credit term is EOM 45 days.
13%
3 AUSZ AUO Subsidiary to parent Receivables from
related parties
CNY 2,196,989 - 2%
3 AUSZ AUKS Subsidiary to subsidiary Receivables from
related parties
CNY 1,016,582 - 1%
4 AUXM AUO Subsidiary to parent Net revenue CNY 5,704,904 The prices of inter-company sales are not comparable with
those of third parties. The credit term is EOM 45 days.
9%
4 AUXM BVXM Subsidiary to subsidiary Net revenue CNY 760,742 The prices of inter-company sales are not comparable with
those of third parties. The credit term is EOM 45 days.
1%
4 AUXM AUKS Subsidiary to subsidiary Receivables from
related parties
CNY 818,914 - 1%
4 AUXM AUO Subsidiary to parent Receivables from
related parties
CNY 1,865,262 - 2%
5 BVHF DPTW Subsidiary to subsidiary Net revenue CNY 381,196 The prices of inter-company sales are not comparable with
those of third parties. The credit term is EOM 60 days.
1%
6 DPXM DPTW Subsidiary to subsidiary Net revenue CNY 1,074,429 The prices of inter-company sales are not comparable with
those of third parties. The credit term is EOM 90 days.
2%
7 FTWJ DPTW Subsidiary to subsidiary Net revenue CNY 765,048 The prices of inter-company sales are not comparable with
those of third parties. The credit term is EOM 90 days.
1%

AU
Optro
nics
2019 A
nnual R
epo
rt 187
(Continued)
Appendix
1
No. Company
Name Counterparty Nature of Relationship
Inter-company Transactions
Financial
Statement
Account
Amount Trading Terms
Percentage of
Consolidated
Net Revenue or
Total Assets
7 FTWJ DPTW Subsidiary to subsidiary Receivables from
related parties
CNY 552,530 - 1%
8 M.Setek ACTW Subsidiary to subsidiary Net revenue JPY 5,215,104 The prices of inter-company sales are not comparable with
those of third parties. The credit term is EOM 45 days.
1%
9 DPTW AUXM Subsidiary to subsidiary Net revenue 1,379,316 The prices of inter-company sales are not comparable with
those of third parties. The credit term is EOM 120 days.
1%
9 DPTW AUO Subsidiary to parent Net revenue 6,456,889 The prices of inter-company sales are not comparable with
those of third parties. The credit term is EOM 60 days.
2%
Note 1: This table discloses the information on inter-company sales and receivables which are accounted for 1% or more of the consolidated net revenue or the consolidated total
assets, respectively. The information of the corresponding inter-company purchases and payables is no more disclosed herein.
Note 2: All inter-company transactions have been eliminated in the consolidated financial statements.

AU
Optro
nics
2019 A
nnual R
epo
rt
(Continued)
18
8
AU OPTRONICS CORP. AND SUBSIDIARIES
Information on Investees (Excluding Information on Investment in Mainland China)
For the year ended December 31, 2019 (Amount in thousands of New Taiwan Dollars and foreign currencies indicated, and shares in thousands)
Table 8
Investor
Company
Investee
Company Location Main Activities
Original Investment Amount December 31, 2019 Maximum
Shareholding
in the Interim
Net Income
(Loss) of
Investee
Investor’s Share
of Profit (Loss)
of Investee
(Notes 1 and 2)
Note December 31,
2019
December 31,
2018 Shares
Percentage of
Ownership
Carrying Amount
(Notes 1 and 2)
AUO AULB Malaysia Holding and trading company 59,058,698 59,058,698 1,882,189 100.00% 53,221,601 100.00%
1,367,091 1,481,004 Subsidiary AUO AUNL Netherlands Sales and sales support of
TFT-LCD panels
24,275 24,275 50 100.00% 37,774 100.00%
13,707 13,707 Subsidiary
AUO Konly Taiwan ROC Venture capital investment 4,227,070 4,227,070 284,302 100.00% 5,208,936 100.00%
171,825 171,825 Subsidiary AUO Ronly Taiwan ROC Venture capital investment 1,778,692 1,778,692 154,757 100.00% 2,049,860 100.00%
9,126 9,126 Subsidiary
AUO DPTW Taiwan ROC Design, manufacturing, and
sales of TFT-LCD modules, backlight modules, TV set
and related parts
3,569,155 3,569,155 190,108 28.56% 3,156,574 28.56%
(190,141) (54,311) Subsidiary
AUO ACTW Taiwan ROC Manufacturing and sales of ingots and solar wafers
15,687,921 15,138,528 418,583 100.00% 2,805,441 100.00% (2,648,071) (2,614,702) Subsidiary
(Note 4)
AUO SREC Taiwan ROC Investment 379,040 379,040 37,904 32.01% 424,653 32.01%
110,266 35,300 Associate
AUO Lextar Taiwan ROC Manufacturing and sales of Light Emitting Diode
881,076 881,076 78,418 15.10% 1,642,746 15.33%
(309,651) (46,855) Associate
AUO SMI Taiwan ROC Sales and leasing of content
management system and hardware
30,000 30,000 3,000 100.00% 18,247 100.00%
(11,025) (11,025) Subsidiary
AUO UTI Taiwan ROC Planning, design and
development of construction for environmental protection
and related project
management
100,000 50,000 10,000 100.00% 88,906 100.00%
(11,183) (11,183) Subsidiary
AUO SSEC Taiwan ROC Investment 930,000 930,000 93,000 31.00% 953,966 31.00%
73,407 22,756 Associate
AUO CQIL Israel Holding company 876,659 821,138 39,974 100.00% 576,111 100.00%
(54,995)
(182,866) Subsidiary
Konly DPTW Taiwan ROC Design, manufacturing, and
sales of TFT-LCD modules,
backlight modules, TV set and related parts
703,795 703,795 42,598 6.40% 707,303 6.40%
(190,141) (12,170) Subsidiary
Konly ACTW Taiwan ROC Manufacturing and sales of
ingots and solar wafers
- 589,793 - -
- 2.50% (2,648,071)
(2,381) Subsidiary
(Note 4) Konly SREC Taiwan ROC Investment 17,760 17,760 1,776 1.50% 19,897 1.50%
110,266 1,654 Associate
Konly Raydium Taiwan ROC IC design 175,857 175,857 11,454 17.10% 740,504 17.63%
674,300 117,334 Associate
Konly Daxin Taiwan ROC Research, manufacturing and sales of display related
chemicals
154,748 154,748 19,114 18.61% 517,812 18.61%
650,420 121,032 Associate
Konly Lextar Taiwan ROC Manufacturing and sales of Light Emitting Diode
450,674 450,674 26,133 5.03% 547,439 5.11%
(309,651) (15,614) Associate

AU
Optro
nics
2019 A
nnual R
epo
rt 189
(Continued)
Appendix
1
Investor
Company
Investee
Company Location Main Activities
Original Investment Amount December 31, 2019 Maximum
Shareholding
in the Interim
Net Income
(Loss) of
Investee
Investor’s Share
of Profit (Loss)
of Investee
(Notes 1 and 2)
Note December 31,
2019
December 31,
2018 Shares
Percentage of
Ownership
Carrying Amount
(Notes 1 and 2)
Konly Ubitech Inc. Taiwan ROC Development and sales of
software for POS system
27,000 27,000 357 26.31% 1,262 26.31%
(7,584) (16,854) Associate
Konly SSEC Taiwan ROC Investment 60,000 60,000 6,000 2.00% 61,546 2.00%
73,407 1,468 Associate
Konly WishMobile
,Inc.
Taiwan ROC Developing and providing
CRM APP
15,000 15,000 2,500 12.50% 5,899 12.50%
1,334 (7,932) Associate
Konly SkyREC
Ltd.
BVI Data consulting service for
retail
46,016 46,016 188 16.12% 4,304 16.12%
(14,143) (38,982) Associate
Ronly DPTW Taiwan ROC Design, manufacturing, and sales of TFT-LCD modules,
backlight modules, TV set
and related parts
845,510 845,510 40,509 6.09% 672,617 6.09%
(190,141) (11,573) Subsidiary
Ronly Daxin Taiwan ROC Research, manufacturing and
sales of display related
chemicals
70,021 70,021 6,312 6.15% 171,001 6.15%
650,420 39,969 Associate
Ronly Lextar Taiwan ROC Manufacturing and sales of
Light Emitting Diode
323,431 323,431 34,338 6.61% 719,336 6.71%
(309,651) (20,517) Associate
DPTW BVLB Malaysia Holding company 1,051,289 1,051,289 36,000 29.71% 242,935 29.71%
(133,388) (39,630) Subsidiary DPTW DPLB Malaysia Holding company 4,362,627 4,362,627 92,267 100.00% 6,172,423 100.00%
(27,931) (17,834) Subsidiary
DPTW FHVI BVI Holding company 2,362,321 2,362,321 22,006 100.00% 4,008,112 100.00%
96,028 20,304 Subsidiary
DPTW FRVI BVI Holding company - 274,700 - - - 100.00%
6,200 6,029 Subsidiary (Note 5)
DPTW FFMI Mauritius Holding company 274,700 - 653 100.00% 93,524 100.00%
6,200 - Subsidiary
(Note 5) DPTW EFOP Taiwan ROC Manufacturing and sales of
polymer plasticized raw
materials
338,729 338,729 33,873 49.00% 178,719 49.00%
(88,238) (43,237) Joint
Venture
DPTW Darwin
Summit
Corporation, Ltd.
Thailand International trade 3,740 3,740 40 40.00% 10,394 40.00%
7,765 3,106 Associate
ACTW ACMK Malaysia Manufacturing and sales of
solar wafers
449,975 449,975 46,196 100.00% 537,395 100.00%
42,306 42,306 Subsidiary
ACTW SDMC Taiwan ROC Holding company 1,988,488 1,988,488 116,836 100.00% 1,948,642 100.00%
171,314 168,217 Subsidiary
SDMC M.Setek Japan Manufacturing and sales of
ingots
23,596,398 23,596,368 11,404,184 99.9991% 1,946,295 99.9991%
188,831 188,830 Subsidiary
AULB AUUS United States Sales and sales support of
TFT-LCD panels
USD 1,000 USD 1,000 1,000 100.00% USD 2,063 100.00% USD 161 USD 161 Subsidiary
AULB AUJP Japan Sales support of TFT-LCD panels
USD 276 USD 276 1 100.00% USD 1,765 100.00% USD 1 USD 1 Subsidiary
AULB AUKR South Korea Sales support of TFT-LCD
panels
USD 155 USD 155 - 100.00% USD 1,014 100.00% USD 83 USD 83 Subsidiary
AULB AUCZ Czech
Republic
Assembly of solar modules USD 20,531 USD 20,531 - 100.00% USD 10,534 100.00% USD (3,607) USD (3,607) Subsidiary
AULB AUSK Slovakia Republic
Repairing of TFT-LCD modules
USD 1,359 USD 54,349 - 100.00% USD 22,879 100.00% USD 246 USD 246 Subsidiary

AU
Optro
nics
2019 A
nnual R
epo
rt
(Continued)
19
0
Investor
Company
Investee
Company Location Main Activities
Original Investment Amount December 31, 2019 Maximum
Shareholding
in the Interim
Net Income
(Loss) of
Investee
Investor’s Share
of Profit (Loss)
of Investee
(Notes 1 and 2)
Note December 31,
2019
December 31,
2018 Shares
Percentage of
Ownership
Carrying Amount
(Notes 1 and 2)
AULB AUST Singapore Manufacturing TFT-LCD
panels based on low temperature polysilicon
technology
USD 276,543 USD 321,161 907,114 100.00% USD 139,306 100.00% USD 2,120 USD 2,120 Subsidiary
AULB AUVI United States Research and development and IP related business
USD 5,000 USD 5,000 5,000 100.00% USD 5,875 100.00% USD 255 USD 255 Subsidiary
AULB BVLB Malaysia Holding company USD 85,171 USD 85,171 85,171 70.29% USD 19,073 70.29% USD (4,313) USD (3,032) Subsidiary
AULB AUSG Singapore Holding company and sales support of TFT-LCD panels
USD 48,321 USD 86,685 266,268 100.00% USD 34,448 100.00% USD 903 USD 903 Subsidiary
AUSG AEUS United States Sales support of solar-related
products
USD 3,510 USD 3,510 9,510 100.00% USD 814 100.00% USD (1) USD (1) Subsidiary
AUSG AENL Netherlands Sales support of solar-related
products
USD 45 USD 45 - 100.00% USD 174 100.00% USD (12) USD (12) Subsidiary
DPLB DPHK Hong Kong Holding company USD 103,785 USD 103,785 10 100.00% USD 205,804 100.00% USD (248) USD (248) Subsidiary (Note 6)
DPLB DPSK Slovakia
Republic
Manufacturing and sales of
automotive parts
USD 4,216 USD 4,216 - 100.00% USD 2,546 100.00% USD (655) USD (655) Subsidiary
FHVI FTMI Mauritius Holding company USD 6,503 USD 6,503 6,503 100.00% USD 75,756 100.00% USD (2,786) USD (2,786) Subsidiary
FHVI FWSA Samoa Holding company USD 19,000 USD 19,000 19,000 100.00% USD 14,364 100.00% USD 146 USD 146 Subsidiary
FHVI PMSA Samoa Holding company USD 39,673 USD 39,673 31,993 100.00% USD 44,825 100.00% USD 1,832 USD 1,832 Subsidiary FRVI FFMI Mauritius Holding company - USD 8,200 - -
- 100.00% USD 200 USD 200 Subsidiary
(Note 5)
M.Setek Ichijo Seisakusyo
Co., Ltd.
Japan Manufacturing of semiconductor equipment and
related parts
JPY 5,000 JPY 5,000 - 38.46%
- 38.46%
-
- Associate (Note 3)
CQIL CQHLD United Kingdom
Holding company USD 18,868 USD 4,071 635,709 100.00% USD 18,491 100.00% USD 4,811 USD 4,811 Subsidiary
CQHLD CQUK United
Kingdom
Sales and sales support of
content management system
GBP 1,874 - - 100.00% USD 510 100.00% USD 123 USD 123 Subsidiary
CQHLD CQUS United States Sales of content management
system and hardware
USD 15,607 USD 1 11 100.00% USD 3,863 100.00% USD (1,873) USD (1,873) Subsidiary
CQHLD CQCA Canada Research and development of content management system
CAD 1,310 - - 100.00% USD 550 100.00% USD 88 USD 88 Subsidiary
CQUS JRUK United
Kingdom
Development and sales of
content management system
and sales of related hardware
-
- - 100.00%
- 100.00%
-
- Subsidiary
CQUS JRUS United States Development and sales of
content management system and sales of related hardware
-
- 10 100.00%
- 100.00%
-
- Subsidiary
Note 1: All inter-company transactions among AUO and its subsidiaries have been eliminated in the consolidated financial statements.
Note 2: Inclusive of the amortization of differences between the investment cost and the entity’s share of the net value of investee, and the effect of upstream and sidestream transactions.
Note 3: The carrying amount includes accumulated impairment loss.
Note 4: As part of a business restructuring, AUO acquired all shares of ACTW from Konly and other shareholders.
Note 5: FRVI was liquidated in the fourth quarter of 2019. FRVI transferred all of its shareholdings in FFMI to DPTW.
Note 6: The registration of the alteration of DPHK’s common stock has not been completed.
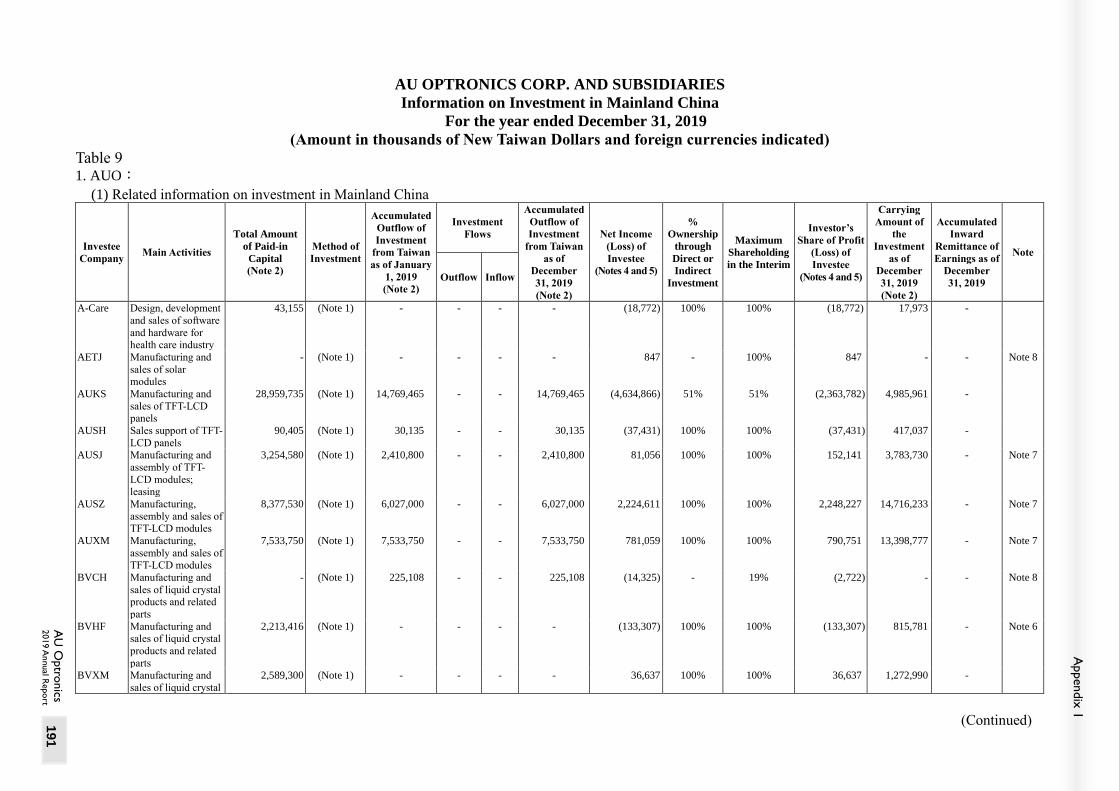
AU
Optro
nics
2019 A
nnual R
epo
rt 191
(Continued)
Appendix
1
AU OPTRONICS CORP. AND SUBSIDIARIES
Information on Investment in Mainland China
For the year ended December 31, 2019
(Amount in thousands of New Taiwan Dollars and foreign currencies indicated)
Table 9 1. AUO:
(1) Related information on investment in Mainland China
Investee
Company Main Activities
Total Amount
of Paid-in
Capital
(Note 2)
Method of
Investment
Accumulated
Outflow of
Investment
from Taiwan
as of January
1, 2019
(Note 2)
Investment
Flows
Accumulated
Outflow of
Investment
from Taiwan
as of
December
31, 2019
(Note 2)
Net Income
(Loss) of
Investee
(Notes 4 and 5)
%
Ownership
through
Direct or
Indirect
Investment
Maximum
Shareholding
in the Interim
Investor’s
Share of Profit
(Loss) of
Investee
(Notes 4 and 5)
Carrying
Amount of
the
Investment
as of
December
31, 2019
(Note 2)
Accumulated
Inward
Remittance of
Earnings as of
December
31, 2019
Note
Outflow Inflow
A-Care Design, development
and sales of software
and hardware for health care industry
43,155 (Note 1) - - - - (18,772) 100% 100% (18,772) 17,973 -
AETJ Manufacturing and
sales of solar modules
- (Note 1) - - - - 847 - 100% 847 - - Note 8
AUKS Manufacturing and
sales of TFT-LCD panels
28,959,735 (Note 1) 14,769,465 - - 14,769,465 (4,634,866) 51% 51% (2,363,782) 4,985,961 -
AUSH Sales support of TFT-
LCD panels
90,405 (Note 1) 30,135 - - 30,135 (37,431) 100% 100% (37,431) 417,037 -
AUSJ Manufacturing and
assembly of TFT-
LCD modules; leasing
3,254,580 (Note 1) 2,410,800 - - 2,410,800 81,056 100% 100% 152,141 3,783,730 - Note 7
AUSZ Manufacturing,
assembly and sales of TFT-LCD modules
8,377,530 (Note 1) 6,027,000 - - 6,027,000 2,224,611 100% 100% 2,248,227 14,716,233 - Note 7
AUXM Manufacturing,
assembly and sales of TFT-LCD modules
7,533,750 (Note 1) 7,533,750 - - 7,533,750 781,059 100% 100% 790,751 13,398,777 - Note 7
BVCH Manufacturing and
sales of liquid crystal products and related
parts
- (Note 1) 225,108 - - 225,108 (14,325) - 19% (2,722) - - Note 8
BVHF Manufacturing and sales of liquid crystal
products and related
parts
2,213,416 (Note 1) - - - - (133,307) 100% 100% (133,307) 815,781 - Note 6
BVXM Manufacturing and
sales of liquid crystal
2,589,300 (Note 1) - - - - 36,637 100% 100% 36,637 1,272,990 -

AU
Optro
nics
2019 A
nnual R
epo
rt
(Continued)
19
2
Investee
Company Main Activities
Total Amount
of Paid-in
Capital
(Note 2)
Method of
Investment
Accumulated
Outflow of
Investment
from Taiwan
as of January
1, 2019
(Note 2)
Investment
Flows
Accumulated
Outflow of
Investment
from Taiwan
as of
December
31, 2019
(Note 2)
Net Income
(Loss) of
Investee
(Notes 4 and 5)
%
Ownership
through
Direct or
Indirect
Investment
Maximum
Shareholding
in the Interim
Investor’s
Share of Profit
(Loss) of
Investee
(Notes 4 and 5)
Carrying
Amount of
the
Investment
as of
December
31, 2019
(Note 2)
Accumulated
Inward
Remittance of
Earnings as of
December
31, 2019
Note
Outflow Inflow
products and related parts
EDT Design and sales of
software and hardware integration
system and
equipment relating to intelligent
manufacturing
21,578 (Note 1) - - - - (4,886) 100% 100% (4,886) 16,862 -
MIS Development and licensing of software
relating to intelligent
manufacturing, and related consulting
services
21,578 (Note 1) - - - - (13,025) 100% 100% (13,025) 8,659 -
UFSZ Planning, design and development of
construction project
for environmental protection and related
project management
25,893 (Note 1) - - - - (7,951) 100% 100% (7,951) 18,506 -
UFSD Planning, design and development of
construction project
for environmental protection and related
project management
8,631 (Note 1) - - - - (2,932) 100% 100% (2,932) 5,802 -
(2) Upper limit on investment in Mainland China Accumulated Investment in Mainland China
as of December 31, 2019 (Note 2)
Investment Amounts Authorized by the
Investment Commission, MOEA (Note 2)
Upper Limit on Investment Stipulated by the
Investment Commission, MOEA (Note 3)
30,996,258 (USD 1,028,580) 40,462,497 (USD 1,335,003 and HKD 60,000) 112,786,050
Note 1: Indirect investments in Mainland China through companies registered in a third region.
Note 2: Amounts denominated in foreign currencies are translated into New Taiwan Dollars using the exchange rates at the reporting date.
Note 3: Pursuant to the Regulations Governing Permission for Investment and Technical Cooperation in the Mainland Area, AUO’s accumulated investments in Mainland China did not
exceed the upper limit on investment amount or ratio stipulated by the Investment Commission, Ministry of Economic Affairs (“MOEA”).
Note 4: Amounts were recognized based on the investees’ audited financial statements except for BVCH.
Note 5: Amounts denominated in foreign currencies are translated into New Taiwan Dollars using the average exchange rates for the year of 2019.
Note 6: BVHF is 100% owned by BVLB, a jointly-owned subsidiary of AUO and DPTW.
Note 7: Investor’s share of profit (loss) of investee and the carrying amount of the investment as of December 31, 2019 both include the effect of sidestream transactions.
Note 8: AETJ and BVCH were liquidated in the fourth quarter of 2019.

AU
Optro
nics
2019 A
nnual R
epo
rt 193
Appendix
1
2. DPTW:
(1) Related information on investment in Mainland China
Investee
Company Main Activities
Total Amount
of Paid-in
Capital
(Note 4)
Method of
Investment
Accumulated
Outflow of
Investment from
Taiwan as of
January 1, 2019
(Note 4)
Investment
Flows
Accumulated
Outflow of
Investment
from Taiwan as
of December
31, 2019
(Note 4)
Net Income
(Loss) of
Investee
(Notes 2 and 6)
%
Ownership
through
Direct or
Indirect
Investment
Maximum
Shareholding
in the Interim
Investor’s
Share of Profit
(Loss) of
Investee
(Notes 2 and 6)
Carrying
Amount of the
Investment as
of December
31, 2019
(Note 4)
Accumulated
Inward
Remittance of
Earnings as of
December
31, 2019
(Note 4)
Note Outflow
(Note 4)
Inflow
(Note 4)
BVHF Manufacturing and sales of liquid crystal
products and related
parts
2,213,416 (Note 1) 482,160 - - 482,160 (133,307) 29.71% 29.71% (133,307) 815,781 - Note 5
DPSZ Manufacturing and
sales of backlight
modules and related
parts
753,375 (Note 1) 452,025 - - 452,025 1,474 100% 100% 1,474 1,779,351 1,003,989 Note 9
DPXM Manufacturing and sales of backlight
modules and related
parts
2,109,450 (Note 1) 2,109,450 - - 2,109,450 (9,145) 100% 100% (9,145) 4,422,562 1,559,487
FHWJ Manufacturing of
motorized treadmills
195,878 (Note 1) 247,107 - - 247,107 6,200 100% 100% 6,200 43,308 -
FPWJ Manufacturing and
sales of precision
plastic parts
873,915 (Note 1) 572,565 - - 572,565 6,879 100% 100% 6,879 644,612 - Note 8
FTKS Manufacturing and
sales of backlight
modules and related
parts
1,084,860 (Note 1) 1,084,860 - - 1,084,860 56,654 100% 100% 56,654 1,350,802 -
FTWJ Manufacturing and
sales of backlight
modules and related parts
1,054,725 (Note 1) 195,878 - - 195,878 (88,537) 100% 100% (88,537) 2,071,120 424,136 Note 7
(2) Upper limit on investment in Mainland China Accumulated Investment in Mainland China
as of December 31, 2019 (Note 4)
Investment Amounts Authorized by the
Investment Commission, MOEA (Note 4)
Upper Limit on Investment Stipulated by the Investment
Commission, MOEA (Note 3)
5,144,045 (USD 170,700) 5,674,511 (USD 188,303) 6,630,571
Note 1: Indirect investments in Mainland China through companies registered in a third region.
Note 2: Amounts were recognized based on the investees’ audited financial statements.
Note 3: Pursuant to the Regulations Governing Permission for Investment and Technical Cooperation in the Mainland Area, DPTW’s accumulated investments in Mainland China did not exceed the
upper limit on investment amount or ratio stipulated by the Investment Commission, Ministry of Economic Affairs (“MOEA”).
Note 4: Amounts denominated in foreign currencies are translated into New Taiwan Dollars using the exchange rates at the reporting date.
Note 5: BVHF is 100% owned by BVLB, a jointly-owned subsidiary of AUO and DPTW. Accordingly, the share of profit (loss) of investee and the carrying amount of the investment as of December
31, 2019 disclosed in the table are presented based on 100% held.
Note 6: Amounts denominated in foreign currencies are translated into New Taiwan Dollars using the average exchange rates for the year of 2019.
Note 7: The amount of paid-in capital includes the capitalization of retained earnings amounting to USD28,500 thousand for the years from 2005 to 2007.
Note 8: The amount of paid-in capital includes the capital injection of USD10,000 thousand from the offshore holding company, which was originally from FTWJ’s appropriation of earnings.
Note 9: The amount of paid-in capital includes the capital injection of USD1,000 thousand from DPLB in 2010 and the capitalization of retained earnings of USD9,000 thousand from DPSZ in 2012.

AU Optronics 2019 Annual Report
194
Appendix 2
Stock Code:2409
AU OPTRONICS CORP.
Parent Company Only Financial Statements and
Independent Auditors’ Report
For the Years Ended
December 31, 2019 and 2018
The independent auditors’ report and the accompanying parent company only financial statements are the English translation of the
Chinese version prepared and used in the Republic of China. If there is any conflict between, or any difference in the interpretation of
the English version and Chinese version, the Chinese-language independent auditors’ report and the parent company only financial
statements shall prevail.

AU Optronics 2019 Annual Report
195
Appendix 2
Independent Auditors’ Report
To the Board of Directors of AU Optronics Corp.:
Opinion
We have audited the parent company only financial statements of AU Optronics Corp. (“the Company”),
which comprise the balance sheets as of December 31, 2019 and 2018, the statements of comprehensive
income, statements of changes in equity, and statements of cash flows for the years ended December 31,
2019 and 2018, and notes to the parent company only financial statements including a summary of
significant accounting policies.
In our opinion, the accompanying parent company only financial statements present fairly, in all material
respects, the financial position of the Company as of December 31, 2019 and 2018, and its financial
performance and its cash flows for each of the years then ended, in accordance with the Regulations
Governing the Preparation of Financial Reports by Securities Issuers.
Basis for Opinion
We conducted our audit in accordance with the Regulations Governing Auditing and Certification of
Financial Statements by Certified Public Accountants and the auditing standards generally accepted in the
Republic of China. Our responsibilities under those standards are further described in the Auditor’s
Responsibilities for the Audit of the Parent Company Only Financial Statements section of our report. We are
independent of the Company in accordance with the Certified Public Accountants Code of Professional
Ethics in Republic of China (“the Code”), and we have fulfilled our other ethical responsibilities in
accordance with the Code. We believe that the audit evidence we have obtained is sufficient and appropriate
to provide a basis for our opinion.
Emphasis of Matter
As stated in Note 3(1) to the parent company only financial statements, the Company has initially adopted
the IFRS 16, “Leases” from January 1, 2019 and applied the modified retrospective approach with no
restatement of comparative period amounts. Our conclusion is not modified in respect of this matter.
Key Audit Matters
Key audit matters are those matters that, in our professional judgment, were of most significance in our audit
of the parent company only financial statements of the current period. These matters were addressed in the
context of our audit of the parent company only financial statements as a whole, and in forming our opinion
thereon, and we do not provide a separate opinion on these matters. We have determined the matters
described below to be the key audit matters to be communicated in our report.
Impairment of long-term non-financial assets (including goodwill)
Refer to Note 4(15) “Impairment – non-financial assets”, Note 5(2) and Note 5(3) “Critical accounting
judgments and key sources of estimation and assumption uncertainty”, Note 6(8) “Property, plant and
equipment”, Note 6(9) “Lease arrangements” and Note 6(11) “Intangible assets” to the parent company only
financial statements.
Description of key audit matter:
The Company operates in an industry with high investment costs, has goodwill through the acquisition of
subsidiaries, and may experience volatility in response to changes in the external market; hence, it is
important to assess the impairment of its long-term non-financial assets (including goodwill). The
impairment assessment includes identifying cash-generating units, determining a valuation model,
determining significant assumptions, and computing recoverable amounts. With the complexity of the
impairment assessment process and the involvement of significant management judgment regarding
assumptions used, this is one of the key areas our audit focused on.

AU Optronics 2019 Annual Report
196
How the matter was addressed in our audit:
In relation to the key audit matter above, our principal audit procedures included understanding and testing
the Company’s controls surrounding the impairment assessment and testing process; assessing whether there
are impairment indications for the identified cash-generating units of the Company and its related assets;
understanding and assessing the appropriateness of the valuation model used by the management in the
impairment assessment and the significant assumptions used to determine related assets’ future cash flows
projection, useful lives, and weighted-average cost of capital; retrospectively reviewing the accuracy of
assumptions used in prior-period estimates and performing a sensitivity analysis of key assumptions and
results; in addition to the above audit procedures, appointing specialists to evaluate the appropriateness of the
weighted-average cost of capital used and related assumptions; performing an inquiry of the management
and identifying any event after the balance sheet date if able to affect the results of the impairment
assessment; and assessing the adequacy of the Company’s disclosures of its policy on impairment of
noncurrent non-financial assets and other related disclosures.
Revenue recognition
Refer to Note 4(18) “Revenue from contracts with customers” and Note 6(18) “Revenue from contracts with
customers” to the parent company only financial statements.
Description of key audit matter:
Revenue is recognized when the control over a product has been transferred to the customer as specified in
each individual contract with customers. The Company recognizes revenue depending on the various sales
terms in each individual contract with customers to ensure the performance obligation has been satisfied by
transferring control over a product to a customer. In addition, the Company operates in an industry in which
sales revenue is easily influenced by various external factors such as supply and demand of the market, and
this may impact the recognition of revenue. Consequently, this is one of the key areas our audit focused on.
How the matter was addressed in our audit:
In relation to the key audit matter above, our principal audit procedures included understanding and testing
the Company’s controls surrounding revenue recognition; assessing whether appropriate revenue recognition
policies are applied through comparison with accounting standards and understanding the Company’s main
revenue types, its related sales agreements, and sales terms; on a sample basis, inspecting contracts with
customers or customers’ orders and assessing whether the accounting treatment of the related contracts
(including sales terms) is applied appropriately; performing a test of details of sales revenue and
understanding the rationale for any identified significant sales fluctuations and any significant reversals of
revenue through sales discounts and sales returns which incurred within a certain period before or after the
balance sheet date; and assessing the adequacy of the Company’s disclosures of its revenue recognition
policy and other related disclosures.
Responsibilities of Management and Those Charged with Governance for the Parent Company Only
Financial Statements
Management is responsible for the preparation and fair presentation of the parent company only financial
statements in accordance with Regulations Governing the Preparation of Financial Reports by Securities
Issuers and for such internal control as management determines is necessary to enable the preparation of
parent company only financial statements that are free from material misstatement, whether due to fraud or
error.
In preparing the parent company only financial statements, management is responsible for assessing the
Company’s ability to continue as a going concern, disclosing, as applicable, matters related to going concern
and using the going concern basis of accounting unless management either intends to liquidate the Company
or to cease operations, or has no realistic alternative but to do so.
Those charged with governance (inclusive of the Audit Committee) are responsible for overseeing the

AU Optronics 2019 Annual Report
197
Appendix 2
Company’s financial reporting process.
Auditor’s Responsibilities for the Audit of the Parent Company Only Financial Statements
Our objectives are to obtain reasonable assurance about whether the parent company only financial
statements as a whole are free from material misstatement, whether due to fraud or error, and to issue an
auditors’ report that includes our opinion. Reasonable assurance is a high level of assurance, but is not a
guarantee that an audit conducted in accordance with the auditing standards generally accepted in the
Republic of China will always detect a material misstatement when it exists. Misstatements can arise from
fraud or error and are considered material if, individually or in the aggregate, they could reasonably be
expected to influence the economic decisions of users taken on the basis of these parent company only
financial statements.
As part of an audit in accordance with auditing standards generally accepted in the Republic of China, we
exercised professional judgment and maintained professional skepticism throughout the audit. We also:
1. Identified and assessed the risks of material misstatement of the parent company only financial
statements, whether due to fraud or error, design and perform audit procedures responsive to those risks,
and obtain audit evidence that is sufficient and appropriate to provide a basis for our opinion. The risk of
not detecting a material misstatement resulting from fraud is higher than for one resulting from error, as
fraud may involve collusion, forgery, intentional omissions, misrepresentations, or the override of
internal control.
2. Obtained an understanding of internal control relevant to the audit in order to design audit procedures
that are appropriate in the circumstances, but not for the purpose of expressing an opinion on the
effectiveness of the Company’s internal control.
3. Evaluated the appropriateness of accounting policies used and the reasonableness of accounting
estimates and related disclosures made by management.
4. Concluded on the appropriateness of management’s use of the going concern basis of accounting and,
based on the audit evidence obtained, whether a material uncertainty exists related to events or
conditions that may cast significant doubt on the Company’s ability to continue as a going concern. If
we conclude that a material uncertainty exists, we are required to draw attention in our auditors’ report to
the related disclosures in the parent company only financial statements or, if such disclosures are
inadequate, to modify our opinion. Our conclusions are based on the audit evidence obtained up to the
date of our auditors’ report. However, future events or conditions may cause the Company to cease to
continue as a going concern.
5. Evaluated the overall presentation, structure and content of the parent company only financial
statements, including the disclosures, and whether the parent company only financial statements
represent the underlying transactions and events in a manner that achieves fair presentation.
6. Obtained sufficient and appropriate audit evidence regarding the financial information of the entities or
business activities within the Company to express an opinion on the parent company only financial
statements. We are responsible for the direction, supervision and performance of the group audit. We
remain solely responsible for our audit opinion.
We communicated with those charged with governance regarding, among other matters, the planned scope
and timing of the audit and significant audit findings, including any significant deficiencies in internal
control that we identified during our audit.
We also provided those charged with governance with a statement that we have complied with relevant
ethical requirements regarding independence, and communicated with them all relationships and other
matters that may reasonably be thought to bear on our independence, and where applicable, related
safeguards.

AU Optronics 2019 Annual Report
198
From the matters communicated with those charged with governance, we determined those matters that were
of most significance in the audit of the parent company only financial statements of the current period and
are therefore the key audit matters. We describe these matters in our auditors’ report unless law or regulation
precludes public disclosure about the matter or when, in extremely rare circumstances, we determine that a
matter should not be communicated in our report because the adverse consequences of doing so would
reasonably be expected to outweigh the public interest benefits of such communication.
The engagement partners on the audit resulting in this independent auditors’ report are Wei, Shing-Hai and
Lu, Chien-Hui.
KPMG
Hsinchu, Taiwan (Republic of China)
February 25, 2020
Notice to Readers
The accompanying parent company only financial statements are intended only to present the financial position, financial
performance, and cash flows in accordance with the Regulations Governing the Preparation of Financial Reports by Securities
Issuers. The standards, procedures and practices to audit such parent company only financial statements are those generally
accepted and applied in the Republic of China.
The independent auditors’ report and the accompanying parent company only financial statements are the English translation of the
Chinese version prepared and used in the Republic of China. If there is any conflict between, or any difference in the interpretation of
the English version and Chinese version, the Chinese-language independent auditors’ report and parent company only financial
statements shall prevail.

AU
Optro
nics
2019 A
nnual R
epo
rt
Appendix
2 199
AU OPTRONICS CORP.
Balance Sheets
December 31, 2019 and 2018 (Expressed in thousands of New Taiwan dollars)
December 31,
2019 2018
Assets Amount % Amount %
Current assets:
1100 Cash and cash equivalents (Note 6(1)) $ 45,928,070 13 30,316,278 9
1110 Financial assets at fair value through profit or
loss-current (Note 6(2)) 18,753 - 52,434 -
1170 Accounts receivable, net (Note 6(4)) 26,986,723 8 41,612,155 12
1180 Accounts receivable from related parties, net
(Notes 6(4)&7) 1,938,966 1 4,625,330 1
1210 Other receivables from related parties (Note 7) 1,211,588 - 27,905 -
1220 Current tax assets 28,303 - 26,282 -
130X Inventories (Note 6(5)) 17,256,261 5 20,209,268 6
1476 Other current financial assets (Note 6(4)) 1,111,904 - 304,164 -
1479 Other current assets (Note 6(12)) 1,836,890 1 1,754,804 -
98,317,458 28 98,928,620 28
Noncurrent assets:
1517 Financial assets at fair value through other
comprehensive income-noncurrent (Note 6(3)) 7,140,410 2 6,604,041 2
1550 Investments in equity-accounted investees (Notes
6(6)&(7)) 70,184,815 20 73,281,985 21
1600 Property, plant and equipment (Notes 6(8),7&8) 144,142,738 42 148,448,632 43
1755 Right-of-use assets (Note 6(9)) 9,346,877 3 - -
1760 Investment property (Note 6(10)&8) 465,868 - 539,436 -
1780 Intangible assets (Note 6(11)) 12,051,761 3 12,476,746 4
1840 Deferred tax assets (Note 6(24)) 4,265,480 1 5,151,811 1
1900 Other noncurrent assets (Notes 6(12)&8) 1,749,460 1 1,973,250 1
249,347,409 72 248,475,901 72
Total Assets $ 345,664,867 100 347,404,521 100
December 31,
2019 2018
Liabilities and Equity Amount % Amount %
Current liabilities:
2120 Financial liabilities at fair value through profit or
loss-current (Note 6(2)) $ 7,054 - 13,973 -
2170 Accounts payable 24,296,415 7 29,179,096 9
2180 Accounts payable to related parties (Note 7) 25,325,274 8 31,270,499 9
2213 Equipment and construction payable (Note 7) 4,568,963 1 7,125,831 2
2220 Other payables to related parties (Note 7) 405,656 - 224,886 -
2230 Current tax liabilities - - 1,267,055 -
2250 Provisions-current (Note 6(15)) 666,896 - 1,395,690 -
2280 Lease liabilities-current (Note 6(9)) 415,981 - - -
2399 Other current liabilities 13,584,470 4 17,353,370 5
2322 Current installments of long-term borrowings
(Notes 6(13)&8) 4,000,000 1 22,212,000 7
73,270,709 21 110,042,400 32
Noncurrent liabilities:
2540 Long-term borrowings, excluding current
installments (Notes 6(13)&8) 81,966,110 24 29,733,545 9
2550 Provisions-noncurrent (Note 6(15)) 805,729 - 777,445 -
2570 Deferred tax liabilities (Note 6(24)) 2,213,429 1 2,356,782 1
2580 Lease liabilities-noncurrent (Note 6(9)) 9,009,594 3 - -
2600 Other noncurrent liabilities (Note 6(16)) 1,727,456 - 1,631,634 -
95,722,318 28 34,499,406 10
Total liabilities 168,993,027 49 144,541,806 42
Equity (Note 6(17)):
3100 Common stock 96,242,451 28 96,242,451 28
3200 Capital surplus 60,544,474 18 60,622,043 17
3300 Retained earnings 22,903,722 6 46,845,991 13
3400 Other components of equity (2,005,384) (1) (847,770) -
3500 Treasury stock (1,013,423) - - -
Total equity 176,671,840 51 202,862,715 58
Total Liabilities and Equity $ 345,664,867 100 347,404,521 100
See accompanying notes to the parent company only financial statements
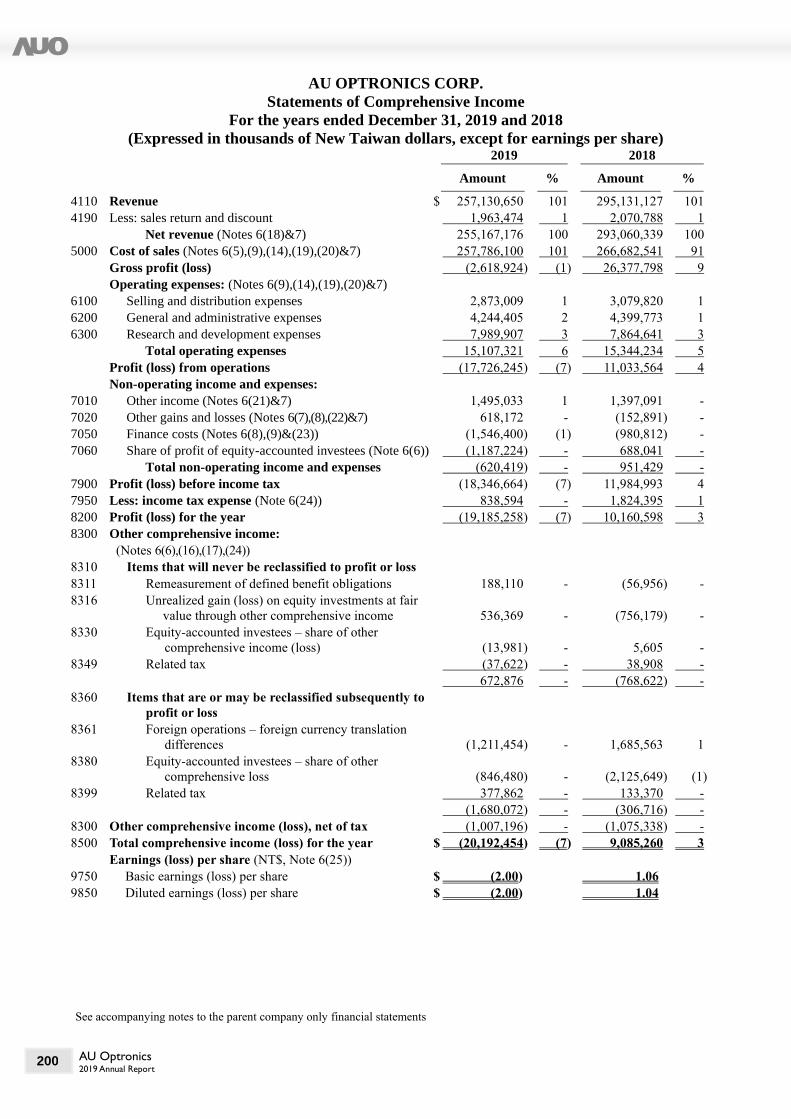
AU Optronics 2019 Annual Report
200
AU OPTRONICS CORP.
Statements of Comprehensive Income
For the years ended December 31, 2019 and 2018
(Expressed in thousands of New Taiwan dollars, except for earnings per share) 2019 2018
Amount % Amount %
4110 Revenue $ 257,130,650 101 295,131,127 101
4190 Less: sales return and discount 1,963,474 1 2,070,788 1
Net revenue (Notes 6(18)&7) 255,167,176 100 293,060,339 100
5000 Cost of sales (Notes 6(5),(9),(14),(19),(20)&7) 257,786,100 101 266,682,541 91
Gross profit (loss) (2,618,924) (1) 26,377,798 9
Operating expenses: (Notes 6(9),(14),(19),(20)&7)
6100 Selling and distribution expenses 2,873,009 1 3,079,820 1
6200 General and administrative expenses 4,244,405 2 4,399,773 1
6300 Research and development expenses 7,989,907 3 7,864,641 3
Total operating expenses 15,107,321 6 15,344,234 5
Profit (loss) from operations (17,726,245) (7) 11,033,564 4
Non-operating income and expenses:
7010 Other income (Notes 6(21)&7) 1,495,033 1 1,397,091 -
7020 Other gains and losses (Notes 6(7),(8),(22)&7) 618,172 - (152,891) -
7050 Finance costs (Notes 6(8),(9)&(23)) (1,546,400) (1) (980,812) -
7060 Share of profit of equity-accounted investees (Note 6(6)) (1,187,224) - 688,041 -
Total non-operating income and expenses (620,419) - 951,429 -
7900 Profit (loss) before income tax (18,346,664) (7) 11,984,993 4
7950 Less: income tax expense (Note 6(24)) 838,594 - 1,824,395 1
8200 Profit (loss) for the year (19,185,258) (7) 10,160,598 3
8300 Other comprehensive income:
(Notes 6(6),(16),(17),(24))
8310 Items that will never be reclassified to profit or loss
8311 Remeasurement of defined benefit obligations 188,110 - (56,956) -
8316 Unrealized gain (loss) on equity investments at fair
value through other comprehensive income 536,369 - (756,179) -
8330 Equity-accounted investees – share of other
comprehensive income (loss) (13,981) - 5,605 -
8349 Related tax (37,622) - 38,908 -
672,876 - (768,622) -
8360 Items that are or may be reclassified subsequently to
profit or loss
8361 Foreign operations – foreign currency translation
differences (1,211,454) - 1,685,563 1
8380 Equity-accounted investees – share of other
comprehensive loss (846,480) - (2,125,649) (1)
8399 Related tax 377,862 - 133,370 -
(1,680,072) - (306,716) -
8300 Other comprehensive income (loss), net of tax (1,007,196) - (1,075,338) -
8500 Total comprehensive income (loss) for the year $ (20,192,454) (7) 9,085,260 3
Earnings (loss) per share (NT$, Note 6(25))
9750 Basic earnings (loss) per share $ (2.00) 1.06
9850 Diluted earnings (loss) per share $ (2.00) 1.04
See accompanying notes to the parent company only financial statements

AU
Optro
nics
2019 A
nnual R
epo
rt
(Continued)
See accompanying notes to the parent company only financial statements
Appendix
2
201
AU OPTRONICS CORP. Statements of Changes in Equity
For the years ended December 31, 2019 and 2018 (Expressed in thousands of New Taiwan dollars)
Capital
Stock Retained Earnings
Other Components of Equity
Common
Stock
Capital
Surplus
Legal
Reserve
Special
Reserve
Unappropriate
d Earnings Subtotal
Cumulative
Translation
Differences
Unrealized
Gains (Losses)
on Financial Assets at
Fair Value through
Other
Comprehensive
Income (Loss)
Unrealized
Gains (Losses)
on Available-for-
sale Financial
Assets Subtotal
Treasury
Shares
Total
Equity
Balance at January 1, 2018 $ 96,242,451 60,540,326 3,439,686 - 47,675,843 51,115,529 (1,120,969) - 1,377,031 256,062 - 208,154,368
Adjustments on initial application of
new standards
- - - - 73,020 73,020 - 1,303,816 (1,377,031) (73,215) - (195)
Adjusted balance at January 1, 2018 96,242,451 60,540,326 3,439,686 - 47,748,863 51,188,549 (1,120,969) 1,303,816 - 182,847 - 208,154,173
Appropriation of earnings
Legal reserve - - 3,235,942 - (3,235,942) - - - - - - -
Cash dividends distributed to
shareholders
- - - - (14,436,368) (14,436,368) - - - - - (14,436,368)
Profit for the year - - - - 10,160,598 10,160,598 - - - - - 10,160,598
Other comprehensive income (loss), net
of tax
- - - - (16,862) (16,862) (306,716) (751,760) - (1,058,476) - (1,075,338)
Total comprehensive income (loss) for
the year
- - - - 10,143,736 10,143,736 (306,716) (751,760) - (1,058,476) - 9,085,260
Changes in deemed contributions from
shareholders
- 33,304 - - - - - - - - - 33,304
Adjustments for changes in investees’
equity
- 28,889 - - 158 158 - - - - - 29,047
Group reorganization - 19,524 - - - - (22,225) - - (22,225) - (2,701)
Disposal of equity investments measured
at fair value through other
comprehensive income
- - - - (50,084) (50,084) - 50,084 - 50,084 - -
Balance at December 31, 2018 96,242,451 60,622,043 6,675,628 - 40,170,363 46,845,991 (1,449,910) 602,140 - (847,770) - 202,862,715
Appropriation of earnings
Legal reserve - - 1,016,060 - (1,016,060) - - - - - - -
Special reserve - - - 847,770 (847,770) - - - - - - -
Cash dividends distributed to
shareholders - - - - (4,812,122) (4,812,122) - - - - - (4,812,122)
Loss for the year - - - - (19,185,258) (19,185,258) - - - - - (19,185,258)
Other comprehensive income (loss), net
of tax - - - - 150,418 150,418 (1,680,072) 522,458 - (1,157,614) - (1,007,196)
Total comprehensive income (loss) for
the year - - - - (19,034,840) (19,034,840) (1,680,072) 522,458 - (1,157,614) - (20,192,454)
Changes in deemed contributions from
shareholders - 547 - - - - - - - - - 547
Treasury shares acquired - - - - - - - - - - (1,013,423) (1,013,423)
Adjustments for changes in investees’
equity - (40,085) - - - - - - - - - (40,085)
Changes in ownership interest in
subsidiaries - (15,749) - - (95,307) (95,307) - - - - - (111,056)
Differences between acquisition price
and carrying amount arising from
acquisition of subsidiaries - (22,282) - - - - - - - - - (22,282)
Balance at December 31, 2019 $ 96,242,451 60,544,474 7,691,688 847,770 14,364,264 22,903,722 (3,129,982) 1,124,598 - (2,005,384) (1,013,423) 176,671,840
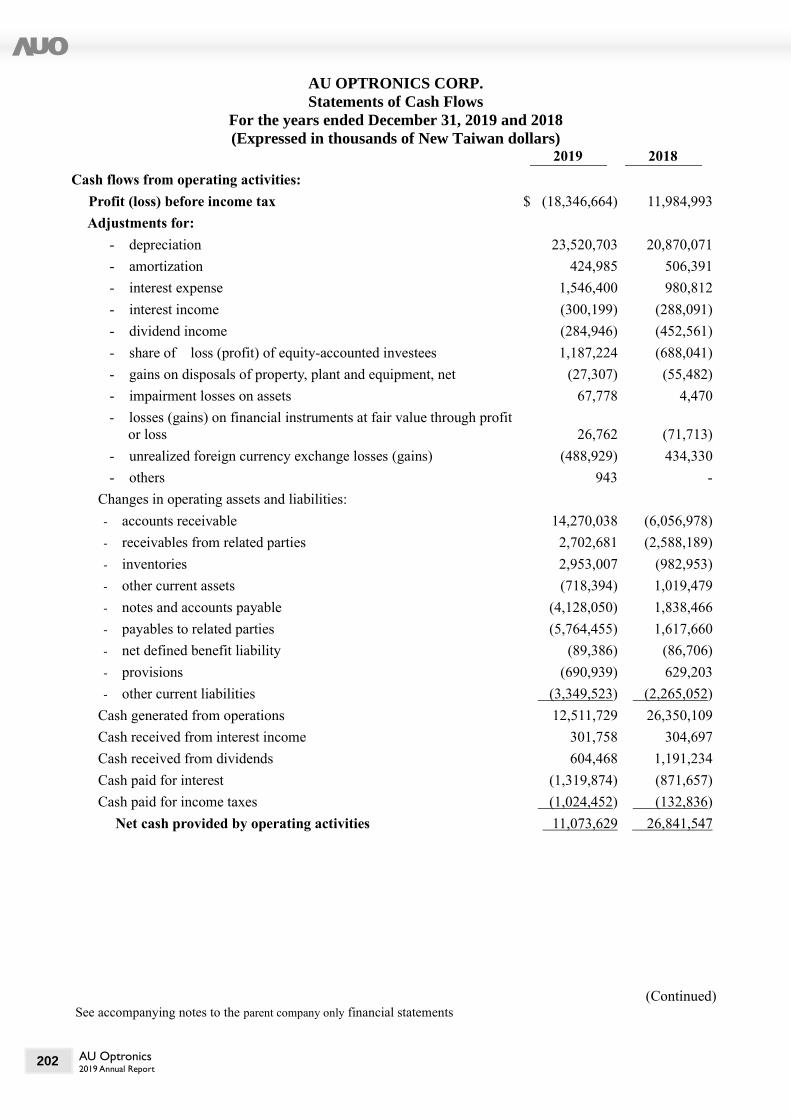
AU Optronics 2019 Annual Report
202
AU OPTRONICS CORP.
Statements of Cash Flows
For the years ended December 31, 2019 and 2018
(Expressed in thousands of New Taiwan dollars)
2019 2018
Cash flows from operating activities:
Profit (loss) before income tax $ (18,346,664) 11,984,993
Adjustments for:
- depreciation 23,520,703 20,870,071
- amortization 424,985 506,391
- interest expense 1,546,400 980,812
- interest income (300,199) (288,091)
- dividend income (284,946) (452,561)
- share of loss (profit) of equity-accounted investees 1,187,224 (688,041)
- gains on disposals of property, plant and equipment, net (27,307) (55,482)
- impairment losses on assets 67,778 4,470
- losses (gains) on financial instruments at fair value through profit
or loss 26,762 (71,713)
- unrealized foreign currency exchange losses (gains) (488,929) 434,330
- others 943 -
Changes in operating assets and liabilities:
- accounts receivable 14,270,038 (6,056,978)
- receivables from related parties 2,702,681 (2,588,189)
- inventories 2,953,007 (982,953)
- other current assets (718,394) 1,019,479
- notes and accounts payable (4,128,050) 1,838,466
- payables to related parties (5,764,455) 1,617,660
- net defined benefit liability (89,386) (86,706)
- provisions (690,939) 629,203
- other current liabilities (3,349,523) (2,265,052)
Cash generated from operations 12,511,729 26,350,109
Cash received from interest income 301,758 304,697
Cash received from dividends 604,468 1,191,234
Cash paid for interest (1,319,874) (871,657)
Cash paid for income taxes (1,024,452) (132,836)
Net cash provided by operating activities 11,073,629 26,841,547
(Continued) See accompanying notes to the parent company only financial statements
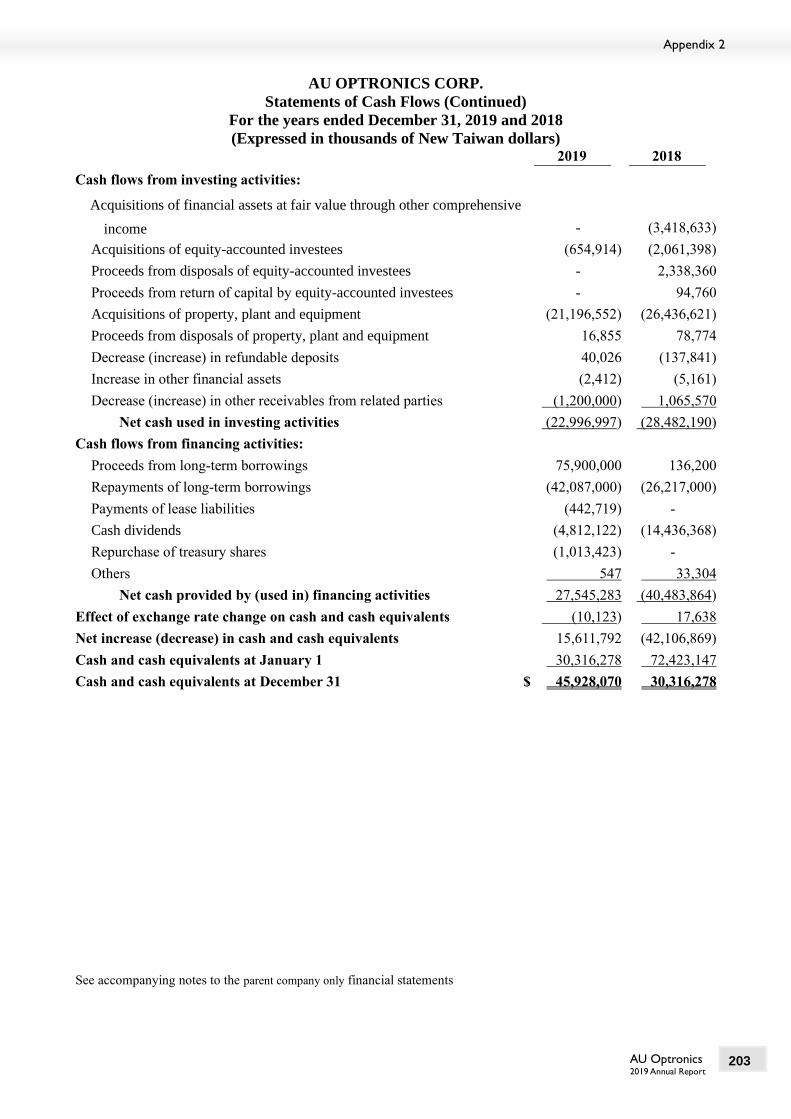
AU Optronics 2019 Annual Report
Appendix 2
203
AU OPTRONICS CORP.
Statements of Cash Flows (Continued)
For the years ended December 31, 2019 and 2018
(Expressed in thousands of New Taiwan dollars)
2019 2018
Cash flows from investing activities:
Acquisitions of financial assets at fair value through other comprehensive
income - (3,418,633)
Acquisitions of equity-accounted investees (654,914) (2,061,398)
Proceeds from disposals of equity-accounted investees - 2,338,360
Proceeds from return of capital by equity-accounted investees - 94,760
Acquisitions of property, plant and equipment (21,196,552) (26,436,621)
Proceeds from disposals of property, plant and equipment 16,855 78,774
Decrease (increase) in refundable deposits 40,026 (137,841)
Increase in other financial assets (2,412) (5,161)
Decrease (increase) in other receivables from related parties (1,200,000) 1,065,570
Net cash used in investing activities (22,996,997) (28,482,190)
Cash flows from financing activities:
Proceeds from long-term borrowings 75,900,000 136,200
Repayments of long-term borrowings (42,087,000) (26,217,000)
Payments of lease liabilities (442,719) -
Cash dividends (4,812,122) (14,436,368)
Repurchase of treasury shares (1,013,423) -
Others 547 33,304
Net cash provided by (used in) financing activities 27,545,283 (40,483,864)
Effect of exchange rate change on cash and cash equivalents (10,123) 17,638
Net increase (decrease) in cash and cash equivalents 15,611,792 (42,106,869)
Cash and cash equivalents at January 1 30,316,278 72,423,147
Cash and cash equivalents at December 31 $ 45,928,070 30,316,278
See accompanying notes to the parent company only financial statements

AU Optronics 2019 Annual Report
(Continued)
204
AU OPTRONICS CORP.
Notes to Parent Company Only Financial Statements
For the years ended December 31, 2019 and 2018
(Expressed in thousands of New Taiwan dollars, unless otherwise indicated)
1. Organization
AU Optronics Corp. (“AUO” or “the Company”) was founded on August 12, 1996 and is located in
Hsinchu Science Park, the Republic of China (“ROC”). AUO’s main activities are the research,
development, production and sale of thin film transistor liquid crystal displays (“TFT-LCDs”) and other
flat panel displays used in a wide variety of applications. AUO also engages in the production and sale of
solar modules and systems. AUO’s common shares have been publicly listed on the Taiwan Stock
Exchange since September 2000, and its American Depositary Shares (“ADSs”) have been listed on the
New York Stock Exchange (“NYSE”) since May 2002. On and from October 1, 2019, AUO’s ADSs has
delisted from the NYSE and begun trading on the over-the-counter (“OTC”) market.
On September 1, 2001, October 1, 2006 and October 1, 2016, Unipac Optoelectronics Corp. (“Unipac”),
Quanta Display Inc. (“QDI”) and Taiwan CFI Co., Ltd. (“CFI”) were merged with and into AUO,
respectively. AUO is the surviving Company, whereas Unipac, QDI and CFI were dissolved. 2. The Authorization of Financial Statements
These parent company only financial statements were approved and authorized for issue by the Board of
Directors of AUO on February 5, 2020. 3. Application of New and Revised Standards, Amendments and Interpretations
(1) Impact of adoption of new, revised or amended standards and interpretations endorsed by the
Financial Supervisory Commission, ROC (“FSC”)
In preparing the accompanying parent company only financial statements, the Company has adopted
the following International Financial Reporting Standards (“IFRS”), International Accounting
Standards (“IAS”), Interpretations developed by the International Financial Reporting Interpretations
Committee (“IFRIC”) or the former Standing Interpretations Committee (“SIC”) issued by the
International Accounting Standards Board (“IASB”) (collectively, “IFRSs”) and endorsed by the
FSC with effective date from January 1, 2019.
New, Revised or Amended Standards and Interpretations Effective Date
Issued by IASB Amendments to IFRS 9, Prepayment Features with Negative
Compensation
January 1, 2019
IFRS 16, Leases January 1, 2019
Amendments to IAS 19, Plan Amendment, Curtailment or Settlement January 1, 2019
Amendments to IAS 28, Long-term Interests in Associates and Joint
Ventures
January 1, 2019
IFRIC 23, Uncertainty over Income Tax Treatments January 1, 2019
Annual Improvements to IFRSs 2015 – 2017 Cycle January 1, 2019

AU Optronics 2019 Annual Report
(Continued)
AU OPTRONICS CORP.
Notes to Parent Company Only Financial Statements
Appendix 2
205
Except for the item discussed below, the adoption of abovementioned standards and interpretations
has not had a material impact on the Company’s accounting policies.
IFRS 16, Leases
IFRS 16 sets out the accounting standards for leases, which replaces IAS 17, Leases and the related
interpretations.
Upon the initial application of IFRS 16, if the Company is a lessee, it is required to recognize a right-
of-use asset and a lease liability on the balance sheet for all leases with exception for leases of low-
value assets and short-term leases which the Company may elect to apply the accounting method
similar to the accounting for operating lease under IAS 17. Additionally, a depreciation expense
charged on the right-of-use asset and an interest expense accrued on the lease liability, for which
interest is computed by using effective interest method, are recognized separately on the statement
of comprehensive income. On the statement of cash flows, cash payments for the principal amount
of the lease liability is classified within financing activities; cash payments for interest portion is
classified within operating activities. See Note 4(13) for an explanation of the Company’s accounting
policies on leases.
When IFRS 16 became effective, as a lessee, the Company applied this Standard using the modified
retrospective approach with the cumulative effect of the initial application of this Standard
recognized at the date of initial application. Comparative financial information, therefore, has not
been restated. The Company is not required to make any adjustments on transition to IFRS 16 for
leases in which it acts as a lessor, except for a sublease. The Company has accounted for those leases
in accordance with IFRS 16 starting from the date of initial application. On January 1, 2019, based
on the assessment of the remaining contractual terms and conditions agreed in head leases and
subleases, all of the Company’s subleases were classified as operating leases.
As at January 1, 2019, lease liabilities recognized for leases previously classified as an operating
lease under IAS 17, except for leases of low-value asset and short-term leases, were measured at the
present value of the remaining lease payments, discounted using the lessee’s incremental borrowing
rate at the date of initial application. Right-of-use assets were measured at an amount equal to the
lease liabilities, adjusted by the amount of any prepaid or accrued lease payments relating to that
lease. The Company also tested right-of-use assets for impairment applying IAS 36.
In addition, the Company used the following practical expedients when applying IFRS 16 to leases.
a. Applied a single discount rate to a portfolio of leases with reasonably similar characteristics.
b. Applied the exemption not to recognize right-of-use assets and lease liabilities to leases for which
the lease term ends within 12 months of the date of initial application.
c. Excluded initial direct costs from the measurement of the right-of-use assets at the date of initial
application.
d. Used hindsight when determining the lease term if the contract contains options to extend or
terminate the lease.
For leases that were classified as finance leases under IAS 17, the carrying amount of the right-of-
use asset and the lease liability at the date of initial application were determined at the carrying
amount of the lease asset and lease payable under IAS 17 as at December 31, 2018.

AU Optronics 2019 Annual Report
(Continued)
AU OPTRONICS CORP.
Notes to Parent Company Only Financial Statements
206
The weighted average lessee’s incremental borrowing rate applied to lease liabilities recognized by
the Company at January 1, 2019 is 1.82%. The reconciliation between the lease liabilities recognized
and the future minimum lease payments of non-cancellable operating leases on December 31, 2018
is presented as follows:
Amounts
(in thousands)
The future minimum lease payments of non-cancellable operating
leases on December 31, 2018
$ 3,845,080
Other leases in scope of IFRS 16 119,504
Undiscounted amount on January 1, 2019 $ 3,964,584
Discounted amount using the incremental borrowing rate on January 1,
2019
$ 3,639,324
Extension of lease that reasonably certain to be exercised 7,149,661
Lease liabilities recognized on January 1, 2019 $ 10,788,985
The following table summarized the impacts of initially applying IFRS 16 on the Company’s assets,
liabilities and equity as at January 1, 2019.
January 1, 2019
Carrying
amount under
IAS 17 and
related
standards and
interpretations
Adjustments
from changes in
accounting
policies
Carrying
amount under
IFRS 16
(in thousands)
Right-of-use assets $ - 10,788,985 10,788,985
Impacts to total assets $ 10,788,985
Lease liabilities–current $ - 442,879 442,879
Lease liabilities–noncurrent - 10,346,106 10,346,106
Impacts to total liabilities $ 10,788,985
Impacts to total equity $ -
(2) Impact of the IFRSs that have been endorsed by the FSC but not yet in effect
According to Ruling No. 1080323028 issued by the FSC on July 29, 2019, commencing from 2020,
the Company is required to adopt the IFRSs that have been endorsed by the FSC with effective date
from 2020. The related new, revised or amended standards and interpretations are set out below:
New, Revised or Amended Standards and Interpretations Effective Date
Issued by IASB Amendments to IFRS 3, Definition of a Business January 1, 2020
Amendments to IFRS 9, IAS 39 and IFRS 7, Interest Rate Benchmark
Reform
January 1, 2020
Amendments to IAS 1 and IAS 8, Definition of Material January 1, 2020
The Company assesses that the initial adoption of the abovementioned standards would not have any
material impact on its accounting policies.

AU Optronics 2019 Annual Report
(Continued)
AU OPTRONICS CORP.
Notes to Parent Company Only Financial Statements
Appendix 2
207
(3) The IFRSs issued by the IASB but not yet endorsed by the FSC
A summary of the new or/and amended IFRSs issued by the IASB but not yet endorsed by the FSC
is set out below.
New, Revised or Amended Standards and Interpretations Effective Date
Issued by IASB Amendments to IFRS 10 and IAS 28, Sale or Contribution of Assets
between an Investor and its Associate or Joint Venture
Subject to IASB’s
announcement
IFRS 17, Insurance Contracts January 1, 2021
Amendments to IAS 1, Classification of Liabilities as Current or Non-
Current
January 1, 2022
Note: The aforementioned new, revised and amended standards and interpretations are effective for
annual periods beginning on or after the respective effective dates.
As of the date that the accompanying parent company only financial statements were issued, the
Company continues in assessing the impact on its financial position and results of operations as a
result of the application of abovementioned standards and interpretations. The related impact will be
disclosed when the assessment is complete. 4. Summary of Significant Accounting Policies
The significant accounting policies applied in the preparation of these parent company only financial
statements are set out as below. The significant accounting policies have been applied consistently to all
periods presented in these parent company only financial statements.
(1) Statement of compliance
The parent company only financial statements have been prepared in accordance with the
Regulations Governing the Preparation of Financial Reports by Securities Issuers (hereinafter
referred to as “the Regulations”).
(2) Basis of preparation
a. Basis of measurement
The parent company only financial statements have been prepared on the historical cost basis
except for the following material items in the balance sheets:
(i) Financial instruments at fair value through profit or loss (including derivative financial
instruments) (Note 6(2));
(ii) Financial assets at fair value through other comprehensive income (Note 6(3));
(iii) Defined benefit asset (liability) is recognized as the fair value of the plan assets less the
present value of the defined benefit obligation (Note 6(16)).
b. Functional and presentation currency
The functional currency of the Company is determined based on the primary economic
environment in which the entity operates. The parent company only financial statements are
presented in New Taiwan Dollar (“NTD”), which is also the Company’s functional currency.
All financial information presented in NTD has been rounded to the nearest thousand, unless
otherwise noted.

AU Optronics 2019 Annual Report
(Continued)
AU OPTRONICS CORP.
Notes to Parent Company Only Financial Statements
208
(3) Foreign currency transactions and operations
a. Transactions in foreign currencies are translated to the functional currency of the Company at
exchange rates at the dates of the transactions. Monetary assets and liabilities denominated in
foreign currencies at the reporting date are retranslated to the functional currency at the
exchange rate at that date and the resulting exchange differences are included in profit or loss
for the year. Non-monetary assets and liabilities denominated in foreign currencies that are
measured at fair value are retranslated to the functional currency at the exchange rate at the
date when the fair value was determined. The resulting exchange differences are included in
profit or loss for the year except for those arising from the retranslation of non-monetary items
in respect of which gains and losses are recognized directly in other comprehensive income,
in which case, the exchange differences are also recognized directly in other comprehensive
income. Non-monetary items in foreign currencies that are measured at historical cost are
translated using the exchange rate at the date of the transaction.
Exchange differences arising from the effective portion of changes in the fair value of
derivatives that are designated and qualified as cash flow hedges are recognized in other
comprehensive income.
b. For the purpose of presenting parent company only financial statements, the assets and
liabilities of the Company’s foreign operations are translated into NTD using the exchange
rates at each reporting date. Income and expenses of foreign operations are translated at the
average exchange rates for the period unless the exchange rates fluctuate significantly during
the period; in that case, the exchange rates at the dates of the transactions are used. Foreign
currency differences are recognized in other comprehensive income and accumulated in equity.
(4) Classification of current and non-current assets and liabilities
An asset is classified as current when:
a. The asset expected to realize, or intends to sell or consume, in its normal operating cycle;
b. The asset primarily held for the purpose of trading;
c. The asset expected to realize within twelve months after the reporting date; or
d. Cash and cash equivalent excluding the asset restricted to be exchanged or used to settle a
liability for at least twelve months after the reporting date.
All other assets are classified as non-current.
A liability is classified as current when:
a. The liability expected to settle in its normal operating cycle;
b. The liability primarily held for the purpose of trading;
c. The liability is due to be settled within twelve months after the reporting date; or
d. The Company does not have an unconditional right to defer settlement of the liability for at
least twelve months after the reporting date. Terms of a liability that could, at the option of the
counterparty, result in its settlement by the issue of equity instruments, do not affect its
classification.
All other liabilities are classified as non-current.
(5) Cash and cash equivalents
Cash comprises cash balances and demand deposits. Cash equivalents comprise short-term highly
liquid investments that are readily convertible into known amount of cash and are subject to an
insignificant risk of changes in their fair value. Time deposits with short-term maturity but not for
investments and other purposes and are qualified with the aforementioned criteria are classified as
cash equivalent.
AU Optronics 2019 Annual Report
(Continued)
AU OPTRONICS CORP.
Notes to Parent Company Only Financial Statements
Appendix 2
209
(6) Financial instruments
a. Financial assets
(i) Classification of financial assets
The Company classifies financial assets into the following categories: financial assets at
amortized cost, financial assets at fair value through other comprehensive income and
financial assets at fair value through profit or loss. When, and only when, the Company
changes its business model for managing financial assets it shall reclassify all affected
financial assets.
(a) Financial assets at amortized cost
A financial asset is measured at amortized cost if it meets both of the following
conditions and is not designated as measured at fair value through profit or loss:
i. it is held within a business model whose objective is to hold financial assets to
collect contractual cash flows; and
ii. its contractual terms give rise on specified dates to cash flows that are solely
payments of principal and interest on the principal amount outstanding.
Such financial assets are initially recognized at fair value, plus any directly attributable
transaction costs. Subsequently, these assets are measured at amortized cost using the
effective interest method, less any impairment losses. Interest income, foreign
exchange gains and losses, and recognition (reversal) of impairment losses, are
recognized in profit or loss.
(b) Financial assets at fair value through other comprehensive income
On initial recognition, the Company is able to make an irrevocable election to present
subsequent changes in the fair value of investments in equity instruments that is not
held for trading in other comprehensive income. This election is made on an
instrument-by-instrument basis.
Such financial assets are initially recognized at fair value, plus any directly attributable
transaction costs. Subsequent to initial recognition, they are measured at fair value and
changes therein are recognized in other comprehensive income and accumulated in
equity-unrealized gains (losses) on financial assets at fair value through other
comprehensive income, except for dividends deriving from equity investments which
are recognized in profit or loss unless the dividend clearly represents a recovery of
part of the cost of the investment. When an investment is derecognized, the cumulative
gain or loss in equity will not be reclassified to profit or loss, instead, is reclassified to
retained earnings.
Dividends on investments in equity instruments are recognized on the date that the
Company’s right to receive the dividends is established.
(c) Financial assets at fair value through profit or loss
All financial assets not classified as at amortized cost or at fair value through other
comprehensive income as described above are measured at fair value through profit
or loss. This includes all derivative financial assets.
Such financial assets are initially recognized at fair value, and attributable transaction
costs are recognized in profit or loss as incurred. Subsequent to initial recognition,
they are measured at fair value and changes therein are recognized in profit or loss.

AU Optronics 2019 Annual Report
(Continued)
AU OPTRONICS CORP.
Notes to Parent Company Only Financial Statements
210
(ii) Impairment of financial assets
The Company recognizes loss allowances for expected credit losses on financial assets at
amortized cost, including cash and cash equivalents, receivables, refundable deposits and
other financial assets, etc., and contract assets. Loss allowances for financial assets are
deducted from the gross carrying amount of the assets. The recognition or reversal of the
loss allowance is recognized in profit or loss.
The expected credit loss is the weighted average of credit losses with the respective risks
of a default occurring on the financial instrument as the weights.
The Company measures the loss allowance for a financial instrument at an amount equal
to lifetime expected credit losses, except for the financial instrument that is determined to
have low credit risk at the reporting date and the credit risk thereof has not increased
significantly since initial recognition, which is measured at an amount equal to the 12-
month expected credit losses. For trade receivables and contract assets, the Company
measures their loss allowances at an amount equal to lifetime expected credit losses.
When determining whether the credit risk of a financial asset has increased significantly
since initial recognition, the Company considers reasonable and supportable information
that is relevant. This includes both qualitative and quantitative information and analysis,
based on the Company’s historical experience and credit assessment as well as forward-
looking information.
In the circumstance that a financial asset is past due or the borrower is unlikely to pay its
credit obligations to the Company in full, the Company considers the credit risk on that
financial asset has significantly increased, or further, to be in default.
At each reporting date, the Company assesses whether financial assets at amortized cost
are credit-impaired. A financial asset is “credit-impaired” when one or more events that
have a detrimental impact on the estimated future cash flows of the financial asset have
occurred.
(iii) De-recognition of financial assets
The Company derecognizes financial assets when the contractual rights to the cash flows
from the asset expire, or when the Company transfers substantially all the risks and rewards
of ownership of the financial assets to another entity.
b. Financial liabilities
(i) Classification of financial liabilities
The Company classifies financial liabilities into the following categories: financial liabilities
at fair value through profit or loss and other financial liabilities.
(a) Financial liabilities at fair value through profit or loss
The Company designates financial liabilities as held for trading for the purpose of
hedging exposure to foreign exchange risk arising from operating and financing
activities. When a financial liability is not effective as a hedge, the Company accounts
for it as a financial liability at fair value through profit or loss.
The Company designates financial liabilities, other than the one mentioned above, as
at fair value through profit or loss at initial recognition. Attributable transaction costs
are recognized in profit or loss as incurred. Financial liabilities in this category are
subsequently measured at fair value and changes therein, which takes into account any
interest expense, are recognized in profit or loss.

AU Optronics 2019 Annual Report
(Continued)
AU OPTRONICS CORP.
Notes to Parent Company Only Financial Statements
Appendix 2
211
(b) Other financial liabilities
Financial liabilities not classified as held for trading, or not designated as at fair value
through profit or loss (including loans and borrowings, trade and other payables), are
measured at fair value, plus any directly attributable transaction cost at the time of
initial recognition. Subsequent to initial recognition, they are measured at amortized
cost calculated using the effective interest method, except for insignificant recognition
of interest expense from short-term borrowings and payables. Interest expense not
capitalized as an asset cost is recognized in profit or loss.
(ii) De-recognition of financial liabilities
The Company derecognizes financial liabilities when the contractual obligation has been
discharged, cancelled or expired. The difference between the carrying amount and the
consideration paid or payable, including any non-cash assets transferred or liabilities
assumed is recognized in profit or loss.
c. Offsetting of financial assets and liabilities
The Company presents financial assets and liabilities on a net basis in the balance sheet when the
Company has the legally enforceable rights to offset, and intends to settle such financial assets and
liabilities on a net basis or to realize the assets and settle the liabilities simultaneously.
(7) Inventories
The cost of inventories includes all necessary expenditures and charges for bringing the inventory
to a stable, useable and marketable condition and location. The production overhead is allocated to
finished goods and work in progress based on the normal capacity of the production facilities.
Subsequently, inventories are measured at the lower of cost and net realizable value. Cost is
determined using the weighted-average method. Net realizable value is calculated based on the
estimated selling price less all estimated costs of completion and the estimated costs necessary to
make the sale.
(8) Noncurrent assets held for sale
Noncurrent assets are classified as held for sale when their carrying amounts are expected to be
recovered primarily through sale rather than through continuing use. Such noncurrent assets must
be available for immediate sale in their present condition and the sale is highly probable within one
year. When classified as held for sale, the assets are measured at the lower of their carrying amount
and fair value less costs to sell. Impairment losses on initial classification as held for sale and
subsequent gains or losses on re-measurement are recognized in profit or loss. However, subsequent
gains are not recognized in excess of the cumulative impairment loss that has been recognized.
When intangible assets and property, plant and equipment are classified as held for sale, they are no
longer amortized or depreciated. In addition, once an equity-accounted investee is classified as held
for sale, it is no longer equity accounted.
(9) Investments in associates and joint ventures
Associates are those entities in which the Company together with its subsidiaries have the power to
exercise significant influence, but not control or joint control, over their financial and operating
policies.
Joint venture is a joint arrangement whereby the Company and other parties agreed to share the
control of the arrangement, and have rights to the net assets of the arrangement. Unanimous consent
from the parties sharing control is required when making decisions for the relevant activities of the
arrangement.
Investments in associates or joint ventures are accounted for using the equity method and are
recognized initially at cost. The cost of the investment includes transaction costs. The parent
company only financial statements include the Company’s share of the profit or loss and other
comprehensive income of associates or joint ventures, after adjustments are made to align their

AU Optronics 2019 Annual Report
(Continued)
AU OPTRONICS CORP.
Notes to Parent Company Only Financial Statements
212
accounting policies with those of the Company. When an associate or a joint venture incurs changes
in its equity not derived from profit or loss and other comprehensive income, the Company
recognizes all the equity changes in proportion to its ownership interest in the associate or joint
venture as capital surplus provided that the ownership interest in the associate or joint venture
remains unchanged.
The difference between acquisition cost and fair value of associates’ or joint ventures’ identifiable
assets and liabilities as of the acquisition date is accounted for as goodwill. Goodwill is included in
the original investment cost of acquired associates or joint ventures and is not amortized. If the fair
value of identified assets and liabilities is in excess of acquisition cost, the remaining excess over
acquisition cost is recognized as a gain in profit or loss.
The Company discontinues the use of the equity method from the date when its investment ceases
to be an associate or a joint venture, and then measures the retained interests at fair value at that date.
The difference between the carrying amount of the investment at the date the equity method was
discontinued and the fair value of the retained interests along with any proceeds from disposing of
a part interest in the associate or joint venture is recognized in profit or loss. Moreover, the Company
accounts for all amounts previously recognized in other comprehensive income in relation to that
investment on the same basis as would be required if the investee had directly disposed of the related
assets or liabilities.
When the Company subscribes for additional shares in an associate or a joint venture at a percentage
different from its existing ownership percentage, the resulting carrying amount of the investment
differs from the amount of the Company’s proportionate interest in the net assets of the associate or
joint venture. The Company records such a difference as an adjustment to investments with the
corresponding amount charged or credited to capital surplus. If the capital surplus arising from
investment accounted for under the equity method in associates or joint ventures is insufficient to
offset with the said corresponding amount, the differences will be charged or credited to retained
earnings.
If the Company’s ownership interest in an associate or a joint venture is reduced due to disposal of
or disproportionate subscription to the shares, but the Company continues to apply the equity
method, the Company shall reclassify to profit or loss the proportion of the gain or loss that had
previously been recognized in other comprehensive income relating to that reduction in ownership
interest on the same basis as would be required if the investee had directly disposed of the related
assets or liabilities.
At the end of each reporting period, if there is any indication of impairment, the entire carrying
amount of the investment including goodwill is tested for impairment as a single asset, by
comparing its recoverable amount with its carrying amount. An impairment loss recognized forms
part of the carrying amount of the investment in associates or joint ventures. Accordingly, any
reversal of that impairment loss is recognized to the extent that the recoverable amount of the
investment subsequently increases.
Profits and losses resulting from the transactions between the Company and associates or joint
ventures are recognized in the Company’s parent company only financial statements only to the
extent of interests in the associate or joint venture that are not related to the Company.
When the Company’s share of losses exceeds its interest in an associate or a joint venture, the
carrying amount of that interest, including any long-term investments that form part thereof, is
reduced to zero, and the recognition of further losses is discontinued except to the extent that the
Company has a legal or constructive obligation, or has made payments on behalf of the investee.
(10) Investment in subsidiaries
The investees which are controlled by the Company are measured under equity method in preparing
the parent company only financial statement. The profit or loss, other comprehensive income and

AU Optronics 2019 Annual Report
(Continued)
AU OPTRONICS CORP.
Notes to Parent Company Only Financial Statements
Appendix 2
213
equity in the parent company only financial statement are equal to the profit or loss, other
comprehensive income and equity attributable to the shareholders of parent in the consolidated
financial statement. The Company prepares the consolidated financial statement quarterly
comprising of AUO and its subsidiaries.
Changes in the Company’s ownership interests in subsidiaries that do not result in the Company
losing of control over the subsidiary are accounted for as equity transaction.
(11) Investment property
Investment property is the property held either to earn rental income or for capital appreciation or
for both, but not for sale in the ordinary course of business, use in the production or supply of goods
or services or for administrative purposes. Investment property is measured at cost on initial
recognition. Subsequent to initial recognition, investment properties are measured using the cost
model. Depreciation is charged and recognized in non-operating income and expenses based on
the depreciable amount. Depreciation methods, useful lives and residual values are in accordance
with the policy of property, plant and equipment. Cost includes expenditure that is directly
attributable to the acquisition of the investment property.
An investment property is reclassified to property, plant and equipment at its carrying amount when
the use of the investment property changes.
(12) Property, plant and equipment
a. Recognition and measurement
Items of property, plant and equipment are measured at cost less accumulated depreciation and
accumulated impairment losses. Cost includes expenditure that is directly attributed to the
acquisition of the asset, any cost directly attributable to bringing the asset to the location and
condition necessary for it to be capable of operating in the manner intended by management,
the initial estimate of the costs of dismantling and removing the item and restoring the site on
which it is located, and any borrowing cost that is eligible for capitalization. The cost of the
software is capitalized as part of the equipment if the purchase of the software is necessary for
the equipment to be capable of operating.
When part of an item of property, plant and equipment with a cost that is significant in relation
to the total cost of the item and the useful life or the depreciation method of the significant part
is different from another significant part of that same item, it is accounted for as a separate
item (significant component) of property, plant and equipment.
The gain or loss arising from the derecognition of an item of property, plant and equipment is
determined as the difference between the net disposal proceeds, if any, and the carrying amount
of the item, and is recognized in profit or loss.
b. Subsequent costs
Subsequent expenditure is capitalized only when it is probable that the future economic
benefits associated with the expenditure will flow to the Company and the cost of the item can
be measured reliably. Ongoing repairs and maintenance expenses are recognized in profit or
loss as incurred.
c. Depreciation
Depreciation is determined by depreciable amount allocated over the estimated useful lives of
the respective assets, considering significant components of an individual asset on a straight-
line basis. If a component has a useful life that is different from the remainder of that asset,
that component is depreciated separately. Depreciation charge is recognized in profit or loss.
Leased assets are depreciated over their useful lives if it is reasonably certain that the Company
will obtain ownership by the end of the lease term. Otherwise, leased assets are depreciated
over the shorter of the lease term and their useful lives.
Except for land, which is not depreciated, the estimated useful lives of the assets are as follows:

AU Optronics 2019 Annual Report
(Continued)
AU OPTRONICS CORP.
Notes to Parent Company Only Financial Statements
214
(i) Buildings: 20~50 years
(ii) Machinery and equipment: 3~10 years
(iii) Other equipment: 3~6 years
Depreciation methods, useful lives, and residual values are reviewed at each annual reporting
date and, if necessary, adjusted as appropriate. Any changes therein are accounted for as
changes in accounting estimates.
d. Reclassification to investment property
A property is reclassified to investment property at its carrying amount when the use of the
property changes from owner-occupied to investment purpose.
(13) Leases
Leases (policy applicable from January 1, 2019)
a. Identifying a lease
A contract is, or contains, a lease when all the following conditions are satisfied:
(i) the contract involves the use of an identified asset, and the supplier does not have a
substantive right to substitute the asset; and
(ii) the Company has the right to obtain substantially all of the economic benefits from use
of the identified asset throughout the period of use; and
(iii) the Company has the right to direct the use of the identified asset throughout the period
of use.
b. As a lessee
Payments for leases of low-value assets and short-term leases are recognized as expenses on a
straight-line basis during the lease term for which the recognition exemption is applied. Except
for leases described above, a right-of-use asset and a lease liability shall be recognized for all
other leases at the lease commencement date.
The Company recognizes a right-of-use asset and a lease liability at the lease commencement
date. The lease liability is initially measured at the present value of the lease payments
(including fixed payments and variable lease payments that depend on an index or a rate),
discounted using the lessee’s incremental borrowing rate. The right-of-use asset is initially
measured at cost, which comprises the initial amount of the lease liability, adjusted for any
lease payments made at or before the commencement date, less any lease incentives received,
plus any initial direct costs incurred and an estimate of costs to be incurred in restoring the
underlying asset.
The right-of-use asset is subsequently depreciated using the straight-line method over the
shorter of the useful life of the right-of-use asset or the lease term. The lease liability is
subsequently measured at amortized cost using the effective interest method. It is remeasured
(i) if there is a change in the lease term; (ii) if there is a change in future lease payments arising
from a change in an index or a rate; (iii) if there is a change in the amounts expected to be
payable under a residual value guarantee; or (iv) if the Company changes its assessment of
whether it will exercise a purchase, extension or termination option. When the lease liability is
remeasured in the circumstances aforementioned, a corresponding adjustment is made to the
carrying amount of the right-of-use asset. However, if the carrying amount of the right-of-use
asset is reduced to zero, any remaining amount of the remeasurement is recognized in profit or
loss.
Moreover, the lease liability is remeasured when lease modifications occur that decrease the
scope of the lease. The Company accounts for the remeasurement of the lease liability by
decreasing the carrying amount of the right-of-use asset to reflect the partial or full termination
of the lease, and recognizes in profit or loss any gain or loss relating to the partial or full
termination of the lease.

AU Optronics 2019 Annual Report
(Continued)
AU OPTRONICS CORP.
Notes to Parent Company Only Financial Statements
Appendix 2
215
c. As a lessor
Lease income from an operating lease is recognized in profit or loss on a straight-line basis
over the lease term. Initial direct costs incurred in negotiating and arranging an operating lease
are added to the carrying amount of the asset leased to others and recognized as an expense on
a straight-line basis over the lease term.
Leases (policy applicable before January 1, 2019)
a. Lessor
Lease income from an operating lease is recognized in profit or loss on a straight-line basis over
the lease term. Initial direct costs incurred in negotiating and arranging an operating lease are
added to the carrying amount of the leased asset, and recognized as an expense on a straight-
line basis over the lease term.
b. Lessee
Payments made under operating lease (excluding insurance and maintenance expenses) are
recognized in profit or loss on a straight-line basis over the term of the lease.
(14) Intangible assets
a. Goodwill
Goodwill is recognized when the purchase price exceeds the fair value of identifiable net assets
acquired in a business combination. Goodwill is measured at cost less accumulated impairment
losses.
Equity-method goodwill is included in the carrying amounts of the equity investments. The
impairment losses for the goodwill within the equity-accounted investees are accounted for as
deductions of carrying amounts of investments in equity-accounted investees.
b. Research and development
During the research phase, activities are carried out to obtain and understand new scientific or
technical knowledge. Expenditures during this phase are recognized in profit or loss as incurred.
Expenditure arising from development is capitalized as an intangible asset when the Company
demonstrates all of the following:
(i) the technical feasibility of completing the intangible asset so that it will be available for
use or sale;
(ii) its intention to complete the intangible asset and use or sell it;
(iii) its ability to use or sell the intangible asset;
(iv) the probability that the intangible asset will generate probable future economic benefits;
(v) the availability of adequate technical, financial and other resources to complete the
development and to use or sell the intangible asset; and
(vi) its ability to measure reliably the expenditure attributable to the intangible asset during
its development.
Development expenditure which fails to meet the criteria for recognition as an intangible asset
is reflected in profit or loss when incurred. Capitalized development expenditure is measured
at cost less accumulated amortization and any accumulated impairment losses.
c. Other intangible assets
Other intangible assets acquired are measured at cost less accumulated amortization and any
accumulated impairment losses.
d. Subsequent expenditure

AU Optronics 2019 Annual Report
(Continued)
AU OPTRONICS CORP.
Notes to Parent Company Only Financial Statements
216
Subsequent expenditure is capitalized only when it increases the future economic benefits
embodied in the specific asset to which it relates. All other expenditure, including expenditure
on internally generated goodwill and brands, is recognized in profit or loss as incurred.
e. Amortization
The depreciable amount of an intangible asset is the cost less its residual value. Other than
goodwill and intangible assets with indefinite useful life, an intangible asset with a finite useful
life is amortized over 3 to 20 years using the straight-line method from the date that the asset
is made available for use. The amortization charge is recognized in profit or loss.
The residual value, amortization period, and amortization method are reviewed at least
annually at each annual reporting date, and any changes therein are accounted for as changes
in accounting estimates.
(15) Impairment – non-financial assets
Other than inventories, deferred tax assets and noncurrent assets held for sale, the carrying amounts
of the Company’s investment property measured at cost and other long-term non-financial assets
(property, plant and equipment, right-of-use assets and other intangible assets with finite useful
lives), are reviewed at the reporting date to determine whether there is any indication of impairment.
When there is an indication of impairment exists for the aforementioned assets, the recoverable
amount of the asset is estimated. If it is not possible to estimate the recoverable amount of an
individual asset, the Company estimates the recoverable amount of the cash-generating unit (“CGU”)
to which the asset has been allocated to.
In performing an impairment test for other long-term non-financial assets, the estimated recoverable
amount is evaluated in terms of an asset or a CGU. Any excess of the carrying amount of the asset
or its related CGU over its recoverable amount is recognized as an impairment loss. The recoverable
amount of an asset or a CGU is the higher of its fair value less costs of disposal and its value in use.
If there is evidence that the accumulated impairment loss of an asset other than goodwill and
intangible assets with indefinite useful lives in prior years no longer exists or has decreased, the
amount previously recognized as an impairment loss is reversed, and the carrying amount of the
asset or CGU is increased to the revised estimate of its recoverable amount. The increased carrying
amount shall not exceed the carrying amount that would have been determined (net of depreciation
or amortization) had no impairment loss been recognized for the asset in prior years.
For goodwill and intangible assets with indefinite useful lives or that are not yet available for use,
are required to be tested for impairment at least annually. Any excess of the carrying amount of the
asset over its recoverable amount is recognized as an impairment loss.
For the purpose of impairment test, goodwill acquired in a business combination is allocated to
CGUs that are expected to benefit from the synergies of the combination. If the recoverable amount
of a CGU is less than its carrying amount, the difference is allocated first to reduce the carrying
amount of any goodwill allocated to the unit, then the carrying amounts of the other assets in the
unit on a pro rata basis. The impairment loss recognized on goodwill is not reversed in a subsequent
period.
(16) Provisions
A provision is recognized when the Company has a present obligation arising from a past event, it
is probable that the Company will be required to make an outflow of resources embodying economic
benefits to settle the obligation, and the amount of the obligation can be estimated reliably.
Provisions are determined by discounting the expected future cash flows at a pre-tax rate that reflects
the current market assessments of the time value of money and the risks specific to the liability. The
unwinding of the discount is recognized as interest expense.
a. Warranties

AU Optronics 2019 Annual Report
(Continued)
AU OPTRONICS CORP.
Notes to Parent Company Only Financial Statements
Appendix 2
217
A provision for warranties is recognized when the underlying products or services are sold.
The provision is weighting factors based on historical experience of warranty claims rate and
other possible outcomes against their associated probabilities.
b. Decommissioning obligation
The Company is subject to decommissioning obligations related to certain items of property,
plant and equipment. Such decommissioning obligations are primarily attributable to clean-up
costs, including deconstruction, transportation, and recover costs. The unwinding of the
discount based on original discount rate is recognized in profit or loss as interest expense over
the periods with corresponding increase in the carrying amounts of the accrued
decommissioning costs. The carrying amount of the accruals at the end of the assets’ useful
lives is the same as the estimated decommissioning costs.
c. Onerous contracts
A provision for onerous contracts is recognized when the expected benefits to be derived by
the Company from a contract are lower than the unavoidable cost of meeting its obligations
under the contract. The provision is measured at the present value of the lower of the expected
cost of terminating the contract and the expected net cost of continuing with the contract.
Before a provision is established, the Company recognizes any impairment loss on the assets
associated with that contract.
d. Loss contingencies
Management periodically assesses the obligation of all litigation and claims and relative legal
costs. Provision for loss contingencies arising from claims, assessments, litigation, fines, and
penalties and other sources are recognized when it is probable the present obligation as a result
of a past event will result in an outflow of resources and the amount can be reasonably
estimated.
Provisions recognized are the best estimates of the expenditure for settling the present
obligation at each reporting date.
(17) Treasury shares
Where the Company repurchases its common stock that has been issued, the consideration paid,
including all directly attributable costs is recorded as treasury share and deducted from equity. When
treasury share is reissued, the excess of sales proceeds over cost is accounted for as capital surplus
– treasury shares. If the sales proceeds are less than cost, the deficiency is accounted for as a
reduction of capital surplus arising from similar types of treasury shares. If such capital surplus is
insufficient to cover the deficiency, the remainder is recorded as a reduction of retained earnings.
The carrying amount of treasury share is calculated using the weighted-average cost of different
types of repurchase.
If treasury share is retired, the weighted-average cost of the retired treasury share is written off
against the par value and the capital surplus premium, if any, of the stock retired on a pro rata basis.
If the weighted-average cost written off exceeds the sum of the par value and the capital surplus
premium, the difference is accounted for as a reduction of capital surplus – treasury shares, or a
reduction of retained earnings for any deficiency where capital surplus – treasury shares is
insufficient to cover the difference. If the weighted-average cost written off is less than the sum of
the par value and the capital surplus premium, if any, of the stock retired, the difference is accounted
for as an increase in capital surplus – treasury shares.
(18) Revenue from contracts with customers
Revenue is measured based on the consideration that the Company expects to be entitled in the
transfer of goods or services to a customer. The Company recognizes revenue when it satisfies a
performance obligation by transferring control over a product or service to a customer. The
following is a description of the Company’s major revenues:

AU Optronics 2019 Annual Report
(Continued)
AU OPTRONICS CORP.
Notes to Parent Company Only Financial Statements
218
a. Sales of goods
Revenue is recognized when the control over a product has been transferred to the customer.
The transfer of control refers to the product has been delivered to and accepted by the customer
without remaining performance obligations from the Company. Delivery occurs when the
product has been shipped to the specified location and the risk of loss over the product has been
transferred to the customer, as well as when the product has been accepted by the customer
according to the terms of sales contract, or when the Company has objective evidence that all
criteria for acceptance have been satisfied.
For certain contracts with volume discounts offer to customers, revenue is recognized on a net
basis of contract price less estimated volume discounts, and only to the extent that it is highly
probable that a significant reversal will not occur. The amount of volume discounts is estimated
based on the expected value with reference to the historical experience, and is recorded as refund
liability (presented under other current liabilities).
Trade receivable is recognized when the Company is entitled for unconditional right to receive
payment upon delivery of goods to customers. The consideration received in advance from the
customer according to the sales contract but without delivery of goods is recognized as a contract
liability, for which revenue is recognized when the control over the goods is transferred to the
customer.
The Company provides standard warranties for goods sold and has obligation to refund
payments for defective goods, in which the Company has recognized provisions for warranties
to fulfill the obligation. Refer to Note 4(16) for further details.
b. Construction contracts
For construction contracts, revenue is recognized progressively based on the progress towards
complete satisfaction of contract activities, and only to the extent that it is highly probable that
a significant reversal in the amount of cumulative revenue recognized will not occur.
If the Company cannot reasonably measure its progress towards complete satisfaction of
performance obligations in accordance with the construction contracts, revenue is recognized
only to the extent of contract costs incurred that it is expected to be recoverable.
The consideration is paid by the customer according to the agreed payment terms. The excess
of the amount that has been recognized as revenue over the amount that the Company has issued
a bill is recognized as a contract asset. When the entitlement to the payment becomes
unconditional, the contract asset is transferred to receivables.
A contract liability is recognized for an advance consideration that the Company has billed to
customers arising from construction contracts. When the construction is completed and accepted
by the customers, the contract liability is transferred to revenue.
If there are changes in circumstances, the estimates of revenue, cost and the progress towards
complete satisfaction of contract will be amended. Any changes therein are recognized in profit
or loss during the period in which the changes and amendments are made.
The Company provides standard warranties for construction contracts and has recognized
provisions for warranties to fulfill the obligation. Refer to Note 4(16) for further details.

AU Optronics 2019 Annual Report
(Continued)
AU OPTRONICS CORP.
Notes to Parent Company Only Financial Statements
Appendix 2
219
c. Financing components
The Company expects that the length of time when the Company transfers the goods or services
to the customer and when the customer pays for those goods or services will be less than one
year. Therefore, the amount of consideration is not adjusted for the time value of money.
(19) Employee benefits
a. Defined contribution plans
Obligations for contributions to defined contribution pension plans are recognized as an
employee benefit expense in profit or loss in the periods during which services are rendered by
employees.
b. Defined benefit plans
The Company’s net obligation in respect of defined benefit pension plans is calculated
separately for each benefit plan by estimating the amount of future benefit that employees have
earned in the current and prior periods, discounting that amount and deducting the fair value
of any plan assets. Discount rate is determined by reference to the yield rate of Taiwan
government bonds at the reporting date. The calculation of defined benefit obligations is
performed annually by a qualified actuary using the Projected Unit Credit Cost Method.
Remeasurements of the net defined benefit liability (asset) which comprise actuarial gains and
losses, the return on plan assets (excluding interest) and the effect of the asset ceiling (if any,
excluding interest), are recognized in other comprehensive income in the period in which they
occur, and which then are reflected in retained earnings and will not be reclassified to profit or
loss.
c. Short-term employee benefits
Short-term employee benefit obligations, which are due to be settled within twelve months are
measured on an undiscounted basis and are expensed as the related service is provided.
The expected cost of cash bonus or profit-sharing plans, which is anticipated to be paid within
one year, are recognized as a liability when the Company has a present legal or constructive
obligation to pay this amount as a result of past service provided by the employee, and the
obligation can be estimated reliably.
(20) Income taxes
Income tax expense comprises current and deferred taxes.
a. Current taxes
Current taxes comprise the expected tax payable or receivable on the taxable income or losses
for the year and any adjustments to tax payable or receivable in respect of previous years. It
is measured using the statutory tax rate or the actual legislative tax rate at the reporting date.
In accordance with the ROC Income Tax Act, undistributed earnings from the companies
located in the Republic of China, if any, is subject to an additional surtax. The surtax on
unappropriated earnings is expensed in the year the shareholders approved the distributions
which is the year subsequent to the year the earnings arise.
b. Deferred taxes
Deferred taxes are recognized in respect of temporary differences between the carrying
amounts of assets and liabilities for financial reporting purposes and the amounts used for
income tax purposes. Deferred tax liabilities are recognized for temporary difference of future
taxable income. Deferred tax assets are recognized for unused tax losses, unused tax credits
and deductible temporary differences to the extent that it is probable that future taxable profits
will be available against which they can be utilized.
AU Optronics 2019 Annual Report
(Continued)
AU OPTRONICS CORP.
Notes to Parent Company Only Financial Statements
220
Deferred tax assets are reviewed at annual reporting date, by considering global economic
environment, industry environment, statutory tax deduction years and projected future taxable
income, and reduced to the extent that it is no longer probable that future taxable profits will
be available to allow all or part of the deferred tax asset to be recovered. Deferred tax assets
which originally not recognized is also reviewed at annual reporting date and recognized to the
extent that it is probable that future taxable profits will be available to allow all or part of the
deferred tax asset to be recovered.
Deferred taxes liabilities for taxable temporary differences related to investments in
subsidiaries, associates and joint arrangements are recognized, unless the Company is able to
control the timing of the reversal of the taxable temporary differences and it is probable that
they will not reverse in the foreseeable future.
Deferred tax is measured at the tax rates that are expected to be applied to temporary
differences when the reverse, using the statutory tax rate or the actual legislative tax rate on
the reporting date. Deferred tax assets and liabilities are offset only if certain criteria are met.
Current taxes and deferred taxes are recognized in profit or loss except to the extent that it
relates to items recognized directly in equity or other comprehensive income.
(21) Business combinations
The consideration transferred in the acquisition is measured at fair value, as are identifiable net
assets acquired. Goodwill is measured as the excess of the aggregate of the fair value of
consideration transferred and the amount of any non-controlling interests in the acquiree over the
net identifiable assets acquired and liabilities assumed. If the fair value of the net assets acquired is
in excess of the aggregate consideration transferred and the amount of any non-controlling interests
in the acquiree, after reassessing all of the assets acquired and all of the liabilities assumed being
properly identified, the difference is recognized in profit or loss as a gain on bargain purchase.
Acquisition-related costs are expensed as incurred, except that the costs are related to the issue of
debt or equity instruments.
Non-controlling interests in an acquiree that are present ownership interests and entitle their holders
to a proportionate share of the entity’s net assets in the event of liquidation are measured, on a case-
by-case basis, at either fair value or the present ownership instruments’ proportionate share in the
recognized amounts of the acquiree’s net identifiable assets. All other components of non-
controlling interests shall be measured at their acquisition-date fair values, unless another
measurement basis is required by IFRSs endorsed by the FSC with effective date (hereinafter
referred to as “TIFRSs”).
Any contingent consideration included in the consideration transferred is recognized at fair value at
the date of acquisition. Subsequent changes to the fair value of the contingent consideration during
the measurement period shall adjust to the cost of the acquisition and the resulting goodwill
retrospectively. An adjustment made during the measurement period is to reflect additional
information obtained by the Company about facts and circumstances that existed as of the
acquisition date. The measurement period shall not exceed one year from the acquisition date. The
accounting treatment for those changes to the fair value of the contingent consideration that are not
measurement period adjustments is depending on the classification of the contingent consideration.
If the contingent consideration is classified as equity, it is not remeasured and the subsequent
settlement is accounted for within equity. Otherwise, other contingent consideration is remeasured
at fair value at each reporting date and subsequent changes in the fair value are recognized in profit
or loss.
AU Optronics 2019 Annual Report
(Continued)
AU OPTRONICS CORP.
Notes to Parent Company Only Financial Statements
Appendix 2
221
(22) Earnings (loss) per share
Basic earnings (loss) per share is computed by dividing profit or loss attributable to the shareholders
of the Company by the weighted-average number of common shares outstanding during the period.
In computing diluted earnings per share, profit or loss attributable to the shareholders of the
Company and the weighted-average number of common shares outstanding during the period are
adjusted for the effects of dilutive potential common stock, assuming dilutive share equivalents had
been issued.
The weighted-average outstanding shares are retroactively adjusted for the effects of stock dividends
transferred from retained earnings or capital surplus to common stock.
(23) Operating segments
The Company has provided the operating segments disclosure in the consolidated financial
statements. Thus, disclosure of the segment information in the parent company only financial
statements is waived. 5. Critical Accounting Judgments and Key Sources of Estimations and Assumptions Uncertainty
The preparation of the parent company only financial statements in conformity with the Regulations
requires management to make judgments, estimates and assumptions that affect the application of the
accounting policies and the reported amount of assets, liabilities, income and expenses. Actual results
may differ from these estimates.
Estimates and underlying assumptions are reviewed by management on an ongoing basis. Revisions to
accounting estimates are recognized in the period in which the estimates are revised and in any future
periods affected.
Information about critical judgments, estimates and assumptions in applying accounting policies that have
the significant effect on the amounts recognized in the parent company only financial statements is
included in the following notes:
(1) Estimate of provisions
Provision for warranty is estimated when product revenue is recognized. The estimate has been
made based on the quantities within the warranty period, the historical and anticipated warranty
claims rate associated with similar products and services, and the projected unit cost of
maintenance. The Company regularly reviews the basis of the estimate and if necessary, amends it
as appropriate. There could be a significant impact on provision for warranty for any changes of
the basis of the estimate.
Provision for unsettled litigation and claims is recognized when it is probable that it will result in
an outflow of the Company’s resources and the amount can be reasonably estimated. While the
ultimate resolution of litigation and claims cannot be predicted with certainty, the final outcome or
the actual cash outflow may be materially different from the estimated liability.
(2) Impairment of long-term non-financial assets, other than goodwill
In the process of evaluating the potential impairment of tangible and intangible assets other than
goodwill, the Company is required to make subjective judgments in determining the independent
cash flows, useful lives, expected future income and expenses related to the specific asset groups
with the consideration of the usage mode of asset and the nature of industry. Any changes in these
estimates based on changed economic conditions or business strategies could result in significant
impairment charges or reversal in future years.
(3) Impairment of goodwill
The assessment of impairment of goodwill requires the Company to make subjective judgment to
determine the identified CGUs, allocate the goodwill to relevant CGUs and estimate the
recoverable amount of relevant CGUs.

AU Optronics 2019 Annual Report
(Continued)
AU OPTRONICS CORP.
Notes to Parent Company Only Financial Statements
222
(4) Measurement of defined benefit obligations
Accrued pension liabilities and the resulting pension expenses under defined benefit pension plans
are calculated using the Projected Unit Credit Cost Method. Actuarial assumptions comprise the
discount rate, rate of employee turnover, long-term average future salary increase, etc. Changes in
economic circumstances and market conditions will affect these assumptions and may have a
material impact on the amount of the expense and the liability.
(5) Recognition of deferred tax assets
Deferred tax assets are recognized to the extent that it is probable that future taxable profits will be
available against which those deferred tax assets can be utilized. Assessment of the realization of
the deferred tax assets requires management’s subjective judgment and estimate, including the
future revenue growth and profitability, the sources of taxable income, the amount of tax credits
can be utilized and feasible tax planning strategies. Changes in the global economic environment,
the industry trends and relevant laws and regulations may result in adjustments to the deferred tax
assets.
(6) Estimate of variable consideration of revenue
The Company estimates the amount of variable consideration by using methods either the expected
value or the most likely amount based on historical experience, market and economic situation and
any known factors that would significantly affect the estimates. The amount of variable
consideration is recognized as a reduction of revenue in the same period the related revenue is
recognized. The Company periodically reviews the reasonableness of the estimated variable
consideration. However, the adequacy of estimations may be affected by factors such as market
price competition and the evolution of product technology, which could result in significant
adjustments to the variable consideration.
(7) Valuation of inventories
As inventories are stated at the lower of cost or net realizable value, the Company estimates the net
realizable value of inventories for obsolescence and unmarketable items at the end of reporting
period and then writes down the cost of inventories to net realizable value. The net realizable value
of the inventory is mainly determined based on assumptions of future demand within a specific
time horizon. Due to the rapid industrial transformation, there may be significant changes in the net
realizable value of inventories.
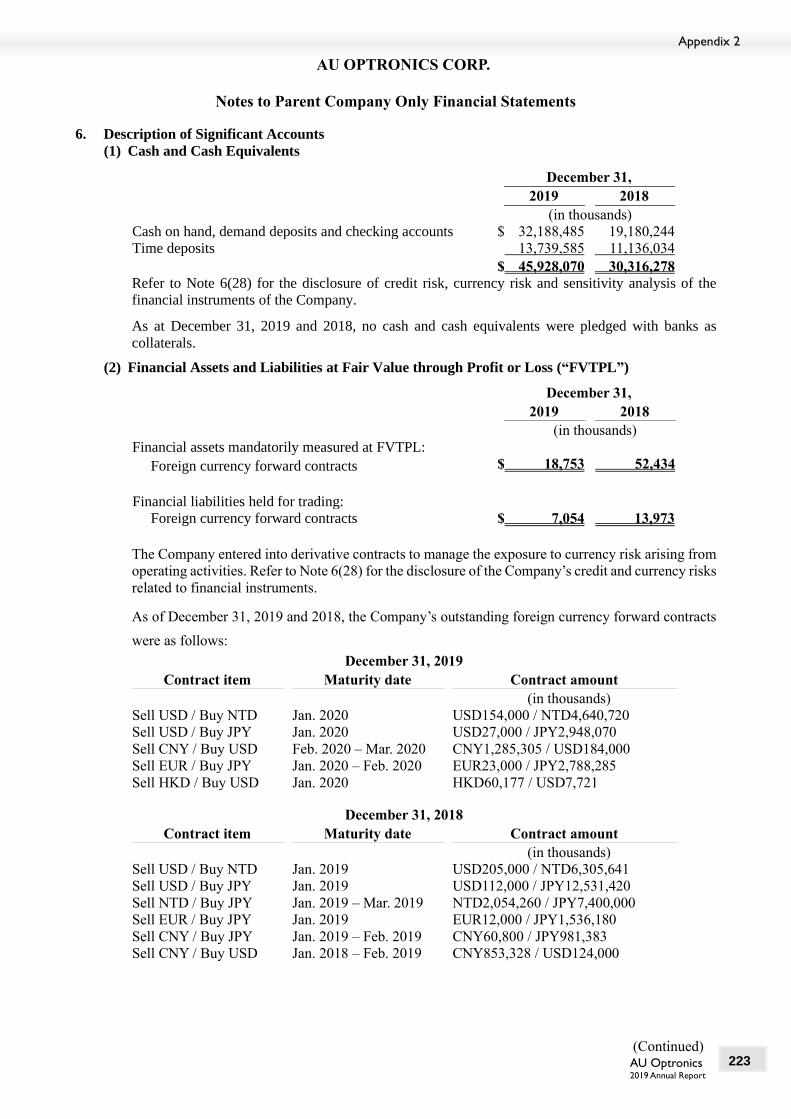
AU Optronics 2019 Annual Report
(Continued)
AU OPTRONICS CORP.
Notes to Parent Company Only Financial Statements
Appendix 2
223
6. Description of Significant Accounts
(1) Cash and Cash Equivalents
December 31,
2019 2018
(in thousands)
Cash on hand, demand deposits and checking accounts $ 32,188,485 19,180,244
Time deposits 13,739,585 11,136,034
$ 45,928,070 30,316,278
Refer to Note 6(28) for the disclosure of credit risk, currency risk and sensitivity analysis of the
financial instruments of the Company.
As at December 31, 2019 and 2018, no cash and cash equivalents were pledged with banks as
collaterals.
(2) Financial Assets and Liabilities at Fair Value through Profit or Loss (“FVTPL”)
December 31,
2019 2018
(in thousands)
Financial assets mandatorily measured at FVTPL:
Foreign currency forward contracts $ 18,753 52,434
Financial liabilities held for trading:
Foreign currency forward contracts $ 7,054 13,973
The Company entered into derivative contracts to manage the exposure to currency risk arising from
operating activities. Refer to Note 6(28) for the disclosure of the Company’s credit and currency risks
related to financial instruments.
As of December 31, 2019 and 2018, the Company’s outstanding foreign currency forward contracts
were as follows:
December 31, 2019
Contract item Maturity date Contract amount
(in thousands)
Sell USD / Buy NTD Jan. 2020 USD154,000 / NTD4,640,720
Sell USD / Buy JPY Jan. 2020 USD27,000 / JPY2,948,070
Sell CNY / Buy USD Feb. 2020 – Mar. 2020 CNY1,285,305 / USD184,000
Sell EUR / Buy JPY Jan. 2020 – Feb. 2020 EUR23,000 / JPY2,788,285
Sell HKD / Buy USD Jan. 2020 HKD60,177 / USD7,721
December 31, 2018
Contract item Maturity date Contract amount
(in thousands)
Sell USD / Buy NTD Jan. 2019 USD205,000 / NTD6,305,641
Sell USD / Buy JPY Jan. 2019 USD112,000 / JPY12,531,420
Sell NTD / Buy JPY Jan. 2019 – Mar. 2019 NTD2,054,260 / JPY7,400,000
Sell EUR / Buy JPY Jan. 2019 EUR12,000 / JPY1,536,180
Sell CNY / Buy JPY Jan. 2019 – Feb. 2019 CNY60,800 / JPY981,383
Sell CNY / Buy USD Jan. 2018 – Feb. 2019 CNY853,328 / USD124,000

AU Optronics 2019 Annual Report
(Continued)
AU OPTRONICS CORP.
Notes to Parent Company Only Financial Statements
224
(3) Financial Assets at Fair Value through Other Comprehensive Income (“FVTOCI”)
December 31
2019 2018
(in thousands)
Investments in equity instruments at FVTOCI:
Equity securities – listed stocks $ 7,140,410 6,604,041
The purpose that the Company invests in the abovementioned equity securities is for long-term
strategies, but rather for trading purpose. Therefore, those equity securities are designated as financial
assets at FVTOCI.
If the value of these equity securities appreciates or depreciates by 10% at the reporting date, other
comprehensive income would increase or decrease by $714,041 thousand and $660,404 thousand for
the years ended December 31, 2019 and 2018, respectively.
(4) Accounts Receivable, net (Including Related and Unrelated Parties)
December 31,
2019 2018
(in thousands)
Accounts receivable $ 28,925,839 46,252,776
Less: loss allowance (150) (15,291)
$ 28,925,689 46,237,485
Accounts receivable, net $ 26,986,723 41,612,155
Accounts receivable from related parties, net $ 1,938,966 4,625,330
The Company measures loss allowance for accounts receivable using the simplified approach under
IFRS 9 with the lifetime expected credit losses. Analysis of expected credit losses which was
measured based on the aforementioned method, was as follows:
December 31, 2019
Carrying
amount of
accounts
receivable
Weighted-
average loss
rate
Loss
allowance
for lifetime
expected
credit losses
(in thousands) (in thousands)
Not past due $ 28,140,278 0.00% 1
Past due less than 60 days 773,489 0.00% 4
Past due 61~180 days 12,072 1.20% 145
$ 28,925,839 150
December 31, 2018
Carrying
amount of
accounts
receivable
Weighted-
average loss
rate
Loss
allowance
for lifetime
expected
credit losses
(in thousands) (in thousands)
Not past due $ 45,576,334 0.00% 89
Past due less than 60 days 653,327 0.07% 439
Past due 61~180 days 8,461 1.29% 109
$ 46,238,122 637
In addition, there was objective evidence indicating that, under reasonable expectation, some of the
accounts receivable would not be recovered in total; therefore, the Company recognized a loss
allowance amounting to $0 and $14,654 thousand as of December 31, 2019 and 2018.

AU Optronics 2019 Annual Report
(Continued)
AU OPTRONICS CORP.
Notes to Parent Company Only Financial Statements
Appendix 2
225
The movement of the loss allowance for accounts receivable was as follows:
December 31,
2019 2018
(in thousands)
Balance at beginning of the year $ 15,291 19,589
Reversals against expense (487) (4,298)
Write-offs (14,654) -
Balance at end of the year $ 150 15,291
The payment terms granted to customers are generally 25 to 60 days from the end of the month during
which the invoice is issued. This term is consistent with practices in our industry, and thus, no
financing components involved.
Information about the Company’s exposure to credit risk is included in Note 6(28).
As at December 31, 2018, the Company did not sell its accounts receivables to banks. As at December
31, 2019, the Company’s accounts receivables sold and derecognized were as follows: December 31, 2019
Underwriting bank
Factoring
limit
Amount
sold and
derecognized
Amount
advanced
Principal
terms
(in thousands) (in thousands) (in thousands)
CTBC Bank USD 152,000 USD 18,526 NTD 500,000 See Notes(a)~(d)
Taipei Fubon Bank USD 120,000 USD 56,020 NTD
1,500,000
See Notes(a)~(d)
DBS Bank USD 154,000 USD 56,730 NTD
1,520,000
See Notes(a)~(d)
Bank of Taiwan USD 250,000 USD 15,718 USD 14,000 See Notes(a)~(d)
Note (a): Under these facilities, the Company transferred accounts receivable to the respective underwriting
banks, which are without recourse subject to the underwriting consents.
Note (b): The Company informed its customers pursuant to the respective facilities to make payment
directly to the respective underwriting banks.
Note (c): As of December 31, 2019, total outstanding receivables after the above transactions, net of fees
charged by underwriting banks, of $487,754 thousand was recognized under other current
financial assets. In addition, interest rate for the balance of advanced amount as of December 31,
2019 was ranging from 1.0700% to 2.4419%.
Note (d): To the extent of the amount transferred to the underwriting banks, risks of non-collection or potential
payment default by customers in the event of insolvency are borne by respective banks. The
Company is not responsible for the collection of receivables subject to these facilities, or for any
legal proceedings and costs thereof in collecting these receivables. In case any commercial dispute
between the Company and customers or other reasons results in the Company’s failure to perform
the obligation under these facilities, the banks have requested the Company to issue promissory
notes in the amounts equal to 10 percent of respective facilities or to transfer receivables in the
amounts equal to 10 percent of respective facilities. Other than such arrangements, no collaterals
were provided by the Company.

AU Optronics 2019 Annual Report
(Continued)
AU OPTRONICS CORP.
Notes to Parent Company Only Financial Statements
226
(5) Inventories
December 31,
2019 2018
(in thousands)
Finished goods $ 7,022,551 7,585,386
Work-in-progress 8,404,901 10,467,651
Raw materials 1,828,809 2,156,231
$ 17,256,261 20,209,268
For the years ended December 31, 2019 and 2018, the amounts recognized as cost of sales in relation
to inventories were $257,786,100 thousand and $266,682,541 thousand, respectively. The net of
provisions for inventories written down to net realizable value, which were also included in cost of
sales, amounted to $265,330 thousand and $922,443 thousand for the years ended December 31,
2019 and 2018, respectively.
As at December 31, 2019 and 2018, none of the Company’s inventories was pledged as collateral.
(6) Investments in Equity-accounted Investees
December 31,
2019 2018
(in thousands)
Subsidiaries $ 67,163,450 70,184,683
Associates 3,021,365 3,097,302
$ 70,184,815 73,281,985
a. Subsidiaries
Refer to consolidated financial statements for the years ended December 31, 2019 and 2018 for
the details.
The following table summarized the amount recognized by the Company at its share of those
subsidiaries.
For the years ended
December 31,
2019 2018
(in thousands)
The Company’s share of subsidiaries’:
Profit (loss) $ (1,198,425) 638,531
Other comprehensive loss (2,052,161) (427,892)
Total comprehensive income (loss) $ (3,250,586) 210,639
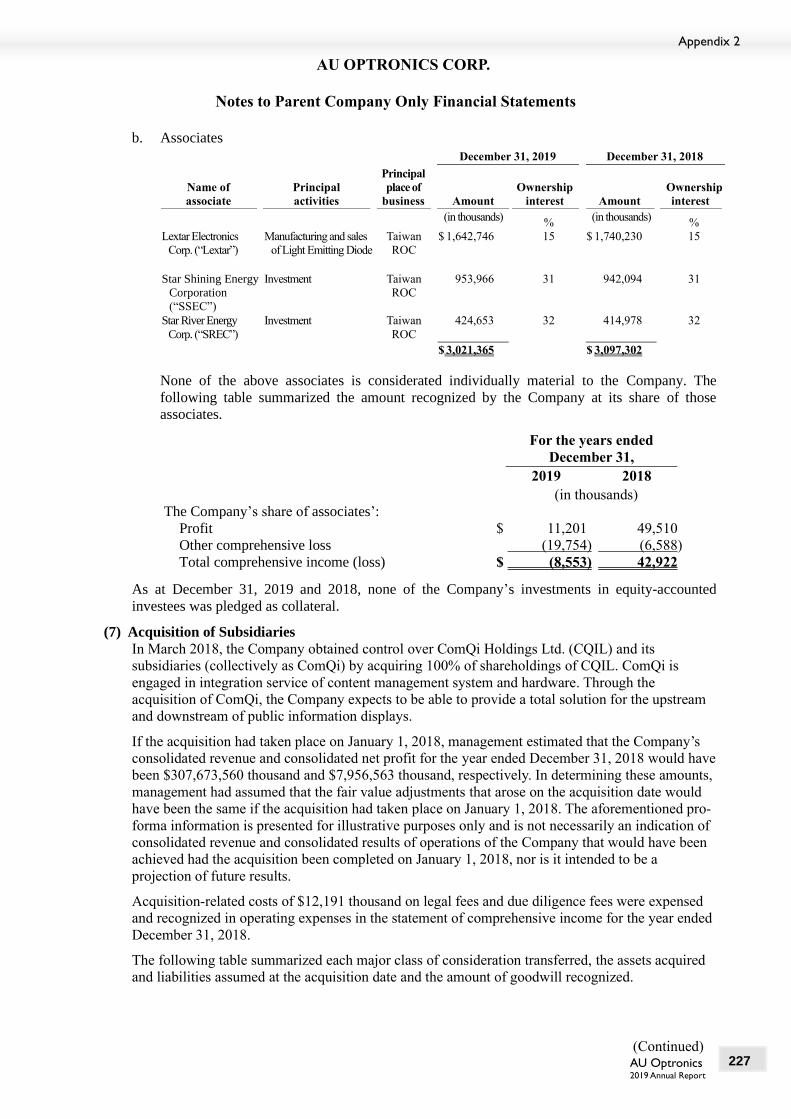
AU Optronics 2019 Annual Report
(Continued)
AU OPTRONICS CORP.
Notes to Parent Company Only Financial Statements
Appendix 2
227
b. Associates
December 31, 2019 December 31, 2018
Name of
associate
Principal
activities
Principal
place of
business Amount
Ownership
interest Amount
Ownership
interest
(in thousands) %
(in thousands) %
Lextar Electronics
Corp. (“Lextar”)
Manufacturing and sales
of Light Emitting Diode
Taiwan
ROC
$ 1,642,746 15 $ 1,740,230 15
Star Shining Energy
Corporation
(“SSEC”)
Investment Taiwan
ROC
953,966 31 942,094 31
Star River Energy
Corp. (“SREC”)
Investment Taiwan
ROC
424,653 32 414,978 32
$ 3,021,365 $ 3,097,302
None of the above associates is considerated individually material to the Company. The
following table summarized the amount recognized by the Company at its share of those
associates.
For the years ended
December 31,
2019 2018
(in thousands)
The Company’s share of associates’:
Profit $ 11,201 49,510
Other comprehensive loss (19,754) (6,588)
Total comprehensive income (loss) $ (8,553) 42,922
As at December 31, 2019 and 2018, none of the Company’s investments in equity-accounted
investees was pledged as collateral.
(7) Acquisition of Subsidiaries
In March 2018, the Company obtained control over ComQi Holdings Ltd. (CQIL) and its
subsidiaries (collectively as ComQi) by acquiring 100% of shareholdings of CQIL. ComQi is
engaged in integration service of content management system and hardware. Through the
acquisition of ComQi, the Company expects to be able to provide a total solution for the upstream
and downstream of public information displays.
If the acquisition had taken place on January 1, 2018, management estimated that the Company’s
consolidated revenue and consolidated net profit for the year ended December 31, 2018 would have
been $307,673,560 thousand and $7,956,563 thousand, respectively. In determining these amounts,
management had assumed that the fair value adjustments that arose on the acquisition date would
have been the same if the acquisition had taken place on January 1, 2018. The aforementioned pro-
forma information is presented for illustrative purposes only and is not necessarily an indication of
consolidated revenue and consolidated results of operations of the Company that would have been
achieved had the acquisition been completed on January 1, 2018, nor is it intended to be a
projection of future results.
Acquisition-related costs of $12,191 thousand on legal fees and due diligence fees were expensed
and recognized in operating expenses in the statement of comprehensive income for the year ended
December 31, 2018.
The following table summarized each major class of consideration transferred, the assets acquired
and liabilities assumed at the acquisition date and the amount of goodwill recognized.

AU Optronics 2019 Annual Report
(Continued)
AU OPTRONICS CORP.
Notes to Parent Company Only Financial Statements
228
d. Consideration transferred
Amounts
(in thousands)
Cash $ 467,920
Contingent consideration 283,354
$ 751,274
In accordance with the terms of the contingent consideration, in the event that ComQi’s annual
net revenue and annual recurring revenue for the year ended December 31, 2018 are greater than
the agreed revenue targets in the agreement, the Company should pay additional consideration
of USD4,000 thousand and USD7,000 thousand, respectively, to the original shareholders of
ComQi. Under the arrangement of the contingent consideration, the potential undiscounted
amount of the contingent payment that the Company might have to pay was between USD0 and
USD11,000 thousand.
The fair value of the contingent consideration estimated using Monte Carlo simulation amounted
to $283,354 thousand. The fair value measurement was based on the significant unobservable
inputs in the market and categorised as a Level 3 fair value under IFRS 13. The significant inputs
in the valuation technique used are discount rate of 8.5%, revenue volatility rate of 30.8% and
AUO’s credit spread of 0.88%.
As ComQi’s annual net revenue and annual recurring revenue for the year ended December 31,
2018 were not greater than the agreed revenue targets in the agreement, the Company remeasured
the fair value of the contingent consideration and determined the value was zero. The change in
the fair value of the contingent consideration of $283,354 thousand was not a measurement
period adjustment, and therefore, was recognized under other gains and losses in the statement
of comprehensive income for the year ended December 31, 2018.
a. Identifiable assets acquired and liabilities assumed
The following table summarized the fair value of identifiable assets acquired and liabilities
assumed recognized at the acquisition date:
Fair value
(in thousands)
Cash $ 19,432
Accounts receivable and other current assets 36,851
Property, plant and equipment 3,712
Intangible assets 150,436
Accounts payable and other current liabilities (57,361)
Other liabilities (2,120)
$ 150,950
Goodwill arising from the acquisition for which is attributable mainly to the synergies expected
to be achieved from integrating ComQi into the Company’s existing business has been
recognized as follows:
Amounts
(in thousands)
Consideration transferred $ 751,274
Less: Fair value of identifiable net assets (150,950)
$ 600,324
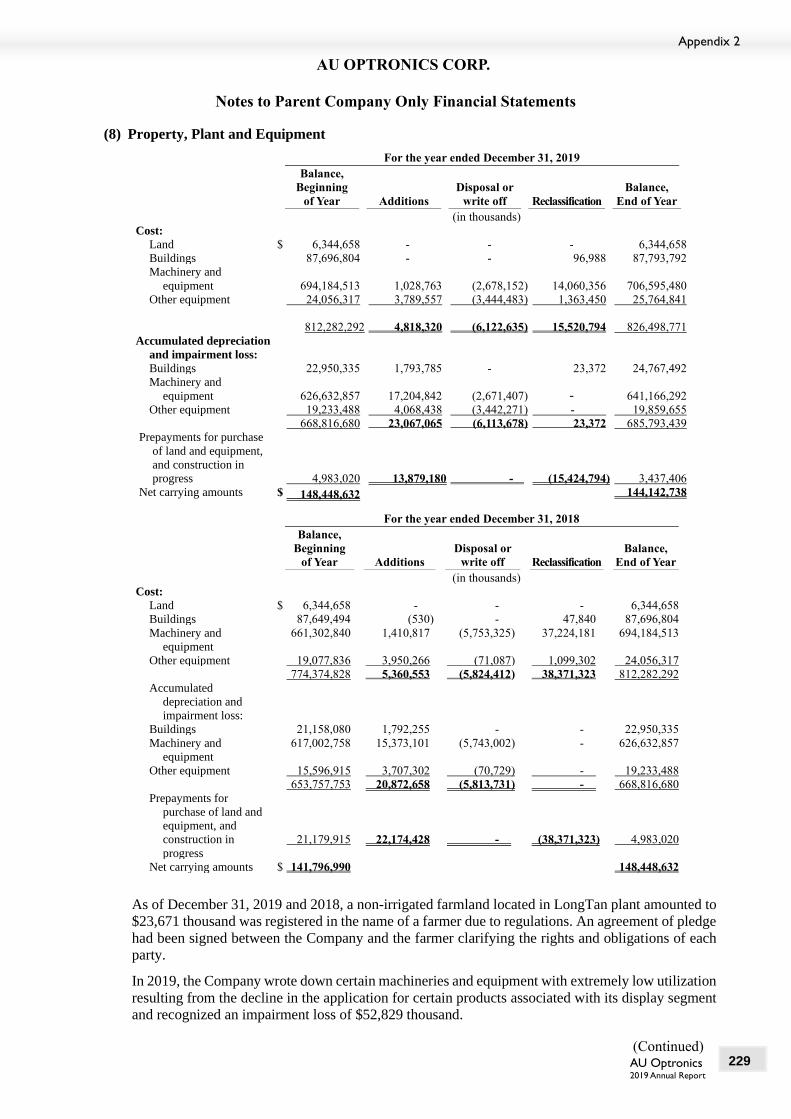
AU Optronics 2019 Annual Report
(Continued)
AU OPTRONICS CORP.
Notes to Parent Company Only Financial Statements
Appendix 2
229
(8) Property, Plant and Equipment
For the year ended December 31, 2019
Balance,
Beginning
of Year Additions
Disposal or
write off Reclassification
Balance,
End of Year
(in thousands)
Cost:
Land $ 6,344,658 - - - 6,344,658
Buildings 87,696,804 - - 96,988 87,793,792
Machinery and
equipment 694,184,513 1,028,763 (2,678,152) 14,060,356 706,595,480
Other equipment 24,056,317 3,789,557 (3,444,483) 1,363,450 25,764,841
812,282,292 4,818,320 (6,122,635) 15,520,794 826,498,771
Accumulated depreciation
and impairment loss:
Buildings 22,950,335 1,793,785 - 23,372 24,767,492
Machinery and
equipment 626,632,857 17,204,842 (2,671,407) - 641,166,292
Other equipment 19,233,488 4,068,438 (3,442,271) - 19,859,655
668,816,680 23,067,065 (6,113,678) 23,372 685,793,439
Prepayments for purchase
of land and equipment,
and construction in
progress 4,983,020 13,879,180 - (15,424,794) 3,437,406
Net carrying amounts $ 148,448,632 144,142,738
For the year ended December 31, 2018
Balance,
Beginning
of Year Additions
Disposal or
write off Reclassification
Balance,
End of Year
(in thousands)
Cost:
Land $ 6,344,658 - - - 6,344,658
Buildings 87,649,494 (530) - 47,840 87,696,804
Machinery and
equipment
661,302,840 1,410,817 (5,753,325) 37,224,181 694,184,513
Other equipment 19,077,836 3,950,266 (71,087) 1,099,302 24,056,317
774,374,828 5,360,553 (5,824,412) 38,371,323 812,282,292
Accumulated
depreciation and
impairment loss:
Buildings 21,158,080 1,792,255 - - 22,950,335
Machinery and
equipment
617,002,758 15,373,101 (5,743,002) - 626,632,857
Other equipment 15,596,915 3,707,302 (70,729) - 19,233,488
653,757,753 20,872,658 (5,813,731) - 668,816,680
Prepayments for
purchase of land and
equipment, and
construction in
progress
21,179,915
22,174,428
-
(38,371,323)
4,983,020
Net carrying amounts $ 141,796,990 148,448,632
As of December 31, 2019 and 2018, a non-irrigated farmland located in LongTan plant amounted to
$23,671 thousand was registered in the name of a farmer due to regulations. An agreement of pledge
had been signed between the Company and the farmer clarifying the rights and obligations of each
party.
In 2019, the Company wrote down certain machineries and equipment with extremely low utilization
resulting from the decline in the application for certain products associated with its display segment
and recognized an impairment loss of $52,829 thousand.

AU Optronics 2019 Annual Report
(Continued)
AU OPTRONICS CORP.
Notes to Parent Company Only Financial Statements
230
In 2019 and 2018, the Company wrote down certain long-term assets with extremely low capacity
utilization associated with its energy segment and recognized impairment losses of $14,949
thousand and $4,470 thousand, respectively.
The following table summarized the Company’s capitalized borrowing costs and the interest rate
range applied for the capitalization:
For the years ended
December 31,
2019 2018
(in thousands)
Capitalized borrowing costs $ 127,318 290,262
Interest rates applied for the capitalization 1.77%~ 1.73%~
1.89% 1.91%
Certain property, plant and equipment were pledged as collateral, see Note 8.
(9) Lease Arrangements
a. Leasees
(i) Right-of-use assets
December 31, 2019
(in thousands)
Carrying amount of right-of-use assets
Land $ 9,236,323
Buildings 78,037
Other equipment 32,517
$ 9,346,877
For the year ended
December 31, 2019
(in thousands)
Additions to right-of-use assets $ 143,402
Depreciation charge for right-of-use assets
Land $ 431,013
Buildings 25,552
Other equipment 64,851
$ 521,416
(ii) Lease liabilities
December 31, 2019
Future
minimum
lease
payments Interests
Present value
of minimum
lease
payments
(in thousands)
Less than one year $ 583,994 168,013 415,981
Between one and five years 2,143,485 601,155 1,542,330
More than five years 8,797,303 1,330,039 7,467,264
$ 11,524,782 2,099,207 9,425,575
Lease liabilities-current $ 415,981
Lease liabilities-noncurrent 9,009,594
$ 9,425,575

AU Optronics 2019 Annual Report
(Continued)
AU OPTRONICS CORP.
Notes to Parent Company Only Financial Statements
Appendix 2
231
(iii) Significant lease agreements
AUO has entered into various land lease agreements with Hsinchu Science Park Bureau,
Central Science Park Administration Bureau and Southern Taiwan Science Park Bureau,
respectively, for the construction of plant for operations. All lease amounts are adjusted in
accordance with the land value announced by the government from time to time. In January
2019, AUO modified one of its lease contracts due to the decrease of the scope of the lease,
and therefore, the carrying amount of the right-of-use asset was reduced by $1,064,094
thousand. The difference between the remeasurement of the lease liability and the reduction
of the right-of-use asset was recognized in profit or loss.
(iv) Additional lease information
The Company applies the recognition exemption to account for short-term leases and leases
of low-value assets, primarily for some leases of office buildings and other sporadic leasing.
The amounts recognized in profit or loss during the lease term were as follows:
For the year
ended
December 31,
2019
(in thousands)
Expenses relating to short-term leases $ 2,861
Total cash outflow for the Company’s leases in which it acts as a lessee for the year ended
December 31, 2019 was $618,293 thousand.
b. Lessor
The Company leased out its investment properties and part of its land and buildings and did not
transfer substantially all the risks and rewards incidental to their ownership to the lessees,
therefore, those leases were recognized as operating leases. Refer to Note 6(21) for the
information of rental income from operating leases. In addition, the direct costs relating to the
aforementioned operating leases amounted to $ 1,803 thousand for the year ended December
31, 2019.
The maturity analysis of undiscounted operating lease receivable for the abovementioned assets
are as follows:
December 31,
2019
(in thousands)
Year 1 $ 8,052
Year 2 8,052
Year 3 8,052
Year 4 8,052
Year 5 8,052
Year 6 onwards 63,074
Total undiscounted operating lease receivable $ 103,334
Refer to Note 6(14) for the Company’s respective information as lessor and lessee as of
December 31, 2018.

AU Optronics 2019 Annual Report
(Continued)
AU OPTRONICS CORP.
Notes to Parent Company Only Financial Statements
232
(10) Investment Property
For the year ended December 31, 2019
Balance,
Beginning
of Year Additions Reclassification
Balance,
End of
Year
(in thousands)
Cost:
Land $ 465,868 - - 465,868
Buildings 96,000 - (96,000) -
561,868 - (96,000) 465,868
Accumulated depreciation:
Buildings 22,432 940 (23,372) -
Net carrying amounts $ 539,436 465,868
Fair Value $ 1,500,985 1,578,838
For the year ended December 31, 2018
Balance,
Beginning
of Year Additions Reclassification
Balance,
End of
Year
(in thousands)
Cost:
Land $ 465,868 - - 465,868
Buildings 96,000 - - 96,000
561,868 - - 561,868 Accumulated depreciation:
Buildings 20,549 1,883 - 22,432
Net carrying amounts $ 541,319 539,436
Fair Value $ 1,502,896 1,500,985
The fair value of investment property is based on a valuation performed by a qualified independent
appraiser who holds a recognized and relevant professional qualification and has recent valuation
experience in the location and category of the investment property being valued. The valuation is
performed using sales comparison approach and land development analysis approach with reference
to available market information.
The fair value measurement was categorized as a level 3 fair value based on the inputs in the valuation
techniques used. Sales comparison approach is through comparison, analysis, adjustment and other
means of value for comparable properties to estimate the value of the investment property. Land
development analysis approach determine the fair value of investment property based on the value
prior to development or construction, after deducting the direct cost, indirect cost, capital interest and
profit during the development period, and also consider total sales price of properties after
completion of development or construction. It also incorporates the possibility of changes in utility
of land through development or improvement in accordance with legal use and density of the land.
The significant inputs used in the fair value measurement were as follows:
December 31,
2019 2018
Overall capital interest rate 2.53% 1.86%
Rate of return 15.00% 10.00%
As at December 31, 2019 and 2018, there was no investment property that was pledged as collateral.

AU Optronics 2019 Annual Report
(Continued)
AU OPTRONICS CORP.
Notes to Parent Company Only Financial Statements
Appendix 2
233
(11) Intangible Assets
For the year ended December 31, 2019
Balance,
Beginning
of Year Additions Reclassification
Balance,
End of Year
(in thousands)
Cost:
Goodwill $ 11,280,595 - - 11,280,595
Patent and technology fee 12,078,767 - - 12,078,767
Accumulated amortization:
23,359,362 - - 23,359,362
Patent and technology fee 10,882,616 424,985 - 11,307,601
Net carrying amounts $ 12,476,746 12,051,761
For the year ended December 31, 2018
Balance,
Beginning
of Year Additions Reclassification
Balance,
End of Year
(in thousands)
Cost:
Goodwill $ 11,280,595 - - 11,280,595
Patent and technology fee 12,078,767 - - 12,078,767
23,359,362 - - 23,359,362
Accumulated amortization:
Patent and technology fee 10,376,225 506,391 - 10,882,616
Net carrying amounts $ 12,983,137 12,476,746
For the purpose of impairment test, the following table shows the information of the operating
business that the Company’s goodwill allocating to.
December 31,
2019 2018
(in thousands)
Display business $ 11,280,595 11,280,595
The Company’s goodwill has been tested for impairment at least once at the end of the annual
reporting period. The recoverable amount was determined based on value in use of the operating
business.
The key assumptions used in the estimation of the recoverable amount included discount rate and
terminal growth rate. The annual discount rates for the years ended December 31, 2019 and 2018
were 12.25% and 11.57%, respectively, based on industry weighted average cost of capital. The cash
flow projections were determined based on the financial budgets approved by management covering
the future five-year period and extrapolated with a steady annual terminal growth rate for subsequent
years, which were negative 0.5% and negative 1% for the years ended December 31, 2019 and 2018,
respectively. The key assumptions abovementioned represents the management’s forecast of the
future for the related industry by considering the history information from internal and external
sources.
Based on the impairment assessment for the years ended December 31, 2019 and 2018, no
impairment losses were recognized as the recoverable amount of the CGU was higher than its
carrying value.

AU Optronics 2019 Annual Report
(Continued)
AU OPTRONICS CORP.
Notes to Parent Company Only Financial Statements
234
(12) Other Current Assets and Other Noncurrent Assets
December 31,
2019 2018
(in thousands)
Refundable deposits $ 543,530 585,697
Refundable and overpaid tax 404,135 414,004
Prepayments for purchases 134,972 373,119
Others 2,503,713 2,355,234
3,586,350 3,728,054
Less: current (1,836,890) (1,754,804)
Noncurrent $ 1,749,460 1,973,250
(13) Long-term Borrowings
December 31,
Bank or agent bank Durations 2019 2018
(in thousands)
Syndicated loans:
Bank of Taiwan and others From Feb. 2015 to Feb. 2019 $ - 5,912,000
Bank of Taiwan and others From Apr. 2016 to Apr. 2019 - 36,175,000
Bank of Taiwan and others From May 2017 to May 2022 10,000,000 10,000,000
Bank of Taiwan and others From Feb. 2019 to Feb. 2024 42,000,000 -
Bank of Taiwan and others From Mar. 2019 to Apr. 2023 23,000,000 -
Unsecured loans From Aug 2018 to Aug. 2023 5,000,000 300,000
Secured loans From Nov. 2019 to Dec. 2026 6,200,000 -
86,200,000 52,387,000
Less: transaction costs (233,890) (441,455)
85,966,110 51,945,545
Less: current portion (4,000,000) (22,212,000)
$ 81,966,110 29,733,545
Unused credit facilities $ 31,000,000 75,120,300
Interest rate range
1.0000%~
1.8822%
1.5991%~
1.9598%
The Company entered into the aforementioned long-term loan arrangements with banks and financial
institutions to finance capital expenditures for purchase of machinery and equipment, and to fulfill
working capital, as well as to repay the matured debts. A commitment fee is negotiated with the
leading banks of syndicated loans and is calculated based on the committed-to-withdraw but unused
balance, if any. No commitment fees were paid for the year ended December 31, 2019.
These credit facilities contain covenants that require the Company to maintain certain financial ratios,
calculating based on the Company’s annual consolidated financial statements prepared in accordance
with TIFRSs, such as current ratio, leverage ratio, interest coverage ratio, tangible net worth and
others as specified in the loan agreements. As of December 31, 2019 and 2018, the Company
complied with all financial covenants required under each of the loan agreements.
Refer to Note 6(28) for detailed information of exposures to interest rate, currency, and liquidity
risks. Refer to Note 8 for assets pledged as collateral to secure the aforementioned long-term
borrowings.
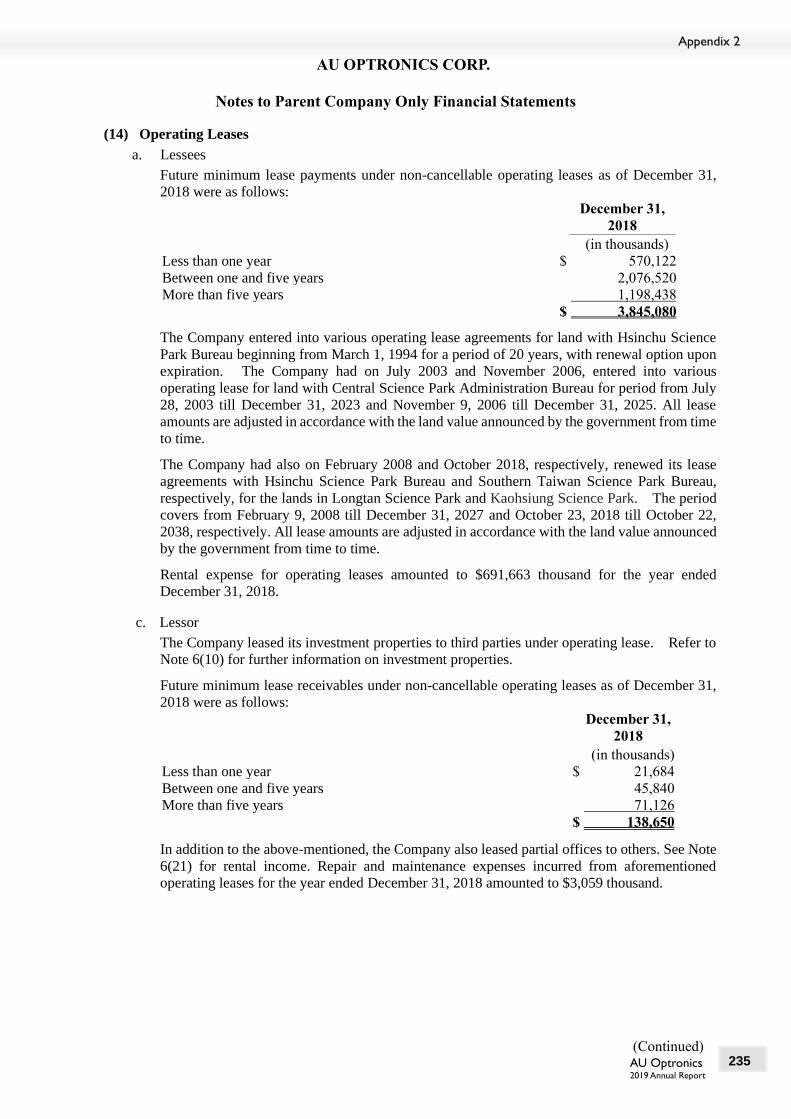
AU Optronics 2019 Annual Report
(Continued)
AU OPTRONICS CORP.
Notes to Parent Company Only Financial Statements
Appendix 2
235
(14) Operating Leases
a. Lessees
Future minimum lease payments under non-cancellable operating leases as of December 31,
2018 were as follows:
December 31,
2018
(in thousands)
Less than one year $ 570,122
Between one and five years 2,076,520
More than five years 1,198,438
$ 3,845,080
The Company entered into various operating lease agreements for land with Hsinchu Science
Park Bureau beginning from March 1, 1994 for a period of 20 years, with renewal option upon
expiration. The Company had on July 2003 and November 2006, entered into various
operating lease for land with Central Science Park Administration Bureau for period from July
28, 2003 till December 31, 2023 and November 9, 2006 till December 31, 2025. All lease
amounts are adjusted in accordance with the land value announced by the government from time
to time.
The Company had also on February 2008 and October 2018, respectively, renewed its lease
agreements with Hsinchu Science Park Bureau and Southern Taiwan Science Park Bureau,
respectively, for the lands in Longtan Science Park and Kaohsiung Science Park. The period
covers from February 9, 2008 till December 31, 2027 and October 23, 2018 till October 22,
2038, respectively. All lease amounts are adjusted in accordance with the land value announced
by the government from time to time.
Rental expense for operating leases amounted to $691,663 thousand for the year ended
December 31, 2018.
c. Lessor
The Company leased its investment properties to third parties under operating lease. Refer to
Note 6(10) for further information on investment properties.
Future minimum lease receivables under non-cancellable operating leases as of December 31,
2018 were as follows:
December 31,
2018
(in thousands)
Less than one year $ 21,684
Between one and five years 45,840
More than five years 71,126
$ 138,650
In addition to the above-mentioned, the Company also leased partial offices to others. See Note
6(21) for rental income. Repair and maintenance expenses incurred from aforementioned
operating leases for the year ended December 31, 2018 amounted to $3,059 thousand.
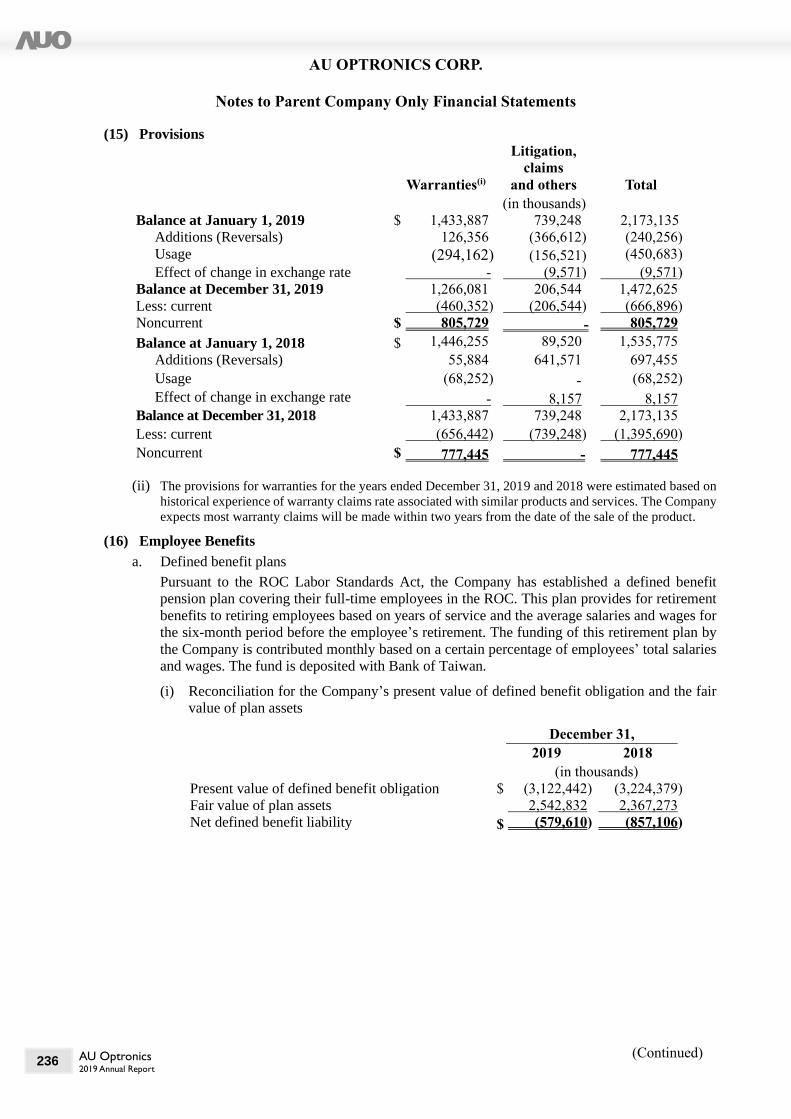
AU Optronics 2019 Annual Report
(Continued)
AU OPTRONICS CORP.
Notes to Parent Company Only Financial Statements
236
(15) Provisions
Warranties(i)
Litigation,
claims
and others Total
(in thousands)
Balance at January 1, 2019 $ 1,433,887 739,248 2,173,135
Additions (Reversals) 126,356 (366,612) (240,256)
Usage (294,162) (156,521) (450,683)
Effect of change in exchange rate - (9,571) (9,571)
Balance at December 31, 2019 1,266,081 206,544 1,472,625
Less: current (460,352) (206,544) (666,896)
Noncurrent $ 805,729 - 805,729
Balance at January 1, 2018 $ 1,446,255 89,520 1,535,775
Additions (Reversals) 55,884 641,571 697,455
Usage (68,252) - (68,252)
Effect of change in exchange rate - 8,157 8,157
Balance at December 31, 2018 1,433,887 739,248 2,173,135
Less: current (656,442) (739,248) (1,395,690)
Noncurrent $ 777,445 - 777,445
(ii) The provisions for warranties for the years ended December 31, 2019 and 2018 were estimated based on
historical experience of warranty claims rate associated with similar products and services. The Company
expects most warranty claims will be made within two years from the date of the sale of the product.
(16) Employee Benefits
a. Defined benefit plans
Pursuant to the ROC Labor Standards Act, the Company has established a defined benefit
pension plan covering their full-time employees in the ROC. This plan provides for retirement
benefits to retiring employees based on years of service and the average salaries and wages for
the six-month period before the employee’s retirement. The funding of this retirement plan by
the Company is contributed monthly based on a certain percentage of employees’ total salaries
and wages. The fund is deposited with Bank of Taiwan.
(i) Reconciliation for the Company’s present value of defined benefit obligation and the fair
value of plan assets
December 31,
2019 2018
(in thousands)
Present value of defined benefit obligation $ (3,122,442) (3,224,379)
Fair value of plan assets 2,542,832 2,367,273
Net defined benefit liability $ (579,610) (857,106)

AU Optronics 2019 Annual Report
(Continued)
AU OPTRONICS CORP.
Notes to Parent Company Only Financial Statements
Appendix 2
237
(ii) Movement in net defined benefit asset (liability)
Defined benefit
obligation
Fair value of plan
assets
Net defined benefit
asset (liability)
2019 2018 2019 2018 2019 2018
(in thousands)
Balance at January 1, $ (3,224,379) (3,099,874) 2,367,273 2,213,018 (857,106) (886,856)
Included in profit or loss
Service cost (1,177) (1,935) - - (1,177) (1,935)
Interest cost (39,337) (49,598) - - (39,337) (49,598)
Expected return on plan
assets - - 28,881 35,408 28,881 35,408
(40,514) (51,533) 28,881 35,408 (11,633) (16,125)
Included in other
comprehensive income
Remeasurements (loss)
gain:
Actuarial (loss) gain
arising from:
- demographic
assumptions 89,851 (15,795) - - 89,851 (15,795)
- financial assumptions (206,995) (178,212) - - (206,995) (178,212)
- experience adjustment 228,466 84,437 - - 228,466 84,437
Return on plan assets
excluding interest
income - - 76,788 52,614 76,788 52,614
111,322 (109,570) 76,788 52,614 188,110 (56,956)
Other
Contributions paid by the
employer - - 101,019 102,831 101,019 102,831
Benefits paid 31,129 36,598 (31,129) (36,598) - -
Others 31,129 36,598 69,890 66,233 101,019 102,831
Balance at December 31, $ (3,122,442) (3,224,379) 2,542,832 2,367,273 (579,610) (857,106)
(iii) Plan assets
Pursuant to the ROC Labor Standards Act, the Company contributes an amount based on
a certain percentage of employees’ total salaries and wages paid every month to its pension
fund (the “Fund”), which is administered by the Bureau of Labor Fund, Ministry of Labor
and supervised by the employees’ pension plan committee (the “Committee”) and
deposited in the Committee’s name with Bank of Taiwan. Under the ROC Regulations for
Revenues, Expenditures, Safeguard and Utilization of the Labor Retirement Fund, the
minimum return on the plan assets should not be lower than the average interest rate on
two-year time deposits published by the local banks. The government is not only
responsible for the determination of the investment strategies and policies, but also for any
shortfall in the event that the rate of return is less than the required rate of return.
As of December 31, 2019, the Fund deposited in the Committee’s name in the Bank of
Taiwan amounted to $2,542,832 thousand. Information on utilization of labor pension
funds, including the yield rate of funds and the component of plan assets are available at
the Bureau of Labor Funds, Ministry of Labor website.

AU Optronics 2019 Annual Report
(Continued)
AU OPTRONICS CORP.
Notes to Parent Company Only Financial Statements
238
(iv) Defined benefit obligation
(a) Principal actuarial assumptions
December 31,
2019 2018
Discount rate 0.88% 1.22%
Rate of increase in future salary 2.90% 2.90%
The Company anticipates contributing $100,799 thousand to the defined benefit plans
in the next year starting from January 1, 2020.
As at December 31, 2019, the weighted-average duration of the defined benefit
obligation was 20 years.
(b) Sensitivity analysis
Reasonably possible changes at December 31, 2019 and 2018 to one of the relevant
actuarial assumptions, holding other assumptions constant, would have affected the
defined benefit obligation by the amounts shown below.
December 31, 2019 December 31, 2018
Changes in assumptions Changes in assumptions
+ 0.25% - 0.25% + 0.25% - 0.25%
(in thousands) (in thousands)
Discount rate $ (150,518) 158,966 (159,872) 169,102
Rate of increase in
future salary
$ 156,374 (147,992) 165,850 (157,706)
In practical, the relevant actuarial assumptions are correlated to each other. The
approach to develop the sensitivity analysis as above is the same approach to recognize
the net defined benefit liability in the balance sheet.
The approach to develop the sensitivity analysis and its relevant actuarial assumptions
are the same as those in previous year.
b. Defined contribution plans
Commencing July 1, 2005, pursuant to the ROC Labor Pension Act (the “Act”), employees who
elected to participate in the Act or joined the Company after July 1, 2005, are subject to a defined
contribution plan under the Act. Under the defined contribution plan, the Company contributes
monthly at a rate of no less than six percent of the employees’ monthly salaries and wages to
the employee’s individual pension fund account at the ROC Bureau of Labor Insurance.
The Company has set up defined contribution plan in accordance with the Act. For the years
ended December 31, 2019 and 2018, $902,578 thousand and $942,864 thousand, respectively,
of the pension costs under the pension plan to the ROC Bureau of the Labor Insurance.
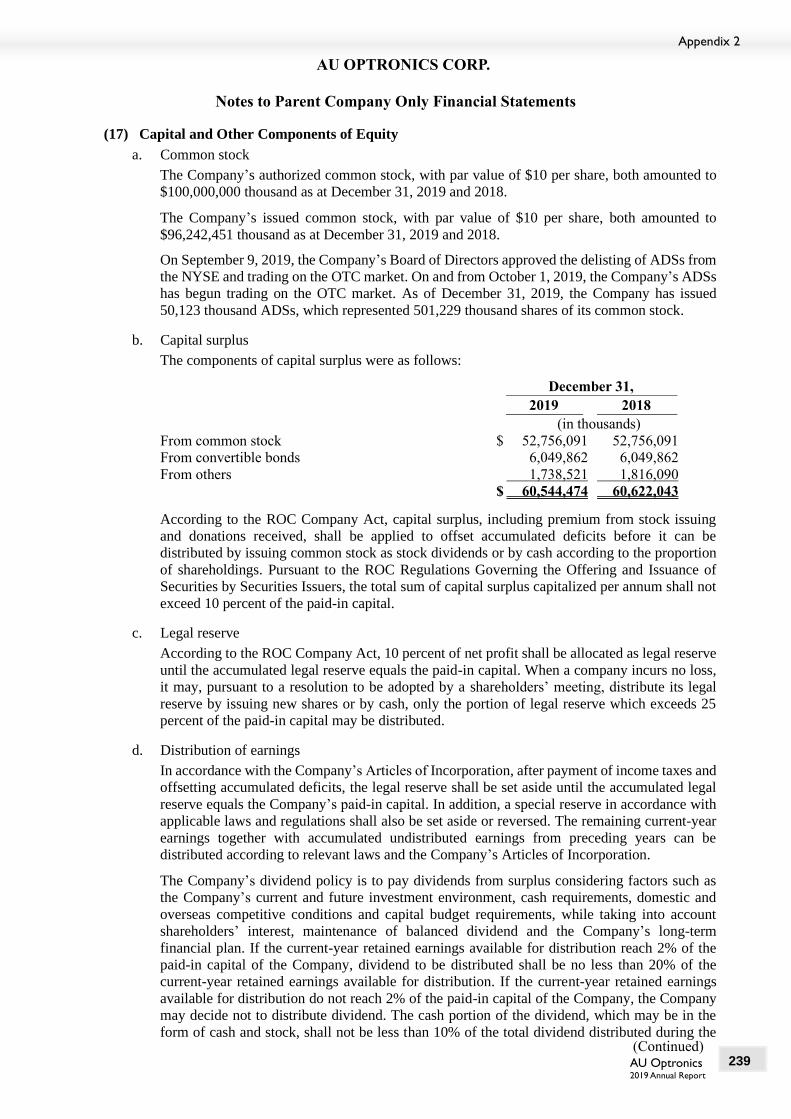
AU Optronics 2019 Annual Report
(Continued)
AU OPTRONICS CORP.
Notes to Parent Company Only Financial Statements
Appendix 2
239
(17) Capital and Other Components of Equity
a. Common stock
The Company’s authorized common stock, with par value of $10 per share, both amounted to
$100,000,000 thousand as at December 31, 2019 and 2018.
The Company’s issued common stock, with par value of $10 per share, both amounted to
$96,242,451 thousand as at December 31, 2019 and 2018.
On September 9, 2019, the Company’s Board of Directors approved the delisting of ADSs from
the NYSE and trading on the OTC market. On and from October 1, 2019, the Company’s ADSs
has begun trading on the OTC market. As of December 31, 2019, the Company has issued
50,123 thousand ADSs, which represented 501,229 thousand shares of its common stock.
b. Capital surplus
The components of capital surplus were as follows:
December 31,
2019 2018
(in thousands)
From common stock $ 52,756,091 52,756,091
From convertible bonds 6,049,862 6,049,862
From others 1,738,521 1,816,090
$ 60,544,474 60,622,043
According to the ROC Company Act, capital surplus, including premium from stock issuing
and donations received, shall be applied to offset accumulated deficits before it can be
distributed by issuing common stock as stock dividends or by cash according to the proportion
of shareholdings. Pursuant to the ROC Regulations Governing the Offering and Issuance of
Securities by Securities Issuers, the total sum of capital surplus capitalized per annum shall not
exceed 10 percent of the paid-in capital.
c. Legal reserve
According to the ROC Company Act, 10 percent of net profit shall be allocated as legal reserve
until the accumulated legal reserve equals the paid-in capital. When a company incurs no loss,
it may, pursuant to a resolution to be adopted by a shareholders’ meeting, distribute its legal
reserve by issuing new shares or by cash, only the portion of legal reserve which exceeds 25
percent of the paid-in capital may be distributed.
d. Distribution of earnings
In accordance with the Company’s Articles of Incorporation, after payment of income taxes and
offsetting accumulated deficits, the legal reserve shall be set aside until the accumulated legal
reserve equals the Company’s paid-in capital. In addition, a special reserve in accordance with
applicable laws and regulations shall also be set aside or reversed. The remaining current-year
earnings together with accumulated undistributed earnings from preceding years can be
distributed according to relevant laws and the Company’s Articles of Incorporation.
The Company’s dividend policy is to pay dividends from surplus considering factors such as
the Company’s current and future investment environment, cash requirements, domestic and
overseas competitive conditions and capital budget requirements, while taking into account
shareholders’ interest, maintenance of balanced dividend and the Company’s long-term
financial plan. If the current-year retained earnings available for distribution reach 2% of the
paid-in capital of the Company, dividend to be distributed shall be no less than 20% of the
current-year retained earnings available for distribution. If the current-year retained earnings
available for distribution do not reach 2% of the paid-in capital of the Company, the Company
may decide not to distribute dividend. The cash portion of the dividend, which may be in the
form of cash and stock, shall not be less than 10% of the total dividend distributed during the

AU Optronics 2019 Annual Report
(Continued)
AU OPTRONICS CORP.
Notes to Parent Company Only Financial Statements
240
year. The dividend distribution ratio aforementioned could be adjusted after taking into
consideration factors such as finance, business and operations, etc.
Pursuant to relevant laws or regulations or as requested by the local authority, total net debit
balance of the other components of equity shall be set aside from current earnings as special
reserve, and not for distribution. Subsequent decrease pertaining to items that are accounted for
as a reduction to the other components of equity shall be reclassified from special reserve to
undistributed earnings.
The Company’s appropriations of earnings for 2017 had been approved in the shareholders’
meeting held on June 15, 2018. The appropriations and dividends per share were as follows:
For fiscal year 2017
Appropriation
of earnings
Dividends per
share
(in thousands, except for per share data)
Legal reserve $ 3,235,942
Cash dividends to shareholders 14,436,368 $1.50
$ 17,672,310
The aforementioned appropriation of earnings for 2017 was consistent with the resolutions of
the board of directors’ meeting held on March 23, 2018.
The Company’s appropriations of earnings for 2018 had been approved in the shareholders’
meeting held on June 14, 2019. The appropriations and dividends per share were as follows:
For fiscal year 2018
Appropriation
of earnings
Dividends per
share
(in thousands, except for per share data)
Legal reserve $ 1,016,060
Special reserve 847,770
Cash dividends to shareholders 4,812,122 $0.50
$ 6,675,952
The aforementioned appropriation of earnings for 2018 was consistent with the resolutions of
the board of directors’ meeting held on March 22, 2019.
Information on the approval of board of directors and shareholders for the Company’s
appropriations of earnings are available at the Market Observation Post System website.
e. Treasury shares
According to the resolution approved by the board of directors’ meeting held on September 9,
2019, the Company expects to repurchase 125,000 thousand shares as treasury shares transferred
to employees in accordance with Securities and Exchange Act requirements. The related
information on treasury share transactions was as follows:
For the year ended December 31, 2019
Reason for reacquisition
Number of
shares,
Beginning of
Year Additions Reductions
Number of
shares, End of Year
(in thousands of shares)
Transferring to employees - 125,000 - 125,000

AU Optronics 2019 Annual Report
(Continued)
AU OPTRONICS CORP.
Notes to Parent Company Only Financial Statements
Appendix 2
241
Pursuant to the Securities and Exchange Act, the number of shares repurchased shall not exceed
10 percent of the number of the company’s issued and outstanding shares, and the total amount
repurchased shall not exceed the sum of the company’s retained earnings, share premium, and
realized capital surplus. Also, the shares repurchased for transferring to employees shall be
transferred within five years from the date of reacquisition and those shares not transferred
within the five-year period are to be retired.
In accordance with the Securities and Exchange Act, treasury shares held by the Company shall
not be pledged, and do not hold any shareholder rights before their transfer.
f. Other components of equity
Cumulative
translation
differences
Unrealized
gains (losses)
on financial
assets at
FVTOCI Total
(in thousands)
Balance at January 1, 2019 $ (1,449,910) 602,140 (847,770)
Foreign operations – foreign currency translation
differences (1,211,454) - (1,211,454)
Net change in fair value of financial assets at
FVTOCI - 536,369 536,369
Equity-accounted investees – share of other
comprehensive income (846,480) (13,911) (860,391)
Related tax 377,862 - 377,862
Balance at December 31, 2019 $ (3,129,982) 1,124,598 (2,005,384)
Cumulative
translation
differences
Unrealized
gains (losses)
on financial
assets at
FVTOCI
Unrealized
gains (losses)
on available-
for-sale
financial
assets Total
(in thousands)
Balance at January 1, 2018 $ (1,120,969) - 1,377,031 256,062
Adjustments on initial application of
new standards - 1,303,816 (1,377,031) (73,215)
Foreign operations – foreign currency
translation differences 1,685,563 - - 1,685,563
Net change in fair value of financial
assets at FVTOCI - (756,179) - (756,179)
Equity-accounted investees – share of
other comprehensive income (2,125,649) 4,419 - (2,121,230)
Cumulative unrealized loss of equity
instruments transferred to retained
earnings due to disposal - 50,084 - 50,084
Group reorganization (22,225) - - (22,225)
Related tax 133,370 - - 133,370
Balance at December 31, 2018 $ (1,449,910) 602,140 - (847,770)

AU Optronics 2019 Annual Report
(Continued)
AU OPTRONICS CORP.
Notes to Parent Company Only Financial Statements
242
(18) Revenue from Contracts with Customers
For the year ended December 31, 2019
Display
segment
Energy
segment
Total
segments
(in thousands)
Primary geographical markets:
PRC (including Hong Kong) $ 92,747,943 1,262,345 94,010,288
Taiwan 76,020,646 4,486,119 80,506,765
Singapore 38,550,665 7,666 38,558,331
Japan 18,861,590 280,429 19,142,019
Others 21,459,052 1,490,721 22,949,773
$ 247,639,896 7,527,280 255,167,176
Major products:
Products for Televisions $ 86,426,165 - 86,426,165
Products for Mobile PCs and Devices 69,290,266 - 69,290,266
Products for Monitors 39,522,268 - 39,522,268
Products for Commercial and Others(i) 52,401,197 - 52,401,197
Solar Products - 7,527,280 7,527,280
$ 247,639,896 7,527,280 255,167,176
Major customers:
Customer A $ 31,426,701 - 31,426,701
Others (individually not greater than 10%) 216,213,195 7,527,280 223,740,475
$ 247,639,896 7,527,280 255,167,176
For the year ended December 31, 2018
Display
segment
Energy
segment
Total
segments
(in thousands)
Primary geographical markets:
PRC (including Hong Kong) $ 109,586,951 1,031,491 110,618,442
Taiwan 91,085,995 5,464,243 96,550,238
Singapore 39,367,379 - 39,367,379
Japan 16,888,485 460,783 17,349,268
Others 24,898,667 4,276,345 29,175,012
$ 281,827,477 11,232,862 293,060,339
Major products:
Products for Televisions $ 110,451,334 - 110,451,334
Products for Mobile PCs and Devices 74,393,888 - 74,393,888
Products for Monitors 47,032,467 - 47,032,467
Products for Commercial and Others(i) 49,949,788 - 49,949,788
Solar Products - 11,232,862 11,232,862
$ 281,827,477 11,232,862 293,060,339
Major customers:
Customer A $ 34,869,029 - 34,869,029
Others (individually not greater than 10%) 246,958,448 11,232,862 258,191,310
$ 281,827,477 11,232,862 293,060,339

AU Optronics 2019 Annual Report
(Continued)
AU OPTRONICS CORP.
Notes to Parent Company Only Financial Statements
Appendix 2
243
(i) Others include sales from products for other applications and sales of raw materials, components and
from service charges.
(19) Remuneration to Employees and Directors
According to the Company’s Articles of Incorporation, the Company should distribute remuneration
to employees and directors no less than 5% and no more than 1% of annual profits before income
tax, respectively, after offsetting accumulated deficits, if any. Only employees, including employees
of affiliate companies that meet certain conditions are entitled to the abovementioned remuneration
which to be distributed in stock or cash. The said conditions and distribution method are decided by
board of directors or the personnel authorized by board of directors.
The Company did not accrue remuneration to employees and directors due to the loss making
position for the year ended December 31, 2019.
The Company accrued remuneration to employees based on the profit before income tax excluding
the remuneration to employees and directors for the period, multiplied by the percentage resolved by
board of directors. For the year ended December 31, 2018, the Company estimated the remuneration
to employees amounting to $1,215,696 thousand. Remuneration to directors was estimated based on
the amount expected to pay and recognized together with the remuneration to employees as cost of
sales or operating expenses. If remuneration to employees is resolved to be distributed in stock, the
number of shares is determined by dividing the amount of remuneration by the closing price of the
shares (ignoring ex-dividend effect) on the day preceding the board of directors’ meeting. If there is
a change in the proposed amounts after the annual financial statements are authorized for issue, the
differences are accounted for as a change in accounting estimate and adjusted prospectively to next
year’s profit or loss.
Remuneration to employees and directors for 2018 in the amounts of $1,215,696 thousand and
$27,780 thousand, respectively, in cash for payment had been approved in the meeting of board of
directors held on March 22, 2019. The aforementioned approved amounts are the same as the
amounts charged against earnings of 2018.
Remuneration to employees and directors for 2017 in the amounts of $4,062,114 thousand and
$132,604 thousand, respectively, in cash for payment had been approved in the meeting of board of
directors held on March 23, 2018. The aforementioned approved amounts are the same as the
amounts charged against earnings of 2017.
The information about the Company’s remuneration to employees and directors is available at the
Market Observation Post System website.
(20) The Nature of Expenses For the years ended December 31,
2019 2018
Recognized
in cost of
sales
Recognized
in
operating
expenses Total
Recognized
in cost of
sales
Recognized
in
operating
expenses Total
(in thousands)
Employee benefits expenses:
Salaries and wages 14,352,414 5,242,481 19,594,895 16,109,604 5,554,392 21,663,996
Labor and health insurances 1,322,702 391,763 1,714,465 1,394,015 407,740 1,801,755
Retirement benefits 668,826 245,385 914,211 707,531 251,458 958,989
Remuneration to directors - 31,681 31,681 - 58,713 58,713
Other employee benefits 1,275,784 214,908 1,490,692 1,236,157 242,955 1,479,112
Depreciation(i) 20,708,657 2,812,046 23,520,703 18,424,568 2,443,620 20,868,188
Amortization 424,985 - 424,985 506,391 - 506,391
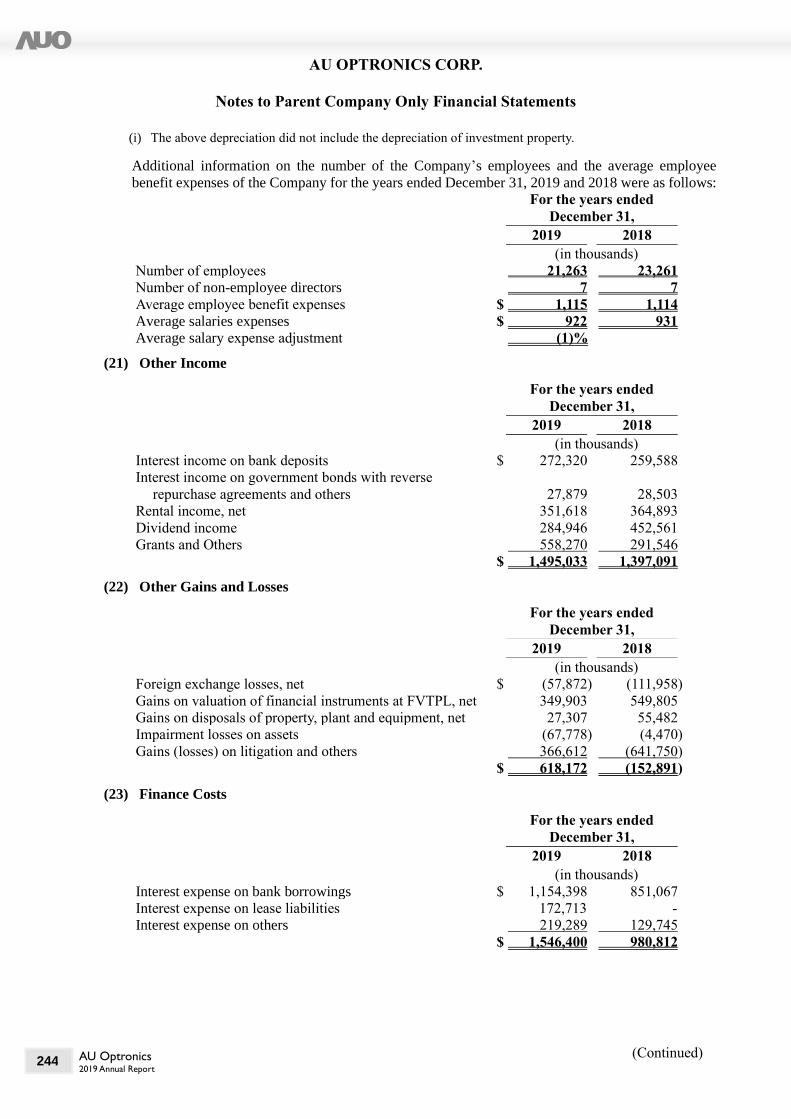
AU Optronics 2019 Annual Report
(Continued)
AU OPTRONICS CORP.
Notes to Parent Company Only Financial Statements
244
(i) The above depreciation did not include the depreciation of investment property.
Additional information on the number of the Company’s employees and the average employee
benefit expenses of the Company for the years ended December 31, 2019 and 2018 were as follows:
For the years ended
December 31,
2019 2018
(in thousands)
Number of employees 21,263 23,261
Number of non-employee directors 7 7
Average employee benefit expenses $ 1,115 1,114
Average salaries expenses $ 922 931
Average salary expense adjustment (1)%
(21) Other Income
For the years ended
December 31,
2019 2018
(in thousands)
Interest income on bank deposits $ 272,320 259,588
Interest income on government bonds with reverse
repurchase agreements and others 27,879 28,503
Rental income, net 351,618 364,893
Dividend income 284,946 452,561
Grants and Others 558,270 291,546
$ 1,495,033 1,397,091
(22) Other Gains and Losses
For the years ended
December 31,
2019 2018
(in thousands)
Foreign exchange losses, net $ (57,872) (111,958)
Gains on valuation of financial instruments at FVTPL, net 349,903 549,805
Gains on disposals of property, plant and equipment, net 27,307 55,482
Impairment losses on assets (67,778) (4,470)
Gains (losses) on litigation and others 366,612 (641,750)
$ 618,172 (152,891)
(23) Finance Costs
For the years ended
December 31,
2019 2018
(in thousands)
Interest expense on bank borrowings $ 1,154,398 851,067
Interest expense on lease liabilities 172,713 -
Interest expense on others 219,289 129,745
$ 1,546,400 980,812

AU Optronics 2019 Annual Report
(Continued)
AU OPTRONICS CORP.
Notes to Parent Company Only Financial Statements
Appendix 2
245
(24) Income Taxes
a. Income tax expense
The components of income tax expense for the years ended December 31, 2019 and 2018 were
as follows:
For the years ended
December 31,
2019 2018
(in thousands)
Current income tax expense (benefit):
Current year $ - 1,266,731
Adjustment to prior years and others (244,624) (388,025)
(244,624) 878,706
Deferred tax expense (benefit):
Temporary differences 553,216 (413,271)
Investment tax credit and tax losses carryforwards 530,002 1,911,841
Effect of changes in statutory income tax rate - (552,881)
1,083,218 945,689
Total income tax expense $ 838,594 1,824,395
Income taxes expense (benefit) recognized directly in other comprehensive income for the years
ended December 31, 2019 and 2018 were as follows:
For the years ended
December 31,
2019 2018
(in thousands)
Items that will never be reclassified to profit or loss:
Remeasurement of defined benefit obligations $ 37,622 (38,908)
Items that are or may be reclassified subsequently to
profit or loss:
Foreign operations – foreign currency translation
differences $ (242,291) 241,618
Equity-accounted investees – share of other
comprehensive income (135,571) (374,988)
$ (377,862) (133,370)
Reconciliation of the expected income tax expense (benefit) calculated based on the ROC
statutory income tax rate compared with the actual income tax expense as reported in the
statements of comprehensive income for the years ended December 31, 2019 and 2018, was as
follows:

AU Optronics 2019 Annual Report
(Continued)
AU OPTRONICS CORP.
Notes to Parent Company Only Financial Statements
246
For the years ended
December 31,
2019 2018
(in thousands)
Income tax expense at statutory tax rate $ (3,669,333) 2,396,999
Tax on undistributed earnings, net - 1,266,731
Effect of changes in statutory income tax rate - (552,881)
Net of non-taxable income and non-deductible expense 442,825 (67,590)
Effect of change of unrecognized deductible temporary
differences, tax losses carryforwards, and investment
tax credits 4,309,726 (830,839)
Adjustments to prior year (244,624) (388,025)
Income tax expense $ 838,594 1,824,395
b. Deferred tax assets and liabilities
Deferred tax assets have not been recognized in respect of the following items.
December 31,
2019 2018
(in thousands)
Deductible temporary differences $ 976,183 253,978
Unused tax losses carryforwards 14,453,820 11,276,085
$ 15,430,003 11,530,063
Under the ROC tax laws, approved tax losses can be carried forward for 10 years to offset future
taxable profits.
As of December 31, 2019, the expiration period for abovementioned unrecognized deferred tax
assets of unused tax losses carryforwards were as follows:
Year of assessment
Unrecognized
deferred tax assets
Expiration in year
(in thousands)
2011 $ 1,801,079 2021
2012 9,667,511 2022
2019 (estimated) 2,985,230 2029
$ 14,453,820
As of December 31, 2019, the aggregate taxable temporary differences associated with
investments in subsidiaries not recognized as deferred tax liabilities amounted to $277,670
thousand.

AU Optronics 2019 Annual Report
(Continued)
AU OPTRONICS CORP.
Notes to Parent Company Only Financial Statements
Appendix 2
247
The components of and changes in deferred tax assets and liabilities were as follows:
Deferred tax assets Deferred tax liabilities Total
December 31,
2019
December 31,
2018
December 31,
2019
December 31,
2018
December 31,
2019
December 31,
2018
(in thousands)
Tax losses carryforwards $ 2,120,783 2,650,785 - - 2,120,783 2,650,785
Unrealized loss and expenses 161,146 303,467 - (2,586) 161,146 300,881
Inventories write-down 857,255 809,322 - - 857,255 809,322
Accumulated amortization of goodwill in
accordance with local tax laws - - (2,213,429) (2,213,429) (2,213,429) (2,213,429)
Remeasurement of defined benefit plans 157,216 194,838 - - 157,216 194,838
Others 969,080 1,193,399 - (140,767) 969,080 1,052,632
$ 4,265,480 5,151,811 (2,213,429) (2,356,782) 2,052,051 2,795,029
January 1,
2018
Recognized
in profit or
loss
Recognized
in other
comprehensive
income
December
31, 2018
Recognized
in profit or
loss
Recognized
in other
comprehensive
income
December
31, 2019
Deferred tax assets (liabilities):
(in thousands)
Tax losses carryforwards $ 3,878,232 (1,227,447) - 2,650,785 (530,002) - 2,120,783
Unrealized loss and expenses 191,866 109,015 - 300,881 (139,735) - 161,146
Inventories write-down 531,108 278,214 - 809,322 47,933 - 857,255
Accumulated amortization of goodwill in
accordance with local tax laws (1,881,415) (332,014) - (2,213,429) - - (2,213,429)
Remeasurement of defined benefit plans 155,930 - 38,908 194,838 - (37,622) 157,216
Others 692,719 226,543 133,370 1,052,632 (461,414) 377,862 969,080
$ 3,568,440 (945,689) 172,278 2,795,029 (1,083,218) 340,240 2,052,051
c. Assessments by the tax authorities
As of December 31, 2019, the tax authorities have completed the examination of income tax
returns of the Company through 2017.
(25) Earnings (Loss) per Share
For the years ended
December 31,
2019 2018
(in thousands, except for per
share data)
Basic earnings (loss) per share
Profit (loss) attributable to shareholders $ (19,185,258) 10,160,598
Weighted-average number of common shares
outstanding during the year
9,597,268 9,624,245
Basic earnings (loss) per share (NT$) $ (2.00) 1.06
Diluted earnings (loss) per share
Profit (loss) attributable to shareholders $ (19,185,258) 10,160,598
Weighted-average number of common shares
outstanding during the year
9,597,268
9,624,245
Effect of employee remuneration in stock - 164,609
9,597,268 9,788,854
Diluted earnings (loss) per share (NT$) $ (2.00) 1.04

AU Optronics 2019 Annual Report
(Continued)
AU OPTRONICS CORP.
Notes to Parent Company Only Financial Statements
248
Since AUO incurred net loss for the year ended December 31, 2019, there were no potential ordinary
shares with dilutive effect for the year.
(26) Cash Flow Information
The reconciliation of liabilities to cash flows arising from financing activities was as follows:
Long-term
borrowings
(including
current
installments)
Guarantee
deposits Lease liabilities
Total liabilities
from financing
activities
(in thousands)
Balance at January 1, 2019 $ 51,945,545 757,315 10,788,985 63,491,845
Cash flows 33,813,000 (442,719) 33,370,281
Non-cash changes:
Increase (decrease) in lease
liabilities
- - (920,691) (920,691)
Changes in exchange rate - (29,228) - (29,228)
Amortization on transaction costs 207,565 - - 207,565
Balance at December 31, 2019 $ 85,966,110 728,087 9,425,575 96,119,772
Long-term
borrowings
(including current
installments)
Guarantee
deposits
Total liabilities
from financing
activities
(in thousands)
Balance at January 1, 2018 $ 77,902,271 765,883 78,668,154
Cash flows (26,080,800) - (26,080,800)
Non-cash changes:
Changes in exchange rate - (8,568) (8,568)
Amortization on transaction costs 124,074 - 124,074
Balance at December 31, 2018 $ 51,945,545 757,315 52,702,860
(27) Financial Instruments
a. Fair value and carrying amount
The carrying amounts of the Company’s current non-derivative financial instruments, including
financial assets at amortized cost and financial liabilities at amortized cost, were considered to
approximate their fair value due to their short-term nature. This methodology applies to cash
and cash equivalents, receivables or payables (including related parties) and other current
financial assets.
Disclosures of fair value are not required for the financial instruments abovementioned and lease
liabilities. Other than those, the carrying amount and fair value of other financial instruments of
the Company as of December 31, 2019 and 2018 were as follows:
December 31, 2019 December 31, 2018
Carrying
Amount Fair Value
Carrying
Amount Fair Value
(in thousands)
Financial assets:
Financial assets at FVTPL:
Financial assets mandatorily
measured at FVTPL $ 18,753 18,753 52,434 52,434
Financial assets at FVTOCI 7,140,410 7,140,410 6,604,041 6,604,041
Financial assets at amortized cost:
Refundable deposits 543,530 543,530 585,697 585,697
Financial liabilities:
Financial liabilities at FVTPL:
Financial liabilities held for
trading 7,054 7,054 13,973 13,973

AU Optronics 2019 Annual Report
(Continued)
AU OPTRONICS CORP.
Notes to Parent Company Only Financial Statements
Appendix 2
249
December 31, 2019 December 31, 2018
Carrying
Amount Fair Value
Carrying
Amount Fair Value
(in thousands)
Financial liabilities at amortized
cost:
Long-term borrowings (including
current installments) 85,966,110 85,966,110 51,945,545 51,945,545
Guarantee deposits 728,087 728,087 757,315 757,315
b. Valuation techniques and assumptions applied in fair value measurement
The fair values of financial assets and financial liabilities with standard terms and conditions
and traded in active markets are determined with reference to quoted market prices. The fair
values of other financial assets and financial liabilities without quoted market prices are
estimated using valuation approach. The estimates and assumptions used are the same as those
used by market participants in the pricing of financial instruments.
Fair value of foreign currency forward contract is measured based on the maturity date of each
contract with quoted spot rate and quoted swap points from Reuters quote system.
The refundable deposits and guarantee deposits are based on carrying amount as there is no
fixed maturity.
The fair value of floating-rate long-term borrowings approximates to their carrying value.
c. Fair value measurements recognized in the balance sheets
The Company determines fair value based on assumptions that market participants would use
in pricing an asset or a liability in the principal market. When considering market participant
assumptions in fair value measurements, the following fair value hierarchy distinguishes
between observable and unobservable inputs, which are categorized in one of the following
levels:
(i) Level 1 inputs: Unadjusted quoted prices for identical assets or liabilities in active markets.
(ii) Level 2 inputs: Other than quoted prices included within Level 1, inputs are observable for
the asset or liability, either directly (i.e. as prices) or indirectly (i.e. derived from prices).
(iii) Level 3 inputs: Derived from valuation techniques that include inputs for the asset or
liability that are not based on observable market data (unobservable inputs).
The fair value measurement level of an asset or a liability within their fair value hierarchy is
based on the lowest level of any input that is significant to the fair value measurement. The
Company uses valuation techniques that maximize the use of observable inputs and minimize
the use of unobservable inputs.
Level 1 Level 2 Level 3 Total
(in thousands)
December 31, 2019
Financial assets at FVTPL:
Financial assets mandatorily measured at
FVTPL
$ - 18,753 - 18,753
Financial assets at FVTOCI 7,140,410 - - 7,140,410
Financial liabilities at FVTPL:
Financial liabilities held for trading - 7,054 - 7,054
December 31, 2018
Financial assets at FVTPL:
Financial assets mandatorily measured at
FVTPL
- 52,434 - 52,434

AU Optronics 2019 Annual Report
(Continued)
AU OPTRONICS CORP.
Notes to Parent Company Only Financial Statements
250
Level 1 Level 2 Level 3 Total
(in thousands)
Financial assets at FVTOCI 6,604,041 - - 6,604,041
Financial liabilities at FVTPL:
Financial liabilities held for trading - 13,973 - 13,973
There were no transfers between Level 1 and 2 for the years ended December 31, 2019 and 2018.
(28) Financial Risk Management
a. Risk management framework
The managerial officers of related divisions are appointed to review, control, trace and monitor
the strategic risks, financial risks and operational risks faced by the Company. The managerial
officers report to executive officers the progress of risk controls from time to time and, if
necessary, report to the board of directors, depending on the extent of impact of risks.
b. Financial risk information
Hereinafter discloses information about the Company’s exposure to variable risks, and the goals,
policies and procedures of the Company’s risk measurement and risk management.
The Company is exposed to the following risks due to usage of financial instruments:
(i) Credit risk
Credit risk is the risk of financial loss to the Company if a customer or counterparty to a
financial instrument fails to meet its contractual obligations. The Company’s exposures to
credit risk are mainly from:
(a) The carrying amount of financial assets recognized in the balance sheets.
(b) The amount of contingent liabilities as a result from the Company providing financial
guarantee to its customers.
The Company’s potential credit risk is derived primarily from cash in bank, cash
equivalents and trade receivables. The Company deposits its cash and cash equivalent
investments with various reputable financial institutions of high credit quality. There
should be no major concerns for the performance capability of trading counterparts.
Management performs periodic evaluations of the relative credit standing of these financial
institutions and limits the amount of credit exposure with any one institution. Management
believes that there is a limited concentration of credit risk in cash in banks and cash
equivalents.
The majority of the Company’s customers are in high technology industries.
Management continuously evaluates and controls the credit quality, credit limit and
financial strength of its customers to ensure any overdue receivables are taken necessary
procedures. The Company also flexibly makes use of prepayments, accounts receivable
factoring and credit insurance as credit enhancement instruments. If necessary, the
Company will request collaterals or assurance from its customers in order to reduce the
credit risk from particular customers.
Additionally, on the reporting date, the Company reviews the recoverability of its
receivables to provide appropriate valuation allowances. Consequently, management
believes there is a limited concentration of its credit risk.
For the years ended December 31, 2019 and 2018, the Company’s five largest customers
accounted for 38.7% and 37.8%, respectively, of the Company’s net revenue. There is no
other significant concentration of credit risk.

AU Optronics 2019 Annual Report
(Continued)
AU OPTRONICS CORP.
Notes to Parent Company Only Financial Statements
Appendix 2
251
Refer to Note 6(4) for expected credit loss analysis of accounts receivable and the
movement in the loss allowance of accounts receivable.
For credit of guarantee, the Company’s policy is to provide financial guarantees only to
subsidiaries. Refer to Note 13(1)b. for information about endorsements or guarantees
provided by the Company to its subsidiaries as of December 31, 2019.
(ii) Liquidity risk
Liquidity risk is the risk that the Company has no sufficient working capital and unused
credit facilities to meet its obligations associated with matured financial liabilities, that may
resulting from an economic downturn or uneven demand and supply in the market and
cause a significant decrease in product selling prices and market demands.
Liquidity risk of the Company is monitored through its corporate treasury department
which tracks the development of the actual cash flow position for the Company and uses
input from a number of sources in order to forecast the overall liquidity position both on a
short and long term basis. Corporate treasury invests surplus cash in money market deposits
with appropriate maturities to ensure sufficient liquidity is available to meet liabilities when
due, without incurring unacceptable losses or risking damage to the Company’s reputation.
The following, except for payables (including related parties) and equipment and
construction payable, are the contractual maturities of other financial liabilities. The
amounts include estimated interest payments but exclude the impact of netting
agreements.
Contractual
cash flows
2020.1.1~
2020.12.31
2021.1.1~
2022.12.31
2023.1.1~
2024.12.31
2025 and
thereafter
(in thousands)
December 31, 2019
Non-derivative financial liabilities
Long-term borrowings (including
current installments)
$ 90,585,552 5,494,005 39,068,031 45,000,942 1,022,574
Guarantee deposits 728,087 - - - 728,087
Derivative financial instruments
Foreign currency forward
contracts-inflows
(12,006,046) (12,006,046) - - -
Foreign currency forward
contracts-outflows
12,010,120 12,010,120 - - -
$ 91,317,713 5,498,079 39,068,031 45,000,942 1,750,661
Contractual
cash flows
2019.1.1~
2019.12.31
2020.1.1~
2021.12.31
2022.1.1~
2023.12.31
2024 and
thereafter
(in thousands)
December 31, 2018
Non-derivative financial liabilities
Long-term borrowings (including
current installments)
$ 53,691,689 22,903,847 28,468,316 2,319,526 -
Guarantee deposits 757,315 - - - 757,315
Derivative financial instruments
Foreign currency forward
contracts-inflows (16,354,682) (16,354,682) - - -
Foreign currency forward
contracts-outflows 16,337,417 16,337,417 - - -
$ 54,431,739 22,886,582 28,468,316 2,319,526 757,315
The Company is not expecting that the cash flows included in the maturity analysis could
occur significantly earlier or at significantly different amounts.
As at December 31, 2019, the management believes the Company’s existing unused
credit facilities under its existing loan agreements, together with net cash flows expected

AU Optronics 2019 Annual Report
(Continued)
AU OPTRONICS CORP.
Notes to Parent Company Only Financial Statements
252
to be generated from its operating activities, will be sufficient for the Company to fulfill
its payment obligations. Therefore, management believes that the Company does not have
significant liquidity risk.
(iii) Market risk
Market risk is the risk that changes in market prices, such as foreign exchange rates, interest
rates and equity prices, which will affect the Company’s income or the value of its holdings
of financial instruments. The objective of market risk management is to manage and control
market risk exposures within acceptable range, while optimizing the return.
The Company buys and sells derivatives, and also incurs financial assets and liabilities, in
order to manage market risks. All such transactions are executed in accordance with the
Company’s handling procedures for conducting derivative transactions, and also monitored
by internal audit department.
(a) Currency risk
The Company is exposed to currency risk on foreign currency denominated financial
assets and liabilities arising from operating, financing and investing activities such
that the Company uses forward exchange contracts to hedge its currency risk. Gains
and losses derived from the foreign currency fluctuations on underlying assets and
liabilities are likely to offset. However, transactions of derivative financial instruments
help minimize the impact of foreign currency fluctuations, but the risk cannot be fully
eliminated.
The Company periodically examines portions exposed to currency risks for individual
asset and liability denominated in foreign currency and uses forward contracts as
hedging instruments to hedge positions exposed to risks. The contracts have maturity
dates that do not exceed six months, and do not meet the criteria for hedge accounting.
I. Exposure of currency risk
The Company’s significant exposure to foreign currency risk was as follows:
December 31, 2019 December 31, 2018
Foreign
currency
amounts
Exchange
rate NTD
Foreign
currency
amounts
Exchange
rate NTD
(in thousands) (in thousands) (in thousands) (in thousands)
Financial assets
Monetary items
USD $ 1,133,061 30.1350 34,144,793 1,716,412 30.8020 52,868,922
JPY 19,604,815 0.2768 5,426,613 8,705,129 0.2775 2,415,673
EUR 45,485 33.7422 1,534,764 28,478 35.2036 1,002,528
Non-monetary items
USD 1,765,302 30.1350 53,197,376 1,743,967 30.8020 53,717,672
Financial liabilities
Monetary items
USD 1,236,623 30.1350 37,265,634 1,511,459 30.8020 46,555,960
JPY 23,792,658 0.2768 6,585,808 29,016,969 0.2775 8,052,209
EUR 2,910 33.7422 98,190 3,490 35.2036 122,861
II. Sensitivity analysis
The Company’s exposure to foreign currency risk arises mainly from the
translation of the foreign currency exchange gains and losses on cash and cash
equivalents, trade receivables, loans and borrowings and trade payables that are
denominated in foreign currency. Depreciation or appreciation of the NTD by 1%
against the USD, EUR and JPY at December 31, 2019 and 2018, while all other
variables were remained constant, would have increased or decreased the net
profit before tax for the years ended December 31, 2019 and 2018 as follows:

AU Optronics 2019 Annual Report
(Continued)
AU OPTRONICS CORP.
Notes to Parent Company Only Financial Statements
Appendix 2
253
For the years ended
December 31,
2019 2018
(in thousands)
1% of depreciation $ (28,435) 15,561
1% of appreciation 28,435 (15,561)
III. Foreign exchange gain (loss) on monetary items
With varieties of functional currencies within the Company, the Company
disclosed foreign exchange gain (loss) on monetary items in aggregate. The
aggregate of realized and unrealized foreign exchange losses for the years ended
December 31, 2019 and 2018 were $57,872 thousand and $111,958 thousand,
respectively.
(b) Interest rate risk
The Company’s exposure to changes in interest rates is mainly from floating-rate long-
term debt obligations. Any change in interest rates will cause the effective interest
rates of long-term borrowings to change and thus cause the future cash flows to
fluctuate over time. The Company will, depending on the market condition, enter into
and designate interest rate swaps as hedges of the variability in cash flows attributable
to interest rate risk.
Assuming the amount of floating-rate debts at the end of the reporting period had been
outstanding for the entire year and all other variables were remained constant, an
increase or a decrease in the interest rate by 0.25% would have resulted in a decrease
or an increase in the net profit before tax for the years ended December 31, 2019 and
2018 by $215,500 thousand and $130,968 thousand, respectively.
(c) Equity price risk
See Note 6(3) for disclosure of equity price risk analysis.
(29) Capital Management
Through clear understanding and managing of significant changes in external environment, related
industry characteristics, and corporate growth plan, the Company manages its capital structure to
ensure it has sufficient financial resources to sustain proper liquidity, to invest in capital
expenditures and research and development expenses, to repay debts and to distribute dividends in
accordance to its plan. The management pursues the most suitable capital structure by monitoring
and maintaining proper financial ratios as below. The Company aims to enhance the returns of its
shareholders through achieving an optimized debt-to-equity ratio from time to time.
December 31,
2019 2018
(in thousands)
Long-term borrowings (including current installments) $ 85,966,110 51,945,545
Total liabilities 168,993,027 144,541,806
Total equity 176,671,840 202,862,715
Debt-to-equity ratio 96% 71%
Net debt-to-equity ratio(i) 23% 11%
(i) Net debt-to-equity ratio is defined as long-term borrowings less cash and cash equivalents and divided by total equity.

AU Optronics 2019 Annual Report
(Continued)
AU OPTRONICS CORP.
Notes to Parent Company Only Financial Statements
254
7. Related-party Transactions
(1) Name and relationship of related parties
The following is a summary of subsidiaries and related parties that have had transactions with the
Company during the periods presented in the parent company only financial statements.
Name of related party Relationship with the Company
AU Optronics (L) Corp. (“AULB”) Subsidiary of the Company
Konly Venture Corp. (“Konly”) Subsidiary of the Company
Ronly Venture Corp. (“Ronly”) Subsidiary of the Company
Darwin Precisions Corporation (“DPTW”) Subsidiary of the Company
AUO Crystal Corp. (“ACTW”) Subsidiary of the Company
Space Money Inc. (“SMI”) Subsidiary of the Company
U-Fresh Technology Inc. (“UTI”) Subsidiary of the Company
AU Optronics Corporation America (“AUUS”) Subsidiary of the Company
AU Optronics Corporation Japan (“AUJP”) Subsidiary of the Company
AU Optronics Europe B.V. (“AUNL”) Subsidiary of the Company
AU Optronics Korea Ltd. (“AUKR”) Subsidiary of the Company
AU Optronics Singapore Pte. Ltd. (“AUSG”) Subsidiary of the Company
AU Optronics (Czech) s.r.o. (“AUCZ”) Subsidiary of the Company
AU Optronics (Shanghai) Co., Ltd. (“AUSH”) Subsidiary of the Company
AU Optronics (Xiamen) Corp. (“AUXM”) Subsidiary of the Company
AU Optronics (Suzhou) Corp., Ltd. (“AUSZ”) Subsidiary of the Company
AU Optronics (Slovakia) s.r.o. (“AUSK”) Subsidiary of the Company
AFPD Pte., Ltd. (“AUST”) Subsidiary of the Company
AU Optronics (Kunshan) Co., Ltd. (“AUKS”) Subsidiary of the Company
a.u. Vista Inc. (“AUVI”) Subsidiary of the Company
Fortech Electronics (Suzhou) Co., Ltd. (“FTWJ”) Subsidiary of the Company
Darwin Precisions (Xiamen) Corp. (“DPXM”) Subsidiary of the Company
BriView (Xiamen) Corp. (“BVXM”) Subsidiary of the Company
AUO Green Energy Europe B.V. (“AENL”) Subsidiary of the Company
ComQi Inc. (“CQUS”) Subsidiary of the Company
Lextar Electronics Corporation (“Lextar”) Associate of the Company
Raydium Semiconductor Corporation (“Raydium”) Associate of the Company
Star River Energy Corp. (“SREC”) Associate of the Company
Sungen Power Corporation (“SGPC”) Subsidiary of SREC
Evergen Power Corporation (EGPC) Subsidiary of SREC
Star Shining Energy Corporation (“SSEC”) Associate of the Company
TronGen Power Corporation (“TGPC”) Subsidiary of SSEC
Fargen Power Corporation (“FGPC”) Subsidiary of SSEC
Ri Ji Power Corporation (“RJPC”) Subsidiary of SSEC
Ri Jing Power Corporation (“RGPC”) Subsidiary of SSEC
ChampionGen Power Corporation (“CGPC”) Subsidiary of SSEC
Daxin Materials Corp. (“Daxin”) Associate of the Company
Qisda Corporation (“Qisda”) Corporate shareholder of the Company of which
accounts for the Company using the equity
method
Qisda (Suzhou) Co., Ltd. (“QCSZ”) Subsidiary of Qisda
Qisda Electronics (Suzhou) Co., Ltd. (“QCES”) Subsidiary of Qisda
Qisda Optronics (Suzhou) Co., Ltd. (“QCOS”) Subsidiary of Qisda
Qisda Japan Co., Ltd. (“QJTO”) Subsidiary of Qisda
Mainteq Europe B.V. (“MQE”) Subsidiary of Qisda
BenQ Corporation (“BenQ”) Subsidiary of Qisda
BenQ Materials Corp. (“BMC”) Subsidiary of Qisda
BenQ Asia Pacific Corp. (“BQP”) Subsidiary of Qisda
BenQ America Corporation (“BQA”) Subsidiary of Qisda
DFI Inc. (“DFI”) Subsidiary of Qisda
Data Image Corporation (“DIC”) Subsidiary of Qisda
Data Image (Suzhou) Corporation (“DICSZ”) Subsidiary of Qisda
Sysage Technology Co., Ltd. (“Sysage”) Subsidiary of Qisda

AU Optronics 2019 Annual Report
(Continued)
AU OPTRONICS CORP.
Notes to Parent Company Only Financial Statements
Appendix 2
255
Name of related party Relationship with the Company
Qisda Vietnam Co., Ltd (“QVH”) Subsidiary of Qisda
TRENDYLITE CORPORATION (“TRENDYLITE“) Subsidiary of Lextar
BenQ Foundation Substantive related party
AUO Foundation Substantive related party
Note : For the information in respect of the Company’s subsidiaries, please refer to the consolidated financial statements
for the years ended December 31, 2019 and 2018.
(2) Compensation to key management personnel
Key management personnel’s compensation comprised:
For the years ended
December 31,
2019 2018
(in thousands)
Short-term employee benefits $ 238,873 334,713
Post-employment benefits 2,633 2,457
$ 241,506 337,170

AU Optronics 2019 Annual Report
(Continued)
AU OPTRONICS CORP.
Notes to Parent Company Only Financial Statements
256
(3) Except for otherwise disclosed in other notes to the parent company only financial statements, the
Company’s significant related party transactions and balances were as follows:
a. Sales
Sales
Accounts receivable
from related parties
For the years ended
December 31, December 31,
2019 2018 2019 2018
(in thousands)
Subsidiaries $ 4,053,100 2,476,237 313,465 2,028,364
Associates 1,124,483 1,871,511 236,971 659,372
Others 10,051,582 11,651,266 1,388,530 1,937,594
$ 15,229,165 15,999,014 1,938,966 4,625,330
The collection terms for sales to related parties were 25 to 55 days from the end of the month
during which the invoice is issued. The pricing for sales to related parties were not materially
different from those with third parties.
b. Purchases
Purchases
Accounts payable to related
parties
For the years ended
December 31, December 31,
2019 2018 2019 2018
(in thousands)
Subsidiaries $ 86,620,411 90,178,389 21,808,772 26,799,904
Associates 3,687,643 4,201,227 1,089,448 1,577,440
Others 12,380,236 13,949,794 2,427,054 2,893,155
$ 102,688,290 108,329,410 25,325,274 31,270,499
The payment terms for purchases from related parties were 30 to 120 days. The pricing and
payment terms with related parties were not materially different from those with third parties.
c. Acquisition of property, plant and equipment
Acquisition prices
For the years ended
December 31,
2019 2018
(in thousands)
Subsidiaries $ 474,357 258,967
Associates 6,555 6,527
Others 5,909 3,418
$ 486,821 268,912

AU Optronics 2019 Annual Report
(Continued)
AU OPTRONICS CORP.
Notes to Parent Company Only Financial Statements
Appendix 2
257
d. Disposal of property, plant and equipment and others
Proceeds from disposal Gains on disposal
For the years ended
December 31,
For the years ended
December 31,
2019 2018 2019 2018
(in thousands)
Subsidiaries $ 2,261 36,021 50 7,880
e. Other related party transactions
Transaction type
Type of
related party
December 31,
2019 2018
(in thousands)
Other receivables due from
related parties
Subsidiaries $ 1,211,067 21,284
Associates 328 1,961
Others 193 4,660
$ 1,211,588 27,905
Other payables due to related
parties
(including payables for
equipment)
Subsidiaries $ 398,081 211,551
Associates 13,163 17,757
Others 22,450 3,615
$ 433,694 232,923
Transaction type
Type of related party
For the years ended
December 31,
2019 2018
(in thousands)
Rental income Subsidiaries $ 26,764 48,560
Associates 40,684 38,002
Others 107,074 90,491
$ 174,522 177,053
Administration and Subsidiaries $ 41,585 62,994
other income Associates 8,154 7,626
Others 6,476 6,149
$ 56,215 76,769
Other expenses Subsidiaries $ 696,208 721,134
Associates 17,491 31,783
Others 46,781 11,096
$ 760,480 764,013
The Company leased portion of its facilities to related parties. The collection term was 15 days
from quarter-end, and the pricing was not materially different from that with third parties.
For the years ended December 31, 2019 and 2018, the Company had received cash dividends
from related parties of $604,468 thousand and $1,191,234 thousand, respectively.
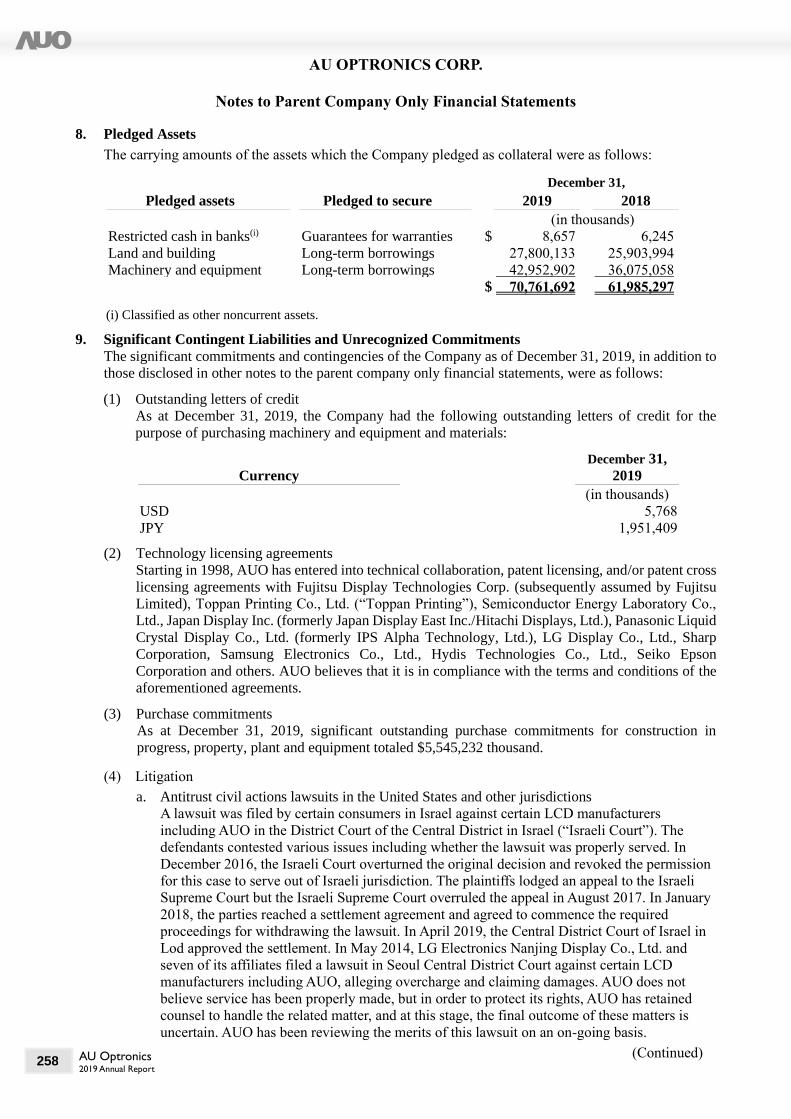
AU Optronics 2019 Annual Report
(Continued)
AU OPTRONICS CORP.
Notes to Parent Company Only Financial Statements
258
8. Pledged Assets
The carrying amounts of the assets which the Company pledged as collateral were as follows:
Pledged assets Pledged to secure
December 31,
2019 2018
(in thousands)
Restricted cash in banks(i) Guarantees for warranties $ 8,657 6,245
Land and building Long-term borrowings 27,800,133 25,903,994
Machinery and equipment Long-term borrowings 42,952,902 36,075,058
$ 70,761,692 61,985,297
(i) Classified as other noncurrent assets. 9. Significant Contingent Liabilities and Unrecognized Commitments
The significant commitments and contingencies of the Company as of December 31, 2019, in addition to
those disclosed in other notes to the parent company only financial statements, were as follows:
(1) Outstanding letters of credit
As at December 31, 2019, the Company had the following outstanding letters of credit for the
purpose of purchasing machinery and equipment and materials:
Currency
December 31,
2019
(in thousands)
USD 5,768
JPY 1,951,409
(2) Technology licensing agreements
Starting in 1998, AUO has entered into technical collaboration, patent licensing, and/or patent cross
licensing agreements with Fujitsu Display Technologies Corp. (subsequently assumed by Fujitsu
Limited), Toppan Printing Co., Ltd. (“Toppan Printing”), Semiconductor Energy Laboratory Co.,
Ltd., Japan Display Inc. (formerly Japan Display East Inc./Hitachi Displays, Ltd.), Panasonic Liquid
Crystal Display Co., Ltd. (formerly IPS Alpha Technology, Ltd.), LG Display Co., Ltd., Sharp
Corporation, Samsung Electronics Co., Ltd., Hydis Technologies Co., Ltd., Seiko Epson
Corporation and others. AUO believes that it is in compliance with the terms and conditions of the
aforementioned agreements.
(3) Purchase commitments
As at December 31, 2019, significant outstanding purchase commitments for construction in
progress, property, plant and equipment totaled $5,545,232 thousand.
(4) Litigation
a. Antitrust civil actions lawsuits in the United States and other jurisdictions
A lawsuit was filed by certain consumers in Israel against certain LCD manufacturers
including AUO in the District Court of the Central District in Israel (“Israeli Court”). The
defendants contested various issues including whether the lawsuit was properly served. In
December 2016, the Israeli Court overturned the original decision and revoked the permission
for this case to serve out of Israeli jurisdiction. The plaintiffs lodged an appeal to the Israeli
Supreme Court but the Israeli Supreme Court overruled the appeal in August 2017. In January
2018, the parties reached a settlement agreement and agreed to commence the required
proceedings for withdrawing the lawsuit. In April 2019, the Central District Court of Israel in
Lod approved the settlement. In May 2014, LG Electronics Nanjing Display Co., Ltd. and
seven of its affiliates filed a lawsuit in Seoul Central District Court against certain LCD
manufacturers including AUO, alleging overcharge and claiming damages. AUO does not
believe service has been properly made, but in order to protect its rights, AUO has retained
counsel to handle the related matter, and at this stage, the final outcome of these matters is
uncertain. AUO has been reviewing the merits of this lawsuit on an on-going basis.

AU Optronics 2019 Annual Report
(Continued)
AU OPTRONICS CORP.
Notes to Parent Company Only Financial Statements
Appendix 2
259
In September 2018, AUUS received a complaint filed by the Government of Puerto Rico on its
own behalf and on behalf of all consumers and governmental agencies of Puerto Rico against
certain LCD manufacturers including AUO and AUUS in the Superior Court of San Juan,
Court of First Instance alleging unjust enrichment and claiming unspecified monetary
damages. AUO has retained counsel to handle the related matter and intends to defend this
lawsuit vigorously, and at this stage, the final outcome of these matters is uncertain. AUO is
reviewing the merits of this lawsuit on an on-going basis.
b. Alleged patent infringements
In July 2018, Vista Peak Ventures, LLC (“VPV”) filed three lawsuits in the United States
District Court for the Eastern District of Texas against AUO, claiming infringement of certain
of VPV’s patents in the United States relating to the manufacturing of TFT-LCD panels. In the
complaints, VPV seeks, among other things, unspecified monetary damages for past damages
and an injunction against future infringement. On September 27, 2019, the relevant parties
reached a settlement agreement, and all pending lawsuits that have been filed by VPV against
AUO were dismissed on October 10, 2019.
As of February 5, 2020, the Company has made certain provisions with respect to certain of
the above lawsuits as the management deems appropriate, considering factors such as the
nature of the litigation or claims, the materiality of the amount of possible loss, the progress of
the cases and the opinions or views of legal counsel and other advisors. Management will
reassess all litigation and claims at each reporting date based on the facts and circumstances
that exist at that time, and will make additional provisions or adjustments to previous
provisions. The ultimate amount cannot be ascertained until the relevant cases are closed. The
ultimate resolution of the legal proceedings and/or lawsuits cannot be predicted with certainty.
While management intends to defend certain of the lawsuits described above vigorously, there
is a possibility that one or more legal proceedings or lawsuits may result in an unfavorable
outcome to the Company. In addition to the matters described above, the Company is also a
party to other litigations or proceedings that arise during the ordinary course of business.
Except as mentioned above, the Company, to its knowledge, is not involved as a defendant in
any material litigation or proceeding which could be expected to have a material adverse effect
on the Company’s business or results of operations.
10. Significant Disaster Losses: None. 11. Subsequent Event
On February 5, 2020, AUO’s Board of Directors resolved to acquire common shares of ADLINK
Technology Inc. through tender offer. The tender offer consideration for each common share is NT$57 in
cash. The planned acquisition amount is 65,249 thousand shares of ADLINK. The tender offer period will
run from February 7, 2020 to March 12, 2020. 12. Others
Since 2010, there have been environmental proceedings relating to the development project of the Central
Taiwan Science Park in Houli, Taichung, which AUO’s second 8.5-generation fab is located at. The
proceedings were initiated by six residents in Houli District, Taichung City (the “Plaintiffs”) to object the
administrative dispositions of the environmental assessment and development approval issued in 2010 by
the Environmental Protection Administration (“EPA”) of the Executive Yuan of Taiwan to the third
phrase development area in the Central Taiwan Science Park (the “Project”). On August 8, 2014, the
Plaintiffs reached a settlement with the defendants (i.e. the governmental authorities, including the EPA
of the Executive Yuan of Taiwan, the Ministry of Science and Technology (former National Science
Council of the ROC Executive Yuan) and the Central Taiwan Science Park Development Office) in the
Taipei High Administrative Court. The second phase environmental impact assessment for the Project
continues to proceed. On December 14, 2017, the EPA of the Executive Yuan of Taiwan held the third
review meeting of the investigation group. The review meeting reached the conclusion of suggesting
approval for the Project. On November 6, 2018, the EPA approved the Project, but on December 6, 2018,
five residents in Houli District, Taichung City filed administrative appeal to the Appeals Review

AU Optronics 2019 Annual Report
(Continued)
AU OPTRONICS CORP.
Notes to Parent Company Only Financial Statements
260
Committee of the Executive Yuan requesting a withdrawal of the approval. Currently management does
not believe that this event will have a material adverse effect on the Company’s operation and will
continue to monitor the development of this event. 13. Additional Disclosures
(4) Information on significant transactions:
Following are the additional disclosures required by the Regulations for the Company for the year
ended December 31, 2019.
a. Financings provided: Please see Table 1 attached.
b. Endorsements / guarantees provided: Please see Table 2 attached.
c. Marketable securities held (excluding investment in subsidiaries, associates and joint ventures):
Please see Table 3 attached.
d. Individual marketable securities acquired or disposed of with costs or prices exceeding NT$300
million or 20% of the paid-in capital: Please see Table 4 attached.
e. Acquisition of individual real estate with costs exceeding NT$300 million or 20% of the paid-in
capital: None.
f. Disposal of individual real estate with prices exceeding NT$300 million or 20% of the paid-in
capital: None.
g. Purchases from or sales to related parties with amounts exceeding NT$100 million or 20% of the
paid-in capital: Please see Table 5 attached.
h. Receivables from related parties with amounts exceeding NT$100 million or 20% of the paid-in
capital: Please see Table 6 attached.
i. Information about trading in derivative instruments: Please see Note 6(2).
(5) Information on investees (excluding information on investment in Mainland China): Please see Table
7 attached.
(6) Information on investment in Mainland China:
a. The related information on investment in Mainland China: Please see Table 8.1 and 8.2 attached.
b. Upper limit on investment in Mainland China: Please see Table 8.1 and 8.2 attached.
c. Significant transactions:
Significant direct or indirect transactions with the investees in Mainland China for the year ended
December 31, 2019, for which intercompany transactions were eliminated upon consolidation,
are disclosed in Note 13(1) “Information on significant transactions”. 14. Segment Information
The Company has provided the operating segments disclosure in the consolidated financial statements.
Disclosure of the segment information in the parent company only financial statements is waived.

AU
Optro
nics
2019 A
nnual R
epo
rt
(Continued)
261
Appendix
2
AU OPTRONICS CORP. AND SUBSIDIARIES
Financings Provided
For the year ended December 31, 2019 (Amount in thousands of New Taiwan Dollars)
Table 1
No. Financing
Company
Borrowing
Company
Financial
Statement
Account
Related
Party
Maximum
Balance for
the Period
(Note 3)
Ending Balance
(Notes 1 and 2)
Amount
Actually
Drawn Down
(Notes 1 and 4)
Interest Rate Nature of
Financing
Transaction
Amounts
Reason for
Financing
Allowance
for Bad
Debt
Collateral Financing
Limits for Each
Borrowing
Company
(Notes 1 and 5)
Limits on
Financing
Company’s Total
Financing
Amount
(Notes 1 and 5)
Item Value
0 AUO ACTW Other
receivables from related
parties
Yes 3,500,000 1,725,000 1,200,000 Markup rate on
short-term financing cost
Needs for
short-term financing
- Operating
capital
- - - 17,667,184 70,668,736
0 AUO AUKS Other receivables
from related
parties
Yes 1,524,810 1,294,650 - Markup rate on short-term
financing cost
Needs for short-term
financing
- Operating capital
- - - 17,667,184 70,668,736
1 AULB AUSK Other
receivables
from related parties
Yes - - - Markup rate on
short-term
financing cost
Needs for
short-term
financing
- Operating
capital
- - - 53,221,601 53,221,601
1 AULB AUKS Other
receivables from related
parties
Yes 10,633,245 10,572,975 2,805,075 Markup rate on
short-term financing cost
Needs for
short-term financing
- Operating
capital
- - - 21,288,641 21,288,641
2 AUXM BVHF Other receivables
from related
parties
Yes - - - Markup rate on short-term
financing cost
Needs for short-term
financing
- Operating capital
- - - 5,359,511 5,359,511
2 AUXM AUKS Other
receivables
from related
parties
Yes 5,272,980 4,962,825 3,452,400 Markup rate on
short-term
financing cost
Needs for
short-term
financing
- Operating
capital
- - - 5,359,511 5,359,511
3 BVXM AUKS Other receivables
from related
parties
Yes 434,010 431,550 - Markup rate on short-term
financing cost
Needs for short-term
financing
- Operating capital
- - - 509,196 509,196
4 AUSJ UFSZ Other
receivables
from related parties
Yes 92,090 86,310 - Markup rate on
short-term
financing cost
Needs for
short-term
financing
- Operating
capital
- - - 3,783,730 3,783,730
4 AUSJ AUKS Other
receivables from related
parties
Yes 1,467,264 1,380,960 949,410 Markup rate on
short-term financing cost
Needs for
short-term financing
- Operating
capital
- - - 1,513,492 1,513,492

(Continued)
AU
Optro
nics
2019 A
nnual R
epo
rt
262
No. Financing
Company
Borrowing
Company
Financial
Statement
Account
Related
Party
Maximum
Balance for
the Period
(Note 3)
Ending Balance
(Notes 1 and 2)
Amount
Actually
Drawn Down
(Notes 1 and 4)
Interest Rate Nature of
Financing
Transaction
Amounts
Reason for
Financing
Allowance
for Bad
Debt
Collateral Financing
Limits for Each
Borrowing
Company
(Notes 1 and 5)
Limits on
Financing
Company’s Total
Financing
Amount
(Notes 1 and 5)
Item Value
4 AUSJ A-Care Other
receivables
from related parties
Yes 46,045 43,155 - Markup rate on
short-term
financing cost
Needs for
short-term
financing
- Operating
capital
- - - 3,783,730 3,783,730
5 AUSZ AUKS Other
receivables from related
parties
Yes 5,272,980 4,962,825 4,099,725 Markup rate on
short-term financing cost
Needs for
short-term financing
- Operating
capital
- - - 5,886,493 5,886,493
6 DPSZ AUKS Other receivables
from related
parties
Yes 460,450 431,550 - Adjusted by base lending
rate of People’s
Bank of China
Needs for short-term
financing
- Operating capital
- - - 711,740 711,740
7 FTKS AUKS Other
receivables
from related parties
Yes 450,170 431,550 431,550 Adjusted by
base lending
rate of People’s Bank of China
Needs for
short-term
financing
- Operating
capital
- - - 540,321 540,321
8 FTWJ FHWJ Other
receivables from related
parties
Yes 92,090 64,733 64,733 Adjusted by
base lending rate of People’s
Bank of China
Needs for
short-term financing
- Operating
capital
- - - 2,071,120 2,071,120
Note 1: Amounts denominated in foreign currencies are translated into New Taiwan Dollars using the exchange rates at the reporting date.
Note 2: The ending balance represents the amounts approved by the Board of Directors.
Note 3: The maximum balance for the period represents the highest amount in New Taiwan Dollar announced or occurred during the period.
Note 4: All inter-company transactions among AUO and its subsidiaries have been eliminated in the consolidated financial statements.
Note 5: The policy for the limit on total financing amount and the financing limit for any individual entity are prescribed as follows:
a. AUO: The total amount available for lending purposes shall not exceed 40% of AUO’s net worth as stated in its latest audited financial statement. The total amount for
lending to a company shall not exceed 10% of AUO’s net worth as stated in its latest audited financial statement.
b. AULB, AUSZ, AUXM, AUSJ and BVXM: The total amount available for lending purposes shall not exceed 40% of the net worth of the lending company as stated in
its latest audited financial statement. The total amount for lending to a company shall not exceed 40% of the net worth of the lending company as stated in its latest
audited financial statement.
c. In the event that the financing is between foreign subsidiaries whose voting shares are 100% owned, directly or indirectly, by AUO, the aggregate amount available for
lending to such borrowers and total amount lendable to a company shall not exceed the net worth of the lending company as stated in its latest audited financial statement.
d. DPSZ, FTWJ and FTKS: The total amount available for lending purposes shall not exceed 40% of the net worth of the lending company. The total amount for lending
to a company shall not exceed 40% of the net worth of the lending company.
e. In the event that the financing is between foreign subsidiaries whose voting shares are 100% owned, directly and indirectly, by DPTW, the aggregate amount available
for lending to such borrowers and the total amount lendable to each of such borrowers shall not exceed the net worth of the lending company.

AU
Optro
nics
2019 A
nnual R
epo
rt
(Continued)
263
Appendix
2
AU OPTRONICS CORP. AND SUBSIDIARIES
Endorsements/Guarantees Provided
For the year ended December 31, 2019 (Amount in thousands of New Taiwan Dollars)
Table 2
No. Endorser/
Guarantor
Guaranteed Party
Limits on
Endorsement/
Guarantee Amount
Provided for Each
Party (Notes 4 and 5)
Maximum
Endorsement/
Guarantee
Balance for the
Period (Note 2)
Ending Balance
(Notes 3 and 4)
Amount
Actually
Drawn Down
(Note 4)
Amount of
Endorsement/
Guarantee
Collateralized
by Properties
Ratio of
Accumulated
Endorsement/
Guarantee to Net
Worth per Latest
Financial
Statements
Maximum
Endorsement/
Guarantee
Amount
Allowable
(Notes 4 and 5)
Endorsement/
Guarantee
Provided by
Parent
Company to
Subsidiary
Endorsement/
Guarantee
Provided by
Subsidiary to
Parent
Company
Endorsement/
Guarantee
Provided to
Subsidiaries
in Mainland
China
Name
Nature of
Relationship
(Note 1)
0 AUO AUKS 2 88,335,920 16,140,185 15,317,737 11,507,216 - 8.67% 176,671,840 Yes No Yes 1 AUXM AUO
&AUST
3,4 13,398,777 2,302,250 - - - - 13,398,777 No Yes No
1 AUXM AUO 3 13,398,777 9,577,360 6,257,475 - - 46.70% 13,398,777 No Yes No 2 AUSJ AUO 3 3,783,730 1,473,440 - - - - 3,783,730 No Yes No
3 AUSZ AUO 3 14,716,233 7,275,110 4,401,810 - - 29.91% 14,716,233 No Yes No
3 AUSZ AUO &AUSK
3,4 14,716,233 1,519,485 - - - - 14,716,233 No Yes No
Note 1: The relationship between the endorser/guarantor and the guaranteed party: 8. A company with which it does business. 9. A company in which the Company directly and indirectly holds more than 50% of the voting shares. 10. A company that directly and indirectly holds more than 50% of the voting shares in the Company. 11. Companies in which the Company holds, directly or indirectly, 90% or more of the voting shares. 12. A company that fulfills its contractual obligations by providing mutual endorsements/guarantees for another company in the same industry or for joint builders for
purposes of undertaking a construction project. 13. A company that all capital contributing shareholders make endorsements/guarantees for their jointly invested company in proportion to their shareholding percentages. 14. Companies in the same industry provide among themselves joint and several security for a performance guarantee of a sales contract for pre-construction homes
pursuant to the Consumer Protection Act for each other. Note 2: The maximum endorsement/guarantee balance for the period represents the highest amount in New Taiwan Dollar announced or occurred during the period. Note 3: The ending balance represents the amounts approved by the Board of Directors. Note 4: Amounts denominated in foreign currencies are translated into New Taiwan Dollars using the exchange rates at the reporting date. Note 5: The policy for the limit of total endorsement/guarantee amount and the limit on endorsement/guarantee amount provided to each party are prescribed as follows:
c. AUO: The total endorsement/guarantee amount provided shall not exceed the net worth of AUO as stated in its latest audited financial statement. The aggregate amount of endorsement/guarantee provided to each guaranteed party shall not exceed 50% of AUO’s net worth as stated in its latest audited financial statement.
d. AUSZ, AUXM and AUSJ: The total endorsement/guarantee amount provided and the aggregate amount of endorsement/guarantee provided to each guaranteed party both shall not exceed the net worth of the endorser/guarantor as stated in its latest audited financial statement.

(Continued)
AU
Optro
nics
2019 A
nnual R
epo
rt
264
AU OPTRONICS CORP. AND SUBSIDIARIES
Marketable Securities Held (Excluding Investment in Subsidiaries, Associates and Joint Ventures)
December 31, 2019 (Amount in thousands of New Taiwan Dollars and foreign currencies indicated, and shares in thousands)
Table 3
Name of
Holder
Type and Name
of Marketable
Securities
Relationship
with the
Securities Issuer
Financial Statement Account
December 31, 2019
Note Shares
Carrying
Amount
Percentage of
Ownership Fair Value
AUO Stock
BenQ ESCO Corp.
Related party Financial assets at FVTPL— noncurrent 1,700 - 17.00% -
AUO Stock
Qisda
Related party Financial assets at FVTOCI— noncurrent 335,231 7,140,410 17.04% 7,140,410
AULB Stock
Abakus Solar AG
- Financial assets at FVTPL— noncurrent 3 - 2.22% -
AUSH Stock
T-powertek
Optronics Co.,
Ltd.
- Financial assets at FVTOCI— noncurrent 352 CNY 6,250 2.16% CNY 6,250
DPSZ Structured deposit - Financial assets at FVTPL-current - CNY 70,488 - CNY 70,488
FPWJ Structured deposit - Financial assets at FVTPL-current - CNY 100,642 - CNY 100,642
FTKS Structured deposit - Financial assets at FVTPL-current - CNY 171,493 - CNY 171,493
Konly Stock
PlayNitride Inc.
- Financial assets at FVTOCI— noncurrent 609 42,123 1.80% 42,123
Konly Stock
SnapBizz
CloudTech Pte.
Ltd.
- Financial assets at FVTOCI— noncurrent 13 - 5.33% -
Konly Stock
a2peak power Co.,
Ltd.
- Financial assets at FVTPL-noncurrent 4,000 - 10.87% -
Konly Stock
ChenFeng
Optronics
Corporation
- Financial assets at FVTPL-noncurrent 1,500 - 2.63% -
Konly Stock
UniBright
Chemical Co., Ltd.
- Financial assets at FVTPL-noncurrent 4,200 - 8.52% -

AU
Optro
nics
2019 A
nnual R
epo
rt
(Continued)
265
Appendix
2
Name of
Holder
Type and Name
of Marketable
Securities
Relationship
with the
Securities Issuer
Financial Statement Account
December 31, 2019
Note Shares
Carrying
Amount
Percentage of
Ownership Fair Value
Konly Stock
Azotek Co., Ltd.
- Financial assets at FVTOCI— noncurrent 2,407 7,345 4.01% 7,345
Konly Stock
Qisda
Related party Financial assets at FVTOCI— noncurrent 10,145 216,091 0.52% 216,091
Konly Stock
ATS International
Inc.
- Financial assets at FVTOCI— noncurrent 1,667 - 5.15% -
DPTW Stock
Wibase Industrial
Solutions Inc.
Related party Financial assets at FVTOCI— noncurrent 4,700 56,400 12.11% 56,400
DPTW Stock
Evertrust
Technology Ltd.
- Financial assets at FVTOCI— noncurrent 150 1,500 16.13% 1,500
DPTW Stock
D8AI Holdings
Corporation
- Financial assets at FVTOCI— noncurrent 7,000 8,649 4.59% 8,649
DPTW Stock
HUAI I Precision
Technology Co.,
Ltd.
- Financial assets at FVTOCI— noncurrent 2,914 34,968 10.00% 34,968
DPTW Stock
Disign
Incorporated
- Financial assets at FVTOCI— noncurrent 2 10,714 19.89% 10,714
Ronly Stock
UniBright
Chemical Co., Ltd.
- Financial assets at FVTPL-noncurrent 600 - 1.22% -
Ronly Stock
Exploit
Technology Co.,
Ltd.
- Financial assets at FVTPL-noncurrent 41 - 0.49% -

(Continued)
AU
Optro
nics
2019 A
nnual R
epo
rt
266
AU OPTRONICS CORP. AND SUBSIDIARIES
Individual Marketable Securities Acquired or Disposed of with Costs or Prices Exceeding
NT$300 Million or 20% of the Paid-in Capital
For the year ended December 31, 2019 (Amount in thousands of New Taiwan Dollars and foreign currencies indicated, and shares in thousands)
Table 4
Company
Name
Type and
Name of
Marketable
Securities
Financial
Statement
Account
Counterparty Relationship
Beginning Balance Acquisition Disposal Ending Balance
Shares Amount Shares Amount Shares Amount Carrying
Amount
Gain/Loss
on Disposal Shares Amount
Note
AUO Stock
ACTW Investments in equity-
accounted
investees
- - 378,193 5,005,774 40,390 549,393 - - - - 418,583 2,805,441 1
DPSZ Structured
deposit
Financial
assets at
FVTPL-
current
- - - - - CNY 140,000 - CNY 71,331 CNY 71,331 - - CNY 70,488 2
FPWJ Structured
deposit
Financial
assets at
FVTPL-
current
- - - CNY 91,753 - CNY 200,000 - CNY 194,885 CNY 194,885 - - CNY 100,642 2
FTKS Structured
deposit
Financial
assets at
FVTPL-
current
- - - CNY 274,091 - CNY 510,000 - CNY 621,552 CNY 621,552 - - CNY 171,493 2
Note 1: a. As part of a business restructuring, AUO acquired all shares of ACTW from Konly and other shareholders.
b. The ending balance includes the recognition of investment gain (loss), foreign currency translation differences and capital surplus, etc. under the equity method.
Note 2: The ending balance includes the gain/loss on valuation of the financial asset.

AU
Optro
nics
2019 A
nnual R
epo
rt
(Continued)
267
Appendix
2
AU OPTRONICS CORP. AND SUBSIDIARIES
Purchases from or Sales to Related Parties with Amounts Exceeding NT$100 Million or 20% of the Paid-in Capital
For the year ended December 31, 2019 (Amount in thousands of New Taiwan Dollars and foreign currencies indicated)
Table 5
Company
Name Counterparty Relationship
Transaction Details
Transactions with
Terms Different
from Others
Notes/Accounts Receivable (Payable)
Note
Purchases
/Sales
Amount
(Note 2)
Percentage of
Total Purchases
/Sales
Credit Terms
Unit
Price
(Note 1)
Credit
Terms
(Note 1)
Ending Balance
(Note 2)
Percentage of
Total Notes
/Accounts
Receivable
(Payable)
AUO BMC Subsidiary of Qisda Purchases 4,049,902 2% EOM 90 days - (988,782) (2)%
AUO Raydium Associate Purchases 980,406 1% EOM 120 days - (238,957) -
AUO Qisda Corporate shareholder of
AUO of which accounts for
AUO using the equity
method
Purchases 8,306,875 4% EOM 45 days - (1,437,067) (3)%
AUO Daxin Associate Purchases 2,665,305 1% EOM 120 days - (831,009) (2)%
AUO DPTW Subsidiary of AUO Purchases 6,101,237 3% EOM 60 days - (887,617) (2)%
AUO AUCZ Subsidiary of AUO Purchases 129,946 - EOM 45 days - - -
AUO AUSZ Subsidiary of AUO Purchases 35,474,816 18% EOM 45 days - (9,447,956) (19)%
AUO AUST Subsidiary of AUO Purchases 5,692,940 3% EOM 45 days - (873,769) (2)%
AUO AUSK Subsidiary of AUO Purchases 134,558 - EOM 45 days - (19,847) -
AUO AULB Subsidiary of AUO Purchases 956,615 - EOM 45 days - (381,063) (1)%
AUO AUKS Subsidiary of AUO Purchases 12,385,120 6% EOM 30 days - (2,151,131) (4)%
AUO AUXM Subsidiary of AUO Purchases 25,695,562 13% EOM 45 days - (8,029,959) (16)%
AUO TGPC Subsidiary of SSEC Sales (161,763) - EOM 25 days - 109,566 -
AUO QCSZ Subsidiary of Qisda Sales (7,126,336) (3)% EOM 55 days - 930,165 3%
AUO QCOS Subsidiary of Qisda Sales (244,442) - EOM 55 days - 27,621 -
AUO FGPC Subsidiary of SSEC Sales (663,428) - EOM 25 days - 76,082 -
AUO DPXM Subsidiary of AUO Sales (130,396) - EOM 45 days - 7,822 -
AUO DPTW Subsidiary of AUO Sales (413,290) - EOM 45 days - 43,577 -
AUO BenQ Subsidiary of Qisda Sales (2,571,371) (1)% EOM 55 days - 399,935 1%
AUO AUXM Subsidiary of AUO Sales (989,043) - EOM 45 days - - -
AUO AUUS Subsidiary of AUO Sales (131,140) - EOM 75 days - 36,724 -
AUO AUSZ Subsidiary of AUO Sales (1,036,086) - EOM 45 days - - -
AUO AUNL Subsidiary of AUO Sales (696,101) - EOM 45 days - 136,045 -
AUO RGPC Subsidiary of SSEC Sales (109,168) - EOM 25 days - - -
AUO ACTW Subsidiary of AUO Sales (581,352) - EOM 45 days - 82,862 -
ACMK ACTW Subsidiary of AUO Purchases USD 36,650 93% OA 60 days - USD (5,971) (92)%

(Continued)
AU
Optro
nics
2019 A
nnual R
epo
rt
268
Company
Name Counterparty Relationship
Transaction Details
Transactions with
Terms Different
from Others
Notes/Accounts Receivable (Payable)
Note
Purchases
/Sales
Amount
(Note 2)
Percentage of
Total Purchases
/Sales
Credit Terms
Unit
Price
(Note 1)
Credit
Terms
(Note 1)
Ending Balance
(Note 2)
Percentage of
Total Notes
/Accounts
Receivable
(Payable)
AUCZ AUO Ultimate parent company Sales CZK (99,079) (100)% EOM 45 days - - -
AUKS AUSZ Subsidiary of AUO Purchases CNY 130,338 8% EOM 60 days - CNY (42,137) (6)%
AUKS Qisda Corporate shareholder of
AUO of which accounts for
AUO using the equity
method
Purchases CNY 23,017 1% EOM 120
days
- CNY (10,475) (2)%
AUKS AUO Ultimate parent company Sales CNY (2,770,165) (100)% EOM 30 days - CNY 500,963 100%
AULB AUO Ultimate parent company Sales USD (30,931) (72)% EOM 45 days - USD 8,711 100%
AULB AUSZ Subsidiary of AUO Sales USD (11,445) (11)% EOM 45 days - - -
AULB AUXM Subsidiary of AUO Sales USD (18,769) (17)% EOM 45 days - - -
AUNL AUO Ultimate parent company Purchases EUR 20,734 100% EOM 45 days - EUR (4,009) (100)%
AUSH AUO Ultimate parent company Sales CNY (31,870) (97)% End of quarter
25 days
- - -
AUSK AUO Ultimate parent company Sales EUR (4,275) (84)% EOM 45 days - EUR 746 82%
AUST AUO Ultimate parent company Sales USD (184,271) (100)% EOM 45 days - USD 28,995 100%
AUSZ Raydium Associate Purchases CNY 560,109 8% EOM 120
days
- CNY (222,287) (10)%
AUSZ Qisda Corporate shareholder of
AUO of which accounts for
AUO using the equity
method
Purchases CNY 569,724 8% EOM 120
days
- CNY (235,978) (10)%
AUSZ DPTW Subsidiary of AUO Purchases CNY 178,762 3% EOM 120
days
- CNY (67,252) (3)%
AUSZ AUO Ultimate parent company Purchases CNY 227,034 3% EOM 45 days - - -
AUSZ AULB Subsidiary of AUO Purchases CNY 75,930 1% EOM 45 days - - -
AUSZ BMC Subsidiary of Qisda Purchases CNY 274,748 4% EOM 90 days - CNY (82,462) (4)%
AUSZ AULB Subsidiary of AUO Sales CNY (36,846) - EOM 45 days - - -
AUSZ AUKS Subsidiary of AUO Sales CNY (130,338) (2)% EOM 60 days - CNY 42,137 2%
AUSZ AUO Ultimate parent company Sales CNY (7,869,533) (95)% EOM 45 days - CNY 2,196,988 88%
AUUS AUO Ultimate parent company Purchases USD 4,555 100% EOM 75 days USD (1,215) (100)%
AUUS AUO Ultimate parent company Sales USD (5,539) (56)% EOM 30 days - - -
AUXM Raydium Associate Purchases CNY 377,685 7% EOM 120
days
- CNY (130,325) (7)%
AUXM Lextar Associate Purchases CNY 42,203 1% EOM 120
days
- CNY (18,499) (1)%
AUXM AULB Subsidiary of AUO Purchases CNY 125,815 2% EOM 45 days - - -
AUXM AUO Ultimate parent company Purchases CNY 194,961 3% EOM 45 days - - -
AUXM BMC Subsidiary of Qisda Purchases CNY 180,358 3% EOM 90 days - CNY (46,691) (2)%

AU
Optro
nics
2019 A
nnual R
epo
rt
(Continued)
269
Appendix
2
Company
Name Counterparty Relationship
Transaction Details
Transactions with
Terms Different
from Others
Notes/Accounts Receivable (Payable)
Note
Purchases
/Sales
Amount
(Note 2)
Percentage of
Total Purchases
/Sales
Credit Terms
Unit
Price
(Note 1)
Credit
Terms
(Note 1)
Ending Balance
(Note 2)
Percentage of
Total Notes
/Accounts
Receivable
(Payable)
AUXM DPXM Subsidiary of AUO Purchases CNY 43,398 1% EOM 120
days
- CNY (13,923) (1)%
AUXM DPTW Subsidiary of AUO Purchases CNY 308,620 5% EOM 120
days
- CNY (115,982) (6)%
AUXM AULB Subsidiary of AUO Sales CNY (27,290) - EOM 45 days - - -
AUXM BVXM Subsidiary of AUO Sales CNY (760,742) (12)% EOM 45 days - CNY 183,553 9%
AUXM AUO Ultimate parent company Sales CNY (5,704,904) (88)% EOM 45 days - CNY 1,865,262 91%
BVHF DPTW Subsidiary of AUO Purchases CNY 52,126 21% EOM 60 days - CNY (36,531) (58)%
BVHF Lextar Associate Purchases CNY 30,865 12% EOM 120
days
- CNY (5,229) (8)%
BVHF DPTW Subsidiary of AUO Sales CNY (381,196) (100)% EOM 60 days - CNY 88,590 100%
BVXM AUXM Subsidiary of AUO Purchases CNY 759,427 100% EOM 45 days - CNY (182,131) (100)%
DPSZ DPTW Subsidiary of AUO Purchases CNY 24,407 25% EOM 60 days CNY (2,649) (7)%
DPSZ DPTW Subsidiary of AUO Sales CNY (134,962) (76)% EOM 90 days - CNY 36,326 70%
DPXM DPTW Subsidiary of AUO Purchases CNY 24,058 3% EOM 60 days CNY (19,029) (7)%
DPXM AUO Ultimate parent company Purchases CNY 28,887 4% EOM 45 days - CNY (1,936) (1)%
DPXM AUXM Subsidiary of AUO Sales CNY (43,246) (4)% EOM 120
days
- CNY 13,923 3%
DPXM DPTW Subsidiary of AUO Sales CNY (1,074,429) (89)% EOM 90 days - CNY 384,021 83%
FTWJ DPTW Subsidiary of AUO Purchases CNY 116,790 21% EOM 60 days - CNY (283,725) (57)%
FTWJ Lextar Associate Purchases CNY 57,349 10% EOM 120
days
- CNY (22,443) (5)%
FTWJ DPTW Subsidiary of AUO Sales CNY (765,048) (90)% EOM 90 days - CNY 552,530 91%
M.Setek ACTW Subsidiary of AUO Sales JPY (5,215,104) (99)% EOM 45 days - JPY 1,643,976 100%
ACTW AUO Ultimate parent company Purchases 581,454 17% EOM 45 days - (82,862) (11)%
ACTW M.Setek Subsidiary of AUO Purchases 1,480,568 43% EOM 45 days - (455,053) (62)%
ACTW ACMK Subsidiary of AUO Sales (1,079,766) (22)% OA 60 days - 179,946 22%
UTI AUO Ultimate parent company Sales (150,409) (69)% EOM 60 days - 15,093 89%
DPTW BVHF Subsidiary of AUO Purchases 1,726,072 13% EOM 60 days - (143,375) (5)%
DPTW AUO Ultimate parent company Purchases 410,921 3% EOM 45 days - (43,343) (1)%
DPTW EFOP Joint Venture Purchases 1,027,147 7% EOM 45 days - (72,942) (2)%
DPTW FTWJ Subsidiary of AUO Purchases 3,428,533 25% EOM 90 days - (998,087) (32)%
DPTW DPXM Subsidiary of AUO Purchases 4,819,703 35% EOM 90 days - (1,390,592) (45)%
DPTW DPSZ Subsidiary of AUO Purchases 606,434 4% EOM 90 days - (156,919) (5)%

(Continued)
AU
Optro
nics
2019 A
nnual R
epo
rt
270
Company
Name Counterparty Relationship
Transaction Details
Transactions with
Terms Different
from Others
Notes/Accounts Receivable (Payable)
Note
Purchases
/Sales
Amount
(Note 2)
Percentage of
Total Purchases
/Sales
Credit Terms
Unit
Price
(Note 1)
Credit
Terms
(Note 1)
Ending Balance
(Note 2)
Percentage of
Total Notes
/Accounts
Receivable
(Payable)
DPTW DPXM Subsidiary of AUO Sales (107,170) (1)% EOM 60 days - 36,730 1%
DPTW FTWJ Subsidiary of AUO Sales (521,864) (3)% EOM 60 days - 196,827 7%
DPTW DPSZ Subsidiary of AUO Sales (110,489) (1)% EOM 60 days - 11,445 -
DPTW BVHF Subsidiary of AUO Sales (236,590) (2)% EOM 60 days - 9,589 -
DPTW AUXM Subsidiary of AUO Sales (1,379,316) (9)% EOM 120 days - 501,004 18%
DPTW AUO Ultimate parent company Sales (6,456,889) (42)% EOM 60 days - 845,012 31%
DPTW QCES Subsidiary of Qisda Sales (208,913) (1)% EOM 120 days - 80,000 3%
DPTW Darwin Summit
Corporation,
Ltd.
Associate Sales (100,201) (1)% EOM 90 days - 42,033 2%
DPTW AUSZ Subsidiary of AUO Sales (797,366) (5)% EOM 120 days - 290,507 11%
Note 1: Transaction terms with related parties were similar to those with third parties, except for particular transactions with no similar transactions to compare with. For those
transactions, transaction terms were determined in accordance with mutual agreements.
Note 2: All inter-company transactions among AUO and its subsidiaries have been eliminated in the consolidated financial statements.

AU
Optro
nics
2019 A
nnual R
epo
rt
(Continued)
271
Appendix
2
AU OPTRONICS CORP. AND SUBSIDIARIES
Receivables from Related Parties with Amounts Exceeding NT$100 Million or 20% of the Paid-in Capital
December 31, 2019 (Amount in thousands of New Taiwan Dollars and foreign currencies indicated)
Table 6
Company
Name Counterparty Relationship
Ending Balance of
Receivables
(Note 3)
Turnover
Rate
Overdue Receivables Amounts
Received in
Subsequent
Period
(Note 1)
Allowance
for Bad
Debts Amount Action Taken
AUO TGPC Subsidiary of SSEC 109,566 2.93 - - - -
AUO ACTW Subsidiary of AUO 1,284,439 (Note 2) - - - -
AUO BenQ Subsidiary of Qisda 399,935 5.52 114 Will be collected in next period - -
AUO AUNL Subsidiary of AUO 136,045 10.23 16 Collected in subsequent period 70,516 -
AUO QCSZ Subsidiary of Qisda 930,165 6.26 935 Will be collected in next period - -
AUKS AUO Ultimate parent company CNY 500,963 5.83 CNY 28,896 Collected in subsequent period CNY 240,556 -
AULB AUO Ultimate parent company USD 9,189 (Note 2) USD 8,711 Will be collected in next period - -
AULB AUKS Subsidiary of AUO USD 95,056 (Note 2) - - - -
AUSJ AUKS Subsidiary of AUO CNY 224,528 (Note 2) - - - -
AUST AUO Ultimate parent company USD 28,995 5.92 - - - -
AUSZ AUKS Subsidiary of AUO CNY 1,016,582 (Note 2) CNY 14,634 Collected in subsequent period CNY 16,118 -
AUSZ AUO Ultimate parent company CNY 2,196,989 (Note 2) CNY 27,024 Collected in subsequent period CNY 1,511,352 -
AUXM BVXM Subsidiary of AUO CNY 183,895 (Note 2) CNY 1,421 Collected in subsequent period CNY 106,300 -
AUXM AUKS Subsidiary of AUO CNY 818,914 (Note 2) CNY 137 Collected in subsequent period CNY 250
AUXM AUO Ultimate parent company CNY 1,865,262 6.10 CNY 93,824 Collected in subsequent period CNY 1,082,848 -
BVHF DPTW Subsidiary of AUO CNY 88,996 (Note 2) CNY 49,549 Will be collected in next period - -
DPSZ DPTW Subsidiary of AUO CNY 36,326 2.55 - - - -
DPXM DPTW Subsidiary of AUO CNY 384,031 (Note 2) - - CNY 24,417 -
FTKS AUKS Subsidiary of AUO CNY 101,547 (Note 2) - - - -
FTWJ DPTW Subsidiary of AUO CNY 552,530 1.39 - - CNY 97,667 -
M.Setek ACTW Subsidiary of AUO JPY 1,643,976 5.75 JPY 418,115 Will be collected in next period - -
ACTW M.Setek Subsidiary of AUO 220,875 - - - - -
ACTW ACMK Subsidiary of AUO 188,510 (Note 2) - - - -
DPTW AUSZ Subsidiary of AUO 290,507 5.49 - - - -

(Continued)
AU
Optro
nics
2019 A
nnual R
epo
rt
272
Company
Name Counterparty Relationship
Ending Balance of
Receivables
(Note 3)
Turnover
Rate
Overdue Receivables Amounts
Received in
Subsequent
Period
(Note 1)
Allowance
for Bad
Debts Amount Action Taken
DPTW FTWJ Subsidiary of AUO 1,230,770 (Note 2) 29,182 Collected in subsequent period 414,948 -
DPTW AUXM Subsidiary of AUO 501,004 5.36 - - - -
DPTW AUO Ultimate parent company 845,532 (Note 2) 71,466 Will be collected in next period - -
DPTW BVHF Subsidiary of AUO 157,802 (Note 2) - - - -
Note 1: Until the end of January 2020.
Note 2: The ending balance includes other receivables from transactions not related to ordinary sales.
Note 3: All inter-company transactions among AUO and its subsidiaries have been eliminated in the consolidated financial statements.

AU
Optro
nics
2019 A
nnual R
epo
rt
(Continued)
273
Appendix
2
AU OPTRONICS CORP. AND SUBSIDIARIES
Information on Investees (Excluding Information on Investment in Mainland China)
For the year ended December 31, 2019 (Amount in thousands of New Taiwan Dollars and foreign currencies indicated, and shares in thousands)
Table 7
Investor
Company
Investee
Company Location Main Activities
Original Investment Amount December 31, 2019 Maximum
Shareholding
in the Interim
Net Income
(Loss) of
Investee
Investor’s Share
of Profit (Loss)
of Investee
(Notes 1 and 2)
Note December 31,
2019
December 31,
2018 Shares
Percentage of
Ownership
Carrying Amount
(Notes 1 and 2)
AUO AULB Malaysia Holding and trading
company
59,058,698 59,058,698 1,882,189 100.00% 53,221,601 100.00%
1,367,091 1,481,004 Subsidiary
AUO AUNL Netherlands Sales and sales support of
TFT-LCD panels
24,275 24,275 50 100.00% 37,774 100.00%
13,707 13,707 Subsidiary
AUO Konly Taiwan ROC Venture capital investment 4,227,070 4,227,070 284,302 100.00% 5,208,936 100.00%
171,825 171,825 Subsidiary AUO Ronly Taiwan ROC Venture capital investment 1,778,692 1,778,692 154,757 100.00% 2,049,860 100.00%
9,126 9,126 Subsidiary
AUO DPTW Taiwan ROC Design, manufacturing, and
sales of TFT-LCD modules, backlight modules, TV set
and related parts
3,569,155 3,569,155 190,108 28.56% 3,156,574 28.56%
(190,141) (54,311) Subsidiary
AUO ACTW Taiwan ROC Manufacturing and sales of ingots and solar wafers
15,687,921 15,138,528 418,583 100.00% 2,805,441 100.00% (2,648,071) (2,614,702) Subsidiary
(Note 4)
AUO SREC Taiwan ROC Investment 379,040 379,040 37,904 32.01% 424,653 32.01%
110,266 35,300 Associate
AUO Lextar Taiwan ROC Manufacturing and sales of Light Emitting Diode
881,076 881,076 78,418 15.10% 1,642,746 15.33%
(309,651) (46,855) Associate
AUO SMI Taiwan ROC Sales and leasing of content
management system and hardware
30,000 30,000 3,000 100.00% 18,247 100.00%
(11,025) (11,025) Subsidiary
AUO UTI Taiwan ROC Planning, design and
development of construction for environmental protection
and related project
management
100,000 50,000 10,000 100.00% 88,906 100.00%
(11,183) (11,183) Subsidiary
AUO SSEC Taiwan ROC Investment 930,000 930,000 93,000 31.00% 953,966 31.00%
73,407 22,756 Associate
AUO CQIL Israel Holding company 876,659 821,138 39,974 100.00% 576,111 100.00% (54,995) (182,866) Subsidiary
Konly DPTW Taiwan ROC Design, manufacturing, and
sales of TFT-LCD modules,
backlight modules, TV set
and related parts
703,795 703,795 42,598 6.40% 707,303 6.40%
(190,141) (12,170) Subsidiary
Konly ACTW Taiwan ROC Manufacturing and sales of
ingots and solar wafers
- 589,793 - -
- 2.50% (2,648,071)
(2,381) Subsidiary
(Note 4)
Konly SREC Taiwan ROC Investment 17,760 17,760 1,776 1.50% 19,897 1.50%
110,266 1,654 Associate Konly Raydium Taiwan ROC IC design 175,857 175,857 11,454 17.10% 740,504 17.63%
674,300 117,334 Associate
Konly Daxin Taiwan ROC Research, manufacturing and
sales of display related chemicals
154,748 154,748 19,114 18.61% 517,812 18.61%
650,420 121,032 Associate

(Continued)
AU
Optro
nics
2019 A
nnual R
epo
rt
274
Investor
Company
Investee
Company Location Main Activities
Original Investment Amount December 31, 2019 Maximum
Shareholding
in the Interim
Net Income
(Loss) of
Investee
Investor’s Share
of Profit (Loss)
of Investee
(Notes 1 and 2)
Note December 31,
2019
December 31,
2018 Shares
Percentage of
Ownership
Carrying Amount
(Notes 1 and 2)
Konly Lextar Taiwan ROC Manufacturing and sales of
Light Emitting Diode
450,674 450,674 26,133 5.03% 547,439 5.11% (309,651) (15,614) Associate
Konly Ubitech
Inc.
Taiwan ROC Development and sales of
software for POS system
27,000 27,000 357 26.31% 1,262 26.31% (7,584) (16,854) Associate
Konly SSEC Taiwan ROC Investment 60,000 60,000 6,000 2.00% 61,546 2.00% 73,407 1,468 Associate Konly WishMobil
e,Inc.
Taiwan ROC Developing and providing
CRM APP
15,000 15,000 2,500 12.50% 5,899 12.50% 1,334 (7,932) Associate
Konly SkyREC Ltd.
BVI Data consulting service for retail
46,016 46,016 188 16.12% 4,304 16.12% (14,143) (38,982) Associate
Ronly DPTW Taiwan ROC Design, manufacturing, and
sales of TFT-LCD modules, backlight modules, TV set
and related parts
845,510 845,510 40,509 6.09% 672,617 6.09% (190,141) (11,573) Subsidiary
Ronly Daxin Taiwan ROC Research, manufacturing and sales of display related
chemicals
70,021 70,021 6,312 6.15% 171,001 6.15% 650,420 39,969 Associate
Ronly Lextar Taiwan ROC Manufacturing and sales of Light Emitting Diode
323,431 323,431 34,338 6.61% 719,336 6.71% (309,651) (20,517) Associate
DPTW BVLB Malaysia Holding company 1,051,289 1,051,289 36,000 29.71% 242,935 29.71% (133,388) (39,630) Subsidiary
DPTW DPLB Malaysia Holding company 4,362,627 4,362,627 92,267 100.00% 6,172,423 100.00% (27,931) (17,834) Subsidiary DPTW FHVI BVI Holding company 2,362,321 2,362,321 22,006 100.00% 4,008,112 100.00% 96,028 20,304 Subsidiary
DPTW FRVI BVI Holding company - 274,700 - - - 100.00% 6,200 6,029 Subsidiary
(Note 5) DPTW FFMI Mauritius Holding company 274,700 - 653 100.00% 93,524 100.00% 6,200 - Subsidiary
(Note 5)
DPTW EFOP Taiwan ROC Manufacturing and sales of polymer plasticized raw
materials
338,729 338,729 33,873 49.00% 178,719 49.00% (88,238) (43,237) Joint Venture
DPTW Darwin Summit
Corporatio
n, Ltd.
Thailand International trade 3,740 3,740 40 40.00% 10,394 40.00% 7,765 3,106 Associate
ACTW ACMK Malaysia Manufacturing and sales of
solar wafers
449,975 449,975 46,196 100.00% 537,395 100.00% 42,306 42,306 Subsidiary
ACTW SDMC Taiwan ROC Holding company 1,988,488 1,988,488 116,836 100.00% 1,948,642 100.00% 171,314 168,217 Subsidiary
SDMC M.Setek Japan Manufacturing and sales of
ingots
23,596,398 23,596,368 11,404,184 99.9991% 1,946,295 99.9991% 188,831 188,830 Subsidiary
AULB AUUS United States Sales and sales support of TFT-LCD panels
USD 1,000 USD 1,000 1,000 100.00% USD 2,063 100.00% USD 161 USD 161 Subsidiary
AULB AUJP Japan Sales support of TFT-LCD
panels
USD 276 USD 276 1 100.00% USD 1,765 100.00% USD 1 USD 1 Subsidiary
AULB AUKR South Korea Sales support of TFT-LCD
panels
USD 155 USD 155 - 100.00% USD 1,014 100.00% USD 83 USD 83 Subsidiary
AULB AUCZ Czech Republic
Assembly of solar modules USD 20,531 USD 20,531 - 100.00% USD 10,534 100.00% USD (3,607) USD (3,607) Subsidiary
AULB AUSK Slovakia
Republic
Repairing of TFT-LCD
modules
USD 1,359 USD 54,349 - 100.00% USD 22,879 100.00% USD 246 USD 246 Subsidiary

AU
Optro
nics
2019 A
nnual R
epo
rt
(Continued)
275
Appendix
2
Investor
Company
Investee
Company Location Main Activities
Original Investment Amount December 31, 2019 Maximum
Shareholding
in the Interim
Net Income
(Loss) of
Investee
Investor’s Share
of Profit (Loss)
of Investee
(Notes 1 and 2)
Note December 31,
2019
December 31,
2018 Shares
Percentage of
Ownership
Carrying Amount
(Notes 1 and 2)
AULB AUST Singapore Manufacturing TFT-LCD
panels based on low temperature polysilicon
technology
USD 276,543 USD 321,161 907,114 100.00% USD 139,306 100.00% USD 2,120 USD 2,120 Subsidiary
AULB AUVI United States Research and development and IP related business
USD 5,000 USD 5,000 5,000 100.00% USD 5,875 100.00% USD 255 USD 255 Subsidiary
AULB BVLB Malaysia Holding company USD 85,171 USD 85,171 85,171 70.29% USD 19,073 70.29% USD (4,313) USD (3,032) Subsidiary
AULB AUSG Singapore Holding company and sales support of TFT-LCD panels
USD 48,321 USD 86,685 266,268 100.00% USD 34,448 100.00% USD 903 USD 903 Subsidiary
AUSG AEUS United States Sales support of solar-related
products
USD 3,510 USD 3,510 9,510 100.00% USD 814 100.00% USD (1) USD (1) Subsidiary
AUSG AENL Netherlands Sales support of solar-related
products
USD 45 USD 45 - 100.00% USD 174 100.00% USD (12) USD (12) Subsidiary
DPLB DPHK Hong Kong Holding company USD 103,785 USD 103,785 10 100.00% USD 205,804 100.00% USD (248) USD (248) Subsidiary (Note 6)
DPLB DPSK Slovakia
Republic
Manufacturing and sales of
automotive parts
USD 4,216 USD 4,216 - 100.00% USD 2,546 100.00% USD (655) USD (655) Subsidiary
FHVI FTMI Mauritius Holding company USD 6,503 USD 6,503 6,503 100.00% USD 75,756 100.00% USD (2,786) USD (2,786) Subsidiary
FHVI FWSA Samoa Holding company USD 19,000 USD 19,000 19,000 100.00% USD 14,364 100.00% USD 146 USD 146 Subsidiary
FHVI PMSA Samoa Holding company USD 39,673 USD 39,673 31,993 100.00% USD 44,825 100.00% USD 1,832 USD 1,832 Subsidiary FRVI FFMI Mauritius Holding company - USD 8,200 - - - 100.00% USD 200 USD 200 Subsidiary
(Note 5)
M.Setek Ichijo Seisakusyo
Co., Ltd.
Japan Manufacturing of semiconductor equipment
and related parts
JPY 5,000 JPY 5,000 - 38.46% - 38.46% - - Associate (Note 3)
CQIL CQHLD United Kingdom
Holding company USD 18,868 USD 4,071 635,709 100.00% USD 18,491 100.00% USD 4,811 USD 4,811 Subsidiary
CQHLD CQUK United
Kingdom
Sales and sales support of
content management system
GBP 1,874 - - 100.00% USD 510 100.00% USD 123 USD 123 Subsidiary
CQHLD CQUS United States Sales of content
management system and
hardware
USD 15,607 USD 1 11 100.00% USD 3,863 100.00% USD (1,873) USD (1,873) Subsidiary
CQHLD CQCA Canada Research and development
of content management
system
CAD 1,310 - - 100.00% USD 550 100.00% USD 88 USD 88 Subsidiary
CQUS JRUK United
Kingdom
Development and sales of
content management system
and sales of related hardware
- - - 100.00% - 100.00% - - Subsidiary
CQUS JRUS United States Development and sales of
content management system
and sales of related hardware
- - 10 100.00% - 100.00% - - Subsidiary
Note 1: All inter-company transactions among AUO and its subsidiaries have been eliminated in the consolidated financial statements.
Note 2: Inclusive of the amortization of differences between the investment cost and the entity’s share of the net value of investee, and the effect of upstream and sidestream transactions.
Note 3: The carrying amount includes accumulated impairment loss. Note 4: As part of a business restructuring, AUO acquired all shares of ACTW from Konly and other shareholders.
Note 5: FRVI was liquidated in the fourth quarter of 2019. FRVI transferred all of its shareholdings in FFMI to DPTW.
Note 6: The registration of the alteration of DPHK’s common stock has not been completed.

(Continued)
AU
Optro
nics
2019 A
nnual R
epo
rt
276
AU OPTRONICS CORP. AND SUBSIDIARIES
Information on Investment in Mainland China
For the year ended December 31, 2019 (Amount in thousands of New Taiwan Dollars and foreign currencies indicated)
Table 8
1. AUO:
(1) Related information on investment in Mainland China
Investee
Company Main Activities
Total Amount
of Paid-in
Capital
(Note 2)
Method of
Investment
Accumulated
Outflow of
Investment
from Taiwan
as of January
1, 2019
(Note 2)
Investment
Flows
Accumulated
Outflow of
Investment
from Taiwan
as of
December
31, 2019
(Note 2)
Net Income
(Loss) of
Investee
(Notes 4 and 5)
%
Ownership
through
Direct or
Indirect
Investment
Maximum
Shareholding
in the Interim
Investor’s
Share of Profit
(Loss) of
Investee
(Notes 4 and 5)
Carrying
Amount of
the
Investment
as of
December
31, 2019
(Note 2)
Accumulated
Inward
Remittance of
Earnings as of
December
31, 2019
Note
Outflow Inflow
A-Care Design, development
and sales of software and hardware for
health care industry
43,155 (Note 1) - - - - (18,772) 100% 100% (18,772) 17,973 -
AETJ Manufacturing and sales of solar
modules
- (Note 1) - - - - 847 - 100% 847 - - Note 8
AUKS Manufacturing and sales of TFT-LCD
panels
28,959,735 (Note 1) 14,769,465 - - 14,769,465 (4,634,866) 51% 51% (2,363,782) 4,985,961 -
AUSH Sales support of TFT-LCD panels
90,405 (Note 1) 30,135 - - 30,135 (37,431) 100% 100% (37,431) 417,037 -
AUSJ Manufacturing and
assembly of TFT-LCD modules;
leasing
3,254,580 (Note 1) 2,410,800 - - 2,410,800 81,056 100% 100% 152,141 3,783,730 - Note 7
AUSZ Manufacturing, assembly and sales of
TFT-LCD modules
8,377,530 (Note 1) 6,027,000 - - 6,027,000 2,224,611 100% 100% 2,248,227 14,716,233 - Note 7
AUXM Manufacturing,
assembly and sales of
TFT-LCD modules
7,533,750 (Note 1) 7,533,750 - - 7,533,750 781,059 100% 100% 790,751 13,398,777 - Note 7
BVCH Manufacturing and
sales of liquid crystal
products and related parts
- (Note 1) 225,108 - - 225,108 (14,325) - 19% (2,722) - - Note 8
BVHF Manufacturing and
sales of liquid crystal products and related
parts
2,213,416 (Note 1) - - - - (133,307) 100% 100% (133,307) 815,781 - Note 6
BVXM Manufacturing and sales of liquid crystal
2,589,300 (Note 1) - - - - 36,637 100% 100% 36,637 1,272,990 -

AU
Optro
nics
2019 A
nnual R
epo
rt
(Continued)
277
Appendix
2
Investee
Company Main Activities
Total Amount
of Paid-in
Capital
(Note 2)
Method of
Investment
Accumulated
Outflow of
Investment
from Taiwan
as of January
1, 2019
(Note 2)
Investment
Flows
Accumulated
Outflow of
Investment
from Taiwan
as of
December
31, 2019
(Note 2)
Net Income
(Loss) of
Investee
(Notes 4 and 5)
%
Ownership
through
Direct or
Indirect
Investment
Maximum
Shareholding
in the Interim
Investor’s
Share of Profit
(Loss) of
Investee
(Notes 4 and 5)
Carrying
Amount of
the
Investment
as of
December
31, 2019
(Note 2)
Accumulated
Inward
Remittance of
Earnings as of
December
31, 2019
Note
Outflow Inflow
products and related parts
EDT Design and sales of
software and hardware integration
system and
equipment relating to intelligent
manufacturing
21,578 (Note 1) - - - - (4,886) 100% 100% (4,886) 16,862 -
MIS Development and licensing of software
relating to intelligent
manufacturing, and related consulting
services
21,578 (Note 1) - - - - (13,025) 100% 100% (13,025) 8,659 -
UFSZ Planning, design and development of
construction project
for environmental protection and related
project management
25,893 (Note 1) - - - - (7,951) 100% 100% (7,951) 18,506 -
UFSD Planning, design and development of
construction project
for environmental protection and related
project management
8,631 (Note 1) - - - - (2,932) 100% 100% (2,932) 5,802 -
(2) Upper limit on investment in Mainland China Accumulated Investment in Mainland China
as of December 31, 2019 (Note 2)
Investment Amounts Authorized by the
Investment Commission, MOEA (Note 2)
Upper Limit on Investment Stipulated by the
Investment Commission, MOEA (Note 3)
30,996,258 (USD 1,028,580 ) 40,462,497 (USD 1,335,003 and HKD 60,000) 112,786,050 Note 1: Indirect investments in Mainland China through companies registered in a third region.
Note 2: Amounts denominated in foreign currencies are translated into New Taiwan Dollars using the exchange rates at the reporting date.
Note 3: Pursuant to the Regulations Governing Permission for Investment and Technical Cooperation in the Mainland Area, AUO’s accumulated investments in Mainland China did not exceed the
upper limit on investment amount or ratio stipulated by the Investment Commission, Ministry of Economic Affairs (“MOEA”).
Note 4: Amounts were recognized based on the investees’ audited financial statements except for BVCH.
Note 5: Amounts denominated in foreign currencies are translated into New Taiwan Dollars using the average exchange rates for the year of 2019.
Note 6: BVHF is 100% owned by BVLB, a jointly-owned subsidiary of AUO and DPTW.
Note 7: Investor’s share of profit (loss) of investee and the carrying amount of the investment as of December 31, 2019 both include the effect of sidestream transactions.
Note 8: AETJ and BVCH were liquidated in the fourth quarter of 2019.

(Continued)
AU
Optro
nics
2019 A
nnual R
epo
rt
278
2. DPTW:
(1) Related information on investment in Mainland China
Investee
Company Main Activities
Total Amount
of Paid-in
Capital
(Note 4)
Method of
Investment
Accumulated
Outflow of
Investment
from Taiwan as
of January 1,
2019
(Note 4)
Investment
Flows
Accumulated
Outflow of
Investment
from Taiwan
as of
December
31, 2019
(Note 4)
Net Income
(Loss) of
Investee
(Notes 2 and 6)
%
Ownership
through
Direct or
Indirect
Investment
Maximum
Shareholdin
g in the
Interim
Investor’s
Share of Profit
(Loss) of
Investee
(Notes 2 and 6)
Carrying
Amount of the
Investment as
of December
31, 2019
(Note 4)
Accumulated
Inward
Remittance of
Earnings as of
December
31, 2019
(Note 4)
Note
Outflow
(Note 4)
Inflow
(Note 4)
BVHF Manufacturing and sales of liquid crystal
products and related
parts
2,213,416 (Note 1) 482,160 - - 482,160 (133,307) 29.71% 29.71% (133,307) 815,781 - Note 5
DPSZ Manufacturing and
sales of backlight
modules and related parts
753,375 (Note 1) 452,025 - - 452,025 1,474 100% 100% 1,474 1,779,351 1,003,989 Note 9
DPXM Manufacturing and
sales of backlight modules and related
parts
2,109,450 (Note 1) 2,109,450 - - 2,109,450 (9,145) 100% 100% (9,145) 4,422,562 1,559,487
FHWJ Manufacturing of motorized treadmills
195,878 (Note 1) 247,107 - - 247,107 6,200 100% 100% 6,200 43,308 -
FPWJ Manufacturing and
sales of precision
plastic parts
873,915 (Note 1) 572,565 - - 572,565 6,879 100% 100% 6,879 644,612 - Note 8
FTKS Manufacturing and sales of backlight
modules and related
parts
1,084,860 (Note 1) 1,084,860 - - 1,084,860 56,654 100% 100% 56,654 1,350,802 -
FTWJ Manufacturing and
sales of backlight
modules and related parts
1,054,725 (Note 1) 195,878 - - 195,878 (88,537) 100% 100% (88,537) 2,071,120 424,136 Note 7
(2) Upper limit on investment in Mainland China Accumulated Investment in Mainland China
as of December 31, 2019 (Note 4)
Investment Amounts Authorized by the
Investment Commission, MOEA (Note 4)
Upper Limit on Investment Stipulated by the Investment
Commission, MOEA (Note 3)
5,144,045 (USD 170,700) 5,674,511 (USD 188,303) 6,630,571 Note 1: Indirect investments in Mainland China through companies registered in a third region. Note 2: Amounts were recognized based on the investees’ audited financial statements. Note 3: Pursuant to the Regulations Governing Permission for Investment and Technical Cooperation in the Mainland Area, DPTW’s accumulated investments in Mainland China did not exceed the upper limit
on investment amount or ratio stipulated by the Investment Commission, Ministry of Economic Affairs (“MOEA”). Note 4: Amounts denominated in foreign currencies are translated into New Taiwan Dollars using the exchange rates at the reporting date. Note 5: BVHF is 100% owned by BVLB, a jointly-owned subsidiary of AUO and DPTW. Accordingly, the share of profit (loss) of investee and the carrying amount of the investment as of December 31, 2019
disclosed in the table are presented based on 100% held. Note 6: Amounts denominated in foreign currencies are translated into New Taiwan Dollars using the average exchange rates for the year of 2019. Note 7: The amount of paid-in capital includes the capitalization of retained earnings amounting to USD28,500 thousand for the years from 2005 to 2007. Note 8: The amount of paid-in capital includes the capital injection of USD10,000 thousand from the offshore holding company, which was originally from FTWJ’s appropriation of earnings. Note 9: The amount of paid-in capital includes the capital injection of USD1,000 thousand from DPLB in 2010 and the capitalization of retained earnings of USD9,000 thousand from DPSZ in 2012.

AU Optronics 2019 Annual Report
(Continued)
279
Appendix 2
AU OPTRONICS CORP.
Cash and Cash Equivalents
December 31, 2019
(In thousands of New Taiwan Dollars, unless otherwise indicated)
Item Description Amount
Petty cash $ 2
Cash in Banks Checking accounts 26,949
Demand deposits 21,343,944
Foreign currency deposits (note)
USD : 155,001 thousand
JPY: 19,086,238 thousand
EUR:25,505 thousand
CNY:691 thousand
10,817,590
Time deposits
TWD : 11,600 thousand
11,600,000
Foreign currency time deposits (note)
USD : 71,000 thousand 2,139,585
$ 45,928,070
Note:Exchange rate at balance sheet date was as follows:
USD :30.135
JPY :0.2768
EUR :33.7422
CNY :4.3155

AU Optronics 2019 Annual Report
(Continued)
280
AU OPTRONICS CORP.
Accounts Receivable
December 31, 2019
(In thousands of New Taiwan Dollars)
Customer Name Description Amount Remark
Customer A From operating activities $ 3,485,653
Customer B From operating activities 3,308,630
Customer C From operating activities 3,164,298
Customer D From operating activities 1,938,715
Customer E From operating activities 1,922,559
Customer F From operating activities 1,486,619
Others (less than 5% for each
customer)
From operation activities 11,680,399
Less: Loss allowance (150)
$ 26,986,723
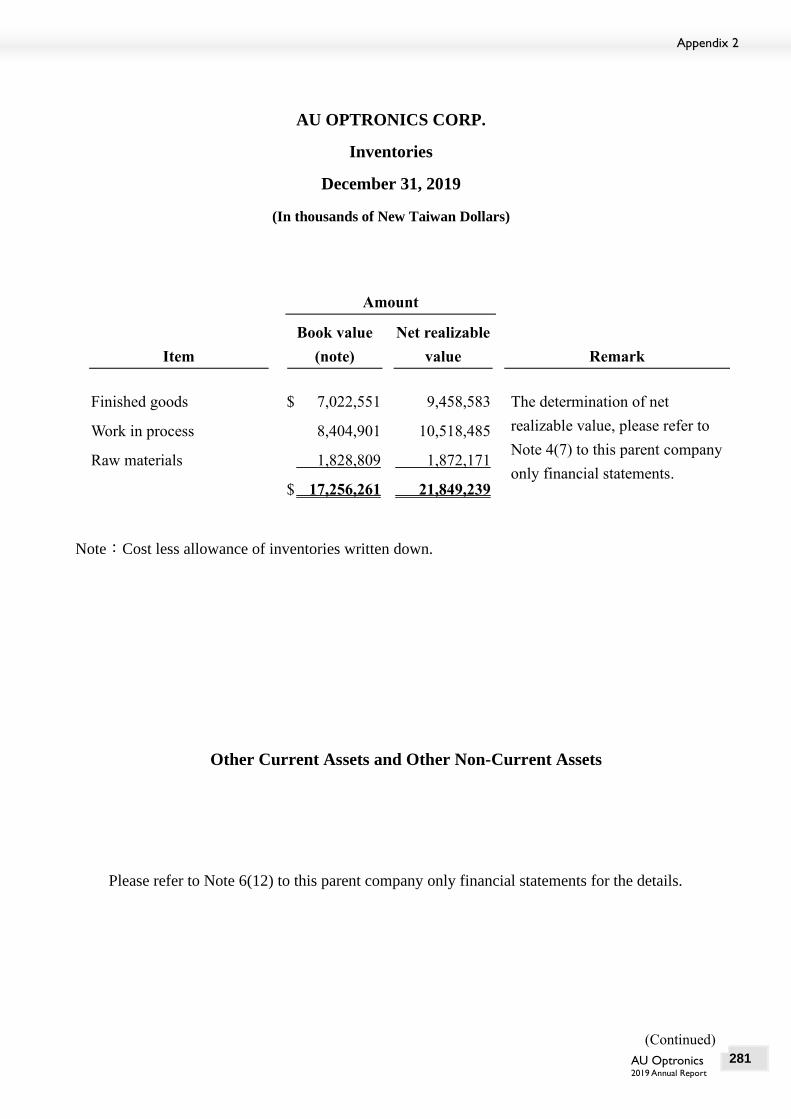
AU Optronics 2019 Annual Report
(Continued)
281
Appendix 2
AU OPTRONICS CORP.
Inventories
December 31, 2019
(In thousands of New Taiwan Dollars)
Amount
Item
Book value
(note)
Net realizable
value Remark
Finished goods $ 7,022,551 9,458,583 The determination of net
realizable value, please refer to
Note 4(7) to this parent company
only financial statements.
Work in process 8,404,901 10,518,485
Raw materials 1,828,809 1,872,171
$ 17,256,261 21,849,239
Note:Cost less allowance of inventories written down.
Other Current Assets and Other Non-Current Assets
Please refer to Note 6(12) to this parent company only financial statements for the details.

(Continued)
AU
Optro
nics
2019 A
nnual R
epo
rt
282
AU OPTRONICS CORP.
Changes in Investments in Equity-accounted Investees
For the year ended December 31, 2019 (In thousands of New Taiwan Dollars, unless otherwise indicated, and shares in thousands)
Beginning balance
(note 1)
Addition (Disposal)
(note 2)
Unrealized
gains (losses)
on financial
assets Ending balance (note 1)
Market value or
net asset value
Investee
Name Shares
Amount Shares
Amount
Share of
profit (loss)
Capital
surplus
Cash
dividend
Cumulative
translation
differences
at fair value
though other
comprehensive
income
Other
adjustments
(note 3) Shares
Amount
% of
Ownership
Unit
price
Total price
Guarantee
or
Pledged
AULB 1,882,189 $53,565,171 - - 1,481,004 - - (1,824,574) - - 1,882,189 53,221,601 100.00 - 53,221,601 None
ACTW 378,193 5,005,774 40,390 549,393 (2,614,702) (153,994) - 18,970 - - 418,583 2,805,441 100.00 - 2,805,441 None
Konly 284,302 5,296,190 - - 171,825 2,750 (202,127) (43,211) (16,463) (28) 284,302 5,208,936 100.00 - 5,208,936 None
DPTW 190,108 3,369,060 - - (54,311) - (64,637) (93,538) - - 190,108 3,156,574 28.56 15.15 2,880,136 None
Ronly 149,412 2,076,069 5,345 - 9,126 (6,754) - (29,345)
777
(13) 154,757 2,049,860 100.00 - 2,049,860 None
SMI 3,000 29,272 - - (11,025) - - - - - 3,000 18,247 100.00 - 18,247 None
UTI 5,000 50,888 5,000 50,000 (11,183) - (799) - - - 10,000 88,906 100.00 - 88,906 None
Lextar 78,418 1,740,230 - - (46,855) (15,425) (15,450) (21,500)
1,775
(29) 78,418 1,642,746 15.10 18.15 1,423,295 None
SSEC 93,000 942,094 - - 22,756 - (10,884) - - - 93,000 953,966 31.00 - 953,966 None
SREC 37,904 414,978 - - 35,300 - (25,625) - - - 37,904 424,653 32.01 - 424,653 None
CQIL 39,974 766,795 - 55,521 (182,866) - - (63,339) - - 39,974 576,111 100.00 - 576,111 None
AUNL 50 25,464 - - 13,707 - - (1,397) - - 50 37,774 100.00 - 37,774 None
$73,281,985 654,914 (1,187,224) (173,423) (319,522) (2,057,934) (13,911) (70) 70,184,815
Note 1:The amount is net of accumulated impairment.
Note 2:Including: (1) The Company acquired shareholdings in ACTW from Konly and Ronly; (2) The Company received stock dividends from Ronly;(3) The Company joined the capital injuction in UTI and CQIL.
Note 3:Including share of actuarial gains (losses) in investees' defined benefits plan and so on.
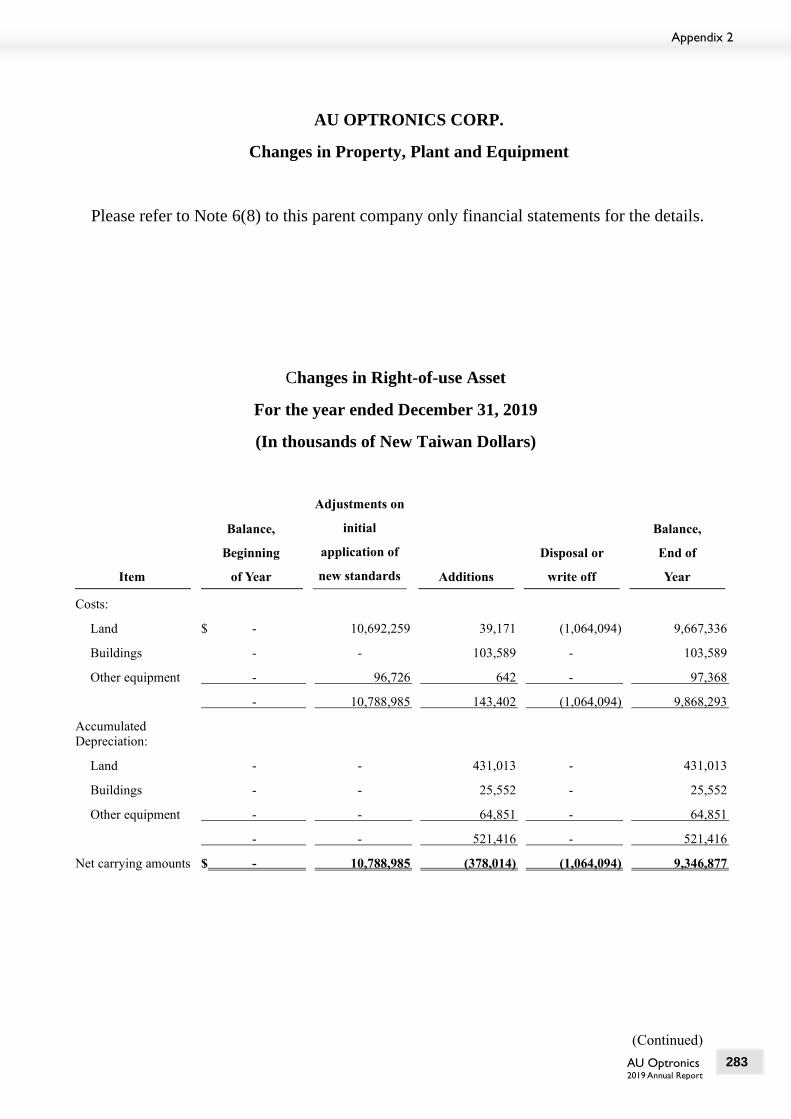
AU Optronics 2019 Annual Report
(Continued)
283
Appendix 2
AU OPTRONICS CORP.
Changes in Property, Plant and Equipment
Please refer to Note 6(8) to this parent company only financial statements for the details.
Changes in Right-of-use Asset
For the year ended December 31, 2019
(In thousands of New Taiwan Dollars)
Item
Balance,
Beginning
of Year
Adjustments on
initial
application of
new standards Additions
Disposal or
write off
Balance,
End of
Year
Costs:
Land $ - 10,692,259 39,171 (1,064,094) 9,667,336
Buildings - - 103,589 - 103,589
Other equipment - 96,726 642 - 97,368
- 10,788,985 143,402 (1,064,094) 9,868,293
Accumulated Depreciation:
Land - - 431,013 - 431,013
Buildings - - 25,552 - 25,552
Other equipment - - 64,851 - 64,851
- - 521,416 - 521,416
Net carrying amounts $ - 10,788,985 (378,014) (1,064,094) 9,346,877

AU Optronics 2019 Annual Report
(Continued)
284
AU OPTRONICS CORP.
Intangible Assets
December 31, 2019
Please refer to Note 6(11) to this parent company only financial statements for the details.
Accounts Payable
December 31, 2019
(In thousands of New Taiwan Dollars)
Vendor name Description Amount Remark
Company A Using in operation $ 2,964,269
Company B Using in operation 2,448,898
Company C Using in operation 1,801,739
Company D Using in operation 1,432,966
Company E Using in operation 1,225,773
Others (less than 5% for each vendor) Using in operation 14,422,770
$ 24,296,415

AU Optronics 2019 Annual Report
(Continued)
285
Appendix 2
AU OPTRONICS CORP.
Other Current Liabilities
December 31, 2019
(In thousands of New Taiwan Dollars)
Item Description Amount Remark
Accrued payroll and bonus $ 4,286,761
Refund liability 2,036,113
Accrued royalty and others 7,261,596
$ 13,584,470
Equipment and Construction Payable
Vendor name Amount
Company W $ 305,390
Company X 304,518
Company Y 254,572
Others (less than 5% for each vendor) 3,704,483
$ 4,568,963
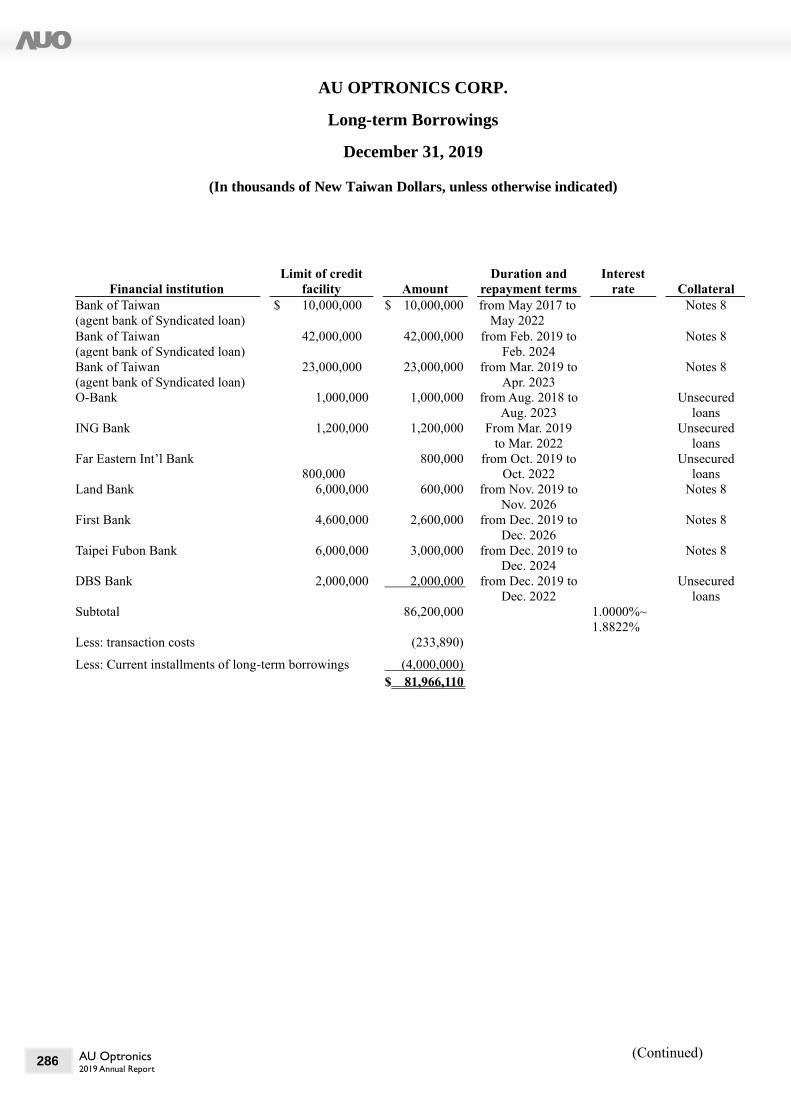
AU Optronics 2019 Annual Report
(Continued)
286
AU OPTRONICS CORP.
Long-term Borrowings
December 31, 2019
(In thousands of New Taiwan Dollars, unless otherwise indicated)
Financial institution Limit of credit
facility Amount Duration and
repayment terms Interest
rate Collateral Bank of Taiwan
(agent bank of Syndicated loan) $ 10,000,000 $ 10,000,000 from May 2017 to
May 2022
Notes 8
Bank of Taiwan
(agent bank of Syndicated loan) 42,000,000 42,000,000 from Feb. 2019 to
Feb. 2024
Notes 8
Bank of Taiwan
(agent bank of Syndicated loan) 23,000,000 23,000,000 from Mar. 2019 to
Apr. 2023
Notes 8
O-Bank 1,000,000 1,000,000 from Aug. 2018 to
Aug. 2023
Unsecured
loans ING Bank 1,200,000 1,200,000 From Mar. 2019
to Mar. 2022
Unsecured
loans Far Eastern Int’l Bank
800,000 800,000 from Oct. 2019 to
Oct. 2022
Unsecured
loans Land Bank 6,000,000 600,000 from Nov. 2019 to
Nov. 2026
Notes 8
First Bank 4,600,000 2,600,000 from Dec. 2019 to
Dec. 2026
Notes 8
Taipei Fubon Bank 6,000,000 3,000,000 from Dec. 2019 to
Dec. 2024
Notes 8
DBS Bank 2,000,000 2,000,000 from Dec. 2019 to
Dec. 2022
Unsecured
loans Subtotal 86,200,000 1.0000%~
1.8822%
Less: transaction costs (233,890)
Less: Current installments of long-term borrowings (4,000,000)
$ 81,966,110

AU Optronics 2019 Annual Report
(Continued)
287
Appendix 2
AU OPTRONICS CORP.
Lease Liabilities
December 31, 2019
(In thousands of New Taiwan Dollars, unless otherwise indicated)
Item Durations Discount Rate Amount
Land from Sep. 2001 to Dec. 2045 1.8203~1.8853% $ 9,313,209
Buildings from Dec. 2018 to Nov. 2024 1.8853% 79,552
Other equipment from Jul. 2005 to Jul. 2020 1.8203% 32,814
$ 9,425,575
Net Revenue
For the year ended December 31, 2019
Item Quantity Amount Remark
(Panels in thousands)
Products ten inches and above in
diagonal length
108,160 $ 198,981,031
Products which are under ten inches in
diagonal length
131,116 43,844,572
Sales of raw material and others 365,379 12,341,573
Total $ 255,167,176

AU Optronics 2019 Annual Report
(Continued)
288
AU OPTRONICS CORP.
Cost of Sales
For the year ended December 31, 2019
(In thousands of New Taiwan Dollars)
Item Amount
Raw materials used
Balance, beginning of year (note) $ 2,853,559
Add:Purchases 86,548,105
Less:Raw materials, end of year (note) (2,811,760)
Sale of raw materials (5,722,744)
Transferred to other expenses and others (30,864,444)
Subtotal 50,002,716
Direct labor 9,948,290
Manufacturing expenses 110,225,743
Manufacturing cost 170,176,749
Work in process, beginning of year (note) 11,474,466
Add:Purchases 74,498,347
Less:Work in process, end of year (note) (9,862,806)
Transferred to other expenses and others (8,040,779)
Cost of finished goods 238,245,977
Finished goods, beginning of year (note) 9,927,850
Add:Purchases 314,253
Less:Finished goods, end of year (note) (8,893,633)
Transferred to other expenses and others (1,278,678)
Cost of goods sold 238,315,769
Add:Cost of raw materials sold 5,722,744
Other operating cost 11,081,848
Write-downs of inventories 265,330
Cost of idle capacity 2,400,409
Cost of Sales $ 257,786,100
Note:The amounts were stated at cost.

AU Optronics 2019 Annual Report
(Continued)
289
Appendix 2
AU OPTRONICS CORP.
Selling and Distribution Expenses
For the year ended December 31, 2019
(In thousands of New Taiwan Dollars)
Item Description Amount Remark
Salary expenses $ 978,512
Freight expenses 939,031
Warranty expenses 566,517
Others (less than 5% for each item) 388,949
$ 2,873,009
General and Administrative Expenses
Item Description Amount Remark
Salary expenses $ 1,429,819
Professional service fees 555,999
Depreciation expenses 314,215
Management fees of the Science
Park Administration
243,416
Repairs and maintenance expenses 229,876
Others (less than 5% for each item) 1,471,080
$ 4,244,405
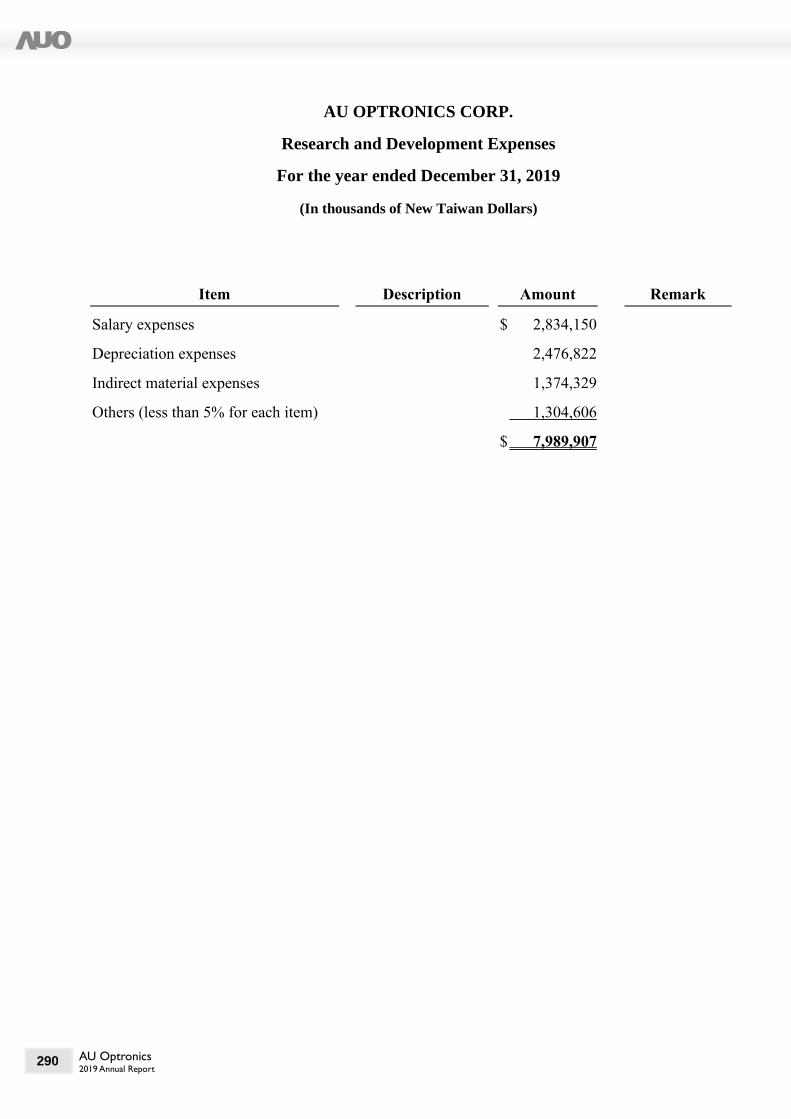
AU Optronics 2019 Annual Report
290
AU OPTRONICS CORP.
Research and Development Expenses
For the year ended December 31, 2019
(In thousands of New Taiwan Dollars)
Item Description Amount Remark
Salary expenses $ 2,834,150
Depreciation expenses 2,476,822
Indirect material expenses 1,374,329
Others (less than 5% for each item) 1,304,606
$ 7,989,907

AU Optronics Corporation
Representative: Shuang-Lang (Paul) Peng


![Panel AU Optronics M150XN07 V1 0 [DS]](https://img.pdfslide.net/doc/110x75/55cf85cf550346484b91965b/panel-au-optronics-m150xn07-v1-0-ds.jpg)

![Panel Au Optronics t260xw04 v7 Cell 0 [Ds]](https://img.pdfslide.net/doc/110x75/55cf85d0550346484b919c7f/panel-au-optronics-t260xw04-v7-cell-0-ds.jpg)

![Panel AU Optronics B133XN03 V3 0 [DS]](https://img.pdfslide.net/doc/110x75/563dbb70550346aa9aad28e7/panel-au-optronics-b133xn03-v3-0-ds-56941a1a36cc7.jpg)
![Panel AU Optronics T201VN01 V1 0 [DS]](https://img.pdfslide.net/doc/110x75/55cf85d0550346484b919ccc/panel-au-optronics-t201vn01-v1-0-ds.jpg)
![Panel AU Optronics A201SN01 V0 0 [DS]](https://img.pdfslide.net/doc/110x75/55cf85cf550346484b9194ac/panel-au-optronics-a201sn01-v0-0-ds.jpg)