Embed Size (px)
Citation preview
Christopher Lewis & Sean Brooks
Digital System Processing – Project VI
12/11/2012
2012Audio Equalizer
TABLE OF CONTENTS
The current report will describe and provide an informative breakdown of an audio equalizer created to adjustable settings per any user preferences using LabVIEW. The final project for Project V, Digital Signal Processing System Design, was to apply basic theory and applications of modern digital signal processing, to learn basic theory of real-time digital signal processing, and to develop ability to implement and simulate digital signal processing algorithms using MATLAB and on real-time DSP platform. Within the project, we must demonstrate that these course objectives have been learned:
Understand basic concepts of digital signal processing theories and techniques.
Develop basic understanding of real-time digital signal processing.
Develop ability to implement digital signal processing algorithms in Matlab and LabVIEW.
Develop ability to implement digital signal processing algorithms on real-time DSP platform.
Background Information
An audio equalizer is a device commonly used in sound recording and reproduction to alter the frequency response of an audio system using linear filters.1 Equalization is can be broken into three parts to better understand the process. The three parts are signal acquisition (input), signal processing, and the output of the modified signal. Filters are the main component to the equalization process. These filters can be used for noise
1 Wikipedia
1
suppression, signal enhancement, removal or attenuation of a specific frequency. The signal processing section of the filters can be . Audio equalizers are typically constructed in a parallel-circuit manner, where the lowpass, bandpass, and highpass are connected in this configuration. The filters are set to specified frequencies based on typical frequencies that can be heard by the average human ear. Frequencies affected can be analyzed visually by implementing a spectrum analyzer. This element allows the user to see and measure the effects as the controls are moved to a particular preference. Such equipment to replicate these specific frequencies can be relatively expensive. This can be corrected by using software, such as LabVIEW. This can minimize any size restrictions and makes it portable for easy transport.
Signal Acquisition
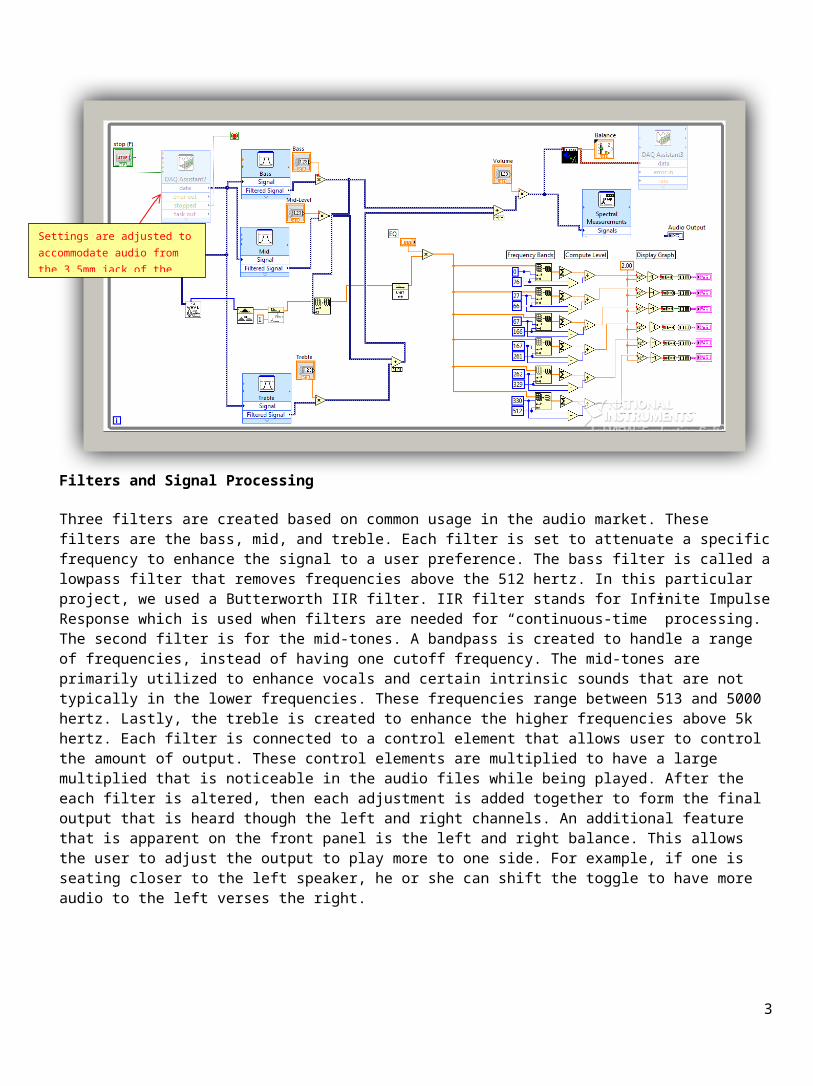
The design of the audio equalizer allows a user to connect audio files via the 3.5 mm jack. This was chosen to allow compatibility with most audio input devices. The myDAQ is used to acquire the input signal. The myDAQ is a low-cost data acquisition (DAQ) device that gives students the ability to measure and analyze live signals. National Instruments myDAQ is compact and portable so students can extend hands-on learning outside of the lab environment using industry-standard tools and methods.2 Once the myDAQ is connected to LabVIEW, we had to program the correct to allow the audio to feed into our project’s VI. We had to set the sample rate and voltage specifications to allow the audio files to play without lag or error. For example, the voltage specifications must be set to ±2V for the left and right channel for the input and output. I believe this is just a standard parameter for the myDAQ because once the voltage parameters are exceed, an error dialog box will display and stop the VI from continuing. In the diagrams below, we will show how the signal acquisition part of the VI looks:
Filters and Signal Processing
Three filters are created based on common usage in the audio market. These filters are the bass, mid, and treble. Each filter is set to attenuate a specific frequency to enhance the signal to a user preference. The bass filter is called a lowpass filter that removes frequencies above the 512 hertz. In this particular project, we used a
2 http://sine.ni.com/np/app/main/p/ap/academic/lang/en/pg/1/sn/n17:academic,n21:16781/fmid/6353/
2
Settings are adjusted to accommodate audio from the 3.5mm jack of the left and right channels.
Butterworth IIR filter. IIR filter stands for Infinite Impulse Response which is used when filters are needed for “continuous-time” processing. The second filter is for the mid-tones. A bandpass is created to handle a range of frequencies, instead of having one cutoff frequency. The mid-tones are primarily utilized to enhance vocals and certain intrinsic sounds that are not typically in the lower frequencies. These frequencies range between 513 and 5000 hertz. Lastly, the treble is created to enhance the higher frequencies above 5k hertz. Each filter is connected to a control element that allows user to control the amount of output. These control elements are multiplied to have a large multiplied that is noticeable in the audio files while being played. After the each filter is altered, then each adjustment is added together to form the final output that is heard though the left and right channels. An additional feature that is apparent on the front panel is the left and right balance. This allows the user to adjust the output to play more to one side. For example, if one is seating closer to the left speaker, he or she can shift the toggle to have more audio to the left verses the right.
Filter Configurations in LabVIEW
3
Each filter is calculated separately and then summed together to form the final output that is heard through the speakers with the desired adjustments from the user.
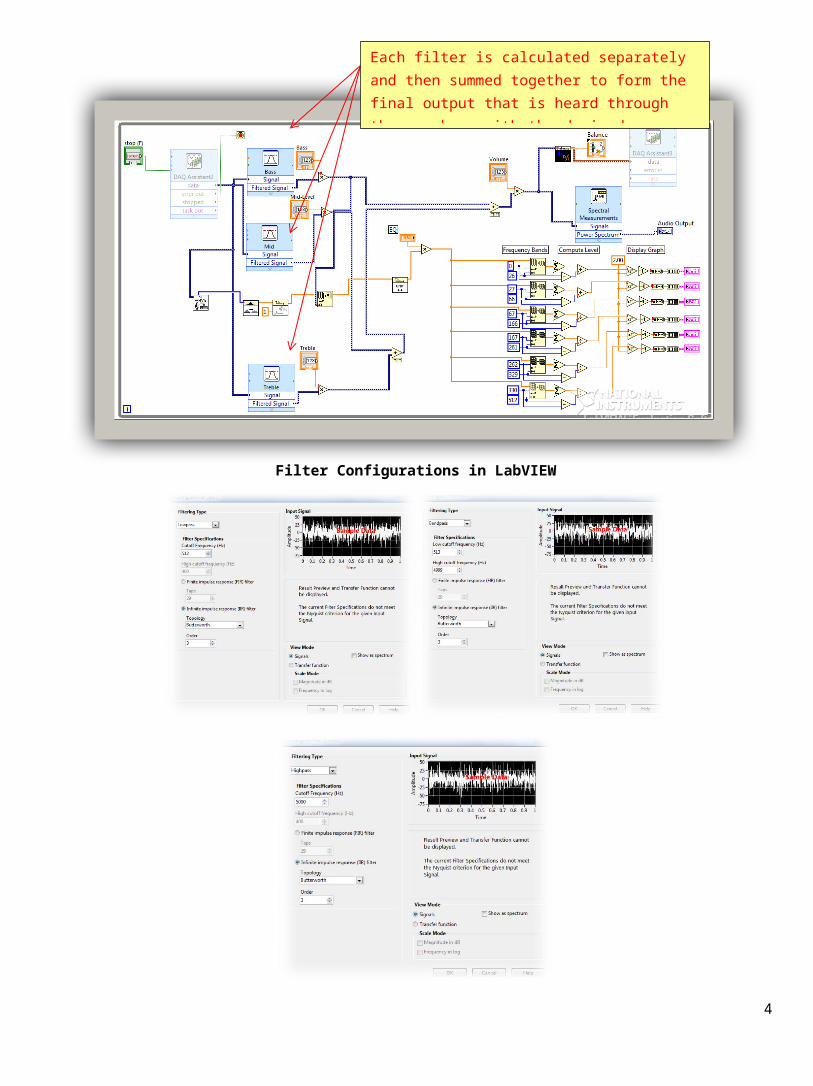
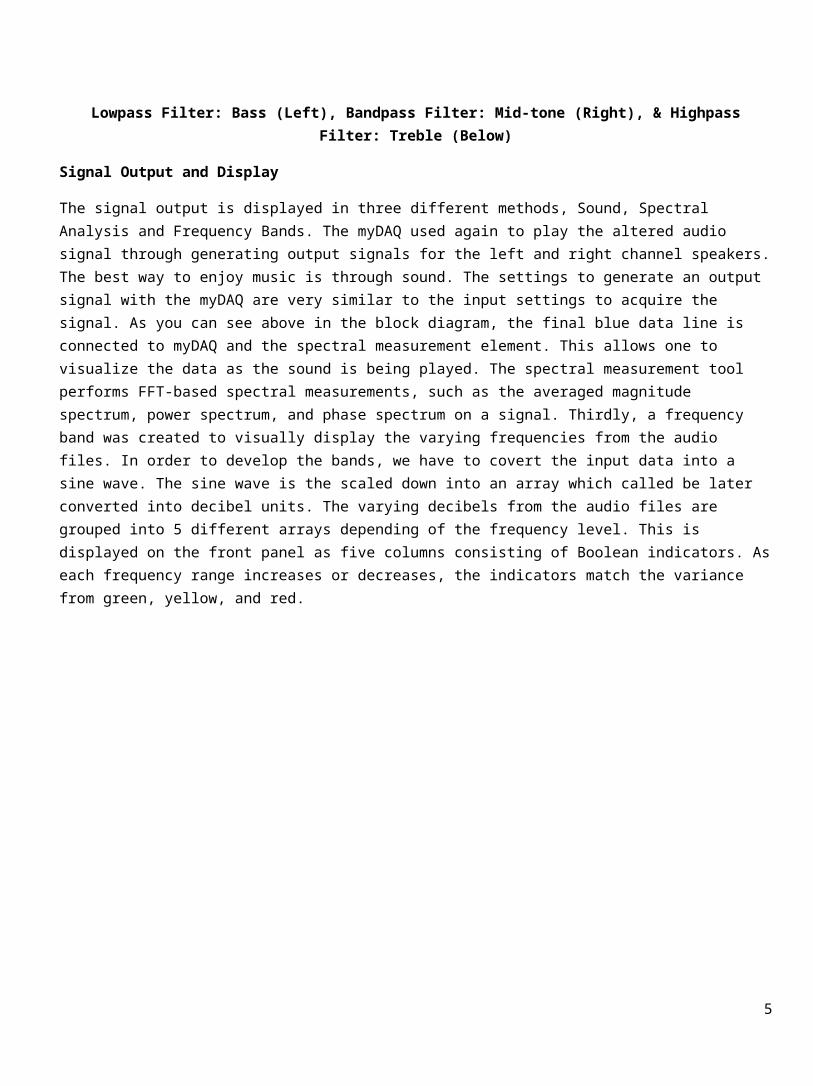
Lowpass Filter: Bass (Left), Bandpass Filter: Mid-tone (Right), & Highpass Filter: Treble (Below)
Signal Output and Display
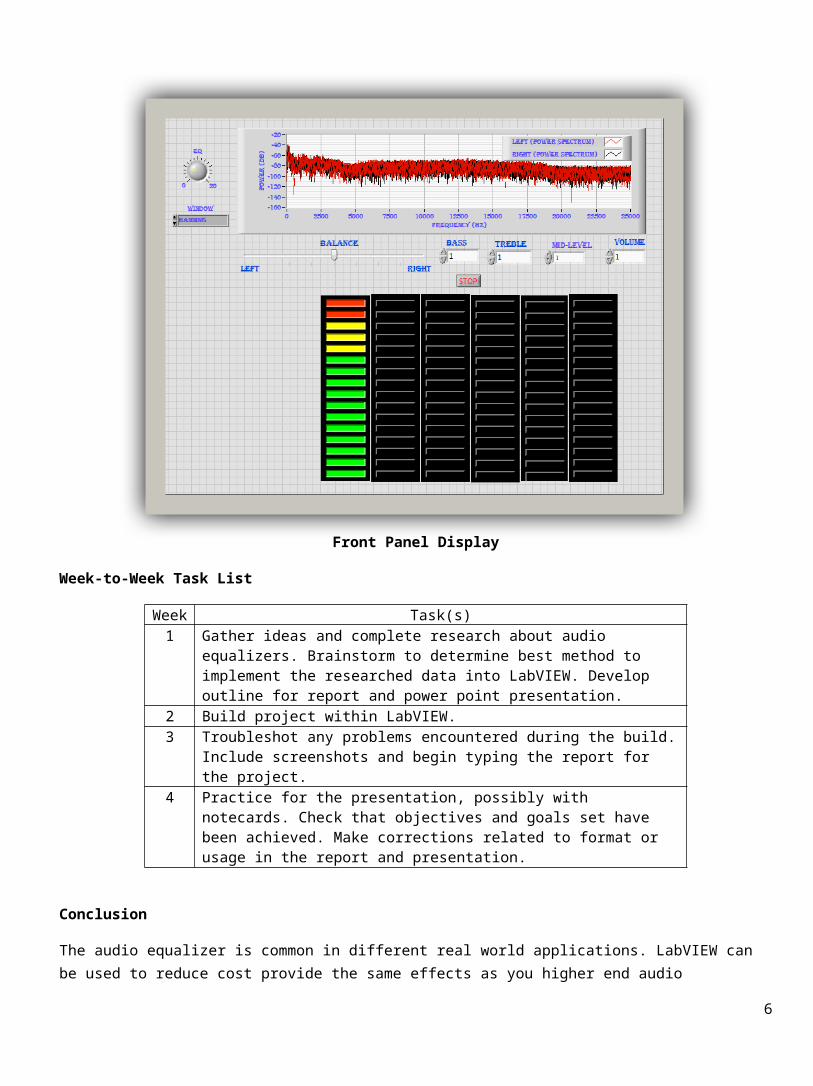
The signal output is displayed in three different methods, Sound, Spectral Analysis and Frequency Bands. The myDAQ used again to play the altered audio signal through generating output signals for the left and right channel speakers. The best way to enjoy music is through sound. The settings to generate an output signal with the myDAQ are very similar to the input settings to acquire the signal. As you can see above in the block diagram, the final blue data line is connected to myDAQ and the spectral measurement element. This allows one to visualize the data as the sound is being played. The spectral measurement tool performs FFT-based spectral measurements, such as the averaged magnitude spectrum, power spectrum, and phase spectrum on a signal. Thirdly, a frequency band was created to visually display the varying frequencies from the audio files. In order to develop the bands, we have to covert the input data into a sine wave. The sine wave is the scaled down into an array which called be later converted into decibel units. The varying decibels from the audio files are grouped into 5 different arrays depending of the frequency level. This is displayed on the front panel as five columns consisting of Boolean indicators. As each frequency range increases or decreases, the indicators match the variance from green, yellow, and red.
4
Front Panel Display
Week-to-Week Task List
Week
Task(s)
1 Gather ideas and complete research about audio equalizers. Brainstorm to determine best method to implement the researched data into LabVIEW. Develop outline for report and power point presentation.
2 Build project within LabVIEW.3 Troubleshot any problems encountered during the build. Include
screenshots and begin typing the report for the project.4 Practice for the presentation, possibly with notecards. Check that objectives
and goals set have been achieved. Make corrections related to format or usage in the report and presentation.
Conclusion
The audio equalizer is common in different real world applications. LabVIEW can be used to reduce cost provide the same effects as you higher end audio equipment. Challenges did occur throughout the process. Many hours were dedicated to research to understand the elements required to create a frequency band within the software. Also, we had difficulty developing the correct calculations to have the frequency vary as the audio files were playing. The filters and controls for the filters had to be constantly changed to accommodate the small voltage
5
output of ±2V. Overall, this was an interesting because it required us to use many engineering design standards and learn the extensive elements within LabVIEW to achieve the completion of our final project.
References
I. Welch, Thad, Wright, Cameron, Morrow, Michael. Real-Time Digital Signal Processing from MATLAB to C with the TMS3206x DSPs. Boca Raton,FL: CRC Press.2012
6