Embed Size (px)
Citation preview

For Official Use Only
AUDIT OF FTS WORKING CAPITAL / RESERVE FUND LEVELS
REPORT NUMBER A040132/T/A/Z05012
MARCH 28, 2005
NOTICE: This report has been developed by and is the property of the Office of Audits, Office of Inspector General. Copies of the report are provided to agency personnel for official purposes only and should not be disseminated further. Agency officials who receive requests to release this report to anyone outside of the General Services Administration should refer the requestor to the Office of Inspector General, Office of Counsel – Freedom of Information Officer.
For Official Use Only

For Official Use Onlyu.s. GENERAL SERVICES ADMINISTRATIONOffice of Inspector General
Date: March 28, 2005
Reply toAttn of:
William D. Anthony, Audit ManagerAcquisition Programs Audit Office (JA-A)
Subject: Audit of FTS Working Capital/Reserve Fund LevelsReport Number AO40132/T/A/ZO5012
To: Barbara L. SheltonActing Commissioner, Federal Technology Service (T)
This report presents the results of the Office of Inspector General's review of theFederal Technology Service's (FTS) reserve fund levels. The audit was included inthe Fiscal Year (FY) 2004 Office of Inspector General's Annual Plan.
Background
Over the years GSA's funding sources transitioned from direct enactedappropriations from the general funds of the Treasury to self-sustaining reimbursablerevolving funds. GSA's FY 2005 Budget reflects obligations totaling $24.3 billion forprograms under GSA's accounts. Most funds (about 99%) become available to GSAfrom Federal customers through reimbursements to three revolving funds forpurchase of goods and services or as rent paid for space in GSA owned and leasedbuildings. While the President's 2006 budget proposes to merge the General SupplyFund with the Information Technology (IT) Fund, the focus of this discussion is the ITFund.
FTS recovers both the costs of products and services and the costs of delivery of theproducts and services for its information technology and telecommunicationsactivities through the IT Fund. The IT Fund is a full cost recovery, revolving fund thatprovides Federal agencies with information technology solutions andtelecommunications products and services. These include information technologysolutions, local telecommunications and long-distance products and services.
The IT Fund was established by the Paperwork Reduction Reauthorization Act of1986, as included in Public Laws 99-500 and 99-591, section 821 (a) (1); 40 U.S.C322.
Levels of funding for capital investments and operating capital are determinedthrough the submission of planned cost and capital requirements to the Office ofManagement and Budget (OM B) pursuant to section 110 (a) (1) of the FederalProperty and Administrative Services Act of 1949, as amended by P.L. 99-591.
The
For Official Use Only24118th Street 5., CS4, Suite 400, Arlington, VA 22202-3402
~Federal Recycling Program ..., Printed on Recycled Paper

For Official Use Only
statute authorizes the Administrator to establish rates to be charged to agencies receiving services that are consistent with the Cost and Capital Requirements Plan. The IT Fund’s capital reserve provides financing for capital investments and program costs which are one-time or non-recurring in nature, allowing for more stable rates for services even when expenses vary because of unique events such as the Networx1 transition. The reserve requirements and fees are developed annually by FTS and included as part of the IT Fund Cost and Capital Requirements (C & C) Plan. For every dollar FTS collects from their customers, 95.6 percent goes to vendors for services provided. The remaining 4.4 percent covers FTS administrative/overhead expenses and IT Fund contributions (Appendix A). There are four business lines financed through the fund:
• Regional IT Solutions • National IT Solutions • Regional Telecommunications • Long Distance
An overview of the business lines’ fee structure and usage of those fees can be viewed in Appendix A. Objective, Scope and Methodology
The objectives of our audit were to answer the following questions: Has GSA/FTS established a methodology to determine appropriate working capital/reserve fund levels? If not, is the level of working capital/reserve fund levels comprising the IT Fund sufficient to “act as a safety net”, while not causing unduly high costs to FTS’ customers?
To make our assessment we: • Reviewed establishing legislation in order to identify relevant criteria; • Reviewed audit reports for relevant findings and recommendations; • Reviewed FTS Cost and Capital Requirements Plans for FY04/05, FY05/06,
and Obligation Schedule file for IT Fund reserve balance and trend information;
• Reviewed Contribution Income Statements for all business units for FYs 1999 through 2004 for Net Operating Results (NOR) and related effect on IT Fund reserve account balances;
• Reviewed available monthly balance sheet information from March 2001 through the end of FY2004 to determine cash, receivables, payables, and reserve account balance and trend information;
1 The Networx program will provide telecommunications and networking services to federal agencies and will serve as the primary replacement for the expiring FTS2001 and FTS2001 Crossover contracts and Federal Wireless contracts.
2 For Official Use Only

For Official Use Only
• Utilized FY 2003 and FY 2004 FTS Audited Consolidating Balance Sheets, Consolidating Statements of Net Cost, and Consolidating Statements of Changes in Net Position to reconcile and validate, on an end of FY basis, electronic financial information submitted to the audit team;
• Interviewed cognizant officials from the Service Coordination and Analysis Division within the GSA Office of the Chief Financial Officer, and Office of the FTS Chief Financial Officer (CFO);
• Researched other Federal and state revolving funds to identify applicable reserve balance criteria;
• Researched relevant U.S. Tax Court (USTC) decisions involving private corporation capital reserve balances.
Our audit work was performed during the period April 2004 through December 2004. The survey phase of the audit involved looking at four business lines and the reserves of the IT Fund. Initially we identified three separate audits – IT Fund reserve levels, Regional Telecommunication (RT) fees, and Regional IT Solutions (RIT) fees; we have since decided to perform two audits, the first on the working capital/reserve fund levels of the IT Fund and the second encompassing the fees of RT and RIT. This report addresses the IT Fund and principally involved work with the Office of the FTS CFO. The audit was conducted in accordance with generally accepted government auditing standards. Results of Review FTS has a methodology for establishing levels of the IT Fund. At the end of FY 2004 the IT Fund balance was reported as $214 million in the FY05/06 Cost and Capital Plan. While some guidance for minimum IT Fund reserves can be inferred from the establishing legislation, we did not find requirements relating to maximum reserve levels defined by OMB, the GSA Office of the Chief Financial Officer, or FTS. Even with the pending consolidation of the IT and General Supply Funds, determining maximum reserve levels would ensure that sufficient funds are available to meet mission needs without maintaining excess reserves and burdening customer agencies with additional fees. FTS had revenue of approximately $8.4 billion in FY 2004, marking the first time that FTS revenue has not increased in the last ten years. On a year-to-year basis FTS NOR has been volatile. FY 2004 NOR was approximately $31 million. The largest negative NOR during the time frame we reviewed was $57.7 million in FY 2001. The FY 2004 FTS cash balance averaged approximately $291 million. The reported IT Fund balance of $214 million does not include an additional $37 million listed in Retained Earnings Other or $66 million identified as Appropriated Capital; FTS has informed us that the Appropriated Capital was start-up capital to commence business-like operations and is not available to shoulder losses.
3 For Official Use Only

For Official Use Only
To the extent we can determine, OMB and GSA Budget have never rejected the IT Fund levels contained in the Cost and Capital Requirements Plans. The IT Fund’s “permanent” Working Capital reserve account is targeted for a balance of approximately $40 million by FTS. Its use includes shouldering business unit losses, financing for capital investments and program costs which are one-time or non-recurring in nature, and allowing for more stable rates for services even when expenses vary because of unique events such as Networx Transition. The balance of each business unit’s “temporary” reserve account is a function of the NOR of that unit. The legislation that established the IT Fund provides some guidance relating to minimum balances required. 40 USC Sec. 757 (c) 1) (A) relates that: “. . . the Administrator is authorized to enter into multiyear contracts for the provision of information technology hardware, software, or services for periods not in excess of five years, if funds are available and adequate for payment of the costs of such contract for the first fiscal year and any costs of cancellation or termination . . . “ To our knowledge OMB, GSA, and FTS have not defined maximum levels for the reserves that comprise FTS’ IT Fund. Developing maximum reserve levels would ensure that there are sufficient IT funds available to meet the mission needs without maintaining excess amounts and burdening customer agencies with additional fees. While we did not find requirements for maximum reserve levels defined by OMB, the GSA Office of the Chief Financial Officer, or FTS, there are United States Tax Court (USTC) decisions that relate to the capital reserve balances of private corporations that are relevant and could be extended in principle to a professional service organization like FTS. The Bardahl formula (see Appendix B) was developed by the USTC to calculate the base level of working capital required for one operating cycle of a private manufacturing company that can be included in retained earnings (capital reserves). The Bardahl ruling permits this working capital base to be supplemented by other reasonable business needs - assuming they can be substantiated - such as debt retirement and expansion of the business. In a related ruling, the USTC allowed two months of professional salaries to be added to the reserve levels calculated by Bardahl for Simons-Eastern, a private professional services company that did not maintain inventories. The USTC rendered both of these decisions in cases where the IRS had levied the excess accumulated earnings tax on private corporations it determined had maintained capital reserves in excess of what was needed for reasonable business purposes. FTS operates in a business-like manner and is a professional services organization. Using the concepts embodied in the Bardahl and Simons-Eastern decisions, an evaluative process could be constructed to assess the maximum level of capital reserves required in the IT Fund.
4 For Official Use Only

For Official Use Only
The graph on page C1 of Appendix C illustrates a range of required IT Fund maximum aggregate reserve levels based on three components selected by us: 1) working capital; 2) two months of professional salaries; and, 3) varying percentages of planned, non-recurring capital investments/transition expenditures over the next five fiscal years included in the IT Fund. We used the change in reserves shown in the FY05/06 C & C Plan as a surrogate for these non-recurring expenditures to capture net impact on the IT Fund. In addition, we estimated and included annual contributions (profits before reserve uses) to the IT Fund for FYs 2007 through 2009 for this illustration. Although it is current FTS practice to only include estimated contributions for the next two FYs in their C & C plan, it is our belief that an estimate of future contributions must be included for all applicable years for this methodology to be viable. We used $28 million, as it was the lowest annual contribution level going back to FY1993. The graph on page C2 of Appendix C replicates the graph above except that our estimated annual contributions are not included in NOR for FYs 2007 though 2009. This graph was inserted for illustrative purposes at the request of FTS. While FTS NOR fluctuates to positive and negative amounts over the last five years, we believe FTS’ use of this type of dynamic, evaluative process will maintain IT Fund reserves at needed levels and stabilize FTS fees. This assumes that FTS manages its receivables aggressively to minimize its operating cycle and related working capital needs, and resulting in cash balances sufficient for ordinary business needs. Recommendation We recommend that the FTS Commissioner:
1. Develop and utilize a dynamic evaluative process to determine maximum IT Fund capital reserve levels. The components comprising the reserves should be quantifiable, able to be substantiated, and reasonably related to the business needs of FTS. This process should also be flexible enough to continue to be applicable after the consolidation of the IT and General Supply Funds.
Issues Needing Further Consideration and/or Study
1. Investment of U.S. Government, Appropriated Capital listed at $66 million.
The Office of the FTS CFO indicated that this amount was start-up capital and not available to shoulder losses. FTS as an organization is well beyond start up, and the GSA Office of the Chief Financial Officer and the Office of the FTS CFO should assess the need to continue restricting this $66 million.
5 For Official Use Only

For Official Use Only
2. Investment of U.S. Government, Retained Earnings Other
FTS needs to assess whether the $37 million in this capital account should beincluded in the reported IT Fund balance.
3. Continuing negative National Information Technology (NIT) budget.
FTS needs to assess whether NIT is a viable business entity.
4 Receivables trend
FTS needs to review the trend of rising unbilled receivables as this results indecreasing cash balances (See Chart in Appendix D).
5, FTS Overhead growth
FTS Corporate Overhead is listed at $40.8, $48.8, and $66.3 million on itsrespective FY02, FY03, and FY04 Contribution Income Statements. Thisrapid growth is disproportionate with growth in business volume and shouldbe assessed.
Management Comments
In a memorandum dated March 23,2005 (see Appendix E), the ActingCommissioner of the Federal Technology Service concurred in principle with theabove recommendation.
Internal Controls
Except for the control aspect of an evaluative process discussed in the Results ofReview section, this review did not require, nor did we perform, a review of internalcontrols.
We wish to thank the FTS for the assistance provided during the audit. If you haveany questions, please contact me on (703) 603-0189.
#
For Official Use Only6
-
Acquisition Programs Audit Office (JA-A)
D. AnthonyAudit Manager

For Official Use Only
AUDIT OF FTS WORKING CAPITAL/RESERVE FUND LEVELS REPORT NUMBER A040132/T/A/Z05012
APPENDIX A – RATE STRUCTURE AND USAGE FY 2004
Federal Technology Service (FTS)
Regional IT Solutions
National IT Solutions Regional Telecommunications Long Distance
Type of Service IT Solutions 1/ IT Solutions 1/ IT Solutions 1/
Local Telecommunications
Services
Expanded 2/ Services
Commercial 3/ Tolls
Long Distance Services
Wireless and Satellite Services
Rate Type Surcharge Hourly by Grade Surcharge Average Line Rate Surcharge Surcharge Surcharge Surcharge
Rate Base % of Total Acquisition Labor Hours
Provided % of Total Acquisition
Number of dial tone lines
% of Total Acquisition
% of Vendor Billing
% of Vendor Billing % of Vendor Billing
Rate Range
Commodities 2% - 4%
Services 3% - 5%
GS-15 - $166 GS-14 - $147 GS-13 - $140 GS-12 - $132 GS-11 - $127 GS-09 - $114 GS-07 - $107
GS-03/06 - $99
Commodities 2% - 4%
Services 3% - 5%
4/
Region 1 - $21.55 Region 2 - $20.36 Region 3 - $20.47 Region 4 - $24.14 Region 5 - $18.01 Region 6 - $26.81 Region 7 - $21.80 Region 8 - $25.32 Region 9 - $26.19
Region 10 - $18.68 Region 11 - $10.11
Equipment 2% - 4%
Services 3% - 5%
16.6% 7%
Direct bill to agency from vendor 1% - 2% Ordering and billing
provided by GSA 4%
1/ FY03 IT Solutions includes commodities such as hardware and software, and advisory services for information technology 2/ Includes any services in support of the local telecommunications infrastructure, such as equipment, servers, and project management and other services 3/ Comprises that portion of the long distance service provided by the local exchange carrier 4/ These FY03 line rates and associated charges vary widely by geographic location and are strongly influenced by the degree of competition in the marketplace.
A-1 For Official Use Only

For Official Use Only
REPORT NUMBER A040132/T/A/Z05012 APPENDIX A – RATE STRUCTURE AND USAGE FY 2004
Information Technology Fund
Cost of Services Managed by GSA’s Federal Technology Service (FTS)
FY 2003 Actual FY 2004 Actual
($Millions) ($Millions) Revenue $8,731 $8,459 Cost of Goods Sold 8,385 96% 8,085 95.6% (Payments to Vendors) Gross Margin $ 346 4% $ 374 4.4% For every dollar FTS collects from their customers, 96 cents goes to vendors for services provided. The remaining 4 cents covers FTS administrative/overhead expenses. The following information reflects how the remaining 4 cents is spent within FTS. \1
Salaries $ 131 37.9% = 1.51 cents
Commercial Services \2 65 18.8% = 0.75 cents
FTS Administrative Expenses \3 56 16.2% = 0.65 cents
GSA Administrative Expenses \4 47 13.6% = 0.54 cents
Rent, Utilities, Other 26 7.5% = 0.31 cents
Non-Rate Recoverable Expenses 21 6.0% = 0.24 cents Total FTS Administrative/ Overhead Expenses $ 346 100.0% = 4 cents \1 FTS Administrative/Overhead Expense breakdown presented for FY 2003 only. \2 Contractor provided support services to FTS. \3 Includes FTS Administrative costs (i.e., cost of the Commissioner, Deputy
Commissioner, FTS CFO, FTS CIO and FTS Office of Acquisition). \4 Includes GSA Centralized Administrative Support Services (i.e., CFO, CPO, CIO and
legal services), GSA Centralized Charges (i.e., agency-wide common distributable costs) and GSA Information Infrastructure (i.e., GSA network support costs).
A-2 For Official Use Only

For Official Use Only
AUDIT OF FTS WORKING CAPITAL/RESERVE FUND LEVELS REPORT NUMBER A040132/T/A/Z05012
APPENDIX B – GLOSSARY
Accounts Payable (average): This was established by summing the Funded and Unfunded Accounts Payable and the DEL PAY (GEN ENTRS) line item balances for all months that data were included on the comparative balance sheets that were provided to us by the FTS office of the CFO. This sum was then divided by the number of months. For FY04 this amount was calculated to be $1,254,723,827. Accounts Payable (AP) Turnover Ratio: Bardahl calculates the AP turnover ratio by dividing the average AP balance by Purchases plus total annual expenses net of depreciation and other noncash expenses. We used Cost of Goods Sold (COGS) as a surrogate for Purchases and did not incorporate any noncash expenses beyond depreciation.
AP Turnover Ratio = (Average AP + DEL PAY) / [COGS + annual expenses – (depreciation + noncash expenses)]
For FY04:
Average Annual AP Turnover Ratio = $1,254,723,827 / [$8,085,074,800 + $349,125,400 – ($15,158,064)]
Average Annual AP Turnover Ratio = 0.1490
Times 365 days = 54.4 days
Peak Operating Cycle Month AP Turnover Ratio = 0.1519 Times 365 days = 55.4 days
Accounts Receivable (average): The total Accounts Receivable line item balance was used for those months that data were available from the balance sheets provided to us by the FTS office of the CFO. This sum was then divided by the number of months. For FY04 this amount was calculated to be $1,305,137,658. Accounts Receivable (AR) Turnover Ratio: Bardahl calculates the AR turnover ratio by dividing average AR by annual sales on account. We assumed that all FTS sales were on account and used annual revenue as a surrogate for sales on account.
AR Turnover Ratio = Average accounts receivable / Annual Revenue
B-1 For Official Use Only
For Official Use Only
AUDIT OF FTS WORKING CAPITAL/RESERVE FUND LEVELS REPORT NUMBER A040132/T/A/Z05012
APPENDIX B – GLOSSARY
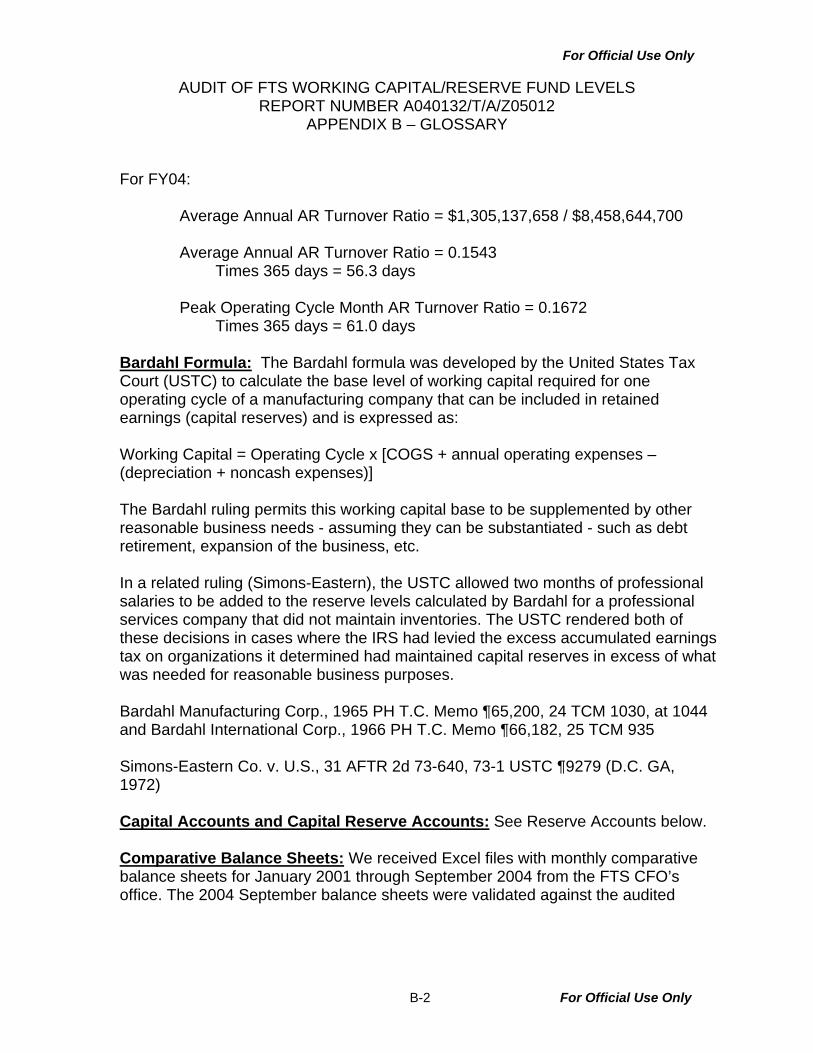
For FY04:
Average Annual AR Turnover Ratio = $1,305,137,658 / $8,458,644,700
Average Annual AR Turnover Ratio = 0.1543 Times 365 days = 56.3 days
Peak Operating Cycle Month AR Turnover Ratio = 0.1672 Times 365 days = 61.0 days
Bardahl Formula: The Bardahl formula was developed by the United States Tax Court (USTC) to calculate the base level of working capital required for one operating cycle of a manufacturing company that can be included in retained earnings (capital reserves) and is expressed as: Working Capital = Operating Cycle x [COGS + annual operating expenses – (depreciation + noncash expenses)] The Bardahl ruling permits this working capital base to be supplemented by other reasonable business needs - assuming they can be substantiated - such as debt retirement, expansion of the business, etc. In a related ruling (Simons-Eastern), the USTC allowed two months of professional salaries to be added to the reserve levels calculated by Bardahl for a professional services company that did not maintain inventories. The USTC rendered both of these decisions in cases where the IRS had levied the excess accumulated earnings tax on organizations it determined had maintained capital reserves in excess of what was needed for reasonable business purposes. Bardahl Manufacturing Corp., 1965 PH T.C. Memo ¶65,200, 24 TCM 1030, at 1044 and Bardahl International Corp., 1966 PH T.C. Memo ¶66,182, 25 TCM 935 Simons-Eastern Co. v. U.S., 31 AFTR 2d 73-640, 73-1 USTC ¶9279 (D.C. GA, 1972) Capital Accounts and Capital Reserve Accounts: See Reserve Accounts below. Comparative Balance Sheets: We received Excel files with monthly comparative balance sheets for January 2001 through September 2004 from the FTS CFO’s office. The 2004 September balance sheets were validated against the audited
B-2 For Official Use Only

For Official Use Only
AUDIT OF FTS WORKING CAPITAL/RESERVE FUND LEVELS REPORT NUMBER A040132/T/A/Z05012
APPENDIX B – GLOSSARY
Consolidating Balance Sheets contained in the FY 2004 Annual Performance and Accountability Report. Contribution Income Statements (CIS): The audit team received Excel files with annual CIS for FY 1999 through FY 2004 from the FTS CFO’s office. The 2004 Revenues, Expenses and Net Operating Results (NOR) were validated against the audited Consolidating Statements of Changes in Net Position and Consolidating Statements of Net Costs from the 2004 Annual Performance and Accountability Report (PAR). Depreciation Expense: Depreciation is not broken out separately as an expense on the CIS; therefore, the audit team calculated the difference between end-of-year and beginning-of-year Accumulated Depreciation shown on the comparative balance sheets and used this amount as depreciation expense. For FY04 this amount was $15,158,064. Inventory turnover ratio: Bardahl calculates the inventory turnover ratio by dividing average inventory balance by the annual COGS. Since FTS does not maintain inventory the audit team did not calculate this ratio. IT Fund: The reserves that make up the IT Fund are capital reserve accounts included in the equity section of the balance sheet. There is also an Appropriated Capital account in the equity section with a FY04 end of year balance of approximately $66 million. Net Operating Results (NOR): This figure reflects revenue less COGS, Program Expenses, reserve expenses, and FTS and GSA overhead and is comparable to Net Income. For FY04 NOR was $30,989,700. Operating Cycle: (cash to inventory to accounts receivable to cash) Under Bardahl, the operating cycle is determined by adding the inventory turnover ratio to the accounts receivable turnover ratio and then subtracting the accounts payable turnover ratio. This ratio multiplied by 365 will give the operating cycle in days. Average Operating Cycle for FY04:
Average AR Turnover Ratio = 0.154 (56.3 days)
Less Average AP Turnover Ratio = 0.149 (54.4 days) Operating Cycle = 0.005 ( 1.9 days)
B-3 For Official Use Only

For Official Use Only
AUDIT OF FTS WORKING CAPITAL/RESERVE FUND LEVELS REPORT NUMBER A040132/T/A/Z05012
APPENDIX B – GLOSSARY
Peak Average Operating Cycle for FY04:
Peak Operating Cycle Month AR Turnover Ratio = 0.167 (61.0 days) Less Peak Operating Cycle Month AP Turnover Ratio = 0.151 (55.4 days)
Peak Operating Cycle = 0.015 ( 5.6 days) Note: slight differences due to rounding.
Operating Expenses: Annual operating expenses were calculated by summing all revenue and expense center expenses detailed on the “rev_cst ctrs” sheet of the CIS. Reserve Accounts: In the Cost and Capital Requirements Plan submitted to OMB for approval, FTS identifies 5 reserve accounts as comprising the overall IT Fund. These are the Long Distance Reserve, the Regional Telecom Reserve, the Regional IT Solutions Reserve, the National IT Solutions Reserve, and the Working Capital Reserve. On the monthly balance sheets, the IT Fund reserve accounts are found in the Investment of U.S. Government (equity) section under the heading Reserve Balances as capital accounts and are further broken down and entitled: Innovative Tech Reserve, E-Mail Reserve, Elect Commerce Reserve, FISSP Reserve, INFO Security Reserve, FEDSIM/FEDCAC Reserve, Local (258), Contingencies-Local, Working Capital Reserve, Network Service Reserve, and Contingencies-FT 2000. Both the $66 million listed as Appropriated Capital, and the $37 million listed as Retained Earnings Other, in the Investment of U.S. Government section are not included in the IT Fund totals by FTS in the Cost and Capital Requirements Plan. Retained Earnings: Derived from positive NOR and accounted for in the FTS Capital Reserve accounts. Working capital: Working Capital is generally defined as the excess of current assets over current liabilities. Bardahl calculates the working capital necessary for an operating cycle by multiplying the operating cycle ratio by the sum of annual Cost of Goods Sold plus Annual Operating Expenses net of depreciation and other noncash expenses.
Working Capital = Operating Cycle x [COGS + annual operating expenses – (depreciation + noncash expenses)]
B-4 For Official Use Only

For Official Use Only
AUDIT OF FTS WORKING CAPITAL/RESERVE FUND LEVELS REPORT NUMBER A040132/T/A/Z05012
APPENDIX C – IT FUND ILLUSTRATIVE CHART
IT Fund Capital Reserve Requirement Dollars in 000's
$0
$50,000
$100,000
$150,000
$200,000
$250,000
40% 50% 60% 70% 80%
% of Future Capital / Transition Expenditures in IT Fund
Capital/TransitionExpenditures
Two Month's Salaries perSimons-Eastern
Peak Working Capital perBardahl
Current overall IT Fund Capital Reserve Level:
$214 million
The estimate of varying Capital/Transition Expenditures included in the IT Fund is based on the next five fiscal years projected Change in Reserves per FY05/06 C & C Plan modified by our inclusion of estimated annual contributions (profits before reserve uses) of $28 million for FYs 2007 through 2009. Although it is current FTS practice to only include estimated contributions for the next two FYs in their C & C plan, it is our belief that an estimate of future contributions must be included for all applicable years for this methodology to be viable. We used $28 million, as it was the lowest annual contribution level going back to FY1993. The chart illustrates that inclusion of 40% of the PV of the next five years’ Capital/Transition Expenditures in the IT Fund would permit the return of $39 million to the Treasury, whereas inclusion of 80% of these expenditures would permit the return of $17 million to the Treasury.
C-1 For Official Use Only

For Official Use Only
AUDIT OF FTS WORKING CAPITAL/RESERVE FUND LEVELS REPORT NUMBER A040132/T/A/Z05012
APPENDIX C – IT FUND ILLUSTRATIVE CHART
IT Fund Capital Reserve Requirement Dollars in 000's
$0
$50,000
$100,000
$150,000
$200,000
$250,000
$300,000
40% 50% 60% 70% 80%
% of Future Capital / Transition Expenditures in IT Fund
Capital/TransitionExpenditures
Two Month's Salaries perSimons-Eastern
Peak Working Capital perBardahl
Current overall IT Fund Capital Reserve Level:
$214 million
This graph was inserted for illustrative purposes at the request of FTS. The estimate of Capital/Transition Expenditures is based on the next five fiscal years projected Change in Reserves per FY05/06 C & C Plan and assumes no IT Fund contributions (profits before reserve uses) for FY07 forward, even though FY04 actual contributions were $53.7 million, and FY05 and FY06 contributions are projected to average $32.4 million. It is our belief that an estimate of future contributions based on some measure of contribution history (rolling average, minimum contribution within moving window, etc.) must be included for this methodology to be viable.
C-2 For Official Use Only

For Official Use Only
AUDIT OF FTS WORKING CAPITAL/RESERVE FUND LEVELS REPORT NUMBER A040132/T/A/Z05012
APPENDIX D – RECEIVABLES & CASH TRENDS
($200,000,000)
$0
$200,000,000
$400,000,000
$600,000,000
$800,000,000
$1,000,000,000
$1,200,000,000
$1,400,000,000
$1,600,000,000
Jan-0
1
Cash
Billed Receivables
Unbilled Receivables
Poly. (UnbilledReceivables)
Poly. (Cash)
Poly. (BilledReceivables)
D-1 For Official Use Only

For Official Use Only
AUDIT OF FTS WORKING CAPITAL/RESERVE FUND LEVELS REPORT NUMBER A040132/T/A/Z05012
APPENDIX E – FTS ACTING COMMISSIONER’S RESPONSE
E-1 For Official Use Only

For Official Use Only
AUDIT OF FTS WORKING CAPITAL/RESERVE FUND LEVELS REPORT NUMBER A040132/T/A/Z05012 APPENDIX F – REPORT DISTRIBUTION
REPORT DISTRIBUTION
Copies Acting Commissioner, Federal Technology Service (T) ......................................... 3 Office of the Chief Financial Officer (B).................................................................. 2 Audit Follow-up and Evaluation Branch (BECA) .................................................... 1 Assistant Inspector General for Auditing (JA, JAO) .............................................. 2 Assistant Inspector General for Investigations (JI) ................................................ 1
F-1 For Official Use Only