Embed Size (px)
Citation preview

Tangerine® Balanced Growth Portfolio
Audited Annual Financial StatementsFor the year ended December 31, 2019

2
Tangerine Balanced Growth PortfolioAudited Annual Financial Statements for the year ended December 31, 2019(In Canadian dollars, unless otherwise indicated)
Independent Auditor’s Report
To the Unitholders of Tangerine Balanced Growth Portfolio (the “Fund”)
Opinion We have audited the financial statements of the Fund, which comprise the statements of financial position as at December 31, 2019 and 2018, and the statements of comprehensive income, statements of changes in net assets attributable to holders of redeemable units and statements of cash flows for the years then ended, and notes to the financial statements, including a summary of significant accounting policies.
In our opinion, the accompanying financial statements present fairly, in all material respects, the financial position of the Fund as at December 31, 2019 and 2018, and its financial performance and its cash flows for the years then ended in accordance with International Financial Reporting Standards (IFRSs).
Basis for OpinionWe conducted our audit in accordance with Canadian generally accepted auditing standards. Our responsibilities under those standards are further described in the Auditor’s Responsibilities for the Audit of the Financial Statements section of our report. We are independent of the Fund in accordance with the ethical requirements that are relevant to our audit of the financial statements in Canada, and we have fulfilled our other ethical responsibilities in accordance with these requirements. We believe that the audit evidence we have obtained is sufficient and appropriate to provide a basis for our opinion.
Other Information Management is responsible for the other information. The other information comprises the Management Report of Fund Performance. Our opinion on the financial statements does not cover the other information and we do not express any form of assurance conclusion thereon.
In connection with our audit of the financial statements, our responsibility is to read the other information, and in doing so, consider whether the other information is materially inconsistent with the financial statements or our knowledge obtained in the audit or otherwise appears to be materially misstated.
We obtained the Management Report of Fund Performance prior to the date of this auditor’s report. If, based on the work we have performed, we conclude that there is a material misstatement of this other information, we are required to report that fact in this auditor’s report. We have nothing to report in this regard.
Responsibilities of Management and Those Charged with Governance for the Financial Statements Management is responsible for the preparation and fair presentation of the financial statements in accordance with IFRSs, and for such internal control as management determines is necessary to enable the preparation of financial statements that are free from material misstatement, whether due to fraud or error.
In preparing the financial statements, management is responsible for assessing the Fund’s ability to continue as a going concern, disclosing, as applicable, matters related to going concern and using the going concern basis of accounting unless management either intends to liquidate the Fund or to cease operations, or has no realistic alternative but to do so.
Those charged with governance are responsible for overseeing the Fund’s financial reporting process.
Auditor’s Responsibilities for the Audit of the Financial Statements Our objectives are to obtain reasonable assurance about whether the financial statements as a whole are free from material misstatement, whether due to fraud or error, and to issue an auditor’s report that includes our opinion. Reasonable assurance is a high level of assurance, but is not a guarantee that an audit conducted in accordance with Canadian generally accepted auditing standards will always detect a material misstatement when it exists. Misstatements can arise from fraud or error and are considered material if, individually or in the aggregate, they could reasonably be expected to influence the economic decisions of users taken on the basis of these financial statements.
3
Tangerine Balanced Growth PortfolioAudited Annual Financial Statements for the year ended December 31, 2019(In Canadian dollars, unless otherwise indicated)
As part of an audit in accordance with Canadian generally accepted auditing standards, we exercise professional judgment and maintain professional skepticism throughout the audit. We also:
• Identify and assess the risks of material misstatement of the financial statements, whether due to fraud or error, design and perform audit procedures responsive to those risks, and obtain audit evidence that is sufficient and appropriate to provide a basis for our opinion. The risk of not detecting a material misstatement resulting from fraud is higher than for one resulting from error, as fraud may involve collusion, forgery, intentional omissions, misrepresentations, or the override of internal control.
• Obtain an understanding of internal control relevant to the audit in order to design audit procedures that are appropriate in the circumstances, but not for the purpose of expressing an opinion on the effectiveness of the Fund’s internal control.
• Evaluate the appropriateness of accounting policies used and the reasonableness of accounting estimates and related disclosures made by management.
• Conclude on the appropriateness of management’s use of the going concern basis of accounting and, based on the audit evidence obtained, whether a material uncertainty exists related to events or conditions that may cast significant doubt on the Fund’s ability to continue as a going concern. If we conclude that a material uncertainty exists, we are required to draw attention in our auditor’s report to the related disclosures in the financial statements or, if such disclosures are inadequate, to modify our opinion. Our conclusions are based on the audit evidence obtained up to the date of our auditor’s report. However, future events or conditions may cause the Fund to cease to continue as a going concern.
• Evaluate the overall presentation, structure, and content of the financial statements, including the disclosures, and whether the financial statements represent the underlying transactions and events in a manner that achieves fair presentation.
We communicate with those charged with governance regarding, among other matters, the planned scope and timing of the audit and significant audit findings, including any significant deficiencies in internal control that we identify during our audit.
Chartered Professional Accountants Licensed Public Accountants
Toronto, CanadaApril 14, 2020

4
Tangerine Balanced Growth PortfolioAudited Annual Financial Statements for the year ended December 31, 2019(In Canadian dollars, unless otherwise indicated)
Statements of Financial PositionAs at
December 31, 2019
December 31, 2018
Assets
Current Assets
Investments (Notes 3c and 5) $ 1,086,084,364 $ 920,521,269
Cash (Note 3m) 2,412,186 980,771
Subscriptions receivable 3,988,539 2,624,214
Receivable for securities sold 1,794 208,753
Accrued investment income 3,200,621 2,985,318
Total assets 1,095,687,504 927,320,325
Liabilities
Current Liabilities
Payable for securities purchased 867,320 304,971
Redemptions payable 2,576,426 1,513,883
Accrued expenses 1,935,876 841,678
Total current liabilities 5,379,622 2,660,532
Net assets attributable to holders of redeemable units $ 1,090,307,882 $ 924,659,793
Number of redeemable units outstanding (Note 7) 67,193,868 65,090,689
Net assets attributable to holders of redeemable units per unit (Note 3e) $ 16.23 $ 14.21
Statements of Comprehensive IncomeFor the years ended
December 31, 2019
December 31, 2018
Income
Dividends (Note 3j) $ 23,410,541 $ 20,857,565
Interest for distribution purposes (Note 3j) 7,034,507 6,733,539
Net realized gain on investments 1,958,415 18,297,209
Net realized loss on foreign exchange (46,278) (3,990)
Change in unrealized appreciation (depreciation) on investments 130,811,620 (62,500,423)
Change in unrealized appreciation (depreciation) on foreign exchange (68,581) 57,465
Total income 163,100,224 (16,558,635)
Expenses
Management fees (Note 10a) 8,244,813 7,515,655
Administrative fees (Note 10a) 1,545,902 1,409,185
Other expenses including indirect taxes (Note 10a) 1,236,722 1,127,456
Independent Review Committee fees (Note 10a) 12,461 13,230
Foreign withholding taxes (Note 6) 1,698,443 1,473,250
Transaction costs (Note 3g) 39,495 75,969
Total expenses 12,777,836 11,614,745
Less: Rebated and absorbed expenses (Note 10a) (12,461) (13,230)
Net expenses 12,765,375 11,601,515
Increase (decrease) in net assets attributable to holders of redeemable units from operations $ 150,334,849 $ (28,160,150)
Increase (decrease) in net assets attributable to holders of redeemable units from operations per unit (Note 3l) $ 2.28 $ (0.45)
Approved by the board of directors of Tangerine Investment Management Inc.
Ramy Dimitry, Director Timothy Morris, Director

5
Tangerine Balanced Growth PortfolioAudited Annual Financial Statements for the year ended December 31, 2019(In Canadian dollars, unless otherwise indicated)
Statements of Cash FlowsFor the years ended
December 31, 2019
December 31, 2018
Cash flows from operating activities
Increase (decrease) in net assets attributable to holders of redeemable units from operations $ 150,334,849 $ (28,160,150)
Adjustments for:
Net realized gain on investments (1,958,415) (18,297,209)
Unrealized foreign exchange (gain) loss on cash 6,058 (17,600)
Change in unrealized (appreciation) depreciation on investments (130,811,620) 62,500,423
Proceeds from sale and maturity of investments 161,990,564 194,526,297
Purchase of investments (194,014,316) (287,677,069)
Net change in non-cash assets and liabilities 878,895 (555,473)
Net cash used in operating activities (13,573,985) (77,680,781)
Cash flows from financing activities
Proceeds from issuances redeemable units 162,765,091 202,795,996
Distributions to holders of redeemable units, net of reinvestments (20,636) (8,847)
Amounts paid on redemptions of redeemable units (147,732,997) (126,322,358)
Net cash from financing activities 15,011,458 76,464,791
Unrealized foreign exchange gain (loss) on cash (6,058) 17,600
Net increase (decrease) in cash during the year 1,431,415 (1,198,390)
Cash, beginning of the year 980,771 2,179,161
Cash, end of the year $ 2,412,186 $ 980,771
Supplemental cash flow information relating to operating activities
Interest received $ 7,020,644 $ 6,523,731
Dividends received, net of withholding taxes $ 21,511,108 $ 18,993,776
Statements of Changes in Net Assets Attributable to Holders of Redeemable UnitsFor the years ended
December 31, 2019
December 31, 2018
Net assets attributable to holders of redeemable units, beginning of the year $ 924,659,793 $ 876,161,203
Increase (decrease) in net assets attributable to holders of redeemable units from operations 150,334,849 (28,160,150)
Distributions to holders of redeemable units from
Net investment income (17,593,806) (16,259,475)
Capital gains — (2,336,618)
Total distributions to holders of redeemable units (17,593,806) (18,596,093)
Redeemable unit transactions
Proceeds from redeemable units issued 164,129,416 202,858,638
Reinvestments of distributions to holders of redeemable units 17,573,170 18,587,246
Redemptions of redeemable units (148,795,540) (126,191,051)
Net increase from redeemable unit transactions 32,907,046 95,254,833
Net increase in net assets attributable to holders of redeemable units for the year 165,648,089 48,498,590
Net assets attributable to holders of redeemable units, end of the year $ 1,090,307,882 $ 924,659,793

6
Tangerine Balanced Growth PortfolioAudited Annual Financial Statements for the year ended December 31, 2019(In Canadian dollars, unless otherwise indicated)
Schedule of InvestmentsAs at December 31, 2019
Number of Shares Security
Average Cost ($)
Fair Value ($)
EQUITY (76.9% of Net Assets)
Australia (1.6% of Net Assets)9,487 AGL Energy Limited 153,564 177,541
31,201 Alumina Limited 51,293 65,415
54,051 AMP Limited 212,436 94,352
15,629 APA Group 101,661 158,138
8,184 Aristocrat Leisure Limited 103,406 251,183
2,835 ASX, Ltd. 127,264 202,631
29,787 Aurizon Holdings Limited 116,098 142,007
26,974 AusNet Services 39,336 41,800
39,444 Australia and New Zealand Banking Group Limited 1,027,418 885,577
6,008 Bendigo and Adelaide Bank Limited 65,154 53,561
40,541 BHP Group Ltd. 1,224,015 1,438,295
6,593 BlueScope Steel Limited 76,117 90,508
17,840 Boral, Ltd. 93,300 72,854
22,555 Brambles Limited 197,530 240,963
3,878 Caltex Australia Limited 103,177 120,013
6,919 Challenger Financial Services Group Ltd. 63,841 51,024
1,418 CIMIC Group Limited 46,666 42,836
6,715 Coca-Cola Amatil Limited 66,974 67,699
725 Cochlear, Ltd. 71,170 148,518
15,148 Coles Group Limited 181,804 204,913
24,621 Commonwealth Bank of Australia 1,595,883 1,793,219
6,351 Computershare, Ltd. 69,639 97,144
4,666 Crown Resorts, Ltd. 54,966 51,082
6,198 CSL Limited 508,615 1,557,986
14,557 Dexus Property Group 109,913 155,252
572 Flight Centre Travel Group Limited 27,718 22,973
21,049 Fortescue Metals Group Limited 71,088 205,111
22,907 Goodman Group 127,706 279,177
10,292 Harvey Norman Holdings, NPV 37,831 38,183
22,144 Incitec Pivot Limited 87,905 64,190
32,206 Insurance Australia Group Limited 158,117 224,878
7,813 Lend Lease Corp. 93,201 125,346
4,377 Macquarie Group Limited 277,086 550,002
1,709 Magellan Financial Group Limited 78,036 88,719
34,819 Medibank Private Limited 85,733 100,296
55,738 Mirvac Group 101,344 161,569
41,628 National Australia Bank Limited 1,119,911 934,611
11,091 Newcrest Mining Limited 269,961 305,828
4,612 Orica Limited 79,802 92,405
22,674 Origin Energy Limited 201,312 174,649
10,058 Qantas Airways Limited 65,854 65,187
18,873 QBE Insurance Group Limited 258,638 221,584
2,082 Ramsay Health Care Limited 102,698 137,651
813 REA Group Limited 47,373 76,777
5,111 Rio Tinto Limited 320,292 467,757
25,249 Santos Limited 179,547 188,269
73,259 Scentre Group 309,431 255,765
4,138 Seek Limited 53,413 85,059
6,057 Sonic Healthcare Limited 115,245 158,736
66,539 South32 Limited 147,347 163,327
35,353 Stockland 128,208 148,884
16,253 Suncorp Group Limited 191,720 192,008
16,896 Sydney Airport 90,569 133,378
Number of Shares Security
Average Cost ($)
Fair Value ($)
28,032 Tabcorp Holdings Limited 128,358 115,753
60,469 Telstra Corporation Limited 236,623 195,127
26,057 The GPT Group 109,585 133,013
6,696 TPG Telecom Limited 37,289 40,956
38,406 Transurban Group 366,836 521,984
9,219 Treasury Wine Estates 69,884 136,474
49,317 Vicinity Centres 134,751 111,938
1,420 Washington H. Soul Pattinson & Company Limited 36,770 27,830
16,011 Wesfarmers Limited 579,467 604,226
47,607 Westpac Banking Corporation 1,284,171 1,051,490
1,972 Wisetech Global Limited 47,517 42,009
12,912 Woodside Petroleum Limited 449,900 404,651
17,221 Woolworths Limited 454,880 567,633
4,233 Worley Limited 54,477 59,075
15,278,834 17,878,989
Austria (0.1% of Net Assets)1,019 Andritz AG 65,503 56,957
4,494 Erste Group Bank AG 187,884 219,532
2,280 OMV AG 114,892 166,204
1,640 Raiffeisen International Bank-Holding AG 69,478 53,449
898 Verbund AG Cl. A 48,546 58,481
1,266 Voestalpine AG 51,555 45,812
537,858 600,435
Belgium (0.2% of Net Assets)2,465 Ageas 117,019 189,019
10,480 Anheuser-Busch InBev SA 1,063,554 1,109,169
870 Colruyt SA 49,735 58,861
597 Galapagos NV 150,712 162,067
1,041 Groupe Bruxelles Lambert SA 99,074 142,376
3,521 KBC Groep NV 225,932 343,694
2,037 Proximus SA 74,353 75,668
939 Solvay SA 115,297 141,192
756 Telenet Group Holding NV 53,542 44,083
1,620 UCB SA 119,375 167,188
2,714 Umicore SA 80,522 171,294
2,149,115 2,604,611
Bermuda (0.4% of Net Assets)44,312 Brookfield Infrastructure Partners LP 2,468,417 2,874,076
9,500 CK Infrastructure Holdings Limited 93,788 87,668
4,200 Dairy Farm International Holdings Ltd. 47,435 31,099
355 Everest Re Group, Ltd. 116,689 127,442
15,500 Hongkong Land Holdings Limited 137,568 115,573
3,233 IHS Markit, Ltd. 209,421 315,897
3,142 Invesco Ltd. 96,100 73,258
3,000 Jardine Matheson Holdings Limited 235,823 216,298
3,000 Jardine Strategic Holding Limited 148,679 119,236
9,500 Kerry Properties Limited 52,182 39,131
1,780 Norwegian Cruise Line Holdings, Ltd. 130,442 134,823
19,277 NWS Holdings Limited 34,440 35,033
11,500 Yue Yuen Industrial (Holdings) Limited 49,147 44,019
3,820,131 4,213,553
British Virgin Islands (0.0% of Net Assets)1,180 Capri Holdings Limited 101,685 58,376

7
Tangerine Balanced Growth PortfolioAudited Annual Financial Statements for the year ended December 31, 2019(In Canadian dollars, unless otherwise indicated)
Number of Shares Security
Average Cost ($)
Fair Value ($)
Canada (25.7% of Net Assets)36,147 Agnico-Eagle Mines Limited 1,809,282 2,891,037
131,036 Alimentation Couche-Tard Inc. 3,667,435 5,399,994
96,643 Bank of Montreal 7,238,869 9,726,152
269,041 Barrick Gold Corporation 5,972,908 6,489,269
46,979 Bausch Health Companies Inc. 3,812,254 1,826,074
136,497 BCE Inc. 6,621,407 8,211,660
73,439 BlackBerry Limited 1,691,749 613,216
318,858 Bombardier Inc. 1,035,472 615,396
141,000 Brookfield Asset Management Inc. 5,471,859 10,579,230
59,383 Cameco Corporation 1,183,445 685,280
67,115 Canadian Imperial Bank of Commerce 6,194,810 7,252,447
108,469 Canadian National Railway Company 7,340,839 12,741,853
178,961 Canadian Natural Resources, Ltd. 6,500,844 7,516,362
20,798 Canadian Pacific Railway Company 3,391,827 6,884,762
8,727 Canadian Tire Corporation, Limited 895,762 1,219,598
33,849 Canopy Growth Corporation 1,897,014 924,416
21,658 CCL Industries Inc. Cl. B 1,392,498 1,198,121
153,008 Cenovus Energy Inc. 3,136,838 2,019,706
36,286 CGI Inc. 1,918,668 3,943,200
2,981 Constellation Software Inc. 1,902,612 3,759,518
44,049 Dollarama Inc. 1,449,628 1,965,907
35,956 Emera Incorporated 1,665,154 2,005,985
305,567 Enbridge Inc. 14,265,392 15,776,424
197,418 EnCana Corporation 2,728,913 1,200,301
103,484 First Quantum Minerals, Ltd. 1,550,492 1,362,884
69,533 Fortis Inc. 2,806,795 3,746,438
28,595 Franco-Nevada Corporation 2,191,947 3,834,304
10,545 George Weston Limited 918,438 1,086,346
31,017 Gildan Activewear Inc. 877,389 1,190,743
35,764 Imperial Oil, Ltd. 1,520,825 1,228,493
63,447 Inter Pipeline, Ltd. 1,740,344 1,430,095
187,577 Kinross Gold Corp. 1,535,213 1,155,474
28,800 Kirkland Lake Gold Ltd. 1,828,314 1,648,512
26,571 Loblaw Companies Limited 1,194,193 1,780,257
42,907 Magna International, Inc. 1,939,449 3,054,978
297,518 Manulife Financial Corporation 6,129,751 7,842,574
38,245 Metro Inc. 1,172,964 2,049,550
50,740 National Bank of Canada 2,235,446 3,657,339
86,489 Nutrien Ltd. 5,721,486 5,377,021
40,725 Open Text Corporation 1,827,894 2,330,284
78,324 Pembina Pipeline Corporation 3,217,814 3,769,734
49,360 Power Corporation of Canada 1,399,095 1,651,092
45,196 Restaurant Brands International Inc. 2,820,684 3,741,325
53,867 Rogers Communications Inc. 2,556,570 3,473,344
215,968 Royal Bank of Canada 15,948,806 22,190,712
35,776 Saputo Inc. 1,103,521 1,438,195
68,726 Shaw Communications Inc. 1,694,715 1,810,930
15,672 Shopify Inc. Cl. A 4,516,664 8,091,454
26,339 SNC-Lavalin Group Inc. 1,267,773 788,853
88,577 Sun Life Financial Inc. 3,483,143 5,244,644
233,230 Suncor Energy Inc. 9,087,462 9,926,269
141,198 TC Energy Corporation 7,164,894 9,765,254
73,968 Teck Resources, Ltd. 1,866,381 1,665,759
90,675 TELUS Corporation 3,224,820 4,559,139
183,816 The Bank of Nova Scotia 11,458,202 13,482,904
Number of Shares Security
Average Cost ($)
Fair Value ($)
275,038 The Toronto-Dominion Bank 14,387,743 20,031,018
25,587 Thomson Reuters Corporation 1,209,491 2,376,776
39,832 Waste Connections, Inc. 3,567,989 4,698,184
67,299 Wheaton Precious Metals Corp. 1,894,659 2,600,433
220,246,845 279,527,219
Cayman Islands (0.2% of Net Assets)4,400 ASM Pacific Technologies, Ltd. 66,771 79,158
400 BeiGene, Ltd. ADR 80,441 85,980
16,400 Budweiser Brewing Company APAC Limited 88,380 71,782
35,167 CK Asset Holdings Limited 371,300 329,213
38,167 CK Hutchison Holdings Limited 748,058 471,949
3,285 Melco Crown Entertainment, Ltd. ADR 79,271 102,960
32,000 Sands China, Ltd. 143,131 221,811
115,254 WH Group Limited 109,909 154,408
17,000 Wharf Real Estate Investment Company Limited 149,113 134,530
19,200 Wynn Macau, Limited 52,326 61,351
1,888,700 1,713,142
Denmark (0.4% of Net Assets)49 A.P. Moller - Maersk A/S Cl. A 98,125 86,191
95 A.P. Moller - Maersk A/S Cl. B 175,861 177,801
1,410 Carlsberg A/S 155,425 272,958
1,279 Chr. Hansen Holding A/S 106,398 131,896
1,566 Coloplast A/S 127,717 252,093
9,252 Danske Bank A/S 305,166 194,282
1,415 Demant A/S 29,028 57,828
2,494 DONG Energy A/S 152,463 334,729
3,008 DSV Panalpina A/S 195,363 449,887
810 Genmab A/S 153,984 233,757
1,137 H. Lundbeck A/S 77,841 56,345
2,188 ISS AS 93,656 68,130
24,397 Novo Nordisk A/S 1,087,733 1,837,520
2,846 Novozymes A/S 119,654 180,730
1,300 Pandora A/S 122,164 73,387
1,547 Tryg A/S 40,860 59,516
2,562 Vestas Wind Systems A/S 182,775 335,970
3,224,213 4,803,020
Finland (0.3% of Net Assets)1,958 Elisa OYJ 76,271 140,366
6,523 Fortum OYJ 155,831 208,888
4,667 Kone OYJ 217,100 395,913
1,185 Metso OYJ 57,531 60,682
5,691 Neste OYJ 94,748 256,964
78,034 Nokia OYJ 693,987 374,667
1,247 Nokian Renkaat OYJ 56,143 46,522
44,038 Nordea Bank ABP 549,558 461,472
1,142 Orion OYJ 43,334 68,603
6,152 Sampo OYJ 300,692 348,434
8,164 Stora Enso OYJ 133,632 154,070
7,313 UPM-Kymmene OYJ 177,868 329,031
6,765 Wartsila OYJ ABP 114,333 96,994 2,671,028 2,942,606
Schedule of InvestmentsAs at December 31, 2019

8
Tangerine Balanced Growth PortfolioAudited Annual Financial Statements for the year ended December 31, 2019(In Canadian dollars, unless otherwise indicated)
Number of Shares Security
Average Cost ($)
Fair Value ($)
France (2.6% of Net Assets)2,617 Accor SA 130,187 159,039
460 Aeroports de Paris SA 66,658 117,912
6,584 Air Liquide SA 740,853 1,209,460
2,864 Alstom SA 155,053 176,050
850 Amundi SA 96,855 86,485
991 Arkema SA 108,870 136,605
1,368 Atos SE 131,100 147,991
26,603 AXA SA 746,183 972,344
606 bioMerieux 68,361 69,994
15,701 BNP Paribas SA 1,150,011 1,207,398
68 Bollore — 376
11,736 Bollore SA 70,410 66,453
3,048 Bouygues SA 142,707 168,061
3,997 Bureau Veritas SA 104,810 135,328
2,202 CAP Gemini SA 218,800 349,050
8,336 Carrefour SA 256,675 181,402
725 Casino Guichard-Perrachon SA 64,188 44,006
2,293 CNP Assurances 50,901 59,177
6,817 Compagnie de Saint-Gobain 345,913 362,183
2,440 Compagnie Generale des Etablissements Michelin 262,098 387,487
683 Covivio 76,707 100,611
16,250 Credit Agricole SA 260,357 305,722
8,643 DANONE SA 645,877 929,718
35 Dassault Aviation 56,310 59,607
1,878 Dassault Systemes SA 168,369 400,612
3,387 Edenred 110,924 227,279
1,095 Eiffage SA 115,738 162,576
8,312 Electricite de France SA 178,623 120,118
25,843 Engie SA 631,852 541,686
3,899 Essilor International SA 509,832 770,718
644 Eurazeo SE 41,739 57,182
2,803 Eutelsat Communications 75,965 59,120
1,042 Faurecia 104,662 72,849
626 Gecina 100,876 145,429
6,539 Getlink SE 83,004 147,627
451 Hermes International 251,282 437,344
503 ICADE NPV 46,885 71,057
381 Iliad SA 79,536 64,082
928 Ingenico SA 123,838 130,757
533 Ipsen SA 90,388 61,291
1,523 JC Decaux SA 64,725 60,920
1,044 Kering SA 283,685 889,298
2,712 Klepierre SA 150,221 133,626
3,643 Legrand SA 212,301 385,192
3,523 L'Oréal SA 725,140 1,353,814
3,842 LVMH Moet Hennessy Louis Vuitton SA 880,302 2,316,380
14,501 Natixis 89,493 83,544
28,137 Orange SA 583,558 537,346
2,928 Pernod Ricard SA 399,920 679,363
8,069 Peugeot SA 179,242 250,174
3,039 Publicis Groupe SA 196,648 178,535
306 Remy Cointreau SA 26,983 48,773
2,669 Renault SA 232,472 163,869
4,578 Safran SA 436,271 917,264
Number of Shares Security
Average Cost ($)
Fair Value ($)
15,659 Sanofi 1,522,900 2,042,732
365 Sartorius Stedim Biotech 49,538 78,472
7,733 Schneider Electric SE 626,649 1,029,939
2,268 SCOR SE 101,831 123,535
330 SEB SA 63,974 63,598
11,507 Societe Generale 578,113 519,489
1,250 Sodexo SA 126,025 192,230
5,396 Suez 109,420 105,917
836 Teleperformance 166,727 264,550
1,516 Thales SA 148,575 204,163
33,312 Total SA 1,819,721 2,385,658
1,177 UbiSoft Entertainment SA 129,686 105,501
3,411 Valeo 171,936 155,952
7,363 Veolia Environnement 168,258 254,114
7,139 Vinci 587,097 1,028,762
11,759 Vivendi SA 337,236 441,946
378 Wendel 51,142 65,201
1,543 Worldline SA 126,690 141,834
20,009,876 28,103,877
Germany (2.1% of Net Assets)2,482 Adidas AG 351,694 1,046,990
5,911 Allianz SE 1,149,050 1,879,126
12,792 BASF SE 1,206,438 1,254,060
12,955 Bayer AG 1,591,024 1,373,001
5,252 Bayerische Motoren Werke (BMW) AG 518,777 538,208
1,406 Beiersdorf AG 121,487 218,267
2,156 Brenntag AG 116,613 152,144
554 Carl Zeiss Meditec AG 72,873 91,688
13,421 Commerzbank AG 235,066 107,778
1,505 Continental AG 280,346 252,498
2,186 Covestro AG 214,514 131,892
12,704 Daimler AG 1,025,630 912,948
1,493 Delivery Hero SE 85,034 153,342
26,834 Deutsche Bank AG 818,414 270,175
2,605 Deutsche Boerse AG 270,516 531,426
3,170 Deutsche Lufthansa AG 65,291 75,720
13,946 Deutsche Post AG 471,489 690,397
45,890 Deutsche Telekom AG 886,821 973,240
4,850 Deutsche Wohnen AG 152,828 257,113
32,015 E.ON AG 606,853 443,829
2,436 Evonik Industries AG 106,395 96,482
555 Fraport AG 45,727 61,219
2,960 Fresenius Medical Care AG & Co., KGaA 264,480 284,194
5,610 Fresenius SE 398,126 409,766
939 FUCHS PETROLUB SE 49,086 60,358
2,352 GEA Group AG 78,191 100,927
878 Hannover Rueckversicherungs AG 99,132 220,202
2,093 HeidelbergCement AG 188,878 197,905
3,912 Henkel AG & Co., KGaA 416,765 507,243
259 Hochtief AG 45,995 42,865
17,757 Infineon Technologies AG 303,930 524,955
1,019 KION Group AG 108,553 91,309
666 Knorr- Bremse Aktiengesellschaft 96,714 87,976
1,243 Lanxess 98,586 108,233
1,783 Merck KGaA 183,540 273,419
3,007 METRO AG 80,534 62,810
Schedule of InvestmentsAs at December 31, 2019

9
Tangerine Balanced Growth PortfolioAudited Annual Financial Statements for the year ended December 31, 2019(In Canadian dollars, unless otherwise indicated)
Number of Shares Security
Average Cost ($)
Fair Value ($)
755 MTU Aero Engines Holding AG 184,464 279,800
2,027 Muenchener Rueckversicherungs-Gesellschaft AG 420,490 775,982
2,117 Porsche Automobil Holding SE 167,450 205,352
1,180 Puma AG Rudolf Dassler Sport 79,095 117,399
8,422 RWE AG 359,853 335,286
13,532 SAP AG 1,251,475 2,369,967
539 Sartorius AG Preferred Non-Voting 110,243 149,696
10,613 Siemens AG 1,391,610 1,800,344
2,253 Siemens Healthineers AG 119,809 140,427
1,705 Symrise AG 132,336 232,793
11,169 Telefonica Deutschland Holding AG 78,304 42,010
6,383 ThyssenKrupp AG 193,167 111,865
6,161 TUI AG 121,063 100,948
2,746 Uniper SE 104,614 117,954
1,556 United Internet AG 60,202 66,317
3,036 Volkswagen AG 633,981 777,039
7,314 Vonovia SE 314,414 511,021
1,590 Wirecard AG 237,209 248,799
1,941 Zalando SE 109,636 127,648
18,874,805 22,994,352
Hong Kong (0.6% of Net Assets)166,400 AIA Group Limited 1,074,801 2,265,297
15,778 Bank of East Asia, Ltd. 52,087 45,690
50,500 BOC Hong Kong Holdings, Ltd. 197,435 227,341
22,500 CLP Holdings Limited 250,143 306,680
32,000 Galaxy Entertainment Group Limited 190,897 305,689
29,000 Hang Lung Properties, Ltd. 92,700 82,530
10,400 Hang Seng Bank Limited 220,307 278,662
19,250 Henderson Land Development Company, Ltd. 86,953 122,541
33,000 HK Electric Investments Limited 36,769 42,179
53,140 HKT Trust and HKT, Ltd. 82,105 97,105
138,881 Hong Kong & China Gas Company Ltd. 215,504 351,784
16,332 Hong Kong Exchanges & Clearing Ltd. 400,704 687,667
20,284 MTR Corporation Limited 95,835 155,454
85,257 New World Development Company Ltd. 100,309 151,537
62,535 PCCW Limited 41,902 47,978
20,000 Power Assets Holdings Limited 185,874 189,724
40,982 Sino Land Company Limited 66,268 77,207
30,000 SJM Holdings Limited 46,853 44,286
22,440 Sun Hung Kai Properties Limited 362,664 445,535
7,000 Swire Pacific Limited 87,232 84,344
15,715 Swire Properties Limited 59,053 67,607
20,500 Techtronic Industries Company Limited 105,539 216,814
28,882 The Link Real Estate Investment Trust 197,788 396,552
10,000 Vitasoy International Holdings, Ltd. 70,774 47,015
13,000 Wheelock and Company Limited 80,081 112,395
4,400,577 6,849,613
International (0.0% of Net Assets)1,401 Unibail-Rodamco-Westfield REIT 400,196 286,827
9,400 Unibail-Rodamco-Westfield REIT CDI 134,939 95,883
535,135 382,710
Number of Shares Security
Average Cost ($)
Fair Value ($)
Ireland (0.8% of Net Assets)5,241 Accenture PLC 617,002 1,431,090
13,104 AIB Group PLC 97,161 59,245
823 Allegion PLC 56,398 132,912
2,678 Allergan PLC 732,069 663,875
14,609 Bank of Ireland Group PLC 149,879 103,815
10,986 CRH PLC 341,811 570,407
1,389 DCC PLC 172,491 156,148
3,508 Eaton Corporation PLC 236,299 430,881
1,226 Flutter Entertainment PLC 221,252 193,358
1,997 Ingersoll-Rand PLC 143,094 344,211
1,701 Irish Bank Resolution Corporation, Ltd. 759 515
6,590 James Hardie Industries PLC 95,749 167,418
6,662 Johnson Controls International PLC 358,438 351,692
2,236 Kerry Group PLC 193,784 361,600
2,019 Kingspan Group PLC 115,480 160,021
4,442 Linde Public Limited Company 762,779 1,226,339
11,169 Medtronic PLC 906,843 1,643,142
1,343 Pentair PLC 109,384 79,884
1,092 Perrigo Company PLC 178,452 73,153
2,102 Seagate Technology PLC 89,236 162,183
2,758 Smurfit Kappa Group PLC 147,367 137,539
733 STERIS Public Limited Company 144,628 144,878
1,070 Willis Towers Watson PLC 186,544 280,196
6,056,899 8,874,502
Isle of Man (0.0% of Net Assets)8,989 GVC Holdings PLC 146,856 136,538
Israel (0.1% of Net Assets)679 Azrieli Group 42,762 64,367
15,886 Bank Hapoalim BM 88,163 170,873
21,886 Bank Leumi Le-Israel 139,169 206,569
1,813 Check Point Software Technologies, Ltd. 219,247 260,868
500 CyberArk Software Ltd. 91,782 75,588
308 Elbit Systems, Ltd. 42,300 62,165
11,103 Israel Chemicals Limited 98,628 67,737
16,019 Israel Discount Bank Series A 83,372 96,285
1,315 Mizrahi Tefahot Bank, Ltd. 15,607 45,420
918 Nice, Ltd. 68,890 184,594
7,997 Teva Pharmaceutical Industries, Ltd. 502,567 102,710
5,574 Teva Pharmaceutical Industries, Ltd. ADR 179,228 70,835
600 Wix.com, Ltd. 75,292 95,218
1,647,007 1,503,229
Italy (0.5% of Net Assets)15,086 Assicurazioni Generali SPA 340,742 403,939
6,454 Atlantia SPA 193,342 195,311
8,271 Davide Campari-Milano SPA 84,711 98,000
114,009 ENEL - SPA 675,654 1,173,610
35,814 Eni SPA 836,514 721,804
7,123 FinecoBank Banca Fineco SPA 101,779 110,837
200,680 Intesa Sanpaolo SPA 682,380 686,020
5,177 Leonardo SPA 83,586 78,748
7,901 Mediobanca SPA 87,199 112,868
2,190 Moncler SPA 129,973 127,734
Schedule of InvestmentsAs at December 31, 2019

10
Tangerine Balanced Growth PortfolioAudited Annual Financial Statements for the year ended December 31, 2019(In Canadian dollars, unless otherwise indicated)
Number of Shares Security
Average Cost ($)
Fair Value ($)
4,914 Pirelli & C SPA 54,638 36,766
6,324 Poste Italiane SPA 60,246 93,157
3,288 Prysmian SPA 95,746 102,851
1,510 Recordati SPA 82,475 82,577
30,304 Snam SPA 174,045 206,702
206,331 Telecom Italia SPA 266,178 165,861
20,180 Terna SPA 114,493 174,893
27,240 UniCredit SPA 805,853 516,250
4,869,554 5,087,928
Japan (6.0% of Net Assets)500 ABC-Mart, Inc. 32,008 44,388
4,100 Acom Co., Ltd. 16,741 24,315
2,700 Advantest Corporation 88,481 198,459
8,700 AEON Co., Ltd. 126,578 234,147
1,700 AEON Financial Service Co., Ltd. 44,785 35,032
1,100 AEON Mall Co., Ltd. 32,475 25,437
2,600 AGC Inc. 105,358 121,925
2,000 Air Water Inc. 42,526 38,184
2,100 Aisin Seiki Co., Ltd. 74,918 101,986
6,300 Ajinomoto Co., Inc. 119,868 136,441
2,500 Alfresa Holdings Corporation 48,918 66,463
3,000 Alps Alpine Co., Ltd. 100,642 89,206
4,100 Amada Holdings Co., Ltd. 45,986 61,153
1,500 ANA Holdings Inc. 55,861 65,187
1,400 Aozora Bank, Ltd. 49,583 48,295
5,200 Asahi Group Holdings, Ltd. 173,490 309,187
2,600 Asahi Intecc Co., Ltd. 80,669 99,277
17,300 Asahi Kasei Corporation 168,101 254,735
11,400 Ashikaga Holdings Co., Ltd. 52,899 38,088
26,700 Astellas Pharma Inc. 380,237 595,771
2,900 Bandai Namco Holdings Inc. 81,321 229,458
1,300 Benesse Holdings, Inc. 51,363 44,582
8,100 Bridgestone Corp. 285,622 393,374
3,000 Brother Industries, Ltd. 55,531 81,295
1,100 CALBEE, Inc. 44,343 46,662
14,100 Canon Inc. 573,575 502,468
2,900 Casio Computer Company 48,655 75,817
2,000 Central Japan Railway Company 344,150 525,024
8,500 Chubu Electric Power Co., Inc. 177,837 156,347
3,100 Chugai Pharmaceutical Co., Ltd. 97,618 372,863
1,600 Coca-Cola West Company, Limited 69,018 53,285
13,700 Concordia Financial Group, Ltd. 88,115 73,890
2,300 Credit Saison Co., Ltd. 51,095 52,172
1,600 CyberAgent, Inc. 102,091 72,835
3,700 Dai Nippon Printing Co., Ltd. 104,868 130,683
4,400 Daicel Corporation 54,116 55,075
1,500 Daifuku Co., Ltd. 101,734 119,204
8,000 Daiichi Sankyo Company, Limited 248,781 689,977
3,400 Daikin Industries, Ltd. 282,910 626,807
1,000 Daito Trust Construction Company, Ltd. 132,090 160,848
7,700 Daiwa House Industry Co., Ltd. 206,991 311,471
27 Daiwa House REIT Investment Corp. 87,721 91,369
22,400 Daiwa Securities Group Inc. 155,813 147,809
6,000 DENSO Corporation 288,974 355,537
3,000 Dentsu Group Inc. 129,114 135,134
400 DISCO Corporation 103,928 123,619
Number of Shares Security
Average Cost ($)
Fair Value ($)
4,300 East Japan Railway Company 411,955 505,806
3,400 Eisai Co., Ltd. 194,303 332,837
1,800 Electric Power Development Co., Ltd. 64,808 56,853
3,600 FamilyMart Co., Ltd. 78,605 112,761
2,700 FANUC Corporation 556,209 654,980
800 Fast Retailing Co., Ltd. 337,262 620,483
1,600 Fuji Electric Company, Limited 49,856 63,862
8,400 Fuji Heavy Industries, Ltd. 233,691 271,979
5,200 FUJIFILM Holdings Corporation 201,607 324,513
2,700 Fujitsu, Ltd. 166,960 330,873
2,400 Fukuoka Financial Group, Inc. NPV 56,167 60,282
600 GMO Payment Gateway, Inc. 57,622 53,552
3,600 Hakuhodo Dy Holdings Incorporated 56,945 75,947
2,000 Hamamatsu Photonics K.K. 65,504 107,272
3,200 Hankyu Hanshin Holdings, Inc. 114,288 178,699
300 Hikari Tsushin, Inc. 34,404 98,191
3,400 Hino Motors Limited 49,830 47,142
420 Hirose Electric Co., Ltd. 59,245 70,313
800 Hisamitsu Pharmaceutical Co., Inc. 43,739 51,071
1,700 Hitachi Chemical Company, Ltd. 50,733 92,804
1,200 Hitachi Construction Machinery Co., Ltd. 35,325 47,037
900 Hitachi High-Technologies Corporation 37,741 83,121
3,000 Hitachi Metals, Ltd. 50,761 57,741
13,500 Hitachi, Ltd. 469,190 745,188
22,300 Honda Motor Co., Ltd. 829,012 824,618
800 Hoshizaki Corporation 84,252 92,977
5,200 Hoya Corporation 220,541 648,405
4,400 Hulic Co., Ltd. 57,475 69,093
3,030 Idemitsu Kosan Co., Ltd. 120,694 109,550
2,100 IHI Corporation 64,966 64,499
2,000 Iida Group Holdings Co., Ltd. 43,065 45,796
13,500 INPEX Corporation 207,291 183,075
4,900 Isetan Mitsukoshi Holdings, Ltd. 66,769 57,533
7,700 Isuzu Motors Limited 84,812 119,351
19,000 Itochu Corporation 272,056 574,609
1,300 Itochu Techno-Science Corporation 43,220 47,700
2,600 J. Front Retailing Co., Ltd. NPV 35,712 47,467
1,500 Japan Airlines Co., Ltd. 47,653 60,801
900 Japan Airport Terminal Co., Ltd. 58,177 65,401
7,200 Japan Exchange Group, Inc. 97,213 165,812
5,100 Japan Post Bank Co., Ltd. 94,571 63,898
21,500 Japan Post Holdings Co., Ltd. 339,864 263,216
3,100 Japan Post Insurance Co., Ltd. 71,748 68,876
11 Japan Prime Realty Investment Corp. 47,519 62,544
18 Japan Real Estate Investment Corp. 110,744 154,643
37 Japan Retail Fund Investment Corp. 83,151 103,001
16,500 Japan Tobacco Inc. 543,610 478,920
6,600 JFE Holding, Inc. 148,431 111,121
2,800 JGC Holdings Corporation 62,816 58,636
2,400 JSR Corporation 46,871 57,619
2,700 JTEKT Corporation 39,764 41,915
44,450 JX Holdings, Inc. 286,027 264,083
6,300 Kajima Corporation 77,845 109,604
2,100 Kakaku.com, Inc 44,695 69,987
1,200 Kamigumi Co., Ltd. 30,684 34,351
2,800 Kansai Paint Co., Ltd. 48,896 89,440
6,600 Kao Corporation 359,556 710,751
Schedule of InvestmentsAs at December 31, 2019

11
Tangerine Balanced Growth PortfolioAudited Annual Financial Statements for the year ended December 31, 2019(In Canadian dollars, unless otherwise indicated)
Number of Shares Security
Average Cost ($)
Fair Value ($)
1,700 Kawasaki Heavy Industries Limited 68,070 48,846
24,200 KDDI Corporation 554,774 939,347
1,500 Keihan Holdings Co., Ltd. 53,234 94,862
3,200 Keikyu Corporation 66,997 80,567
1,400 Keio Corporation 57,678 110,422
1,800 Keisei Electric Railway Co., Ltd. 53,301 91,068
2,600 Keyence Corporation 535,572 1,194,120
2,000 Kikkoman Corporation 75,560 128,154
2,400 Kintetsu Group Holdings Co., Ltd. 113,042 169,535
11,300 Kirin Holdings Company, Limited 227,580 322,257
600 Kobayashi Pharmaceutical Co., Ltd. 69,517 66,368
1,600 Koito Manufacturing Co., Ltd. 74,022 97,368
12,500 Komatsu, Ltd. 338,217 394,066
1,300 Konami Corporation 48,328 69,572
6,500 Konica Minolta Holdings, Inc. 69,479 55,301
500 KOSE Corporation 73,228 95,459
14,400 Kubota Corporation 228,275 296,572
4,200 Kuraray Company Limited 60,417 66,704
1,500 Kurita Water Industries Limited 42,451 58,260
4,400 Kyocera Corporation 253,305 392,718
3,700 Kyowa Kirin Co., Ltd. 62,261 113,597
5,100 Kyushu Electric Power Company, Inc. 97,466 57,508
2,000 Kyushu Railway Company 91,719 87,106
600 Lawson, Inc. 50,441 44,317
800 LINE Corporation 37,838 51,071
3,000 Lion Corporation 69,301 76,069
3,300 LIXIL Group Corporation 82,683 74,383
6,400 M3, Inc. 107,955 252,393
3,200 Makita Corporation 116,701 145,479
21,200 Marubeni Corp. 139,227 205,054
3,000 Marui Co., Ltd. 45,152 95,507
900 Maruichi Steel Tube, Ltd. 32,289 33,077
7,500 Mazda Motor Corporation 131,960 83,944
1,000 McDonald's Holdings Company (Japan), Ltd. 38,294 62,526
3,000 Medipal Holdings Corporation 60,321 86,378
1,600 MEIJI Holdings Co., Ltd. 110,370 140,897
1,000 Mercari, Inc. 37,097 26,669
4,800 Minebea Company 66,128 130,416
4,300 Misumi Group Incorporated 113,726 139,664
19,000 Mitsubishi Chemical Holdings Corp. 147,847 185,340
18,700 Mitsubishi Corporation 486,811 647,092
24,800 Mitsubishi Electric Corporation 333,550 443,440
16,200 Mitsubishi Estate Company, Limited 358,964 403,909
2,300 Mitsubishi Gas & Chemical Company, Limited 45,515 45,942
4,600 Mitsubishi Heavy Industries, Ltd. 221,858 233,168
1,600 Mitsubishi Material Corporation 52,718 56,836
9,600 Mitsubishi Motors Corporation 99,915 52,464
3,900 Mitsubishi Tanabe Pharma Corporation 73,595 93,445
169,400 Mitsubishi UFJ Financial Group, Inc. 1,146,427 1,199,061
5,800 Mitsubishi UFJ Lease & Finance Company Limited 28,380 48,861
22,500 MITSUI & Co., Ltd. 369,111 522,459
2,900 Mitsui Chemicals, Inc. 68,693 92,738
12,100 Mitsui Fudosan Co., Ltd. 339,250 385,788
1,500 Mitsui O.S.K. Lines, Ltd. 78,382 54,143
Number of Shares Security
Average Cost ($)
Fair Value ($)
334,100 Mizuho Financial Group, Inc. 699,217 670,945
1,700 MonotaRO Co., Ltd. 61,115 59,293
6,500 MS&AD Insurance Group Holdings, Inc. 202,955 280,071
7,800 Murata Manufacturing Company, Ltd. 300,140 627,867
1,600 Nabtesco Corporation 48,631 62,335
2,400 Nagoya Railroad Co., Ltd. 55,986 97,082
3,600 NEC Corporation 114,558 194,163
7,400 Nexon Co., Ltd. 94,447 128,034
3,800 NGK Insulators Limited 97,453 86,333
2,000 NGK Spark Plug Co., Ltd. 51,897 50,927
1,300 NH Foods, Ltd. 64,373 69,959
3,100 Nidec Corporation 315,465 555,040
4,000 Nikon Corporation 82,958 64,148
1,600 Nintendo Co., Ltd. 544,796 839,466
19 Nippon Building Fund Inc. 113,189 180,238
1,100 Nippon Express Co. 62,988 84,266
2,000 Nippon Paint Co., Ltd. 53,364 134,597
26 Nippon Prologis REIT, Inc. 64,424 85,751
600 Nippon Shinyaku Co., Ltd. 70,072 67,800
11,100 Nippon Steel Corporation 306,011 219,071
18,200 Nippon Telegraph and Telephone Corp. 383,798 598,735
2,100 Nippon Yusen Kabushiki Kaisha 58,392 49,640
1,800 Nissan Chemical Industries, Ltd. 92,860 98,693
31,600 Nissan Motor Co., Ltd. 323,799 239,850
2,800 Nisshin Seifun Group Inc. 48,995 63,681
800 Nissin Foods Holdings Co., Ltd. 47,519 77,513
1,100 Nitori Company, Ltd. 110,707 226,089
2,300 Nitto Denko Corp. 147,936 169,607
47,100 Nomura Holdings, Inc. 304,626 316,639
2,100 Nomura Real Estate Holdings, Inc. 42,006 65,652
58 Nomura Real Estate Master Fund, Inc. 98,403 128,450
5,100 Nomura Research Institute, Ltd. 85,361 142,279
5,200 NSK, Ltd. 49,273 64,592
8,400 NTT Data Corporation 79,163 147,040
18,700 NTT DoCoMo, Inc. 461,933 677,885
9,100 Obayashi Corporation 80,483 132,147
900 Obic Co., Ltd. 60,835 158,510
4,400 Odakyu Electric Railway Co., Ltd. 108,500 133,934
12,600 Oji Holdings Corporation 76,050 89,457
16,000 Olympus Optical Co., Ltd. 155,882 322,460
2,800 Omron Corporation 121,107 214,496
5,300 ONO Pharmaceutical Co., Ltd. 133,501 158,230
600 Oracle Corporation Japan 36,228 71,236
2,800 Oriental Land Co., Ltd. 177,070 497,150
17,900 Orix Corporation 269,517 386,810
36 ORIX JREIT Inc. 105,907 101,077
5,200 Osaka Gas Co., Ltd. 114,519 129,743
1,700 Otsuka Corporation 52,839 88,747
5,300 Otsuka Holdings Co., Ltd. 197,471 308,808
6,700 Pan Pacific International Holdings Corp. 88,427 144,784
30,000 Panasonic Corporation 417,477 368,531
1,400 Park24 Co., Ltd. 33,304 44,586
1,300 PeptiDream Inc. 87,760 86,868
2,500 Persol Holdings Co., Ltd. 77,475 61,183
1,500 PIGEON CORPORATION 82,062 71,863
1,200 Pola Orbis Holdings Inc. 33,823 37,429
12,000 Rakuten, Inc. 151,758 133,881
Schedule of InvestmentsAs at December 31, 2019

12
Tangerine Balanced Growth PortfolioAudited Annual Financial Statements for the year ended December 31, 2019(In Canadian dollars, unless otherwise indicated)
Number of Shares Security
Average Cost ($)
Fair Value ($)
18,900 Recruit Holdings Co., Ltd. 448,795 924,414
11,100 Renesas Electronics Corporation 154,081 99,337
28,500 Resona Holdings, Inc. 177,494 162,895
10,200 Ricoh Co., Ltd. 134,460 145,079
500 Rinnai Corp. 47,614 51,011
1,400 Rohm Company Limited 108,738 146,673
3,000 Ryohin Keikaku Co. 81,617 91,497
500 Sankyo Company, Limited 26,768 21,627
4,600 Santen Pharmaceutical Co., Ltd. 55,712 114,498
3,100 SBI Holdings, Inc. 67,484 85,633
2,900 Secom Co., Ltd. 205,721 338,322
2,600 Sega Sammy Holding Inc. 58,191 49,111
3,200 SEIBU Holdings Inc. 73,510 68,540
4,000 Seiko Epson Corporation 74,527 78,992
4,900 Sekisui Chemical Co., Ltd. 55,206 111,324
8,700 Sekisui House, Ltd. 144,109 242,244
10,600 Seven & I Holdings Co., Ltd. 458,497 506,312
6,700 Seven Bank, Ltd. 31,043 28,621
2,000 SG Holdings Co., Ltd. 64,403 58,707
3,400 Sharp Corporation 63,828 68,361
3,000 Shimadzu Corporation 43,170 123,142
300 Shimamura Co., Ltd. 38,037 29,783
1,000 Shimano Inc. 132,745 212,038
9,200 Shimizu Corporation 76,121 122,512
5,100 Shin-Etsu Chemical Co., Ltd. 418,225 733,912
3,300 Shinsei Bank, Ltd. 73,398 65,956
3,800 Shionogi & Co., Ltd. 158,731 306,836
5,500 Shiseido Company, Limited 202,968 510,717
1,700 Showa Denko K.K. 105,784 58,806
800 SMC Corporation 243,881 480,063
23,700 SoftBank Corp. 419,666 412,742
21,600 SoftBank Group Corp. 724,323 1,225,807
900 Sohgo Security Services Co., Ltd. 59,020 63,576
4,600 Sompo Japan Nipponkoa Holdings, Inc. 172,857 236,022
17,500 Sony Corporation 657,603 1,545,450
2,400 Sony Financial Holdings Inc. 46,575 75,260
1,300 Square Enix Holdings Co., Ltd 86,746 84,231
1,800 Stanley Electric Co., Ltd. 47,686 68,301
3,200 SUMCO Corporation 104,589 69,723
20,000 Sumitomo Chemical Company, Ltd. 107,413 118,846
16,400 Sumitomo Corp. 245,689 317,802
2,200 Sumitomo Dainippon Pharma Co., Ltd. 53,557 55,915
10,700 Sumitomo Electric Industries, Ltd. 161,281 210,921
1,600 Sumitomo Heavy Industries Limited 52,135 59,757
3,000 Sumitomo Metal Mining Co., Ltd. 102,254 126,865
18,400 Sumitomo Mitsui Financial Group, Inc. 794,361 886,565
4,400 Sumitomo Mitsui Trust Holdings, Inc. 197,511 227,703
4,500 Sumitomo Realty & Development Co., Ltd. 180,259 204,688
1,900 Sumitomo Rubber Industries, Ltd. 31,879 30,312
800 Sundrug Co., Ltd. 44,358 37,754
1,900 Suntory Beverage & Food Limited 95,383 103,042
1,100 Suzuken Co., Ltd. 42,749 58,606
5,100 Suzuki Motor Corporation 187,160 277,925
2,300 Sysmex Corporation 136,820 204,434
8,100 T&D Holdings, Inc. 121,608 134,830
1,900 Taiheiyo Cement Corporation 68,565 72,889
Number of Shares Security
Average Cost ($)
Fair Value ($)
2,900 Taisei Corp. 81,931 157,275
500 Taisho Pharmaceutical Holdings Co., Ltd. 58,385 48,386
2,200 Taiyo Nippon Sanso Corporation 36,678 63,738
20,973 Takeda Pharmaceutical Company Ltd. 1,093,620 1,084,116
1,900 TDK Corporation 155,272 280,900
2,500 Teijin Limited 45,510 61,004
9,200 Terumo Corporation 179,010 426,487
900 The Bank of Kyoto, Ltd. 51,093 50,474
8,000 The Chiba Bank, Ltd. 53,146 60,426
4,200 The Chugoku Electric Power Co., Inc. 72,551 71,666
14,700 The Dai-ichi Life Insurance Company, Ltd. 269,316 318,625
9,700 The Kanzai Electric Power Company, Inc. 177,410 146,358
7,000 The Shizuoka Bank, Ltd. 79,939 68,325
1,800 The Yokohama Rubber Company, Ltd. 43,905 45,770
1,600 THK Co., Ltd. 42,862 56,664
2,600 Tobu Railway Company 76,423 122,701
1,800 Toho Company 56,875 97,619
1,100 TOHO Gas Company, Ltd. 39,177 58,540
6,000 Tohoku Electric Power Co., Inc. 117,516 77,465
8,800 Tokio Marine Holdings, Inc. 370,203 642,525
500 Tokyo Century Corporation 39,981 34,902
19,800 Tokyo Electric Power Co. 258,337 110,334
2,200 Tokyo Electron Limited 194,722 628,060
5,100 Tokyo Gas Co., Ltd. 143,674 161,357
7,400 Tokyu Corporation 112,822 178,277
8,800 Tokyu Fudosan Holdings Corporation 77,895 79,279
4,400 Toppan Printing Co., Ltd. 88,228 118,708
19,100 Toray Industries, Inc. 172,188 168,903
7,000 Toshiba Corp. 300,362 309,466
3,500 Tosoh Corporation 80,463 70,789
1,900 Toto, Ltd. 74,755 105,196
2,300 Toyo Seikan Kaisha, Ltd. 50,417 51,870
1,400 Toyo Suisan Kaisha, Ltd. 57,813 77,346
800 Toyoda Gosei Co., Ltd. 19,173 26,203
1,900 Toyota Industries Corp. 94,110 143,511
31,500 Toyota Motor Corporation 1,961,044 2,899,458
2,800 Toyota Tsusho Corporation 84,050 128,965
1,700 Trend Micro Incorporated 71,637 113,596
500 Tsuruha Holdings, Inc. 72,663 83,646
5,800 Unicharm Corporation 158,626 256,069
46 United Urban Investment Corporation 84,233 111,754
3,500 USS Co., Ltd. 66,389 86,283
600 Welcia Holdings Co., Ltd. 40,434 49,758
2,300 West Japan Railway Company 145,273 259,103
1,600 Yakult Honsha Co., Ltd. 110,040 115,123
7,900 Yamada Denki Co., Ltd. 48,208 54,486
2,000 Yamaha Corp. 63,435 145,098
4,200 Yamaha Motor Co., Ltd. 109,197 110,405
4,400 Yamato Holdings Co., Ltd. 85,973 98,022
1,700 Yamazaki Baking Company 31,374 39,536
3,400 Yaskawa Electric Corp. 82,625 169,177
3,100 Yokogawa Electric Corporation 52,917 71,354
38,100 Z Holdings Corporation 179,964 209,581
2,000 ZOZO, Inc. 50,394 49,806
48,190,888 65,887,262
Schedule of InvestmentsAs at December 31, 2019
13
Tangerine Balanced Growth PortfolioAudited Annual Financial Statements for the year ended December 31, 2019(In Canadian dollars, unless otherwise indicated)
Number of Shares Security
Average Cost ($)
Fair Value ($)
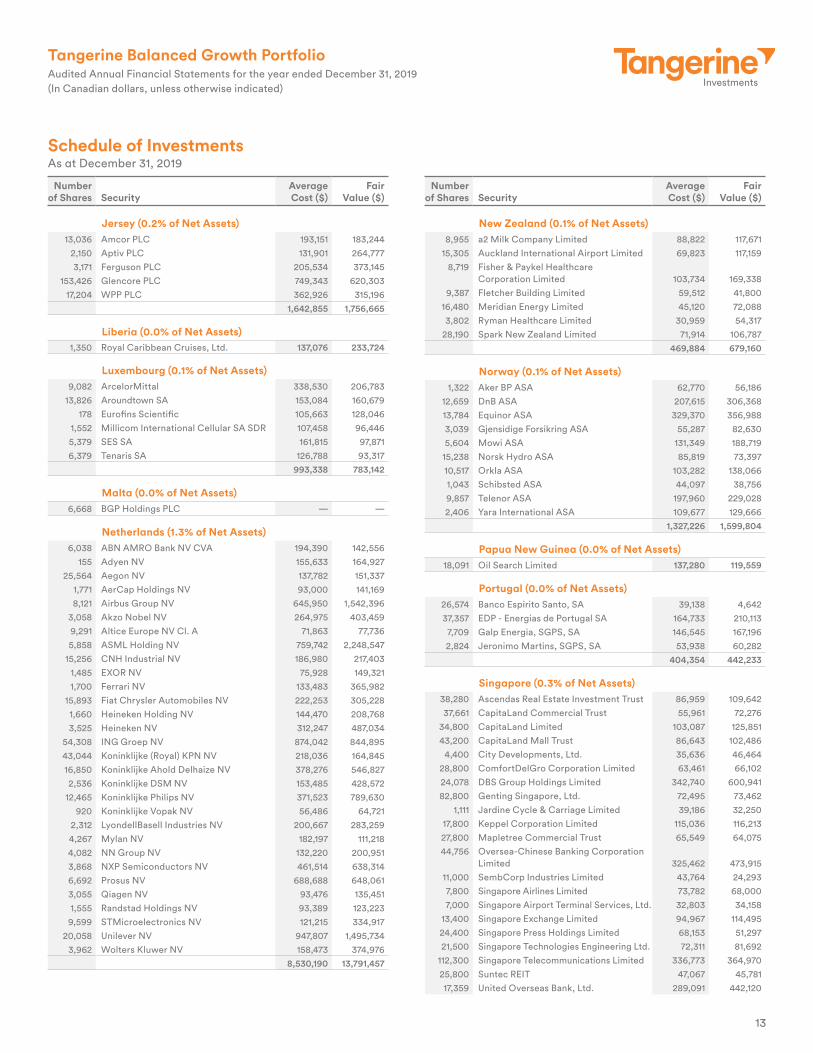
Jersey (0.2% of Net Assets)13,036 Amcor PLC 193,151 183,244
2,150 Aptiv PLC 131,901 264,777
3,171 Ferguson PLC 205,534 373,145
153,426 Glencore PLC 749,343 620,303
17,204 WPP PLC 362,926 315,196
1,642,855 1,756,665
Liberia (0.0% of Net Assets)1,350 Royal Caribbean Cruises, Ltd. 137,076 233,724
Luxembourg (0.1% of Net Assets)9,082 ArcelorMittal 338,530 206,783
13,826 Aroundtown SA 153,084 160,679
178 Eurofins Scientific 105,663 128,046
1,552 Millicom International Cellular SA SDR 107,458 96,446
5,379 SES SA 161,815 97,871
6,379 Tenaris SA 126,788 93,317
993,338 783,142
Malta (0.0% of Net Assets)6,668 BGP Holdings PLC — —
Netherlands (1.3% of Net Assets)6,038 ABN AMRO Bank NV CVA 194,390 142,556
155 Adyen NV 155,633 164,927
25,564 Aegon NV 137,782 151,337
1,771 AerCap Holdings NV 93,000 141,169
8,121 Airbus Group NV 645,950 1,542,396
3,058 Akzo Nobel NV 264,975 403,459
9,291 Altice Europe NV Cl. A 71,863 77,736
5,858 ASML Holding NV 759,742 2,248,547
15,256 CNH Industrial NV 186,980 217,403
1,485 EXOR NV 75,928 149,321
1,700 Ferrari NV 133,483 365,982
15,893 Fiat Chrysler Automobiles NV 222,253 305,228
1,660 Heineken Holding NV 144,470 208,768
3,525 Heineken NV 312,247 487,034
54,308 ING Groep NV 874,042 844,895
43,044 Koninklijke (Royal) KPN NV 218,036 164,845
16,850 Koninklijke Ahold Delhaize NV 378,276 546,827
2,536 Koninklijke DSM NV 153,485 428,572
12,465 Koninklijke Philips NV 371,523 789,630
920 Koninklijke Vopak NV 56,486 64,721
2,312 LyondellBasell Industries NV 200,667 283,259
4,267 Mylan NV 182,197 111,218
4,082 NN Group NV 132,220 200,951
3,868 NXP Semiconductors NV 461,514 638,314
6,692 Prosus NV 688,688 648,061
3,055 Qiagen NV 93,476 135,451
1,555 Randstad Holdings NV 93,389 123,223
9,599 STMicroelectronics NV 121,215 334,917
20,058 Unilever NV 947,807 1,495,734
3,962 Wolters Kluwer NV 158,473 374,976
8,530,190 13,791,457
Number of Shares Security
Average Cost ($)
Fair Value ($)
New Zealand (0.1% of Net Assets)8,955 a2 Milk Company Limited 88,822 117,671
15,305 Auckland International Airport Limited 69,823 117,159
8,719 Fisher & Paykel Healthcare Corporation Limited 103,734 169,338
9,387 Fletcher Building Limited 59,512 41,800
16,480 Meridian Energy Limited 45,120 72,088
3,802 Ryman Healthcare Limited 30,959 54,317
28,190 Spark New Zealand Limited 71,914 106,787
469,884 679,160
Norway (0.1% of Net Assets)1,322 Aker BP ASA 62,770 56,186
12,659 DnB ASA 207,615 306,368
13,784 Equinor ASA 329,370 356,988
3,039 Gjensidige Forsikring ASA 55,287 82,630
5,604 Mowi ASA 131,349 188,719
15,238 Norsk Hydro ASA 85,819 73,397
10,517 Orkla ASA 103,282 138,066
1,043 Schibsted ASA 44,097 38,756
9,857 Telenor ASA 197,960 229,028
2,406 Yara International ASA 109,677 129,666
1,327,226 1,599,804
Papua New Guinea (0.0% of Net Assets)18,091 Oil Search Limited 137,280 119,559
Portugal (0.0% of Net Assets)26,574 Banco Espirito Santo, SA 39,138 4,642
37,357 EDP - Energias de Portugal SA 164,733 210,113
7,709 Galp Energia, SGPS, SA 146,545 167,196
2,824 Jeronimo Martins, SGPS, SA 53,938 60,282
404,354 442,233
Singapore (0.3% of Net Assets)38,280 Ascendas Real Estate Investment Trust 86,959 109,642
37,661 CapitaLand Commercial Trust 55,961 72,276
34,800 CapitaLand Limited 103,087 125,851
43,200 CapitaLand Mall Trust 86,643 102,486
4,400 City Developments, Ltd. 35,636 46,464
28,800 ComfortDelGro Corporation Limited 63,461 66,102
24,078 DBS Group Holdings Limited 342,740 600,941
82,800 Genting Singapore, Ltd. 72,495 73,462
1,111 Jardine Cycle & Carriage Limited 39,186 32,250
17,800 Keppel Corporation Limited 115,036 116,213
27,800 Mapletree Commercial Trust 65,549 64,075
44,756 Oversea-Chinese Banking Corporation Limited 325,462 473,915
11,000 SembCorp Industries Limited 43,764 24,293
7,800 Singapore Airlines Limited 73,782 68,000
7,000 Singapore Airport Terminal Services, Ltd. 32,803 34,158
13,400 Singapore Exchange Limited 94,967 114,495
24,400 Singapore Press Holdings Limited 68,153 51,297
21,500 Singapore Technologies Engineering Ltd. 72,311 81,692
112,300 Singapore Telecommunications Limited 336,773 364,970
25,800 Suntec REIT 47,067 45,781
17,359 United Overseas Bank, Ltd. 289,091 442,120
Schedule of InvestmentsAs at December 31, 2019

14
Tangerine Balanced Growth PortfolioAudited Annual Financial Statements for the year ended December 31, 2019(In Canadian dollars, unless otherwise indicated)
Number of Shares Security
Average Cost ($)
Fair Value ($)
7,374 UOL Group Limited 51,789 59,166
3,300 Venture Corporation, Ltd. 67,082 51,556
26,400 Wilmar International, Ltd. 90,350 104,893
36,300 Yangzijiang Shipbuilding Holdings Ltd. 47,242 39,208
2,707,389 3,365,306
Spain (0.7% of Net Assets)3,362 ACS, Actividades de Construccion y
Servicios SA 147,160 174,462
881 Aena SA 138,037 218,647
5,863 Amadeus IT Holding SA 298,909 621,289
89,864 Banco Bilbao Vizcaya Argentaria SA 856,923 651,807
75,775 Banco de Sabadell SA 192,283 114,710
230,673 Banco Santander, SA 1,732,145 1,252,414
17,573 Bankia, SA 100,794 48,665
9,219 Bankinter SA 101,735 87,654
50,611 Caixabank, SA 256,137 206,127
3,446 Cellnex Telecom, SA 152,579 192,464
3,455 Enagas SA 110,821 114,362
4,317 Endesa, SA 110,938 149,492
6,441 Ferrovial SA 134,644 252,858
2,606 Gamesa Corporation Tecnologica, SA 63,914 59,308
3,971 Grifols, SA 103,266 181,671
82,639 Iberdrola SA 642,766 1,104,257
15,142 Industria de Diseno Textil, SA 470,969 693,180
13,908 Mapfre SA 58,211 47,777
4,134 Naturgy Energy Group SA 100,247 134,791
5,771 Red Electrica Corporacion, SA 116,290 150,575
19,993 Repsol, SA 421,188 405,389
19,993 Repsol, SA, Rights (Exp. 01/08/20) 12,417 12,310
63,038 Telefonica SA 1,012,017 571,378
7,334,390 7,445,587
Sweden (0.6% of Net Assets)4,107 Alfa Laval AB 83,251 134,210
13,761 ASSA ABLOY AB 250,014 417,471
9,240 Atlas Copco AB Series A 276,760 478,201
5,403 Atlas Copco AB Series B 130,342 243,398
3,566 Boliden AB 95,028 122,755
3,022 Electrolux AB NPV 92,147 96,242
8,186 Epiroc AB Cl. A 109,131 129,670
4,728 Epiroc AB Cl. B 59,711 72,732
8,294 Essity Aktiebolag Cl. B 310,088 346,749
11,657 Hennes & Mauritz AB 415,911 307,587
3,830 Hexagon AB 178,694 278,541
4,554 Husqvarna AB 36,233 47,326
1,151 ICA Gruppen AB 52,238 69,709
1,982 Industrivarden AB 42,691 62,023
6,239 Investor AB 239,643 441,812
3,112 Kinnevik AB Cl. B 87,057 98,720
791 L E Lundbergforetagen AB Series B 34,427 45,035
2,628 Lundin Petroleum AB 61,979 115,876
15,504 Sandvik AB NPV 237,023 392,279
4,422 Securitas AB 67,937 98,898
22,474 Skandinaviska Enskilda Banken 252,282 274,214
4,173 Skanska AB 92,869 122,377
5,782 SKF AB 130,494 151,702
20,846 Svenska Handelsbanken AB 292,179 291,371
Number of Shares Security
Average Cost ($)
Fair Value ($)
12,333 Swedbank AB 296,599 238,242
2,561 Swedish Match AB 105,120 171,281
6,980 Tele2 AB 103,957 131,355
41,599 Telefonaktiebolaget LM Ericsson 470,426 469,993
35,376 Telia Company AB 241,471 197,245
21,246 Volvo AB 329,701 461,777
5,175,403 6,508,791
Switzerland (2.4% of Net Assets)25,987 ABB, Ltd. 626,981 813,278
2,325 Adecco Group AG, Registered Shares 166,183 190,608
5,941 Alcon Inc. 436,386 435,977
681 Baloise Holding, Ltd. 92,911 159,591
47 Barry Callebaut AG 93,589 134,564
17 Chocoladefabriken Lindt & Spruengli AG 305,332 379,946
3,732 Chubb, Ltd. 492,614 753,312
3,164 Clariant AG 111,430 91,520
2,936 Coca-Cola HBC Schweiz AG CDI 90,086 129,370
7,373 Compagnie Financiere Richemont SA 572,619 750,973
36,205 Credit Suisse Group AG 870,519 635,374
490 Dufry Group 88,658 63,006
117 Ems-Chemie Holding AG Registered 53,216 99,726
644 Galencia AG 120,570 152,343
1,290 Garmin, Ltd. 87,318 163,199
511 Geberit AG 169,446 371,710
131 Givaudan SA 265,882 531,718
3,306 Julius Baer Group, Ltd. 183,274 221,049
753 Kuehne & Nagel International AG 102,099 164,566
1,230 Lafargeholcim, Ltd. 88,307 87,640
5,646 Lafargeholcim, Ltd. Registered 360,581 406,012
1,061 Lonza Group AG 232,027 501,834
41,374 Nestlé SA 3,364,779 5,805,369
29,906 Novartis AG 2,587,923 3,680,423
566 Pargesa Holdings SA 52,734 60,977
271 Partners Group Holding AG 142,871 322,042
9,777 Roche Holding AG 2,609,846 4,111,111
830 Schindler Holding AG 143,317 270,176
73 SGS SA 168,698 259,153
1,774 Sika AG 156,201 432,007
734 Sonova Holding AG 120,623 217,718
149 Straumann AG 115,321 189,634
469 Swiss Life Holding 133,747 305,108
1,108 Swiss Prime Site AG 111,485 166,033
4,136 Swiss Re AG 379,795 602,052
355 Swisscom AG 192,546 243,686
2,804 TE Connectivity Limited 176,745 348,483
859 Temenos Group AG 164,566 176,228
426 The Swatch Group SA Bearer 180,195 154,027
764 The Swatch Group SA Registered 66,506 52,331
54,346 UBS Group AG 1,118,272 889,693
2,060 Zurich Insurance Group AG 654,618 1,095,446
18,250,816 26,619,013
United Kingdom (4.0% of Net Assets)13,536 3i Group PLC 100,180 255,319
2,976 Admiral Group PLC 91,685 118,045
14,887 Anglo American PLC 415,832 555,722
6,139 Antofagasta PLC 95,575 96,686
Schedule of InvestmentsAs at December 31, 2019

15
Tangerine Balanced Growth PortfolioAudited Annual Financial Statements for the year ended December 31, 2019(In Canadian dollars, unless otherwise indicated)
Number of Shares Security
Average Cost ($)
Fair Value ($)
1,973 Aon PLC 181,858 532,907
6,760 Ashtead Group PLC 149,374 280,333
4,921 Associated British Foods PLC 178,965 219,626
18,087 AstraZeneca PLC 1,309,018 2,363,580
13,335 Auto Trader Group PLC 98,449 136,210
889 Aveva Group PLC 68,006 71,106
54,018 Aviva PLC 418,208 388,537
45,454 BAE Systems PLC 371,719 441,019
242,102 Barclays PLC 902,293 747,123
13,708 Barratt Developments PLC 140,195 175,814
29,542 BHP Group PLC 795,376 901,714
281,818 BP PLC 1,948,506 2,283,142
31,873 British American Tobacco PLC 1,991,705 1,769,365
13,399 British Land Company, PLC 129,816 147,037
120,285 BT Group PLC 605,468 397,647
4,818 Bunzl PLC 134,756 170,914
6,036 Burberry Group PLC 132,400 228,638
2,307 Carnival PLC 124,419 144,416
79,511 Centrica PLC 305,524 121,974
3,028 Coca-Cola European Partners PLC 155,450 197,093
21,782 Compass Group PLC 420,666 707,213
1,704 Croda International PLC 83,502 149,875
32,692 Diageo PLC 1,013,348 1,797,421
20,100 Direct Line Insurance Group PLC 110,977 107,904
2,355 easyJet PLC 55,523 57,629
6,952 Evraz PLC 70,114 48,248
12,409 Experian PLC 232,774 544,011
21,545 G4S PLC 94,162 80,685
68,590 GlaxoSmithKline PLC 1,669,835 2,096,173
5,225 Halma PLC 161,271 189,929
4,119 Hargreaves Lansdown PLC 88,642 136,919
279,153 HSBC Holdings PLC 2,560,794 2,838,449
13,620 Imperial Brands PLC 626,997 437,297
17,255 Informa PLC 244,120 254,031
2,374 InterContinental Hotels Group PLC 118,796 212,394
2,278 Intertek Group PLC 108,836 229,007
52,772 ITV PLC 155,630 136,890
23,643 J Sainsbury PLC 121,614 93,375
6,030 JD Sports Fashion PLC 81,212 86,744
2,799 Johnson Matthey PLC 128,604 144,057
29,942 Kingfisher PLC 138,242 111,617
10,826 Land Securities Group PLC 191,269 184,117
84,968 Legal & General Group PLC 292,923 442,271
972,389 Lloyds Banking Group PLC 1,132,139 1,044,024
4,450 London Stock Exchange Group PLC 222,133 592,451
35,054 M&G PLC 130,651 142,838
25,863 Marks & Spencer Group PLC 153,482 94,857
11,006 Meggitt PLC 82,418 124,180
68,268 Melrose Industries PLC 273,073 281,579
484 Micro Focus International PLC 21,423 8,845
4,318 Micro Focus International PLC ADR 189,433 78,559
7,141 Mondi PLC 202,997 217,438
48,640 National Grid PLC 620,616 789,031
1,881 Next PLC 127,733 226,774
2,654 Nielsen Holdings PLC 132,808 69,864
1,497 NMC Health PLC 87,872 45,441
6,256 Ocado Group PLC 128,974 137,454
Number of Shares Security
Average Cost ($)
Fair Value ($)
11,205 Pearson PLC 179,424 122,614
4,347 Persimmon PLC 131,963 201,251
35,054 Prudential PLC 713,784 872,562
9,884 Reckitt Benckiser Group PLC 910,478 1,040,669
26,758 RELX PLC 444,625 875,430
25,450 Rentokil Initial PLC 163,209 198,051
15,688 Rio Tinto PLC 810,411 1,213,556
24,612 Rolls-Royce Holdings PLC 342,827 288,858
66,730 Royal Bank of Scotland Group PLC 333,781 275,464
58,913 Royal Dutch Shell PLC Cl. A 1,516,405 2,261,930
51,601 Royal Dutch Shell PLC Cl. B 1,811,187 1,985,179
14,326 RSA Insurance Group PLC 124,762 139,195
1,937 Schroders PLC 84,780 110,939
15,986 SEGRO PLC 127,752 246,388
3,334 Severn Trent PLC 103,184 144,044
11,988 Smith & Nephew PLC 195,749 377,382
5,813 Smiths Group PLC 128,586 168,463
1,013 Spirax-Sarco Engineering PLC 150,139 154,704
14,863 SSE PLC 269,100 367,288
7,834 St. Jame's Place PLC 144,584 156,716
38,275 Standard Chartered PLC 569,869 468,414
34,089 Standard Life Aberdeen PLC 224,604 192,137
43,951 Taylor Wimpey PLC 146,824 146,021
3,507 TechnipFMC PLC 157,422 97,503
138,137 Tesco PLC 630,765 605,593
1,873 The Berkeley Group Holdings PLC 109,879 156,342
16,033 The Sage Group PLC 140,303 206,294
3,809 The Weir Group PLC 120,437 98,772
15,278 Unilever PLC 717,939 1,141,816
9,252 United Utilities Group PLC 116,321 149,942
372,928 Vodafone Group PLC 1,531,084 940,206
1,846 Whitbread PLC 114,271 153,676
36,846 WM Morrison Supermarkets PLC 152,038 126,467
36,538,866 43,367,424
United States (25.5% of Net Assets)4,767 3M Co. 771,442 1,090,559
1,100 A.O. Smith Corporation 75,699 67,955
14,626 Abbott Laboratories 752,387 1,647,410
12,266 AbbVie Inc. 801,855 1,408,312
373 ABIOMED, Inc. 189,006 82,512
6,240 Activision Blizzard, Inc. 343,960 480,810
4,027 Adobe Systems Inc. 466,167 1,722,272
600 Advance Auto Parts, Inc. 122,232 124,612
9,351 Advanced Micro Devices Incorporated 226,911 556,094
6,226 AFLAC Incorporated 224,183 427,092
2,567 Agilent Technologies, Inc. 105,717 283,976
1,801 Air Products and Chemicals Inc. 268,352 548,807
1,433 Akamai Technologies, Inc. 70,354 160,515
940 Alaska Air Group, Inc. 83,702 82,584
850 Albemarle Corporation 91,662 80,507
920 Alexandria Real Estate Equities, Inc. 141,686 192,767
1,826 Alexion Pharmaceuticals Inc. 280,651 256,085
590 Align Technology, Inc. 120,828 213,489
294 Alliance Data Systems Corporation 85,093 42,776
1,850 Alliant Energy Corporation 95,652 131,273
2,491 Alphabet Inc. Cl. A 2,294,576 4,326,503
Schedule of InvestmentsAs at December 31, 2019

16
Tangerine Balanced Growth PortfolioAudited Annual Financial Statements for the year ended December 31, 2019(In Canadian dollars, unless otherwise indicated)
Number of Shares Security
Average Cost ($)
Fair Value ($)
2,495 Alphabet Inc. Cl. C 1,548,623 4,325,783
15,445 Altria Group, Inc. 816,612 999,613
3,461 Amazon.com, Inc. 2,870,729 8,293,202
2,059 Ameren Corp. 104,905 205,057
3,402 American Airlines Group Inc. 230,723 126,523
4,030 American Electric Power Company, Inc. 256,438 493,900
5,669 American Express Company 388,590 915,160
7,222 American International Group, Inc. 360,959 480,712
3,663 American Tower Corporation 427,792 1,091,644
1,466 American Water Works Co., Inc. 136,385 233,542
1,127 Ameriprise Financial, Inc. 110,354 243,446
1,302 AmerisourceBergen Corporation 87,874 143,545
1,886 AMETEK, Inc. 109,158 243,931
5,011 Amgen Inc. 709,546 1,566,476
2,505 Amphenol Corp. 157,093 351,570
3,026 Analog Devices, Inc. 231,913 466,324
700 Ansys Inc. 112,663 233,657
2,108 Anthem, Inc. 306,115 825,614
3,049 Apache Corporation 262,214 101,177
1,367 Apartment Investment & Management Company 51,223 91,558
34,757 Apple Inc. 3,788,351 13,235,140
7,654 Applied Materials, Inc. 221,239 605,842
4,420 Archer-Daniels-Midland Company 180,546 265,661
3,291 Arconic Inc. 119,912 131,314
472 Arista Networks, Inc. 176,347 124,494
1,603 Arthur J. Gallagher & Co. 111,415 197,954
469 Assurant, Inc. 36,349 79,720
60,877 AT&T Inc. 2,474,714 3,085,063
900 Atmos Energy Corporation 115,033 130,549
1,802 Autodesk, Inc. 145,022 428,699
3,546 Automatic Data Processing, Inc. 334,580 784,006
198 AutoZone, Inc. 111,586 305,877
1,172 Avalonbay Communities, Inc. 224,361 318,700
740 Avery Dennison Corporation 47,644 125,534
5,582 Baker Hughes Company 244,531 185,522
2,799 Ball Corporation 102,320 234,726
67,354 Bank of America Corporation 1,375,320 3,076,161
7,055 Bank of New York Mellon Corporation 310,214 460,448
4,145 Baxter International Inc. 198,299 449,460
2,243 Becton, Dickinson and Company 464,027 791,055
16,290 Berkshire Hathaway Inc. 2,639,930 4,784,599
1,980 Best Buy Co., Inc. 100,234 225,432
1,513 Biogen Idec Inc. 359,818 582,179
986 BlackRock, Inc. 359,163 642,750
347 Booking Holdings Inc. 410,187 924,121
1,722 BorgWarner Inc. 75,992 96,868
1,238 Boston Properties, Inc. 152,576 221,317
11,610 Boston Scientific Corporation 242,388 680,799
19,536 Bristol-Myers Squibb Company 1,191,285 1,626,145
3,303 Broadcom Inc. 598,731 1,353,566
930 Broadridge Financial Solutions Inc. 140,344 148,986
1,567 Brown Forman Corp. 68,014 137,364
1,143 C.H. Robinson Worldwide, Inc. 86,870 115,907
3,540 Cabot Oil & Gas Corporation 65,971 79,921
2,230 Cadence Design Systems Inc. 106,550 200,572
Number of Shares Security
Average Cost ($)
Fair Value ($)
1,521 Campbell Soup Co. 78,345 97,474
3,862 Capital One Financial Corporation 301,638 515,378
2,335 Cardinal Health, Inc. 159,193 153,152
1,318 CarMax, Inc. 68,124 149,838
3,216 Carnival Corporation 151,620 211,979
4,667 Caterpillar Inc. 472,211 893,749
882 CBOE Holdings Inc. 104,439 137,248
2,640 CBRE Group, Inc. 99,458 209,821
1,154 CDW Corporation 185,294 213,753
1,030 Celanese Corporation, Series A 121,317 164,446
3,489 Centene Corporation 174,919 284,447
4,151 CenterPoint Energy, Inc. 107,055 146,789
7,806 CenturyLink, Inc. 244,075 133,717
2,760 Cerner Corporation 164,223 262,665
1,890 CF Industries Holdings, Inc. 71,014 117,004
1,318 Charter Communications, Inc. Cl. A 490,625 829,058
15,765 Chevron Corporation 1,883,706 2,463,618
201 Chipotle Mexican Grill, Inc. 92,585 218,190
1,960 Church & Dwight Co., Inc. 118,818 178,778
3,080 Cigna Corporation 484,117 816,731
720 Cimarex Energy Co. 108,678 49,008
1,188 Cincinnati Financial Corp. 68,116 161,988
683 Cintas Corporation 52,108 238,319
35,097 Cisco Systems, Inc. 1,115,253 2,182,757
18,187 Citigroup Inc. 1,066,007 1,884,125
3,868 Citizens Financial Group, Inc. 123,710 203,693
1,098 Citrix Systems, Inc. 86,975 157,903
1,027 Clorox Company 104,360 204,479
3,003 CME Group Inc. 388,049 781,632
2,280 CMS Energy Corp. 80,017 185,792
4,733 Cognizant Technology Solutions Corp. 254,392 380,649
7,046 Colgate-Palmolive Company 460,906 628,984
37,860 Comcast Corporation 1,056,540 2,207,800
1,271 Comerica Inc. 67,759 118,256
3,799 ConAgra Foods, Inc. 148,934 168,678
1,610 Concho Resources Inc. 255,427 182,826
9,312 ConocoPhillips 564,720 785,259
2,742 Consolidated Edison Inc. 197,345 321,683
1,403 Constellation Brands, Inc. 168,917 345,220
1,600 Copart, Inc. 119,043 188,682
6,513 Corning Incorporated 146,854 245,855
6,249 Corteva, Inc. 193,576 239,536
3,690 Costco Wholesale Corporation 566,326 1,406,409
2,050 Coty Inc. Cl. A 43,394 29,906
3,384 Crown Castle International Corp. 339,756 623,783
6,496 CSX Corporation 237,912 609,538
1,324 Cummins Inc. 179,702 307,256
10,783 CVS Health Corporation 853,019 1,038,786
5,297 Danaher Corporation 427,450 1,054,236
1,039 Darden Restaurants, Inc. 77,262 146,872
822 DaVita Inc. 50,200 79,977
2,611 Deere & Company 295,116 586,626
4,854 Delta Air Lines, Inc. 192,871 368,098
1,892 DENTSPLY SIRONA, Inc. 125,386 138,841
3,373 Devon Energy Corporation 198,597 113,591
1,402 Diamondback Energy, Inc. 196,598 168,824
1,700 Digital Realty Trust, Inc. 225,308 263,964
Schedule of InvestmentsAs at December 31, 2019

17
Tangerine Balanced Growth PortfolioAudited Annual Financial Statements for the year ended December 31, 2019(In Canadian dollars, unless otherwise indicated)
Number of Shares Security
Average Cost ($)
Fair Value ($)
2,611 Discover Financial Services 130,816 287,185
1,045 Discovery Communications, Inc. Cl. A 41,304 44,366
3,083 Discovery Communications, Inc. Cl. C 107,481 121,895
1,848 DISH Network Corp. Cl. A 150,049 85,000
2,078 Dollar General Corp. 151,524 420,311
1,880 Dollar Tree, Inc. 142,433 229,284
6,865 Dominion Resources, Inc. 533,086 737,279
1,259 Dover Corporation 65,239 188,174
6,249 Dow Inc. 340,229 443,499
2,740 DR Horton, Inc. 80,735 187,426
1,527 DTE Energy Company 128,389 257,160
5,971 Duke Energy Corporation 501,470 706,229
2,890 Duke Realty Corporation 100,118 129,930
6,249 DuPont de Nemours Inc. 482,114 520,238
2,363 DXC Technology Co. 167,007 115,184
1,950 E*Trade Financial Corporation 53,218 114,725
1,152 Eastman Chemical Company 80,590 118,403
6,855 eBay Inc. 150,473 320,990
2,079 Ecolab Inc. 243,117 520,290
2,984 Edison International 205,941 291,799
1,719 Edwards Lifesciences Corporation 153,414 520,030
2,434 Electronic Arts Inc. 127,490 339,333
7,069 Eli Lilly and Company 547,823 1,204,783
5,118 Emerson Electric Co. 330,377 506,120
1,685 Entergy Corporation 156,482 261,766
4,893 EOG Resources, Inc. 438,654 531,457
980 Equifax Inc. 86,332 178,067
716 Equinix, Inc. 304,539 541,950
2,986 Equity Residential 216,267 313,330
553 Essex Property Trust, Inc. 135,040 215,748
2,100 Evergy, Inc. 146,226 177,251
2,722 Eversource Energy 152,621 300,276
7,879 Exelon Corporation 373,319 465,797
1,175 Expedia, Inc. 142,420 164,771
1,407 Expeditors International of Washington, Inc. 68,033 142,350
988 Extra Space Storage Inc. 118,346 135,319
35,258 Exxon Mobil Corporation 3,378,864 3,190,398
530 F5 Networks, Inc. 81,175 95,978
20,006 Facebook, Inc. Cl. A 2,551,235 5,324,756
4,710 Fastenal Company 99,236 225,679
567 Federal Realty Investment Trust 115,738 94,650
1,975 FedEx Corp. 319,857 387,261
5,082 Fidelity National Information Services, Inc. 627,031 916,615
5,781 Fifth Third Bancorp 130,478 230,443
1,429 First Republic Bank 172,848 217,641
4,519 FirstEnergy Corp. 200,262 284,797
4,789 Fiserv, Inc. 335,608 718,078
700 FleetCor Technologies Inc. 204,544 261,171
1,181 FLIR Systems, Inc. 44,248 79,743
1,073 Flowserve Corporation 50,852 69,251
1,090 FMC Corporation 55,073 141,091
32,580 Ford Motor Company 452,784 392,907
1,100 Fortinet Inc. 113,610 152,285
2,414 Fortive Corporation 108,010 239,128
1,250 Fortune Brands Home & Security Inc. 92,292 105,912
Number of Shares Security
Average Cost ($)
Fair Value ($)
2,885 Fox Corporation Cl. A 159,340 138,683
1,330 Fox Corporation Cl. B 73,191 62,778
2,334 Franklin Resources, Inc. 103,145 78,631
11,958 Freeport-McMoRan Inc. 291,741 203,446
730 Gartner, Inc. 107,307 145,875
1,899 General Dynamics Corp. 266,923 434,267
72,290 General Electric Company 1,751,970 1,046,161
4,899 General Mills, Inc. 272,170 340,255
10,685 General Motors Co. 442,327 507,121
1,219 Genuine Parts Company 97,241 167,922
10,444 Gilead Sciences, Inc. 703,713 880,041
2,524 Global Payments Inc. 220,553 597,518
920 Globe Life Inc. 42,540 125,564
1,553 H&R Block, Inc. 40,859 47,285
6,908 Halliburton Company 318,557 219,201
2,600 Hanesbrands, Inc. 109,408 50,068
1,360 Harley-Davidson, Inc. 63,216 65,588
1,841 Harris Corporation 190,939 472,378
1,083 Hasbro, Inc. 82,353 148,317
2,199 HCA Holdings, Inc. 222,977 421,488
3,799 Healthpeak Properties, Inc. 147,146 169,811
911 Helmerich & Payne, Inc. 61,188 53,668
1,220 Henry Schein, Inc. 90,318 105,553
2,077 Hess Corporation 144,503 179,943
10,739 Hewlett Packard Enterprise Company 139,193 220,863
2,400 Hilton Inc. 221,089 345,174
1,390 HollyFrontier Corporation 132,591 91,404
2,098 Hologic, Inc. 99,260 142,042
5,964 Honeywell International Inc. 626,897 1,368,886
2,270 Hormel Foods Corporation 63,133 132,787
5,711 Host Hotels & Resorts Inc. 108,706 137,376
12,168 HP Inc. 463,035 324,255
1,124 Humana Inc. 207,509 534,220
8,760 Huntington Bancshares Incorporated 97,133 171,302
350 Huntington Ingalls Industries Inc. 99,794 113,865
600 IDEX Corporation 129,163 133,825
710 Idexx Labs Incorporated 117,265 240,420
2,491 Illinois Tool Works Inc. 243,185 580,242
1,194 Illumina, Inc. 294,339 513,639
1,430 Incyte Corporation 242,073 161,922
36,201 Intel Corporation 1,267,066 2,809,577
4,637 Intercontinental Exchange, Inc. 255,675 556,506
7,352 International Business Machines Corp. 1,239,611 1,277,898
830 International Flavors & Fragrances Inc. 89,905 138,944
3,337 International Paper Co. 133,332 199,270
2,166 Intuit Inc. 271,932 735,699
960 Intuitive Surgical, Inc. 256,740 735,911
300 IPG Photonics Corporation 93,419 56,377
1,469 IQVIA Holdings Inc. 201,461 294,330
2,311 Iron Mountain Incorporated 84,227 95,508
720 J.B. Hunt Transport Services, Inc. 79,116 109,033
600 Jack Henry & Associates, Inc. 112,066 113,339
1,167 Jacobs Engineering Group Inc. 80,922 135,940
21,887 Johnson & Johnson 2,447,210 4,140,078
26,078 JPMorgan Chase & Co. 1,892,943 4,714,041
2,888 Juniper Networks, Inc. 85,618 92,240
860 Kansas City Southern 104,357 170,805
Schedule of InvestmentsAs at December 31, 2019

18
Tangerine Balanced Growth PortfolioAudited Annual Financial Statements for the year ended December 31, 2019(In Canadian dollars, unless otherwise indicated)
Number of Shares Security
Average Cost ($)
Fair Value ($)
2,000 Kellogg Co. 126,944 179,366
8,518 KeyCorp 110,858 223,565
1,586 Keysight Technologies, Inc. 127,510 211,074
2,825 Kimberly-Clark Corporation 317,024 503,889
3,483 Kimco Realty Corp. 85,437 93,538
16,307 Kinder Morgan, Inc. Cl. P 566,975 447,663
1,299 KLA Corporation 107,475 300,123
1,360 Kohl's Corporation 77,773 89,854
847 Laboratory Corporation of America Holdings 116,692 185,807
1,211 Lam Research Corporation 120,102 459,175
1,100 Lamb Weston Holdings, Inc. 112,141 122,715
2,800 Las Vegas Sands Corp. 210,391 250,677
1,225 Leggett & Platt, Incorporated 50,198 80,744
1,200 Leidos Holdings, Inc. 133,688 152,327
2,270 Lennar Corporation 120,657 164,225
1,982 Limited Brands, Inc. 85,557 46,571
1,745 Lincoln National Corporation 82,031 133,530
1,240 Live Nation Inc. 116,829 114,922
2,450 LKQ Corporation 101,926 113,420
2,103 Lockheed Martin Corporation 487,799 1,061,865
2,120 Loews Corporation 104,788 144,301
6,300 Lowe's Companies, Inc. 375,749 978,382
1,130 M&T Bank Corporation 163,947 248,739
2,609 Macy's, Inc. 96,011 57,515
6,900 Marathon Oil Corporation 152,211 121,508
5,386 Marathon Petroleum Corporation 315,797 420,804
300 MarketAxess Holdings Inc. 126,005 147,483
2,309 Marriott International, Inc. 199,923 453,411
4,160 Marsh & McLennan Companies, Inc. 261,935 600,999
505 Martin Marietta Materials, Inc. 91,318 183,125
2,560 Masco Corporation 59,641 159,311
7,387 MasterCard Incorporated 693,237 2,860,221
2,178 Maxim Integrated Products, Inc. 161,399 173,724
1,040 McCormick & Company, Incorporated 94,433 228,901
6,277 McDonald's Corporation 756,825 1,608,486
1,560 Mckesson Corporation 214,486 279,812
21,088 Merck & Co., Inc. 1,212,919 2,487,106
6,450 MetLife, Inc. 296,786 426,315
200 Mettler Toledo International Inc. 109,173 205,737
4,110 MGM Resorts International 174,088 177,317
1,920 Microchip Technology Incorporated 108,931 260,728
9,161 Micron Technology, Inc. 249,090 638,881
63,484 Microsoft Corporation 3,925,248 12,982,318
875 Mid-America Apartment Communities, Inc. 105,816 149,616
487 Mohawk Industries, Inc. 102,309 86,126
1,491 Molson Coors Beverage Company Cl. B 118,230 104,213
11,850 Mondelez International Inc. 445,590 846,386
3,266 Monster Beverage Corporation 164,669 269,146
1,340 Moodys Corporation 104,278 412,534
10,609 Morgan Stanley 419,854 703,269
1,450 Motorola Solutions, Inc. 105,846 302,990
700 MSCI Inc. Cl. A 130,561 234,356
929 NASDAQ OMX Group, Inc. 47,797 129,021
3,094 National-Oilwell Varco Inc. 159,029 100,504
2,092 Netapp Inc. 98,019 168,872
Number of Shares Security
Average Cost ($)
Fair Value ($)
3,625 Netflix, Inc. 544,638 1,521,012
2,952 Newell Brands Inc. 132,643 73,574
6,669 Newmont Corporation 301,228 375,757
3,502 News Corporation Cl. A 41,976 64,213
820 News Corporation Cl. B 13,972 15,429
4,049 NextEra Energy, Inc. 526,717 1,271,471
10,296 Nike Inc. 497,969 1,352,624
3,155 NiSource Inc. 99,700 113,900
3,898 Noble Energy, Inc. 176,717 125,560
861 Nordstrom, Inc. 41,433 45,698
2,212 Norfolk Southern Corporation 244,113 556,845
1,767 Northern Trust Corporation 147,763 243,434
1,281 Northrop Grumman Corporation 226,545 571,381
4,961 NortonLifeLock, Inc. 123,132 164,175
2,076 NRG Energy, Inc. 63,536 107,009
2,588 Nucor Corp. 162,397 188,875
5,102 NVIDIA Corporation 489,994 1,556,749
30 NVR, Inc. 142,380 148,157
7,337 Occidental Petroleum Corporation 616,382 392,082
500 Old Dominion Freight Line, Inc. 122,253 123,049
1,905 Omnicom Group Inc. 126,128 200,144
3,422 ONEOK, Inc. 196,645 335,784
18,269 Oracle Corporation 768,743 1,255,113
644 O'Reilly Automotive, Inc. 132,352 365,994
2,852 PACCAR Inc. 180,951 292,538
760 Packaging Corp of America 104,394 110,369
1,073 Parker-Hannifin Corporation 125,263 286,381
2,693 Paychex, Inc. 140,839 297,042
9,808 PayPal Holdings, Inc. 494,125 1,375,763
3,369 People's United Financial Inc. 67,312 73,832
11,631 PepsiCo, Inc. 1,184,464 2,061,325
847 PerkinElmer Inc. 41,145 106,650
46,070 Pfizer Inc. 1,510,573 2,340,663
12,908 Philip Morris International Inc. 1,183,669 1,424,275
3,643 Phillips 66 282,957 526,308
875 Pinnacle West Capital Corporation 56,243 102,040
1,344 Pioneer Natural Resources Company 189,797 263,812
1,964 PPG Industries Inc. 162,218 339,975
6,108 PPL Corp. 221,005 284,189
2,145 Principal Financial Group, Inc. 103,144 152,984
5,145 Prologis, Inc. 294,361 594,722
3,396 Prudential Financial, Inc. 305,816 412,809
4,092 Public Service Enterprise Group Inc. 180,960 313,337
1,235 Public Storage, Inc. 259,907 341,053
2,093 PulteGroup Inc. 43,285 105,307
640 PVH Corp. 85,359 87,266
1,050 Qorvo, Inc. 103,285 158,257
9,548 QUALCOMM Incorporated 644,654 1,092,408
1,240 Quanta Services, Inc. 38,642 65,460
1,045 Quest Diagnostics Incorporated 77,826 144,712
444 Ralph Lauren Corporation 57,014 67,490
1,113 Raymond James Financial, Inc. 119,363 129,116
2,315 Raytheon Company 279,472 659,654
2,640 Realty Income Corporation 189,323 252,066
1,427 Regency Centers Corp. 129,420 116,746
672 Regeneron Pharmaceuticals, Inc. 266,779 327,199
8,773 Regions Financial Corporation 100,108 195,219
Schedule of InvestmentsAs at December 31, 2019

19
Tangerine Balanced Growth PortfolioAudited Annual Financial Statements for the year ended December 31, 2019(In Canadian dollars, unless otherwise indicated)
Number of Shares Security
Average Cost ($)
Fair Value ($)
1,787 Republic Services, Inc. 88,500 207,699
1,215 Resmed Inc. 128,696 244,163
1,060 Robert Half International Inc. 44,411 86,803
1,001 Rockwell Automation Inc. 110,871 263,075
1,200 Rollins, Inc. 62,758 51,600
862 Roper Industries, Inc. 144,318 395,958
3,088 Ross Stores Inc. 152,005 466,188
2,046 S&P Global, Inc. 195,753 724,443
7,393 Salesforce.com, Inc. 826,255 1,559,209
950 SBA Communications Corporation 188,288 296,879
11,249 Schlumberger Limited 931,293 586,403
1,142 Sealed Air Corp. 41,880 58,984
2,370 Sempra Energy 274,907 465,543
1,564 ServiceNow, Inc. 588,030 572,578
2,508 Simon Property Group, Inc. 424,496 484,455
1,474 Skyworks Solutions, Inc. 171,688 231,051
630 SL Green Realty Corp. 99,453 75,062
496 Snap-on Incorporated 66,099 108,956
4,141 Southwest Airlines Co. 143,044 289,864
1,242 Stanley Black & Decker Inc. 132,949 266,935
9,901 Starbucks Corporation 452,077 1,128,816
3,154 State Street Corporation 231,290 323,515
2,700 Stryker Corporation 349,584 735,047
430 SVB Financial Group 148,547 139,981
5,096 Synchrony Financial 210,174 237,963
1,260 Synopsys Inc. 121,091 227,440
4,161 Sysco Corporation 209,539 461,555
1,938 T. Rowe Price Group Inc. 148,210 306,196
920 Take-Two Interactive Software, Inc. 129,261 146,060
2,448 Tapestry, Inc. 117,901 85,615
4,215 Target Corporation 297,254 700,770
370 Teleflex Incorporated 125,267 180,615
7,690 Texas Instruments Incorporated 462,686 1,279,309
2,073 Textron Inc. 86,596 119,892
5,320 The AES Corporation 62,852 137,284
2,661 The Allstate Corporation 180,356 388,026
4,429 The Boeing Company 759,593 1,870,939
9,765 The Charles Schwab Corporation 325,213 602,241
31,879 The Coca-Cola Company 1,419,443 2,288,119
394 The Cooper Companies, Inc. 98,066 164,153
1,873 The Estee Lauder Companies Inc. 176,806 501,647
1,951 The Gap, Inc. 65,630 44,730
2,638 The Goldman Sachs Group, Inc. 515,126 786,551
2,867 The Hartford Financial Services Group, Inc. 97,920 225,930
1,258 The Hershey Company 121,715 239,770
9,094 The Home Depot, Inc. 984,917 2,575,278
3,370 The Interpublic Group of Companies, Inc. 68,675 100,948
899 The J.M. Smucker Company 102,538 121,392
4,870 The Kraft Heinz Company 321,921 202,906
6,596 The Kroger Co. 177,468 247,962
2,968 The Mosaic Company 139,764 83,287
3,740 The PNC Financial Services Group, Inc. 370,549 774,181
20,714 The Procter & Gamble Company 1,932,083 3,354,924
4,770 The Progressive Corporation 190,001 447,768
672 The Sherwin-Williams Company 193,730 508,506
8,650 The Southern Co. 459,336 714,516
Schedule of InvestmentsAs at December 31, 2019
Number of Shares Security
Average Cost ($)
Fair Value ($)
10,036 The TJX Companies Inc. 324,225 794,646
2,179 The Travelers Companies, Inc. 215,520 386,968
15,023 The Walt Disney Company 1,299,157 2,817,548
10,018 The Williams Companies, Inc. 354,909 308,143
3,317 Thermo Fisher Scientific Inc. 526,929 1,397,370
839 Tiffany & Co. 47,407 145,408
2,600 T-Mobile US, Inc. 269,512 264,397
920 Tractor Supply Company 83,172 111,475
417 TransDigm Group Inc. 158,428 302,817
11,169 Truist Financial Corporation 457,928 815,705
6,252 Twitter, Inc. 315,262 259,838
2,370 Tyson Foods, Inc. 115,964 279,793
11,700 U.S. Bancorp 488,946 899,546
2,391 UDR, Inc. 116,071 144,795
448 Ulta Salon, Cosmetics & Fragrance, Inc. 125,769 147,060
1,230 Under Armour, Inc. Cl. A 85,619 34,452
1,238 Under Armour, Inc. Cl. C 2,733 30,791
5,846 Union Pacific Corporation 519,654 1,370,533
1,787 United Airlines Holdings Inc. 137,620 204,130
5,856 United Parcel Service, Inc. 621,260 888,926
690 United Rentals, Inc. 90,718 149,219
6,767 United Technologies Corporation 803,849 1,314,160
7,846 UnitedHealth Group Incorporated 1,080,414 2,991,041
710 Universal Health Services, Inc. 97,333 132,083
1,847 Unum Group 68,661 69,841
2,769 V.F. Corporation 143,335 357,849
3,485 Valero Energy Corporation 192,128 423,221
733 Varian Medical Systems, Inc. 58,005 134,983
3,081 Ventas, Inc. 198,369 230,688
862 VeriSign, Inc. 74,853 215,377
1,310 Verisk Analytics, Inc. 149,649 253,690
34,474 Verizon Communications Inc. 1,898,482 2,744,835
2,159 Vertex Pharmaceuticals Inc. 288,556 612,991
4,548 ViacomCBS Inc. Cl. B 275,782 247,523
14,265 Visa Inc. 1,034,797 3,475,800
1,324 Vornado Realty Trust 125,302 114,174
1,080 Vulcan Materials Co. 95,316 201,657
1,200 W.R. Berkley Corporation 108,342 107,526
378 W.W. Grainger Inc. 115,309 165,933
1,392 Wabtec Corporation 136,725 140,435
6,514 Walgreens Boots Alliance, Inc. 464,132 498,037
11,787 Walmart Inc. 987,465 1,816,445
3,214 Waste Management, Inc. 191,480 474,957
550 Waters Corporation 71,089 166,642
2,515 WEC Energy Group, Inc. 131,246 300,792
400 WellCare Health Plans Inc. 157,167 171,280
32,042 Wells Fargo & Company 1,571,212 2,235,415
3,386 Welltower Inc 262,478 359,079
2,534 Western Digital Corporation 187,685 208,560
3,341 Western Union Company 68,211 116,023
2,095 WestRock Company 121,361 116,573
5,949 Weyerhaeuser Company 180,406 232,974
577 Whirlpool Corporation 68,610 110,386
791 Wynn Resorts, Ltd. 102,405 142,443
4,250 Xcel Energy Inc. 179,756 349,905
1,574 Xerox Holdings Corporation 50,333 75,255

20
Tangerine Balanced Growth PortfolioAudited Annual Financial Statements for the year ended December 31, 2019(In Canadian dollars, unless otherwise indicated)
Par Value ($) Security
Average Cost ($)
Fair Value ($)
FIXED INCOME (22.7% of Net Assets)
Issued or Guaranteed by Canadian Federal Government (7.5% of Net Assets)
844,000 Canada Housing Trust No. 1 1.15% Dec 15/21 833,963 833,917
1,422,000 Canada Housing Trust No. 1 1.25% Jun 15/21 1,419,074 1,411,325
792,000 Canada Housing Trust No. 1 1.50% Dec 15/21 791,054 787,822
1,660,000 Canada Housing Trust No. 1 1.75% Jun 15/22 1,660,562 1,657,061
1,364,000 Canada Housing Trust No. 1 1.80% Dec 15/24 1,361,555 1,352,791
1,078,000 Canada Housing Trust No. 1 1.90% Sep 15/26 1,063,618 1,068,921
447,000 Canada Housing Trust No. 1 1.95% Dec 15/25 437,211 445,566
921,000 Canada Housing Trust No. 1 2.10% Sep 15/29 942,754 921,856
563,000 Canada Housing Trust No. 1 2.25% Dec 15/25 574,798 570,617
1,661,500 Canada Housing Trust No. 1 2.35% Jun 15/23 1,659,301 1,686,017
611,000 Canada Housing Trust No. 1 2.35% Sep 15/23 620,333 620,238
1,043,000 Canada Housing Trust No. 1 2.35% Jun 15/27 1,043,823 1,062,706
361,000 Canada Housing Trust No. 1 2.35% Mar 15/28 355,795 368,242
2,336,000 Canada Housing Trust No. 1 2.40% Dec 15/22 2,361,175 2,372,217
1,623,000 Canada Housing Trust No. 1 2.55% Dec 15/23 1,624,487 1,660,295
857,000 Canada Housing Trust No. 1 2.55% Mar 15/25 882,080 880,780
971,000 Canada Housing Trust No. 1 2.65% Mar 15/22 989,981 988,565
661,000 Canada Housing Trust No. 1 2.65% Mar 15/28 655,293 689,126
956,000 Canada Housing Trust No. 1 2.65% Dec 15/28 954,387 999,895
2,320,000 Canada Housing Trust No. 1 2.90% Jun 15/24 2,425,116 2,412,344
279,000 Canada Housing Trust No. 1 3.15% Sep 15/23 279,765 291,125
Par Value ($) Security
Average Cost ($)
Fair Value ($)
578,000 Canada Housing Trust No. 1 3.35% Dec 15/20 595,907 586,566
1,110,000 Canada Housing Trust No. 1 3.80% Jun 15/21 1,195,931 1,141,953
53,000 Export Development Canada 1.65% Jul 31/24 52,939 52,289
66,000 Export Development Canada 1.80% Sep 01/22 65,909 65,959
2,034,000 Government of Canada 0.50% Mar 01/22 1,974,011 1,982,810
2,708,000 Government of Canada 0.75% Mar 01/21 2,649,901 2,677,300
2,513,000 Government of Canada 0.75% Sep 01/21 2,481,037 2,474,086
3,054,000 Government of Canada 1.00% Sep 01/22 2,982,270 2,999,778
2,053,000 Government of Canada 1.00% Jun 01/27 1,870,304 1,950,783
362,000 Government of Canada 1.25% Nov 01/21 359,789 359,125
1,325,000 Government of Canada 1.25% Mar 01/25 1,307,269 1,297,274
890,000 Government of Canada 1.25% Jun 01/30 876,245 851,087
250,000 Government of Canada 1.50% Aug 01/21 250,933 249,175
385,000 Government of Canada 1.50% Feb 01/22 383,686 383,513
1,692,000 Government of Canada 1.50% Jun 01/23 1,649,491 1,682,292
2,652,000 Government of Canada 1.50% Sep 01/24 2,650,981 2,630,475
1,709,000 Government of Canada 1.50% Jun 01/26 1,707,727 1,689,514
485,000 Government of Canada 1.75% May 01/21 485,044 485,134
2,433,000 Government of Canada 1.75% Mar 01/23 2,399,494 2,438,070
1,623,000 Government of Canada 2.00% Sep 01/23 1,620,267 1,640,992
1,981,000 Government of Canada 2.00% Jun 01/28 1,977,699 2,024,612
1,440,000 Government of Canada 2.00% Dec 01/51 1,438,159 1,528,217
865,000 Government of Canada 2.25% Feb 01/21 868,832 869,678
2,189,000 Government of Canada 2.25% Mar 01/24 2,265,254 2,238,367
1,948,000 Government of Canada 2.25% Jun 01/25 2,006,445 2,005,253
1,917,000 Government of Canada 2.25% Jun 01/29 2,052,134 2,008,758
1,697,000 Government of Canada 2.50% Jun 01/24 1,765,202 1,755,766
1,573,000 Government of Canada 2.75% Jun 01/22 1,669,799 1,612,293
1,947,000 Government of Canada 2.75% Dec 01/48 2,389,217 2,381,362
365,000 Government of Canada 2.75% Dec 01/64 377,171 479,135
1,745,000 Government of Canada 3.25% Jun 01/21 1,901,440 1,781,825
1,889,000 Government of Canada 3.50% Dec 01/45 2,441,758 2,563,498
1,865,000 Government of Canada 4.00% Jun 01/41 2,460,806 2,598,375
1,564,000 Government of Canada 5.00% Jun 01/37 2,241,313 2,317,578
1,528,000 Government of Canada 5.75% Jun 01/29 2,138,658 2,057,776
1,533,000 Government of Canada 5.75% Jun 01/33 2,265,489 2,264,155
209,000 Government of Canada 8.00% Jun 01/23 308,727 252,447
287,000 Government of Canada 8.00% Jun 01/27 443,817 411,161
75,000 Government of Canada 9.00% Jun 01/25 122,616 103,187
81,629,796 81,973,044
Issued or Guaranteed by Canadian Provincial Governments (8.2% of Net Assets)
52,000 Hydro One Inc. 1.62% Apr 30/20 51,684 51,949
90,000 Hydro One Inc. 1.84% Feb 24/21 90,097 89,831
67,000 Hydro One Inc. 2.54% Apr 05/24 66,981 67,931
62,000 Hydro One Inc. 2.57% Jun 25/21 61,518 62,478
88,000 Hydro One Inc. 2.77% Feb 24/26 87,969 90,302
63,000 Hydro One Inc. 2.97% Jun 26/25 62,329 65,259
73,000 Hydro One Inc. 3.02% Apr 05/29 72,981 75,905
90,000 Hydro One Inc. 3.20% Jan 13/22 93,273 91,994
116,000 Hydro One Inc. 3.63% Jun 25/49 114,153 128,829
55,000 Hydro One Inc. 3.64% Apr 05/50 54,959 61,305
64,000 Hydro One Inc. 3.72% Nov 18/47 63,962 71,957
Schedule of InvestmentsAs at December 31, 2019
Number of Shares Security
Average Cost ($)
Fair Value ($)
2,067 Xilinx, Inc. 93,227 262,061
1,448 Xylem, Inc. 58,448 147,944
2,504 Yum! Brands, Inc. 175,817 327,077
465 Zebra Technologies Corporation Cl. A 154,603 154,027
1,726 Zimmer Biomet Holdings, Inc. 198,695 335,012
1,588 Zions Bancorporation 49,127 106,916
3,920 Zoetis Inc. 220,446 672,769 151,234,553 277,922,062
Total Equities (76.9% of Net Assets) 589,533,626 838,795,889

21
Tangerine Balanced Growth PortfolioAudited Annual Financial Statements for the year ended December 31, 2019(In Canadian dollars, unless otherwise indicated)
Par Value ($) Security
Average Cost ($)
Fair Value ($)
13,000 Hydro One Inc. 3.79% Jul 31/62 12,962 15,047
95,000 Hydro One Inc. 3.91% Feb 23/46 98,655 109,437
7,000 Hydro One Inc. 4.00% Dec 22/51 7,001 8,311
65,000 Hydro One Inc. 4.17% Jun 06/44 69,568 77,221
56,000 Hydro One Inc. 4.39% Sep 26/41 60,515 67,805
17,000 Hydro One Inc. 4.40% Jun 01/20 18,972 17,168
133,000 Hydro One Inc. 4.59% Oct 09/43 134,161 166,998
75,000 Hydro One Inc. 4.89% Mar 13/37 83,350 93,751
55,000 Hydro One Inc. 5.00% Oct 19/46 61,481 74,555
100,000 Hydro One Inc. 5.36% May 20/36 116,008 130,603
65,000 Hydro One Inc. 5.49% Jul 16/40 81,788 88,983
45,000 Hydro One Inc. 6.03% Mar 03/39 54,828 64,277
55,000 Hydro One Inc. 6.35% Jan 31/34 69,832 76,579
75,000 Hydro One Inc. 6.93% Jun 01/32 102,101 106,621
35,000 Hydro One Inc. 7.35% Jun 03/30 45,802 49,230
20,000 Hydro-Ottawa Holding Inc. 2.61% Feb 03/25 20,000 20,243
16,000 Hydro-Ottawa Holding Inc. 3.64% Feb 02/45 16,000 17,042
533,000 Hydro-Quebec 4.00% Feb 15/55 666,825 723,280
248,000 Hydro-Quebec 5.00% Feb 15/45 319,421 362,039
255,000 Hydro-Quebec 5.00% Feb 15/50 325,698 390,062
125,000 Hydro-Quebec 6.00% Aug 15/31 157,468 169,977
230,000 Hydro-Quebec 6.00% Feb 15/40 318,075 354,308
381,000 Hydro-Quebec 6.50% Feb 15/35 553,806 572,853
142,000 Hydro-Quebec 9.63% Jul 15/22 220,323 169,177
200,000 Hydro-Quebec 11.00% Aug 15/20 297,585 211,192
77,000 Ontario Electricity Financial Corporation 8.25% Jun 22/26 117,984 104,459
40,000 Ontario Electricity Financial Corporation 8.50% May 26/25 57,500 52,712
25,000 Ontario Electricity Financial Corporation 8.90% Aug 18/22 37,205 29,403
40,000 Ontario Electricity Financial Corporation 10.00% Feb 06/20 58,073 40,286
11,000 Ontario Electricity Financial Corporation 10.13% Oct 15/21 17,345 12,574
1,000 Ontario Electricity Financial Corporation 10.75% Aug 06/21 1,618 1,138
445,000 Province of Alberta 1.35% Sep 01/21 441,520 441,592
119,000 Province of Alberta 1.60% Sep 01/22 117,626 118,105
318,000 Province of Alberta 2.05% Jun 01/30 313,521 307,797
509,000 Province of Alberta 2.20% Jun 01/26 501,507 508,533
518,000 Province of Alberta 2.35% Jun 01/25 516,265 523,712
257,000 Province of Alberta 2.55% Dec 15/22 263,633 261,625
484,000 Province of Alberta 2.55% Jun 01/27 477,952 492,043
166,000 Province of Alberta 2.65% Sep 01/23 165,929 169,903
471,000 Province of Alberta 2.90% Dec 01/28 471,008 491,302
228,000 Province of Alberta 2.90% Sep 20/29 211,390 237,938
975,000 Province of Alberta 3.05% Dec 01/48 963,223 1,059,437
108,000 Province of Alberta 3.10% Jun 01/24 110,814 112,774
396,000 Province of Alberta 3.10% Jun 01/50 405,262 436,828
701,000 Province of Alberta 3.30% Dec 01/46 716,059 789,597
71,000 Province of Alberta 3.40% Dec 01/23 74,036 74,740
373,000 Province of Alberta 3.45% Dec 01/43 384,024 425,963
175,000 Province of Alberta 3.50% Jun 01/31 181,244 192,779
161,000 Province of Alberta 3.90% Dec 01/33 170,408 186,159
70,000 Province of Alberta 4.50% Dec 01/40 74,085 90,675
Par Value ($) Security
Average Cost ($)
Fair Value ($)
164,000 Province of British Columbia 2.20% Jun 18/30 164,192 162,695
340,000 Province of British Columbia 2.30% Jun 18/26 342,300 343,912
249,000 Province of British Columbia 2.55% Jun 18/27 246,477 255,142
310,000 Province of British Columbia 2.70% Dec 18/22 317,505 317,380
761,000 Province of British Columbia 2.80% Jun 18/48 732,737 819,071
331,000 Province of British Columbia 2.85% Jun 18/25 343,007 344,736
275,000 Province of British Columbia 2.95% Dec 18/28 281,909 290,653
380,000 Province of British Columbia 2.95% Jun 18/50 394,489 424,481
630,000 Province of British Columbia 3.20% Jun 18/44 611,433 715,941
322,000 Province of British Columbia 3.25% Dec 18/21 329,357 330,830
255,000 Province of British Columbia 3.30% Dec 18/23 259,808 268,130
376,000 Province of British Columbia 3.70% Dec 18/20 386,398 382,873
433,000 Province of British Columbia 4.30% Jun 18/42 495,477 569,702
180,000 Province of British Columbia 4.70% Jun 18/37 223,757 237,434
272,000 Province of British Columbia 4.95% Jun 18/40 332,599 380,053
88,000 Province of British Columbia 5.40% Jun 18/35 116,345 121,840
470,000 Province of British Columbia 5.70% Jun 18/29 596,456 606,057
235,000 Province of British Columbia 6.35% Jun 18/31 319,903 329,191
18,000 Province of British Columbia 9.95% May 15/21 27,487 19,962
188,000 Province of Manitoba 1.55% Sep 05/21 186,814 187,161
278,000 Province of Manitoba 2.45% Jun 02/25 276,698 282,561
360,000 Province of Manitoba 2.55% Jun 02/23 358,555 367,154
308,000 Province of Manitoba 2.55% Jun 02/26 311,368 314,293
234,000 Province of Manitoba 2.60% Jun 02/27 230,732 238,753
140,000 Province of Manitoba 2.75% Jun 02/29 144,335 144,346
276,000 Province of Manitoba 2.85% Sep 05/46 259,121 286,559
230,000 Province of Manitoba 3.00% Jun 02/28 229,425 241,254
50,000 Province of Manitoba 3.15% Sep 05/52 46,923 55,664
223,000 Province of Manitoba 3.20% Mar 05/50 230,522 250,115
74,000 Province of Manitoba 3.25% Sep 05/29 73,088 79,296
152,000 Province of Manitoba 3.30% Jun 02/24 157,076 160,111
62,000 Province of Manitoba 3.35% Mar 05/43 60,794 69,433
305,000 Province of Manitoba 3.40% Sep 05/48 312,063 352,026
13,000 Province of Manitoba 3.85% Dec 01/21 14,192 13,484
224,000 Province of Manitoba 4.05% Sep 05/45 248,926 281,965
204,000 Province of Manitoba 4.10% Mar 05/41 228,716 251,452
57,000 Province of Manitoba 4.40% Sep 05/25 65,651 63,790
32,000 Province of Manitoba 4.40% Mar 05/42 34,220 41,275
150,000 Province of Manitoba 4.60% Mar 05/38 162,452 192,199
95,000 Province of Manitoba 4.65% Mar 05/40 105,668 124,359
Schedule of InvestmentsAs at December 31, 2019

22
Tangerine Balanced Growth PortfolioAudited Annual Financial Statements for the year ended December 31, 2019(In Canadian dollars, unless otherwise indicated)
Par Value ($) Security
Average Cost ($)
Fair Value ($)
15,000 Province of Manitoba 4.70% Mar 05/50 16,725 21,476
24,000 Province of Manitoba 4.75% Feb 11/20 27,354 24,071
95,000 Province of Manitoba 5.70% Mar 05/37 117,534 135,143
45,000 Province of Manitoba 6.30% Mar 05/31 61,546 61,650
22,000 Province of Manitoba 7.75% Dec 22/25 33,567 28,800
7,000 Province of Manitoba 10.50% Mar 05/31 13,706 12,422
57,000 Province of New Brunswick 1.55% May 04/22 55,366 56,554
189,000 Province of New Brunswick 2.35% Aug 14/27 183,708 189,075
151,000 Province of New Brunswick 2.60% Aug 14/26 150,641 154,195
133,000 Province of New Brunswick 2.85% Jun 02/23 136,282 136,835
86,000 Province of New Brunswick 3.05% Aug 14/50 89,350 92,179
125,000 Province of New Brunswick 3.10% Aug 14/28 124,863 131,801
161,000 Province of New Brunswick 3.10% Aug 14/48 157,143 173,273
91,000 Province of New Brunswick 3.35% Dec 03/21 97,539 93,519
167,000 Province of New Brunswick 3.55% Jun 03/43 169,920 190,114
28,000 Province of New Brunswick 3.55% Jun 03/55 28,878 33,082
118,000 Province of New Brunswick 3.65% Jun 03/24 124,741 125,819
198,000 Province of New Brunswick 3.80% Aug 14/45 210,274 236,429
42,000 Province of New Brunswick 4.50% Jun 02/20 44,797 42,466
143,000 Province of New Brunswick 4.55% Mar 26/37 143,115 178,573
70,000 Province of New Brunswick 4.65% Sep 26/35 79,096 87,416
135,000 Province of New Brunswick 4.80% Sep 26/39 160,627 176,787
141,000 Province of New Brunswick 4.80% Jun 03/41 158,355 187,567
25,000 Province of New Brunswick 5.50% Jan 27/34 33,048 33,350
20,000 Province of New Brunswick 5.65% Dec 27/28 25,597 25,086
69,000 Province of Newfoundland 1.95% Jun 02/22 68,825 69,012
155,000 Province of Newfoundland 2.30% Jun 02/25 151,460 155,592
70,000 Province of Newfoundland 2.65% Oct 17/50 69,423 66,788
149,000 Province of Newfoundland 2.85% Jun 02/28 147,105 152,708
99,000 Province of Newfoundland 2.85% Jun 02/29 100,669 101,522
176,000 Province of Newfoundland 3.00% Jun 02/26 177,419 182,842
248,000 Province of Newfoundland 3.30% Oct 17/46 234,643 266,357
170,000 Province of Newfoundland 3.70% Oct 17/48 177,239 197,315
50,000 Province of Newfoundland 4.50% Apr 17/37 61,691 61,096
Par Value ($) Security
Average Cost ($)
Fair Value ($)
67,000 Province of Newfoundland 4.65% Oct 17/40 72,625 85,225
40,000 Province of Newfoundland 5.60% Oct 17/33 51,303 52,812
60,000 Province of Newfoundland 5.70% Oct 17/35 79,112 81,928
100,000 Province of Newfoundland 6.15% Apr 17/28 133,184 127,067
30,000 Province of Newfoundland 6.55% Oct 17/30 41,850 40,936
10,000 Province of Newfoundland 10.95% Apr 15/21 15,926 11,131
149,000 Province of Nova Scotia 2.10% Jun 01/27 143,581 147,407
75,000 Province of Nova Scotia 2.15% Jun 01/25 73,661 75,208
165,000 Province of Nova Scotia 3.15% Dec 01/51 179,598 186,797
57,000 Province of Nova Scotia 3.45% Jun 01/45 58,166 66,157
162,000 Province of Nova Scotia 3.50% Jun 02/62 164,111 201,980
131,000 Province of Nova Scotia 4.10% Jun 01/21 141,963 135,137
132,000 Province of Nova Scotia 4.40% Jun 01/42 143,167 172,441
25,000 Province of Nova Scotia 4.45% Oct 24/21 29,812 26,148
100,000 Province of Nova Scotia 4.50% Jun 01/37 118,686 127,007
100,000 Province of Nova Scotia 4.70% Jun 01/41 103,810 134,532
60,000 Province of Nova Scotia 4.90% Jun 01/35 75,771 78,116
50,000 Province of Nova Scotia 5.80% Jun 01/33 62,588 68,720
40,000 Province of Nova Scotia 6.60% Jun 01/27 54,891 51,771
20,000 Province of Nova Scotia 6.60% Dec 01/31 29,323 28,525
836,000 Province of Ontario 1.35% Mar 08/22 817,826 827,001
148,000 Province of Ontario 1.95% Jan 27/23 147,400 148,205
338,000 Province of Ontario 2.30% Sep 08/24 339,851 341,916
1,226,000 Province of Ontario 2.40% Jun 02/26 1,236,018 1,243,404
841,000 Province of Ontario 2.60% Sep 08/23 837,934 859,679
2,032,000 Province of Ontario 2.60% Jun 02/25 2,058,088 2,084,909
1,660,000 Province of Ontario 2.60% Jun 02/27 1,653,570 1,700,707
295,000 Province of Ontario 2.65% Feb 05/25 299,999 303,340
1,250,000 Province of Ontario 2.65% Dec 02/50 1,311,291 1,293,021
1,223,000 Province of Ontario 2.70% Jun 02/29 1,258,730 1,264,361
1,611,000 Province of Ontario 2.80% Jun 02/48 1,549,349 1,706,784
1,796,000 Province of Ontario 2.85% Jun 02/23 1,806,752 1,850,138
1,444,000 Province of Ontario 2.90% Jun 02/28 1,444,184 1,511,752
2,043,000 Province of Ontario 2.90% Dec 02/46 1,962,826 2,191,461
1,918,000 Province of Ontario 2.90% Jun 02/49 1,853,629 2,077,069
1,866,000 Province of Ontario 3.15% Jun 02/22 1,958,392 1,921,894
1,785,000 Province of Ontario 3.45% Jun 02/45 1,763,343 2,091,208
1,727,000 Province of Ontario 3.50% Jun 02/24 1,839,628 1,834,313
1,446,000 Province of Ontario 3.50% Jun 02/43 1,481,737 1,692,226
1,325,000 Province of Ontario 4.00% Jun 02/21 1,421,126 1,365,191
1,001,000 Province of Ontario 4.60% Jun 02/39 1,196,074 1,315,152
1,222,000 Province of Ontario 4.65% Jun 02/41 1,515,418 1,646,906
1,120,000 Province of Ontario 4.70% Jun 02/37 1,356,713 1,463,478
900,000 Province of Ontario 5.60% Jun 02/35 1,167,597 1,257,773
596,000 Province of Ontario 5.85% Mar 08/33 748,336 823,702
370,000 Province of Ontario 6.20% Jun 02/31 500,901 510,797
30,000 Province of Ontario 6.20% Dec 02/41 45,180 48,045
725,000 Province of Ontario 6.50% Mar 08/29 989,041 973,196
50,000 Province of Ontario 7.50% Feb 07/24 67,841 60,662
540,000 Province of Ontario 7.60% Jun 02/27 781,378 736,606
40,000 Province of Ontario 8.10% Sep 08/23 55,768 48,657
59,000 Province of Ontario 9.50% Jul 13/22 92,878 69,909
Schedule of InvestmentsAs at December 31, 2019

23
Tangerine Balanced Growth PortfolioAudited Annual Financial Statements for the year ended December 31, 2019(In Canadian dollars, unless otherwise indicated)
Par Value ($) Security
Average Cost ($)
Fair Value ($)
62,000 Province of Prince Edward Island 2.35% Aug 25/25 60,656 62,135
13,000 Province of Prince Edward Island 2.65% Dec 01/51 12,989 12,813
9,000 Province of Prince Edward Island 3.60% Jan 17/53 8,308 10,545
71,000 Province of Prince Edward Island 3.65% Jun 27/42 66,200 80,725
4,000 Province of Prince Edward Island 3.70% Sep 02/20 3,979 4,049
8,000 Province of Prince Edward Island 3.85% Jul 17/54 7,958 9,822
45,000 Province of Prince Edward Island 4.60% May 19/41 49,863 57,788
44,000 Province of Quebec 1.65% Mar 03/22 43,954 43,834
63,000 Province of Quebec 2.25% Feb 22/24 62,991 63,723
758,000 Province of Quebec 2.30% Sep 01/29 767,812 760,331
53,000 Province of Quebec 2.45% Mar 01/23 52,923 53,900
865,000 Province of Quebec 2.50% Sep 01/26 872,809 883,809
32,000 Province of Quebec 2.60% Jul 06/25 31,931 32,913
955,000 Province of Quebec 2.75% Sep 01/25 978,484 988,974
945,000 Province of Quebec 2.75% Sep 01/27 954,192 979,995
908,000 Province of Quebec 2.75% Sep 01/28 902,018 943,429
889,000 Province of Quebec 3.00% Sep 01/23 901,424 922,137
679,000 Province of Quebec 3.10% Dec 01/51 757,965 775,812
1,099,000 Province of Quebec 3.50% Dec 01/22 1,169,515 1,149,153
1,465,000 Province of Quebec 3.50% Dec 01/45 1,493,810 1,744,669
1,595,000 Province of Quebec 3.50% Dec 01/48 1,744,062 1,930,874
997,000 Province of Quebec 3.75% Sep 01/24 1,046,483 1,073,538
1,212,000 Province of Quebec 4.25% Dec 01/21 1,322,901 1,266,956
1,001,000 Province of Quebec 4.25% Dec 01/43 1,166,255 1,315,614
300,000 Province of Quebec 4.50% Dec 01/20 333,540 307,318
598,000 Province of Quebec 5.00% Dec 01/38 726,556 821,381
1,167,000 Province of Quebec 5.00% Dec 01/41 1,496,747 1,655,563
83,000 Province of Quebec 5.35% Jun 01/25 99,792 96,532
520,000 Province of Quebec 5.75% Dec 01/36 713,496 753,930
375,000 Province of Quebec 6.00% Oct 01/29 492,066 494,941
577,000 Province of Quebec 6.25% Jun 01/32 754,055 813,320
75,000 Province of Quebec 8.50% Apr 01/26 111,694 102,523
35,000 Province of Saskatchewan 2.20% Jun 02/30 34,996 34,369
205,000 Province of Saskatchewan 2.55% Jun 02/26 205,383 209,325
184,000 Province of Saskatchewan 2.65% Jun 02/27 184,168 188,633
357,000 Province of Saskatchewan 2.75% Dec 02/46 331,830 366,172
224,000 Province of Saskatchewan 3.05% Dec 02/28 226,594 236,358
233,000 Province of Saskatchewan 3.10% Jun 02/50 246,876 258,208
139,000 Province of Saskatchewan 3.20% Jun 03/24 147,105 145,845
332,000 Province of Saskatchewan 3.30% Jun 02/48 337,125 378,519
120,000 Province of Saskatchewan 3.40% Feb 03/42 116,906 135,433
50,000 Province of Saskatchewan 3.75% Mar 05/54 56,414 63,198
Par Value ($) Security
Average Cost ($)
Fair Value ($)
228,000 Province of Saskatchewan 3.90% Jun 02/45 250,698 281,890
167,000 Province of Saskatchewan 4.75% Jun 01/40 209,028 222,489
75,000 Province of Saskatchewan 5.00% Mar 05/37 93,389 99,753
55,000 Province of Saskatchewan 5.60% Sep 05/35 61,665 76,369
40,000 Province of Saskatchewan 5.75% Mar 05/29 51,323 51,073
25,000 Province of Saskatchewan 6.40% Sep 05/31 32,731 34,965
84,598,168 89,112,972
Issued or Guaranteed by Canadian Municipal Governments (0.3% of Net Assets)
69,000 City of Montreal 2.30% Sep 01/29 68,438 67,885
62,000 City of Montreal 2.75% Sep 01/26 61,602 63,682
66,000 City of Montreal 3.00% Sep 01/25 67,154 68,686
136,000 City of Montreal 3.00% Sep 01/27 136,660 141,395
68,000 City of Montreal 3.15% Sep 01/28 67,661 71,567
79,000 City of Montreal 3.15% Dec 01/36 77,145 83,237
117,000 City of Montreal 3.50% Sep 01/23 118,256 122,935
60,000 City of Montreal 3.50% Sep 01/24 63,329 63,578
100,000 City of Montreal 3.50% Dec 01/38 102,496 110,568
79,000 City of Montreal 4.10% Dec 01/34 82,918 92,329
66,000 City of Montreal 4.25% Dec 01/32 65,887 77,401
67,000 City of Montreal 4.50% Dec 01/21 71,608 70,264
72,000 City of Montreal 6.00% Jun 01/43 103,947 111,896
17,000 City of Ottawa 3.05% May 10/39 16,912 17,696
9,000 City of Ottawa 3.05% Apr 23/46 8,913 9,486
102,000 City of Ottawa 3.10% Jul 27/48 97,861 109,190
38,000 City of Ottawa 3.25% Nov 10/47 40,289 41,798
10,000 City of Ottawa 4.20% Jul 30/53 9,975 13,246
6,000 City of Ottawa 4.40% Oct 22/33 5,991 7,190
22,000 City of Ottawa 4.60% Jul 14/42 23,050 28,776
3,000 City of Ottawa 5.05% Aug 13/30 3,479 3,699
55,000 City of Toronto 2.40% Jun 24/26 53,771 55,348
107,000 City of Toronto 2.40% Jun 07/27 104,169 107,059
53,000 City of Toronto 2.45% Feb 06/25 52,264 53,620
20,000 City of Toronto 2.60% Sep 24/39 19,858 19,451
37,000 City of Toronto 2.65% Nov 09/29 36,932 37,577
38,000 City of Toronto 2.80% Nov 22/49 37,931 38,185
38,000 City of Toronto 2.95% Apr 28/35 36,135 39,122
42,000 City of Toronto 3.20% Aug 01/48 41,894 45,881
79,000 City of Toronto 3.25% Jun 24/46 77,152 85,895
48,000 City of Toronto 3.40% May 21/24 49,408 50,518
69,000 City of Toronto 3.50% Dec 06/21 71,885 71,061
108,000 City of Toronto 3.50% Jun 02/36 108,542 118,836
66,000 City of Toronto 3.80% Dec 13/42 61,056 77,279
20,000 City of Toronto 3.90% Sep 29/23 19,943 21,308
22,000 City of Toronto 4.15% Mar 10/44 21,861 27,275
86,000 City of Toronto 4.70% Jun 10/41 100,027 112,342
83,000 City of Toronto 5.20% Jun 01/40 92,572 114,097
13,000 City of Vancouver 2.70% Dec 15/26 12,984 13,340
12,000 City of Vancouver 2.85% Nov 03/27 11,974 12,410
7,000 City of Vancouver 2.90% Nov 20/25 6,976 7,269
7,000 City of Vancouver 3.05% Oct 16/24 6,992 7,291
Schedule of InvestmentsAs at December 31, 2019

24
Tangerine Balanced Growth PortfolioAudited Annual Financial Statements for the year ended December 31, 2019(In Canadian dollars, unless otherwise indicated)
Par Value ($) Security
Average Cost ($)
Fair Value ($)
6,000 City of Vancouver 3.45% Dec 02/21 5,991 6,179
4,000 City of Vancouver 3.70% Oct 18/52 3,973 4,889
8,000 City of Vancouver 3.75% Oct 24/23 7,991 8,498
23,000 City of Winnipeg 4.10% Jun 01/45 25,485 28,303
37,000 City of Winnipeg 4.30% Nov 15/51 43,766 48,760
8,000 City of Winnipeg 5.20% Jul 17/36 9,418 10,528
3,000 City of Winnipeg 5.90% Feb 02/29 3,771 3,817
18,000 The Regional Municipality of Halton 3.15% Apr 06/45 17,938 19,175
6,000 The Regional Municipality of Halton 4.05% Oct 11/41 5,971 7,255
12,000 The Regional Municipality of Peel 2.30% Nov 02/26 11,961 11,965
31,000 The Regional Municipality of Peel 3.50% Dec 01/21 32,115 31,945
46,000 The Regional Municipality of Peel 3.85% Oct 30/42 48,790 54,482
18,000 The Regional Municipality of Peel 4.25% Dec 02/33 17,928 21,267
70,000 The Regional Municipality of Peel 5.10% Jun 29/40 79,635 95,533
54,000 The Regional Municipality of York 2.35% Jun 09/27 52,394 53,923
42,000 The Regional Municipality of York 2.50% Jun 02/26 42,189 42,525
30,000 The Regional Municipality of York 2.60% Dec 15/25 29,804 30,591
30,000 The Regional Municipality of York 2.65% Apr 18/29 29,961 30,523
38,000 The Regional Municipality of York 3.65% May 13/33 35,747 42,208
132,000 The Regional Municipality of York 4.00% Jun 30/21 139,508 136,121
32,000 The Regional Municipality of York 4.00% May 31/32 32,198 36,629
61,000 The Regional Municipality of York 4.05% May 01/34 64,517 70,894
10,000 The Regional Municipality of York 4.50% Jun 30/20 10,287 10,133
3,069,235 3,297,811
Other (6.7% of Net Assets)5,252 407 East Development Group General
Partnership 4.47% Jun 23/45 5,252 5,834 52,000 407 International Inc. 2.43% May 04/27 52,491 52,192 43,000 407 International Inc. 2.47% Sep 08/22 42,824 43,269 12,000 407 International Inc. 3.14% Mar 06/30 11,993 12,527 15,000 407 International Inc. 3.30% Mar 27/45 14,974 15,651 20,000 407 International Inc. 3.35% May 16/24 19,983 20,883 41,000 407 International Inc. 3.43% Jun 01/33 40,966 43,721 88,000 407 International Inc. 3.60% May 21/47 88,917 97,007 75,000 407 International Inc. 3.65% Sep 08/44 74,653 82,700 77,000 407 International, Inc. 3.67% Mar 08/49 80,239 86,261
107,000 407 International Inc. 3.72% May 11/48 107,000 120,515 99,000 407 International Inc. 3.83% May 11/46 101,216 112,859 51,000 407 International Inc. 3.98% Sep 11/52 50,829 60,364
46,000 407 International Inc. 4.19% Apr 25/42 47,875 54,314 40,000 407 International Inc. 4.30% May 26/21 43,152 41,028 42,000 407 International Inc. 4.45% Nov 15/41 45,361 51,342 31,000 407 International Inc. 4.68% Oct 07/53 34,742 41,320
Par Value ($) Security
Average Cost ($)
Fair Value ($)
70,000 407 International Inc. 5.75% Feb 14/36 84,326 93,556 55,000 407 International Inc. 5.96% Dec 03/35 70,645 76,485
125,000 407 International Inc. 6.47% Jul 27/29 131,369 165,943 14,741 Access Prairies Partnership 4.23%
Mar 01/48 14,741 15,893 45,878 Access Recherche Montreal LP 7.07%
Dec 31/42 67,338 65,260 50,000 Aeroports de Montreal 3.36% Apr 24/47 49,452 54,532 40,000 Aeroports de Montreal 3.92% Sep 26/42 41,275 46,911 46,000 Aeroports de Montreal 3.92% Jun 12/45 47,135 54,484 55,000 Aeroports de Montreal 5.17% Sep 17/35 58,597 71,219 20,000 Aeroports de Montreal 5.47% Apr 16/40 27,580 27,915 50,000 Aeroports de Montreal 5.67% Oct 16/37 41,048 69,288 50,000 Aeroports de Montreal 6.55% Oct 11/33 62,750 71,059 15,000 AGT Limited 8.80% Sep 22/25 22,137 19,324 71,000 AIMCo Realty Investors LP 2.27%
Jun 26/24 71,000 70,684 34,000 AIMCo Realty Investors LP 2.71%
Jun 01/29 34,000 34,142 57,000 AIMCo Realty Investors LP 3.04%
Jun 01/28 56,950 58,724 45,000 AIMCo Realty Investors LP 3.37%
Jun 01/27 45,000 47,379 82,241 Alberta Powerline LP 4.07% Dec 01/53 82,790 93,153
79,000 Alberta Powerline LP 4.07% Mar 01/54 79,474 89,363 115,000 Alectra Inc. 2.49% May 17/27 113,219 115,572 35,000 Alectra Inc. 3.03% Jul 25/22 35,043 35,830 24,000 Alectra Inc. 3.24% Nov 21/24 24,000 25,036 17,000 Alectra Inc. 3.46% Apr 12/49 17,000 18,551
40,000 Alectra Inc. 3.96% Jul 30/42 40,530 46,395 10,000 Alectra Inc. 4.52% Apr 29/21 10,000 10,320 14,000 Alectra Inc. 5.30% Apr 29/41 14,000 19,061 17,000 Algonquin Power Co. 4.09% Feb 17/27 16,988 17,996
68,000 Algonquin Power Co. 4.60% Jan 29/29 67,967 74,178 16,000 Algonquin Power Co. 4.65% Feb 15/22 15,977 16,745 30,000 Algonquin Power Co. 4.82% Feb 15/21 29,982 30,829 112,000 Alimentation Couche-Tard Inc. 3.06%
Jul 26/24 110,614 113,405 108,000 Alimentation Couche-Tard Inc. 3.60%
Jun 02/25 107,572 111,616 25,000 Alimentation Couche-Tard Inc. 3.90%
Nov 01/22 26,711 26,034 25,000 Alimentation Couche-Tard Inc. 4.21%
Aug 21/20 25,000 25,309 49,000 Allied Properties Real Estate Investment
Trust 3.11% Apr 08/27 49,000 48,795 33,000 Allied Properties Real Estate Investment
Trust 3.39% Aug 15/29 33,000 32,862 54,000 Allied Properties Real Estate Investment
Trust 3.64% Apr 21/25 54,000 55,879 38,000 Allied Properties Real Estate Investment
Trust 3.93% Nov 14/22 38,000 39,507 37,000 AltaGas Canada Inc. 3.15% Apr 06/26 36,998 37,722 44,000 AltaGas Canada Inc. 4.26% Dec 05/28 43,968 48,008 65,000 AltaGas, Ltd. 2.61% Dec 16/22 65,110 65,184 42,000 AltaGas, Ltd. 3.57% Jun 12/23 42,149 43,207 65,000 AltaGas, Ltd. 3.72% Sep 28/21 64,979 66,544 52,000 AltaGas, Ltd. 3.84% Jan 15/25 53,335 54,133 12,000 AltaGas, Ltd. 3.98% Oct 04/27 11,995 12,558 15,000 AltaGas, Ltd. 4.07% Jun 01/20 15,225 15,110
Schedule of InvestmentsAs at December 31, 2019

25
Tangerine Balanced Growth PortfolioAudited Annual Financial Statements for the year ended December 31, 2019(In Canadian dollars, unless otherwise indicated)
Par Value ($) Security
Average Cost ($)
Fair Value ($)
68,000 AltaGas, Ltd. 4.12% Apr 07/26 71,184 71,810 28,000 AltaGas, Ltd. 4.40% Mar 15/24 28,823 29,718 47,000 AltaGas, Ltd. 4.50% Aug 15/44 45,831 48,751 28,000 AltaGas, Ltd. 4.99% Oct 04/47 28,000 31,493 21,000 AltaGas, Ltd. 5.16% Jan 13/44 23,717 23,766 51,000 AltaLink Investments LP 2.24% Mar 07/22 51,000 51,139 12,000 AltaLink Investments LP 3.27% Jun 05/20 11,999 12,023
64,000 AltaLink, LP 2.75% May 29/26 64,130 65,816 45,000 AltaLink, LP 2.98% Nov 28/22 45,001 46,114 66,000 AltaLink, LP 3.40% Jun 06/24 66,509 69,182 10,000 AltaLink, LP 3.62% Sep 17/20 10,000 10,111 77,000 AltaLink, LP 3.67% Nov 06/23 78,687 81,372 75,000 AltaLink, LP 3.72% Dec 03/46 75,132 85,364
101,000 AltaLink, LP 3.99% Jun 30/42 108,603 118,038 39,000 AltaLink, LP 4.05% Nov 21/44 39,647 46,292 39,000 AltaLink, LP 4.09% Jun 30/45 39,000 46,689
6,000 AltaLink, LP 4.27% Jun 06/64 6,000 7,821 35,000 AltaLink, LP 4.45% Jul 11/53 38,912 45,748 37,000 AltaLink, LP 4.46% Nov 08/41 40,550 45,868 33,000 AltaLink, LP 4.87% Nov 15/40 36,812 42,672 89,000 AltaLink, LP 4.92% Sep 17/43 93,290 118,351 15,000 AltaLink, LP 5.38% Mar 26/40 15,000 20,474 15,769 Arrow Lakes Power 5.52% Apr 05/41 15,769 19,166 17,000 Artis Real Estate Investment Trust
3.67% Feb 22/21 17,000 17,186 556,000 Bank of Montreal 1.61% Oct 28/21 548,360 551,335 326,000 Bank of Montreal 1.88% Mar 31/21 324,802 325,376 100,000 Bank of Montreal 2.10% Oct 06/20 100,109 100,091 216,000 Bank of Montreal 2.12% Mar 16/22 216,272 215,985 295,000 Bank of Montreal 2.27% Jul 11/22 294,404 295,896 278,000 Bank of Montreal 2.28% Jul 29/24 277,883 275,476 90,000 Bank of Montreal 2.57% Jun 01/27 88,029 90,343
248,000 Bank of Montreal 2.70% Sep 11/24 247,968 252,709 139,000 Bank of Montreal 2.70% Dec 09/26 138,792 141,972 333,000 Bank of Montreal 2.85% Mar 06/24 332,923 338,070
70,000 Bank of Montreal 2.88% Sep 17/29 69,994 70,075 281,000 Bank of Montreal 2.89% Jun 20/23 280,949 287,367
444,000 Bank of Montreal 3.19% Mar 01/28 442,079 468,545 140,000 Bank of Montreal 3.32% Jun 01/26 141,781 142,027 100,000 Bank of Montreal 3.34% Dec 08/25 101,490 100,999 207,000 Bank of Montreal 3.40% Apr 23/21 213,628 210,600 98,000 Bank of Montreal 4.61% Sep 10/25 104,225 109,859
11,553 Bankers Hall LP 4.38% Nov 20/23 11,554 11,795 69,000 bcIMC Realty Corporation 2.10%
Jun 03/21 68,973 69,055 47,000 bcIMC Realty Corporation 2.15%
Aug 11/22 46,986 47,048 80,000 bcIMC Realty Corporation 2.84%
Jun 03/25 79,958 81,801 37,000 bcIMC Realty Corporation 3.00%
Mar 31/27 37,000 38,186 28,000 bcIMC Realty Corporation 3.51%
Jun 29/22 30,064 28,953 141,000 Bell Canada 2.00% Oct 01/21 140,724 140,569 149,000 Bell Canada 2.70% Feb 27/24 148,898 149,850
81,000 Bell Canada 2.75% Jan 29/25 80,834 81,286 140,000 Bell Canada 2.90% Aug 12/26 139,626 140,474 52,000 Bell Canada 2.90% Sep 10/29 51,933 51,035
Par Value ($) Security
Average Cost ($)
Fair Value ($)
241,000 Bell Canada 3.00% Oct 03/22 242,831 245,295 101,000 Bell Canada 3.15% Sep 29/21 101,016 102,569 160,000 Bell Canada 3.35% Mar 22/23 155,479 164,389 69,000 Bell Canada 3.35% Mar 12/25 68,897 71,147 118,000 Bell Canada 3.55% Mar 02/26 117,929 122,705 118,000 Bell Canada 3.60% Sep 29/27 118,995 122,992 167,000 Bell Canada 3.80% Aug 21/28 165,937 176,396 79,000 Bell Canada 4.35% Dec 18/45 78,516 85,959 74,000 Bell Canada 4.45% Feb 27/47 74,063 81,893 96,000 Bell Canada 4.70% Sep 11/23 101,973 102,968 85,000 Bell Canada 4.75% Sep 29/44 86,033 97,455 82,000 Bell Canada 4.95% May 19/21 91,172 85,042 60,000 Bell Canada 6.10% Mar 16/35 62,637 76,864 25,000 Bell Canada 6.17% Feb 26/37 30,069 32,458 10,000 Bell Canada 6.55% May 01/29 12,487 12,605 27,000 Bell Canada 7.30% Feb 23/32 31,061 36,743 25,000 Bell Canada 7.65% Dec 30/31 31,881 34,125 75,000 Bell Canada 7.85% Apr 02/31 98,575 105,231 15,000 Blackbird Infrastructure 407 GP 3.76%
Jun 30/47 15,000 15,886 23,000 BMW Canada Inc. 1.78% Oct 19/20 22,993 22,956 44,000 BMW Canada Inc. 1.83% Jun 15/21 43,353 43,788 80,000 BMW Canada Inc. 1.88% Dec 11/20 80,014 79,881 37,000 BMW Canada Inc. 2.15% Nov 26/21 36,997 36,972 26,000 BMW Canada Inc. 2.41% Nov 27/23 25,994 25,949 41,000 BMW Canada Inc. 2.57% Aug 06/21 40,988 41,248 31,000 BMW Canada Inc. 2.80% Jan 28/21 30,995 31,227
764 Borealis Infrastructure Trust 6.35% Dec 01/20 782 782
30,000 Bow Centre Street LP 3.80% Jun 13/23 29,106 29,933 21,000 Bridging North America General
Partnership 4.02% May 31/38 21,242 21,913 17,000 Bridging North America General
Partnership 4.34% Aug 31/53 17,599 19,004 9,000 British Columbia Ferry Services Inc.
2.79% Oct 15/49 9,000 8,771 32,000 British Columbia Ferry Services Inc.
4.29% Apr 28/44 32,000 39,342 13,000 British Columbia Ferry Services Inc.
4.70% Oct 23/43 13,179 16,828 45,000 British Columbia Ferry Services Inc.
5.02% Mar 20/37 50,570 57,748 40,000 British Columbia Ferry Services Inc.
5.58% Jan 11/38 46,560 54,708 40,000 British Columbia Ferry Services Inc.
6.25% Oct 13/34 51,214 56,048 68,000 Brookfield Asset Management Inc.
3.80% Mar 16/27 67,977 70,957 90,000 Brookfield Asset Management Inc.
4.54% Mar 31/23 92,901 95,621 130,000 Brookfield Asset Management Inc.
4.82% Jan 28/26 133,639 142,566 28,000 Brookfield Asset Management Inc.
5.04% Mar 08/24 27,989 30,388 35,000 Brookfield Asset Management Inc.
5.30% Mar 01/21 38,413 36,208 62,000 Brookfield Asset Management Inc.
5.95% Jun 14/35 68,968 75,779 100,000 Brookfield Infrastructure Finance ULC
3.32% Feb 22/24 101,003 101,945
Schedule of InvestmentsAs at December 31, 2019

26
Tangerine Balanced Growth PortfolioAudited Annual Financial Statements for the year ended December 31, 2019(In Canadian dollars, unless otherwise indicated)
Par Value ($) Security
Average Cost ($)
Fair Value ($)
147,000 Brookfield Infrastructure Finance ULC 3.41% Oct 09/29 147,000 145,082
42,000 Brookfield Infrastructure Finance ULC 3.45% Mar 11/22 42,000 42,942
119,000 Brookfield Infrastructure Finance ULC 4.19% Sep 11/28 119,000 125,098
14,000 Brookfield Property Finance ULC 4.12% Oct 19/21 14,000 14,383
93,000 Brookfield Property Finance ULC 4.30% Mar 01/24 93,552 96,442
81,000 Brookfield Property Finance ULC 4.35% Jul 03/23 80,961 84,125
54,000 Brookfield Renewable Energy Partners ULC 3.75% Jun 02/25 54,596 56,472
154,000 Brookfield Renewable Energy Partners ULC 4.79% Feb 07/22 162,432 161,715
12,000 Brookfield Renewable Energy Partners ULC 5.84% Nov 05/36 11,350 14,751
20,000 Brookfield Renewable Partners ULC 3.38% Jan 15/30 19,995 20,066
63,000 Brookfield Renewable Partners ULC 3.63% Jan 15/27 64,909 65,309
84,000 Brookfield Renewable Partners ULC 4.25% Jan 15/29 83,949 90,272
44,000 Brookfield Renewable Partners ULC 4.29% Nov 05/49 43,928 44,635
82,000 Bruce Power LP 2.84% Jun 23/21 82,265 82,697 64,000 Bruce Power LP 3.00% Jun 21/24 63,993 64,964 98,000 Bruce Power LP 3.97% Jun 23/26 98,461 103,621 70,000 Bruce Power LP 4.01% Jun 21/29 70,003 73,776 68,000 Bruce Power LP 4.13% Jun 21/33 67,996 71,996 24,000 Bruce Power LP 4.75% Jun 21/49 23,998 26,827
5,000 Business Development Bank of Canada 4.35% Feb 28/22 5,687 5,254
50,000 Cadillac Fairview Finance Trust 4.31% Jan 25/21 51,793 51,251
207,000 Caisse Centrale Desjardins 1.75% Mar 02/20 205,942 206,942
35,000 Cameco Corporation 3.75% Nov 14/22 34,997 35,762 60,000 Cameco Corporation 4.19% Jun 24/24 60,070 62,034 35,000 Canada Post Corporation 4.08%
Jul 16/25 37,299 38,716 14,000 Canada Post Corporation 4.36%
Jul 16/40 14,021 18,500 293,000 Canadian Imperial Bank of Commerce
1.64% Jul 12/21 291,079 291,105 316,000 Canadian Imperial Bank of Commerce
1.90% Apr 26/21 313,872 315,359 202,000 Canadian Imperial Bank of Commerce
2.04% Mar 21/22 203,078 201,658 317,000 Canadian Imperial Bank of Commerce
2.30% Jul 11/22 316,984 318,056 208,000 Canadian Imperial Bank of Commerce
2.35% Aug 28/24 208,000 206,378 185,000 Canadian Imperial Bank of Commerce
2.43% Jun 09/23 184,950 185,298 170,000 Canadian Imperial Bank of Commerce
2.47% Dec 05/22 168,850 171,352 126,000 Canadian Imperial Bank of Commerce
2.90% Sep 14/21 125,996 127,694
Par Value ($) Security
Average Cost ($)
Fair Value ($)
168,000 Canadian Imperial Bank of Commerce 2.95% Jun 19/29 167,992 168,712
262,000 Canadian Imperial Bank of Commerce 2.97% Jul 11/23 261,126 268,598
107,000 Canadian Imperial Bank of Commerce 3.29% Jan 15/24 106,985 110,373
335,000 Canadian Imperial Bank of Commerce 3.30% May 26/25 338,595 351,620
100,000 Canadian Imperial Bank of Commerce 3.42% Jan 26/26 101,630 101,220
123,000 Canadian Imperial Bank of Commerce 3.45% Apr 04/28 122,961 126,168
20,000 Canadian National Railway Company 2.75% Feb 18/21 19,869 20,135
24,000 Canadian National Railway Company 2.80% Sep 22/25 23,923 24,637
42,000 Canadian National Railway Company 3.00% Feb 08/29 41,806 43,422
128,000 Canadian National Railway Company 3.05% Feb 08/50 126,936 127,495
73,000 Canadian National Railway Company 3.20% Jul 31/28 72,666 76,647
113,000 Canadian National Railway Company 3.60% Aug 01/47 112,261 123,841
62,000 Canadian National Railway Company 3.60% Jul 31/48 61,356 67,950
52,000 Canadian National Railway Company 3.60% Feb 08/49 51,575 57,093
42,000 Canadian National Railway Company 3.95% Sep 22/45 42,425 48,370
152,000 Canadian Natural Resources, Ltd. 2.89% Aug 14/20 153,163 152,630
139,000 Canadian Natural Resources, Ltd. 3.31% Feb 11/22 138,979 141,747
87,000 Canadian Natural Resources, Ltd. 3.42% Dec 01/26 87,000 88,992
66,000 Canadian Natural Resources, Ltd. 3.55% Jun 03/24 65,758 68,032
42,000 Canadian Natural Resources, Ltd. 4.85% May 30/47 42,348 48,882
83,000 Canadian Pacific Railway Company 3.15% Mar 13/29 82,823 84,907
6,000 Canadian Pacific Railway Company 5.10% Jan 14/22 5,983 6,327
45,000 Canadian Pacific Railway Company 6.45% Nov 17/39 56,400 65,335
13,566 Canadian Pacific Railway Company 6.91% Oct 01/24 16,194 15,122
31,000 Canadian Tire Corporation, Limited 2.65% Jul 06/20 31,000 31,070
82,000 Canadian Tire Corporation, Limited 3.17% Jul 06/23 81,856 83,718
38,000 Canadian Tire Corporation, Limited 6.45% Feb 24/34 45,133 49,140
100,000 Canadian Utilities Limited 3.12% Nov 09/22 97,750 102,827
30,000 Canadian Western Bank 2.38% Jan 23/20 30,000 30,003 35,000 Canadian Western Bank 2.60% Sep 06/24 35,000 34,769 54,000 Canadian Western Bank 2.74% Jun 16/22 54,126 54,377 69,000 Canadian Western Bank 2.75% Jun 29/20 69,565 69,233 78,000 Canadian Western Bank 2.79% Sep 13/21 77,378 78,607 22,000 Canadian Western Bank 2.83% Mar 14/22 22,000 22,212
Schedule of InvestmentsAs at December 31, 2019

27
Tangerine Balanced Growth PortfolioAudited Annual Financial Statements for the year ended December 31, 2019(In Canadian dollars, unless otherwise indicated)
Par Value ($) Security
Average Cost ($)
Fair Value ($)
35,000 Canadian Western Bank 2.88% Mar 01/21 34,999 35,259 58,000 Canadian Western Bank 2.92% Dec 15/22 58,000 58,682 51,000 Canadian Western Bank 3.67% Jun 11/29 51,000 51,078 38,996 Capital City Link General Partnership
4.39% Mar 31/46 39,704 44,063 85,000 Capital Desjardins Inc. 4.95% Dec 15/26 92,374 89,232 58,000 Capital Power Corporation 4.28%
Sep 18/24 58,000 60,579 33,000 Capital Power Corporation 4.42%
Feb 08/30 32,994 33,562 42,000 Capital Power Corporation 4.99%
Jan 23/26 42,000 45,008 30,000 Capital Power Corporation 5.28%
Nov 16/20 30,928 30,758 96,000 CARDS II Trust 2.16% Oct 16/23 96,000 96,075
104,800 CARDS II Trust Series 2019-2 Cl. A 2.43% Nov 15/24 104,800 104,947
26,000 Caterpillar Financial Services Limited 1.50% Jun 08/20 25,971 25,947
62,000 Caterpillar Financial Services Limited 2.80% Jun 08/21 61,973 62,558
125,000 CDP Financial Inc. 4.60% Jul 15/20 138,808 126,795 93,000 Central 1 Credit Union 1.87% Mar 16/20 92,976 92,965 68,000 Central 1 Credit Union 2.58% Dec 06/23 68,000 67,866 53,000 Central 1 Credit Union 2.60% Nov 07/22 52,980 53,188 22,000 Central 1 Credit Union 3.06% Oct 14/26 21,991 22,191
5,000 Centre Hospitalier de l'Universite de Montreal 4.45% Oct 01/49 5,000 6,407
35,000 Chartwell Retirement Residences 3.79% Dec 11/23 35,000 36,094
22,000 Chartwell Retirement Residences 4.21% Apr 28/25 22,000 23,073
11,000 CHIP Mortgage Trust 2.98% Nov 15/41 11,000 11,080 50,000 Choice Properties Limited Partnership
3.60% Apr 20/20 51,085 50,033 25,000 Choice Properties Limited Partnership
3.60% Sep 20/21 26,474 25,453 40,000 Choice Properties Limited Partnership
3.60% Sep 20/22 41,356 41,064 48,000 Choice Properties Real Estate
Investment Trust 2.30% Sep 14/20 47,539 48,027 14,000 Choice Properties Real Estate
Investment Trust 2.95% Jan 18/23 14,000 14,149 38,000 Choice Properties Real Estate
Investment Trust 3.01% Mar 21/22 37,994 38,504 44,000 Choice Properties Real Estate
Investment Trust 3.20% Mar 07/23 44,000 44,800 15,000 Choice Properties Real Estate
Investment Trust 3.50% Feb 08/21 15,000 15,196 82,000 Choice Properties Real Estate
Investment Trust 3.53% Jun 11/29 82,000 83,013 47,000 Choice Properties Real Estate
Investment Trust 3.55% Jan 10/25 47,000 48,342 83,000 Choice Properties Real Estate
Investment Trust 3.56% Sep 09/24 82,515 85,468 33,000 Choice Properties Real Estate
Investment Trust 4.06% Nov 24/25 32,961 34,791 109,000 Choice Properties Real Estate
Investment Trust 4.18% Mar 08/28 109,415 115,718 30,000 Choice Properties Real Estate
Investment Trust 4.29% Feb 08/24 30,000 31,664
Par Value ($) Security
Average Cost ($)
Fair Value ($)
5,000 Choice Properties Real Estate Investment Trust 4.32% Jan 15/21 5,000 5,105
9,000 Choice Properties Real Estate Investment Trust 4.90% Jul 05/23 9,000 9,630
13,000 Choice Properties Real Estate Investment Trust 5.27% Mar 07/46 13,000 15,288
76,000 CI Financial Corp. 2.65% Dec 07/20 76,000 76,229 36,000 CI Financial Corp. 2.78% Nov 25/21 36,000 36,193 35,000 CI Financial Corp. 3.22% Jul 22/24 35,000 34,933 46,000 CI Financial Corp. 3.52% Jul 20/23 46,000 46,816 59,000 CI Financial Corp. 3.90% Sep 27/27 59,000 59,746 20,000 CIBC Capital Trust 10.25% Jun 30/2108 28,809 23,047 22,759 Clover Limited Partnership 4.22%
Mar 31/34 22,759 23,798 28,549 Clover Limited Partnership 4.22%
Jun 30/34 28,549 29,876 12,000 Coast Capital Savings Credit Union
5.00% May 03/28 12,000 12,488 18,000 Coast Capital Savings Credit Union
5.25% Oct 29/30 18,000 19,278 25,000 Cogeco Communications Inc. 4.18%
May 26/23 25,018 26,045 10,000 Cogeco Communications Inc. 4.93%
Feb 14/22 10,004 10,470 8,000 Cogeco Communications Inc. 5.15%
Nov 16/20 7,985 8,188 30,000 Cominar Real Estate Investment Trust
4.16% Jun 01/22 30,000 30,749 20,000 Cominar Real Estate Investment Trust
4.25% Dec 08/21 20,000 20,490 27,000 Cominar Real Estate Investment Trust
4.25% May 23/23 27,000 27,837 11,000 Cominar Real Estate Investment Trust
4.94% Jul 27/20 11,142 11,150 67,562 Cordelio Amalco GP I 4.09% Jun 30/34 67,562 70,638 67,020 Cordelio Amalco GP I 4.09% Sep 30/34 67,020 70,003
196,000 CPPIB Capital Inc. 1.95% Sep 30/29 195,257 190,503 264,000 CPPIB Capital Inc. 3.00% Jun 15/28 264,000 278,856
34,000 Crombie Real Estate Investment Trust 3.68% Aug 26/26 34,000 33,946
33,000 Crombie Real Estate Investment Trust 3.92% Jun 21/27 33,000 33,162
10,000 Crombie Real Estate Investment Trust 3.96% Jun 01/21 10,039 10,200
24,000 Crombie Real Estate Investment Trust 4.07% Nov 21/22 24,000 24,797
34,000 Crombie Real Estate Investment Trust 4.80% Jan 31/25 33,999 36,226
14,000 Crosslinx Transit Solutions General Partnership 4.56% Jun 30/51 13,758 14,838
43,000 Crosslinx Transit Solutions General Partnership 4.65% Sep 30/46 42,892 46,202
16,000 CT Real Estate Investment Trust 2.16% Jun 01/21 16,000 15,986
14,000 CT Real Estate Investment Trust 2.85% Jun 09/22 14,000 14,152
22,000 CT Real Estate Investment Trust 3.29% Jun 01/26 22,000 22,332
14,000 CT Real Estate Investment Trust 3.47% Jun 16/27 14,000 14,268
Schedule of InvestmentsAs at December 31, 2019

28
Tangerine Balanced Growth PortfolioAudited Annual Financial Statements for the year ended December 31, 2019(In Canadian dollars, unless otherwise indicated)
Par Value ($) Security
Average Cost ($)
Fair Value ($)
24,000 CT Real Estate Investment Trust 3.53% Jun 09/25 24,000 24,737
30,000 CT Real Estate Investment Trust 3.87% Dec 07/27 29,580 31,255
110,000 CU Inc. 2.96% Sep 07/49 110,000 108,216 103,000 CU Inc. 3.55% Nov 22/47 103,000 112,438 73,000 CU Inc. 3.76% Nov 19/46 72,967 82,459 65,000 CU Inc. 3.81% Sep 10/42 65,403 72,942 10,000 CU Inc. 3.83% Sep 11/62 10,000 11,626 40,000 CU Inc. 3.86% Nov 14/52 38,036 46,372 83,000 CU Inc. 3.95% Nov 23/48 83,000 97,073 64,000 CU Inc. 3.96% Jul 27/45 67,072 74,267
154,000 CU Inc. 4.09% Sep 02/44 160,254 181,074 36,000 CU Inc. 4.21% Oct 29/55 39,302 44,530 75,000 CU Inc. 4.54% Oct 24/41 80,011 92,691 17,000 CU Inc. 4.56% Nov 07/53 17,544 22,188 21,000 CU Inc. 4.59% Oct 24/61 22,644 28,263 83,000 CU Inc. 4.72% Sep 09/43 88,375 106,140 70,000 CU Inc. 4.80% Nov 22/21 80,198 73,488 6,000 CU Inc. 4.95% Nov 18/50 5,870 8,236
45,000 CU Inc. 5.03% Nov 20/36 48,060 57,257 50,000 CU Inc. 5.18% Nov 21/35 58,688 64,124 40,000 CU Inc. 5.56% May 26/28 37,381 48,941 47,000 CU Inc. 5.56% Oct 30/37 55,556 63,516 15,000 CU Inc. 5.58% May 26/38 16,878 20,421 15,000 CU Inc. 5.90% Nov 20/34 18,505 20,397
40,000 CU Inc. 6.50% Mar 07/39 60,672 59,851 12,000 CU Inc. 9.92% Apr 01/22 18,675 13,979 59,000 Daimler Canada Finance Inc. 1.91%
Jul 08/21 58,983 58,636 44,000 Daimler Canada Finance Inc. 2.23%
Dec 16/21 43,996 43,856 53,000 Daimler Canada Finance Inc. 2.30%
Nov 23/20 53,000 53,062 83,000 Daimler Canada Finance Inc. 2.54%
Aug 21/23 82,993 82,566 81,000 Daimler Canada Finance Inc. 2.57%
Nov 22/22 80,993 80,993 18,000 Daimler Canada Finance Inc. 2.97%
Mar 13/24 17,997 18,141 61,000 Daimler Canada Finance Inc. 3.05%
May 16/22 60,991 61,818 22,000 Daimler Canada Finance Inc. 3.30%
Aug 16/22 21,993 22,424 12,000 Dollarama Inc. 2.20% Nov 10/22 12,000 11,933 62,000 Dollarama Inc. 2.34% Jul 22/21 62,202 62,054
142,000 Dollarama Inc. 3.55% Nov 06/23 141,343 146,411 15,000 Dream Office Real Estate Investment
Trust 4.07% Jan 21/20 15,003 15,009 39,000 Eagle Credit Card Trust 2.22% Jul 17/24 39,000 38,724 33,000 Eagle Credit Card Trust 2.63% Oct 17/22 33,000 33,299 45,000 Eagle Credit Card Trust Series A 3.04%
Jul 17/23 45,000 46,045 50,000 Emera Incorporated 2.90% Jun 16/23 51,050 50,562 30,000 Enbridge Gas Inc. 2.37% Aug 09/29 29,990 29,597 32,000 Enbridge Gas Inc. 2.50% Aug 05/26 32,119 32,261 20,000 Enbridge Gas Inc. 2.76% Jun 02/21 19,994 20,182 50,000 Enbridge Gas Inc. 2.81% Jun 01/26 50,000 51,304 90,000 Enbridge Gas Inc. 2.88% Nov 22/27 89,938 92,596
Par Value ($) Security
Average Cost ($)
Fair Value ($)
22,000 Enbridge Gas Inc. 3.01% Aug 09/49 22,000 21,857 35,000 Enbridge Gas Inc. 3.15% Aug 22/24 34,815 36,341 20,000 Enbridge Gas Inc. 3.19% Sep 17/25 19,991 20,936 66,000 Enbridge Gas Inc. 3.31% Sep 11/25 65,861 69,496 86,000 Enbridge Gas Inc. 3.51% Nov 29/47 86,000 93,465 26,000 Enbridge Gas Inc. 3.59% Nov 22/47 25,957 28,586 37,000 Enbridge Gas Inc. 3.79% Jul 10/23 38,998 38,890 49,000 Enbridge Gas Inc. 3.80% Jun 01/46 48,974 55,530 41,000 Enbridge Gas Inc. 4.00% Aug 22/44 39,289 47,534 33,000 Enbridge Gas Inc. 4.04% Nov 23/20 34,600 33,588 91,000 Enbridge Gas Inc. 4.20% Jun 02/44 94,156 108,583 38,000 Enbridge Gas Inc. 4.50% Nov 23/43 40,549 47,171 20,000 Enbridge Gas Inc. 4.77% Dec 17/21 18,816 21,033 14,000 Enbridge Gas Inc. 4.85% Apr 25/22 16,093 14,870 48,000 Enbridge Gas Inc. 4.88% Jun 21/41 52,996 61,578 31,000 Enbridge Gas Inc. 4.95% Nov 22/50 35,138 42,658 26,000 Enbridge Gas Inc. 5.20% Jul 23/40 29,531 34,473 55,000 Enbridge Gas Inc. 5.21% Feb 25/36 62,621 70,414 20,000 Enbridge Gas Inc. 5.46% Sep 11/36 24,090 26,383 40,000 Enbridge Gas Inc. 6.05% Sep 02/38 51,187 57,090 20,000 Enbridge Gas Inc. 6.10% May 19/28 23,386 24,881 15,000 Enbridge Gas Inc. 6.16% Dec 16/33 18,743 20,550 25,000 Enbridge Gas Inc. 6.65% Nov 03/27 32,759 31,866 20,000 Enbridge Gas Inc. 6.90% Nov 15/32 27,130 28,288
205,000 Enbridge Inc. 2.99% Oct 03/29 204,859 202,305 80,000 Enbridge Inc. 3.16% Mar 11/21 81,831 80,781
102,000 Enbridge Inc. 3.19% Dec 05/22 104,066 104,276 117,000 Enbridge Inc. 3.20% Jun 08/27 116,951 119,091 30,000 Enbridge Inc. 3.94% Jan 13/23 30,753 31,299 97,000 Enbridge Inc. 3.94% Jun 30/23 99,461 101,266 93,000 Enbridge Inc. 3.95% Nov 19/24 95,123 98,185
100,000 Enbridge Inc. 4.24% Aug 27/42 95,618 104,357 47,000 Enbridge Inc. 4.26% Feb 01/21 49,129 48,010 50,000 Enbridge Inc. 4.53% Mar 09/20 49,992 50,210 12,000 Enbridge Inc. 4.56% Mar 28/64 11,991 13,011 117,000 Enbridge Inc. 4.57% Mar 11/44 118,247 128,203 15,000 Enbridge Inc. 4.85% Feb 22/22 15,735 15,790 24,000 Enbridge Inc. 4.87% Nov 21/44 24,230 27,408 29,000 Enbridge Inc. 5.12% Sep 28/40 31,834 33,706
193,000 Enbridge Inc. 5.38% Sep 27/77 192,454 193,644 25,000 Enbridge Inc. 5.57% Nov 14/35 28,823 30,032 36,000 Enbridge Inc. 5.75% Sep 02/39 40,203 44,758 99,000 Enbridge Inc. 6.63% Apr 12/78 99,000 107,425 21,000 Enbridge Inc. 7.20% Jun 18/32 28,187 28,042 10,000 Enbridge Inc. 7.22% Jul 24/30 12,622 13,146 70,000 Enbridge Pipelines Inc. 3.00% Aug 10/26 69,994 71,424
100,000 Enbridge Pipelines Inc. 3.45% Sep 29/25 100,901 104,576 85,000 Enbridge Pipelines Inc. 3.52% Feb 22/29 84,964 89,440
8,000 Enbridge Pipelines Inc. 3.79% Aug 17/23 7,997 8,378 67,000 Enbridge Pipelines Inc. 4.13% Aug 09/46 68,040 72,365 46,000 Enbridge Pipelines Inc. 4.33% Feb 22/49 45,985 51,567 80,000 Enbridge Pipelines Inc. 4.45% Apr 06/20 81,306 80,474 43,000 Enbridge Pipelines Inc. 4.55% Aug 17/43 44,606 48,984 48,000 Enbridge Pipelines Inc. 4.55% Sep 29/45 47,415 55,057 20,000 Enbridge Pipelines Inc. 5.08% Dec 19/36 22,340 23,789 50,000 Enbridge Pipelines Inc. 5.33% Apr 06/40 54,322 61,887 43,000 Enbridge Pipelines Inc. 5.35% Nov 10/39 48,429 53,332 29,000 Enbridge Pipelines Inc. 6.35% Nov 17/23 36,935 33,037
Schedule of InvestmentsAs at December 31, 2019

29
Tangerine Balanced Growth PortfolioAudited Annual Financial Statements for the year ended December 31, 2019(In Canadian dollars, unless otherwise indicated)
Par Value ($) Security
Average Cost ($)
Fair Value ($)
25,000 Enbridge Pipelines Inc. 8.20% Feb 15/24 35,456 30,237 51,000 ENMAX Corporation 2.92% Oct 18/22 51,000 51,513 61,000 ENMAX Corporation 3.33% Jun 02/25 60,998 61,809 28,000 ENMAX Corporation 3.81% Dec 05/24 28,000 29,041 22,000 ENMAX Corporation 3.84% Jun 05/28 22,000 22,547 60,000 ENMAX Corporation 3.88% Oct 18/29 60,000 61,142 13,000 EPCOR Utilities Inc. 1.95% Jul 08/22 13,000 12,967 38,000 EPCOR Utilities Inc. 3.11% Jul 08/49 38,000 38,341 70,000 EPCOR Utilities Inc. 3.55% Nov 27/47 70,000 76,377 47,000 EPCOR Utilities Inc. 3.95% Nov 26/48 47,000 54,840 52,000 EPCOR Utilities Inc. 4.55% Feb 28/42 55,280 64,455 40,000 EPCOR Utilities Inc. 5.65% Nov 16/35 50,102 53,282 10,000 EPCOR Utilities Inc. 5.75% Nov 24/39 10,555 13,974 27,000 EPCOR Utilities Inc. 6.65% Apr 15/38 31,982 40,604 13,000 Equitable Bank 2.95% Sep 26/22 13,000 13,057 34,000 Equitable Bank 3.20% Apr 16/21 34,000 34,269 75,000 Fair Hydro Trust 3.36% May 15/35 75,002 80,804 63,000 Fair Hydro Trust 3.52% May 15/38 63,001 70,110
102,000 Fairfax Financial Holdings Limited 4.23% Jun 14/29 101,951 103,725
148,000 Fairfax Financial Holdings Limited 4.25% Dec 06/27 147,988 152,546
82,000 Fairfax Financial Holdings Limited 4.50% Mar 22/23 81,533 86,484
67,000 Fairfax Financial Holdings Limited 4.70% Dec 16/26 67,559 71,273
20,000 Fairfax Financial Holdings Limited 4.95% Mar 03/25 19,823 21,627
82,000 Fairfax Financial Holdings Limited 5.84% Oct 14/22 83,020 88,976
18,000 Farm Credit Canada 4.55% Apr 12/21 20,021 18,610 35,000 Federated Co-operatives Limited 3.92%
Jun 17/25 35,672 36,207 127,000 Federation des Caisses Desjardins du
Quebec 2.09% Jan 17/22 127,246 126,967 111,000 Federation des Caisses Desjardins du
Quebec 2.39% Aug 25/22 110,556 111,646 70,000 Federation des Caisses Desjardins du
Quebec 2.42% Oct 04/24 70,000 69,626 127,000 Federation des Caisses Desjardins du
Quebec 3.06% Sep 11/23 127,000 130,632 18,288 Fifth Avenue LP 4.71% Aug 05/21 20,098 18,661
230,000 Financement-Quebec 5.25% Jun 01/34 280,341 304,721 42,000 Finning International Inc. 2.63% Aug 14/26 42,000 41,208 14,000 Finning International Inc. 2.84% Sep 29/21 14,000 14,116 8,000 Finning International Inc. 5.08% Jun 13/42 8,000 9,776
14,000 First Capital Realty Inc. 3.46% Jan 22/27 14,000 13,967 52,000 First Capital Realty Inc. 3.60% May 06/26 53,161 52,696 22,000 First Capital Realty Inc. 3.75% Jul 12/27 22,000 22,269
125,000 First Capital Realty Inc. 3.90% Oct 30/23 126,654 129,743 25,000 First Capital Realty Inc. 4.32% Jul 31/25 25,968 26,368 14,000 First Capital Realty Inc. 4.43% Jan 31/22 13,962 14,536 9,000 First Capital Realty Inc. 4.50% Mar 01/21 9,035 9,213
31,000 First Capital Realty Inc. 4.79% Aug 30/24 33,702 33,328 37,000 First National Financial Corporation
3.58% Nov 25/24 37,000 36,983 19,000 First National Financial Corporation
4.01% Apr 09/20 18,992 19,077 54,988 First Nations ETF LP 4.14% Dec 31/41 54,988 58,343
Par Value ($) Security
Average Cost ($)
Fair Value ($)
31,000 First Nations Finance Authority 3.05% Jun 01/28 30,542 32,424
12,000 First Nations Finance Authority 3.40% Jun 26/24 12,659 12,637
88,000 Ford Credit Canada Company 2.45% May 07/20 87,200 87,990
113,000 Ford Credit Canada Company 2.58% May 10/21 113,000 112,500
99,000 Ford Credit Canada Company 2.71% Feb 23/22 99,000 97,924
44,000 Ford Credit Canada Company 2.77% Jun 22/22 44,000 43,387
93,000 Ford Credit Canada Company 2.92% Sep 16/20 93,812 93,171
45,000 Ford Credit Canada Company 3.28% Jul 02/21 46,025 45,186
106,000 Ford Credit Canada Company 3.35% Sep 19/22 106,000 105,705
61,000 Ford Credit Canada Company 3.74% May 08/23 61,000 61,061
117,000 Ford Credit Canada Company 4.46% Nov 13/24 117,000 118,060
134,000 Ford Floorplan Auto Securitization Trust 2.20% Jul 15/20 134,000 133,991
88,000 Fortified Trust 1.67% Jul 23/21 88,000 87,304 106,000 Fortified Trust 2.16% Oct 23/20 106,000 106,077
87,000 Fortified Trust 2.34% Jan 23/23 87,000 87,128 79,000 Fortified Trust 2.56% Mar 23/24 79,000 79,533 77,000 Fortis Inc. 2.85% Dec 12/23 77,149 78,257 20,000 Fortis Inc. 6.51% Jul 04/39 21,861 28,403 32,000 FortisAlberta Inc. 3.30% Sep 30/24 33,337 33,420 21,000 FortisAlberta Inc. 3.34% Sep 21/46 20,964 22,002 38,000 FortisAlberta Inc. 3.67% Sep 09/47 38,000 42,321 41,000 FortisAlberta Inc. 3.73% Sep 18/48 40,734 46,063 9,000 FortisAlberta Inc. 3.98% Oct 23/52 8,995 10,620
24,000 FortisAlberta Inc. 4.11% Sep 29/44 27,103 28,271 26,000 FortisAlberta Inc. 4.27% Sep 22/45 27,790 31,382 21,000 FortisAlberta Inc. 4.54% Oct 18/41 24,187 25,890 6,000 FortisAlberta Inc. 4.80% Oct 27/50 5,996 8,023 9,000 FortisAlberta Inc. 4.85% Sep 11/43 8,990 11,641
20,000 FortisAlberta Inc. 4.99% Jan 03/47 24,814 27,003 15,000 FortisAlberta Inc. 5.37% Oct 30/39 15,954 20,075 10,000 FortisAlberta Inc. 5.85% Apr 15/38 12,160 13,882 25,000 FortisAlberta Inc. 6.22% Oct 31/34 32,482 34,502 15,000 FortisAlberta Inc. 7.06% Feb 14/39 19,346 23,530 18,000 FortisBC Energy Inc. 2.58% Apr 08/26 17,989 18,297 13,000 FortisBC Energy Inc. 2.82% Aug 09/49 12,992 12,600 24,000 FortisBC Energy Inc. 3.38% Apr 13/45 24,000 25,691 16,000 FortisBC Energy Inc. 3.67% Apr 09/46 16,141 18,030 30,000 FortisBC Energy Inc. 3.69% Oct 30/47 30,299 34,023 17,000 FortisBC Energy Inc. 3.78% Mar 06/47 16,979 19,508
36,000 FortisBC Energy Inc. 3.85% Dec 07/48 35,949 41,994 15,000 FortisBC Energy Inc. 4.25% Dec 09/41 15,449 18,072 10,000 FortisBC Energy Inc. 5.20% Dec 06/40 9,971 13,440 40,000 FortisBC Energy Inc. 5.55% Sep 25/36 50,804 53,784 40,000 FortisBC Energy Inc. 5.80% May 13/38 34,011 56,069 15,000 FortisBC Energy Inc. 5.90% Feb 26/35 18,255 20,414 28,000 FortisBC Energy Inc. 6.00% Oct 02/37 32,765 39,672 40,000 FortisBC Energy Inc. 6.05% Feb 15/38 51,540 57,148
Schedule of InvestmentsAs at December 31, 2019

30
Tangerine Balanced Growth PortfolioAudited Annual Financial Statements for the year ended December 31, 2019(In Canadian dollars, unless otherwise indicated)
Par Value ($) Security
Average Cost ($)
Fair Value ($)
50,000 FortisBC Energy Inc. 6.50% May 01/34 62,900 70,903 25,000 FortisBC Energy Inc. 6.55% Feb 24/39 38,383 37,919 75,000 FortisBC Inc. 4.00% Oct 28/44 77,702 86,684 5,000 FortisBC Inc. 5.00% Nov 24/50 4,991 6,848
30,000 FortisBC Inc. 5.60% Nov 09/35 37,075 39,311 25,000 FortisBC Inc. 5.90% Jul 04/47 33,975 37,762 21,000 Gaz Metro Inc. 1.52% May 25/20 20,993 20,958 6,000 Gaz Metro Inc. 3.28% Oct 09/46 5,991 6,357
23,000 Gaz Metro Inc. 3.30% Mar 31/45 21,397 24,279 44,000 Gaz Metro Inc. 3.53% May 16/47 43,952 48,493 75,000 Gaz Metro Inc. 5.45% Jul 12/21 84,639 78,722 40,000 Gaz Metro Inc. 5.70% Jul 10/36 41,716 54,213 76,000 GE Capital Canada Funding Company
4.60% Jan 26/22 83,109 78,618 80,000 General Motors Financial of Canada,
Ltd. 2.60% Jun 01/22 79,918 79,549 115,000 General Motors Financial of Canada,
Ltd. 3.00% Feb 26/21 114,970 115,607 124,000 Genesis Trust II 1.70% Apr 15/20 123,451 123,907 35,000 Genworth MI Canada Inc. 4.24%
Apr 01/24 35,000 36,746 6,000 Genworth MI Canada Inc. 5.68%
Jun 15/20 5,997 6,090 17,000 George Weston Limited 4.12% Jun 17/24 17,000 17,809
30,000 George Weston Limited 7.10% Feb 05/32 33,704 39,357 124,000 Gibson Energy Inc. 3.60% Sep 17/29 123,628 124,686
14,457 Grand Renewable Solar LP 3.93% Jan 31/35 14,457 14,788
6,686 GrandLinq GP 4.77% Mar 31/47 6,686 7,482 17,000 Granite REIT Holdings LP 3.79% Jul 05/21 17,000 17,316 97,000 Granite REIT Holdings LP 3.87% Nov 30/23 97,002 100,497
247,000 Greater Toronto Airports Authority 2.73% Apr 03/29 246,936 252,042
78,000 Greater Toronto Airports Authority 2.75% Oct 17/39 77,892 77,420
50,000 Greater Toronto Airports Authority 3.04% Sep 21/22 51,210 51,165
100,000 Greater Toronto Airports Authority 3.26% Jun 01/37 100,081 106,052
117,000 Greater Toronto Airports Authority 4.53% Dec 02/41 121,391 148,710
83,000 Greater Toronto Airports Authority 5.30% Feb 25/41 94,651 114,952
63,000 Greater Toronto Airports Authority 5.63% Jun 07/40 75,068 89,813
47,000 Greater Toronto Airports Authority 6.45% Dec 03/27 63,119 60,603
17,361 Greater Toronto Airports Authority 6.45% Jul 30/29 22,631 20,836
50,000 Greater Toronto Airports Authority 6.47% Feb 02/34 67,086 71,441
80,000 Greater Toronto Airports Authority 6.98% Oct 15/32 114,122 116,387
80,000 Greater Toronto Airports Authority 7.05% Jun 12/30 103,863 111,848
75,000 Greater Toronto Airports Authority 7.10% Jun 04/31 108,113 107,200
86,000 Great-West Lifeco Inc. 3.34% Feb 28/28 86,000 90,552 77,000 Great-West Lifeco Inc. 4.65% Aug 13/20 81,588 78,194 50,000 Great-West Lifeco Inc. 6.00% Nov 16/39 61,208 70,650
Schedule of InvestmentsAs at December 31, 2019
Par Value ($) Security
Average Cost ($)
Fair Value ($)
55,000 Great-West Lifeco Inc. 6.67% Mar 21/33 66,467 76,594 20,000 Great-West Lifeco Inc. 6.74% Nov 24/31 27,106 27,769 50,000 H&R Real Estate Investment Trust 2.92%
May 06/22 50,048 50,398 38,000 H&R Real Estate Investment Trust 3.37%
Jan 30/24 38,026 38,578 47,000 H&R Real Estate Investment Trust 3.42%
Jan 23/23 47,000 47,918 10,000 H&R Real Estate Investment Trust 4.45%
Mar 02/20 10,007 10,035 10,000 Halifax International Airport Authority
4.89% Nov 15/50 10,000 13,411 11,000 Halifax International Airport Authority
5.50% Jul 19/41 13,770 15,060 20,000 Hamilton Health Sciences Corporation
3.68% Jan 17/59 20,000 23,011 66,000 HCN Canadian Holdings-1 LP 2.95%
Jan 15/27 65,928 66,073 155,000 Health Montreal Collective LP 6.72%
Sep 30/49 195,881 213,381 76,000 Honda Canada Finance Inc. 1.82%
Dec 07/21 76,000 75,461 76,000 Honda Canada Finance Inc. 2.16%
Feb 18/21 75,222 76,030 41,000 Honda Canada Finance Inc. 2.27%
Jul 15/22 41,000 40,977 85,000 Honda Canada Finance Inc. 2.49%
Dec 19/22 85,000 85,337 19,000 Honda Canada Finance Inc. 2.50%
Jun 04/24 19,000 18,975 59,000 Honda Canada Finance Inc. 2.54%
Mar 01/23 59,000 59,307 62,000 Honda Canada Finance Inc. 3.18%
Aug 28/23 62,000 63,587 37,000 Honda Canada Finance Inc. 3.44%
May 23/25 37,000 38,512 15,000 Hospital for Sick Children 5.22%
Dec 16/49 15,000 21,858 44,960 Hospital Infrastructure 5.44% Jan 31/45 50,809 54,445
108,000 HSBC Bank Canada 2.17% Jun 29/22 108,000 107,716 202,000 HSBC Bank Canada 2.25% Sep 15/22 202,002 201,666 100,000 HSBC Bank Canada 2.45% Jan 29/21 100,001 100,376 220,000 HSBC Bank Canada 2.54% Jan 31/23 220,000 221,177
86,000 HSBC Bank Canada 2.91% Sep 29/21 86,000 87,083 186,000 HSBC Bank Canada 3.25% Sep 15/23 186,000 191,268 78,000 Husky Energy Inc. 3.55% Mar 12/25 78,474 79,976 95,000 Husky Energy Inc. 3.60% Mar 10/27 95,727 97,142 75,000 Husky Energy Inc. 5.00% Mar 12/20 75,570 75,403 42,000 iA Financial Corporation Inc. 3.07%
Sep 24/31 42,000 42,193 50,000 IGM Financial Inc. 3.44% Jan 26/27 49,967 51,517 99,000 IGM Financial Inc. 4.12% Dec 09/47 99,000 104,391 31,000 IGM Financial Inc. 4.17% Jul 13/48 31,000 33,094 72,000 IGM Financial Inc. 4.21% Mar 21/50 72,000 77,551 9,000 IGM Financial Inc. 4.56% Jan 25/47 9,000 10,166
15,000 IGM Financial Inc. 6.00% Dec 10/40 15,600 19,713 20,000 IGM Financial Inc. 6.65% Dec 13/27 23,955 24,777 50,000 Industrial Alliance Insurance and
Financial Services Inc. 2.64% Feb 23/27 49,988 50,251 12,000 Industrial Alliance Insurance and
Financial Services Inc. 3.30% Sep 15/28 11,997 12,317

31
Tangerine Balanced Growth PortfolioAudited Annual Financial Statements for the year ended December 31, 2019(In Canadian dollars, unless otherwise indicated)
Par Value ($) Security
Average Cost ($)
Fair Value ($)
38,824 InPower BC General Partnership 4.47% Mar 31/33 38,590 41,635
46,000 Intact Financial Corporation 2.85% Jun 07/27 45,992 45,993
45,000 Intact Financial Corporation 3.77% Mar 02/26 44,992 47,539
45,000 Intact Financial Corporation 4.70% Aug 18/21 46,252 46,764
41,000 Intact Financial Corporation 5.16% Jun 16/42 45,089 52,751
25,000 Intact Financial Corporation 6.40% Nov 23/39 26,729 36,044
4,798 Integrated Team Solutions PCH Partnership 4.88% May 31/46 4,798 5,640
12,862 Integrated Team Solutions SJHC Partnership 5.95% Nov 30/42 12,862 16,415
66,000 Inter Pipeline, Ltd. 2.61% Sep 13/23 66,000 65,803 90,000 Inter Pipeline, Ltd. 2.73% Apr 18/24 88,809 89,820 37,000 Inter Pipeline, Ltd. 3.17% Mar 24/25 36,480 37,423 44,000 Inter Pipeline, Ltd. 3.45% Jul 20/20 44,000 44,290 68,000 Inter Pipeline, Ltd. 3.48% Dec 16/26 68,660 69,468 44,000 Inter Pipeline, Ltd. 3.78% May 30/22 44,485 45,329 60,000 Inter Pipeline, Ltd. 4.64% May 30/44 60,660 65,390 30,000 Inter Pipeline, Ltd. 4.97% Feb 02/21 31,095 30,840 21,000 Inter-American Development Bank
1.88% Mar 20/20 20,934 21,012 48,000 Inter-American Development Bank
4.40% Jan 26/26 53,428 54,274 157,000 International Bank for Reconstruction
and Development 1.80% Jul 26/24 156,948 155,612 107,000 International Bank for Reconstruction
and Development 2.25% Jan 17/23 106,393 108,236 103,000 International Bank for Reconstruction
and Development 2.50% Aug 03/23 102,601 105,231 38,000 Ivanhoe Cambridge II Inc. 2.30%
Dec 12/24 38,000 38,012 85,000 Ivanhoe Cambridge II Inc. 2.91%
Jun 27/23 85,000 86,914 72,000 John Deere Canada Funding Inc. 1.60%
Jul 13/20 71,906 71,862 15,000 John Deere Canada Funding Inc. 1.85%
Mar 24/21 14,999 14,949 16,000 John Deere Canada Funding Inc. 2.05%
Sep 17/20 15,989 16,007 43,000 John Deere Canada Funding Inc. 2.05%
May 13/22 42,966 42,783 22,000 John Deere Canada Funding Inc. 2.63%
Sep 21/22 21,991 22,208 57,000 John Deere Canada Funding Inc. 2.70%
Oct 12/21 56,970 57,506 54,000 John Deere Canada Funding Inc. 2.70%
Jan 17/23 53,990 54,624 38,000 John Deere Canada Funding Inc. 3.02%
Jul 13/23 37,998 38,836 25,000 John Deere Financial Inc. 2.40% Sep 17/24 24,994 24,867 97,000 John Deere Financial Inc. 2.58% Oct 16/26 96,951 96,275 34,000 John Deere Financial Inc. 2.99% Jan 14/22 34,000 34,524 73,000 Keyera Corp. 3.93% Jun 21/28 73,000 76,061 56,860 Kingston Solar LP 3.57% Jul 31/35 56,860 57,181 14,000 Labrador-Island Link Funding Trust
3.76% Jun 01/33 14,259 16,256
Schedule of InvestmentsAs at December 31, 2019
Par Value ($) Security
Average Cost ($)
Fair Value ($)
77,000 Labrador-Island Link Funding Trust 3.85% Dec 01/53 78,284 103,808
66,000 Labrador-Island Link Funding Trust 3.86% Dec 01/45 67,635 84,667
49,000 Laurentian Bank of Canada 2.50% Jan 23/20 49,390 49,006
51,000 Laurentian Bank of Canada 2.55% Jun 20/22 50,936 51,034
41,000 Laurentian Bank of Canada 2.75% Apr 22/21 40,913 41,211
52,000 Laurentian Bank of Canada 3.00% Sep 12/22 51,908 52,608
63,000 Laurentian Bank of Canada 3.45% Jun 27/23 62,977 64,628
45,000 Leisureworld Senior Care LP 3.47% Feb 03/21 45,000 45,557
88,000 Loblaw Companies Limited 3.92% Jun 10/24 88,000 92,647
70,000 Loblaw Companies Limited 4.49% Dec 11/28 70,000 77,138
133,000 Loblaw Companies Limited 4.86% Sep 12/23 142,252 143,075
80,000 Loblaw Companies Limited 5.22% Jun 18/20 82,034 81,091
75,000 Loblaw Companies Limited 6.05% Jun 09/34 80,318 94,828
20,000 Loblaw Companies Limited 6.15% Jan 29/35 21,137 25,620
30,000 Loblaw Companies Limited 6.45% Feb 09/28 35,160 36,633
10,000 Loblaw Companies Limited 6.45% Mar 01/39 10,885 13,744
14,000 Loblaw Companies Limited 6.50% Jan 22/29 17,217 17,406
25,000 Loblaw Companies Limited 6.54% Feb 17/33 29,033 32,465
20,000 Loblaw Companies Limited 6.85% Mar 01/32 21,775 26,265
32,000 Lower Mattagami Energy LP 2.31% Oct 21/26 31,091 31,926
34,000 Lower Mattagami Energy LP 3.42% Jun 20/24 34,000 35,722
30,000 Lower Mattagami Energy LP 4.18% Feb 23/46 30,000 36,377
32,000 Lower Mattagami Energy LP 4.18% Apr 23/52 33,324 39,376
51,000 Lower Mattagami Energy LP 4.33% May 18/21 53,379 52,558
30,000 Lower Mattagami Energy LP 4.94% Sep 21/43 33,180 39,895
52,000 Lower Mattagami Energy LP 5.14% May 18/41 59,688 69,523
46,000 Magna International, Inc. 3.10% Dec 15/22 46,272 46,689
10,000 Manitoba Telecom Services Inc. 4.00% May 27/24 9,993 10,520
47,000 Manulife Bank of Canada 1.92% Sep 01/21 46,542 46,823 43,000 Manulife Bank of Canada 2.08% May 26/22 43,000 42,870
128,000 Manulife Bank of Canada 2.38% Nov 19/24 128,000 127,794 78,000 Manulife Bank of Canada 2.84% Jan 12/23 77,083 79,291
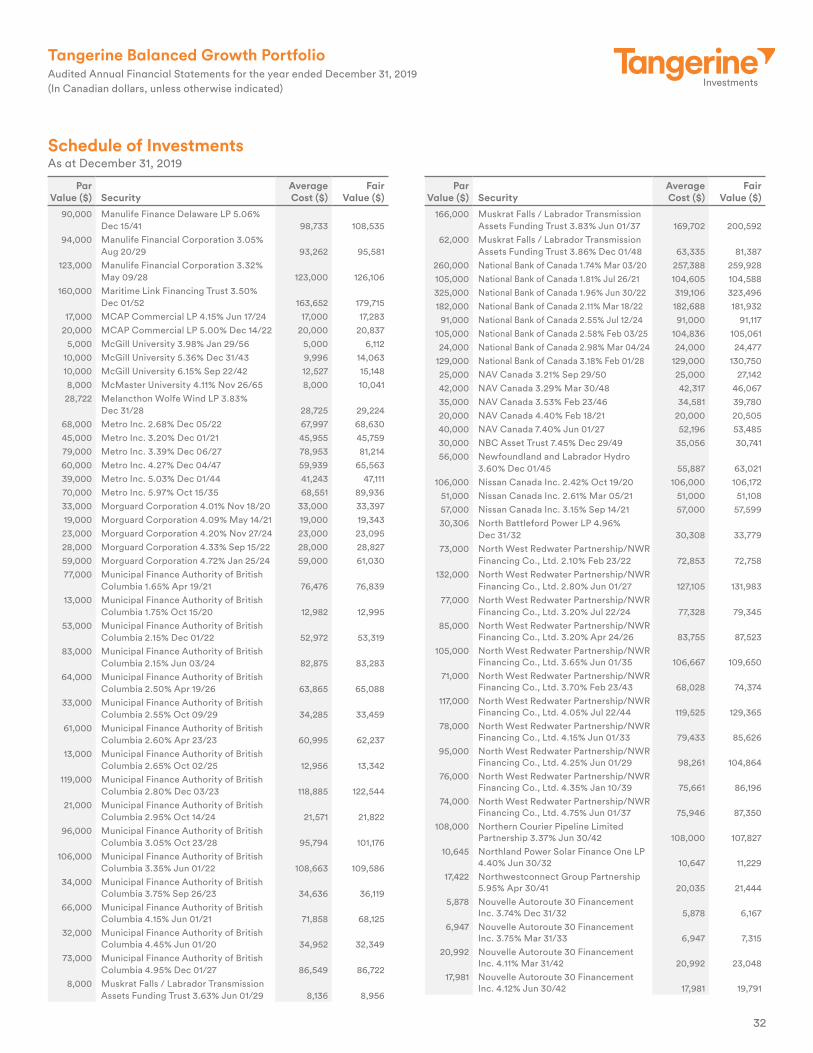
32
Tangerine Balanced Growth PortfolioAudited Annual Financial Statements for the year ended December 31, 2019(In Canadian dollars, unless otherwise indicated)
Par Value ($) Security
Average Cost ($)
Fair Value ($)
90,000 Manulife Finance Delaware LP 5.06% Dec 15/41 98,733 108,535
94,000 Manulife Financial Corporation 3.05% Aug 20/29 93,262 95,581
123,000 Manulife Financial Corporation 3.32% May 09/28 123,000 126,106
160,000 Maritime Link Financing Trust 3.50% Dec 01/52 163,652 179,715
17,000 MCAP Commercial LP 4.15% Jun 17/24 17,000 17,283 20,000 MCAP Commercial LP 5.00% Dec 14/22 20,000 20,837
5,000 McGill University 3.98% Jan 29/56 5,000 6,112 10,000 McGill University 5.36% Dec 31/43 9,996 14,063 10,000 McGill University 6.15% Sep 22/42 12,527 15,148 8,000 McMaster University 4.11% Nov 26/65 8,000 10,041 28,722 Melancthon Wolfe Wind LP 3.83%
Dec 31/28 28,725 29,224 68,000 Metro Inc. 2.68% Dec 05/22 67,997 68,630 45,000 Metro Inc. 3.20% Dec 01/21 45,955 45,759 79,000 Metro Inc. 3.39% Dec 06/27 78,953 81,214 60,000 Metro Inc. 4.27% Dec 04/47 59,939 65,563 39,000 Metro Inc. 5.03% Dec 01/44 41,243 47,111 70,000 Metro Inc. 5.97% Oct 15/35 68,551 89,936 33,000 Morguard Corporation 4.01% Nov 18/20 33,000 33,397 19,000 Morguard Corporation 4.09% May 14/21 19,000 19,343 23,000 Morguard Corporation 4.20% Nov 27/24 23,000 23,095 28,000 Morguard Corporation 4.33% Sep 15/22 28,000 28,827 59,000 Morguard Corporation 4.72% Jan 25/24 59,000 61,030 77,000 Municipal Finance Authority of British
Columbia 1.65% Apr 19/21 76,476 76,839 13,000 Municipal Finance Authority of British
Columbia 1.75% Oct 15/20 12,982 12,995 53,000 Municipal Finance Authority of British
Columbia 2.15% Dec 01/22 52,972 53,319 83,000 Municipal Finance Authority of British
Columbia 2.15% Jun 03/24 82,875 83,283 64,000 Municipal Finance Authority of British
Columbia 2.50% Apr 19/26 63,865 65,088 33,000 Municipal Finance Authority of British
Columbia 2.55% Oct 09/29 34,285 33,459 61,000 Municipal Finance Authority of British
Columbia 2.60% Apr 23/23 60,995 62,237 13,000 Municipal Finance Authority of British
Columbia 2.65% Oct 02/25 12,956 13,342 119,000 Municipal Finance Authority of British
Columbia 2.80% Dec 03/23 118,885 122,544 21,000 Municipal Finance Authority of British
Columbia 2.95% Oct 14/24 21,571 21,822 96,000 Municipal Finance Authority of British
Columbia 3.05% Oct 23/28 95,794 101,176 106,000 Municipal Finance Authority of British
Columbia 3.35% Jun 01/22 108,663 109,586 34,000 Municipal Finance Authority of British
Columbia 3.75% Sep 26/23 34,636 36,119 66,000 Municipal Finance Authority of British
Columbia 4.15% Jun 01/21 71,858 68,125 32,000 Municipal Finance Authority of British
Columbia 4.45% Jun 01/20 34,952 32,349 73,000 Municipal Finance Authority of British
Columbia 4.95% Dec 01/27 86,549 86,722 8,000 Muskrat Falls / Labrador Transmission
Assets Funding Trust 3.63% Jun 01/29 8,136 8,956
Schedule of InvestmentsAs at December 31, 2019
Par Value ($) Security
Average Cost ($)
Fair Value ($)
166,000 Muskrat Falls / Labrador Transmission Assets Funding Trust 3.83% Jun 01/37 169,702 200,592
62,000 Muskrat Falls / Labrador Transmission Assets Funding Trust 3.86% Dec 01/48 63,335 81,387
260,000 National Bank of Canada 1.74% Mar 03/20 257,388 259,928 105,000 National Bank of Canada 1.81% Jul 26/21 104,605 104,588 325,000 National Bank of Canada 1.96% Jun 30/22 319,106 323,496 182,000 National Bank of Canada 2.11% Mar 18/22 182,688 181,932
91,000 National Bank of Canada 2.55% Jul 12/24 91,000 91,117 105,000 National Bank of Canada 2.58% Feb 03/25 104,836 105,061 24,000 National Bank of Canada 2.98% Mar 04/24 24,000 24,477
129,000 National Bank of Canada 3.18% Feb 01/28 129,000 130,750 25,000 NAV Canada 3.21% Sep 29/50 25,000 27,142 42,000 NAV Canada 3.29% Mar 30/48 42,317 46,067 35,000 NAV Canada 3.53% Feb 23/46 34,581 39,780 20,000 NAV Canada 4.40% Feb 18/21 20,000 20,505 40,000 NAV Canada 7.40% Jun 01/27 52,196 53,485 30,000 NBC Asset Trust 7.45% Dec 29/49 35,056 30,741 56,000 Newfoundland and Labrador Hydro
3.60% Dec 01/45 55,887 63,021 106,000 Nissan Canada Inc. 2.42% Oct 19/20 106,000 106,172
51,000 Nissan Canada Inc. 2.61% Mar 05/21 51,000 51,108 57,000 Nissan Canada Inc. 3.15% Sep 14/21 57,000 57,599 30,306 North Battleford Power LP 4.96%
Dec 31/32 30,308 33,779 73,000 North West Redwater Partnership/NWR
Financing Co., Ltd. 2.10% Feb 23/22 72,853 72,758 132,000 North West Redwater Partnership/NWR
Financing Co., Ltd. 2.80% Jun 01/27 127,105 131,983 77,000 North West Redwater Partnership/NWR
Financing Co., Ltd. 3.20% Jul 22/24 77,328 79,345 85,000 North West Redwater Partnership/NWR
Financing Co., Ltd. 3.20% Apr 24/26 83,755 87,523 105,000 North West Redwater Partnership/NWR
Financing Co., Ltd. 3.65% Jun 01/35 106,667 109,650 71,000 North West Redwater Partnership/NWR
Financing Co., Ltd. 3.70% Feb 23/43 68,028 74,374 117,000 North West Redwater Partnership/NWR
Financing Co., Ltd. 4.05% Jul 22/44 119,525 129,365 78,000 North West Redwater Partnership/NWR
Financing Co., Ltd. 4.15% Jun 01/33 79,433 85,626 95,000 North West Redwater Partnership/NWR
Financing Co., Ltd. 4.25% Jun 01/29 98,261 104,864 76,000 North West Redwater Partnership/NWR
Financing Co., Ltd. 4.35% Jan 10/39 75,661 86,196 74,000 North West Redwater Partnership/NWR
Financing Co., Ltd. 4.75% Jun 01/37 75,946 87,350 108,000 Northern Courier Pipeline Limited
Partnership 3.37% Jun 30/42 108,000 107,827 10,645 Northland Power Solar Finance One LP
4.40% Jun 30/32 10,647 11,229 17,422 Northwestconnect Group Partnership
5.95% Apr 30/41 20,035 21,444 5,878 Nouvelle Autoroute 30 Financement
Inc. 3.74% Dec 31/32 5,878 6,167 6,947 Nouvelle Autoroute 30 Financement
Inc. 3.75% Mar 31/33 6,947 7,315 20,992 Nouvelle Autoroute 30 Financement
Inc. 4.11% Mar 31/42 20,992 23,048 17,981 Nouvelle Autoroute 30 Financement
Inc. 4.12% Jun 30/42 17,981 19,791

33
Tangerine Balanced Growth PortfolioAudited Annual Financial Statements for the year ended December 31, 2019(In Canadian dollars, unless otherwise indicated)
Par Value ($) Security
Average Cost ($)
Fair Value ($)
66,000 Nova Scotia Power Inc. 3.57% Apr 05/49 66,000 70,549 28,000 Nova Scotia Power Inc. 3.61% May 01/45 28,000 29,917 45,000 Nova Scotia Power Inc. 4.15% Mar 06/42 45,126 51,688 35,000 Nova Scotia Power Inc. 4.50% Jul 20/43 36,858 42,395 45,000 Nova Scotia Power Inc. 5.61% Jun 15/40 55,944 61,102 34,000 Nova Scotia Power Inc. 5.67% Nov 14/35 37,064 44,381 36,000 Nova Scotia Power Inc. 5.95% Jul 27/39 42,697 50,247 25,000 Nova Scotia Power Inc. 6.95% Aug 25/33 33,488 35,749
143,000 OMERS Finance Trust 2.60% May 14/29 142,850 144,796 42,000 OMERS Realty Corporation 1.82%
May 09/22 42,000 41,699 44,000 OMERS Realty Corporation 2.86%
Feb 23/24 44,000 44,989 10,000 OMERS Realty Corporation 2.97%
Apr 05/21 10,000 10,112 40,000 OMERS Realty Corporation 3.20%
Jul 24/20 41,350 40,262 174,000 OMERS Realty Corporation 3.24%
Oct 04/27 174,000 182,309 69,000 OMERS Realty Corporation 3.33%
Nov 12/24 70,178 72,044 74,000 OMERS Realty Corporation 3.33%
Jun 05/25 74,000 77,396 34,000 OMERS Realty Corporation 3.36%
Jun 05/23 34,000 35,251 129,000 OMERS Realty Corporation 3.63%
Jun 05/30 129,000 140,174 28,000 Ontario Power Generation Inc. 2.98%
Sep 13/29 28,000 28,403 69,000 Ontario Power Generation Inc. 3.32%
Oct 04/27 69,000 72,032 17,000 Ontario Power Generation Inc. 3.65%
Sep 13/50 17,000 18,067 67,000 Ontario Power Generation Inc. 3.84%
Jun 22/48 67,000 73,445 12,000 Ontario Power Generation Inc. 4.25%
Jan 18/49 12,000 14,030 7,281 Ontario School Boards Financing Corp.
5.90% Oct 11/27 8,489 8,228 68,000 OPB Finance Trust 1.88% Feb 24/22 66,611 67,872 17,000 OPB Finance Trust 2.90% May 24/23 16,988 17,432 15,000 OPB Finance Trust 2.95% Feb 02/26 14,992 15,537
100,000 OPB Finance Trust 2.98% Jan 25/27 100,049 103,695 36,000 OPB Finance Trust 3.89% Jul 04/42 37,680 43,165 51,000 Ottawa MacDonald-Cartier
International Airport Authority 3.93% Jun 09/45 51,000 55,840
15,823 Ottawa MacDonald-Cartier International Airport Authority 6.97% May 25/32 21,044 20,080
69,000 Pembina Pipeline Corporation 2.56% Jun 01/23 68,994 69,077
139,000 Pembina Pipeline Corporation 2.99% Jan 22/24 138,455 140,896
33,000 Pembina Pipeline Corporation 3.31% Feb 01/30 32,975 32,884
41,000 Pembina Pipeline Corporation 3.54% Feb 03/25 41,434 42,335
17,000 Pembina Pipeline Corporation 3.62% Apr 03/29 16,994 17,446
Schedule of InvestmentsAs at December 31, 2019
Par Value ($) Security
Average Cost ($)
Fair Value ($)
57,000 Pembina Pipeline Corporation 3.71% Aug 11/26 57,652 59,246
70,000 Pembina Pipeline Corporation 3.77% Oct 24/22 72,139 72,530
114,000 Pembina Pipeline Corporation 4.02% Mar 27/28 113,991 120,436
71,000 Pembina Pipeline Corporation 4.24% Jun 15/27 70,994 76,033
60,000 Pembina Pipeline Corporation 4.54% Apr 03/49 61,960 64,226
105,000 Pembina Pipeline Corporation 4.74% Jan 21/47 103,828 115,369
50,000 Pembina Pipeline Corporation 4.75% Apr 30/43 49,413 54,844
36,000 Pembina Pipeline Corporation 4.75% Mar 26/48 35,977 39,699
53,000 Pembina Pipeline Corporation 4.81% Mar 25/44 53,798 58,491
37,000 Pembina Pipeline Corporation 4.89% Mar 29/21 40,509 38,160
33,000 Penske Truck Leasing Canada Inc. 2.70% Sep 30/24 32,933 32,730
51,000 Penske Truck Leasing Canada Inc. 2.85% Dec 07/22 50,974 51,349
26,000 Penske Truck Leasing Canada Inc. 2.95% Jun 12/20 25,992 26,083
15,000 Plenary Health Care Partnerships Humber LP 4.82% Nov 30/44 15,000 18,386
17,971 Plenary Health Care Partnerships Humber LP 4.90% May 31/39 17,971 20,611
9,121 Plenary Health Hamilton LP 5.80% May 31/43 9,121 11,497
89,881 Plenary Properties LTAP LP 6.29% Jan 31/44 108,895 119,106
61,000 Power Corporation of Canada 4.46% Jul 27/48 62,083 67,754
13,000 Power Corporation of Canada 4.81% Jan 31/47 13,000 15,100
20,000 Power Corporation of Canada 8.57% Apr 22/39 19,985 32,786
153,000 PSP Capital Inc. 1.34% Aug 18/21 152,225 151,862 286,000 PSP Capital Inc. 1.73% Jun 21/22 283,488 285,082 149,000 PSP Capital Inc. 2.05% Jan 15/30 148,511 145,754 183,000 PSP Capital Inc. 2.09% Nov 22/23 183,407 183,869 258,000 PSP Capital Inc. 3.00% Nov 05/25 257,595 270,660 90,000 PSP Capital Inc. 3.03% Oct 22/20 92,912 90,878 175,000 PSP Capital Inc. 3.29% Apr 04/24 183,814 184,200 15,000 PSS Generating Station LP 4.80%
Oct 24/67 15,000 18,031 61,000 Reliance LP 3.75% Mar 15/26 60,802 62,517 45,000 Reliance LP 3.81% Sep 15/20 45,001 45,438 57,000 Reliance LP 3.84% Mar 15/25 57,037 58,876 9,000 Reliance LP 4.08% Aug 02/21 9,000 9,230
26,000 RioCan Real Estate Investment Trust 2.19% Aug 26/20 26,000 26,000
42,000 RioCan Real Estate Investment Trust 2.19% Apr 09/21 42,000 41,978
90,000 RioCan Real Estate Investment Trust 2.58% Feb 12/25 90,000 88,639
46,000 RioCan Real Estate Investment Trust 2.83% Oct 03/22 45,597 46,471
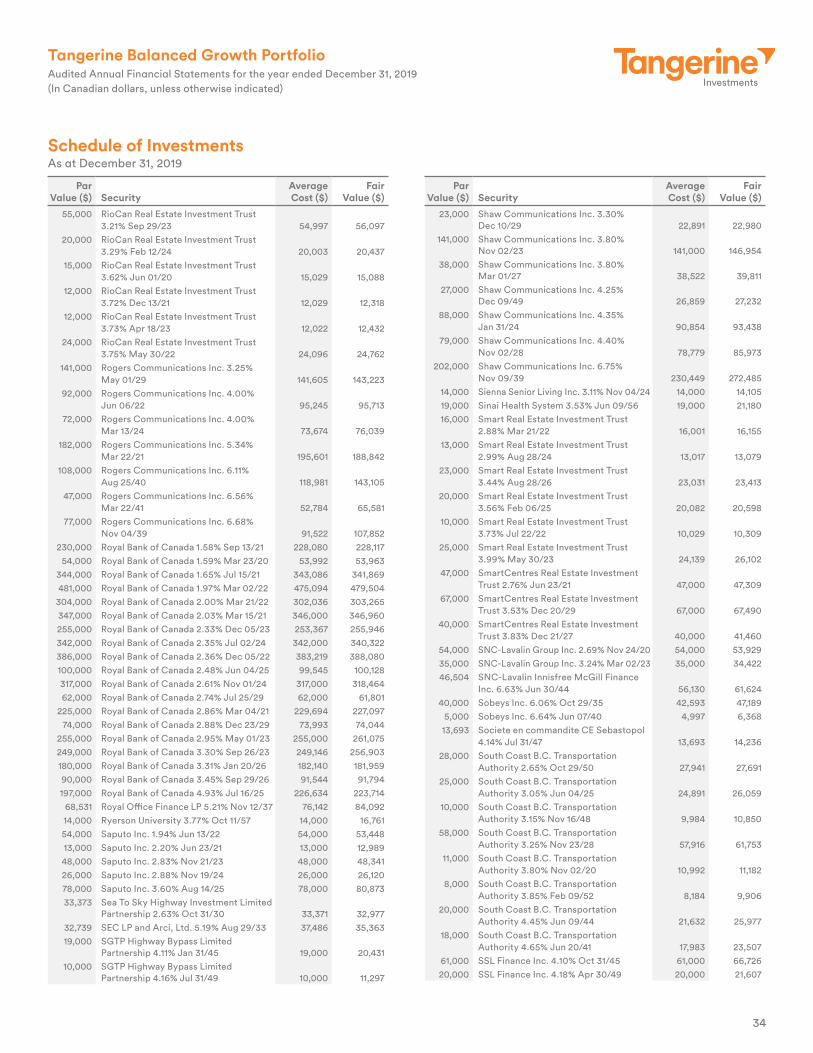
34
Tangerine Balanced Growth PortfolioAudited Annual Financial Statements for the year ended December 31, 2019(In Canadian dollars, unless otherwise indicated)
Par Value ($) Security
Average Cost ($)
Fair Value ($)
55,000 RioCan Real Estate Investment Trust 3.21% Sep 29/23 54,997 56,097
20,000 RioCan Real Estate Investment Trust 3.29% Feb 12/24 20,003 20,437
15,000 RioCan Real Estate Investment Trust 3.62% Jun 01/20 15,029 15,088
12,000 RioCan Real Estate Investment Trust 3.72% Dec 13/21 12,029 12,318
12,000 RioCan Real Estate Investment Trust 3.73% Apr 18/23 12,022 12,432
24,000 RioCan Real Estate Investment Trust 3.75% May 30/22 24,096 24,762
141,000 Rogers Communications Inc. 3.25% May 01/29 141,605 143,223
92,000 Rogers Communications Inc. 4.00% Jun 06/22 95,245 95,713
72,000 Rogers Communications Inc. 4.00% Mar 13/24 73,674 76,039
182,000 Rogers Communications Inc. 5.34% Mar 22/21 195,601 188,842
108,000 Rogers Communications Inc. 6.11% Aug 25/40 118,981 143,105
47,000 Rogers Communications Inc. 6.56% Mar 22/41 52,784 65,581
77,000 Rogers Communications Inc. 6.68% Nov 04/39 91,522 107,852
230,000 Royal Bank of Canada 1.58% Sep 13/21 228,080 228,117 54,000 Royal Bank of Canada 1.59% Mar 23/20 53,992 53,963
344,000 Royal Bank of Canada 1.65% Jul 15/21 343,086 341,869 481,000 Royal Bank of Canada 1.97% Mar 02/22 475,094 479,504
304,000 Royal Bank of Canada 2.00% Mar 21/22 302,036 303,265 347,000 Royal Bank of Canada 2.03% Mar 15/21 346,000 346,960 255,000 Royal Bank of Canada 2.33% Dec 05/23 253,367 255,946 342,000 Royal Bank of Canada 2.35% Jul 02/24 342,000 340,322 386,000 Royal Bank of Canada 2.36% Dec 05/22 383,219 388,080 100,000 Royal Bank of Canada 2.48% Jun 04/25 99,545 100,128 317,000 Royal Bank of Canada 2.61% Nov 01/24 317,000 318,464 62,000 Royal Bank of Canada 2.74% Jul 25/29 62,000 61,801
225,000 Royal Bank of Canada 2.86% Mar 04/21 229,694 227,097 74,000 Royal Bank of Canada 2.88% Dec 23/29 73,993 74,044
255,000 Royal Bank of Canada 2.95% May 01/23 255,000 261,075 249,000 Royal Bank of Canada 3.30% Sep 26/23 249,146 256,903 180,000 Royal Bank of Canada 3.31% Jan 20/26 182,140 181,959 90,000 Royal Bank of Canada 3.45% Sep 29/26 91,544 91,794 197,000 Royal Bank of Canada 4.93% Jul 16/25 226,634 223,714
68,531 Royal Office Finance LP 5.21% Nov 12/37 76,142 84,092 14,000 Ryerson University 3.77% Oct 11/57 14,000 16,761 54,000 Saputo Inc. 1.94% Jun 13/22 54,000 53,448 13,000 Saputo Inc. 2.20% Jun 23/21 13,000 12,989 48,000 Saputo Inc. 2.83% Nov 21/23 48,000 48,341 26,000 Saputo Inc. 2.88% Nov 19/24 26,000 26,120 78,000 Saputo Inc. 3.60% Aug 14/25 78,000 80,873 33,373 Sea To Sky Highway Investment Limited
Partnership 2.63% Oct 31/30 33,371 32,977 32,739 SEC LP and Arci, Ltd. 5.19% Aug 29/33 37,486 35,363 19,000 SGTP Highway Bypass Limited
Partnership 4.11% Jan 31/45 19,000 20,431 10,000 SGTP Highway Bypass Limited
Partnership 4.16% Jul 31/49 10,000 11,297
Schedule of InvestmentsAs at December 31, 2019
Par Value ($) Security
Average Cost ($)
Fair Value ($)
23,000 Shaw Communications Inc. 3.30% Dec 10/29 22,891 22,980
141,000 Shaw Communications Inc. 3.80% Nov 02/23 141,000 146,954
38,000 Shaw Communications Inc. 3.80% Mar 01/27 38,522 39,811
27,000 Shaw Communications Inc. 4.25% Dec 09/49 26,859 27,232
88,000 Shaw Communications Inc. 4.35% Jan 31/24 90,854 93,438
79,000 Shaw Communications Inc. 4.40% Nov 02/28 78,779 85,973
202,000 Shaw Communications Inc. 6.75% Nov 09/39 230,449 272,485
14,000 Sienna Senior Living Inc. 3.11% Nov 04/24 14,000 14,105 19,000 Sinai Health System 3.53% Jun 09/56 19,000 21,180 16,000 Smart Real Estate Investment Trust
2.88% Mar 21/22 16,001 16,155 13,000 Smart Real Estate Investment Trust
2.99% Aug 28/24 13,017 13,079 23,000 Smart Real Estate Investment Trust
3.44% Aug 28/26 23,031 23,413 20,000 Smart Real Estate Investment Trust
3.56% Feb 06/25 20,082 20,598 10,000 Smart Real Estate Investment Trust
3.73% Jul 22/22 10,029 10,309 25,000 Smart Real Estate Investment Trust
3.99% May 30/23 24,139 26,102 47,000 SmartCentres Real Estate Investment
Trust 2.76% Jun 23/21 47,000 47,309 67,000 SmartCentres Real Estate Investment
Trust 3.53% Dec 20/29 67,000 67,490 40,000 SmartCentres Real Estate Investment
Trust 3.83% Dec 21/27 40,000 41,460 54,000 SNC-Lavalin Group Inc. 2.69% Nov 24/20 54,000 53,929 35,000 SNC-Lavalin Group Inc. 3.24% Mar 02/23 35,000 34,422 46,504 SNC-Lavalin Innisfree McGill Finance
Inc. 6.63% Jun 30/44 56,130 61,624 40,000 Sobeys Inc. 6.06% Oct 29/35 42,593 47,189
5,000 Sobeys Inc. 6.64% Jun 07/40 4,997 6,368 13,693 Societe en commandite CE Sebastopol
4.14% Jul 31/47 13,693 14,236 28,000 South Coast B.C. Transportation
Authority 2.65% Oct 29/50 27,941 27,691 25,000 South Coast B.C. Transportation
Authority 3.05% Jun 04/25 24,891 26,059 10,000 South Coast B.C. Transportation
Authority 3.15% Nov 16/48 9,984 10,850 58,000 South Coast B.C. Transportation
Authority 3.25% Nov 23/28 57,916 61,753 11,000 South Coast B.C. Transportation
Authority 3.80% Nov 02/20 10,992 11,182 8,000 South Coast B.C. Transportation
Authority 3.85% Feb 09/52 8,184 9,906 20,000 South Coast B.C. Transportation
Authority 4.45% Jun 09/44 21,632 25,977 18,000 South Coast B.C. Transportation
Authority 4.65% Jun 20/41 17,983 23,507 61,000 SSL Finance Inc. 4.10% Oct 31/45 61,000 66,726 20,000 SSL Finance Inc. 4.18% Apr 30/49 20,000 21,607

35
Tangerine Balanced Growth PortfolioAudited Annual Financial Statements for the year ended December 31, 2019(In Canadian dollars, unless otherwise indicated)
Schedule of InvestmentsAs at December 31, 2019
Par Value ($) Security
Average Cost ($)
Fair Value ($)
22,000 Sun Life Assurance Company of Canada 6.30% May 15/28 27,581 27,682
25,000 Sun Life Capital Trust 7.09% Jun 30/52 30,468 33,822 152,000 Sun Life Financial Inc. 2.38% Aug 13/29 151,992 150,287 70,000 Sun Life Financial Inc. 2.60% Sep 25/25 70,444 70,180 14,000 Sun Life Financial Inc. 2.75% Nov 23/27 13,994 14,127
145,000 Sun Life Financial Inc. 3.05% Sep 19/28 144,778 147,750 80,000 Sun Life Financial Inc. 3.10% Feb 19/26 79,908 80,759 19,000 Sun Life Financial Inc. 4.57% Aug 23/21 18,992 19,724 70,000 Sun Life Financial Inc. 5.40% May 29/42 70,968 89,615 96,000 Suncor Energy Inc. 3.00% Sep 14/26 95,835 97,951
106,000 Suncor Energy Inc. 3.10% Nov 26/21 106,493 107,655 277,000 Suncor Energy Inc. 3.10% May 24/29 276,338 280,921 38,000 Suncor Energy Inc. 4.34% Sep 13/46 39,437 43,476 95,000 Suncor Energy Inc. 5.39% Mar 26/37 106,565 118,097 78,000 Sysco Canada, Inc. 3.65% Apr 25/25 77,970 81,217 69,000 TD Capital Trust IV 6.63% Jun 30/2108 79,795 73,235 40,000 TD Capital Trust IV 10.00% Jun 30/2108 51,771 45,931 18,000 TELUS Communications Inc. 9.65%
Apr 08/22 26,625 20,802 141,000 TELUS Corporation 2.35% Mar 28/22 140,688 141,305 81,000 TELUS Corporation 2.75% Jul 08/26 80,897 80,482 85,000 TELUS Corporation 3.15% Feb 19/30 84,702 84,767 80,000 TELUS Corporation 3.20% Apr 05/21 79,933 80,929 93,000 TELUS Corporation 3.30% May 02/29 93,464 94,384 57,000 TELUS Corporation 3.35% Mar 15/23 58,426 58,543
175,000 TELUS Corporation 3.35% Apr 01/24 177,475 180,230 63,000 TELUS Corporation 3.60% Jan 26/21 63,480 63,950 78,000 TELUS Corporation 3.63% Mar 01/28 77,505 81,247
128,000 TELUS Corporation 3.75% Jan 17/25 129,707 134,127 95,000 TELUS Corporation 3.75% Mar 10/26 95,660 99,780 66,000 TELUS Corporation 3.95% Feb 16/50 65,442 65,736
105,000 TELUS Corporation 4.40% Apr 01/43 102,029 112,154 62,000 TELUS Corporation 4.40% Jan 29/46 60,680 66,444 80,000 TELUS Corporation 4.70% Mar 06/48 79,607 89,981 64,000 TELUS Corporation 4.75% Jan 17/45 65,108 72,069
135,000 TELUS Corporation 4.85% Apr 05/44 135,522 153,746 58,000 TELUS Corporation 5.15% Nov 26/43 61,200 68,466
8,000 Teranet Holdings LP 3.65% Nov 18/22 7,999 8,160 90,000 Teranet Holdings LP 4.81% Dec 16/20 94,665 92,065 55,000 Teranet Holdings LP 5.75% Dec 17/40 58,322 60,633 50,000 Teranet Holdings LP 6.10% Jun 17/41 53,159 57,552 40,000 The Empire Life Insurance Company
3.38% Dec 16/26 40,000 40,672 8,000 The Empire Life Insurance Company
3.66% Mar 15/28 8,000 8,252 30,000 The Hospital for Sick Children 3.42%
Dec 07/57 30,000 33,543 54,000 The Manufacturers Life Insurance
Company 2.39% Jan 05/26 53,999 54,072 135,000 The Manufacturers Life Insurance
Company 3.18% Nov 22/27 135,365 138,019 257,000 The Toronto-Dominion Bank 1.68%
Jun 08/21 256,653 255,878 434,000 The Toronto-Dominion Bank 1.91%
Jul 18/23 427,588 429,894 549,000 The Toronto-Dominion Bank 1.99%
Mar 23/22 543,619 547,577
Par Value ($) Security
Average Cost ($)
Fair Value ($)
422,000 The Toronto-Dominion Bank 2.05% Mar 08/21 419,507 422,054
179,000 The Toronto-Dominion Bank 2.50% Dec 02/24 179,000 179,052
455,000 The Toronto-Dominion Bank 2.62% Dec 22/21 464,111 459,632
332,000 The Toronto-Dominion Bank 2.85% Mar 08/24 332,000 337,460
100,000 The Toronto-Dominion Bank 2.98% Sep 30/25 100,680 100,583
547,000 The Toronto-Dominion Bank 3.01% May 30/23 547,541 561,599
203,000 The Toronto-Dominion Bank 3.06% Jan 26/32 202,927 203,447
269,000 The Toronto-Dominion Bank 3.22% Jul 25/29 268,495 274,072
367,000 The Toronto-Dominion Bank 3.23% Jul 24/24 377,951 382,290
286,000 The Toronto-Dominion Bank 3.59% Sep 14/28 286,000 295,758
135,000 The Toronto-Dominion Bank 4.86% Mar 04/31 146,931 149,802
10,000 The University of Western Ontario 3.39% Dec 04/57 10,000 11,185
58,000 Thomson Reuters Corporation 3.31% Nov 12/21 58,830 59,224
11,503 THP Partnership 4.39% Oct 31/46 11,503 13,022 48,000 TMX Group Limited 3.00% Dec 11/24 48,000 48,950 28,000 TMX Group Limited 3.78% Jun 05/28 28,000 29,715 23,000 TMX Group Limited 4.46% Oct 03/23 23,000 24,585 73,000 Toromont Industries Ltd. 3.84%
Oct 27/27 73,000 76,891 41,000 Toronto Hydro Corporation 2.52%
Aug 25/26 40,993 41,619 32,000 Toronto Hydro Corporation 2.91%
Apr 10/23 31,995 32,728 56,000 Toronto Hydro Corporation 3.49%
Feb 28/48 55,821 61,580 53,000 Toronto Hydro Corporation 3.54%
Nov 18/21 53,783 54,451 27,000 Toronto Hydro Corporation 3.55%
Jul 28/45 26,917 29,808 17,000 Toronto Hydro Corporation 3.96%
Apr 09/63 16,982 20,885 16,000 Toronto Hydro Corporation 4.08%
Sep 16/44 16,050 19,074 40,000 Toronto Hydro Corporation 5.54%
May 21/40 51,880 55,677 41,000 Toyota Credit Canada Inc. 1.75%
Jul 21/21 40,958 40,754 214,000 Toyota Credit Canada Inc. 2.02%
Feb 28/22 213,929 213,238 112,000 Toyota Credit Canada Inc. 2.20%
Feb 25/21 111,778 112,126 45,000 Toyota Credit Canada Inc. 2.35%
Jul 18/22 44,996 45,132 26,000 Toyota Credit Canada Inc. 2.62%
Oct 11/22 26,000 26,244 44,000 Toyota Credit Canada Inc. 2.64%
Mar 27/24 43,996 44,367

36
Tangerine Balanced Growth PortfolioAudited Annual Financial Statements for the year ended December 31, 2019(In Canadian dollars, unless otherwise indicated)
Schedule of InvestmentsAs at December 31, 2019
Par Value ($) Security
Average Cost ($)
Fair Value ($)
19,000 Toyota Credit Canada Inc. 2.70% Jan 25/23 18,988 19,227
75,000 Toyota Credit Canada Inc. 3.04% Jul 12/23 74,990 76,725
26,000 TransAlta Corporation 5.00% Nov 25/20 25,874 26,555 15,000 TransAlta Corporation 6.90% Nov 15/30 15,571 16,116 12,000 TransAlta Corporation 7.30% Oct 22/29 13,110 13,137
103,000 TransCanada PipeLines Limited 3.00% Sep 18/29 102,700 102,715
196,000 TransCanada PipeLines Limited 3.30% Jul 17/25 200,628 202,873
128,000 TransCanada PipeLines Limited 3.39% Mar 15/28 127,421 132,290
85,000 TransCanada PipeLines Limited 3.65% Nov 15/21 86,042 87,246
129,000 TransCanada PipeLines Limited 3.69% Jul 19/23 135,519 134,421
139,000 TransCanada PipeLines Limited 4.18% Jul 03/48 139,757 147,465
104,000 TransCanada PipeLines Limited 4.33% Sep 16/47 106,642 112,699
165,000 TransCanada PipeLines Limited 4.34% Oct 15/49 164,944 179,733
117,000 TransCanada PipeLines Limited 4.35% Jun 06/46 117,461 126,902
141,000 TransCanada PipeLines Limited 4.55% Nov 15/41 139,556 156,421
25,000 TransCanada PipeLines Limited 6.28% May 26/28 32,385 30,485
25,000 TransCanada PipeLines Limited 6.50% Dec 09/30 31,842 31,571
86,000 TransCanada PipeLines Limited 8.05% Feb 17/39 138,061 134,303
10,000 TransCanada PipeLines Limited 8.23% Jan 16/31 13,601 14,031
10,000 TransCanada PipeLines Limited 11.80% Nov 20/20 15,786 10,812
210,000 TransCanada Trust 4.65% May 18/77 213,374 204,064 42,000 TransEd Partners General Partnership
3.95% Sep 30/50 38,846 42,717 8,939 Trillium Windpower LP 5.80% Feb 15/33 8,939 10,336
11,000 University of Ottawa 3.26% Oct 12/56 11,000 11,799 13,000 University of Toronto 4.25% Dec 07/51 12,984 16,597 12,000 University of Western Ontario 4.80%
May 24/47 12,318 16,203 10,000 University of Windsor 5.37% Jun 29/46 10,564 14,103 32,000 Vancouver Airport Authority 2.87%
Oct 18/49 32,000 32,256 35,000 Vancouver Airport Authority 3.66%
Nov 23/48 35,000 40,474 29,000 Vancouver Airport Authority 3.86%
Nov 10/45 29,000 34,291 25,000 Vancouver International Airport
Authority 7.43% Dec 07/26 32,874 33,015 12,000 Ventas Canada Finance Limited 2.55%
Mar 15/23 11,994 11,985 71,000 Ventas Canada Finance Limited 2.80%
Apr 12/24 70,992 71,303 20,000 Ventas Canada Finance Limited 3.30%
Feb 01/22 19,998 20,335
Par Value ($) Security
Average Cost ($)
Fair Value ($)
53,000 Ventas Canada Finance Limited 4.13% Sep 30/24 52,789 55,938
55,000 Veresen Inc. 3.43% Nov 10/21 54,995 56,047 69,000 VW Credit Canada, Inc. 2.65% Jun 27/22 68,963 69,164 48,000 VW Credit Canada, Inc. 2.85% Sep 26/24 47,898 48,020 101,000 VW Credit Canada, Inc. 2.90% Mar 29/21 100,896 101,667 58,000 VW Credit Canada, Inc. 3.25% Mar 29/23 57,931 59,095 35,000 VW Credit Canada, Inc. 3.70% Nov 14/22 34,942 36,083
153,000 Wells Fargo Canada Corporation 3.04% Jan 29/21 154,059 154,529
55,000 Wells Fargo Canada Corporation 3.46% Jan 24/23 56,632 56,862
52,223 West Edmonton Mall Property Inc. 4.06% Feb 13/24 52,224 53,753
40,000 West Edmonton Mall Property Inc. 4.31% Feb 13/24 40,000 41,376
40,000 Westcoast Energy Inc. 3.12% Dec 05/22 39,314 40,890 71,000 Westcoast Energy Inc. 3.43% Sep 12/24 70,970 73,695 71,000 Westcoast Energy Inc. 3.77% Dec 08/25 71,581 75,323 7,000 Westcoast Energy Inc. 3.88% Oct 28/21 7,000 7,196
22,000 Westcoast Energy Inc. 4.57% Jul 02/20 23,607 22,260 29,000 Westcoast Energy Inc. 4.79% Oct 28/41 32,713 34,305 25,000 Westcoast Energy Inc. 7.15% Mar 20/31 34,515 33,607 25,000 Westcoast Energy Inc. 8.85% Jul 21/25 34,515 32,673
5,000 Windsor Canada Utilities Ltd. 4.13% Nov 06/42 4,999 5,426
29,000 Winnipeg Airports Authority Inc. 3.66% Sep 30/47 29,000 32,152
9,443 Winnipeg Airports Authority Inc. 6.10% Nov 20/40 11,632 12,373
2,311 York Region District School Board 6.45% Jun 04/24 2,855 2,538
8,000 York University 4.46% Feb 26/54 8,000 10,565 4,000 Yukon Development Corp. 5.00%
Jun 29/40 3,973 5,345 70,044,686 72,694,648
Total Fixed Income (22.7% of Net Assets) 239,341,885 247,078,475
Short-term Investments (0.0% of Net Assets)210,000 RBC Dominion Securities Inc. 1.70%
Jan 02/20 210,000 210,000
Total Short-term Investments 210,000 210,000
Total investments (99.6% of Net Assets) 829,085,511 1,086,084,364
Other assets less current liabilities (0.4% of Net Assets) 4,223,518
Net assets attributable to holdersof redeemable units (“Net Assets”) 1,090,307,882

37
Notes to the Financial Statements
Tangerine Balanced Growth PortfolioAudited Annual Financial Statements for the year ended December 31, 2019(In Canadian dollars, unless otherwise indicated)
1. Organization of the FundTangerine Balanced Growth Portfolio (the “Fund”) is an open-ended mutual fund trust established under the laws of Ontario. The Fund is governed by a Master Declaration of Trust dated November 19, 2008 and amended most recently on November 2, 2016.
The Fund is domiciled in Canada and its principal business office is located at 3389 Steeles Avenue East in Toronto, Ontario.
The Fund seeks to provide capital appreciation by investing in both fixed income and equity securities based on a targeted allocation among four different types of investments in the following proportions: Canadian bonds (25%), Canadian equities (25%), U.S. equities (25%) and International equities (25%). Each of the four investment types seeks to replicate, as closely as possible, the performance of a recognized securities index: the Canadian bonds component seeks to replicate the FTSE Canada Universe Bond Index; the Canadian equities component seeks to replicate the S&P/TSX 60 Index; the U.S. equities component seeks to replicate the S&P 500 Index; and the International equities component seeks to replicate the Morgan Stanley Capital International (“MSCI”) EAFE Index.
Tangerine Investment Management Inc. (the “Manager”) provides management services to the Fund. The principal distributor of the Fund is Tangerine Investment Funds Limited. Both companies are wholly owned subsidiaries of Tangerine Bank. Tangerine Bank is a wholly owned subsidiary of The Bank of Nova Scotia.
These financial statements were authorized for issue by the Manager on April 9, 2020.
2. Basis of Presentation These financial statements are prepared in accordance with International Financial Reporting Standards (“IFRS”) as issued by the International Accounting Standards Board (“IASB”).
The financial statements are prepared on a going concern basis using the historical cost convention, except for financial assets and liabilities that have been measured at fair value.
3. Summary of Significant Accounting Policies3a. Accounting estimates The preparation of financial statements requires the Manager to make judgments, estimates and assumptions that affect the reported amounts of assets, liabilities, income and expenses. The most significant uses of judgments, estimates and assumptions are to classify financial instruments held by the Fund and to determine the fair value of financial instruments. Actual results may differ from these estimates.
3b. Translation of foreign currencies The Fund’s functional and presentation currency is the Canadian dollar, which is the currency of the primary economic environment in which the Fund operates.
• Monetary assets and liabilities denominated in foreign currencies are translated into Canadian dollars at the rate of exchange prevailing at the Statements of Financial Position dates.
• Purchases and sales of investments classified as fair value recognized in profit and loss (“FVTPL”), investment income and expenses denominated in foreign currencies are translated into Canadian dollars at the rate of exchange prevailing on the respective dates of such transactions.
• Realized foreign currency gains (losses) on investments classified as FVTPL are included in the Statements of Comprehensive Income as part of “Net realized gain on investments”.
• Unrealized foreign currency gains (losses) on investments classified as FVTPL are included in the Statements of Comprehensive Income as part of “Change in unrealized appreciation (depreciation) on investments”.
• Realized and unrealized foreign currency gains (losses) on non-investment assets, liabilities and investment income denominated in foreign currencies are included in the Statements of Comprehensive Income as “Net realized loss on foreign exchange” and “Change in unrealized appreciation (depreciation) on foreign exchange”, respectively.

38
Notes to the Financial Statements
Tangerine Balanced Growth PortfolioAudited Annual Financial Statements for the year ended December 31, 2019(In Canadian dollars, unless otherwise indicated)
3c. Recognition and classification of financial instruments
The Fund recognizes a financial asset or a financial liability when, and only when, it becomes a party to the contractual provisions of the instrument. The Fund’s accounting policy regarding derivative instruments is described in note 3f.
The initial classification of a financial instrument depends upon the contractual cash flow characteristics of the financial assets as well as the Fund’s business model for managing the financial assets. This classification is not subsequently changed except in very limited circumstances.
All financial instruments, including regular way purchases and sales of financial assets, are initially recorded at fair value on the trade date, i.e., the date that the Fund commits to purchase or sell the asset. The subsequent measurement of all financial instruments depends on the initial classification.
Financial assets are those that are managed and whose performance is evaluated on a fair value basis and is neither held to collect contractual cash flows nor held both to collect contractual cash flows and to sell financial assets. The Fund is primarily focused on fair value information and uses that information to assess the assets’ performance and to make decisions. Consequently, all investments and derivatives of the Fund are classified as FVTPL. Financial assets classified as FVTPL are subsequently measured at fair value. The cost of investments classified as FVTPL represents the amount paid for each security, excluding transaction costs, and is determined on an average cost basis.
Income from FVTPL financial instruments are included directly in the Statements of Comprehensive Income and are reported as “Dividends”, “Interest for distribution purposes”, “Change in unrealized appreciation (depreciation) on investments” and “Net realized gain on investments”.
The Fund’s obligation for net assets attributable to holders of redeemable units represents a financial liability and is measured at the redemption amount. Other financial assets and financial liabilities are measured at amortized cost, which approximates their fair value. Under this method, financial assets and liabilities reflect the amount required to be received or paid, discounted, where appropriate, at the effective rate of interest.
3d. Derecognition of financial instrumentsFinancial assetsFinancial assets are derecognized when the rights to receive cash flows from the financial assets have expired or when the Fund has transferred substantially all the risks and rewards of ownership. If the Fund neither transfers nor retains substantially all the risks and rewards of ownership of a financial asset, it derecognizes the financial asset if it no longer has control over the asset.
In transfers where control over the asset is retained, the Fund continues to recognize the asset to the extent of its continuing involvement. The extent of the Fund’s continuing involvement is determined by the extent to which it is exposed to changes in the value of the asset.
Financial liabilitiesFinancial liabilities are derecognized when contractual obligations are met, revoked or have expired.
3e. Redeemable units The units of the Fund contain a contractual obligation for the Fund to repurchase or redeem them for cash or another financial asset and therefore do not meet the criteria in IFRS for classification as equity. Redeemable units are redeemable at the unitholders’ option and are classified as financial liabilities. Redeemable units can be put back to the Fund at any date for cash equal to a proportionate share of the Fund’s Net Assets. The redeemable units are carried at the redemption amount that is payable at the Statements of Financial Position date if the holder exercises the right to put the unit back to the Fund.
The redemption amount (“Net Assets”) is the net difference between total assets and all other liabilities of the Fund calculated in accordance with IFRS.
National Instrument 81-106, “Investment Fund Continuous Disclosure”, requires the Fund to calculate its daily Net Asset Value (“NAV”) for subscriptions and redemptions at the fair value of the Fund’s assets and liabilities. The Fund’s Net Asset Value Per Unit (“NAVPU”) at the date of issue or redemption is computed by dividing the NAV of the Fund by the total number of outstanding units of the Fund. The NAVPU is calculated as of the close of each day that the Toronto Stock Exchange is open for trading.
The calculations of the NAV and Net Assets are both based on the closed or last traded prices of “Investments”. As such, there is no difference between NAV and Net Assets at the Statements of Financial Position date.

39
Notes to the Financial Statements
Tangerine Balanced Growth PortfolioAudited Annual Financial Statements for the year ended December 31, 2019(In Canadian dollars, unless otherwise indicated)
3f. Derivative transactions The Fund is permitted by Canada’s securities law to use derivative instruments to achieve its investment objectives as set out in the Fund’s Simplified Prospectus. Derivatives are initially recognized at fair value on the date on which a derivative contract is entered into and are subsequently measured at their fair value. Derivative instruments are valued daily using normal exchange reporting sources for exchange-traded derivatives and specific broker enquiry for over-the-counter derivatives. All derivatives are carried as assets when fair value is positive and as liabilities when fair value is negative and are reported on the Statements of Financial Position.
3g. Transaction costs Transaction costs are incremental costs that are directly attributable to the acquisition, issue or disposal of an investment. These costs include fees and commissions paid to agents, advisors, brokers and dealers, levies by regulatory agencies and securities exchanges, and transfer taxes and duties. Transaction costs incurred in the purchase and sale of investments classified as FVTPL are expensed and are included in “Transaction costs” on the Statements of Comprehensive Income.
3h. Offsetting financial instrumentsFinancial assets and liabilities are offset and the net amount reported on the Statements of Financial Position when the Fund has a currently legally enforceable right to offset and the Fund either intends to settle on a net basis or realize the asset and settle the liability simultaneously.
3i. Fair value measurement and disclosureFair value estimationFair value is the price that would be received to sell an asset or paid to transfer a liability in an orderly transaction between market participants at the measurement date.
The fair value of financial instruments at the financial reporting date is determined as follows:
• Financial instruments that are traded in an active market are based on the quoted market prices at the close of trading on the reporting date. The Fund uses the last traded market prices for both financial assets and financial liabilities where the last traded price falls within the reporting day’s end bid-ask spread. In circumstances where the last traded price is not within the reporting day’s end bid-ask spread, the Manager determines the point within the bid-ask spread that is most representative of fair value.
• Financial instruments that are not traded in an active market are valued through valuation techniques using observable market inputs, on such basis and in such manner as established by the Manager.
• Bonds and similar securities are valued based on the closing quotation received from recognized investment dealers.
Fair value hierarchyIFRS requires disclosures relating to fair value measurements using a three-level fair value hierarchy that reflects the significance of the inputs used in measuring fair values.
The Fund’s policy for the three-level fair value hierarchy levels is as follows:
Level 1 – Fair values are based on unadjusted quoted prices from an active market for identical assets.
Level 2 – Fair values are based on inputs, other than quoted prices, that are directly or indirectly observable in an active market.
Level 3 – Fair values are based on inputs not observable in the market.
The Fund recognizes a transfer between levels of the fair value hierarchy as of the end of the reporting period during which the change occurred.
3j. Investment transactions and incomeInvestment transactions are accounted for on a trade date basis. Dividends including stock dividends, are recorded on the ex-dividend date. The “Interest for distribution purposes” on the Statements of Comprehensive Income represents the coupon interest received by the Fund, accounted for on an accrual basis. The Fund does not amortize premiums paid or discounts received on the purchase of fixed income securities.
Realized gain (loss) on sale of investments and unrealized appreciation (depreciation) on investments are determined on an average cost basis. Average cost does not include amortization of premiums or discounts on fixed income securities.

40
Notes to the Financial Statements
Tangerine Balanced Growth PortfolioAudited Annual Financial Statements for the year ended December 31, 2019(In Canadian dollars, unless otherwise indicated)
4a. Currency riskCurrency risk arises from financial instruments that are denominated in currencies other than the Canadian dollar. The Fund is exposed to the risk that the Canadian dollar value of investments and cash denominated in other currencies will fluctuate due to changes in exchange rates. When the value of the Canadian dollar falls in relation to foreign currencies, then the Canadian dollar value of foreign investments and cash rises. When the value of the Canadian dollar rises, the Canadian dollar value of foreign investments and cash falls. Other financial assets and financial liabilities that are denominated in foreign currencies do not expose the Fund to significant currency risk. The Fund may enter into foreign exchange forward contracts for hedging purposes to reduce its foreign currency exposure.
The tables below indicate, in Canadian dollar terms, the foreign currencies to which the Fund had significant exposure as at December 31, 2019 and December 31, 2018, including the underlying principal amount of forward currency contracts, if any. The tables also illustrate the potential impact to the Fund’s Net Assets, all other variables held constant, as a result of a 20% change in these currencies relative to the Canadian dollar. In practice, actual trading results may differ from this sensitivity analysis and the difference could be material.
December 31, 2019 Currency
Cash and investments ($)
As % of Net Assets
Impact on Net Assets ($)
Australian Dollar 18,343,889 1.68% 3,668,778
British Pound 43,944,689 4.03% 8,788,938
Danish Krone 4,817,943 0.44% 963,589
Euro 85,497,910 7.84% 17,099,582
Hong Kong Dollar 8,613,280 0.79% 1,722,656
Israeli Shekel 1,016,443 0.09% 203,289
Japanese Yen 65,939,021 6.05% 13,187,804
New Zealand Dollar 692,696 0.07% 138,539
Norwegian Krone 1,623,576 0.15% 324,715
Singapore Dollar 3,385,971 0.31% 677,194
Swedish Krona 7,070,726 0.65% 1,414,145
Swiss Franc 25,155,630 2.31% 5,031,126
U.S. Dollar 291,000,046 26.69% 58,200,009
Total 557,101,820 51.10% 111,420,364
3k. Securities lending The Fund qualifies to lend securities from time to time in order to earn additional income. The Fund receives collateral in the form of cash or qualified non-cash instruments having a fair value equal to at least 102% of the fair value of the securities loaned during the period. The Fund has the right to sell the non-cash collateral if the borrower defaults on its obligations under the transaction. The fair value of the loaned securities is determined at the close of each business day and any additional required collateral is delivered to the Fund on the following business day. Cash collateral is invested in cash equivalents. The loaned securities continue to be included in “Investments” on the Statements of Financial Position. The collateral pledged by the borrower and the related obligation of the Fund to return the collateral are not reported on the Statements of Financial Position and the Schedule of Investments.
Income on securities lending transactions is accrued with the passage of time and is included in “Securities lending income” on the Statements of Comprehensive Income.
3l. Increase (decrease) in net assets attributable to holders of redeemable units from operations per unit“Increase (decrease) in net assets attributable to holders of redeemable units from operations per unit” in the Statements of Comprehensive Income represents the “Increase (decrease) in net assets attributable to holders of redeemable units from operations” for the year divided by the weighted average number of units outstanding during the year.
3m. Cash Cash comprises of deposits in banks.
4. Financial Instrument RiskThe Fund’s activities expose it to a variety of financial risks. The Manager seeks to minimize potential adverse effects of these risks on the Fund’s performance by employing professional, experienced portfolio advisors; by daily monitoring of the Fund’s position and market events; by diversifying the investment portfolio within the constraints of the investment objectives; and by using derivatives to hedge certain risk exposures.

41
Notes to the Financial Statements
Tangerine Balanced Growth PortfolioAudited Annual Financial Statements for the year ended December 31, 2019(In Canadian dollars, unless otherwise indicated)
December 31, 2018 Currency
Cash and investments ($)
As % of Net Assets
Impact on Net Assets ($)
Australian Dollar 16,017,419 1.73% 3,203,484
British Pound 39,154,830 4.23% 7,830,966
Danish Krone 3,894,292 0.42% 778,858
Euro 70,802,543 7.66% 14,160,509
Hong Kong Dollar 7,962,515 0.86% 1,592,503
Israeli Shekel 769,371 0.08% 153,874
Japanese Yen 55,215,041 5.97% 11,043,008
New Zealand Dollar 426,317 0.05% 85,263
Norwegian Krone 1,630,858 0.18% 326,172
Singapore Dollar 3,069,858 0.33% 613,972
Swedish Krona 6,063,846 0.66% 1,212,769
Swiss Franc 19,500,227 2.11% 3,900,045
U.S. Dollar 225,766,945 24.42% 45,153,389
Total 450,274,062 48.70% 90,054,812
4b. Interest rate riskThe Fund is exposed to the risk that the fair value or future cash flows of interest-bearing financial instruments will fluctuate due to changes in the prevailing levels of market interest rates. The Fund’s portfolio of interest-bearing financial instruments consists of cash, short-term investments and fixed income securities comprising the FTSE Canada Universe Bond Index. The Fund’s exposure to interest rate risk arising from cash and short-term investments is minimal. The portfolio manager reviews the Fund’s overall interest rate sensitivity as part of the investment management process.
The following tables summarize the Fund’s exposure to interest rate risk by remaining term to maturity on fixed income securities:
0 – 3 years 3 – 5 years > 5 years Total
December 31, 2019
Bonds $57,348,396 $44,411,708 $145,318,371 $247,078,475
Short-term investments 210,000 — — 210,000
$57,558,396 $44,411,708 $145,318,371 $247,288,475
0 – 3 years 3 – 5 years > 5 years Total
December 31, 2018
Bonds $59,829,495 $49,448,598 $139,024,161 $248,302,254
Short-term investments 280,000 — — 280,000
$60,109,495 $49,448,598 $139,024,161 $248,582,254
As at December 31, 2019, had prevailing interest rates increased or decreased by 1%, assuming a parallel shift in the yield curve, with all other variables held constant, net assets would have decreased or increased by approximately $19,680,183 (December 31, 2018: $18,548,274) or 1.81% (December 31, 2018: 2.01%) of total Net Assets. The Fund’s sensitivity to interest rate changes was estimated using the weighted average duration of the bond portfolio. In practice, actual trading results may differ and the difference could be material.
4c. Other market riskOther market risk is the risk that the fair value or future cash flows of financial instruments will fluctuate as a result of changes in market prices (other than those arising from interest rate risk or currency risk), whether caused by factors specific to an individual investment, its issuer, or other factors affecting all instruments traded in a market or market segment. All securities present a risk of loss of capital. The Fund’s investment portfolio is susceptible to market price risk arising from uncertainties about future prices of the instruments. The Fund manages its exposure to other market risk by diversifying its portfolio of financial instruments between fixed income securities, equity securities and investments in various countries.
The table below indicates the change in Net Assets had the value of the Fund’s benchmarks increased or decreased by 10%, as at December 31, 2019 and December 31, 2018. This change is estimated based on the historical correlation between the return of the Fund and the return of the Fund’s benchmarks, using 12 monthly data points, as available. The historical correlation may not be representative of future correlation, and accordingly the impact on Net Assets could be materially different.

42
Notes to the Financial Statements
Tangerine Balanced Growth PortfolioAudited Annual Financial Statements for the year ended December 31, 2019(In Canadian dollars, unless otherwise indicated)
December 31, 2019 December 31, 2018
Benchmark Impact on Net Assets ($)
Impact on Net Assets ($)
FTSE Canada Universe Bond Index 24,891,044 25,167,445
S&P/TSX 60 Index 28,142,278 22,170,659
S&P 500 Index 28,875,377 22,244,039
Morgan Stanley Capital International EAFE Index 26,341,102 22,399,075
108,249,801 91,981,218
As at December 31, 2019, 76.93% (December 31, 2018: 72.67%) of the Fund’s Net Assets traded on global stock exchanges.
4d. Credit riskCredit risk is the risk that a counterparty to a financial instrument will fail to discharge an obligation or commitment that it has entered into with the Fund. The Fund’s exposure to credit risk mainly arises from the Fund’s investment in fixed income securities comprising the FTSE Canada Universe Bond Index and its participation in securities lending transactions. The fair value of debt securities includes consideration of the creditworthiness of the debt issuer. Credit ratings are obtained from Standard & Poor’s, Moody’s and/or Dominion Bond Rating Services. Under the securities lending program, the Fund holds collateral of at least 102% of the fair value of the loaned securities. The collateral holdings are adjusted daily to reflect changes in fair value for both the loaned securities and the securities held as collateral.
As at December 31, 2019 and December 31, 2018, debt securities by credit rating are as follows:
December 31, 2019 December 31, 2018
Debt securities by credit rating
As % of total debt securities
As % of total debt securities
AAA/Aaa 38% 41%
AA/Aa 37% 36%
A/A 14% 13%
BBB/Bbb 11% 10%
Total 100% 100%
All transactions executed by the Fund in listed securities are settled or paid for upon delivery using approved brokers. The risk of default is considered minimal as delivery of securities sold is only made once the broker has received payment. Payment is made on a purchase once the securities have been received by the broker. The trade will fail if either party fails to meet its obligation.
4e. Liquidity riskAll financial liabilities of the Fund mature in one year or less. In addition, the Fund is exposed to daily cash redemptions of redeemable units. Therefore, in accordance with securities legislation, the Fund maintains at least 90% of its assets in investments that are traded in an active market and can be readily disposed. In addition, the Fund retains sufficient cash and cash equivalent positions to maintain liquidity.
4f. Concentration riskConcentration risk arises as a result of the concentration of exposures within the same category, whether it is geographical location, asset type, industry sector or counterparty type.
The following is a summary of the Fund’s concentration risk by country:
As atDecember 31,
2019December 31,
2018
Country of Issue As % of Net Assets
As % of Net Assets
Canada 48.4 51.0
USA 25.5 23.3
Australia 1.6 1.7
Austria 0.1 0.1
Belgium 0.2 0.2
Bermuda 0.4 0.1
Cayman Islands 0.2 0.2
Denmark 0.4 0.4
Finland 0.3 0.3
France 2.6 2.5
Germany 2.1 2.1
Hong Kong 0.6 0.7
Ireland 0.8 0.7
Israel 0.1 0.1
Italy 0.5 0.5
Japan 6.0 6.0
Jersey 0.2 0.3
Luxembourg 0.1 0.1
Netherlands 1.3 1.1
New Zealand 0.1 –
Norway 0.1 0.2
Singapore 0.3 0.3
Spain 0.7 0.8
Sweden 0.6 0.6
Switzerland 2.4 2.2
United Kingdom 4.0 4.1
Total Investments 99.6 99.6

43
Notes to the Financial Statements
Tangerine Balanced Growth PortfolioAudited Annual Financial Statements for the year ended December 31, 2019(In Canadian dollars, unless otherwise indicated)
The following is a summary of the Fund’s concentration risk by industry grouping:
As atDecember 31,
2019December 31,
2018
Industry Grouping As % of Net Assets
As % of Net Assets
Equities
Communication Services 5.2 5.2
Consumer Discretionary 6.1 5.6
Consumer Staples 5.8 5.5
Energy 7.3 7.7
Financials 18.1 18.5
Health Care 7.6 7.3
Industrials 8.8 8.5
Information Technology 9.9 7.0
Materials 4.9 4.3
Real Estate 1.1 1.3
Utilities 2.1 1.8
Fixed Income
Fixed Income Issued or Guaranteed by Canadian Federal Government 7.5 9.8
Fixed Income Issued or Guaranteed by Canadian Provincial Government 8.2 9.3
Fixed Income Issued or Guaranteed by Canadian Municipal Government 0.3 0.3
Other Fixed Income 6.7 7.5
Total Investments 99.6 99.6
5. Fair Value DisclosureThe following tables categorize financial instruments recorded at fair value on the Statements of Financial Position into one of the three fair value hierarchy levels:
December 31, 2019 Level 1 ($) Level 2 ($) Level 3 ($) Total ($)
Equities 838,795,889 — — 838,795,889
Fixed Income — 247,078,475 — 247,078,475
Short-term investments
— 210,000 — 210,000
Total investments 838,795,889 247,288,475 — 1,086,084,364
December 31, 2018 Level 1 ($) Level 2 ($) Level 3 ($) Total ($)
Equities 671,939,015 — — 671,939,015
Fixed Income — 248,302,254 — 248,302,254
Short-term investments
— 280,000 — 280,000
Total investments 671,939,015 248,582,254 — 920,521,269
There were no level 3 investments held by the Fund as at December 31, 2019 and December 31, 2018. During the years ended December 31, 2019 and 2018, there were no transfers between Level 1 and Level 2.
6. Income TaxThe Fund qualifies as a mutual fund trust under the Income Tax Act (Canada) (the “Tax Act”) and, accordingly, is not subject to income tax on the portion of its net income, including net realized capital gains, which is paid or payable to unitholders. Such distributed income is taxable in the hands of the unitholders. The taxation year end for the Fund is December 15, 2019.
Temporary differences between the carrying value of assets and liabilities for accounting and income tax purposes give rise to deferred income tax assets and liabilities. The most significant temporary difference is between the reported fair value of the Fund’s investment portfolio and its adjusted cost base for income tax purposes. Since the Fund’s distribution policy is to distribute all net realized capital gains, deferred tax liabilities with respect to unrealized capital gains and deferred tax assets with respect to unrealized capital losses are not realized by the Fund and are, therefore, not recorded by the Fund.
As at December 31, 2019 and December 31, 2018, the Fund did not have a net capital loss or a non-capital loss that could be used to offset future taxable income.
The Fund incurs withholding taxes imposed by certain countries on investment income. Such income is recorded on a gross basis and the related withholding taxes are shown as a separate expense in the Statements of Comprehensive Income. For the purpose of the Statements of Cash Flows, cash inflows from dividend income are presented net of withholding taxes, when applicable.

44
Notes to the Financial Statements
Tangerine Balanced Growth PortfolioAudited Annual Financial Statements for the year ended December 31, 2019(In Canadian dollars, unless otherwise indicated)
7. Redeemable UnitsThe Fund is authorized to issue an unlimited number of transferable, redeemable trust units of one class, which represent an equal, undivided interest in the Net Assets of the Fund.
The capital of the Fund is represented by the net assets attributable to holders of the redeemable units with no par value. The units are entitled to distributions, if any, and to a proportionate share of the Fund’s net assets attributable to holders of redeemable units. Each unitholder has one vote for each unit owned as determined at the close of business on the record date for voting at a meeting. There are no voting rights attributed to fractions of a unit. The Fund has no restrictions or specific capital requirements on the subscriptions and redemptions of units.
The number of units issued, reinvested, redeemed and outstanding were as follows:
Number of units December 31, 2019 December 31, 2018
Balance – beginning of the year 65,090,689 58,657,207
Issued 10,527,151 13,463,019
Reinvested 1,073,501 1,337,211
Redeemed (9,497,473) (8,366,748)
Balance – end of the year 67,193,868 65,090,689
The Fund’s objectives are to manage capital to safeguard the Fund’s ability to continue as a going concern; to provide financial capacity and flexibility to meet its strategic objectives; and to provide an adequate return to unitholders commensurate with the level of risk while maximizing the distributions to unitholders.
Historically, the Fund has made distributions only to the extent that revenue exceeded expenses during the year. Since both the revenue and expenses of the Fund are reasonably predictable and stable and since the Fund does not have any externally imposed capital requirements, the Manager believes that current levels of distributions, capital and capital structure are sufficient to sustain ongoing operations. The Manager actively monitors the cash position and financial performance of the Fund to ensure resources are available to meet current distribution levels.
8. Securities LendingThere were no securities loaned and collateral held as at December 31, 2019 (December 31, 2018: $nil).
9. Soft Dollar CommissionsBrokerage business is allocated to brokers based on an assessment as to which broker can deliver the best results to the Fund. Business may be allocated to brokers that provide, in addition to transaction execution, investment research services which may or may not be used by the Manager during its investment decision-making process. No portion of the broker commissions were related to soft dollar costs during the year ended December 31, 2019 (December 31, 2018: $nil).
10. Related Party Transactions10a. Management fees, administration fees
and other expensesThe Manager charges fees in connection with management services at a rate of 0.80% per year of the Fund’s daily NAV. The Fund also pays a fixed administration fee to the Manager equal to 0.15% per year of the Fund’s daily NAV to cover regulatory filing fees and other day-to-day operating expenses including, but not limited to, recordkeeping, accounting and fund valuation costs, custodial fees, audit and legal fees, the costs of preparing and distributing annual and semi-annual reports, prospectuses, financial statements and investor communications. Finally, certain operating expenses are paid directly by the Fund, including the costs and expenses related to the Independent Review Committee; the cost of any government or regulatory requirements introduced after July 1, 2007; and borrowing costs and taxes (including, but not limited to, GST and HST). The Manager, at its sole discretion, may absorb a portion of the Fund’s expenses and these are reflected in the Statements of Comprehensive Income as “Rebated and absorbed expenses”.
10b. Buying and selling securitiesThe Fund invests in securities issued by The Bank of Nova Scotia. Refer to the Schedule of Investments for details.
11. Offsetting of Financial Assets and Financial Liabilities
The Fund has not offset financial assets and financial liabilities on its Statements of Financial Position nor does it transact in financial instruments that are subject to an enforceable master netting arrangement or similar agreement.

® Tangerine is a registered trademark of The Bank of Nova Scotia, used under licence.