Embed Size (px)
Citation preview

AU D I T E D F I N A N C I A L S TAT E M E N T S 2 0 1 2 – 2 0 1 3

PEPPERDINE UNIVERSITY
CONSOLIDATED FINANCIAL STATEMENTS
July 31, 2013 and 2012

PEPPERDINE UNIVERSITY
TABLE OF CONTENTS
Independent Auditor’s Report ................................................................................. 1 Financial Statements: Consolidated Statements of Financial Position .................................................. 2 Consolidated Statements of Activities ............................................................... 3 – 4 Consolidated Statements of Cash Flows ............................................................ 5 Notes to Consolidated Financial Statements ...................................................... 6 – 31

PricewaterhouseCoopers LLP, 601 South Figueroa Street, Los Angeles, CA 90017 T: (213) 356 6000, F: (813) 637 4444, www.pwc.com/us
Independent Auditor’s Report
To the Board of Regents of
Pepperdine University We have audited the accompanying consolidated financial statements of Pepperdine University (the “University”), which comprise the consolidated statements of financial position as of July 31, 2013 and 2012 and the related consolidated statements of activities and cash flows for the years then ended. Management’s Responsibility for the Financial Statements Management is responsible for the preparation and fair presentation of the consolidated financial statements in accordance with accounting principles generally accepted in the United States of America; this includes the design, implementation and maintenance of internal control relevant to the preparation and fair presentation of consolidated financial statements that are free from material misstatement, whether due to fraud or error. Auditor’s Responsibility Our responsibility is to express an opinion on the consolidated financial statements based on our audits. We conducted our audits in accordance with auditing standards generally accepted in the United States of America. Those standards require that we plan and perform the audits to obtain reasonable assurance about whether the consolidated financial statements are free from material misstatement. An audit involves performing procedures to obtain audit evidence about the amounts and disclosures in the consolidated financial statements. The procedures selected depend on our judgment, including the assessment of the risks of material misstatement of the consolidated financial statements, whether due to fraud or error. In making those risk assessments, we consider internal control relevant to the University’s preparation and fair presentation of the consolidated financial statements in order to design audit procedures that are appropriate in the circumstances, but not for the purpose of expressing an opinion on the effectiveness of the University’s internal control. Accordingly, we express no such opinion. An audit also includes evaluating the appropriateness of accounting policies used and the reasonableness of significant accounting estimates made by management, as well as evaluating the overall presentation of the consolidated financial statements. We believe that the audit evidence we have obtained is sufficient and appropriate to provide a basis for our audit opinion. Opinion In our opinion, the consolidated financial statements referred to above present fairly, in all material respects, the financial position of Pepperdine University at July 31, 2013 and 2012 and the changes in its net assets and its cash flows for the years then ended in accordance with accounting principles generally accepted in the United States of America.
November 22, 2013

PEPPERDINE UNIVERSITYConsolidated Statements of Financial Position
At July 31, 2013 and 2012(In thousands)
See accompanying notes to consolidated financial statements.
2
2013 2012ASSETS
Cash and cash equivalents………………………………… 68,941$ 73,625$ Student receivables, less allowance for doubtful accounts of $1,343 and $1,410, respectively… 1,295 1,183 Other accounts receivable……………………………….. 4,062 3,119 Prepaid expenses, inventories and other assets…………… 5,512 4,903 Student loans, less allowance for loan losses of $1,599 and $1,707, respectively………… 22,749 23,812 Contributions receivable, net……………….…………… 30,597 28,905 Investments……………………………………………… 830,726 767,261 Assets held as trustee or agent…………………………… 123,843 124,459 Property, facilities and equipment, net…………...……… 362,409 341,180 Total assets………………………………………….. 1,450,134$ 1,368,447$
LIABILITIES AND NET ASSETS
Liabilities: Accounts payable and accrued liabilities……………… 28,855$ 15,730$ Accrued salaries and wages………………..…………… 3,579 3,364 Student deposits, advance payments and deferred revenue…………………………..…………… 9,977 10,012 Asset retirement obligations………………..…………… 5,912 5,720 U.S. government-funded student loans…………...…… 15,340 15,006 Trust and agency obligations…………………………… 70,754 74,951 Long-term obligations……………………………..…… 238,750 239,422 Total liabilities……………………………………….. 373,167 364,205 Net assets: Unrestricted……………………………………………. 630,777 595,418 Temporarily restricted……………………..…………… 118,605 103,043 Permanently restricted………………………..………… 327,585 305,781 Total net assets………………………………………. 1,076,967 1,004,242 Total liabilities and net assets………………………… 1,450,134$ 1,368,447$

PEPPERDINE UNIVERSITYConsolidated Statement of Activities
For the year ended July 31, 2013(In thousands)
See accompanying notes to consolidated financial statements.
3
Temporarily Permanently Unrestricted Restricted Restricted Total
REVENUES Student tuition and fees………………………...………… 280,531$ -$ -$ 280,531$ Less student aid………………………………………… (88,797) (88,797) Net student tuition and fees……………………….…… 191,734 - - 191,734
Room and board…………………….…………………… 34,675 - - 34,675 Private gifts and grants…………………….……………… 12,098 5,171 4,265 21,534 Endowment support……………………………….……… 32,855 - 365 33,220 Government grants……………….…………………...…… 3,546 - - 3,546 Sales and services………………………………...……… 7,032 - - 7,032 Other revenue……………………………………………… 5,455 4,621 614 10,690 Net assets released from restriction…………………..…… 8,890 (8,890) - - Total revenues…………………………………..……… 296,285 902 5,244 302,431
EXPENSES
Instruction and research……………………………….… 86,348 - - 86,348 Academic support……………………………………..… 51,670 - - 51,670 Student services………………………………………….. 48,381 - - 48,381 Public service……………………………………….…… 14,168 - - 14,168 Auxiliary enterprises………………………………...…… 26,331 - - 26,331 Management and general…………………………...…… 52,609 - - 52,609 Membership development……………………………….… 2,036 - - 2,036 Fundraising………………………………..……………… 7,431 - - 7,431 Total expenses………………………………...……… 288,974 - - 288,974
Change in net assets before nonoperating revenues and expenses……………………….…… 7,311 902 5,244 13,457
NON-OPERATING REVENUES AND EXPENSES
Actuarial adjustment………………………………...…… - 4,090 (76) 4,014 Investment income: Dividends…………………………………...…………… 6,773 2,016 7 8,796 Interest……………………………………………….…… 299 8 83 390 Other……………………………………………….…… 6,731 - 3 6,734 Investment expenses……………………………………… (3,018) (965) - (3,983) Net realized and unrealized investment gains…………… 17,806 7,526 14,424 39,756 Foreign currency translation……………………………… 1,362 1,362 Other……………………………………………………… (1,905) 1,985 2,119 2,199 Total nonoperating revenues and expenses…………… 28,048 14,660 16,560 59,268
Change in net assets……………………………………… 35,359 15,562 21,804 72,725
Net assets at beginning of year…………………….…… 595,418 103,043 305,781 1,004,242 Net assets at end of year………………………….…… 630,777$ 118,605$ 327,585$ 1,076,967$

PEPPERDINE UNIVERSITYConsolidated Statement of Activities
For the year ended July 31, 2012(In thousands)
See accompanying notes to consolidated financial statements.
4
Temporarily Permanently Unrestricted Restricted Restricted Total
REVENUES
Student tuition and fees………………………...………… 269,884$ -$ -$ 269,884$ Less student aid………………………………………… (81,350) - - (81,350) Net student tuition and fees……………………….…… 188,534 - - 188,534
Room and board…………………….…………………… 32,465 - - 32,465 Private gifts and grants…………………….……………… 10,905 6,058 5,960 22,923 Endowment support……………………………….……… 31,527 115 361 32,003 Government grants……………….…………………...…… 3,624 3 - 3,627 Sales and services………………………………...……… 6,273 - - 6,273 Other revenue……………………………………………… 4,344 18 1,054 5,416 Net assets released from restriction…………………..…… 26,744 (26,881) 137 - Total revenues…………………………………..……… 304,416 (20,687) 7,512 291,241
EXPENSES
Instruction and research……………………………….… 84,163 - - 84,163 Academic support……………………………………..… 49,506 - - 49,506 Student services………………………………………….. 48,806 - - 48,806 Public service……………………………………….…… 15,009 - - 15,009 Auxiliary enterprises………………………………...…… 23,744 - - 23,744 Management and general…………………………...…… 46,608 - - 46,608 Membership development……………………………….… 1,824 - - 1,824 Fundraising………………………………..……………… 7,707 - - 7,707 Total expenses………………………………...……… 277,367 - - 277,367
Change in net assets before nonoperating revenues and expenses……………………….…… 27,049 (20,687) 7,512 13,874
NON-OPERATING REVENUES AND EXPENSES
Actuarial adjustment………………………………...…… - (5,635) (2,030) (7,665) Investment income: Dividends…………………………………...…………… 6,632 1,776 1 8,409 Interest……………………………………………….…… 1,135 5 147 1,287 Other……………………………………………….…… 7,599 16 4 7,619 Investment expenses……………………………………… (3,246) (901) - (4,147) Net realized and unrealized investment losses…………… (16,788) (6,585) (3,723) (27,096) Foreign currency translation……………………………… (2,606) - - (2,606) Other……………………………………………………… (60) 2,676 (1,130) 1,486 Total nonoperating revenues and expenses…………… (7,334) (8,648) (6,731) (22,713)
Change in net assets……………………………………… 19,715 (29,335) 781 (8,839)
Net assets at beginning of year…………………….…… 575,703$ 132,378$ 305,000$ 1,013,081$ Net assets at end of year………………………….…… 595,418$ 103,043$ 305,781$ 1,004,242$

PEPPERDINE UNIVERSITYConsolidated Statements of Cash Flows
For the Years Ended July 31, 2013 and 2012(In thousands)
See accompanying notes to consolidated financial statements.
5
CASH FLOWS FROM OPERATING ACTIVITIES 2013 2012 Change in net assets…………………………………………………………………… 72,725$ (8,839)$ Adjustments to reconcile change in net assets to net cash and cash equivalents provided by operating activities: Depreciation and amortization……………………………………………………… 19,630 19,781 Provision for doubtful accounts…………………………………………………… - 200 Loss on early extinguishment of debt……………………………………………… - 333 Non-cash gifts……………………….……………………………………………… (8,869) (8,876) Adjustment of actuarial liability…………………………………………………… (4,014) 7,665 Contributions restricted for long-term investment………………………………… (2,030) (2,931) Income restricted for long-term investment………………………………………… (365) (361) Premium on issuance of long-term debt…………………………………………… - 8,488 Loss from sale of property, facilities and equipment……………………………… 70 200 Net realized and unrealized (gains) losses on investments………………………… (39,756) 27,096 Change in assets and liabilities: Student receivables………………………………………………………………… (112) 454 Other accounts receivable……………………………..………………………… (943) 1,703 Contributions receivable………………………...………………………………… (3,507) (2,072) Prepaid expenses, inventories and other assets……………….…………………… (764) (759) Accounts payable and accrued liabilities…………………………….…………… 4,262 (1,028) Accrued salaries and wages……………………………………………………… 215 148 Student deposits, advance payments and deferred revenue……………………… 24 1,428 Net cash and cash equivalents provided by operating activities………………… 36,566 42,630 CASH FLOWS FROM INVESTING ACTIVITIES Proceeds from sales of investments………………………………………………… 73,724 163,060 Purchases of investments…………………………………………………………… (95,014) (168,193) Purchases of property, facilities and equipment…………………………………… (26,886) (13,977) Student loans repaid………………………………………………………………… 4,565 4,319 Student loans issued….…..…...…………………………………………………… (3,502) (3,618) Net cash and cash equivalents used in investing activities……………………… (47,113) (18,409) CASH FLOWS FROM FINANCING ACTIVITIES Proceeds from contributions restricted for long-term investment……………………………………………………………… 3,845 3,851 Income restricted for long-term investment………………………………………… 365 361 Proceeds from issuance of long-term obligations…………………………………… - 50,000 Principal payments on long-term obligations……………………………………… - (45,000) Increase in U.S. government student loan funds…………………………………… 333 321 Investment income (losses) and gains on annuities payable………………………… 8,885 (2,435) Payment of trust and agency obligations…………………………………………… (7,565) (7,866) Net cash and cash equivalents provided by (used in) financing activities……… 5,863 (768)
Net change in cash and cash equivalents………………………………………… (4,684) 23,453 Cash and cash equivalents at beginning of year………………………………………… 73,625 50,172 Cash and cash equivalents at end of year……………………………………………… 68,941$ 73,625$

PEPPERDINE UNIVERSITY
Notes to Consolidated Financial Statements
1. Nature of Operations
Pepperdine University (the “University”) is an independent private Christian university committed to the highest standards of academic excellence and Christian values, where students are strengthened for lives of purpose, service, and leadership. The University enrolls approximately 7,300 students in its five colleges and schools. Seaver College, the University’s undergraduate liberal arts college, the School of Law, and the School of Public Policy are headquartered on 830 acres in the Santa Monica Mountains overlooking the Pacific Ocean in Malibu, California. The Graduate School of Education and Psychology and the George L. Graziadio School of Business and Management are headquartered at the University’s West Los Angeles, California graduate campus.
Mr. George Pepperdine, the founder of Western Auto Supply Company, established George
Pepperdine College in 1937. He envisioned a college with the highest academic standards guided by the spiritual and ethical ideals of Christian faith. University status was achieved in 1970 with the addition of the graduate and professional schools. Through the generosity of Mrs. Frank Roger Seaver, the University’s Malibu campus of Seaver College opened in 1972. Since then, the Malibu campus expanded to include the School of Law in 1978, and the Drescher Graduate Campus in 2003.
The University operates several consolidated affiliated companies. All material transactions and
balances between the University and its affiliates have been eliminated in consolidation.
2. Summary of Significant Accounting Policies
Basis of Presentation
The accompanying Consolidated Financial Statements of the University are prepared on the accrual basis of accounting in accordance with accounting principles generally accepted in the United States of America (“GAAP”) applicable to not-for-profit organizations. In preparing the Consolidated Financial Statements, management is required to make estimates and assumptions that affect the reported amounts of assets and liabilities and the disclosure of contingent assets and liabilities and revenues and expenses for the periods presented. Significant items which could be materially affected by such estimates include: the allowance for doubtful accounts, the allowance for loan losses, contributions receivable, investments, assets held as trustee or agent, accounts payable and accrued liabilities and trust and agency obligations. The University’s actual results could differ significantly from management’s estimates. Management also utilizes certain estimates based on square footage to allocate depreciation, interest expense and central plant operations expense to the functional expense categories included on the Consolidated Statements of Activities.
Adoption of New Accounting Pronouncements
The University has adopted the required disclosures under ASU 2011-04, Fair Value Measurement
(Topic 820) – Amendments to Achieve Common Fair Value Measurement and Disclosure Requirements in U.S. GAAP and IFRS. These disclosures primarily relate to Level 3 measurements including a description of the valuation processes and a narrative description of the sensitivity of the fair value to changes in unobservable inputs, quantitative disclosure about unobservable inputs and assumptions excluding investments measured at Net Asset Value (“NAV”). In addition, the new guidance requires disclosure of all transfers between Level 1 and Level 2, regardless of significance. The University adopted this guidance effective August 1, 2012, with no material impact on the financial statements.
6
PEPPERDINE UNIVERSITY
Notes to Consolidated Financial Statements
The University has also adopted the required disclosures under ASU 2013-03 Clarifying the Scope and Applicability of a Particular Disclosure to Nonpublic Entities. This update clarifies that nonpublic entities are not required to disclose the level of the fair value hierarchy (i.e., Level 1, 2, or 3) for fair value measurements that are disclosed in the footnotes to the financial statements but not reported at fair value in the statement of financial position. The University adopted this guidance effective February 7, 2013, with no material impact on the financial statements.
Income Taxes As a not-for-profit educational institution, the University is exempt from Federal and California
income taxes under Section 501(c)(3) of the Internal Revenue Code and Section 23701(d) of the California Revenue and Taxation Code, except for taxes on unrelated business income. Since the University’s unrelated business income for the years ended July 31, 2013 and 2012 was immaterial, no provision for income taxes has been made in the accompanying Consolidated Financial Statements.
Net Assets
The University is required to classify its net assets into the following three categories according to
donor-imposed restrictions or provisions of law: Unrestricted net assets represent resources that are not restricted, either temporarily or permanently,
by donor-imposed stipulations. They are available for support of all organizational operations and services.
Temporarily restricted net assets represent contributions and other assets whose use are limited by donor-imposed stipulations. These restrictions are temporary in that they either expire by the passage of time or by the fulfillment of certain obligations of the University pursuant to those stipulations.
Permanently restricted net assets represent contributions and other assets whose use by the University are limited by donor-imposed stipulations. These restrictions are permanent in that they neither expire by passage of time nor can they be otherwise removed by the University. Income from these assets can be unrestricted or restricted based on donor stipulations.
During the year ended July 31, 2012, $21.9 million of net assets related to capital projects
completed in prior years were released from restriction. The University does not believe that this correction has a material impact to the current or previously issued financial statements.
Revenue Recognition
Student tuition and fees and room and board are recorded as revenues in the period the services are rendered. Private gifts, including unconditional promises to give, are recognized as revenue in the period received and are reported as increases in the appropriate category of net assets. Conditional or contingent grant awards are not recorded as revenue until the conditions on which they depend have been substantially met. Grants received from departments or agencies of the government considered to be exchange transactions are not recorded as revenue until related costs are incurred. These revenues are subject to audit by government authorities. A receivable is recorded to represent expenditures incurred prior to the fiscal year end for which cash reimbursement has not been received. Endowment support, limited to the payout calculated under the Total Rate of Return methodology, is comprised of ordinary income earned on endowment and quasi-endowment assets as well as accumulated gains earned on endowment and quasi-endowment assets in previous years.
7

PEPPERDINE UNIVERSITY
Notes to Consolidated Financial Statements
Concentrations of Financial Aid
A significant number of students attending the University receive financial assistance from U.S. government student financial aid programs. These programs require the University to comply with record keeping, eligibility and other requirements. Failure to comply with such U.S. government requirements could result in the loss of U.S. government financial assistance to the University’s students and adversely impact the operations of the University.
Cash and Cash Equivalents
Cash and cash equivalents include cash on hand, cash in checking and savings accounts, money-market funds, cash held by external investment managers and short-term investments with an original maturity of three months or less. Other short-term resources held by external investment managers are classified as investments.
Student Receivables
Student receivables are carried at cost, less an allowance for doubtful accounts. Management believes that the allowance for doubtful accounts is adequate. Management uses
available information to recognize losses on student receivables. Future additions to the allowance may be necessary based on changes in economic conditions and other factors.
Student Loans
Student loans are recorded at the contractual amounts owed by students adjusted for unamortized discounts, premiums, unearned income, undisbursed funds, deferred loan fees and the allowance for loan losses. Interest income is recorded on the accrual basis of accounting in accordance with the terms of the receivables, except that interest accruals are discontinued when the payment of principal or interest is 90 or more days past due or when repayment of principal and interest in full is doubtful. Payments received on non-accrual loans are applied to the principal outstanding until the loan is restored to accrual status.
A student loan is impaired when it is probable that the University will be unable to collect all
amounts due according to the contractual terms of the loan agreement. The measurement of impairment may be based on (i) the present value of the expected future cash flows of the impaired loan discounted at the loan’s original effective interest rate or (ii) the observable market price of the impaired loan. If the recorded investment of the loan exceeds the measure of impairment, a valuation allowance is recorded in the amount of the excess. The University measures impairment by utilizing a discounted cash flow analysis. The University’s income recognition policies for impaired loans are consistent with those for non-accrual loans. All loans designated as impaired are either placed on non-accrual status or are designated as restructured. Payments received on impaired loans are applied to the principal outstanding until the loan is returned to accrual status.
On an ongoing basis, management monitors the student loan portfolio and evaluates the adequacy
of the allowance for loan losses. In determining the adequacy of the allowance for loan losses, management considers such factors as historical loss experience, known problem loans, assessment of economic conditions and other appropriate data to identify the risks in the student loan portfolio. The amount of the allowance for loan losses is based on estimates and the University’s actual losses may
8

PEPPERDINE UNIVERSITY
Notes to Consolidated Financial Statements
vary from management’s estimates. Loans deemed by management to be uncollectible are charged to the allowance for loan losses. Recoveries on loans previously charged off are credited to the allowance for loan losses. Provisions for loan losses are charged to expense and credited to the allowance for loan losses in amounts that are deemed appropriate by management based upon its evaluation of the known and inherent risks in the student loan portfolio.
Management believes that the allowance for loan losses is adequate. Management uses available
information to recognize losses on loans. Future additions to the allowance may be necessary based on changes in economic conditions and other factors.
Contributions Receivable
Contributions, including unconditional promises to give, are recognized as revenue in the period
received and are reported as increases in the appropriate category of net assets. Contributions where donor restrictions are met in the same fiscal year as the contribution is made are reported as unrestricted support. Conditional promises to give are not recognized until they become unconditional, that is, when the conditions on which they depend are substantially met. Contributions of assets other than cash are recorded at their estimated fair value. Contributions to be received in future periods are discounted at a credit-adjusted interest rate.
Investments
Investments are stated at fair value and all related transactions are recorded on the trade date. The fair value of investments is based on quoted market prices from national security exchanges, except for alternative investments for which quoted market prices are not available. The fair value of certain alternative investments, which include limited partnerships in venture capital, real estate and other private debt and equity funds, is typically Net Asset Value (“NAV”), provided by the external investment managers or general partners, adjusted for receipts and disbursements of cash and distributions of securities if the date of valuation is prior to the University’s fiscal year end. Such valuations generally reflect discounts for illiquidity and consider variables such as financial performance of investments, recent sales prices of investments and other pertinent information. The University believes the carrying amount of these financial instruments is a reasonable estimate of fair value. For those investments that are not traded on a ready market, the estimates of their fair value may differ from the value that would have been used had a ready market for those investments existed.
Realized and unrealized gains and losses are accounted for within unrestricted net assets, or as
changes in temporarily or permanently restricted net assets if so stipulated by the donor of such assets.
Pooled Assets The University manages two separate investment pools designated as Pool A and Pool D. Pooled
investments and allocation of pooled investment income are accounted for using the unit market value method.
The Total Rate of Return methodology is utilized for Pool A which consists primarily of funds
functioning as endowment, including both quasi and true endowment funds. The annual total payout is calculated based on an approved spending rate that is applied to a five-year monthly average market value of Pool A funds. For fiscal years 2013 and 2012 the approved spending rate was 5.0%.
9

PEPPERDINE UNIVERSITY
Notes to Consolidated Financial Statements
Pool D is the charitable gift annuity reserve pool and is invested in accordance with California State Insurance Commission requirements.
Endowment The University’s endowment consists of 362 individual donor-restricted endowment funds and 61
University-designated quasi-endowment funds for a variety of purposes. The net assets associated with endowment funds, including funds designated by the University to function as endowments, are classified and reported based on the existence or absence of donor-imposed restrictions.
The University has interpreted the Uniform Prudent Management of Institutional Funds Act
(“UPMIFA”) as allowing the University to appropriate for expenditure or accumulate so much of an endowment fund as the University determines is prudent for the uses, benefits, purposes, and duration for which the endowment funding is established, subject to the intent of the donor as expressed in the gift instrument. As a result of this interpretation, the University classifies as permanently restricted net assets (a) the original value of gifts donated to the permanent endowment, (b) the original value of subsequent gifts to the permanent endowment, and (c) accumulations to the permanent endowment made in accordance with the direction of the applicable donor gift. The remaining portion of donor-restricted net assets is classified as temporarily restricted net assets until those amounts are appropriated for expenditure by the University in a manner consistent with the standard of prudence prescribed by UPMIFA. In accordance with UPMIFA, the University considers the following factors in making a determination to appropriate or accumulate endowment funds:
1) The duration and preservation of the fund 2) The purposes of the University and the donor-restricted endowment fund 3) General economic conditions 4) The possible effect of inflation and deflation 5) The expected total return from income and the appreciation of investments 6) Other resources of the University 7) The investment policies of the University
Additionally, the University is the irrevocable income and principal beneficiary of the Blanche E.
Seaver Endowed Trust which was recorded at $139.6 million and $125.2 million at July 31, 2013 and 2012, respectively.
Derivatives
From time to time, the University enters into derivative transactions either as part of its overall
investment asset allocation or as a specific hedge or risk management tool. Derivatives used as part of the asset allocation strategy are recorded at fair value with realized and unrealized gains and losses reflected in the Consolidated Statements of Activities. These derivatives are included in the investment portfolio.
Derivatives used to economically hedge specific operations, such as interest rate swaps and foreign
currency contracts, are discussed under the heading, “Foreign Currency Management.”
Assets Held As Trustee or Agent
The University uses the actuarial method of recording charitable gift annuities and charitable remainder trusts. When a gift is received, the fair value of the gift received is recorded as an asset and
10

PEPPERDINE UNIVERSITY
Notes to Consolidated Financial Statements
the present value of the related amounts due is recorded as a liability based on United States Internal Revenue Service life expectancy tables and the remainder is recorded as private gift and grant revenue in the appropriate net asset category on the Consolidated Statements of Activities. Investment income is credited, and annuity payments, direct costs of funds management, and investment losses are charged to the related liability. In situations where trust assets are not readily convertible to cash, annuitant payments have been made by the University. For life contingent gifts, the liability is adjusted annually based on the changes in the expected life. This adjustment is reflected as an adjustment of the actuarial liability on the Consolidated Statements of Activities. At July 31, 2013 and 2012, the estimated future payments to be made by the University have been discounted at 1.4% per annum and 1.2% per annum, respectively.
Remainder interests in real estate are recorded at their estimated fair value at the date of gift.
Investment income and gains are credited, and direct costs of asset management and investment losses are charged to the related net asset category.
The University and its consolidated subsidiaries have legal title, either in their name or as trustee, to
the charitable gift annuities, charitable remainder trusts, and life estates subject to life interests of the beneficiaries. No significant financial benefit can be realized until the contractual obligations are released.
Deferred Compensation Plans
Contributions to the University’s deferred compensation plan under Section 457(b) and 457(f) of
the United States Internal Revenue Code are carried at fair value with an equal and offsetting obligation to pay the employees as a component of trust and agency obligations on the Consolidated Statements of Financial Position.
Property, Facilities and Equipment
Property, facilities and equipment are stated at cost or, if received by gift, at fair value at the date of
the gift. Depreciation on buildings, improvements, furniture, fixtures and equipment is provided on a straight-line basis over the estimated useful lives as described in the table below:
Amounts spent for repairs and maintenance are charged to expense as incurred. When assets are
sold or retired, the associated cost and accumulated depreciation are removed. Any gain or loss from such disposition is recorded as a component of other non-operating revenues and expenses on the Consolidated Statements of Activities.
Debt Issuance Costs
Capitalized debt issue costs are included in prepaid expenses, inventories, and other assets and are amortized over the life of the related debt using the effective interest method.
Asset Class Useful Life Furniture and Other Equipment 10-15 years
Computer Hardware and Software 2-10 years Motor Vehicles 5 years
Buildings 20-70 years Land Improvements 20 years
11
PEPPERDINE UNIVERSITY
Notes to Consolidated Financial Statements
U.S. Government-Funded Student Loans Funds provided by the United States government under the Federal Perkins Loan Program are
loaned to qualified students and may be loaned again after their collection. These funds are ultimately refundable to the U.S. government and as such are included as liabilities in the Consolidated Statements of Financial Position.
Foreign Currency Management
The University uses derivative financial instruments to reduce its net exposure to currency
fluctuations. As such, the University enters into forward contracts and purchases currency futures (principally the Euro, the British pound, Argentinian Peso, and Swiss francs) to economically hedge forecasted cash flows denominated in foreign currencies. The purpose of the University’s foreign currency hedging activities is to reduce the risk that eventual United States dollar net cash outflows resulting from costs outside the U.S. will be adversely affected by changes in exchange rates.
For the years ended July 31, 2013 and 2012, the University recorded approximately $1.4 million in
net gains and $2.6 million in net losses on foreign currency hedging transactions, respectively.
Asset Retirement Obligations The University recognizes liabilities for legal obligations associated with the retirement of tangible
long-lived assets when the timing and/or method of settlement of the obligation is conditional on a future event. The fair value of a liability for a conditional asset retirement obligation is recognized in the period in which it occurrs if a reasonable estimate of fair value can be made.
Reclassifications
Certain amounts were reclassified for the year ended July 31, 2012 to conform to year ended July 31, 2013 presentation.
12

PEPPERDINE UNIVERSITY
Notes to Consolidated Financial Statements
3. Student Receivables Student receivables consist of the following at July 31, 2013 and 2012:
2013 2012 (In thousands)
Graziadio School of Business and Management. ... $1,306 $1,456 Seaver College. ....................................................... 911 556 Graduate School of Education and Psychology ...... 296 521 Other ....................................................................... 125 60 Gross student receivables ..................................... 2,638 2,593 Allowance for doubtful accounts. ......................... (1,343) (1,410) $1,295 $1,183
Activity in the allowance for doubtful accounts was as follows:
For the year ended July 31,
2013 2012 (In thousands)
Beginning balance .................................................. $1,410 $1,374 Provision for doubtful accounts .............................. - 200 Accounts charged off .............................................. (217) (462) Recoveries of previously charged-off accounts 150 298 Net charge-offs ..................................................... (67) (164)
Ending balance ........................................................ $1,343 $1,410
13

PEPPERDINE UNIVERSITY
Notes to Consolidated Financial Statements
4. Student Loans Student loans consist of the following at July 31, 2013 and 2012:
2013 2012 (In thousands)
Perkins. ................................................................... $13,477 $14,242 Weingart ................................................................. 9,006 9,676 Other. ...................................................................... 1,865 1,601 Gross student loans. .............................................. 24,348 25,519 Allowance for loan losses. .................................... (1,599) (1,707) $22,749 $23,812
Activity in the allowance for loan losses was as follows:
For the year ended July 31, 2013 2012 (In thousands)
Beginning balance .................................................. 1,707 $1,697 Loans charged-off ................................................... (228) (169) Recoveries of previously charged-off loans. .......... 120 179 Net charge offs ...................................................... (108) 10
Ending balance ........................................................ $1,599 $1,707
The following is an aging of student loans at July 31, 2013:
Current
1-60 days past due
61-120
days past due
> 120
days past due
Total (In thousands) Perkins…………. $11,977 $ 356 $189 $955 $13,477 Weingart…….…. 8,592 270 11 133 9,006 Other………..…. 1,540 213 19 93 1,865 $22,109 $ 839 $219 $1,181 $24,348
14

PEPPERDINE UNIVERSITY
Notes to Consolidated Financial Statements
5. Contributions Receivable
Unconditional promises to give with payments due in future periods are reported as temporarily or permanently restricted support. Unconditional promises to give are recorded at their discounted present value based on a credit-adjusted interest rate. At July 31, 2013, the discount rate applied to contributions receivable ranged from 0.11% per annum to 2.68% per annum and at July 31, 2012 ranged from 0.16% per annum to 1.63% per annum.
The following table provides a summary of contributions receivable by expected collection date at
July 31, 2013 and 2012:
2013 2012 (In thousands)
In one year or less. ...................................................... $ 3,858 $ 1,018 Between one and five years. ....................................... 3,013 9,043 More than five years. .................................................. 23,919 19,106 30,790 29,167 Less discount. ............................................................. (193) (262) $30,597 $28,905
The following table provides a summary of the intended use of contributions receivable at July 31,
2013 and 2012:
2013 2012 (In thousands)
General support ........................................................... $22,588 $18,038 Endowment. ................................................................ 5,574 7,891 Educational and administrative programs .................. 1,335 1,608 Facilities and equipment. ............................................ 1,100 1,368 $30,597 $28,905
During the years ended July 31, 2013 and 2012, the University received payments on prior year
promises to give of $3.5 million and $1.7 million, respectively. Contributions receivable include assets held by external trustees totaling $27.0 million at July 31,
2013 and $22.0 million at July 31, 2012. In the event contributions receivable are deemed uncollectable, they are charged to expense as a
component of “Other non-operating revenues and expenses.” Receivables written off during the years ended July 31, 2013 and 2012 amounted to $643,000 and $400,000, respectively.
During the years ended July 31, 2013 and 2012 promises to give in the net amount of $8.1 million
and $8.0 million were received but not recognized, respectively. Promises to give may not be recognized because a donor has not provided sufficient documentation, the promise is conditional, or the promise is revocable.
15

PEPPERDINE UNIVERSITY
Notes to Consolidated Financial Statements
6. Investments
The University’s investments consist of the following at July 31, 2013 and 2012:
2013 2012
Cost Fair
Value
Cost Fair
Value (In thousands) Cash and cash equivalents ....................... $ 7,289 $ 7,289 $ 2,554 $ 2,554 Absolute return......................................... 67,639 95,747 59,429 75,450 Assets held by trustee ............................... 12,250 139,608 12,250 125,176 Mutual funds ............................................ 12,306 13,006 12,314 12,925 Bonds ....................................................... 1,000 1,001 9,843 9,860 Fixed income ............................................ 62,941 61,869 53,161 53,853 Notes receivable ....................................... 12,250 11,603 18,612 15,377 Opportunistic distressed ........................... 28,752 37,917 34,362 37,047 Private equity ........................................... 114,137 120,666 120,701 130,801 Natural resources ..................................... 39,769 43,895 36,328 42,255 Private real estate ..................................... 53,731 40,989 57,997 43,711 Public equity ............................................ 191,547 224,249 166,032 184,258 Real estate ................................................ 25,029 28,798 23,527 30,979 Other investments .................................... 6,379 4,089 5,305 3,015 $635,019 $830,726 $612,415 $767,261 Unrestricted .............................................. $436,050 483,091 419,586 449,063 Temporarily restricted .............................. 47,949 53,304 43,059 45,995 Permanently restricted ............................. 151,020 294,331 149,770 272,203 $635,019 $830,726 $612,415 $767,261 Pooled investments .................................. $562,889 $629,591 522,471 561,761 Separately invested .................................. 72,130 201,135 89,944 205,500 $635,019 $830,726 $612,415 $767,261
16

PEPPERDINE UNIVERSITY
Notes to Consolidated Financial Statements
7. Endowment Activities
Changes in endowment net assets for the year ended July 31, 2013 are as follows:
Unrestricted Unrestricted Temporarily Permanently Appropriations Principal Restricted Restricted Total (In thousands) Endowment net assets, beginning of year .................. $10,756 $279,936 $44,924 $272,337 $607,953 Investment income ................. 101 5,159 2,013 12 7,285 Net realized and unrealized appreciation .......................... 6 36,112 22,873 14,424 73,415 Private gifts and grants ........... - 230 - 3,124 3,354 Endowment support (appropriation of endowment assets for expenditure) .......................... 32,855 (17,485) (15,370) - -
Management (transfer out)/transfer in or redesignation ......................... (13,207) 61,503 (1,182) 4,633 51,747
Net expenditures of endowment assets ................. (24,107) (2,982) (984) (21) (28,094)
Endowment net assets, end of year ............................ $ 6,404 $362,473 $52,274 $294,509 $715,660
Designations of endowment funds for the year ended July 31, 2013 are as follows: Temporarily Permanently Unrestricted Restricted Restricted Total (In thousands) Donor-restricted funds .................. $ 3,138 $47,716 $294,509 $345,363 University-designated funds ......... 365,739 4,558 - 370,297 Total .............................................. $368,877 $52,274 $294,509 $715,660
17

PEPPERDINE UNIVERSITY
Notes to Consolidated Financial Statements
Changes in endowment net assets for the year ended July 31, 2012 are as follows:
Unrestricted Unrestricted Temporarily Permanently Appropriations Principal Restricted Restricted Total (In thousands) Endowment net assets, beginning of year ..................
$13,564
$289,380
$51,137
$268,499
$622,580
Investment income ................. 45 4,815 1,767 11 6,638 Net realized and unrealized appreciation .......................... -
(1,433) 8,862 (3,723) 3,706
Private gifts and grants ........... 5 136 - 4,339 4,480 Transfer of assets from assets held as trustee or agent to endowment assets....
- 792 500 2,094 3,386 Endowment support / (appropriation of endowment assets for expenditure) .......................... 31,527
(16,015) (15,512) - - Net (expenditures) reinvestments of endowment assets .................
(34,385)
2,261
(1,830)
1,117
(32,837) Endowment net assets, end of year ..................................
$10,756
$279,936
$44,924
$272,337
$607,953
Designations of endowment funds for the year ended July 31, 2012 are as follows: Temporarily Permanently Unrestricted Restricted Restricted Total (In thousands) Donor-restricted funds .................. $ (4,729) $40,621 $272,337 $308,229 University-designated funds ......... 295,421 4,303 - 299,724 Total .............................................. $290,692 $44,924 $272,337 $607,953
The University has recorded deficiencies resulting from the decline in fair value of endowment funds to amounts below the original gift amount as a reduction of unrestricted net assets. Such deficiencies totaled $5.6 million and $8.5 million and affected 85 and 99 donor-restricted true endowment funds with a market value of $37.7 million and $40.3 million at July 31, 2013 and July 31, 2012, respectively.
18

PEPPERDINE UNIVERSITY
Notes to Consolidated Financial Statements
8. Assets Held as Trustee or Agent
The University’s assets held as trustee or agent consist of the following at July 31, 2013 and 2012:
2013 2012
Cost Fair
Value
Cost Fair
Value (In thousands) Publicly traded stocks ...................... 5,192 6,358 7,088 7,713 Bonds ............................................... 760 735 834 870 Mutual funds .................................... 60,231 71,199 62,434 67,675 Notes receivable ............................... 7,070 7,178 6,958 6,996 Real estate ........................................ 29,299 29,014 28,814 29,300 Alternative investments ................... 2,934 1,482 2,936 1,366 Other investments ............................ 7,656 7,877 9,182 10,539 $113,142 $123,843 $118,246 $124,459 Unrestricted………………………. $ 19,150 $ 20,056 $ 19,300 $ 19,462 Temporarily restricted ...................... 72,612 81,481 77,849 84,207 Permanently restricted ..................... 19,592 20,384 19,344 18,951 Agency ............................................. 1,788 1,922 1,753 1,839 $113,142 $123,843 $118,246 $124,459 Pooled investments .......................... $ 24,818 $ 26,809 $ 26,719 $ 27,357 Separately invested .......................... 88,324 97,034 91,527 97,102 $113,142 $123,843 $118,246 $124,459 9. Pooled Investments
The following table sets forth data for the University’s investment pools at July 31, 2013 and 2012:
2013 2012 Pool A Pool D Pool A Pool D
Per unit fair value at end of year ........... $375.73 $ 122.54 $ 355.97 $ 113.42 Number of units owned at end of year:
Unrestricted ....................................... 1,146,794 101,633 1,077,926 67,531 Temporarily restricted ....................... 12,132 42,484 12,086 66,412 Permanently restricted ...................... 516,706 64,373 489,797 96,425 Agency .............................................. 3,355 - 1,752 -
Total units ............................................. 1,678,987 208,490 1,581,561 230,368 Average annual income per unit ........... $2.73 $4.30 $2.76 $3.09
Investment expenses for the years ended July 31, 2013 and 2012 includes investment management
fees totaling $3.4 million and $3.8 million, respectively.
19

PEPPERDINE UNIVERSITY
Notes to Consolidated Financial Statements
10. Property, Facilities and Equipment
Property, facilities and equipment consist of the following at July 31, 2013 and 2012:
2013 2012 (In thousands) Land ....................................................... $ 28,596 $ 25,712 Buildings and improvements ................. 439,649 411,336 Furniture, fixtures and equipment .......... 69,660 58,767 Construction in progress ........................ 13,576 14,218 Total cost ............................................ 551,481 510,033 Less: accumulated depreciation ............ (189,072) (168,853) $362,409 $341,180
11. Lines of Credit
At July 31, 2013 and 2012, the University had a $500,000 line of credit with no expiration date, available to fund the purchase of up to $5.0 million worth of foreign currency forward contracts for the funding of its international programs at Comerica Bank’s prime rate plus 3.0% per annum. 12. Long-Term Obligations
Long term obligations consist of the following at July 31, 2013 and 2012: 2013 2012 (In thousands) CEFA 5.00% Refunding Revenue Bonds (Pepperdine University) Series 2005 A,
due 2035-2036 ......................................................................................................... $ 92,365 $ 92,365 CEFA 5.00% Refunding Revenue Bonds (Pepperdine University) Series 2005 B,
due 2033 .................................................................................................................. 16,340 16,340 Pepperdine University Taxable Bonds Series 2009 A 5.45% interest, due 2019 ......... 50,000 50,000 California Infrastructure and Economic Development Bank Refunding Revenue
Bonds Series 2010, 5.00% due 2019-2029 .............................................................. 15,345 15,345 CEFA Revenue Bonds (Pepperdine University) Series 2012, 3.00%-5.00% due
2013 -2033 ............................................................................................................... 50,000 50,000 224,050 224,050 Net premium on long-term obligations......................................................................... 14,700 15,372 $238,750 $239,422
20
PEPPERDINE UNIVERSITY
Notes to Consolidated Financial Statements
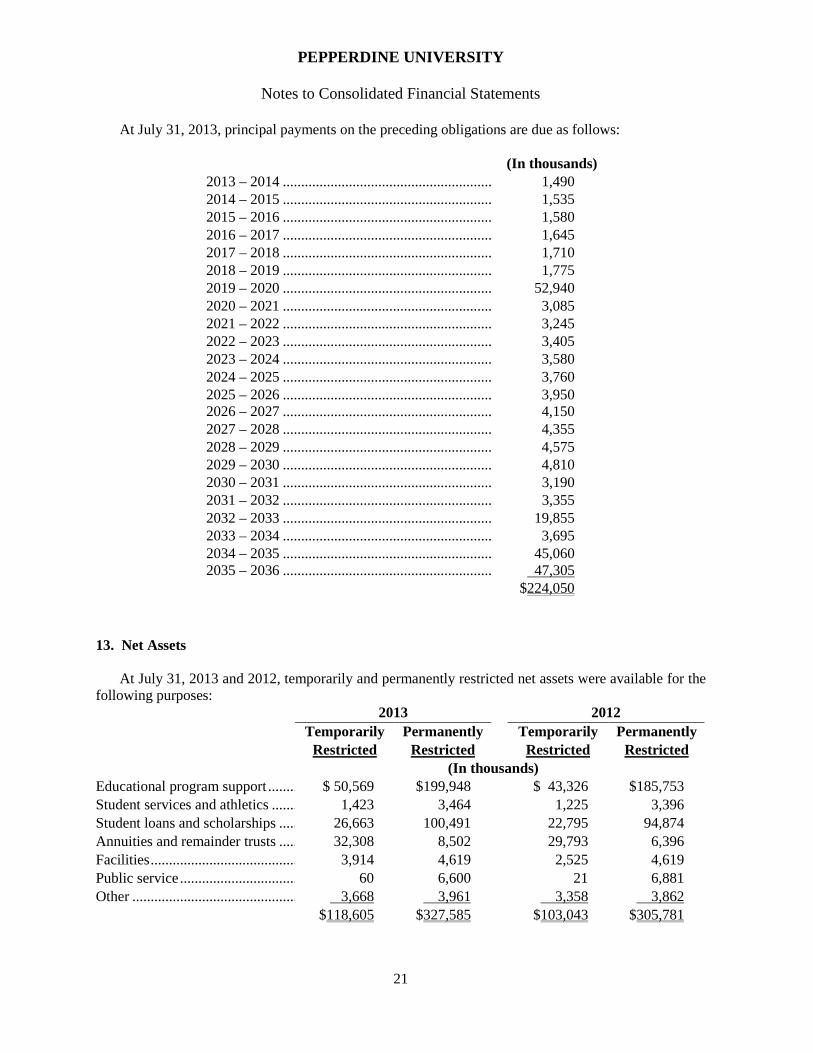
At July 31, 2013, principal payments on the preceding obligations are due as follows:
(In thousands) 2013 – 2014 ......................................................... 1,490 2014 – 2015 ......................................................... 1,535 2015 – 2016 ......................................................... 1,580 2016 – 2017 ......................................................... 1,645 2017 – 2018 ......................................................... 1,710 2018 – 2019 ......................................................... 1,775 2019 – 2020 ......................................................... 52,940 2020 – 2021 ......................................................... 3,085 2021 – 2022 ......................................................... 3,245 2022 – 2023 ......................................................... 3,405 2023 – 2024 ......................................................... 3,580 2024 – 2025 ......................................................... 3,760 2025 – 2026 ......................................................... 3,950 2026 – 2027 ......................................................... 4,150 2027 – 2028 ......................................................... 4,355 2028 – 2029 ......................................................... 4,575 2029 – 2030 ......................................................... 4,810 2030 – 2031 ......................................................... 3,190 2031 – 2032 ......................................................... 3,355 2032 – 2033 ......................................................... 19,855 2033 – 2034 ......................................................... 3,695 2034 – 2035 ......................................................... 45,060 2035 – 2036 ......................................................... 47,305 $224,050
13. Net Assets
At July 31, 2013 and 2012, temporarily and permanently restricted net assets were available for the following purposes: 2013 2012 Temporarily Permanently Temporarily Permanently Restricted Restricted Restricted Restricted (In thousands) Educational program support ........ $ 50,569 $199,948 $ 43,326 $185,753 Student services and athletics ....... 1,423 3,464 1,225 3,396 Student loans and scholarships ..... 26,663 100,491 22,795 94,874 Annuities and remainder trusts ..... 32,308 8,502 29,793 6,396 Facilities ........................................ 3,914 4,619 2,525 4,619 Public service ................................ 60 6,600 21 6,881 Other ............................................. 3,668 3,961 3,358 3,862 $118,605 $327,585 $103,043 $305,781
21

PEPPERDINE UNIVERSITY
Notes to Consolidated Financial Statements
14. Operating Lease Commitments
The University leases facilities for use primarily in its graduate programs. Future minimum lease payments expiring through 2019 under these non-cancelable operating leases at July 31, 2013 are as follows:
(In thousands) 2013– 2014 ................................................... $ 9,340 2014– 2015 ................................................... 9,663 2015– 2016 ................................................... 9,729 2016– 2017 ................................................... 10,166 2017– 2018 ................................................... 9,221 2018– 2019 ................................................... 3,017 $51,136
Leases on facilities contain renewal options and rent escalation clauses based on the Consumer
Price Index.
15. Employee Retirement and Deferred Compensation Plans
The University participates in a defined contribution plan, which provides retirement benefits for eligible employees. Benefits for the plan are funded by contributions from the University and its employees. University contributions are non-refundable and fully vested. There are no prior service costs. The University contributed $8.9 million and $8.8 million to these plans for the years ended July 31, 2013 and 2012, respectively.
In July 2002 the University established deferred compensation programs for senior administrators,
tenured Full Professors, highly paid and certain other employees under Sections 457(b) and 457(f) of the Internal Revenue Code. Under this plan, eligible employees may defer a limited amount of their compensation to future years. Although deferred by employees for tax purposes, amounts contributed to these plans by the University are treated as an expense in the year earned. University contributions to these deferred compensation plans for the years ended July 31, 2013 and 2012 were $301,000 and $212,000, respectively.
16. Faculty and Staff Housing
The University sells condominium units to certain faculty and staff. The sales terms include restrictions on the buyers' eligibility and include a resale price based on a defined index that is not controlled by the University. The University has a right of first refusal to purchase the units when offered for sale by the owner. The University has historically exercised this right and then subsequently sold the units within a short period of time. For the years ended July 31, 2013 and 2012, the University sold nine and five units with associated sales values of $3.8 million and $2.1 million, respectively. Should all 122 of the units be available for purchase at July 31, 2013 and 2012, and the University elected to exercise its right of first refusal on all of the units it did not already own, the total value associated with these transactions would be $53.8 million and $48.2 million, respectively. At July 31, 2013 and 2012, the University held legal title to eight and 14 units with a value of $4.0 million and $7.4 million, respectively.
The land associated with the condominium units has been leased to the homeowner’s associations
for 99 years from the date of completion of the construction. Monthly rents are paid to the University
22

PEPPERDINE UNIVERSITY
Notes to Consolidated Financial Statements
for the grounds, utilities and other services subject to adjustments based on the Consumer Price Index and on the costs of furnishing utilities and services.
At July 31, 2013, the University guaranteed the performance of $21.1 million in mortgage loans
obtained by its faculty and staff. These mortgage loans were issued by independent third-party lenders and all of the proceeds of these loans were used to facilitate the purchase of on-campus housing.
At July 31, 2013 and 2012, University-owned notes receivable from on-campus housing sales
amounted to $802,000 and $1.0 million, respectively. These amounts are included as a component of investments on the Consolidated Statements of Financial Position. The notes bear interest at various rates ranging between 5.50% per annum and 7.25% per annum and are collateralized by deeds of trust. Interest income recognized by the University related to these notes was $47,600 and $64,500 for the years ended July 31, 2013 and 2012, respectively. No allowance for loan losses has been recorded against these loans based on their collateralization and prior collection history. At July 31, 2013 there were no past due amounts related to these notes receivable. 17. Supplemental Cash Flow Information
For the year ended July 31, 2013 2012
(In thousands) Cash paid during the period for: Interest. .................................................................................. $10,694 $11,765 Accrued capitalized asset additions ....................................... 10,668 1,552
18. Natural Expenses
The University’s classifications of expenses in the Consolidated Statements of Activities by natural expense category are as follows:
For the year ended July 31, 2013 2012
(In thousands) Personnel ……………………………….. $166,720 $162,485 Depreciation …………………….……… 20,267 19,710 Professional services …………………… 19,194 19,698 Travel and development …..……….…… 11,607 11,879 Interest………………………………….. 10,804 11,083 Rentals .......…………………………….. 10,458 10,880 Equipment ……………………………… 8,879 3,576 Student meals …………………………... 7,785 6,758 Maintenance ……………………………. 5,948 5,299 Supplies ………………………………… 5,747 4,978 Utilities ………………………………… 5,396 4,680 Advertising and promotion …………….. 4,939 5,942 Insurance ……………………………...... 4,477 4,428 Other …………………………………… 6,753 5,971 $288,974 $277,367
23

PEPPERDINE UNIVERSITY
Notes to Consolidated Financial Statements
19. Commitments and Contingencies
In the normal course of operations, the University is named as a defendant in lawsuits and is subject to periodic examinations by regulatory agencies. After consultation with legal counsel, management is of the opinion that liabilities, if any, arising from such litigation and examinations would not have a material effect on the University’s consolidated financial position or change in net assets.
The University was the subject of an audit by the Internal Revenue Service (“IRS”), covering the
fiscal years ended July 31, 2008 and 2009. The IRS has concluded their audit and the University is contesting some of its findings. Management does not believe the resolution of the findings will result in a material effect on the University’s consolidated financial position or change in net assets.
The University receives and expends monies under U.S. government grant programs and is subject
to audits by related U.S. governmental agencies. Management believes that any liabilities resulting from such audits will not have a material impact on the University.
At July 31, 2013, the University had open commitments to invest approximately $94.0 million with
investment managers and/or limited partnerships over approximately seven years. At July 31, 2013, the University’s maximum exposure under guarantees of Guaranteed Access To
Education (“GATE”) student loans totaled approximately $281,000. Since 1997, the University has sold approximately $14.8 million of GATE student loans into securitization trusts.
At July 31, 2013, the University had outstanding commitments for capital expenditures in
connection with the various construction projects of approximately $18.6 million. The University expects to fund these costs principally through the proceeds of bonds previously issued and unrestricted net assets available. Accordingly, no liability has been recorded in the accompanying Consolidated Statements of Financial Position.
As discussed in Note 16, the University guarantees the performance of certain mortgages for on-
campus condominiums. 20. Fair Value of Financial Instruments
Financial instruments include cash and cash equivalents, student receivables, other accounts receivable, student loans, contributions receivable, investments, assets held as trustee or agent, U.S. government-funded student loans, trust and agency obligations, long-term obligations and various off-balance sheet items. The fair value of certain alternative investments, which include limited partnerships in venture capital, real estate and other private debt and equity funds, is based on valuations provided by the external investment managers or general partners, generally using NAV as a practical expedient, adjusted for receipts and disbursements of cash and distributions of securities if the date of valuation is prior to the University’s fiscal year end. Such valuations generally reflect discounts for illiquidity and consider variables such as financial performance of investments, recent sales prices of investments and other pertinent information. These estimates are subjective in nature and involve uncertainties and matters of judgment and therefore cannot be determined with precision. Changes in assumptions could significantly affect the estimates. In addition, the fair value estimates presented do not include the value of anticipated future operating activities and the value of assets and liabilities that are not considered financial instruments. The University uses the following methods and assumptions in estimating the fair value disclosures for its financial instruments:
24

PEPPERDINE UNIVERSITY
Notes to Consolidated Financial Statements
Financial Assets The carrying values of cash and cash equivalents, student receivables, other accounts receivable,
student loans, contributions receivable, and assets held as trustee or agent are considered to approximate fair value. When possible, the fair value of investments and assets held as trustee or agent are determined by reference to quoted market prices. When quoted market prices are not available, fair value is estimated by reference to market values for similar securities or by discounting cash flows at an appropriate risk rate taking into consideration the varying degrees of risk specific to each financial asset. Determination of the fair value of student loans receivable, which are primarily federally sponsored student loans with United States Government mandated interest rates and repayment terms subject to significant restrictions as to their transfer and disposition could not be made without incurring excessive costs.
Financial Liabilities
The carrying value of trust and agency obligations is considered to approximate fair value. The fair
value of the University’s CEFA and other bonds payable is based on recent trading information available to the University for its debt, or for debt with similar terms and remaining maturities, and approximates Level 2 in the fair value hierarchy. The fair value for notes payable were estimated based upon the discounted amount of future cash flows utilizing current rates offered for debt of similar remaining maturities.
The carrying amount of the University’s financial instruments at July 31, 2013 and 2012 are the
same as their estimated fair values with the exception of CEFA and other bonds payable which have the values outlined below:
2013 2012 Carrying
Amount Estimated Fair Value
Carrying Amount
Estimated Fair Value
(In thousands) CEFA and other bonds payable ............... $238,750 $240,443 $239,422 $257,623
Off-Balance Sheet and Derivative Financial Instruments
The fair value of interest rate caps, floors and swaps, forward treasury contracts and interest rate
futures, to the extent used by the University, are based on quoted market prices. The fair values of foreign currency derivatives are based on pricing models using currency market rates. These amounts are reflected as a component of prepaid expenses, inventories and other assets on the University’s Consolidated Statements of Financial Position.
In accordance with ASC 820, fair value is defined as the price the University would receive to sell
an asset or pay a liability in an orderly transaction between the market participants at the reporting date. ASC 820 also establishes a three-level hierarchy for presenting valuations, based on the transparency of inputs used to value investments and other relevant assets. A financial instrument’s categorization within the valuation hierarchy is based upon the lowest level of input that is significant to the fair value measurement.
Valuation inputs may be observable or unobservable, and refer to the assumptions that a market participant would consider significant to value an asset or liability. The determination of “observable” requires judgment by the University. In general, the University considers observable inputs to be data
25

PEPPERDINE UNIVERSITY
Notes to Consolidated Financial Statements
that are readily available, regularly updated, reliable, and verifiable. Unobservable inputs may be used when observable inputs are not readily available or current. In this situation, one or more valuation techniques may be used including the market approach (inputs based on recent market transactions or comparables) or the income approach (discounted cash flow).
The three levels of the fair value hierarchy under ASC 820 are as follows:
• Level 1 – Quoted prices available in active markets for identical investments.
• Level 2 – Quoted prices in active markets for similar investments; quoted prices for identical investments in markets that are inactive; and prices based on observable inputs other than an unadjusted quoted price.
• Level 3 – Prices based on significant unobservable inputs.
The following table summarizes the valuations of the University’s investments and other relevant
assets as of July 31, 2013, based on their placement within the fair-value hierarchy:
Level 1 Level 2 Level 3 Total (In thousands) Investments Cash and cash equivalents ................ $ 7,289 $ - $ - $ 7,289 Absolute return.................................. - 14,023 81,724 95,747 Assets held by trustee ........................ 95,700 3,600 40,308 139,608 Mutual funds ..................................... 13,006 - - 13,006 Bonds ................................................ - 1,001 - 1,001 Fixed income ..................................... - 61,574 295 61,869 Notes receivable ................................ - - 11,603 11,603 Opportunistic distressed .................... - - 37,917 37,917 Private equity .................................... - - 120,666 120,666 Natural resources .............................. - 16,223 27,672 43,895 Private real estate .............................. - 4,939 36,049 40,988 Public equity ..................................... 150,629 73,620 - 224,249 Real estate ......................................... - - 28,799 28,799 Other investments ............................. - - 4,089 4,089 Total investments .......................... $266,624 $174,980 $389,122 $830,726 Assets held as trustee Publicly traded stocks ....................... $ 6,358 $ - $ - $ 6,358 Bonds ................................................ 735 - - 735 Mutual Funds .................................... 71,199 - - 71,199 Notes Receivable .............................. - - 7,178 7,178 Real Estate ........................................ - - 29,014 29,014 Alternative investments .................... 605 - 877 1,482 Other investments ............................. 7,176 - 701 7,877 Total assets held as trustee ........... 86,073 - 37,770 123,843 Total ............................................... $352,697 $174,980 $426,892 $954,569
26

PEPPERDINE UNIVERSITY
Notes to Consolidated Financial Statements
The following summary table illustrates the valuations of the University’s investments and other
relevant assets as of July 31, 2012, based on their placement within the fair value hierarchy: Level 1 Level 2 Level 3 Total (In thousands) Investments Cash and cash equivalents ................ $ 2,554 $ - $ - $ 2,554 Absolute return.................................. - 2,557 72,893 75,450 Assets held by trustee ........................ 82,666 1,718 40,792 125,176 Mutual funds ..................................... 12,594 331 - 12,925 Bonds ................................................ - 9,860 - 9,860 Fixed income ..................................... 50,044 1,068 2,741 53,853 Notes receivable ................................ - - 15,377 15,377 Opportunistic distressed .................... - - 37,047 37,047 Private equity .................................... - - 130,801 130,801 Natural resources .............................. - 18,413 23,842 42,255 Private real estate .............................. - 4,640 39,071 43,711 Public equity ..................................... 118,786 65,472 - 184,258 Real estate ......................................... - - 30,979 30,979 Other investments ............................. - - 3,015 3,015 Total investments ........................... $266,644 $104,059 $396,558 $767,261 Assets held as trustee Publicly traded stocks ....................... $ 7,713 $ - $ - $ 7,713 Bonds ................................................ 870 - - 870 Mutual funds ..................................... 67,675 - - 67,675 Notes receivable ................................ - - 6,996 6,996 Real estate ......................................... - - 29,300 29,300 Alternative investments .................... - - 1,366 1,366 Other investments ............................. 8,204 254 2,081 10,539 Total assets held as trustee ........... 84,462 254 39,743 124,459 Total ............................................... $351,106 $104,313 $436,301 $891,720
Level 1 generally includes the University’s investments in mutual funds and common stock that are regularly traded in active markets where quoted prices may be easily obtained.
Level 2 generally includes the University’s investments in debt securities and certain unlisted equity funds that offer a high degree of liquidity and transparency. Debt security prices are obtained from pricing services, or from brokers. Non-listed equity funds that consistently transact on a daily, weekly, or monthly basis are valued at reported NAV. Level 2 investments may also be priced using model-based valuation techniques where all assumptions are observable.
Level 3 generally includes the University’s alternative investments, which consist of hedge funds, private equity funds, real estate funds, and other fund of funds. These investments do not typically transact on a regular basis, nor do they have readily determinable fair values. Therefore, the University relies heavily on investment manager-reported valuations, usually in the form of NAV. The University performs due diligence around all reported NAV’s to ensure the values are accurate and appropriate.
27

PEPPERDINE UNIVERSITY
Notes to Consolidated Financial Statements
Level 3 also includes the University’s real property. Oil and gas interests are valued by discounting future expected royalty revenues, while real property is valued based on a number of different approaches including third party appraisals, market comparisons, and discounted future rental revenues. Finally, Level 3 includes the University’s life insurance policies, which are valued at the present value of the future distributions expected to be received over the term of the agreement.
The methods described above may produce a fair value calculation that may not be indicative of net realizable value or reflective of future values. In addition, while the University believes that its valuation methods are appropriate and consistent with other market participants, the use of different methodologies or assumptions to determine the fair value of certain financial instruments could result in a different estimate of fair value at the reporting date.
The following table sets forth a reconciliation of beginning and ending balances for financial instruments designated as Level 3 for the year ended July 31, 2013 (in thousands): Beginning Balance July 31,
2012
Realized
Gains
Unrealized
Gains Purchase
Cost Total
Proceeds
Transfers
into Level 3
Transfers out of
Level 3
Ending Balance July 31,
2013 (In thousands) $436,301 $18,855 $2,545 $31,889 ($62,459) $6,261 ($6,500) $426,892
All net realized and unrealized gains in the table above are reflected in the accompanying
consolidated Statement of Activities. During the fiscal year ended July 31, 2013, the University reclassified $60.7 million of Fixed
Income securities from Level 1 to Level 2 in the fair value hierarchy. The value of these individual securities is based on unadjusted quoted prices for identical assets in an active market.
28

PEPPERDINE UNIVERSITY
Notes to Consolidated Financial Statements
The University uses the NAV to determine the fair value of all the underlying investments which (a) do not have a readily determinable fair value and (b) prepare their financial statements consistent with the measurement principles of an investment company or have the attributes of an investment company. The following table lists investments in other investment companies (in partnership format) by major category for the year ended July 31, 2013:
Investment Category Strategy NAV in Funds
# of Funds
Remaining Life
Amount of Unfunded
Commitments Redemption Terms Redemption Restrictions
(In thousands, except # of funds)
Absolute Return (level 2 & 3) US and non-US investments in relative value, event driven, long/short and directional
$ 95,747 28 Open Ended $ -
Ranges between quarterly with 30, 45, 60 or 90 days notice, semi annual with 90 days notice, annual with 45, 60 or 90 days notice
2.3% of NAV is locked up in side-pockets
Assets Held by Trustee (level 2 &3) US and non-US investments in
relative value, event driven, long/short and directional 43,907 3 Open Ended -
Redemptions are not permitted during the life of the fund
N/A
Public Natural Resources (level 2) US and non-US Investments in upstream, midstream, and downstream natural resources 16,223 2
Approx 7 years -
Redemptions are not permitted during the life of the fund
N/A
Private Natural Resources (level 3) US and non-US Investments in upstream, midstream, and downstream natural resources 27,673 12
Approx 7 years 13,647
Redemptions are not permitted during the life of the fund
N/A
Private Real Estate (level 2) US and non-US real estate 4,939 1
Approx 7 years -
Redemptions are not permitted during the life of the fund N/A
Private Real Estate (level 3) US and non-US real estate
36,050 20 Approx 7 years 11,821
Redemptions are not permitted during the life of the fund N/A
Public Equity (level 2) US and non-US equity securities 73,620 9 Open Ended - Ranges from daily to monthly N/A
Fixed Income (level 2 & 3) US and non-US fixed income
securities 61,869 8 Open Ended - Daily
N/A
Opportunistic Distressed (level 3) US and non-US distressed debt securities 37,917 10
Approx 7 years 15,582
Redemptions are not permitted during the life of the fund N/A
Private Equity (level 3) US and non-US equity securities
120,666 52 Approx 7 years 52,980
Redemptions are not permitted during the life of the fund N/A
Total $518,611 $94,030
29

PEPPERDINE UNIVERSITY
Notes to Consolidated Financial Statements
The University uses the NAV to determine the fair value of all the underlying investments which (a) do not have a readily determinable fair value and (b) prepare their financial statements consistent with the measurement principles of an investment company or have the attributes of an investment company. The following table lists investments in other investment companies (in partnership format) by major category for the year ended July 31, 2012:
Investment Category Strategy NAV in Funds
# of Funds
Remaining Life
Amount of Unfunded
Commitments Redemption Terms Redemption Restrictions
(In thousands, except # of funds)
Absolute Return (level 2 & 3) US and non-US investments in relative value, event driven, long/short and directional
$ 75,453 85 Open Ended $ -
Ranges between quarterly with 30, 45, 60 or 90 days notice, semi annual with 90 days notice, annual with 45, 60 or 90 days notice
2.3% of NAV is locked up in side-pockets
Assets Held By Trustee (level 2 and 3) US and non-US investments in
relative value, event driven, long/short and directional
$42,510 3 Approx 7 years -
Ranges between quarterly with 30, 45, 60 or 90 days notice, semi annual with 90 days notice, annual with 45, 60 or 90 days notice
2.3% of NAV is locked up in side-pockets
Public Natural Resources (level 2) US and non-US Investments in
upstream, midstream, and downstream natural resources 18,413 3
Approx 7 years -
Redemptions are not permitted during the life of the fund
N/A
Private Natural Resources (level 3) US and non-US Investments in upstream, midstream, and downstream natural resources 23,842 11
Approx 7 years 18,981
Redemptions are not permitted during the life of the fund
N/A
Private Real Estate (level 2) US and non-US real estate 4,640 1
Approx 7 years -
Redemptions are not permitted during the life of the fund N/A
Private Real Estate (level 3) US and non-US real estate
39,071 21 Approx 7 years 16,307
Redemptions are not permitted during the life of the fund N/A
Public Equity (level 2) US and non-US equity
securities 65,502 11 Open Ended - Ranges from daily to monthly
N/A
Fixed Income (level 2 & 3) US and non-US fixed income securities 13,668 17 Open Ended -
Daily N/A
Opportunistic Distressed (level 3) US and non-US distressed debt
securities 37,047 10 Approx 7 years 19,201
Redemptions are not permitted during the life of the fund N/A
Private Equity (level 3) US and non-US equity
securities 130,801 55 Approx 7 years 56,114
Redemptions are not permitted during the life of the fund N/A
Total $450,947 $110,603
30

PEPPERDINE UNIVERSITY
Notes to Consolidated Financial Statements
21. Asset Retirement Obligations
The following table illustrates the change in conditional asset retirement obligations during the year ended July 31, 2013:
Abatement
Average Abatement
Conditional
Asset Retirement
Obligation at
Add: 2013
Less: 2013 Costs
Conditional
Asset Retirement
Obligation at Timeframe Date July 31, 2012 Accretion Incurred July 31, 2013 (In thousands) 10 years 2016 $ 726 $ 35 $ - $ 761 11-20 years 2022 3,862 187 85 3,964 21-30 years 2036 20 1 - 21 31-40 years 2044 993 48 - 1,041 41-50 years 2048 112 6 - 118 51+ years 2061 7 - - 7 $5,720 $ 277 $85 $5,912 22. Subsequent Events
The University has performed an evaluation of subsequent events through November 22, 2013 which is the date these financial statements were issued. There are no subsequent events which require disclosure.
31


![Accrued Interest en[1]](https://img.pdfslide.net/doc/110x75/577d231d1a28ab4e1e99053c/accrued-interest-en1.jpg)